Annual Report 2011-12 - Marksans...
60
Annual Report 2011-12
Transcript of Annual Report 2011-12 - Marksans...
Annual Report 2011-12
Notice .................................................................................................. 01
Directors’ Report ............................................................................... 03
Management Discussion & Analysis ........................................... 07
Report on Corporate Governance ............................................... 11
Auditors’ Report ............................................................................... 17
Balance Sheet .................................................................................. 20
Statement of Profit & Loss.............................................................. 21
Notes to Financial Statement ....................................................... 22
Cash Flow Statement ...................................................................... 37
Statement U/s 212 of the Companies Act, 1956....................... 38
Auditors’ Report on Consolidated Financial Statements ...... 39
Consolidated Balance Sheet ........................................................ 40
Consolidated Statement of Profit & Loss..................................... 41
Notes to Consolidated Financial Statement............................... 42
Consolidated Cash Flow Statement ............................................ 54
Board of Directors
Mr. Mark Saldanha - Chairman & Managing Director
Dr. B.S. Desai - Whole Time Director
Mr. Mahesh B. Parikh - Director (Upto 05-10-2011)
Mr. S.R.Buddharaju - Director
Mr. Ajay S. Joshi - Director
Company Secretary & Legal Manager Mr. Harshavardhan Panigrahi
Auditor M/s. N.K. Mittal & Associates Chartered Accountants
Legal Advisors M/s. Crawford Bayley & Co.
Bankers State Bank of India Bank of India Corporation Bank Lakshmi Vilas Bank Limited
Share Transfer Agent Big Share Services Pvt. Ltd., E-2/3, Ansa Industrial Estate, Saki Vihar Road, Sakinaka, Andheri (East), Mumbai - 400 072.
Registered Office 11th Floor, Lotus Business Park, Off New Link Road, Andheri (West), Mumbai - 400 053.
Works I L-82 & 83, Verna Industrial Estate, Verna, Goa - 403 722. II Bell, Sons & Co. (Druggists) Ltd. Gifford House, Slaidburn Crescent, Southport, PR9 9AL
20th Annual General Meeting Day & Date : Thursday, 27th September, 2012 Time : 10.30 a.m. Venue : GMS Community Centre Hall, Sitladevi Complex, 1st Floor, D.N. Nagar, Link Road, Andheri (W), Mumbai - 400 053.
Index

1
Marksans Pharma LimitedMNOTICE
To the Members of Marksans Pharma Limited,
NOTICE is hereby given that the 20th Annual General Meeting of the Members of Marksans Pharma Limited will be held on Thursday, the 27th September, 2012 at GMS Community Centre Hall, Sitladevi Complex, 1st Floor, D.N. Nagar, Link Road, Andheri (W), Mumbai 400 053, at 10.30 a.m. to transact the following business:
ORDINARY BUSINESS
1. To receive, consider and adopt the audited Balance Sheet as at 31st March 2012, the Statement of Profit and Loss for the period ended as on that date and the Report of the Directors and the Auditors thereon.
2. To appoint auditors to hold the office from the conclusion of this Annual General Meeting till the conclusion of the next Annual General Meeting and to fix their remuneration.
SPECIAL BUSINESS
3. To consider and if thought fit, to pass, with or without modification, the following resolution as an Ordinary Resolution:
“RESOLVED THAT Mr. Ajay S. Joshi be and is hereby appointed as a Director of the Company, liable to retire by rotation.”
By order of the Board of Directors
Mumbai Harshavardhan PanigrahiDated : 14th August, 2012 Company Secretary and Legal Manager
NOTES:
a) A MEMBER ENTITLED TO ATTEND AND VOTE AT THE MEETING IS ENTITLED TO APPOINT A PROXY TO ATTEND AND VOTE INSTEAD OF HIMSELF. A PROXY NEED NOT BE MEMBER OF THE COMPANY. Proxies in order to be effective must be deposited at the Registered Office of the Company not less than 48 hours before the commencement of the meeting.
b) The Register of Members and Share Transfer Books of the Company will be closed from Saturday, the22nd September, 2012 and will remain closed till Thursday, the 27th September, 2012 (both days inclusive).
c) Shareholders desiring any information as regards the Accounts are requested to write to the Company at least 8 days In advance so as to enable the Management to keep the Information ready.
d) Members holding shares in physical form are requested to immediately intimate to the Company’s Share Transfer Agents, changes, if any, in their registered address along with the PIN code number. Members holding shares in dematerialized mode are requested to forward intimation for change of address, if any, to their respective Depository Participant.
e) Trading in the Company’s shares through Stock Exchange is permitted only in dematerialized /electronic form. The equity shares of the Company have been inducted in both National Securities Depository Limited and Central Depository Services (India) Limited to enable shareholders to hold and trade the securities in dematerialized /electronic form. In view of the numerous advantages offered by the Depository System, members holding shares of the Company In physical form are requested to avail of the facility of dematerialization.
f) In terms of provisions of Section 109A of the Companies Act, 1956, nomination facility is available to individual shareholders. The shareholders who are holding shares in physical form and are desirous of availing this facility may kindly write to the Company’s Share Transfer Agent M/s Bigshare Services Private Limited for nomination form quoting their folio number. Shareholders holding shares in dematerialized form should write to their Depository Participant for the purpose.

2
ANNUAL REPORT 2011-2012
ITEM NO. 3
Mr. Ajay S. Joshi has been appointed as a Director of your company on 2nd May, 2011 to fill up the casual vacancy caused by the resignation of Mr. Kumar Nair. The tenure of Mr. Ajay S. Joshi shall come to an end on the date of the forthcoming Annual General Meeting by virtue of the provisions of Section 262(2) of the Companies Act, 1956.
Notice along with deposit of Rs. 500/- has been received under Section 257 of the Companies Act, 1956, from a member of the Company signifying the intention to propose Mr. Ajay S. Joshi as a candidate for the office of the Director of the Company, liable to retire by rotation.
Mr. Ajay S. Joshi is a science graduate. He has over 25 years of experience in the field of marketing pharmaceutical products in international market particularly in the USA. Presently he is a Director of Spirit Pharmaceutical LLC of USA. His in-depth knowledge and experience in the aforesaid field shall be of great help to the Company in the long run, if appointed as a Director of the Company.
The Board, therefore, commends this item of the accompanying notice for approval of the Members.
None of the Directors, except Mr. Ajay S. Joshi, is interested or concerned with this resolution.
By order of the Board of Directors
Mumbai Harshavardhan PanigrahiDated : 14th August, 2012 Company Secretary and Legal Manager
Important Communication
The Ministry of Corporate Affairs, vide its Circular No. 18/2011 dated 29th April, 2011, has clarified that as a measure of “Green initiative in Corporate Governance” it will be in compliance if the Annual Report is sent to the shareholders through e-mail. To support this green initiative, members holding shares in demat form are requested to provide their e-mail ID to the Depository through their concerned depository participant and members holding shares in physical form are requested to provide e-mail ID to the Company’s Registrar and Transfer Agent M/s Bigshare services Pvt. Ltd. and also update the e-mail address as and when there is any change.
EXPLANATORY STATEMENT PURSUANT TO SECTION 173(2) OF THE COMPANIES ACT, 1956.
3
Marksans Pharma LimitedM
Dear Shareholders,
The Directors take pleasure in presenting the 20th Report together with the Audited Accounts of the Company for the year ended 31st March, 2012.
FINANCIAL RESULTS
(` in Lacs)
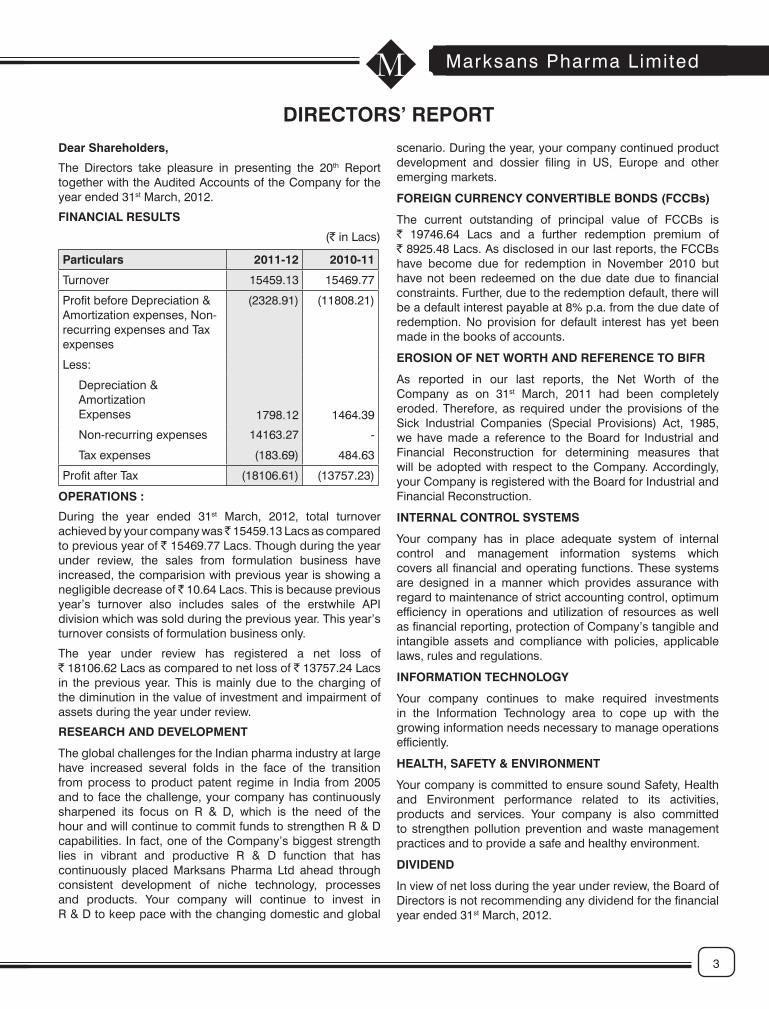
Particulars 2011-12 2010-11
Turnover 15459.13 15469.77
Profit before Depreciation & Amortization expenses, Non-recurring expenses and Tax expenses
(2328.91) (11808.21)
Less:
Depreciation & AmortizationExpenses 1798.12 1464.39
Non-recurring expenses 14163.27 -
Tax expenses (183.69) 484.63
Profit after Tax (18106.61) (13757.23)
OPERATIONS :
During the year ended 31st March, 2012, total turnover achieved by your company was ̀ 15459.13 Lacs as compared to previous year of ` 15469.77 Lacs. Though during the year under review, the sales from formulation business have increased, the comparision with previous year is showing a negligible decrease of ̀ 10.64 Lacs. This is because previous year’s turnover also includes sales of the erstwhile API division which was sold during the previous year. This year’s turnover consists of formulation business only.
The year under review has registered a net loss of ` 18106.62 Lacs as compared to net loss of ` 13757.24 Lacs in the previous year. This is mainly due to the charging of the diminution in the value of investment and impairment of assets during the year under review.
RESEARCH AND DEVELOPMENT
The global challenges for the Indian pharma industry at large have increased several folds in the face of the transition from process to product patent regime in India from 2005 and to face the challenge, your company has continuously sharpened its focus on R & D, which is the need of the hour and will continue to commit funds to strengthen R & D capabilities. In fact, one of the Company’s biggest strength lies in vibrant and productive R & D function that has continuously placed Marksans Pharma Ltd ahead through consistent development of niche technology, processes and products. Your company will continue to invest in R & D to keep pace with the changing domestic and global
DIRECTORS’ REPORT
scenario. During the year, your company continued product development and dossier filing in US, Europe and other emerging markets.
FOREIGN CURRENCY CONVERTIBLE BONDS (FCCBs)
The current outstanding of principal value of FCCBs is ` 19746.64 Lacs and a further redemption premium of ` 8925.48 Lacs. As disclosed in our last reports, the FCCBs have become due for redemption in November 2010 but have not been redeemed on the due date due to financial constraints. Further, due to the redemption default, there will be a default interest payable at 8% p.a. from the due date of redemption. No provision for default interest has yet been made in the books of accounts.
EROSION OF NET WORTH AND REFERENCE TO BIFR
As reported in our last reports, the Net Worth of the Company as on 31st March, 2011 had been completely eroded. Therefore, as required under the provisions of the Sick Industrial Companies (Special Provisions) Act, 1985, we have made a reference to the Board for Industrial and Financial Reconstruction for determining measures that will be adopted with respect to the Company. Accordingly, your Company is registered with the Board for Industrial and Financial Reconstruction.
INTERNAL CONTROL SYSTEMS
Your company has in place adequate system of internal control and management information systems which covers all financial and operating functions. These systems are designed in a manner which provides assurance with regard to maintenance of strict accounting control, optimum efficiency in operations and utilization of resources as well as financial reporting, protection of Company’s tangible and intangible assets and compliance with policies, applicable laws, rules and regulations.
INFORMATION TECHNOLOGY
Your company continues to make required investments in the Information Technology area to cope up with the growing information needs necessary to manage operations efficiently.
HEALTH, SAFETY & ENVIRONMENT
Your company is committed to ensure sound Safety, Health and Environment performance related to its activities, products and services. Your company is also committed to strengthen pollution prevention and waste management practices and to provide a safe and healthy environment.
DIVIDEND
In view of net loss during the year under review, the Board of Directors is not recommending any dividend for the financial year ended 31st March, 2012.

4
ANNUAL REPORT 2011-2012
FIXED DEPOSITS
During the year under review, your company has not accepted any deposits.
DIRECTORS RESPONSIBILITY STATEMENT
In terms of provisions of Section 217(AA) of the Companies Act, 1956 the Directors confirm that:
- in the preparation of the annual accounts, the applicable accounting standards have been followed;
- appropriate accounting policies have been selected and applied consistently and judgments and estimates made that are reasonable and prudent so as to give a true and fair view of the state of affairs of the Company at the end of the financial year ended 31st March, 2012 and the Statement of Profit and Loss for the period ended 31st March, 2012;
- proper and sufficient care has been taken for the maintenance of adequate accounting records in accordance with the provisions of the Companies Act, 1956 for safeguarding the assets of the Company and for preventing and detecting fraud and other irregularities;
- the annual accounts have been prepared on a going concern basis.
CONSOLIDATED FINANCIAL STATEMENTS
In compliance with the Accounting Standard - 21 on Consolidated Financial Statements, this Annual Report also includes Consolidated Financial Statements for the financial year under review. From the Consolidated Statement of Profit and Loss, it may be observed that the turnover of the year under review has increased to ` 35554.87 Lacs from ` 30457.81 Lacs during the previous financial year and net loss after tax has reduced to ` 17883.97 from ` 22,324.45 Lacs in the previous year.
SUBSIDIARIES
Performance of Marksans Pharma (UK) Limited, which operate in the European market is satisfactory, though not as expected, considering the adverse economic scenario in that market and changed ownership structure. The business model of the Company has now been changed to secure sustained profitable growth in the years ahead.
Nova Pharmaceuticals Australasia Pty Ltd (your company holds 60% of the share capital) which operates mainly in Australia, is doing well with consistent growth.
Pursuant to a Central Government’s Circular dated 8th
February, 2011, the audited accounts together with Director’s Report and Auditor’s Report of the subsidiaries namely M/s. Nova Pharmaceuticals Australasia PTY Limited and M/s. Marksans Pharma (U.K.) Limited are not being appended to the Annual Report. However, a statement giving information in aggregate for each subsidiary including subsidiaries of subsidiaries are attached to the Consolidated Balance Sheet.
CONSERVATION OF ENERGY, TECHNOLOGY ABSORPTION, FOREIGN EXCHANGE EARNINGS AND OUTGO
The information required under Section 217(1)(e) of the Companies Act, 1956 read with the Companies (Disclosure of Particulars in the Report of the Board of Directors) Rules, 1988 is annexed hereto and forms part of this Report.
EMPLOYEES
There is no employee drawing remuneration exceeding ` 60 Lacs per annum or ̀ 5 Lacs per month during the year ended 31st March, 2012 and therefore, provision of Section 217(2A) of the Companies Act 1956, read with the Companies (Particulars of Employee) Rules 1975, as amended up to date does not apply.
HUMAN RESOURCES DEVELOPMENT AND INDUSTRIAL RELATIONS
The guiding principle of HR Policy at Marksans is that the “Intellectual Capital” and dedication of employees will help the Company emerge as a successful player in this highly competitive scenario.
The recruitment procedure ensures that people with talent and the right skill sets are selected. Nurturing of talent and a Performance Management System (PMS) is in place to ensure that the coordinated efforts of our people lead to achievement of the Business Goals of the company.
Empowerment and a motivational package ensure that employees keep performing at peak levels. The HR Policy is directed towards creating “Ownership of Goals” at levels and synchronizing the efforts of all employees to achieve the company’s quality and business goals.
Development of skills through mentoring and training by our seasoned professionals ensures that the talent pool keeps expanding. The Leadership Role played by our senior professionals helps to keep the next rung of leadership ready to take up the challenges thrown up by the global market.
The management helps the process of decision making by decentralizing and empowering professionals to execute tasks in a speedy manner. The management fosters information sharing and free exchange of ideas. Above all, the sense of ownership and empowerment to take decisions helps the Company to adapt and be ahead of the competition in this rapidly changing global environment.
The industrial relation at all the plant sites of your company is cordial.
As on 31st March, 2012 the Company’s permanent employees strength was 718.
DIRECTORS
Mr. V. Nagaraj, Whole-time Director resigned as Director and Whole-time Director, which the Board accepted effective from 29th June, 2011. Dr. Balwant Shankarrao Desai has been appointed as a Whole-time Director in the last AGM held on 29th September, 2011.

5
Marksans Pharma LimitedMMr. M. B. Parikh resigned as a Director of the Company effective from 5th October, 2011. The Board of Directors has appointed Mr. Seetharama Raju Buddharaju as a Director to fill the casual vacancy caused by the resignation of Mr. M. B. Parikh with effect from 5th October, 2011.
Mr. Ajay S. Joshi, who was appointed to fill the casual vacancy caused by the resignation of Mr. Kumar Nair, will vacate the office from the forthcoming AGM. Your company has received notice from a member proposing the appointment of Mr. Ajay S. Joshi as a Director of the Company. The Board recommends the appointment of Mr. Ajay S. Joshi as a Director liable to retire by rotation.
CORPORATE GOVERNANCE
Pursuant to the Clause 49 of the Listing Agreement, a detailed report on Corporate Governance and Management Discussion and Analysis and a certificate from the Auditors regarding compliance with the conditions of Corporate Governance forms a part of this report.
AUDITORS
Members of the Company are requested to appoint Auditors for the ensuing year. It is proposed to appoint M/s. N, K. Mittal and Associates, Chartered Accountants, as the Statutory Auditors of the Company. The Company has received letter from them to the effect that their appointment, if made, would be within the prescribed limits Under Section 224 of the Companies Act, 1956. The Board recommends their appointment as Statutory Auditors.
APPRECIATION
The directors place on record their appreciation for the contribution made by the employees at all levels enabling the Company to achieve the performance during the year under review.
The directors also appreciate the valuable co-operation and continued support extended by Company’s Bankers, Medical Professionals, Business Associates and Investors who have put their faith in the Company.
By order of the Board of Directors
Mumbai Mark SaldanhaDated 14th August, 2012 Chairman & Managing Director
ANNEXURE TO THE REPORT OF THE BOARD OF DIRECTORS
INFORMATION UNDER SECTION 217(1)(e) OF THE COMPANIES ACT, 1956, READ WITH THE COMPANIES (DISCLOSURE OF PARTICULAR IN THE REPORT OF THE BOARD OF DIRECTORS) RULES, 1988 AND FORMING PART OF DIRECTORS REPORT FOR THE YEAR ENDED 31ST MARCH, 2012.
A. CONSERVATION OF ENERGY
a) Energy Conservation measures taken:
The Company continues with its policy of giving priority to energy conservation measures including regular review of energy generation and consumption and effective control on utilization of energy.
The following energy conservation methods were implemented during the year.
a) Changed over to Agro Waste Fired boilers.
b) Scheduled production to avoid usage of diesel during “Weekly Power Shutdown”.
c) Optimisation in use of cooling water pumps.
d) Use of energy efficient pumps and motors.
e) Chemical dosing of cooling/chilling water system.
f) Cold Insulation ducting and HVAC system was checked and sections redone.
g) Installed energy efficient motors for chilling plant compressors.
h) Intensified internal audit aimed at detecting wastage and leakage of utility Circuits.
b) Additional investments:
The Company is continuously installing electronic devices to improve quality of power and reduction of energy consumption:
c) Impact of above measure:
The adoption of energy conservation measures have resulted in considerable savings and increased level of awareness amongst the employees. The energy conservation measures have also resulted in improvement of power factor, consequential tariff benefits.

6
ANNUAL REPORT 2011-2012
d) Energy Consumption:
Particulars 2011-12 2010-111 Electricity
(a) PurchasesUnits (kwhs) 5555130 5661945Total Amount (`) 21710545 22000692Rate/ Unit (`) 3.91 3.89(b) Own Generation(i) Through Diesel GenerationUnits (in’000 kwhrs) 204.22 133.95Units per Ltr of Disel Oil 2.96 2.96Cost/ Unit (`) 14.39 13.19(ii) Through SteamTurbine/ Generator 0 0
2 Coal 0 03 Furnace Oil
Qty (units in’000 K.Ltrs) 0 37.55
Total Amount (` in’000) 0 1250.05Average Rate (` /K/Ltr) 0 33.29
4 Light Diesel OilUnits (K.Ltrs) 0 0Total Amount (` ‘000) 0 0Average Rate (`/K.Ltr) 0 0
5 PetcokeQty (units in ‘000) 0 71.01Total Amount (` ‘000) 0 454.46Average Rate 0 6.40
6 Agrowaste ConsumptionQty (units in ‘000) 3544.00 3332.61Total Amount (` ‘000) 11922.38 10526.87Average Rate 3.36 3.16
7 Other Internal Generation 0 0
B. TECHNOLOGY ABSORPTION
Research and Development (R&D)
(1) Specific areas in which R&D carried out by the Company.
Foray into Generic business and identification of few niche areas for product development, mainly in dossier development, post patent filing for regulated & semi regulated markets.
(2) Benefits derived as a result of above R & D
Increase in number of products exported to US, Europe and other regulated and emerging markets.
(3) Future plan in action
Development of new and innovative products will lead to evolution of comprehensive range of generics leading to Abbreviated New Drug Applications / Dossiers for filing.
(4) Expenditure on R&D
Company continues to benefit from the extensive Research and Development (R&D) activity carried on. During the year, your company has incurred major expenses of R & D nature for new products development and ANDA / Dossiers filing for regulated and emerging markets and has capitalized as intangible assets.
Technology absorption, adaptation and innovation.
1. Efforts in brief, made towards technology absorption adaptation and innovation.
Improvements in process parameters, up-gradation of plant and systems facility, working systems, documentation and practices to international regulatory standards for European and U.S. Market.
2. Benefits derived as a result of the above efforts.
Bio Fuel being substantially cheaper to Furnace Oil, its usage will generate savings in fuel cost. Also it will save time on steam generation and add to operator safety. Access to highly regulated markets, thereby increasing the sales volumes, Installation of new testing equipment has substantially reduced dependency on external testing, thereby reducing the overall operational time cycles. The same has also resulted in reduction in manpower. Improvements in process parameters have reduced the percentage rejection in the process thereby reducing the wastage of costly raw material.
3. Imported Technology
Nil
C. FOREIGN EXCHANGE EARNINGS & OUTGO
During the financial year 2011-12, Your company used foreign exchange amounting to ` 2310.93 Lacs (Previous Year ` 996.57 Lacs) and earned foreign exchange amounting to ` 15041.17 Lacs (Previous Year ` 8438.28 Lacs).
By order of the Board of Directors
Mumbai Mark Saldanha14th August, 2012 Chairman & Managing Director
7
Marksans Pharma LimitedM
INDUSTRY STRUCTURE AND DEVELOPMENTGlobal Pharmaceutical MarketThe pharmaceutical market worldwide, after experiencing a slump during the last couple of years, is now in its recovery path, although very slow. Decline in global pharma market was largely due to the economic slowdown, and further aggravated by patent expiry of key blockbusters together with saturation in key pharma markets, such as the US and Western Europe. Meanwhile, pharma markets in some developing regions, like Asia and Latin America have been continuously witnessing robust growth rate for the last few years on account of increasing prevalence of diseases, rising healthcare spending, and increasing affordability. Overall, these markets will enjoy good growth potential in coming years.The global pharma industry is projected to grow at a CAGR of around 5% in the coming years. The growth will be driven by low cost factor, increasing prevalence of diseases worldwide, and rising per capita income of consumers. Sales of generic drugs will emerge as the most prominent segment of the pharma market during the coming period, indicating large opportunities for generics manufacturers.The pharma industry is growing at a rapid rate in emerging countries, such as India, China, Brazil, Russia, among others, while a slowdown is still looming in the US and Western European countries.Recent structural changes in the global pharmaceutical industry has led to outsourcing being a key strategy for improving profitability for innovator companies. These include a) declining productivity, b) rising costs of R&D, c) looming patent cliff, d) increasing genericization of products coupled with weaker pipelines of innovator companies, e) fewer blockbuster launches, and f) delays in new product approvals.Major decisive factors for pharmaceutical companies to adopt outsourcing include flexibility, quicker time-to-market and lower scale-up costs in order to meet increasing demand for new drugs and focus on core competencies. Outsourcing also helps in the reduction of excess capacity in their manufacturing networks and restructure supply chains.Global outsourcing market:• Global outsourcing market reported a slowdown in
growth driven by factors such as inventory rationalization by global innovators, reduced R&D spending etc., triggered by the recent economic crisis.
• However, over the medium to long-term, this market is likely to grow at a CAGR of about 20-25 percent, backed by strong fundamental drivers such as a) increased outsourcing by big pharmaceutical companies; and b) increased traction in the new and high-end service contracts.
US Generic Market:• There is continued penetration of generics in the US
market due to steeply escalating healthcare costs and
the impending patent cliff. Large number of patented drugs are going off-patent in the next few years, thereby offering significant opportunities for Indian pharmaceutical players.
• The US generic market presents the following advantages for the Indian generics players:
• Approval from US FDA can open up a large USD 35bn market;
• The market is easier to penetrate as it is dominated by ‘generic generics’ compared to branded-generic markets in the emerging world;
• Distribution chain already in place and hence large upfront investments in sales and marketing infrastructure are not required; and
• The gestation period is shorter, as there is no need to build relationships with physicians.
• The US market accounts for approximately 40 percent of the global generics market and therefore offers a large scope for scaling up operations.
Impending ‘Patent Cliff’• Approximately USD 150bn worth of drugs are expected
to go off-patent by 2015. The value of these drugs going off-patent is expected to peak in the current fiscal.
• The sale value of drugs going off-patent over the next five years in the US market is approximately double the sale value of drugs that went off- patent in the last five years.
• New generics sales are expected to be the key growth drivers in the regulated markets of the US and Europe.
• The new generics sales are expected to grow at a CAGR of 22 to 23 percent in the US. However, the existing generics market is expected to grow slowly at a rate of around 3 percent.
• This provides a considerable opportunity for generic manufacturers to capture greater generics’ share of the US pharma market.
• Additionally, generic companies will also benefit by the US healthcare bill to extend healthcare coverage to Americans who are still uncovered, as part of healthcare reforms. The provisions of the new healthcare bill are expected to provide a big impetus to generic drug manufacturers, globally.
• The absorption rate for generics in the US market is thus expected to steadily increase over the next few years.
Asia emerging as a preferred outsourcing hub• The nucleus of outsourcing is fast shifting from western
territories of North America and Europe towards Asia. Asia has number of local contract manufacturing players and a significant number of these players have US FDA and GMP certifications.
• Asian countries provide significant cost advantage as compared to the western region.
MANAGEMENT DISCUSSION AND ANALYSIS

8
ANNUAL REPORT 2011-2012
• Pharmaceutical companies have already realized the potential offered by these markets with about 32 percent of them preferring Asia for outsourcing.
Indian Pharmaceutical Market
Globally India ranks third in term of manufacturing pharmaceutical products in volume. The Indian pharmaceutical industry is expected to grow at around 9.5%. The increasing population of the higher income group, competent and skilled workforce, lower production cost, R & D cost and clinical trial expenses in the country will open a vast market for multinational companies selling costly drugs and making India a lucrative destination for clinical trials for global giants. This will also pave the way for new drug discovery research. The Indian pharmaceutical industry has been the front runner in a wide range of specialties involving complex drug manufacture, development and technology.
Growth of Indian pharmaceuticals market is expected to be influenced by:
• Lower production cost, R&D cost and Clinical trial expenses compared to rest of the world.
• Rapid increase in disposable income and number of middle class households.
• Expansion of medical infrastructure largely through private investments.
• Greater penetration of health insurance.
• Rising prevalence of chronic disease. Increased urbanisation and rapidly changing lifestyles in urban and semi-urban areas are expected to see increased incidences of chronic diseases which are expected to provide thrust to specialty and super-specialty therapies.
• Adoption of product patents as patent infrastructure scales up to enable up to 30 approvals annually and an average approval timeframe of two years.
• Aggressive market penetration as several smaller players have surfaced across the country who are catering to mass therapies.
• Solid legal framework and strong financial market.
Mass therapies will remain critical despite shift towards specialty therapies:
• Increasing urbanisation and changing work patterns expected to continue leading to rise in stress levels and growing consumption of unhealthy food. As a result there will be significant rise in the number of anti- infective, gastrointestinal, cardiovascular and many other related lifestyle ailments. The growing prevalence of lifestyle disorders will spur growth in specialty and super-specialty therapies.
• Despite the shift in disease profile, the growth opportunity in mass therapies are expected to remain significant for two reasons:
• The gap between prevalence and treatment remains wide in a range of disease spanning anti-infective, gastrointestinal, respiratory and pain management therapies.
• Nearly 140mn people are estimated to move above poverty line which should increase the spending on basic healthcare and consumption of mass therapy drugs for acute treatment.
Generics to dominate despite increase in share of patent products• If patent related infrastructure is in place and related
regulatory issues finalised, then patent-protected products are expected to constitute about 10 percent of the total markets by 2015.
• However, currently Indian Patent Act has relatively narrow definition of patentability. Therefore, it is likely that a proportion of post-1997 molecules may not get full patent protection.
• Besides strong pipeline of recently launched generic products and products that are undergoing new process developments, companies have an option of developing new combinations and formulations from a range of approximately 200 products that are pre-1995.
Growth prospects of Nuero / CNS therapeutic category• Neurological disorders are age-related. An increasing
aging population will drive the growth of the market and hence the R&D.
• Further, there are large number of unmet needs which will result in demand for neurological and CNS drugs in future. These include:
• Worldwide Alzheimers disease, which affects approximately 24 mn people worldwide and expected to reach 40 mn by 2020. Further, current therapy has a modest symptomatic effect and does not significantly modify the course of this progressive neuro-degenerative disorder.
• Significant need for a Multiple Sclerosis (MS) treatment with superior efficacy to current therapies with a less invasive and less time consuming route of administration.
• An unmet need for primary progressive and secondary-progressive MS indication.
• Need for a reduced dosing frequency or a less invasive therapy with good patient compliance.
Oncology market overview• Estimated market size of the oncology segment is
expected to grow at a CAGR of 25 percent by 2014.• Segment level projections are as follows: • Cytotoxics: This segment is estimated to grow at a
compounded annual growth rate of 16 percent p.a. and reach upto about INR 17,340mn (USD 347mn) by FY 2014.
• Hormones: This segment is estimated to grow at a compounded annual growth rate of 19 percent p.a. and reach upto about INR 2,860mn (USD 57mn) by FY 2014.
• Novels & GFs: This segment is estimated to grow at a compounded annual growth rate of 40 percent p.a. and reach upto about INR 20,550mn (USD 411mn) by FY 2014.

9
Marksans Pharma LimitedM • The growth in the oncology market in India is driven
by introduction of new treatments, increasing number of patients on chemotherapy and improved access to modern cancer therapies.
Indian CRAMS Market• Indian CRAMS industry (both contract manufacturing
and contract research together) is growing at about 12 percent of the global CRAMs market. Growth in the CRO sector is expected to be greater than the growth in the CMO sector.
• Formulations outsourcing forms a small part of the Indian CMO sector. However, formulation outsourcing is expected to capture greater market share in the next few years.
• Indian CRAMs players have diversified in terms of their product offerings and are building competencies to match the global players. The players are investing in MNC relationship and have also made some overseas acquisitions to gain access to customers and critical technologies/capabilities.
DIVISION WISE PERFORMANCEThe Company is actively engaged in R&D and offering CRAMS to global pharmaceutical companies. The R&D capability of the Company includes Dossier Development Service, Formulation Development and Specified Drug Delivery System.The Company’s state-of-the-art manufacturing facilities in Goa are of international standards adhering to stringent quality norms and are approved by US FDA, UK MHRA, Australian TGA, Brazillian ANVISA and other foreign health authorities. It is one of the biggest manufacturing facilities for soft gelatin capsules and tablets in Asia.(1) Domestic Formulation Business (i) Criticare Division: It is the specialty division which
mainly focuses on Oncology and Critical care therapy. The major brands of this division are MARKPARIN and EPIGROF. EPIGROF is also being supplied to major hospitals and other major burns and trauma care institutes. This division has created a niche for itself in the Oncology segments with its anti cancer products.
(ii) Cerebella Division : It is the specialty division marketing drugs meant for lifestyle diseases, Neuro and Psychiatric therapy. The major brands of this division are BAZZY, CITOFAST, GABELLA, GABELLA M, XENOTRIL which are the main contributors of sales.
Our future course of action in this division is going to be more focused in segments like Epilepsey, Alzimerhs and Depression as these segments are the growth drivers for CNS market. Our presence is good in these segments with latest and accepted products like Bazzy, Donaz Citofast.
(2) International Formulation Main focus market for the Company is US, UK, Australia,
New Zealand, Germany and other European markets. It is also eying to tab huge Russian and CIS markets and has started dossier filling in these countries.
OPERATIONAL REVIEWThe Company constantly reviews its product-market portfolio with a view to strengthen sustainable growth. It has worked towards strengthening its competitive status by investing in long-term value assets.To ensure superior control of operations, the company has been able to better monitor its operations and costs.RevenueTurnover of the Company has reduced to ` 15459.13 Lacs in 2011-12 from ` 15469.77 Lacs in 2010-11. The main reason being the turnover of the year 2010-11 also includes turnover of the erstwhile API division whereas, the turnover of the year 2011-12 includes only from formulation business.Cost of SalesCost of sales has reduced to ` 8775.84 Lacs in 2011-12 from ` 10731.84 Lacs in 2010-11 i.e. a decrease by 18.23%.Other ExpensesOther Expenses increased to ` 17105.90 Lacs in 2011-12 from ` 11635.11 Lacs in 2010-11 i.e. an increase by 47.02%, mainly due to charging of diminution in the value of investment and impairment of assets.Depreciation and amortization expensesDepreciation and amortization expenses was ` 1798.12 Lacs in 2011-12 as compared to ` 1464.39 Lacs in 2010-11 i.e. an increase by 22.79%. With the receipt of ANDA approval and approval of Dossiers in the emerging market coupled with site variation approval in CRAMS in the regulated markets, the Company has started amortising the cost capitalized for the development of these products.Finance CostFinance cost has increased to ` 4908.76 Lacs in 2011-12 from ` 3922.79 Lacs in 2010-11 i.e. an increase by 25.13% on account of provisioning of foreign exchange fluctuation loss on FCCBs.Reserves and SurplusThe Negative Reserves & Surplus has further increased to ` 23951.58 Lacs in the year 2011-12 from ` 9241.95 Lacs in 2010-11. This is mainly due to losses incurred in the current year.Long term borrowingsLong term borrowings has reduced to ` 1520.13 Lacs in 2011-12 from ` 1900.48 Lacs in 2010-11 i.e. a decrease by 20.01% due to repayment of term loan.Short term borrowingsShort term borrowings has reduced to ` 7718.34 Lacs in 2011-12 from ` 8433.30 Lacs in 2010-11 i.e. a decrease by 8.48%.Trade PayablesTrade payables has reduced to ` 2947.85 Lacs in 2011-12 from ` 2997.73 Lacs in 2010-11 i.e. a decrease by 1.66%.Other current liabilitiesOther current liabilities has reduced to ` 29443.49 Lacs in 2011-12 from ` 29850.57 Lacs in 2010-11 i.e. a decrease by 1.36%.

10
ANNUAL REPORT 2011-2012
Tangible Assets
The Company’s tangible assets has increased to ` 4895.55 Lacs in 2011-12 from ` 4781.16 Lacs in 2010-11 i.e. an increase by 2.39%.
Intangible Assets
During the year 2011-12, the Company’s Intangible Assets has reduced to ` 2770.13 Lacs in 2011-12 from ` 13708.90 Lacs in 2010-11 on account of impairment.
Non-current investments
Non-current investments has decreased to ` 2351.46 in Lacs in 2011-12 from ` 6761.64 Lacs in 2010-11 on account of diminution in the value of investments.
Long term loans and advances
Long term loans and advances has increased to ` 395.09 Lacs in 2011-12 from ` 370.09 Lacs in 2010-11 i.e. an increase by 6.76%.
Inventory
Inventory has increased to ` 4024.70 Lacs in 2011-12 from ` 4001.25 Lacs in 2010-11.
Receivable
Receivable has increased to ` 7418.94 Lacs in 2011-12 from ` 7217.45 Lacs in 2010-11.
Short term loans and advances
Short term loans and advances has reduced to ̀ 978.39 Lacs in 2011-12 from ` 1208.42 Lacs in 2010-11 i.e. a decrease by 19.04%.
Cash and cash equivalents
Cash and cash equivalents has reduced to ` 1758.50 Lacs in 2011-12 from ` 2623.78 Lacs in 2010-11.
OPPORTUNITIES
We see the following forces to provide ample opportunities for the Indian pharmaceutical sector.
1. The Indian pharmaceutical market is expected to grow at 13% to 16% in the coming years.
2. Rising disposable income level and increasing health awareness among the vast rural population will boost expenditure on healthcare.
3. Growing penetration of health insurance.
4. Lifestyle therapeutic segment in domestic market
5. Many big global players are outsourcing Contract Research and Manufacturing services (CRAMS) in India.
6. Billions of US$ worth of drugs going off patent each year in US opening the vast US market for the Indian pharmaceutical sectors.
7. Increasing captive consumption by the subsidiary companies.
THREATS, RISKS AND CONCERNSCompared with other sectors, pharmaceutical sector works in a dynamic environment and are subject to the following threats, risks and concerns.1. Lack of newer and better molecules availability.2. High competition is adversely affecting the margins.3. High attrition rate.4. Lack of talented and technical field staff.5. Highly demanding customers.6. Government action on price control.7. Rising audit burdens, inspections and fitness regulations.8. Though the global economy has started recovery,
growth in the US and European markets which are the major focused market for the Company, is relatively low.
9. Foreign Exchange fluctuations10. IPR issuesOUTLOOKDespite the aforesaid threats, risks and concerns, the Management looks forward to a satisfactory performance in the coming years in the light of the opportunities available with more focus on the formulation business which are expected to grow in the years to come. The following key factors will drive the Company forward :1. Global presence – Export Oriented Unit2. Low cost manufacturing base3. World class manufacturing facilities with huge capacities
approved by major global health authorities4. Own front ends into UK/Europe and Australia5. Tie up with big pharmaceutical companies6. Strong R&D, Dossier development capabilities7. Preferred outsourcing partnerINTERNAL CONTROL SYSTEM AND THEIR ADEQUACYThe Company has an adequate internal control system including suitable monitoring procedures commensurate with its size and the nature of the business. The internal control system – based on existing laws, regulations and the company policies – comprises regular internal audits, management reviews and use of standard policies and guidelines aimed at ensuring reliability of financial and other records.CAUTIONARY STATEMENTStatements in the Management’s Discussion and Analysis Report describing the Company’s objective, projections and estimates are forward looking statements and progressive within the meaning of applicable Security Laws and Regulations. Actual results could differ materially from those expressed or implied since the company’s operations are influenced by many external and internal factors beyond the control of the Company.

11
Marksans Pharma LimitedM
Company’s Philosophy on Corporate Governance
The Company is committed to the principles of good corporate governance to achieve long term corporate goals and to enhance shareholders value by managing its operations at all levels with highest degree of transparency, responsibility and delegation with equity in all facets of its operations leading to sharp focus and operationally efficient growth. The spirit of Corporate Governance has prevailed in the Company and has influenced its decisions and policies. The strong internal control system and procedures and codes of conduct for observance by the Company’s directors and employees are conducive in achieving good corporate governance practices in the Company. The compliance report is prepared and given below in conformity with the mandatory requirements of Clause 49 of the Listing Agreement with the Stock Exchanges.
Board of Directors
As on the date of this report, the total number of Directors on the Board is 4 (four). Out of that two Directors are non-executive and independent. During the financial year under review, 13 Board Meetings were held on the following dates: 06.04.2011, 02.05.2011, 28.05.2011, 28.06.2011, 12.08.2011, 26.08.2011, 30.08.2011, 05.10.2011, 25.10.2011, 14.11.2011, 21.12.2011, 13.02.2012 and 31.03.2012.
None of the Directors are members of more than 10 Committees of the Board nor are the Chairman of more than 5 Committees of the Board across all the companies in which they are directors. The details as to Composition, Status, Attendance at the Board Meetings and the last Annual General Meeting, outside Directorship and other Committees membership are as follows:
Name of the Director
Executive/ Non-executive/ Independent/ Promoter
No. of Shares in the Company
No. of Board Meetings attended out of 13 held
No. of outside directorship in Public Limited Companies*
Membership held in Committee of Directors**
Chairmanship held in committee of Directors**
Whether attended last AGM
Mr. Mark Saldanha
(Chairman & Managing Director)
Executive, Non-Independent
177982910 12 Nil Nil Nil Yes
Mr. V. Nagaraj
(Whole-time Director) (Upto 29.06.2011)
Executive & Non-Independent
Nil 4 Nil Nil Nil -
Dr. B. S. Desai (w.e.f. 29.09.2011)
Executive & Non-Independent
Nil 6 Nil Nil Nil Yes
Mr. Mahesh B. Parikh (Upto 05.10.2011)
Non-executive & Independent
Nil 5 2 2 1 No
Mr. S. R. Buddharaju (w.e.f 05.10.2011)
Non-executive & Independent
Nil 5 Nil Nil Nil -
Mr. Ajay S. Joshi (w.e.f 02.05.2011)
Non-executive & Independent
Nil 7 Nil Nil Nil No
* This excludes directorship held in private companies, foreign companies, companies formed under section 25 of the Companies Act, 1956 and directorship held as an alternate director.
** Membership/Chairmanship in Committee of Directors include Audit Committees and Shareholder/Investors Grievance Committees only. This does not include membership/chairmanship in committee of Directors of Marksans Pharma Limited.
CORPORATE GOVERNANCE REPORT 2011- 12
12
ANNUAL REPORT 2011-2012
Audit Committee
The Audit Committee consists of Directors, namely Mr. S. R. Buddharaju (Chairman), Dr. B. S. Desai and Mr. Ajay S. Joshi. The Managing Director, head of Finance along with statutory auditors are invited to the audit committee meetings. Company Secretary acts as the Secretary to the Committee. The constitution, functions and the terms of the reference of the Audit Committee are those prescribed under Clause 49 of the Listing Agreement as well as under Section 292A of the Companies Act, 1956. During the financial year under review, 6 Audit committee meetings were held, which were attended by all the members of the Committee.
Remuneration Committee
The Remuneration Committee of the Company consists of Directors, namely Mr. S. R. Buddharaju (Chairman), Dr. B. S. Desai and Mr. Ajay S. Joshi. The Committee has power to determine the remuneration of the executive Directors of the Company as per the provisions of Clause 49 of the Listing Agreement and applicable provisions of the Companies Act, 1956.
Investors’ Grievance Redressal Committee
The Investor Grievance Redressal Committee consists of Directors, namely Mr. S. R. Buddharaju (Chairman), Dr. B. S. Desai and Mr. Ajay S. Joshi. The Committee looks into the shareholders’ and Investors grievances. The Committee also oversees the performance of the Registrar and Share Transfer Agent and recommends measures to improve the level of investor services.
Number of complaints received during the year : Nil
Number of complaints resolved to the satisfaction of shareholders : -
Share Transfer System
The Company has appointed Bigshare Services Private Limited as its Registrar and Share Transfer Agent for both physical and demat segment. The Company has authorised the Company Secretary of the Company to approve the share transfers lodged in physical mode. The shares lodged in physical mode are transferred and returned in 15 days from the date of receipt, so long as the documents are complete in all respects. As on 31.03.2012, no shares were pending for transfer.
The Board has designated Mr. Harshavardhan Panigrahi, the Company Secretary of the Company as Compliance Officer.
Disclosures
a) No material financial and commercial transactions were reported by the management to the Board of Directors in which management had personal interest having a potential conflict with the interest of the Company at large.
b) There was no non-compliance during the last three years by the Company on any matter related to the capital market. Consequently, there were neither any penalties imposed nor strictures passed on the Company by Stock Exchanges, SEBI or any statutory authority.
c) The Company is fully compliant with the applicable mandatory requirements of Clause 49 of the Listing Agreement on Corporate Governance.
d) There is no pecuniary relationship or transaction between the non-executive directors and the Company.
e) There is no relationship between the directors inter se except as members of the Board.
f) Details of related party transactions during the year ended 31st March, 2012 has been set out under Note No. 2.20 of the Notes annexed to the Financial Statements for the year ended 31st March, 2012.
Directors Remuneration
The non-executive directors are not paid any remuneration. The executive directors are paid remuneration under the applicable provisions of the Companies Act, 1956 with approval of the shareholders in the General Meeting. Details of the remuneration paid to the executive directors of the Company during the year ended 31st March, 2012 has been set out under Note No. 2.20 of the Notes annexed to the Financial Statements for the year ended 31st March, 2012.
Management’s Discussion And Analysis Report.
The Annual Report has a separate and detailed chapter on Management’s Discussion and Analysis which deals with Industry structure and development, opportunities and threats, segment wise performance, outlook, risks and concerns of the Company and discussions on financials with respect to operation.

13
Marksans Pharma LimitedMMeans of Communication
Quarterly, Half-yearly, and Annual results of the Company are published in one English and one Marathi newspaper. These are also submitted to the stock exchanges in accordance with the Listing Agreement and are available on the website of the BSE (www.bseindia.com) & NSE (www.nseindia.com) and also on the Company’s website (www.marksanspharma.com).
The Company has not made any presentation to institutional investors or analysts.
General Body Meetings
Annual General Meetings
Date Time Venue No. of SpecialResolutions
Nineteenth 29.09.2011 10:30 A.M. GMS Community Centre HallSitladevi Complex, 1st FloorD.N. Nagar, Link RoadAndheri (W), Mumbai - 400053
1*
Eighteenth 28.09.2010 10:30 A.M. GMS Community Centre HallSitladevi Complex, 1st FloorD.N. Nagar, Link RoadAndheri (W), Mumbai - 400053
1**
Seventeenth 25.09.2009 10.30 A.M. GMS Community Centre HallSitladevi Complex, 1st FloorD.N. Nagar, Link RoadAndheri (W), Mumbai - 400053
Nil
* One Special Resolution has been passed in the AGM held on 29th September, 2011 to create, issue and allot 1,75,00,000 Warrants on a preferential basis to Mr. Mark Saldanha and/or other Promoters and/or Promoters Group of the Company.
** One Special Resolution has been passed in the AGM held on 28th September, 2010 regarding re-appointment of Mr. Mark Saldanha as Managing Director of the Company.
Postal ballot
As of date, there is no proposal to pass any resolution by postal ballot.
General Shareholder Information
AGM : Twentieth Annual General Meeting.Day & Date : Thursday, the 27th September, 2012.Time : 10:30 AMVenue : GMS Community Centre Hall, Sitladevi Complex, 1st Floor, D.N. Nagar, Link Road,
Andheri (W), Mumbai 400 053Financial calendar : Financial Year - April to March
First Quarter Results - 2nd week of August
Second Quarter Results - 2nd week of November
Third Quarter Results - 2nd week of February
Last Quarter Results - 3rd/4th week of MayDate of Book Closure : From Saturday, the 22nd September, 2012 upto Thursday, the 27th September, 2012 (both
days inclusive).Dividend payment date : Nil, as there is no proposal to declare dividend.Listing on Stock Exchanges : The Bombay Stock Exchange Limited (BSE)
The National Stock Exchange of India Limited (NSE)
The annual listing fees for the year 2012-2013 have been paid.Stock Code : BSE : 524404
NSE : MARKSANSISIN : INE750C01026

14
ANNUAL REPORT 2011-2012
Market price data on BSE during the period April 2011 to March 2012
Month Open (`) High (`) Low (`) Close (`)April 2011 2.30 3.00 2.24 2.50May 2011 2.50 2.63 2.12 2.18June 2011 2.19 3.09 2.00 2.56July 2011 2.55 3.44 2.55 2.79August 2011 2.89 2.92 2.10 2.48September 2011 2.37 2.54 2.10 2.20October 2011 2.20 2.48 2.10 2.19November 2011 2.16 2.32 1.65 1.99December 2011 2.05 2.10 1.57 1.73January 2012 1.73 2.24 1.65 2.15February 2012 2.19 2.50 1.88 1.93March 2012 1.94 1.98 1.60 1.65
Shareholding Pattern as on 31.03.2012
Category No. of Shareholders
% of Shareholders
No. of Shares held
% of Shareholding
Individual 45359 97.73 317361275 86.28
Bodies Corporate 753 1.62 34370133 9.34
NRIs 259 0.56 2918457 0.79
FIIs 2 1210507 0.33
Non-Resident Bodies Corporate 2 11765101 3.20
Trust 1 20000
Bank, Financial Institution & Insurance Companies
2 10000
Clearing Members 34 0.07 151731 0.04
Total 46412 100 367807204 100
Promoters 2 0.01 177983090 48.39
Non-Promoters 46410 99.99 189824114 51.61
Total 46412 100 367807204 100
Distribution of Shareholding as on 31.03.2012
Shareholding No. of Shareholders % of Shareholders No. of Shares held % of Shareholding
Upto 5000 41471 89.36 49787955 13.54
5001 – 10000 2640 5.69 21123003 5.74
10001 – 20000 1156 2.49 17127846 4.66
20001 – 30000 437 0.94 11062914 3.01
30001 – 40000 169 0.36 5994085 1.63
40001 – 50000 153 0.33 7215996 1.96
50001 – 100000 227 0.49 16006622 4.35
Above 100000 156 0.34 239488783 65.11
Total 46412 100 367807204 100
15
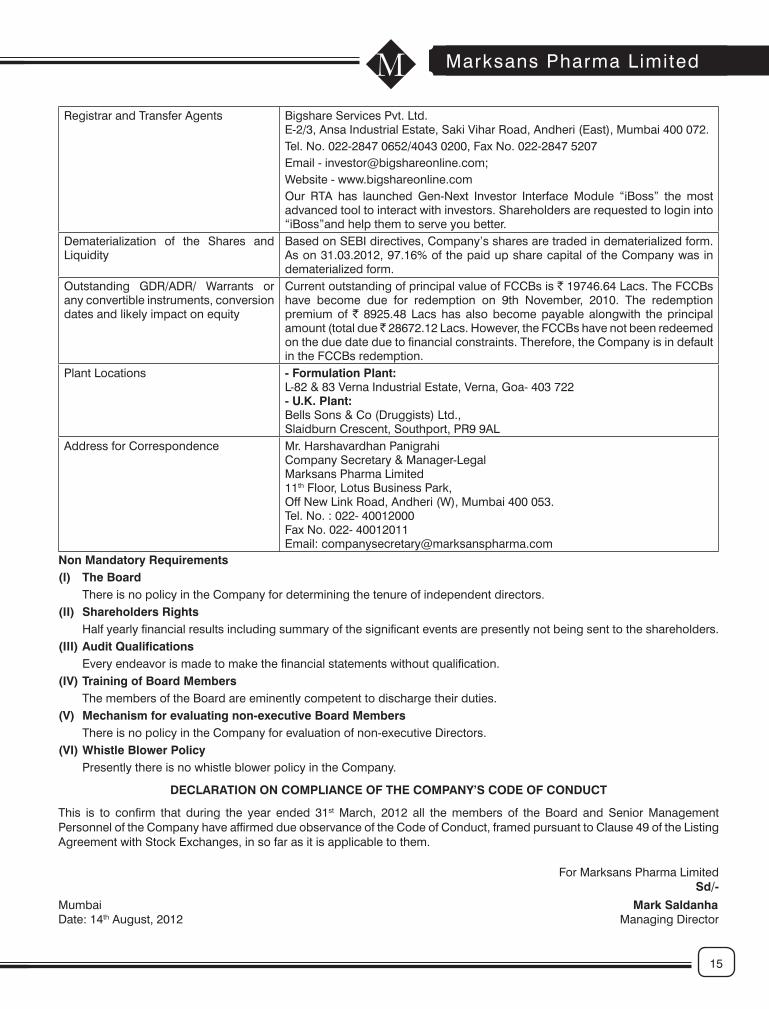
Marksans Pharma LimitedMRegistrar and Transfer Agents Bigshare Services Pvt. Ltd.
E-2/3, Ansa Industrial Estate, Saki Vihar Road, Andheri (East), Mumbai 400 072.Tel. No. 022-2847 0652/4043 0200, Fax No. 022-2847 5207Email - [email protected];Website - www.bigshareonline.comOur RTA has launched Gen-Next Investor Interface Module “iBoss” the most advanced tool to interact with investors. Shareholders are requested to login into “iBoss”and help them to serve you better.
Dematerialization of the Shares and Liquidity
Based on SEBI directives, Company’s shares are traded in dematerialized form. As on 31.03.2012, 97.16% of the paid up share capital of the Company was in dematerialized form.
Outstanding GDR/ADR/ Warrants or any convertible instruments, conversion dates and likely impact on equity
Current outstanding of principal value of FCCBs is ` 19746.64 Lacs. The FCCBs have become due for redemption on 9th November, 2010. The redemption premium of ` 8925.48 Lacs has also become payable alongwith the principal amount (total due ̀ 28672.12 Lacs. However, the FCCBs have not been redeemed on the due date due to financial constraints. Therefore, the Company is in default in the FCCBs redemption.
Plant Locations - Formulation Plant:L-82 & 83 Verna Industrial Estate, Verna, Goa- 403 722- U.K. Plant:Bells Sons & Co (Druggists) Ltd.,Slaidburn Crescent, Southport, PR9 9AL
Address for Correspondence Mr. Harshavardhan PanigrahiCompany Secretary & Manager-LegalMarksans Pharma Limited11th Floor, Lotus Business Park,Off New Link Road, Andheri (W), Mumbai 400 053.Tel. No. : 022- 40012000Fax No. 022- 40012011Email: [email protected]
Non Mandatory Requirements(I) The Board There is no policy in the Company for determining the tenure of independent directors.(II) Shareholders Rights Half yearly financial results including summary of the significant events are presently not being sent to the shareholders.(III) Audit Qualifications Every endeavor is made to make the financial statements without qualification.(IV) Training of Board Members The members of the Board are eminently competent to discharge their duties.(V) Mechanism for evaluating non-executive Board Members There is no policy in the Company for evaluation of non-executive Directors.(VI) Whistle Blower Policy Presently there is no whistle blower policy in the Company.
DECLARATION ON COMPLIANCE OF THE COMPANY’S CODE OF CONDUCT
This is to confirm that during the year ended 31st March, 2012 all the members of the Board and Senior Management Personnel of the Company have affirmed due observance of the Code of Conduct, framed pursuant to Clause 49 of the Listing Agreement with Stock Exchanges, in so far as it is applicable to them.
For Marksans Pharma Limited Sd/-
Mumbai Mark SaldanhaDate: 14th August, 2012 Managing Director

16
ANNUAL REPORT 2011-2012
BRIEF RESUME OF THE PERSON PROPOSED TO BE APPOINTED AS DIRECTOR OF THE COMPANY AT THE ANNUAL GENERAL MEETING.
Name Mr. Ajay S. Joshi
Age 50 Years
Qualification Science Graduate
Experience He has over 25 years of experience in the field of marketing pharmaceutical products in international market particularly in the USA. Presently he is a Director of Spirit Pharmaceutical LLC of USA.
Name of the other Companies in which also holds directorship
Nil
Name of the other Company in the committee of which also holds membership / chairmanship
Nil
No. of shares held in the Company Nil
To,The Members,MARKSANS PHARMA LTD.
We have examined the compliance of conditions of Corporate Governance by MARKSANS PHARMA LTD. for the year ended 31st March, 2012 as stipulated in Clause 49 of the Listing Agreement of the said Company with Stock Exchanges in India.
The compliance of conditions of Corporate Governance is the responsibility of the Management. Our examination was limited to procedures and implementation thereof, adopted by the Company for ensuring the compliance of conditions of Corporate Governance. It is neither an audit nor an expression of opinion on the financial statements of the Company.
In our opinion and to the best of our information and according to the explanations given to us, we certify that the Company has complied with the conditions of Corporate Governance as stipulated in the above-mentioned Listing Agreements.
We state that as per the records maintained by the Company, there were no investor grievances remaining unattended / pending for a period exceeding one month.
We further state that such compliance is neither an assurance as to the future viability of the Company nor the efficiency or effectiveness with which the Management has conducted the affairs of the Company.
For N.K.MITTAL & ASSOCIATESChartered Accountants
N.K. MITTALProprietorMembership No. 46785F. No. 113281W
Place: MumbaiDate : 14th August, 2012
AUDITORS’ CERTIFICATE ON CORPORATE GOVERNANCE
17
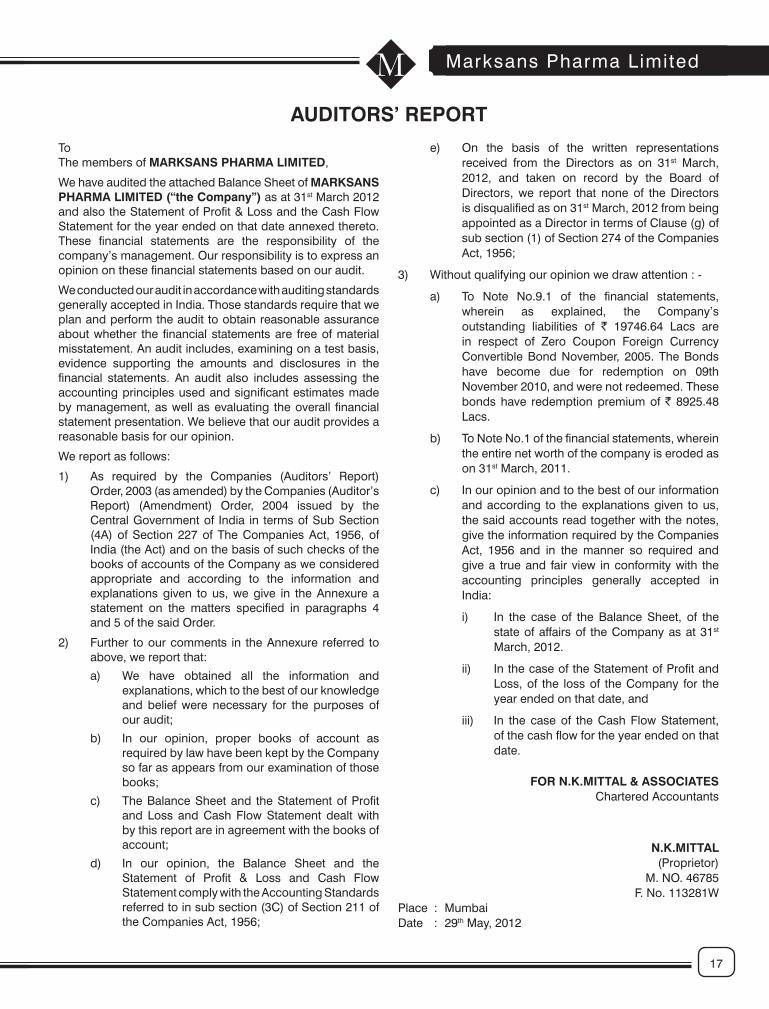
Marksans Pharma LimitedMAUDITORS’ REPORT
ToThe members of MARKSANS PHARMA LIMITED,
We have audited the attached Balance Sheet of MARKSANS PHARMA LIMITED (“the Company”) as at 31st March 2012 and also the Statement of Profit & Loss and the Cash Flow Statement for the year ended on that date annexed thereto. These financial statements are the responsibility of the company’s management. Our responsibility is to express an opinion on these financial statements based on our audit.
We conducted our audit in accordance with auditing standards generally accepted in India. Those standards require that we plan and perform the audit to obtain reasonable assurance about whether the financial statements are free of material misstatement. An audit includes, examining on a test basis, evidence supporting the amounts and disclosures in the financial statements. An audit also includes assessing the accounting principles used and significant estimates made by management, as well as evaluating the overall financial statement presentation. We believe that our audit provides a reasonable basis for our opinion.
We report as follows:
1) As required by the Companies (Auditors’ Report) Order, 2003 (as amended) by the Companies (Auditor’s Report) (Amendment) Order, 2004 issued by the Central Government of India in terms of Sub Section (4A) of Section 227 of The Companies Act, 1956, of India (the Act) and on the basis of such checks of the books of accounts of the Company as we considered appropriate and according to the information and explanations given to us, we give in the Annexure a statement on the matters specified in paragraphs 4 and 5 of the said Order.
2) Further to our comments in the Annexure referred to above, we report that:
a) We have obtained all the information and explanations, which to the best of our knowledge and belief were necessary for the purposes of our audit;
b) In our opinion, proper books of account as required by law have been kept by the Company so far as appears from our examination of those books;
c) The Balance Sheet and the Statement of Profit and Loss and Cash Flow Statement dealt with by this report are in agreement with the books of account;
d) In our opinion, the Balance Sheet and the Statement of Profit & Loss and Cash Flow Statement comply with the Accounting Standards referred to in sub section (3C) of Section 211 of the Companies Act, 1956;
e) On the basis of the written representations received from the Directors as on 31st March, 2012, and taken on record by the Board of Directors, we report that none of the Directors is disqualified as on 31st March, 2012 from being appointed as a Director in terms of Clause (g) of sub section (1) of Section 274 of the Companies Act, 1956;
3) Without qualifying our opinion we draw attention : -
a) To Note No.9.1 of the financial statements, wherein as explained, the Company’s outstanding liabilities of ` 19746.64 Lacs are in respect of Zero Coupon Foreign Currency Convertible Bond November, 2005. The Bonds have become due for redemption on 09th November 2010, and were not redeemed. These bonds have redemption premium of ` 8925.48 Lacs.
b) To Note No.1 of the financial statements, wherein the entire net worth of the company is eroded as on 31st March, 2011.
c) In our opinion and to the best of our information and according to the explanations given to us, the said accounts read together with the notes, give the information required by the Companies Act, 1956 and in the manner so required and give a true and fair view in conformity with the accounting principles generally accepted in India:
i) In the case of the Balance Sheet, of the state of affairs of the Company as at 31st March, 2012.
ii) In the case of the Statement of Profit and Loss, of the loss of the Company for the year ended on that date, and
iii) In the case of the Cash Flow Statement, of the cash flow for the year ended on that date.
FOR N.K.MITTAL & ASSOCIATESChartered Accountants
N.K.MITTAL(Proprietor)
M. NO. 46785F. No. 113281W
Place : Mumbai Date : 29th May, 2012
18
ANNUAL REPORT 2011-2012
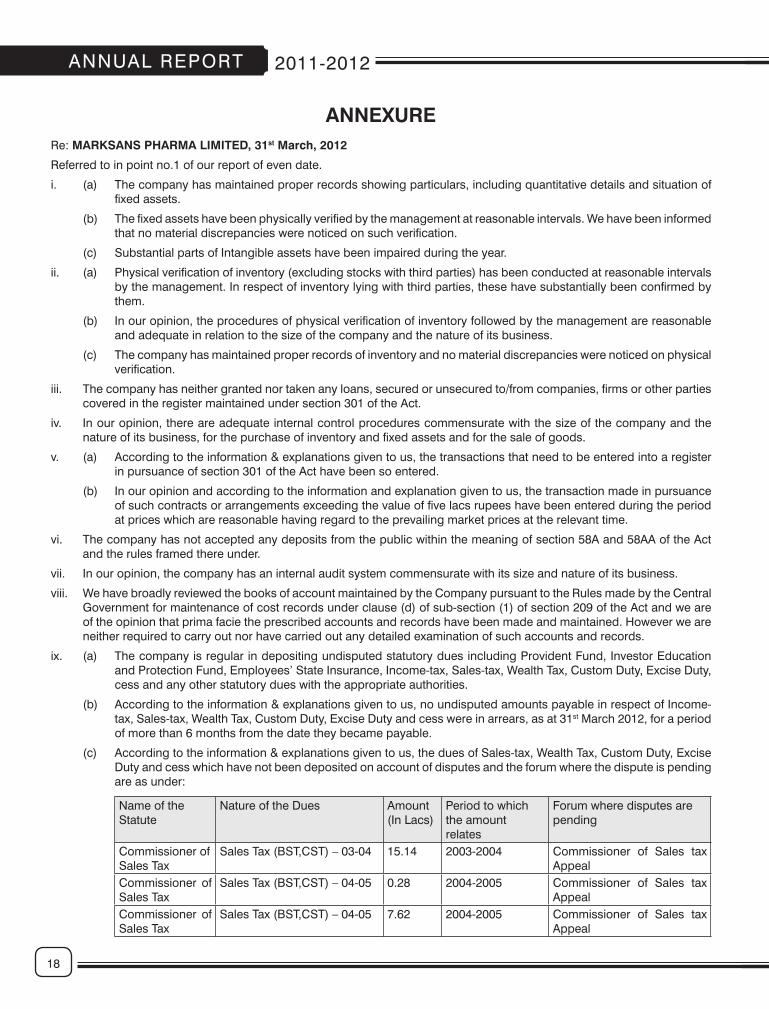
Re: MARKSANS PHARMA LIMITED, 31st March, 2012
Referred to in point no.1 of our report of even date.
i. (a) The company has maintained proper records showing particulars, including quantitative details and situation of fixed assets.
(b) The fixed assets have been physically verified by the management at reasonable intervals. We have been informed that no material discrepancies were noticed on such verification.
(c) Substantial parts of Intangible assets have been impaired during the year.
ii. (a) Physical verification of inventory (excluding stocks with third parties) has been conducted at reasonable intervals by the management. In respect of inventory lying with third parties, these have substantially been confirmed by them.
(b) In our opinion, the procedures of physical verification of inventory followed by the management are reasonable and adequate in relation to the size of the company and the nature of its business.
(c) The company has maintained proper records of inventory and no material discrepancies were noticed on physical verification.
iii. The company has neither granted nor taken any loans, secured or unsecured to/from companies, firms or other parties covered in the register maintained under section 301 of the Act.
iv. In our opinion, there are adequate internal control procedures commensurate with the size of the company and the nature of its business, for the purchase of inventory and fixed assets and for the sale of goods.
v. (a) According to the information & explanations given to us, the transactions that need to be entered into a register in pursuance of section 301 of the Act have been so entered.
(b) In our opinion and according to the information and explanation given to us, the transaction made in pursuance of such contracts or arrangements exceeding the value of five lacs rupees have been entered during the period at prices which are reasonable having regard to the prevailing market prices at the relevant time.
vi. The company has not accepted any deposits from the public within the meaning of section 58A and 58AA of the Act and the rules framed there under.
vii. In our opinion, the company has an internal audit system commensurate with its size and nature of its business.
viii. We have broadly reviewed the books of account maintained by the Company pursuant to the Rules made by the Central Government for maintenance of cost records under clause (d) of sub-section (1) of section 209 of the Act and we are of the opinion that prima facie the prescribed accounts and records have been made and maintained. However we are neither required to carry out nor have carried out any detailed examination of such accounts and records.
ix. (a) The company is regular in depositing undisputed statutory dues including Provident Fund, Investor Education and Protection Fund, Employees’ State Insurance, Income-tax, Sales-tax, Wealth Tax, Custom Duty, Excise Duty, cess and any other statutory dues with the appropriate authorities.
(b) According to the information & explanations given to us, no undisputed amounts payable in respect of Income-tax, Sales-tax, Wealth Tax, Custom Duty, Excise Duty and cess were in arrears, as at 31st March 2012, for a period of more than 6 months from the date they became payable.
(c) According to the information & explanations given to us, the dues of Sales-tax, Wealth Tax, Custom Duty, Excise Duty and cess which have not been deposited on account of disputes and the forum where the dispute is pending are as under:
Name of the Statute
Nature of the Dues Amount (In Lacs)
Period to which the amount relates
Forum where disputes are pending
Commissioner of Sales Tax
Sales Tax (BST,CST) – 03-04 15.14 2003-2004 Commissioner of Sales tax Appeal
Commissioner of Sales Tax
Sales Tax (BST,CST) – 04-05 0.28 2004-2005 Commissioner of Sales tax Appeal
Commissioner of Sales Tax
Sales Tax (BST,CST) – 04-05 7.62 2004-2005 Commissioner of Sales tax Appeal
ANNEXURE

19
Marksans Pharma LimitedMx. In our opinion and according to the information and explanation given to us , the accumulated losses of the company
are more than its net worth at the end of the financial year under report. The Company has incurred cash losses during the current financial year as well as in the previous financial year.
a) In our opinion and according to the information and explanation given to us, the Company’s outstanding liabilities of ` 19746.64 Lacs are in respect of Zero Coupon Foreign Currency Convertible Bonds November 2005. The Bonds have become due for redemption on 9th November 2010, and were not redeemed. These bonds have redemption premium of ` 8925.48 Lacs. The Company is in default in bond redemption.
b) In our opinion and according to the information and explanation given to us the entire net worth of the company is eroded as on 31st March, 2011.
xi. According to the information & explanations given to us, the company has not defaulted in payments of dues to financial institution & banks.
xii. The company has not granted any loans and advances on the basis of security by way of pledge of shares, debentures and other securities.
xiii. In our opinion, the Company is not a chit fund or a nidhi/mutual benefit fund/society. Therefore, the provisions of clause 4(xiii) of the Companies (Auditor’s Report) Order, 2003 are not applicable to the Company.
xiv. In our opinion, the Company is not dealing in or trading in shares, securities, debentures and other investments. Therefore, the provisions of clause 4(xiv) of the Companies (Auditor’s Report) Order, 2003 are not applicable to the Company.
xv. The company has given guarantee to Bank for loans taken by its Subsidiary Company.
xvi. Term loans availed by the Company were, prima facie, applied for the purpose for which the loans were obtained.
xvii. On an overall basis, the funds raised on short-term basis have, prima facie, not been used for long term investment and vice versa.
xviii. The Company has not made any preferential allotment of shares to parties and companies covered in the Register maintained under section 301 of the Act.
xix. The Company has not issued any debentures.
xx. The Company has not raised money by public issues during the year.
xxi. Based on the checks carried out by us, any fraud on or by the company has not been noticed or reported during the year.
FOR N.K.MITTAL & ASSOCIATESChartered Accountants
N.K.MITTAL(Proprietor)
M. NO. 46785F. No. 113281W
Place : Mumbai Date : 29th May, 2012

20
ANNUAL REPORT 2011-2012
Particulars Note No. 31 March 2012 31 March 2011
` `
I. EQUITY AND LIABILITIES
1 Shareholders’ funds
(a) Share capital 3 502,807,204 502,807,204
(b) Reserves and surplus 4 (2,395,158,165) (924,195,497)
(c) Money received against share warrants 11,565,500 -
2 Share application money pending allotment - -
3 Non-current liabilities
(a) Long-term borrowings 5 152,013,622 190,048,719
(b) Deferred tax liabilities (Net) 6 125,868,907 149,614,130
4 Current liabilities
(a) Short-term borrowings 7 771,834,262 843,329,994
(b) Trade payables 8 294,784,683 299,772,650
(c) Other current liabilities 9 2,944,348,797 2,985,057,112
(d) Short-term provisions 10 51,212,174 20,964,583
TOTAL 2,459,276,984 4,067,398,895
II. ASSETS
1 Non-current assets
(a) Fixed assets 11
(i) Tangible assets 489,555,263 478,115,606
(ii) Intangible assets 277,013,145 1,370,889,722
(b) Non-current investments 12 235,146,322 676,163,898
(c) Long-term loans and advances 13 39,509,260 37,008,735
2 Current assets
(a) Inventories 14 402,470,256 400,124,659
(b) Trade receivables 15 741,894,173 721,745,324
(c) Cash and cash equivalents 16 175,849,733 262,378,442
(d) Short-term loans and advances 17 97,838,832 120,841,713
(e) Other current assets - Miscellaneous expenditure - 130,796
TOTAL 2,459,276,984 4,067,398,895
Significant Accounting Policies and Notes on financial Statements 1 to 25
For and on Behalf of For and on behalf of the Board of DirectorsN. K. MITTAL & ASSOCIATESChartered Accountant
MARK SALDANHAChairman and Managing Director
DR. BALWANT S. DESAIWhole-Time Director
N.K.MITTALProprietorMembership No: 46785F. No.113281W
HARSHAVARDHAN PANIGRAHICompany Secretary & Legal Manager
Place : MumbaiDate : 29th May, 2012
Balance Sheet as at March 31, 2012

21
Marksans Pharma LimitedMStatement of Profit & Loss for the year ended as on March 31, 2012
Particulars Note No.
2011-12`
2010-11`
1 Revenue from operations 18 1,545,912,967 1,546,977,030 2 Other income 19 19,540,663 16,863,891 3 Total Revenue (1 + 2) 1,565,453,630 1,563,840,921 4 Expenses:
Cost of materials consumed 20 605,010,473 435,185,119 Purchases of Stock-in-Trade 169,258,274 637,643,951 Changes in inventories of finished goods, work-in-progress andStock-in-Trade
21 103,316,382 354,895
Employee benefits expense 22 135,488,913 113,768,011 Finance costs 23 490,876,486 392,278,525 Depreciation and amortization expense 24 179,812,395 146,438,693 Other expenses 25 1,710,590,389 1,163,511,208 Miscellaneous Expenditure Written Off 130,796 1,921,016 Total expenses 3,394,484,108 2,891,101,418
5 Profit/(Loss) before exceptional and extraordinary items and tax (3-4) (1,829,030,478) (1,327,260,497)6 Exceptional items - -7 Profit/(Loss) before extraordinary items and tax (5-6) (1,829,030,478) (1,327,260,497)8 Extraordinary Items - -9 Profit/(Loss) before tax (7-8) (1,829,030,478) (1,327,260,497)10 Tax expense:
(1) Current Year - - (2) Earlier year 5,376,680 13,849,293 (3) Deferred tax (23,745,223) 34,613,891 Total Tax Expenses (18,368,543) 48,463,184
11 Profit/(Loss) for the period from continuing operations (9-10) (1,810,661,935) (1,375,723,681)12 Profit/(loss) from discontinuing operations - (802,168,180)13 Tax expense of discontinuing operations - -14 Profit/(Loss) from Discontinuing operations (after tax) (12-13) - (802,168,180)15 Profit/(Loss) for the period (11+14) (1,810,661,935) (2,177,891,861)
16 Earnings per equity share:(1) Basic (4.92) (5.92)(2) Diluted (4.70) (5.92)Significant Accounting Policies and Notes on financial Statements 1 to 25
FOR AND ON BEHALF OF For and on behalf of the Board of DirectorsN. K. MITTAL & ASSOCIATESChartered Accountant
MARK SALDANHAChairman and Managing Director
DR. BALWANT S. DESAIWhole-Time Director
N.K.MITTALProprietorMembership No: 46785F. No.113281W
HARSHAVARDHAN PANIGRAHICompany Secretary & Legal Manager
Place : MumbaiDate : 29th May, 2012

22
ANNUAL REPORT 2011-2012
Notes to financial statements for the year ended 31 March 20121 Background
Marksans Pharma Limited (The Company) together with its subsidiaries and associates, operate as an integrated international pharmaceutical organisation with business encompassing the entire value change in and distribution of pharmaceutical products.
The company’s equity shares are listed for trading on the National Stock Exchange and the Bombay Stock Exchange in India.
As per the audited Balance Sheet as at 31st March, 2011, the Company’s Net Worth had been completely eroded.
Therefore, as required under Section 15 (1) of the Sick Industrial Companies (Special Provisions) Act, 1985, the company has made a reference to the Board for Industrial and Financial Reconstruction (BIFR) for measures to be determined with respect to the company. Accordingly, the company is registered with the BIFR.
2 SUMMARY OF SIGNIFICANT ACCOUNTING POLICIES
2.1 Accounting Standards
The Accounts have been prepared in compliance with the Accounting Standards referred to in Section 211(3C) of the Companies Act, 1956.
2.2 Basis of Accounting
The financials are prepared under the historical cost convention on an accrual basis and comply with the Accounting Standards issued by the Institute of Chartered Accountants of India referred to in Section 211(3C) of the Companies Act, 1956.
2.3 Fixed Assets
a Fixed assets are stated at cost along with costs directly attributable to bring the assets to their working condition as reduced by CENVAT credit and Input VAT.
b Intangibles:
� Internally Generated Intangible Assets – ANDA / Market Authorisations / Site Variation Licenses for CRAMS: ANDA / Market Authorisation / Site Variation Licenses for CRAMS costs represent expenses incurred on development of process / product and compliance with regulatory procedures of the US FDA and other Global Health Authorities in filing of Abbreviated New Drug Applications (“ANDA”), Market Authorisation/Site Variation Licenses for CRAMS and MHRA procedure for Market Authorisation / Site Variation Licenses.
This is in accordance with the requirements of Accounting Standard 26 of the Institute of Chartered Accountants of India. The Cost of each ANDA / MA / Site Variation Licenses for CRAMS is amortised to the extent of recovery of developmental costs as applicable as per terms of agreement or over a period of ten years from the date on which the product covered by ANDA / Market Authorisations / Site Variation licenses for CRAMS is Commercially marketed, whichever is earlier.
Product Development Costs:
� Product Development expenditure incurred on an individual project is carried forward when its future recoverability can reasonably be regarded as assured. Any expenditure carried forward is amortised over the period of expected future economic benefit from the related project, not exceeding ten years.
2.4 Depreciation
Depreciation on fixed assets other than leasehold land is provided on Straight Line Method at the rates and in the manner specified in Schedule XIV to the Companies Act, 1956 read with the relevant circulars issued by the Department of Company Affairs from time to time. Leasehold land is not amortised.
2.5 Impairment of Assets
The company identifies impairable assets at the year end in terms of cash generating unit concept based on para - 5 to 13 of AS-28 issued by ICAI for the purpose of arriving at impairment loss thereon being the difference between the book value and recoverable value of relevant assets. Impairment loss, if any, when crystallizes is charged against revenue of the year.

23
Marksans Pharma LimitedM 2.6 Expenditure during construction period
In case of new projects and substantial expansion of existing factories, expenditure incurred including financing costs prior to commencement of commercial production is capitalized. All pre-operative and trial run expenditure accumulated as Capital Work in Progress is allocated on a pro- rata basis depending on the prime cost of the assets.
2.7 Inventories
Inventories are valued at the lower of cost (net of CENVAT Credit and Input VAT) or Net Realisable Value as under:
Raw Materials, Packing Materials and Stores – At Weighted Average Cost on FIFO basis.
Work in Process - At Cost (Direct Cost plus Conversion Cost) upto estimated stage of completion.
By-Products - At Net Realisable Value.
Finished Goods - At Cost (Direct cost plus Conversion Cost and Excise Duty) or Net Realisable Value, whichever is lower.
2.8 Customs / Excise duty
Excise Duty on finished goods and Custom Duty on imported materials are accounted on production of packed finished goods / receipt of material in custom bonded warehouses. All the closing stock of finished goods lying at Goa factory is for export, hence provision for excise duty does not arise.
2.9 Foreign Currency Transaction
Purchase of imported raw materials, capital goods and components are accounted based on presentation memos from bank on the date of the transaction. In respect of liabilities on imports of raw materials, capital goods and components for which invoices / bills are not received, the liability is accounted based on the exchange rates prevailing on the date of the balance sheet.
Export Sales of finished goods are accounted on the basis of export invoices on the invoice date. In respect of the unrealised exports, the receivables are accounted based on the exchange rates prevailing on the date of the balance sheet.
2.10 Miscellaneous Expenditure
Expenditure on launch of new products and their sales promotion for domestic markets are being amortised over a period of 60 months.
2.11 Research and Development
Capital expenditure on research and development is capitalized as fixed assets. Other expenditure on R&D is expensed as incurred.
2.12 Investments
Long term investments are stated at cost less any provision for permanent diminution in the value. The current investments are valued at lower of cost or market value.
2.13 Employee Benefits
Liability for Gratuity is accounted on accrual basis. Annual contributions to Provident Fund & ESIC are accounted on accrual basis and charged to the Statement of Profit & Loss.
2.14 Revenue Recognition
The company recognizes sale of goods on the invoice date. Sales comprise of amounts invoiced for goods sold, including excise duty wherever applicable but net of returns and trade discounts.
Dividend Income is accounted when right to receive dividend is established.
CRAMS milestone revenues are recognised on signing of Agreement with respective parties.
2.15 Income Tax
Current Year:
Provision for current tax has been made in accordance with the Income Tax Laws prevailing for the relevant assessment years.
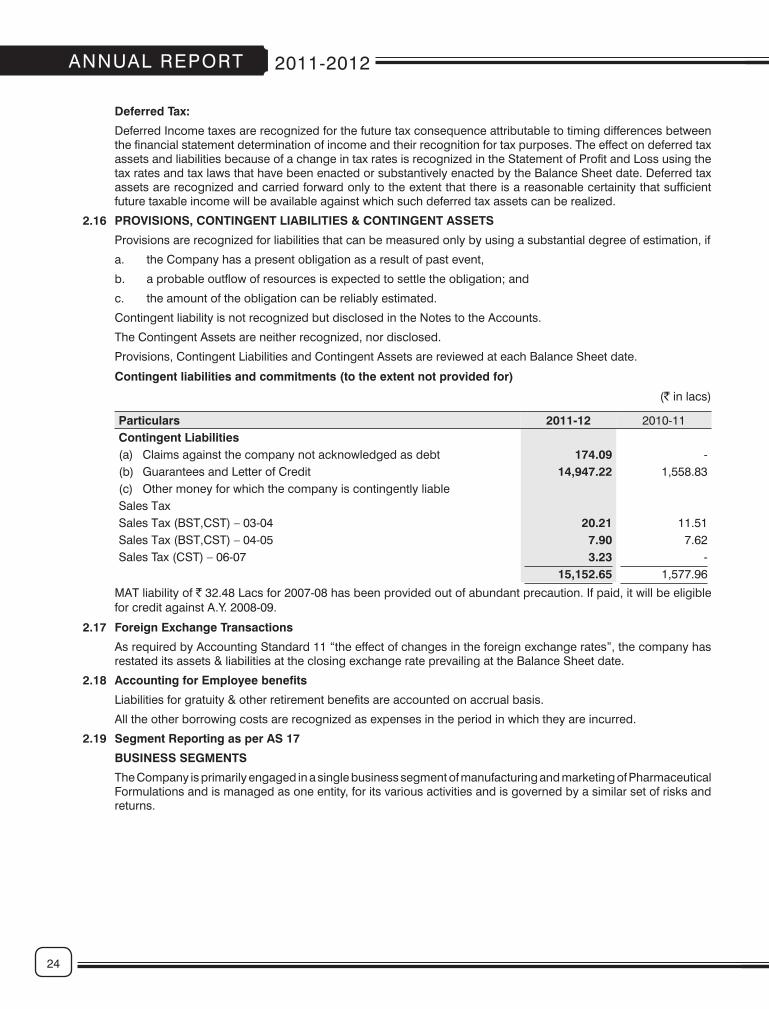
24
ANNUAL REPORT 2011-2012
Deferred Tax:
Deferred Income taxes are recognized for the future tax consequence attributable to timing differences between the financial statement determination of income and their recognition for tax purposes. The effect on deferred tax assets and liabilities because of a change in tax rates is recognized in the Statement of Profit and Loss using the tax rates and tax laws that have been enacted or substantively enacted by the Balance Sheet date. Deferred tax assets are recognized and carried forward only to the extent that there is a reasonable certainity that sufficient future taxable income will be available against which such deferred tax assets can be realized.
2.16 PROVISIONS, CONTINGENT LIABILITIES & CONTINGENT ASSETS
Provisions are recognized for liabilities that can be measured only by using a substantial degree of estimation, if
a. the Company has a present obligation as a result of past event,
b. a probable outflow of resources is expected to settle the obligation; and
c. the amount of the obligation can be reliably estimated.
Contingent liability is not recognized but disclosed in the Notes to the Accounts.
The Contingent Assets are neither recognized, nor disclosed.
Provisions, Contingent Liabilities and Contingent Assets are reviewed at each Balance Sheet date.
Contingent liabilities and commitments (to the extent not provided for)
(` in lacs)
Particulars 2011-12 2010-11 Contingent Liabilities(a) Claims against the company not acknowledged as debt 174.09 -(b) Guarantees and Letter of Credit 14,947.22 1,558.83(c) Other money for which the company is contingently liableSales TaxSales Tax (BST,CST) – 03-04 20.21 11.51Sales Tax (BST,CST) – 04-05 7.90 7.62Sales Tax (CST) – 06-07 3.23 -
15,152.65 1,577.96
MAT liability of ` 32.48 Lacs for 2007-08 has been provided out of abundant precaution. If paid, it will be eligible for credit against A.Y. 2008-09.
2.17 Foreign Exchange Transactions
As required by Accounting Standard 11 “the effect of changes in the foreign exchange rates”, the company has restated its assets & liabilities at the closing exchange rate prevailing at the Balance Sheet date.
2.18 Accounting for Employee benefits
Liabilities for gratuity & other retirement benefits are accounted on accrual basis.
All the other borrowing costs are recognized as expenses in the period in which they are incurred.
2.19 Segment Reporting as per AS 17
BUSINESS SEGMENTS
The Company is primarily engaged in a single business segment of manufacturing and marketing of Pharmaceutical Formulations and is managed as one entity, for its various activities and is governed by a similar set of risks and returns.
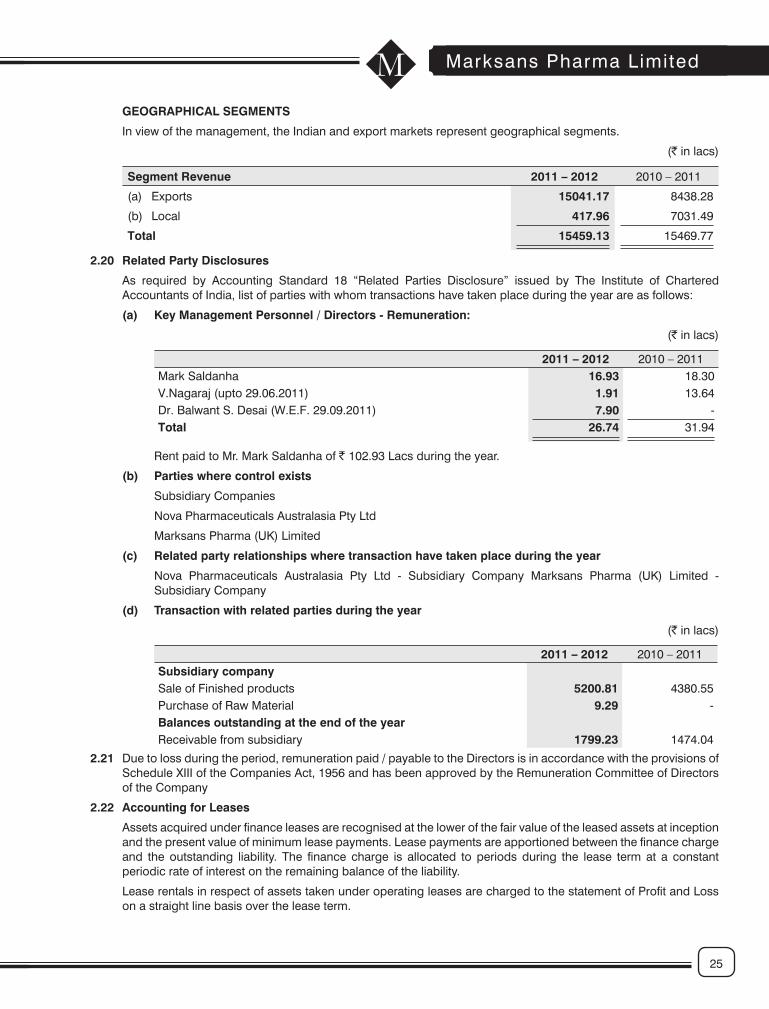
25
Marksans Pharma LimitedM GEOGRAPHICAL SEGMENTS
In view of the management, the Indian and export markets represent geographical segments.
(` in lacs)
Segment Revenue 2011 – 2012 2010 – 2011
(a) Exports 15041.17 8438.28
(b) Local 417.96 7031.49
Total 15459.13 15469.77
2.20 Related Party Disclosures
As required by Accounting Standard 18 “Related Parties Disclosure” issued by The Institute of Chartered Accountants of India, list of parties with whom transactions have taken place during the year are as follows:
(a) Key Management Personnel / Directors - Remuneration:
(` in lacs)
2011 – 2012 2010 – 2011Mark Saldanha 16.93 18.30V.Nagaraj (upto 29.06.2011) 1.91 13.64Dr. Balwant S. Desai (W.E.F. 29.09.2011) 7.90 -Total 26.74 31.94
Rent paid to Mr. Mark Saldanha of ` 102.93 Lacs during the year.
(b) Parties where control exists
Subsidiary Companies
Nova Pharmaceuticals Australasia Pty Ltd
Marksans Pharma (UK) Limited
(c) Related party relationships where transaction have taken place during the year
Nova Pharmaceuticals Australasia Pty Ltd - Subsidiary Company Marksans Pharma (UK) Limited - Subsidiary Company
(d) Transaction with related parties during the year
(` in lacs)
2011 – 2012 2010 – 2011Subsidiary companySale of Finished products 5200.81 4380.55Purchase of Raw Material 9.29 -Balances outstanding at the end of the yearReceivable from subsidiary 1799.23 1474.04
2.21 Due to loss during the period, remuneration paid / payable to the Directors is in accordance with the provisions of Schedule XIII of the Companies Act, 1956 and has been approved by the Remuneration Committee of Directors of the Company
2.22 Accounting for Leases
Assets acquired under finance leases are recognised at the lower of the fair value of the leased assets at inception and the present value of minimum lease payments. Lease payments are apportioned between the finance charge and the outstanding liability. The finance charge is allocated to periods during the lease term at a constant periodic rate of interest on the remaining balance of the liability.
Lease rentals in respect of assets taken under operating leases are charged to the statement of Profit and Loss on a straight line basis over the lease term.
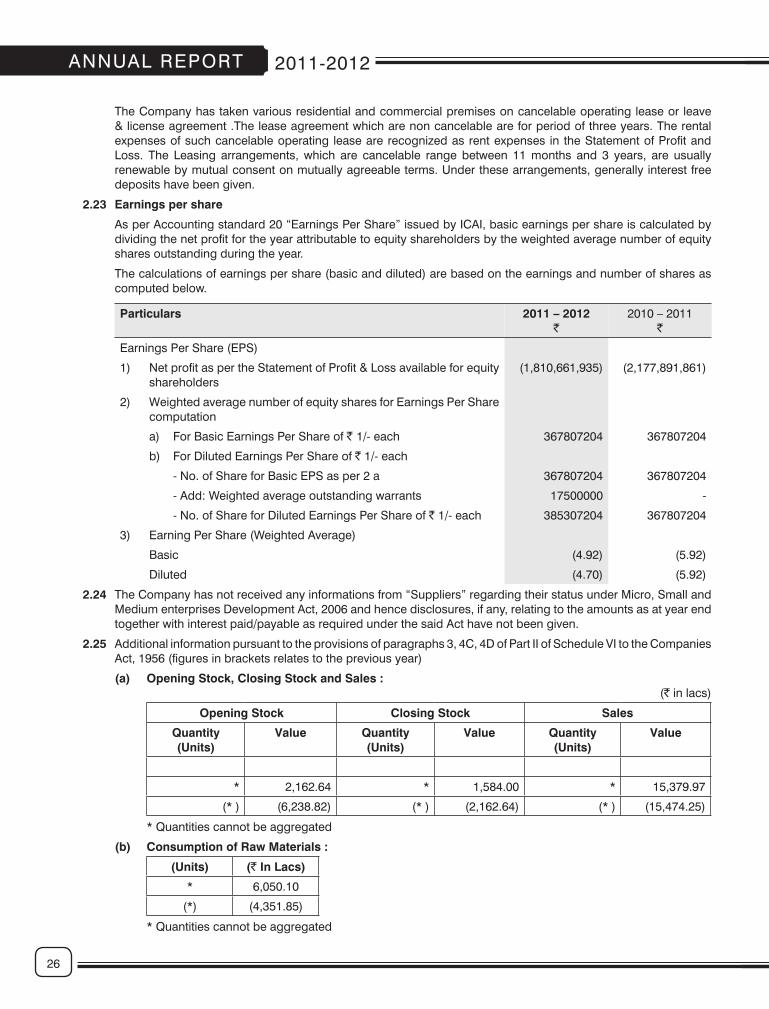
26
ANNUAL REPORT 2011-2012
The Company has taken various residential and commercial premises on cancelable operating lease or leave & license agreement .The lease agreement which are non cancelable are for period of three years. The rental expenses of such cancelable operating lease are recognized as rent expenses in the Statement of Profit and Loss. The Leasing arrangements, which are cancelable range between 11 months and 3 years, are usually renewable by mutual consent on mutually agreeable terms. Under these arrangements, generally interest free deposits have been given.
2.23 Earnings per share
As per Accounting standard 20 “Earnings Per Share” issued by ICAI, basic earnings per share is calculated by dividing the net profit for the year attributable to equity shareholders by the weighted average number of equity shares outstanding during the year.
The calculations of earnings per share (basic and diluted) are based on the earnings and number of shares as computed below.
Particulars 2011 – 2012`
2010 – 2011`
Earnings Per Share (EPS)
1) Net profit as per the Statement of Profit & Loss available for equity shareholders
(1,810,661,935) (2,177,891,861)
2) Weighted average number of equity shares for Earnings Per Share computation
a) For Basic Earnings Per Share of ` 1/- each 367807204 367807204
b) For Diluted Earnings Per Share of ` 1/- each
- No. of Share for Basic EPS as per 2 a 367807204 367807204
- Add: Weighted average outstanding warrants 17500000 -
- No. of Share for Diluted Earnings Per Share of ` 1/- each 385307204 367807204
3) Earning Per Share (Weighted Average)
Basic (4.92) (5.92)
Diluted (4.70) (5.92)
2.24 The Company has not received any informations from “Suppliers” regarding their status under Micro, Small and Medium enterprises Development Act, 2006 and hence disclosures, if any, relating to the amounts as at year end together with interest paid/payable as required under the said Act have not been given.
2.25 Additional information pursuant to the provisions of paragraphs 3, 4C, 4D of Part II of Schedule VI to the Companies Act, 1956 (figures in brackets relates to the previous year)
(a) Opening Stock, Closing Stock and Sales :(` in lacs)
Opening Stock Closing Stock Sales
Quantity (Units)
Value Quantity (Units)
Value Quantity (Units)
Value
* 2,162.64 * 1,584.00 * 15,379.97
(* ) (6,238.82) (* ) (2,162.64) (* ) (15,474.25)
* Quantities cannot be aggregated
(b) Consumption of Raw Materials :
(Units) (` In Lacs)
* 6,050.10
(*) (4,351.85)
* Quantities cannot be aggregated
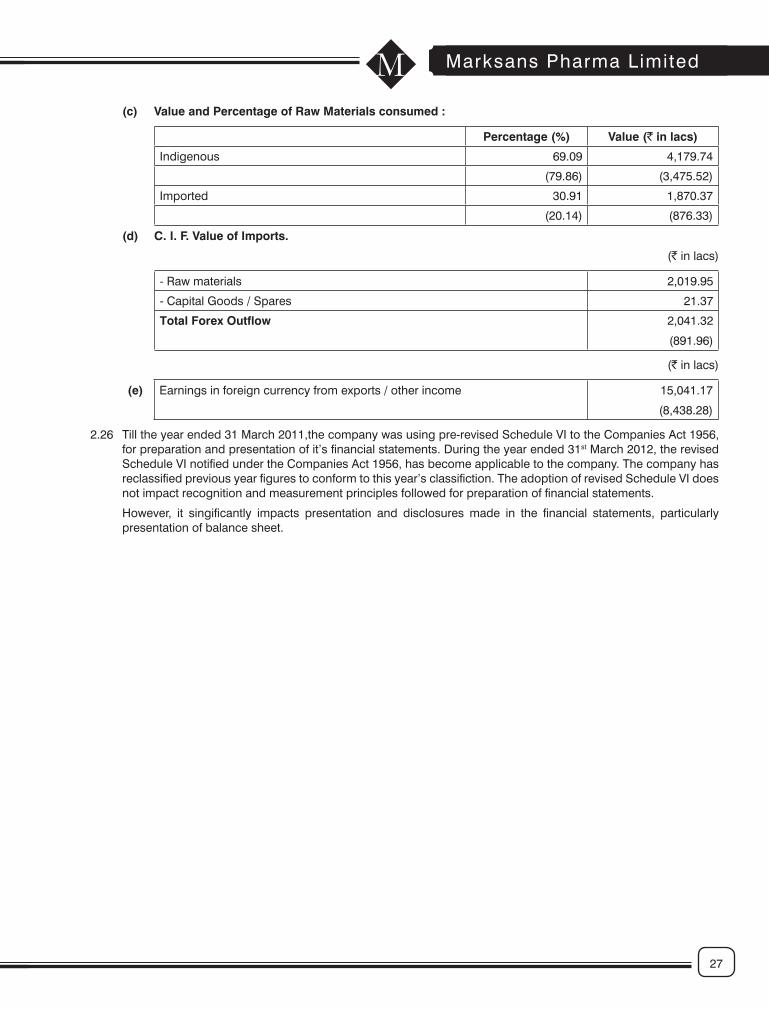
27
Marksans Pharma LimitedM (c) Value and Percentage of Raw Materials consumed :
Percentage (%) Value (` in lacs)
Indigenous 69.09 4,179.74
(79.86) (3,475.52)
Imported 30.91 1,870.37
(20.14) (876.33)
(d) C. I. F. Value of Imports.
(` in lacs)
- Raw materials 2,019.95
- Capital Goods / Spares 21.37
Total Forex Outflow 2,041.32
(891.96)
(` in lacs)
(e) Earnings in foreign currency from exports / other income 15,041.17
(8,438.28)
2.26 Till the year ended 31 March 2011,the company was using pre-revised Schedule VI to the Companies Act 1956, for preparation and presentation of it’s financial statements. During the year ended 31st March 2012, the revised Schedule VI notified under the Companies Act 1956, has become applicable to the company. The company has reclassified previous year figures to conform to this year’s classifiction. The adoption of revised Schedule VI does not impact recognition and measurement principles followed for preparation of financial statements.
However, it singificantly impacts presentation and disclosures made in the financial statements, particularly presentation of balance sheet.
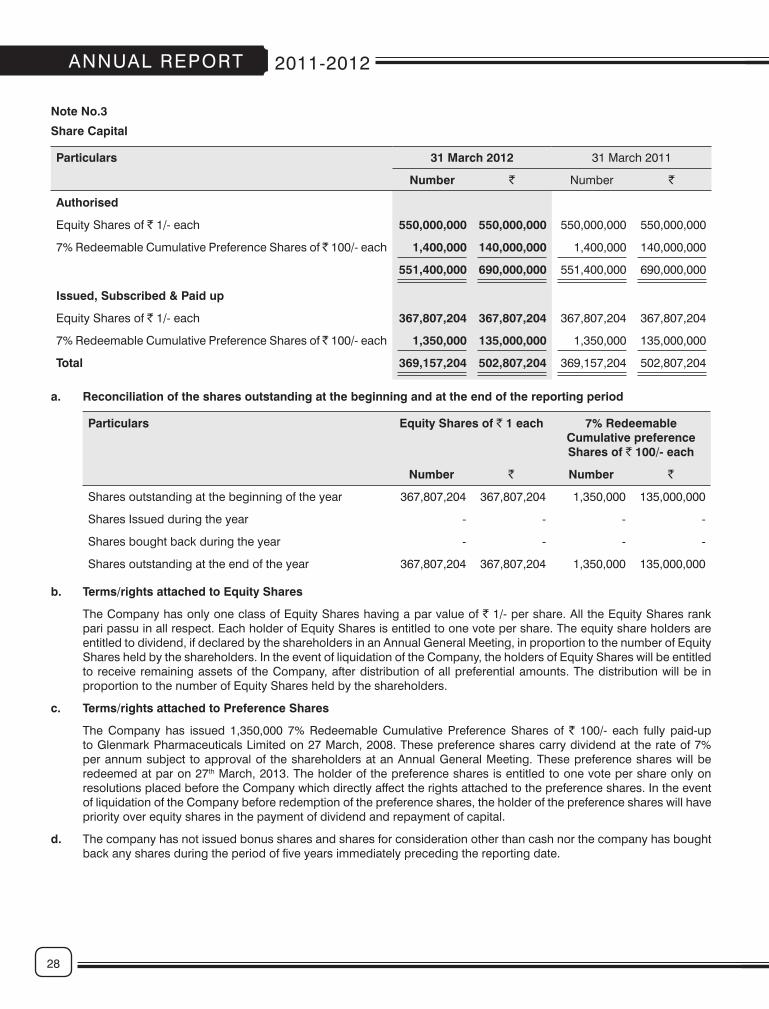
28
ANNUAL REPORT 2011-2012
Note No.3
Share Capital
Particulars 31 March 2012 31 March 2011
Number ` Number `
Authorised
Equity Shares of ` 1/- each 550,000,000 550,000,000 550,000,000 550,000,000
7% Redeemable Cumulative Preference Shares of ̀ 100/- each 1,400,000 140,000,000 1,400,000 140,000,000
551,400,000 690,000,000 551,400,000 690,000,000
Issued, Subscribed & Paid up
Equity Shares of ` 1/- each 367,807,204 367,807,204 367,807,204 367,807,204
7% Redeemable Cumulative Preference Shares of ̀ 100/- each 1,350,000 135,000,000 1,350,000 135,000,000
Total 369,157,204 502,807,204 369,157,204 502,807,204
a. Reconciliation of the shares outstanding at the beginning and at the end of the reporting period
Particulars Equity Shares of ` 1 each 7% Redeemable Cumulative preference Shares of ` 100/- each
Number ` Number `
Shares outstanding at the beginning of the year 367,807,204 367,807,204 1,350,000 135,000,000
Shares Issued during the year - - - -
Shares bought back during the year - - - -
Shares outstanding at the end of the year 367,807,204 367,807,204 1,350,000 135,000,000
b. Terms/rights attached to Equity Shares
The Company has only one class of Equity Shares having a par value of ` 1/- per share. All the Equity Shares rank pari passu in all respect. Each holder of Equity Shares is entitled to one vote per share. The equity share holders are entitled to dividend, if declared by the shareholders in an Annual General Meeting, in proportion to the number of Equity Shares held by the shareholders. In the event of liquidation of the Company, the holders of Equity Shares will be entitled to receive remaining assets of the Company, after distribution of all preferential amounts. The distribution will be in proportion to the number of Equity Shares held by the shareholders.
c. Terms/rights attached to Preference Shares
The Company has issued 1,350,000 7% Redeemable Cumulative Preference Shares of ` 100/- each fully paid-up to Glenmark Pharmaceuticals Limited on 27 March, 2008. These preference shares carry dividend at the rate of 7% per annum subject to approval of the shareholders at an Annual General Meeting. These preference shares will be redeemed at par on 27th March, 2013. The holder of the preference shares is entitled to one vote per share only on resolutions placed before the Company which directly affect the rights attached to the preference shares. In the event of liquidation of the Company before redemption of the preference shares, the holder of the preference shares will have priority over equity shares in the payment of dividend and repayment of capital.
d. The company has not issued bonus shares and shares for consideration other than cash nor the company has bought back any shares during the period of five years immediately preceding the reporting date.

29
Marksans Pharma LimitedMe. Details of shareholders holding more than 5% shares in the Company
Name of Shareholder 31 March 2012 31 March 2011
No. of Shares held
% of Holding
No. of Shares held
% of Holding
Equity Shares of ` 1/- each fully paid
Mr. Mark Saldanha 177,982,910 48.39 177,982,910 48.39
7% Redeemable Cumulative Preference Shares of ` 100/- each fully paid
Glenmark Pharmaceuticals Limited 1,350,000 100 1,350,000 100
f. Pursuant to the special Resolution passed by the share holders at the Annual General Meeting held on 29th September, 2011, the Board of Directors of the company at its meeting held on 25th October, 2011 allotted 17,500,000 warrants to Mr. Mark Saldanha, Promoter of the company at a price of ` 2.56 per warrant on preferential basis and received ` 11,565,500 being 25.81% upfront price. Mr. Mark Saldanha is entitled to apply for allotment of one fully paid up equity share of ` 1/- each against each warrant at any time after the date of allotment but on or before expiry of 18 months from the date of allotment.
Note No.4
Reserves & Surplus
Particulars 31 March 2012 31 March 2011
` `
a. Capital Reserves 122,500 122,500
Closing Balance 122,500 122,500
b. Securities Premium Account
Opening Balance 435,588,795 435,545,217
Add : Securities premium credited on Share issue - 43,578
Closing Balance 435,588,795 435,588,795
c. General Reserve
Opening Balance 167,411,324 167,411,324
(+) Current Year Transfer 339,699,267 -
(-) Written Back in Current Year
Closing Balance 507,110,591 167,411,324
d. Surplus
Opening balance (1,527,318,116) 650,573,745
(+) Net Profit/(Net Loss) For the current year (1,810,661,935) (2,177,891,861)
Closing Balance (3,337,980,051) (1,527,318,116)
Total (2,395,158,165) (924,195,497)

30
ANNUAL REPORT 2011-2012
Particulars 31 March 2012 31 March 2011
` `
Note No. 5
Long Term Borrowings
Secured
a. Term loans
from banks 151,452,705 189,693,354
b. Vehicle Loan 560,917 355,365
Total 152,013,622 190,048,719
Note No. 5.1
The term loan is secured by a charge on the plants and machineries of Goa plants. There are no overdue repayment of the term loan. Maturity profile of Term Loan are as set out below.
2 years 2-3 years 3-4 years Beyond 4 years
Term Loan from Bank (`) 73,925,629 26,614,430 19,849,644 31,623,919
Note No. 6
Deferred tax liabilities (Net)
Depreciation 147,609,602 171,153,814
Provision for excise duty 569,696 569,696
Preliminary expenses written off (230,838) (190,422)
FCCB issue cost (20,503,539) (20,503,539)
Provision for gratuity (1,576,014) (1,415,419)
Total 125,868,907 149,614,130
Note No. 7
Short Term Borrowings
Secured
Working Capital facilities from Bank 771,834,262 843,329,994
Total 771,834,262 843,329,994
Note No. 7.1
Working capital facilities are secured by Hypothecation of stock of raw material, packing material, finished goods, work-in-progress, receivables and equitable mortgage on fixed assets of manufacturing facility of Goa plants, present and future.
Note No. 8
Trade Payable
a) Total outstanding dues to Micro and Small enterprises* - -
b) Total outstanding dues to other than Micro and Small enterprises 294,784,683 299,772,650
Total 294,784,683 299,772,650
* Refer Note No. 2.24 on outstanding dues from micro & small enterprises.

31
Marksans Pharma LimitedMParticulars 31 March 2012 31 March 2011
` `
Note No. 9
Other Current Liabilities
a. Current maturities of Term Loan 76,909,183 83,828,459
b. Current maturities of Vehicle Loan 228,019 360,349
c. Foreign Currency Convertible Bonds* 2,867,211,595 2,896,718,304
d. Deposits - 4,150,000
Total 2,944,348,797 2,985,057,112
*Note No. 9.1 Foreign Currency Convertible Bonds
The current outstanding of principal value of Foreign Currency Convertible Bonds of ` 19746.64 Lacs have become due for redemption on 9th November, 2010 and were not redeemed. These Bonds have redemption premium of ` 8925.48 Lacs. Further, due to the redemption default, there will be a default interest payable at 8% p.a. from the due date of redemption which has not yet been provided.
Note No. 10
Short Term Provisions
a. Provision for Gratuity and compensated absences
Gratuity 3,626,106 3,106,380
Compensated absences 14,599,483 12,917,658
b. Others 32,986,585 4,940,545
Total 51,212,174 20,964,583

32
ANNUAL REPORT 2011-2012N
ote
No
. 11
Fixe
d As
sets
Gro
ss B
lock
Accu
mul
ated
Dep
reci
atio
nNe
t Blo
ck
Bala
nce
as a
t 1
April
201
1Ad
ditio
ns/
Disp
osal
sIm
pairm
ents
Bala
nce
as
at 3
1 M
arch
20
12
Bala
nce
as a
t 1
April
201
1De
prec
iatio
n ch
arge
for t
he
year
On
disp
osal
sBa
lanc
e as
at
31
Mar
ch
2012
Bala
nce
as
at 3
1 M
arch
20
12
Bala
nce
as a
t 31
Mar
ch 2
011
``
``
``
``
``
`
a Ta
ngib
le A
sset
s
La
nd9,
665,
840
- -
- 9,
665,
840
- -
- -
9,66
5,84
09,
665,
840
Bu
ildin
gs17
7,02
5,26
135
,190
- -
177,
060,
451
45,7
15,3
305,
913,
646
- 51
,628
,976
125,
431,
475
131,
309,
931
Pl
ant a
nd E
quip
men
t43
5,60
9,66
345
,627
,749
1,05
3,67
6 -
480,
183,
736
120,
545,
204
21,7
81,0
59 -
142,
326,
263
337,
857,
473
315,
064,
459
Fu
rnitu
re a
nd F
ixtur
es7,
919,
303
122,
778
- -
8,04
2,08
12,
491,
015
505,
522
- 2,
996,
537
5,04
5,54
45,
428,
288
Ve
hicl
es9,
747,
299
996,
663
2,02
2,58
9 -
8,72
1,37
34,
667,
498
1,02
2,83
491
2,54
84,
777,
784
3,94
3,58
95,
079,
801
O
ffice
equ
ipm
ent
4,12
0,59
044
,196
- -
4,16
4,78
61,
825,
008
261,
643
- 2,
086,
651
2,07
8,13
52,
295,
582
Co
mpu
ter a
nd S
oftw
are
25,5
92,2
9243
9,45
6 -
- 26
,031
,748
16,3
20,5
874,
177,
954
- 20
,498
,541
5,53
3,20
79,
271,
705
To
tal
669,
680,
248
47,2
66,0
323,
076,
265
- 71
3,87
0,01
519
1,56
4,64
233
,662
,658
912,
548
224,
314,
752
489,
555,
263
478,
115,
606
b In
tang
ible
Ass
ets
In
tern
ally
Gen
erat
ed
ANDA
, M
arke
t Aut
horis
atio
ns, P
rodu
ct
Lice
nces
& O
ther
s
1,46
1,51
3,72
2-
-94
7,72
6,84
051
3,78
6,88
290
,624
,000
146,
149,
737
-23
6,77
3,73
727
7,01
3,14
51,
370,
889,
722
To
tal
1,46
1,51
3,72
2-
-94
7,72
6,84
051
3,78
6,88
290
,624
,000
146,
149,
737
-23
6,77
3,73
727
7,01
3,14
51,
370,
889,
722
To
tal (
a+b)
2,13
1,19
3,97
047
,266
,032
3,07
6,26
594
7,72
6,84
01,
227,
656,
897
282,
188,
642
179,
812,
395
912,
548
461,
088,
489
766,
568,
408
1,84
9,00
5,32
8
Pr
evio
us ye
ar fi
gure
3,59
8,23
3,54
811
1,69
4,15
91,
578,
733,
737
- 2,131,193,970
656,
809,
717
146,
438,
693
521,
059,
768
282,188,642
1,849,005,328
2,94
1,42
3,83
1
No
te N
o.1
1.1
Land
hel
d on
leas
ehol
d ba
sis.
Bui
ldin
g in
clud
es th
ose
cons
truc
ted
on le
aseh
old
land
.
The
com
pany
has
inte
rnal
ly g
ener
ated
inta
ngib
le a
sset
s in
the
natu
re o
f AN
DA
/Mar
ket A
utho
risat
ion/
Site
Var
iatio
n Li
cens
es fo
r CR
AM
S. T
he e
xpen
ses
incu
rred
on
dev
elop
men
t of p
roce
ss/p
rodu
ct a
nd c
ompl
ianc
e w
ith r
egul
ator
y pr
oced
ures
of U
S F
DA
and
oth
er g
loba
l hea
lth a
utho
ritie
s in
filin
g of
Abb
revi
ated
New
D
rug
App
licat
ion
(AN
DA
), M
arke
t Aut
horis
atio
n/S
ite V
aria
tion
Lice
nses
for C
RA
MS
and
MH
RA
pro
cedu
re fo
r Mar
ket A
utho
risat
ion/
Site
Var
iatio
n Li
cens
es a
re
capi
talis
ed a
nd id
entif
ied
as in
tang
ible
ass
ets
in a
ccor
danc
e w
ith A
S -
26 (
Inta
ngib
le A
sset
s). S
ome
of th
ese
inta
ngib
le a
sset
s ar
e ou
t lic
ense
d to
ove
rsea
s pa
rtie
s gi
ving
them
exc
lusi
ve/s
emi e
xclu
sive
rig
hts
to m
arke
t the
com
pany
’s p
rodu
cts
in th
e in
tern
atio
nal m
arke
ts.
The
Com
pany
has
car
ried
out a
n as
sess
men
t on
the
impa
irmen
t of t
he in
tang
ible
ass
ets
in a
ccor
danc
e w
ith A
S -
28
( Im
pairm
ent o
f Ass
ets)
. Acc
ordi
ngly
, th
e ca
rryi
ng v
alue
of t
he In
tang
ible
Ass
ets
have
bee
n re
duce
d to
thei
r re
cove
rabl
e am
ount
in th
e B
alan
ce
She
et a
s on
31
Mar
ch 2
012
and
the
amou
nt o
f su
ch im
pairm
ent l
oss
has
been
cha
rged
to th
e S
tate
men
t of P
rofit
and
Los
s in
acc
orda
nce
with
AS
- 28
. The
rec
over
able
am
ount
is a
s pe
r th
e bi
ndin
g ou
t lic
ensi
ng/d
istr
ibut
ion
agre
emen
ts fo
r th
e re
spec
tive
prod
ucts
.
In s
ome
case
s of
Site
Var
iatio
n Li
cens
es fo
r CR
AM
S, t
he C
ompa
ny h
as e
ither
term
inat
ed th
e ag
reem
ent a
nd/o
r sto
pped
man
ufac
turin
g an
d su
pply
ing
of th
e pr
oduc
ts. T
he r
elat
ive
capi
talis
ed d
evel
opm
ent c
ost h
as b
een
writ
ten
off a
nd c
harg
ed to
the
Sta
tem
ent o
f P
rofit
and
Los
s du
ring
the
finan
cial
yea
r en
ded
31 M
arch
, 201
2.

33
Marksans Pharma LimitedMParticulars 31 March 2012 31 March 2011
` `Note No. 12Non-current investmentsTrade InvestmentsInvestment in subsidiaries(Unquoted) 235,146,322 676,163,898 Total 235,146,322 676,163,898
Note No.12.1
The Company, in the year 2008, acquired two UK based companies Bell, Sons and Co (Druggists) Limited and Relonchem Limited through its 100% subsidiary, Marksans Pharma (UK) Limited. The company has made an investment of ` 68.78 Crores to part finance above acquisitions.However, Relonchem Limited has been incurring losses and Bell, Sons and Co (Druggists) Limited has failed to meet the expectations. Therefore, the Management has carried out an analysis of the value of investment in subsidiaries. The analysis is based on financial projections and market valuation of the peer companies operating in the similar area of operation. This analysis indicated a diminution in the realisable value of investment in the subsidiaries. Accordingly, the carrying value of the investment in subsidiaries has been reduced in the Balance Sheet as on 31 March, 2012 and the amount of the diminution of ` 4686 Lacs has been charged to the Statement of Profit and Loss for the year ended 31 March, 2012 in accordance with AS - 13 (Accounting for Investments).
Note No.12.2
Investement in Equity Instruments
Name of the Body Corporate Nova Pharmaceuticals Australasia Pty Ltd.
Investment in Marksans Pharma (UK) LTD.
Subsidiary / Associate / JV/ Controlled Entity / Others
Subsidiary Subsidiary
31 March 2012 31 March 2011 31 March 2012 31 March 2011
No. of Shares 90 90 1000 1000
Quoted / Unquoted Unquoted Unquoted Unquoted Unquoted
Partly Paid / Fully paid Fully Paid Fully Paid Fully Paid Fully Paid
Extent of Holding (%) 60% 60% 100% 100%
Amount (`) 15,905,003 15,905,003 219,241,319 660,258,895
“Whether stated at Cost Yes / No” Yes Yes No Yes
“If Answer to Column (9) is ‘No’ - Basis of Valuation”
N.A. N.A. Diminution as per AS-13
N.A.
Note No. 13
Particulars 31 March 2012 31 March 2011` `
Long Term Loans and Advances
a. Security Deposits
Unsecured, considered good 11,885,309 14,847,159
11,885,309 14,847,159
b. Other loans and advances
Unsecured, considered good
Balances with statutory/government authorities 27,623,951 22,161,576
27,623,951 22,161,576
Total 39,509,260 37,008,735

34
ANNUAL REPORT 2011-2012
Particulars 31 March 2012 31 March 2011` `
Note No. 14
Inventories
a. Raw Materials and Packing Materials 206,647,868 100,985,889
b. Work-in-progress 37,422,233 82,873,910
c. Finished goods 130,721,233 185,880,468
d. Stock-in-trade 27,678,922 30,384,392
Total 402,470,256 400,124,659
Note No. 15
Trade Receivables
Trade receivables outstanding for a period less than six months from the date they are due for payment
Unsecured, considered good 741,894,173 721,745,324
Total 741,894,173 721,745,324
Note No. 16
Cash and cash equivalents
a. Balances with banks 6,208,586 15,246,266
b. Cash on hand 88,668 245,272
c. Bank deposits with Less than 12 months maturity 167,362,155 243,824,346
d. Margin Money 2,190,324 3,062,558
Total 175,849,733 262,378,442
Note No. 17
Short-term loans and advances
a. Advance recoverable in cash or kind
Unsecured, considered good 97,838,832 120,841,713
Total 97,838,832 120,841,713
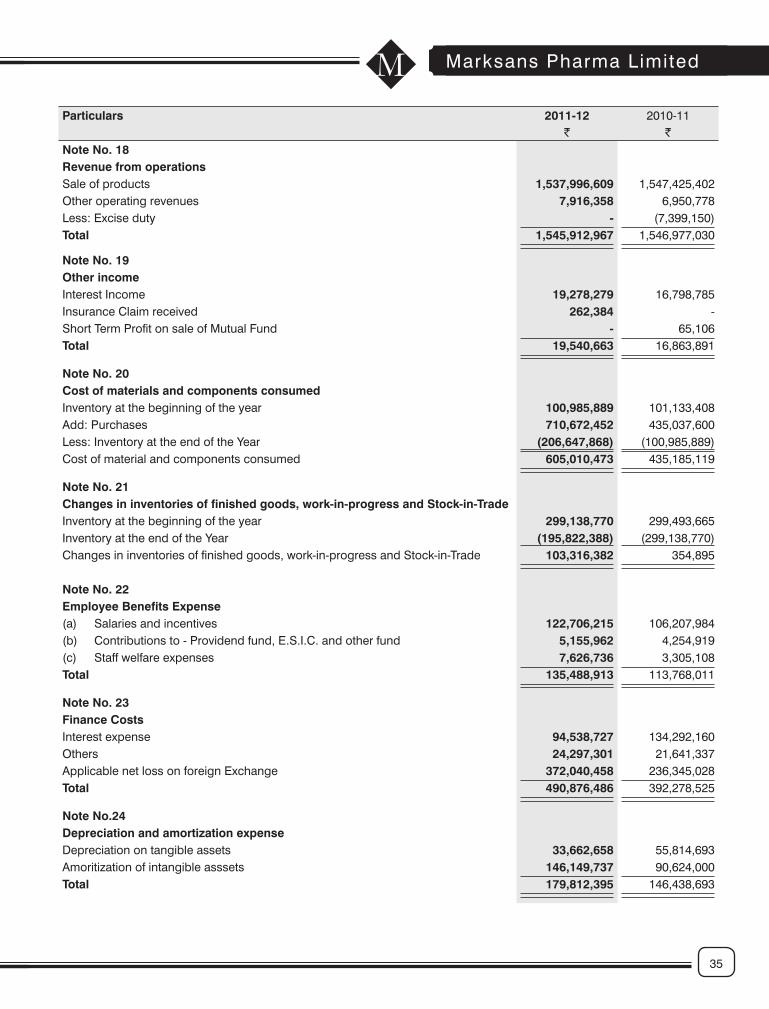
35
Marksans Pharma LimitedMParticulars 2011-12 2010-11
` `Note No. 18Revenue from operationsSale of products 1,537,996,609 1,547,425,402 Other operating revenues 7,916,358 6,950,778 Less: Excise duty - (7,399,150)Total 1,545,912,967 1,546,977,030
Note No. 19Other incomeInterest Income 19,278,279 16,798,785 Insurance Claim received 262,384 -Short Term Profit on sale of Mutual Fund - 65,106 Total 19,540,663 16,863,891
Note No. 20Cost of materials and components consumedInventory at the beginning of the year 100,985,889 101,133,408 Add: Purchases 710,672,452 435,037,600 Less: Inventory at the end of the Year (206,647,868) (100,985,889)Cost of material and components consumed 605,010,473 435,185,119
Note No. 21Changes in inventories of finished goods, work-in-progress and Stock-in-TradeInventory at the beginning of the year 299,138,770 299,493,665 Inventory at the end of the Year (195,822,388) (299,138,770)Changes in inventories of finished goods, work-in-progress and Stock-in-Trade 103,316,382 354,895
Note No. 22Employee Benefits Expense(a) Salaries and incentives 122,706,215 106,207,984 (b) Contributions to - Providend fund, E.S.I.C. and other fund 5,155,962 4,254,919 (c) Staff welfare expenses 7,626,736 3,305,108 Total 135,488,913 113,768,011
Note No. 23Finance CostsInterest expense 94,538,727 134,292,160 Others 24,297,301 21,641,337 Applicable net loss on foreign Exchange 372,040,458 236,345,028 Total 490,876,486 392,278,525
Note No.24Depreciation and amortization expenseDepreciation on tangible assets 33,662,658 55,814,693 Amoritization of intangible asssets 146,149,737 90,624,000 Total 179,812,395 146,438,693

36
ANNUAL REPORT 2011-2012
Particulars 2011-12 2010-11` `
Note No. 25Other ExpensesWater Charges 1,804,264 2,493,816 Power & Fuel 36,562,035 36,921,447 Freight Inward & Raw Material Clearing Charges 10,971,936 9,183,092 Reapairs & Maintenance of Production Facility (plant) 15,732,984 10,042,542 Other Manufacturing Expenses 16,320,737 10,867,821 Rent 31,937,551 13,370,555 Rates & Taxes 6,572,906 1,652,244 Travelling Expenses 10,779,684 8,751,111 Communication Expenses 2,311,463 2,458,019 Courier & Poastage Expenses 1,256,949 2,068,762 Printing & Stationery 5,169,232 3,330,960 Repairs & Maintenance (others) 1,496,353 729,845 Audit Fees 337,000 337,000 Vehicle Expenses & Local Conveyance 3,255,007 4,358,458 Legal & Professional Fees 20,333,658 20,854,496 Office Expenses 595,866 1,222,509 Insurance Charges 5,409,909 5,370,778 Diminuation of Investment 468,600,000 - Impairement of Assets 947,726,840 - Redemption Premium on Foreign Currency Convertible Bond - 901,733,246 Exchange Loss/(Gain) 29,552,722 (18,365,919)Loss on sale of Fixed Assets 492,819 - Other Operating Expenses 18,915,093 11,604,833 Freight Outward & Export Clg. Exps 38,308,116 42,242,857 Selling & Distribution Expenses 36,147,265 92,282,736 Total 1,710,590,389 1,163,511,208
Note No. 25.1Details of Payments to the AuditorAs auditor 337,000 337,000 Total 337,000 337,000
FOR AND ON BEHALF OF For and on behalf of the Board of DirectorsN. K. MITTAL & ASSOCIATESChartered Accountant
MARK SALDANHAChairman and Managing Director
DR. BALWANT S. DESAIWhole-Time Director
N.K.MITTALProprietorMembership No: 46785F. No.113281W
HARSHAVARDHAN PANIGRAHICompany Secretary & Legal Manager
Place : MumbaiDate : 29th May, 2012

37
Marksans Pharma LimitedM
(Amount in `)
Particulars For the period ended as on31.03.2012 31.03.2011
A. Cash Flow From Operating ActivitiesProfit/(Loss) Before Tax (1,829,030,478) (2,129,428,677)Adjustments to reconcile profit before tax and prior perioditems to cash provided by operations:Depreciation 179,812,395 146,438,693 Impairment of assets 947,726,840 - Preliminary & Deferred Revenue Expenses Written off 130,796 1,921,016 Loss on sale of Business/Fixed Assets 492,819 802,168,180 Interest Expense 94,538,727 134,292,160 Interest Receipt (19,278,279) (16,798,785)Operating Profit before working capital changes (625,607,180) (1,061,407,413)Movements in working capital :(Increase)/Decrease in Inventories (2,345,597) 430,477,081 (Increase)/Decrease in Trade and other receivables (20,148,849) (49,728,504)(Increase)/Decrease in loans and advances 20,502,356 48,451,618 Increase/(Decrease) in Trade Payable and short term provisions 25,259,624 (32,527,550)Income Tax Paid (5,376,680) (13,849,293)Net cash used in operating activities (607,716,326) (678,584,061)
B. Cash Flow provided by (used in) Investing Activities:(Purchase)/Sale of Business/Fixed Assets (45,595,134) 143,811,632 Investment 441,017,576 100,000,000 Interest Receipt 19,278,279 16,798,785 Net Cash Flow provided by (used in) Investing Activities 414,700,721 260,610,417
C. Cash Flow provided by (used in) Financing Activities:Increase in Equity Share Capital - 1,333 Increase in Share Premium - 43,578 Increase in General Reserve 339,699,267 - Money received against share warrants 11,565,500 - Proceeds/(Repayment) of Short Term and Long Term Borrowings (150,239,144) 489,472,514 Interest Expense (94,538,727) (134,292,160)Net Cash Flow provided by (used in) Financing Activities 106,486,896 355,225,265 Net Increase /(Decrease) in Cash and Bank Balances (86,528,709) (62,748,379)
Cash & Bank Balances as at 31.03.2011 262,378,442 325,126,821 Cash & Bank Balances as at 31.03.2012 175,849,733 262,378,442
(86,528,709) (62,748,379)Notes :1 The Cash Flow Statement has been prepared under the “Indirect Method” as set out in Accounting Standard - 3 on Cash Flow
Statements issued by the Institute of Chartered Accountants of India.2 The Previous year’s figures have been regrouped wherever necessary in order to conform to this year’s presentation.
Statement of Cash Flow for the year ended as on March 31, 2012
FOR AND ON BEHALF OF For and on behalf of the Board of DirectorsN. K. MITTAL & ASSOCIATESChartered Accountant
MARK SALDANHAChairman and Managing Director
DR. BALWANT S. DESAIWhole-Time Director
N.K.MITTALProprietorMembership No: 46785F. No.113281W
HARSHAVARDHAN PANIGRAHICompany Secretary & Legal Manager
Place : MumbaiDate : 29th May, 2012

38
ANNUAL REPORT 2011-2012
Statement Pursuant to Section 212 of the Companies Act,1956 Relating to Holding Company’s Interest in the Subsidiary Companies
Nova PharmaceuticalsAustralasia Pty Ltd
Marksans Pharma (UK)Limited (Consolidated)
1 The Financial Year of the Subsidiary Companies ended on
31st March,2012 31st March,2012
2 Date on Which it become a Subsidiary 1st April,2006 31st May,2005
3(A) Numbers of Shares held by Marksans Pharma Ltd (Holding Company) in the Subsidiary Companies at the end of the Financial Year of the Subsidiary Companies
90 Equity Shares of A$1each
1000 Equity Shares ofGBP 1 each
3(B) Extent of Interest of Holding Company at the end of the Financial Year of the Subsidiary Companies
60% 100%
4 The net agreegate amount of the Subsidiary Companies Profit/ (Loss) so far as it concerns Members of the Holding Company and
a. Is not dealt with in the Company’s Accounts - -
i. For the Financial Year ended 31st March, 2012 41,406,288 (19,141,628)
ii. For the Previous Financial Year since it becameSubsidiary
20,806,215 (75,358,787)
b. No part of the Profit/(Loss) has been dealt within Company’s Accounts for the Financial Year or for the previous financial year since ir became Subsidiary
Issued and Subscribed Share Capital 4,781 84,840
Reserve 140,398,299 (355,200,503)
Total Assets 176,005,152 1,467,588,605
Total Liabilities 176,005,152 1,467,588,605
Turnover 537,816,518 1,471,758,011
Profit/(loss) before Taxation 97,722,831 (18,728,038)
Provision for Taxation 28,712,351 413,591
Profit/(loss) after Taxation 69,010,480 (19,141,628)
Proposed Dividend 5,111,520 -
Exchange Rate 50.4695(Avg Australian $) 77.0762 (Avg.GBP)
For and on behalf of the Board of Directors
Mark SaldanhaChairman and Managing Director
Dr. Balwant S. DesaiWhole-Time Director
Harshavardhan PanigrahiCompany Secretary & Legal Manager
Place : MumbaiDate : 14th August, 2012

39
Marksans Pharma LimitedMAUDITORS’ REPORT
Auditor’s report to the Board of Directors of MARKSANS PHARMA LIMITED
1) We have audited the attached Consolidated Balance Sheet of MARKSANS PHARMA LIMITED (the company) and its subsidiaries as at 31st March 2012 and also the Consolidated Statement of Profit and Loss for the year ended on that date annexed thereto. These financial statements are the responsibility of the company’s management and have been prepared by the management on the basis of separate financial statements and other financial information regarding component. Our responsibility is to express an opinion on these financial statements based on our audit.
2) We conducted our audit in accordance with auditing standards generally accepted in India. These standards require that we plan and perform the audit to obtain reasonable assurance about whether the financial statements are free of material misstatement. An audit includes, examining on a test basis, evidence supporting the amounts and disclosures in the financial statements. An audit also includes assessing the accounting principles used and significant estimates made by management, as well as evaluating the overall financial statement presentation. We believe that our audit provides a reasonable basis for our opinion.
3) We report that:
(a) The consolidated financial statements have been prepared by the company’s management in accordance with the requirements of AS-21 on consolidated financial statements issued by the Institute of Chartered Accountants of India.
(b) We did not audit the financial statement of the subsidiaries, whose financial statement reflect total assets of ` 16435.94 Lacs as at 31st March 2012 and total revenues of ` 20105.50 Lacs for the year ended on that date. These financial statements have been audited by other auditors whose reports have been furnished to us, and our opinion, insofar as it relates to the amounts included in respect of these subsidiaries, is based solely on the report of other auditors.
4) On the basis of information and explanation given to us and on consideration of separate audit reports on individual audited financial statements of Marksans Pharma Ltd. and its aforesaid subsidiaries, we are of the opinion that the attached consolidated financial statements give a true and fair view in conformity with the accounting principles generally accepted in India:
(a) In the case of Consolidated Balance Sheet, of the state of affairs of Marksans Pharma Ltd. and its subsidiaries as at 31st March, 2012,
(b) In the case of Consolidated Statement of Profit and Loss, of the Loss of Marksans Pharma Ltd. and its subsidiaries for the year ended 31st March, 2012, and
(c) In case of Consolidated Statement of Cash Flow, of the cash flows for the year ended on 31st March, 2012.
FOR N. K. MITTAL & ASSOCIATESChartered Accountants
N. K. MITTAL(Proprietor)
M.NO.46785F.NO. 113281W
Place : MumbaiDate : 14th August, 2012

40
ANNUAL REPORT 2011-2012
Consolidated Balance Sheet as at March 31, 2012
Particulars Note No.
31 March 2012
`
31 March 2011
`
I. EQUITY AND LIABILITIES
1 Shareholders’ funds
(a) Share capital 3 502,807,204 502,807,204
(b) Reserves and surplus 4 (2,195,101,771) (1,154,016,704)
(c) Money received against share warrants 11,565,500 -
2 Share application money pending allotment - -
Minority Interest 56,161,232 25,114,665
3 Non-current liabilities
(a) Long-term borrowings 5 152,013,622 190,048,719
(b) Deferred tax liabilities (Net) 6 130,604,820 157,106,067
4 Current liabilities
(a) Short-term borrowings 7 1,139,224,899 1,159,823,801
(b) Trade payables 8 586,180,477 551,113,377
(c) Other current liabilities 9 3,363,934,107 3,417,591,767
(d) Short-term provisions 10 136,234,550 69,338,698
TOTAL 3,883,624,640 4,918,927,594
II. ASSETS
1 Non-current assets
(a) Fixed assets 11
(i) Tangible assets 738,681,729 737,262,205
(ii) Intangible assets 914,852,690 2,048,634,770
(b) Non-current investments - -
(c) Long-term loans and advances 12 40,827,069 38,813,917
2 Current assets
(a) Inventories 13 733,588,714 672,181,589
(b) Trade receivables 14 1,127,686,895 988,605,711
(c) Cash and cash equivalents 15 223,865,801 309,213,686
(d) Short-term loans and advances 16 104,121,742 124,084,920
(e) Other current assets - Miscellaneous expenditure - 130,796
TOTAL 3,883,624,640 4,918,927,594
Significant Accounting Policies and Notes on financial Statements 1 to 24
FOR AND ON BEHALF OF For and on behalf of the Board of DirectorsN. K. MITTAL & ASSOCIATESChartered Accountant
MARK SALDANHAChairman and Managing Director
DR. BALWANT S. DESAIWhole-Time Director
N.K.MITTALProprietorMembership No: 46785F. No.113281W
HARSHAVARDHAN PANIGRAHICompany Secretary & Legal Manager
Place : MumbaiDate : 14th August, 2012

41
Marksans Pharma LimitedMConsolidated Statement of Profit & Loss for the year ended as on March 31, 2012
Particulars Note No.
2011-12`
2010-11`
1 Revenue from operations 17 3,555,487,496 3,045,780,6712 Other income 18 20,516,278 17,506,1363 Total Revenue (1 + 2) 3,576,003,774 3,063,286,8074 Expenses:
Cost of materials consumed 19 1,178,289,208 857,112,394Purchases of Stock-in-Trade 833,259,816 1,175,376,502Changes in inventories of finished goods, work-in-progress andStock-in-Trade
20 117,715,604 (4,533,490)
Employee benefits expense 21 456,974,371 362,561,196Finance costs 22 535,753,955 436,667,441Depreciation and amortization expense 23 236,997,646 199,751,763Other expenses 24 1,966,918,061 1,386,699,906Miscellaneous Expenditure Written Off 130,796 1,921,016Total expenses 5,326,039,457 4,415,556,728
5 Profit/(Loss) before exceptional and extraordinary items and tax (3-4) (1,750,035,683) (1,352,269,921)6 Exceptional items - -7 Profit/(Loss) before extraordinary items and tax (5-6) (1,750,035,683) (1,352,269,921)8 Extraordinary Items - -9 Profit/(Loss) before tax (7-8) (1,750,035,683) (1,352,269,921)10 Tax expense:
(1) Current Year 33,352,338 15,600,960(2) Earlier year 4,700,413 14,017,690(3) Deferred tax (27,295,353) 34,516,875 Total Tax Expenses 10,757,398 64,135,525
11 Profit/(Loss) for the period from continuing operations (9-10) (1,760,793,081) (1,416,405,446)12 Profit/(loss) from discontinuing operations - (802,168,180)13 Tax expense of discontinuing operations - -14 Profit/(Loss) from Discontinuing operations (after tax) (12-13) - (802,168,180)15 Profit/(Loss) for the period before adjustment for Minority interest (11+14) (1,760,793,081) (2,218,573,626)
16 Less: Minority Interest 27,604,192 13,870,81017 Profit/(Loss) for the period after adjustment for Minority interest (15-16) (1,788,397,273) (2,232,444,436)
18 Earnings per equity share:(1) Basic (4.86) (6.07)(2) Diluted (4.64) (6.07)Significant Accounting Policies and Notes on financial Statements 1 to 24
FOR AND ON BEHALF OF For and on behalf of the Board of DirectorsN. K. MITTAL & ASSOCIATESChartered Accountant
MARK SALDANHAChairman and Managing Director
DR. BALWANT S. DESAIWhole-Time Director
N.K.MITTALProprietorMembership No: 46785F. No.113281W
HARSHAVARDHAN PANIGRAHICompany Secretary & Legal Manager
Place : MumbaiDate : 14th August, 2012
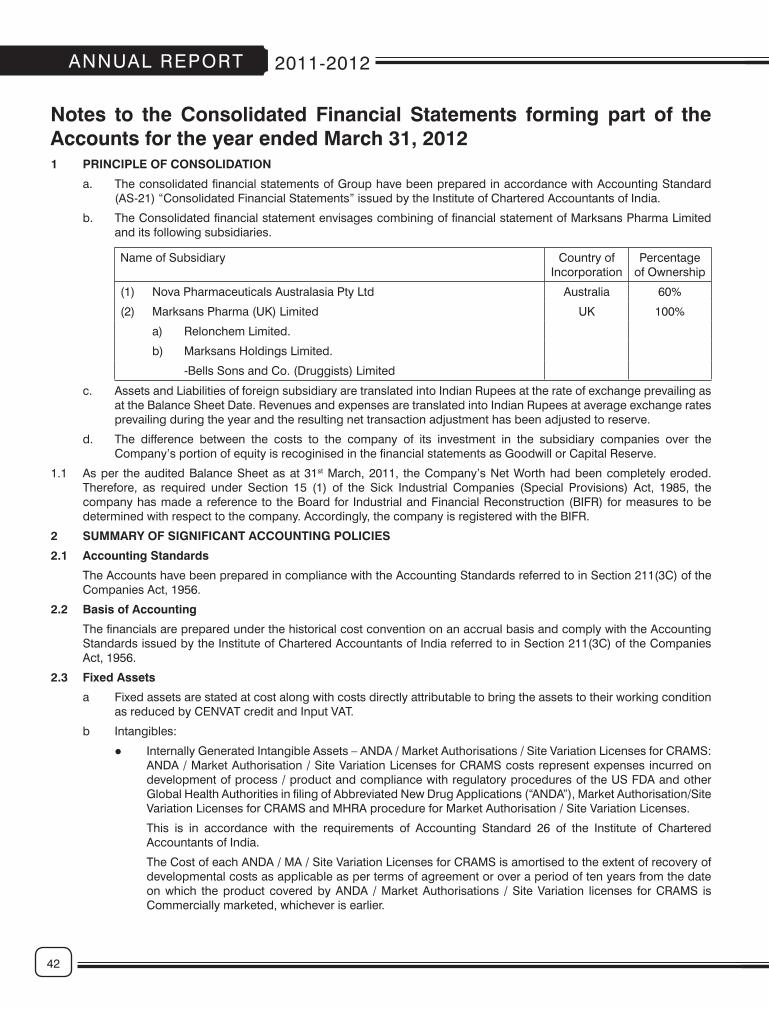
42
ANNUAL REPORT 2011-2012
Notes to the Consolidated Financial Statements forming part of the Accounts for the year ended March 31, 20121 PRINCIPLE OF CONSOLIDATION
a. The consolidated financial statements of Group have been prepared in accordance with Accounting Standard (AS-21) “Consolidated Financial Statements” issued by the Institute of Chartered Accountants of India.
b. The Consolidated financial statement envisages combining of financial statement of Marksans Pharma Limited and its following subsidiaries.
Name of Subsidiary Country of Incorporation
Percentage of Ownership
(1) Nova Pharmaceuticals Australasia Pty Ltd Australia 60%
(2) Marksans Pharma (UK) Limited UK 100%
a) Relonchem Limited.
b) Marksans Holdings Limited.
-Bells Sons and Co. (Druggists) Limited
c. Assets and Liabilities of foreign subsidiary are translated into Indian Rupees at the rate of exchange prevailing as at the Balance Sheet Date. Revenues and expenses are translated into Indian Rupees at average exchange rates prevailing during the year and the resulting net transaction adjustment has been adjusted to reserve.
d. The difference between the costs to the company of its investment in the subsidiary companies over the Company’s portion of equity is recoginised in the financial statements as Goodwill or Capital Reserve.
1.1 As per the audited Balance Sheet as at 31st March, 2011, the Company’s Net Worth had been completely eroded. Therefore, as required under Section 15 (1) of the Sick Industrial Companies (Special Provisions) Act, 1985, the company has made a reference to the Board for Industrial and Financial Reconstruction (BIFR) for measures to be determined with respect to the company. Accordingly, the company is registered with the BIFR.
2 SUMMARY OF SIGNIFICANT ACCOUNTING POLICIES
2.1 Accounting Standards
The Accounts have been prepared in compliance with the Accounting Standards referred to in Section 211(3C) of the Companies Act, 1956.
2.2 Basis of Accounting
The financials are prepared under the historical cost convention on an accrual basis and comply with the Accounting Standards issued by the Institute of Chartered Accountants of India referred to in Section 211(3C) of the Companies Act, 1956.
2.3 Fixed Assets
a Fixed assets are stated at cost along with costs directly attributable to bring the assets to their working condition as reduced by CENVAT credit and Input VAT.
b Intangibles:
� Internally Generated Intangible Assets – ANDA / Market Authorisations / Site Variation Licenses for CRAMS: ANDA / Market Authorisation / Site Variation Licenses for CRAMS costs represent expenses incurred on development of process / product and compliance with regulatory procedures of the US FDA and other Global Health Authorities in filing of Abbreviated New Drug Applications (“ANDA”), Market Authorisation/Site Variation Licenses for CRAMS and MHRA procedure for Market Authorisation / Site Variation Licenses.
This is in accordance with the requirements of Accounting Standard 26 of the Institute of Chartered Accountants of India.
The Cost of each ANDA / MA / Site Variation Licenses for CRAMS is amortised to the extent of recovery of developmental costs as applicable as per terms of agreement or over a period of ten years from the date on which the product covered by ANDA / Market Authorisations / Site Variation licenses for CRAMS is Commercially marketed, whichever is earlier.
43
Marksans Pharma LimitedM � Product Development Costs:
Product Development expenditure incurred on an individual project is carried forward when its future recoverability can reasonably be regarded as assured. Any expenditure carried forward is amortised over the period of expected future economic benefit from the related project, not exceeding ten years.
2.4 Depreciation
Depreciation on fixed assets other than leasehold land is provided on Straight Line Method at the rates and in the manner specified in Schedule XIV to the Companies Act, 1956 read with the relevant circulars issued by the Department of Company Affairs from time to time. Leasehold land is not amortised.
2.5 Impairment of Assets
The company identifies impairable assets at the year end in terms of cash generating unit concept based on para - 5 to 13 of AS-28 issued by ICAI for the purpose of arriving at impairment loss thereon being the difference between the book value and recoverable value of relevant assets. Impairment loss, if any, when crystallizes is charged against revenue of the year.
2.6 Expenditure during construction period
In case of new projects and substantial expansion of existing factories, expenditure incurred including financing costs prior to commencement of commercial production is capitalized. All pre-operative and trial run expenditure accumulated as Capital Work in Progress is allocated on a pro- rata basis depending on the prime cost of the assets.
2.7 Inventories
Inventories are valued at the lower of cost (net of CENVAT Credit and Input VAT) or Net Realisable Value as under :
Raw Materials, Packing Materials and Stores – At Weighted Average Cost on FIFO basis.
Work in Process - At Cost (Direct Cost plus Conversion Cost) upto estimated stage of completion.
By-Products - At Net Realisable Value.
Finished Goods - At Cost (Direct cost plus Conversion Cost and Excise Duty) or Net Realisable Value, whichever is lower.
2.8 Customs / Excise duty
Excise Duty on finished goods and Custom Duty on imported materials are accounted on production of packed finished goods / receipt of material in custom bonded warehouses. All the closing stock of finished goods lying at Goa factory is for export, hence provision for excise duty does not arise.
2.9 Foreign Currency Transaction
Purchase of imported raw materials, capital goods and components are accounted based on presentation memos from bank on the date of the transaction. In respect of liabilities on imports of raw materials, capital goods and components for which invoices / bills are not received, the liability is accounted based on the exchange rates prevailing on the date of the balance sheet.
Export Sales of finished goods are accounted on the basis of export invoices on the invoice date. In respect of the unrealised exports, the receivables are accounted based on the exchange rates prevailing on the date of the balance sheet.
2.10 Miscellaneous Expenditure
Expenditure on launch of new products and their sales promotion for domestic markets are being amortised over a period of 60 months.
2.11 Research and Development
Capital expenditure on research and development is capitalized as fixed assets. Other expenditure on R&D is expensed as incurred.
2.12 Investments
Long term investments are stated at cost less any provision for permanent diminution in the value. The current investments are valued at lower of cost or market value.
2.13 Employee Benefits
Liability for Gratuity is accounted on accrual basis.
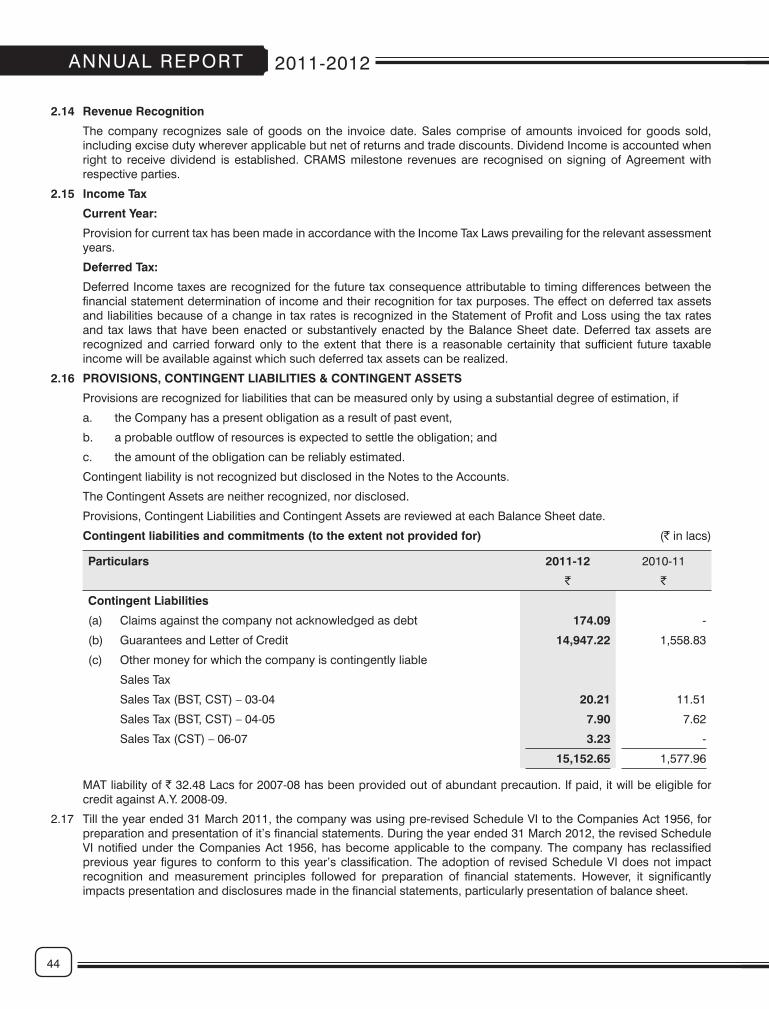
44
ANNUAL REPORT 2011-2012
2.14 Revenue Recognition
The company recognizes sale of goods on the invoice date. Sales comprise of amounts invoiced for goods sold, including excise duty wherever applicable but net of returns and trade discounts. Dividend Income is accounted when right to receive dividend is established. CRAMS milestone revenues are recognised on signing of Agreement with respective parties.
2.15 Income Tax
Current Year:
Provision for current tax has been made in accordance with the Income Tax Laws prevailing for the relevant assessment years.
Deferred Tax:
Deferred Income taxes are recognized for the future tax consequence attributable to timing differences between the financial statement determination of income and their recognition for tax purposes. The effect on deferred tax assets and liabilities because of a change in tax rates is recognized in the Statement of Profit and Loss using the tax rates and tax laws that have been enacted or substantively enacted by the Balance Sheet date. Deferred tax assets are recognized and carried forward only to the extent that there is a reasonable certainity that sufficient future taxable income will be available against which such deferred tax assets can be realized.
2.16 PROVISIONS, CONTINGENT LIABILITIES & CONTINGENT ASSETS
Provisions are recognized for liabilities that can be measured only by using a substantial degree of estimation, if
a. the Company has a present obligation as a result of past event,
b. a probable outflow of resources is expected to settle the obligation; and
c. the amount of the obligation can be reliably estimated.
Contingent liability is not recognized but disclosed in the Notes to the Accounts.
The Contingent Assets are neither recognized, nor disclosed.
Provisions, Contingent Liabilities and Contingent Assets are reviewed at each Balance Sheet date.
Contingent liabilities and commitments (to the extent not provided for) (` in lacs)
Particulars 2011-12 2010-11
` `
Contingent Liabilities
(a) Claims against the company not acknowledged as debt 174.09 -
(b) Guarantees and Letter of Credit 14,947.22 1,558.83
(c) Other money for which the company is contingently liable
Sales Tax
Sales Tax (BST, CST) – 03-04 20.21 11.51
Sales Tax (BST, CST) – 04-05 7.90 7.62
Sales Tax (CST) – 06-07 3.23 -
15,152.65 1,577.96
MAT liability of ` 32.48 Lacs for 2007-08 has been provided out of abundant precaution. If paid, it will be eligible for credit against A.Y. 2008-09.
2.17 Till the year ended 31 March 2011, the company was using pre-revised Schedule VI to the Companies Act 1956, for preparation and presentation of it’s financial statements. During the year ended 31 March 2012, the revised Schedule VI notified under the Companies Act 1956, has become applicable to the company. The company has reclassified previous year figures to conform to this year’s classification. The adoption of revised Schedule VI does not impact recognition and measurement principles followed for preparation of financial statements. However, it significantly impacts presentation and disclosures made in the financial statements, particularly presentation of balance sheet.
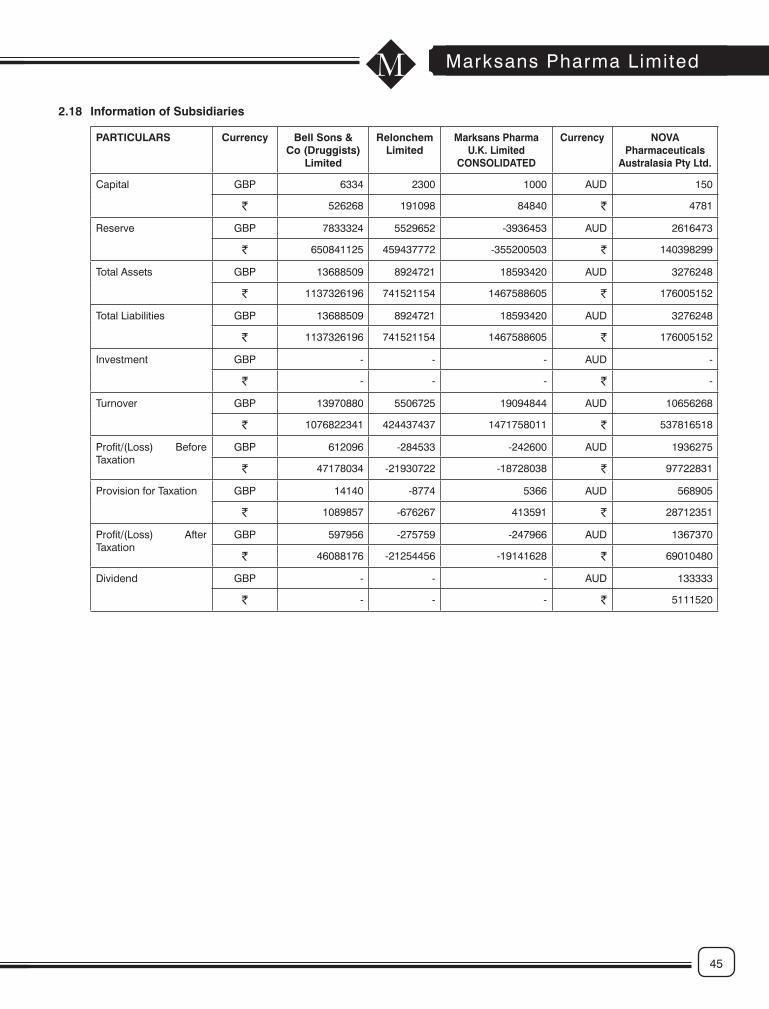
45
Marksans Pharma LimitedM2.18 Information of Subsidiaries
PARTICULARS Currency Bell Sons & Co (Druggists)
Limited
Relonchem Limited
Marksans Pharma U.K. Limited
CONSOLIDATED
Currency NOVA Pharmaceuticals
Australasia Pty Ltd.
Capital GBP 6334 2300 1000 AUD 150
` 526268 191098 84840 ` 4781
Reserve GBP 7833324 5529652 -3936453 AUD 2616473
` 650841125 459437772 -355200503 ` 140398299
Total Assets GBP 13688509 8924721 18593420 AUD 3276248
` 1137326196 741521154 1467588605 ` 176005152
Total Liabilities GBP 13688509 8924721 18593420 AUD 3276248
` 1137326196 741521154 1467588605 ` 176005152
Investment GBP - - - AUD -
` - - - ` -
Turnover GBP 13970880 5506725 19094844 AUD 10656268
` 1076822341 424437437 1471758011 ` 537816518
Profit/(Loss) Before Taxation
GBP 612096 -284533 -242600 AUD 1936275
` 47178034 -21930722 -18728038 ` 97722831
Provision for Taxation GBP 14140 -8774 5366 AUD 568905
` 1089857 -676267 413591 ` 28712351
Profit/(Loss) After Taxation
GBP 597956 -275759 -247966 AUD 1367370
` 46088176 -21254456 -19141628 ` 69010480
Dividend GBP - - - AUD 133333
` - - - ` 5111520

46
ANNUAL REPORT 2011-2012
Note No.3
Share Capital
Particulars 31 March 2012 31 March 2011
Number ` Number `
Authorised
Equity Shares of ` 1/- each 550,000,000 550,000,000 550,000,000 550,000,000
7% Redeemable Cumulative Preference Shares of ̀ 100/- each 1,400,000 140,000,000 1,400,000 140,000,000
551,400,000 690,000,000 551,400,000 690,000,000
Issued, Subscribed & Paid up
Equity Shares of ` 1/- each 367,807,204 367,807,204 367,807,204 367,807,204
7% Redeemable Cumulative Preference Shares of ̀ 100/- each 1,350,000 135,000,000 1,350,000 135,000,000
Total 369,157,204 502,807,204 369,157,204 502,807,204
a. Reconciliation of the shares outstanding at the beginning and at the end of the reporting period
Particulars Equity Shares of ` 1 each 7% Redeemable Cumulative preference Shares of ` 100/- each
Number ` Number `
Shares outstanding at the beginning of the year 367,807,204 367,807,204 1,350,000 135,000,000
Shares Issued during the year - - - -
Shares bought back during the year - - - -
Shares outstanding at the end of the year 367,807,204 367,807,204 1,350,000 135,000,000
b. Terms/rights attached to Equity Shares
The Company has only one class of Equity Shares having a par value of ` 1/- per share. All the Equity Shares rank pari passu in all respect. Each holder of Equity Shares is entitled to one vote per share. The equity share holders are entitled to dividend, if declared by the shareholders in an Annual General Meeting, in proportion to the number of Equity Shares held by the shareholders. In the event of liquidation of the Company, the holders of Equity Shares will be entitled to receive remaining assets of the Company, after distribution of all preferential amounts. The distribution will be in proportion to the number of Equity Shares held by the shareholders.
c. Terms/rights attached to Preference Shares
The Company has issued 1,350,000 7% Redeemable Cumulative Preference Shares of r 100/- each fully paid-up to Glenmark Pharmaceuticals Limited on 27 March, 2008. These preference shares carry dividend at the rate of 7% per annum subject to approval of the shareholders at an Annual General Meeting. These preference shares will be redeemed at par on 27 March, 2013. The holder of the preference shares is entitled to one vote per share only on resolutions placed before the Company which directly affect the rights attached to the preference shares. In the event of liquidation of the Company before redemption of the preference shares, the holder of the preference shares will have priority over equity shares in the payment of dividend and repayment of capital.
d. The company has not issued bonus shares and shares for consideration other than cash nor the company has bought back any shares during the period of five years immediately preceding the reporting date.
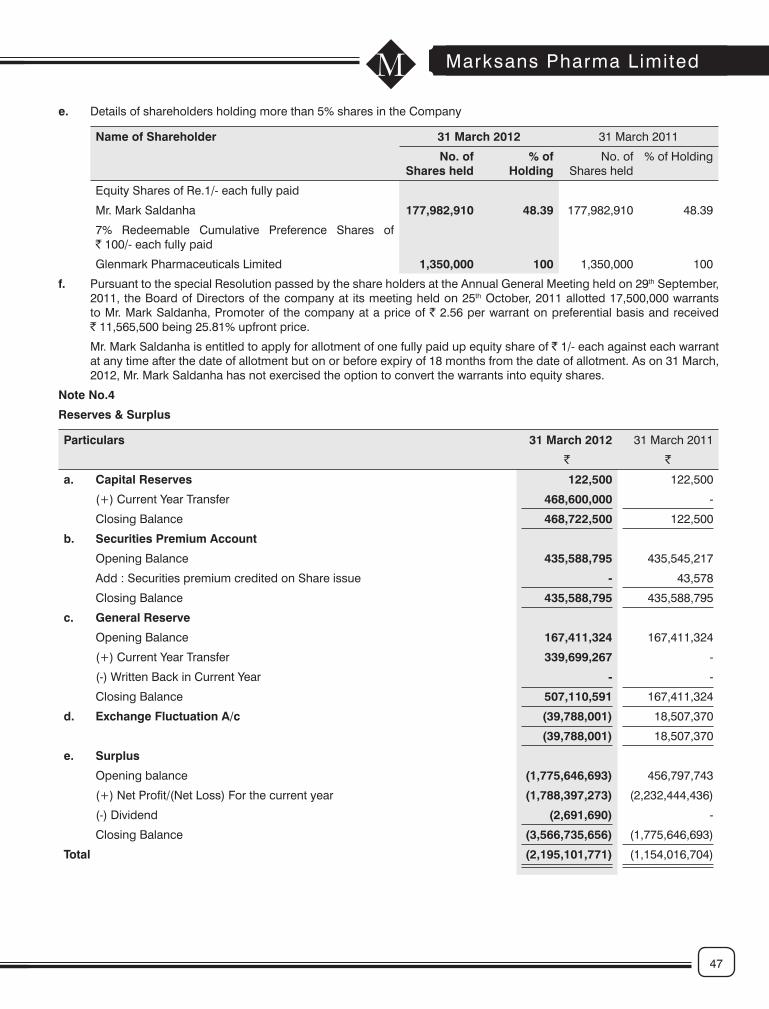
47
Marksans Pharma LimitedMe. Details of shareholders holding more than 5% shares in the Company
Name of Shareholder 31 March 2012 31 March 2011
No. of Shares held
% of Holding
No. of Shares held
% of Holding
Equity Shares of Re.1/- each fully paid
Mr. Mark Saldanha 177,982,910 48.39 177,982,910 48.39
7% Redeemable Cumulative Preference Shares of ` 100/- each fully paid
Glenmark Pharmaceuticals Limited 1,350,000 100 1,350,000 100
f. Pursuant to the special Resolution passed by the share holders at the Annual General Meeting held on 29th September, 2011, the Board of Directors of the company at its meeting held on 25th October, 2011 allotted 17,500,000 warrants to Mr. Mark Saldanha, Promoter of the company at a price of ` 2.56 per warrant on preferential basis and received ` 11,565,500 being 25.81% upfront price.
Mr. Mark Saldanha is entitled to apply for allotment of one fully paid up equity share of ` 1/- each against each warrant at any time after the date of allotment but on or before expiry of 18 months from the date of allotment. As on 31 March, 2012, Mr. Mark Saldanha has not exercised the option to convert the warrants into equity shares.
Note No.4
Reserves & Surplus
Particulars 31 March 2012 31 March 2011
` `
a. Capital Reserves 122,500 122,500
(+) Current Year Transfer 468,600,000 -
Closing Balance 468,722,500 122,500
b. Securities Premium Account
Opening Balance 435,588,795 435,545,217
Add : Securities premium credited on Share issue - 43,578
Closing Balance 435,588,795 435,588,795
c. General Reserve
Opening Balance 167,411,324 167,411,324
(+) Current Year Transfer 339,699,267 -
(-) Written Back in Current Year - -
Closing Balance 507,110,591 167,411,324
d. Exchange Fluctuation A/c (39,788,001) 18,507,370
(39,788,001) 18,507,370
e. Surplus
Opening balance (1,775,646,693) 456,797,743
(+) Net Profit/(Net Loss) For the current year (1,788,397,273) (2,232,444,436)
(-) Dividend (2,691,690) -
Closing Balance (3,566,735,656) (1,775,646,693)
Total (2,195,101,771) (1,154,016,704)

48
ANNUAL REPORT 2011-2012
Note No. 5
Long Term Borrowings
Particulars 31 March 2012 31 March 2011
` `
Secured
a. Term loans
from banks 151,452,705 189,693,354
b. Vehicle Loan 560,917 355,365
Total 152,013,622 190,048,719
Note No. 5.1
The term loan is secured by a charge on the plants and machineries of Goa plants. There are no overdues repayment of the term loan. Maturity profile of Term Loan are as set out below.
2 years 2-3 years 3-4 years Beyond 4 years
Term Loan from Bank (`) 73,925,629 26,614,430 19,849,644 31,623,919
Particulars 31 March 2012 31 March 2011
` `
Note No. 6
Deferred tax liabilities (Net)
Depreciation 147,609,602 171,153,814
Provision for excise duty 569,696 569,696
Preliminary expenses written off (230,838) (190,422)
FCCB issue cost (20,503,539) (20,503,539)
Provision for gratuity (1,576,014) (1,415,419)
Add: Deferred Tax Liability of Marksans Pharma UK Ltd. 4,735,913 7,491,937
Total 130,604,820 157,106,067
Note No. 7
Short Term Borrowings
Secured
Working Capital facilities from Bank 1,139,224,899 1,159,823,801
Total 1,139,224,899 1,159,823,801
Note No. 7.1
Working capital facilities are secured by Hypothecation of stock of raw material,packing material, finished goods, work-in-progress, receivables and equitable mortgage on fixed assets of manufacturing facility of Goa plants, present and future.
Working capital loans taken for Bells Sons and Co.(Druggists) Limited and Relonchem Limited are secured by Corporate Guarantee provided by the parent company Marksans Pharma Ltd.
Note No. 8
Trade Payable
Trade Payable 586,180,477 551,113,377
Total 586,180,477 551,113,377

49
Marksans Pharma LimitedMParticulars 31 March 2012 31 March 2011
` `
Note No. 9
Other Current Liabilities
a. Current maturities of Term Loan 496,494,493 516,363,114
b. Current maturities of Vehicle Loan 228,019 360,349
c. Foreign Currency Convertible Bonds 2,867,211,595 2,896,718,304
d. Deposits - 4,150,000
Total 3,363,934,107 3,417,591,767
Note No. 9.1 Term Loan
Term loan includes loan of of £ 5.05 million taken by subsidiary Companies which is secured by corporate guarantee provided by the parent company Marksans Pharma Ltd and a pledge of shares in Marksans Holding Limited & Relonchem Limited.
One installment of Term loan of GBP 300000 is due for payment.
Note No. 9.2 Foreign Currency Convertible Bonds
The current outstanding of principal value of Foreign Currency Convertible Bonds of ` 19746.64 Lacs have become due for redemption on 9th November, 2010 and were not redeemed. These Bonds have redemption premium of ` 8925.48 Lacs. Further, due to the redemption default, there will be a default interest payable at 8% p.a. from the due date of redemption which has not yet been provided.
Note No. 10
Short Term Provisions
a. Provision for Gratuity and compensated absences
Gratuity 3,626,106 3,106,380
Compensated absences 14,599,483 12,917,658
b. Others 118,008,961 53,314,660
Total 136,234,550 69,338,698

50
ANNUAL REPORT 2011-2012N
ote
No
. 11
Fixe
d As
sets
Gro
ss B
lock
Accu
mul
ated
Dep
reci
atio
nNe
t Blo
ck
Bala
nce
as a
t 1
April
201
1Ad
ditio
ns/
Disp
osal
sIm
pairm
ents
Bala
nce
as
at 3
1 M
arch
20
12
Bala
nce
as a
t 1
April
201
1De
prec
iatio
n ch
arge
for t
he
year
On
disp
osal
sBa
lanc
e as
at
31
Mar
ch
2012
Bala
nce
as
at 3
1 M
arch
20
12
Bala
nce
as a
t 31
Mar
ch 2
011
``
``
``
``
``
`
a Ta
ngib
le A
sset
s
La
nd9,
665,
840
--
-9,
665,
840
--
--
9,66
5,84
09,
665,
840
Bu
ildin
gs37
6,49
5,00
235
,190
--
376,
530,
192
51,4
35,5
358,
904,
202
-60
,339
,737
316,
190,
455
325,
059,
467
Pl
ant a
nd E
quip
men
t70
3,16
1,54
952
,516
,010
1,05
3,67
6-
754,
623,
883
324,
514,
770
35,0
54,3
51-
359,
569,
121
395,
054,
762
378,
646,
779
Fu
rnitu
re a
nd F
ixtur
es9,
619,
041
122,
778
--
9,74
1,81
92,
982,
894
774,
676
-3,
757,
570
5,98
4,24
96,
636,
147
Ve
hicl
es10
,506
,247
996,
663
2,02
2,58
9-
9,48
0,32
15,
310,
257
1,13
9,02
291
2,54
85,
536,
731
3,94
3,59
05,
195,
990
O
ffice
equ
ipm
ent
5,36
7,15
615
5,48
9-
-5,
522,
645
2,58
0,87
963
2,14
0-
3,21
3,01
92,
309,
626
2,78
6,27
7
Co
mpu
ter a
nd S
oftw
are
25,5
92,2
9243
9,45
6-
-26
,031
,748
16,3
20,5
874,
177,
954
-20
,498
,541
5,53
3,20
79,
271,
705
To
tal
1,14
0,40
7,12
754
,265
,586
3,07
6,26
5-
1,19
1,59
6,44
840
3,14
4,92
250
,682
,345
912,
548
452,
914,
719
738,
681,
729
737,
262,
205
b In
tang
ible
Ass
ets
G
oodw
ill45
2,65
9,11
7-
--
452,
659,
117
67,4
07,5
7422
,032
,771
-89
,440
,345
363,
218,
772
385,
251,
543
Pr
escr
iptio
n Pr
oduc
t Lice
nces
344,
737,
793
--
-34
4,73
7,79
354
,004
,661
17,9
20,8
33-
71,9
25,4
9427
2,81
2,29
929
0,73
3,13
2
O
TC P
rodu
ct L
icenc
es2,
023,
119
260,
061
--
2,28
3,18
026
2,74
521
1,96
0-
474,
705
1,80
8,47
51,
760,
374
In
tern
ally
Gen
erat
ed
ANDA
, M
arke
t Aut
horis
atio
ns, P
rodu
ct
Lice
nces
& O
ther
s1,
461,
513,
721
--
947,
726,
840
513,
786,
881
90,6
24,0
0014
6,14
9,73
7-
236,
773,
737
277,
013,
144
1,37
0,88
9,72
1
To
tal
2,26
0,93
3,75
026
0,06
1-
947,
726,
840
1,31
3,46
6,97
121
2,29
8,98
018
6,31
5,30
1-
398,
614,
281
914,
852,
690
2,04
8,63
4,77
0
To
tal (
a+b)
3,40
1,34
0,87
754
,525
,647
3,07
6,26
594
7,72
6,84
02,
505,
063,
419
615,
443,
902
236,
997,
646
912,
548
851,
529,
000
1,65
3,53
4,41
92,
785,
896,
975
Pr
evio
us ye
ar fi
gure
4,85
3,95
0,02
612
6,12
4,58
81,
578,
733,
737
-3,401,340,877
936,
751,
907
199,
751,
763
521,
059,
768
615,443,902
2,785,896,975
3,91
7,19
8,11
9
No
te N
o.1
1.1
The
com
pany
has
inte
rnal
ly g
ener
ated
inta
ngib
le a
sset
s in
the
natu
re o
f AN
DA
/Mar
ket A
utho
risat
ion/
Site
Var
iatio
n Li
cens
es fo
r CR
AM
S. T
he e
xpen
ses
incu
rred
on
dev
elop
men
t of p
roce
ss/p
rodu
ct a
nd c
ompl
ianc
e w
ith r
egul
ator
y pr
oced
ures
of U
S F
DA
and
oth
er g
loba
l hea
lth a
utho
ritie
s in
filin
g of
Abb
revi
ated
New
D
rug
App
licat
ion
(AN
DA
), M
arke
t Aut
horis
atio
n/S
ite V
aria
tion
Lice
nses
for C
RA
MS
and
MH
RA
pro
cedu
re fo
r Mar
ket A
utho
risat
ion/
Site
Var
iatio
n Li
cens
es a
re
capi
talis
ed a
nd id
entif
ied
as in
tang
ible
ass
ets
in a
ccor
danc
e w
ith A
S -
26 (
Inta
ngib
le A
sset
s). S
ome
of th
ese
inta
ngib
le a
sset
s ar
e ou
t lic
ense
d to
ove
rsea
s pa
rtie
s gi
ving
them
exc
lusi
ve/s
emi e
xclu
sive
rig
hts
to m
arke
t the
com
pany
’s p
rodu
cts
in th
e in
tern
atio
nal m
arke
ts.
The
Com
pany
has
car
ried
out a
n as
sess
men
t on
the
impa
irmen
t of t
he in
tang
ible
ass
ets
in a
ccor
danc
e w
ith A
S -
28
( Im
pairm
ent o
f Ass
ets)
. Acc
ordi
ngly
, th
e ca
rryi
ng v
alue
of t
he In
tang
ible
Ass
ets
have
bee
n re
duce
d to
the
ir re
cove
rabl
e am
ount
in t
he B
alan
ce S
heet
as
on 3
1 M
arch
201
2 an
d th
e am
ount
of
such
impa
irmen
t los
s ha
s be
en c
harg
ed to
the
Sta
tem
ent o
f Pro
fit a
nd L
oss
in a
ccor
danc
e w
ith A
S -
28.
The
rec
over
able
am
ount
is a
s pe
r th
e bi
ndin
g ou
t lic
ensi
ng/d
istr
ibut
ion
agre
emen
ts fo
r th
e re
spec
tive
prod
ucts
. In
som
e ca
ses
of S
ite V
aria
tion
Lice
nses
for
CR
AM
S, t
he C
ompa
ny h
as e
ither
term
inat
ed th
e ag
reem
ent a
nd/o
r sto
pped
man
ufac
turin
g an
d su
pply
ing
of th
e pr
oduc
ts. T
he re
lativ
e ca
pita
lised
dev
elop
men
t cos
t has
bee
n w
ritte
n of
f and
cha
rged
to th
e S
tate
men
t of P
rofit
and
Los
s du
ring
the
finan
cial
yea
r en
ded
31 M
arch
, 201
2.
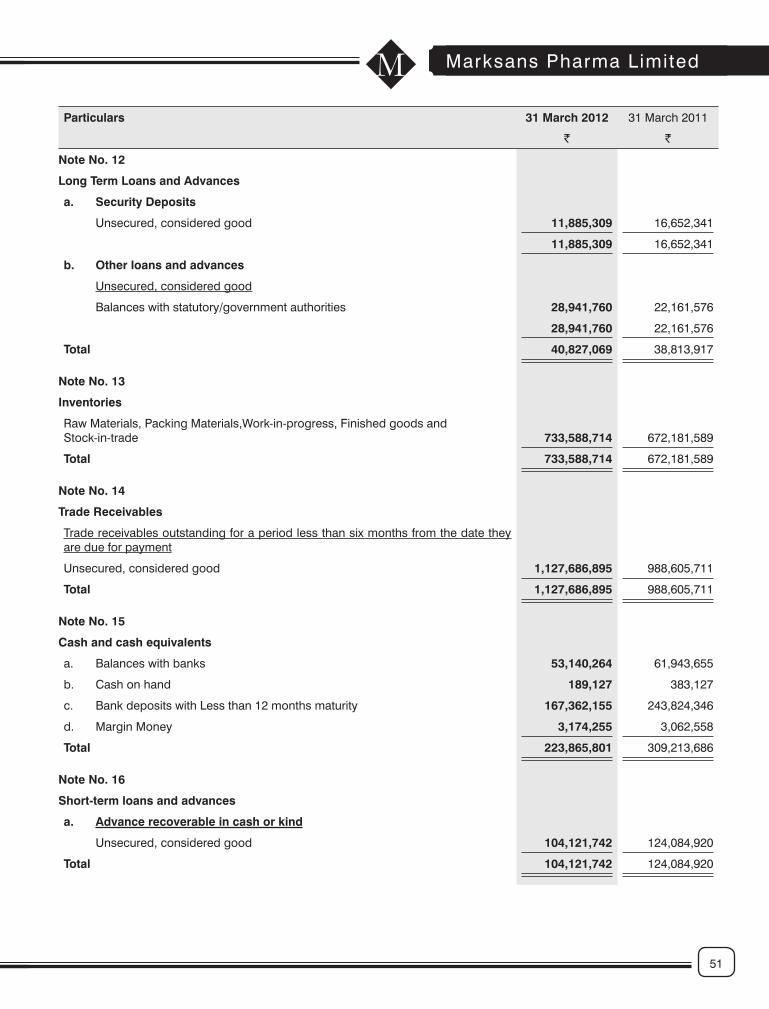
51
Marksans Pharma LimitedMParticulars 31 March 2012 31 March 2011
` `
Note No. 12
Long Term Loans and Advances
a. Security Deposits
Unsecured, considered good 11,885,309 16,652,341
11,885,309 16,652,341
b. Other loans and advances
Unsecured, considered good
Balances with statutory/government authorities 28,941,760 22,161,576
28,941,760 22,161,576
Total 40,827,069 38,813,917
Note No. 13
Inventories
Raw Materials, Packing Materials,Work-in-progress, Finished goods andStock-in-trade 733,588,714 672,181,589
Total 733,588,714 672,181,589
Note No. 14
Trade Receivables
Trade receivables outstanding for a period less than six months from the date they are due for payment
Unsecured, considered good 1,127,686,895 988,605,711
Total 1,127,686,895 988,605,711
Note No. 15
Cash and cash equivalents
a. Balances with banks 53,140,264 61,943,655
b. Cash on hand 189,127 383,127
c. Bank deposits with Less than 12 months maturity 167,362,155 243,824,346
d. Margin Money 3,174,255 3,062,558
Total 223,865,801 309,213,686
Note No. 16
Short-term loans and advances
a. Advance recoverable in cash or kind
Unsecured, considered good 104,121,742 124,084,920
Total 104,121,742 124,084,920

52
ANNUAL REPORT 2011-2012
Particulars 2011-12 2010-11
` `
Note No. 17
Revenue from operations
Sale of products 3,547,571,138 3,046,229,043
Other operating revenues 7,916,358 6,950,778
Less: Excise duty - (7,399,150)
Total 3,555,487,496 3,045,780,671
Note No. 18
Other income
Interest Income 20,253,894 17,441,030
Insurance Claim received 262,384 -
Short Term Profit on sale of Mutual Fund - 65,106
Total 20,516,278 17,506,136
Note No. 19
Cost of materials and components consumed
Cost of material and components consumed 1,178,289,208 857,112,394
Note No. 20
Changes in inventories of finished goods, work-in-progress and Stock-in-Trade
Changes in inventories of finished goods, work-in-progress and Stock-in-Trade 117,715,604 (4,533,490)
Note No. 21
Employee Benefits Expense
(a) Salaries and incentives 404,481,231 327,237,028
(b) Contributions to - Providend fund, E.S.I.C. and other fund 38,261,481 26,765,994
(c) Staff welfare expenses 14,231,659 8,558,174
Total 456,974,371 362,561,196
Note No. 22
Finance Costs
Interest expense 134,722,264 169,500,684
Others 28,991,233 30,821,729
Applicable net loss on foreign Exchange 372,040,458 236,345,028
Total 535,753,955 436,667,441
Note No. 23
Depreciation and amortization expense
Depreciation on tangible assets 50,682,345 72,094,561
Amoritization of intangible asssets 186,315,301 127,657,202
Total 236,997,646 199,751,763
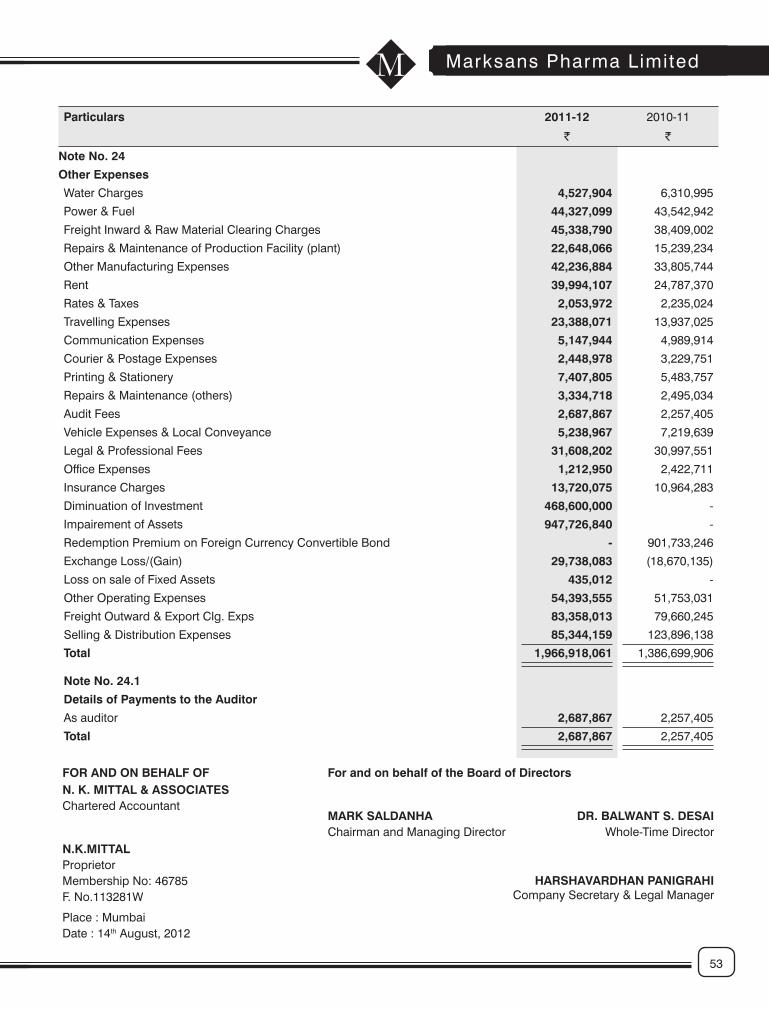
53
Marksans Pharma LimitedMParticulars 2011-12 2010-11
` `
Note No. 24
Other Expenses
Water Charges 4,527,904 6,310,995
Power & Fuel 44,327,099 43,542,942
Freight Inward & Raw Material Clearing Charges 45,338,790 38,409,002
Repairs & Maintenance of Production Facility (plant) 22,648,066 15,239,234
Other Manufacturing Expenses 42,236,884 33,805,744
Rent 39,994,107 24,787,370
Rates & Taxes 2,053,972 2,235,024
Travelling Expenses 23,388,071 13,937,025
Communication Expenses 5,147,944 4,989,914
Courier & Postage Expenses 2,448,978 3,229,751
Printing & Stationery 7,407,805 5,483,757
Repairs & Maintenance (others) 3,334,718 2,495,034
Audit Fees 2,687,867 2,257,405
Vehicle Expenses & Local Conveyance 5,238,967 7,219,639
Legal & Professional Fees 31,608,202 30,997,551
Office Expenses 1,212,950 2,422,711
Insurance Charges 13,720,075 10,964,283
Diminuation of Investment 468,600,000 -
Impairement of Assets 947,726,840 -
Redemption Premium on Foreign Currency Convertible Bond - 901,733,246
Exchange Loss/(Gain) 29,738,083 (18,670,135)
Loss on sale of Fixed Assets 435,012 -
Other Operating Expenses 54,393,555 51,753,031
Freight Outward & Export Clg. Exps 83,358,013 79,660,245
Selling & Distribution Expenses 85,344,159 123,896,138
Total 1,966,918,061 1,386,699,906
Note No. 24.1
Details of Payments to the Auditor
As auditor 2,687,867 2,257,405
Total 2,687,867 2,257,405
FOR AND ON BEHALF OF For and on behalf of the Board of DirectorsN. K. MITTAL & ASSOCIATESChartered Accountant
MARK SALDANHAChairman and Managing Director
DR. BALWANT S. DESAIWhole-Time Director
N.K.MITTALProprietorMembership No: 46785F. No.113281W
HARSHAVARDHAN PANIGRAHICompany Secretary & Legal Manager
Place : MumbaiDate : 14th August, 2012

54
ANNUAL REPORT 2011-2012
Statement of Consolidated Cash Flow for the period ended as on March 31, 2012(Amount in `)
Particulars For the period ended as on31.03.2012 31.03.2011
A. Cash Flow From Operating ActivitiesProfit/(Loss) After Tax (1,788,397,273) (2,232,444,436)Adjustments to reconcile profit before tax and prior perioditems to cash provided by operations:Depreciation 236,997,646 199,751,763 Impairment of assets 947,726,840 - Preliminery & Deferred Revenue Expenses Written off 130,796 1,921,016 Exchange Fluction Reserve (58,295,371) (29,759,419)Loss on sale of Business/Fixed Assets 435,012 802,168,180 Interest Expense 134,722,264 169,500,684 Interest Receipt (20,253,894) (17,441,030)Operating Profit before working capital changes (546,933,980) (1,106,303,242)Movements in working capital :(Increase)/Decrease Inventories (61,407,125) 373,043,082 (Increase)/Decrease Trade and other receivables (139,081,184) (41,427,856)(Increase)/Decrease loans and advances 17,950,027 48,350,767 Deferred Tax Assets/Liability (26,501,247) 35,018,795 Minority Interest 31,046,567 15,976,791 Increase/(Decrease) in Trade Payable and Short term provisions 101,962,952 24,989,552 Net cash used in operating activities (622,963,990) (650,352,111)
B. Cash Flow provided by (used in) Investing Activities:(Purchase)/Sale of Business/Fixed Assets (52,796,943) 129,381,202 Investment - 100,000,000 Interest Receipt 20,253,894 17,441,030 Net Cash used in Investing Activities (32,543,049) 246,822,232
C. Cash Flow provided by (used in) Financing Activities:Increase in Equity Share Capital - 1,333 Increase in Share Premium - 43,578 Increase in General Reserve 339,699,267 - Increase in Capital Reserve 468,600,000 - Money received against share warrants 11,565,500 - Dividend Paid (2,691,690) -Proceeds/(Repayment) of Short Term and Long Term Borrowings (112,291,659) 527,192,120 Interest Expense (134,722,264) (169,500,684)Net cash provided by Financing Activities 570,159,154 357,736,347 Net Increase /(Decrease) in Cash and Bank Balances (85,347,885) (45,793,532)
Cash & Bank Balances as at 31.03.2011 309,213,686 355,007,218 Cash & Bank Balances as at 31.03.2012 223,865,801 309,213,686
(85,347,885) (45,793,532)Notes :1 The Cash Flow Statement has been prepared under the “Indirect Method” as set out in Accounting Standard - 3 on Cash Flow Statements
issued by the Institute of Chartered Accountants of India. . 2 The Previous year’s figures have been regrouped wherever necessary in order to conform to this year’s presentation.
FOR AND ON BEHALF OF For and on behalf of the Board of DirectorsN. K. MITTAL & ASSOCIATESChartered Accountant
MARK SALDANHAChairman and Managing Director
DR. BALWANT S. DESAIWhole-Time Director
N.K.MITTALProprietorMembership No: 46785F. No.113281W
HARSHAVARDHAN PANIGRAHICompany Secretary & Legal Manager
Place : MumbaiDate : 14th August, 2012
Marksans Pharma LimitedM
ATTENDANCE SLIP
Regd Folio No. / Client & D.P. I.D. No. of Shares held
I hereby record my presence at the 20th Annual General Meeting of the Company on Thursday, the 27th September, 2012
at GMS Community Centre Hall, Sitladevi Complex, 1st Floor, D.N. Nagar, Link Road, Andheri (W), Mumbai 400 053, at
10.30 a.m.
Member(s) / Proxy Name Member(s) / Proxy Signature
FORM OF PROXY
Regd Folio No. / Client & D.P. I.D. No. of Shares held
I/We of
being a Member/Members of Marksans Pharma Limited hereby appoint
of or failing
him of as my/
our proxy to vote for me/us on my/our behalf at the 20th Annual General Meeting of the Company on Thursday, the 27th September,
2012 at GMS Community Centre Hall, Sitladevi Complex, 1st Floor, D.N. Nagar, Link Road, Andheri (W), Mumbai 400 053, at
10.30 a.m. and at any adjournment thereof.
Signed this day of , 2012
MARKSANS PHARMA LIMITEDRegd. Office : 11th Floor, Lotus Business Park, Off New Link Road, Andheri (W), Mumbai - 400 053.
MARKSANS PHARMA LIMITEDRegd. Office : 11th Floor, Lotus Business Park, Off New Link Road, Andheri (W), Mumbai - 400 053.
Affix Re. 1/- Revenue Stamp
Signature
M
M
Note: Please sign this attendance slip and hand over at the entrance of the meeting hall.


To become a fully integrated
formulation development,
manufacturing and marketing
company globally.
Health Care in Safe Hands
Mission
Vision

Book Post
ww
w.s
apprints
.com
www.marksanspharma.com