annual report 2010mock4 - Washington Risk Management ... (OTC) derivati ves, and regulati on of...
67
WASHINGTON STATE INVESTMENT BOARD TWENTY NINTH ANNUAL REPORT 2 1 0 0
Transcript of annual report 2010mock4 - Washington Risk Management ... (OTC) derivati ves, and regulati on of...

WASHINGTON STATE INVESTMENT BOARD
TWENTY NINTH ANNUAL REPORT
2
1
0
0

THIS IS THE DUMBEST THING EVER

Lett er of Transmitt al .............................................................. 5Message from the Chair ......................................................... 6Board Members and Committ ees .......................................... 6Executi ve Management and Consultants ............................... 7Partnerships .......................................................................... 8Enterprise Risk Management ............................................... 10Corporate Governance ........................................................ 11Annual Budget ..................................................................... 12
INTRODUCTION

THIS IS THE DUMBEST THING EVER

Page 5
This report describes in detail all of our portf olios, performance, operati ons and fi nance. As this past year has shown, the WSIB can and will conti nue to meet the high standards that the benefi ciaries of the funds we manage expect and deserve.
Theresa Whitmarsh, Executi ve Director
LETTER OF TRANSMITTALJune 30, 2010What a diff erence a year makes. One year ago our economy was mired in the worst recession in 75 years. Though we haven’t fully recovered from the downturn, the Washington State Investment Board (WSIB) is now being rewarded for its disciplined investment approach and diversifi ed portf olio, with returns back in the double digits.
Our commitment to our asset allocati on was affi rmed in a recent comparison of the WSIB to other public funds with assets of more than $25 billion. The WSIB’s investment performance was in the top one percent of peers for the fi ve-year period and the top 15 percent for the 10-year period, according to the Trust Universe Comparison Service (TUCS). The report also found our Fixed Income portf olio had the best investment performance of all public funds surveyed for both the fi ve- and 10-year period.
This is not an insignifi cant achievement. Recogniti on goes to our capable investment team and to the experienced professionals at all levels of the agency. The WSIB is fortunate to be served by a strong, skilled, and engaged Board that takes its fi duciary duty seriously. This Board disti nguished itself among public funds this last year by maintaining the convicti on to stay with a sound investment strategy during a ti me when reasoned approaches were questi oned.
A maxim in business is to never waste a crisis. This economic crisis, like others, has created opportunity. The WSIB is acti vely pursuing bett er fee alignment with private equity partners using the Internati onal Limited Partners Associati on framework as a guide, and has had some signifi cant successes. We have also taken advantage of the economic downturn and subsequent slowdown in deal fl ow to re-analyze and streamline our investment portf olio. We developed a more comprehensive risk protecti on system and used the disrupti on in the labor market to add talented new staff to our already accomplished team. We’re well positi oned to move quickly on the inevitable opportuniti es that arise aft er periods of economic contracti on.
We have also worked this year with other public funds to encourage federal offi cials to adopt the most comprehensive overhaul of fi nancial regulati ons since the Great Depression. The WSIB was invited along with other public fund representati ves last year to meet with senior White House and Treasury offi cials to discuss investor perspecti ves on a number of regulatory issues. Our prioriti es and concerns ranged from corporate governance, system risk, disclosures about over-the-counter (OTC) derivati ves, and regulati on of credit rati ng agencies to pension fund oversight. Many of our recommendati ons were incorporated in the fi nal legislati on.
Ther
esa
W
hitmarsh, Executive Director

Page 6
BOARD MEMBERS & COMMITTEESMESSAGE FROM THE CHAIR
Jam
es L
. McIntire, State Treasurer, V
ice Chair
Mason A. Petit
Ste
ve R
. Hill
Judi Owens
Mike Ragan
Senator Lisa Brown
Jeffrey T. Seely
David Nierenberg
Rich
ard Muhlebach
Will
iam
A. L
ongbrake
Repr
esen
tativ
e Sharon Tomiko S
antos
Robert S. Nakahara, CPA
Ju
dy Schurke
George Masten
I am pleased to report that investment returns for the pension and other public funds managed by the WSIB are steadily moving back into positi ve territory. The rate of return for the state’s reti rement Commingled Trust Fund (CTF) ended fi scal year 2010 at 13.2%.
In ti mes of crisis, there is a tendency among investment managers to second guess themselves and change their long term strategies at the worst possible ti me. I am grati fi ed to report that our Board members and WSIB staff held fi rm to their beliefs and convicti ons and the result is that now our fund benefi ciaries are being rewarded with ever improving performance.
I believe the WSIB’s reputati on for integrity, transparency, and good judgment is one of the best in the industry. We are viewed as a leader by our peers and other investment experts. Other funds routi nely look to us for informati on on how they might develop and incorporate our risk analysis, research, and other investment tacti cs into their management practi ces and programs. Our governance structure, with its strict confl ict of interest policies, promote the highest standards of ethical conduct which keeps the WSIB out of the headlines for questi onable investment schemes and acti viti es. Our travel, accounti ng, and contract compliance programs are thoroughly investi gated each year by the State Auditor’s Offi ce and we are now realizing 18 consecuti ve years of clean audit reports with absolutely no fi ndings.
Much of the credit for that impeccable and noteworthy record goes to the incredible dedicati on and excellence of the WSIB’s staff . Speaking for them and all of us who serve on the Investment Board, it is a great honor to help the teachers, fi refi ghters, law enforcement offi cers, and other public employees to grow their reti rement savings which, in turn, will contribute to a healthier economy and bett er quality of life for all Washington citi zens.
Pat McElligott , Chair
The WSIB is an independent board of trustees whose fi duciary responsibility is to manage reti rement and public fund investments with the highest standard of professional conduct. The Board’s primary investment objecti ve is to maximize returns at a prudent level of risk for the exclusive benefi t of fund parti cipants and benefi ciaries. Individual Board members are appointed by the Chair to serve on any of the Board’s four diff erent committ ees to more effi ciently analyze investment and governance issues. Committ ee recommendati ons are brought to the Board for considerati on and a vote.
Administrati ve Committ eeThe Administrati ve Committ ee oversees organizati onal, personnel, budget, legal, and legislati ve issues, as well as strategic asset allocati on.
Audit Committ eeThe Audit Committ ee nominates candidates for the non-voti ng members, develops and monitors the Board’s Confl ict of Interest Policy, reviews performance-reporti ng and audit requirements, and deals with corporate governance policies and issues.
Private Markets Committ eeThe Private Markets Committ ee develops policy and structure for private market and real estate opportuniti es and reviews those investments for recommendati ons to the Board.
Public Markets committ eeThe Public Markets Committ ee develops policy and structure for public market investments (fi xed income, domesti c equity, internati onal equity) and reviews individual equity managers to recommend to the Board.
Pa
t Mcelligott, Chair

Page 7
EXECUTIVE MANAGEMENT AND CONSULTANTSTHERESA J. WHITMARSH - EXECUTIVE DIRECTORAppointed in 2009The WSIB’s executi ve director is appointed by the Board to oversee the staff , develop and recommend agency and investment policies for Board adopti on, and ensure adherence to state policies and laws.
GARY BRUEBAKER, CFA, CPA - CHIEF INVESTMENT OFFICERAppointed in 2001The Investment Division is comprised of investment professionals who manage investments in major asset classes including public equity, private equity, real estate and fi xed income. The division is also served by a senior investment offi cer who develops asset allocati on and risk budgeti ng strategies. The division deploys both internal and external investment management strategies.
VICTOR MOORE - CHIEF OPERATIONS OFFICER/CHIEF FINANCIAL OFFICERAppointed in 2010The Operati ons Division provides a number of services in support of the investment functi on, including trade sett lement, cash management, private market funding, cash and stock distributi ons, foreign and domesti c tax matt ers, and investment compliance monitoring. It provides agency-wide risk management, informati on systems management, human resources, and administrati ve services.
LIZ MENDIZABAL - PUBLIC AFFAIRS DIRECTORAppointed in 2003Public Aff airs manages duti es typically found in a client services division of an investment management agency including performance reporti ng, annual report preparati on, and corporate governance. In additi on, the division manages functi ons unique to a public pension fund, including legislati ve aff airs, media, enquiries, and consti tuent communicati ons.
STEVE LERCH - RESEARCH DIRECTORAppointed in 2006The Research Director is responsible for internal research and educati on on investment risk, new investment strategies, Board educati on sessions, and special studies. In additi on, the Research Director serves as the business lead for the data warehouse project and team lead or member on strategic initi ati ves related to enterprise risk management, collaborati ons with other pension plans, and currency management.
INVESTMENT ACCOUNTING DATA SYSTEMFinancial Control Systems
MASTER CUSTODIAN BANKJPMorgan Chase
INSURANCE PORTFOLIO CONSULTANTConning Asset Management
GENERAL & SPECIALTY CONSULTANTSAksia LLC Holland Park Risk Management Inc.
Albourne America LLC Mercer Investment Consultants
Callan Associates Pension Consulti ng Alliance
Cutt er Associates, Inc. R.V. Kuhns & Associates Inc.
Ennis Knupp & Associates
LEGAL SERVICESAllen Matkins Leck Gamble Mallory and Natsis
Paul Hasti ngs
Cox, Castle, & Nicholson Proskauer Rose
Davis Wright Tremaine Robbins Geller Rudman and Dowd
Foster, Pepper & Shefelman Song Mondress
Goodwin Procter Torys
K & L Gates Washington Att orney General
Orrick
PRIVATE EQUITY CONSULTANTCapital Dynamics, Inc.
REAL ESTATE AND TANGIBLES CONSULTANTCourtland Partners

Page 8
PARTNERS AND FUND MANAGERSPrivate Equity PartnersAccel Partners El Dorado Ventures Insight Venture Partners Rice, Sangalis, Toole & Wilson
Advent Internati onal Elevati on Partners Intersouth Partners Richland Venture Partners
Affi nity Equity Partners Endeavour Capital InterWest Partners Silver Lake Partners
Alta Communicati ons Essex Woodlands JLL Partners Spark Management Partners
Ampersand Ventures Evercore Capital Partners JMI Equity Spectrum Equity Investors
Apax Partners Evergreen Pacifi c Partners Kohlberg Kravis Roberts & Co. Sprout Group
Apex Investment Partners First Reserve Corp. KPS Investors Swander Pace Capital
Austi n Ventures Fisher Lynch Capital KSL Capital Partners TA Associates
Avenue Capital Group Flagship Ventures Leonard Green & Partners Tailwind Capital Partners
Banc Funds Fortress Investment Group M/C Venture Partners Technology Crossover Ventures
Batt ery Ventures FountainVest Partners Madison Dearborn Partners Three Arch Partners
BC Partners Francisco Partners MatlinPatt erson Global Advisors TPG Partners
Blackstone Group Frazier & Co. Menlo Ventures Trident Capital Partners
Boston Ventures Geocapital Partners Mobius Venture Capital Triton Partners
Bridgepoint Capital GGV Capital Morgan Stanley Venture Partners TSG Capital Group
Butler Capital Partners Gilbert Global Equity Partners New Enterprise Associates U.S. Venture Partners
Canaan Partners Great Hill Partners Nordic Capital Union Square Ventures
Capital Resource Partners Green Mountain Partners Oak Investment Partners Unitas Capital
CDH Investments Gryphon Investors Oaktree Capital Management VantagePoint Venture Partners
Charterhouse Capital Partners GTCR Olympus Partners Värde Partners
Cinven Ltd. H.I.G. Ventures OVP Venture Partners Vestar Capital Partners
Clayton Dubilier & Rice HarbourVest Partners Palamon Capital Partners Vision Capital
Code, Hennessy & Simmons Healthcare Ventures Permira Advisors Vivo Ventures
Collison, Howe and Lennox Hellman & Friedman Polaris Venture Partners Warburg Pincus LLC
Cypress Group Heritage Partners Prism Venture Partners Welsh Carson Anderson & Stowe
Doughty Hanson & Co. Indigo Capital Partners Providence Equity Partners Worldview Technology Partners
Edgewater Funds

Page 9
Real Estate PartnersCherokee
Corporate Properti es of the Americas
Emerging Markets Fund of Funds
Evergreen Investment Advisors
Fillmore Capital Partners
Global Co-Investment
Hometown America
Hudson Advisors
Morgan Stanley
Pacifi c Realty
PBSC Holdings
Principal Enterprise Capital
Prosperitas
Terramar Retail Centers
Warburg Pincus
Washington Holdings
Public Equity Fund ManagersAberdeen Asset Management PLC JPMorgan Asset Management, Inc.
Arrowstreet Capital, L.P. Lazard Asset Management LLC
Arti o Global Investors LSV Asset Management
BlackRock Insti tuti onal Trust Company Mondrian Investment Partners Ltd.
Capital Guardian Trust Co. Pyramis Global Asset Trust Co.
Capital Internati onal, Inc. State Street Global Advisors
Grantham, Mayo, Van Ott erloo & Co. LLC Trilogy Global Advisors PLC
Investec Asset Management Limited William Blair & Co.
Overlay ManagerRussell Investments
Tangibles PartnersAlinda
Campbell Group
Highstar
Sheridan

Page 10
FRAMEWORKA cornerstone of a successful investment strategy is eff ecti ve risk management. Enterprise Risk Management (ERM) is intended to manage risk in the broadest possible terms, encompassing all forms of acti vity across the enti re agency. The WSIB’s enterprise-wide approach to risk management includes involvement of the Board, executi ve management, audit, operati onal, legal, and investment staff .
Managing the AssetsRisks arise from the deployment of the assets under our management in a fi ercely competi ti ve environment. Thus the WSIB needs to comply with the standards that a prudent investor would use to manage the assets of others, as well as with the laws of the state of Washington and Board investment policies. The WSIB has identi fi ed two primary risks for managing assets as fi duciary risk and market risk.
Fiduciary Risk Market Risk
Managing the OrganizationThese risks stem from building and maintaining an organizati on that is best suited to managing this investment eff ort. Our organizati on must operate within a governmental framework while implementi ng investment management strategies that are more closely aligned with private investment enti ti es. The WSIB has identi fi ed three risks under this theme which are strategic, governmental environment, and operati onal.
Strategic Risk Governmental and Environmental Risk Operati onal Risk
Safeguarding Our ReputationReputation RiskThe WSIB must maintain its reputati on in order to be a sought aft er partner in the market place, a trusted fi duciary by stakeholders and the legislature, and a valued resource for the citi zens of Washington state. Failure in any of these prior fi ve risk categories will damage the WSIB’s reputati on and its credibility, and make it diffi cult, if not impossible, to achieve the goals of its consti tuents. The agency has dedicated resources focused on coordinati ng and monitoring communicati ons for the agency. The Board has also adopted rigorous codes of conduct and confl ict of interest policies to ensure that its acti ons meet the most stringent standards and review. Ongoing educati on and informati on assist the Board members to make informed decisions. This enables the WSIB to promote and protect our reputati on.
ENTERPRISE RISK MANAGEMENT

Page 11
CORPORATE GOVERNANCEThe WSIB believes a strong, focused corporate governance program is an important part of managing and protecti ng pension fund assets. Through acti ve support of corporate governance reforms and prudent voti ng of company proxies, the WSIB works to enhance shareowner value and support our long-term investment objecti ves.
The economic crisis made clear the need for long overdue reform of U.S. fi nancial regulati ons. The result was the most sweeping set of legislati ve mandates aimed at protecti ng investors since the Great Depression. The Dodd-Frank Wall Street Reform and Consumer Protecti on Act expands the authority of existi ng regulators, closes gaps in fi nancial regulati on and enhances corporate governance at all U.S. public companies. The WSIB supports many of the corporate governance reforms contained in the new law, including:
Allowing shareowners to nominate candidates to serve on corporate boards; Giving shareowners an advisory vote on executi ve compensati on commonly referred to as “say-on-pay;”and, Requiring disclosure of whether a company has separate CEO and chair positi ons.
The WSIB believes our goal to maximize investment returns includes vigilant oversight of the way companies in which we invest are managed. As a long-term investor, the WSIB doesn’t have the opti on of selling its shares if it doesn’t like the way a company is performing. Therefore, acti ve parti cipati on is a necessity.
Between July 1, 2009 and June 30, 2010, the WSIB voted 3,538 proxy ballots. Proxy votes were cast on 25,558 individual proposals dealing primarily with electi on of directors, rati fi cati on of auditor, compensati on plans, and shareowner proposals.
Of the total director votes during that ti me period, the WSIB withheld – or voted against – more than 3,000 incumbent directors, largely because of lack of board independence or unreasonably generous compensati on practi ces. The WSIB’s policy states that “Executi ve compensati on should be linked directly with performance of the business the executi ve is charged with managing.”
In line with that commitment, the WSIB: Voted against 33 percent of the compensati on plans proposed. Voted against 550 compensati on committ ee members for paying excessive compensati on. Voted in favor of 59 proposals to give shareowners an advisory vote on executi ve compensati on plans.
As one of the country’s largest insti tuti onal investors, the WSIB the proxy voti ng ballot is one of the most eff ecti ve ways to infl uence greater board transparency, integrity, and accountability.

Page 12
OBJECTS OF EXPENDITUREAPPROPRIATED Budget Expenditures Budget VarianceSalaries 7,869,476$ 7,251,863$ 617,613$ Benefits 1,676,200 1,565,687 110,513 Personal Service Contracts 310,800 104,088 206,712 Goods & Services 2,934,978 2,376,647 558,331 Travel 914,800 338,500 576,300 Equipment 140,000 204,693 (64,693) Treasury Note 114,328 114,328 - Subtotal Appropriated 13,960,582$ 11,955,806$ 2,004,775$ *
NON-APPROPRIATED Budget Expenditures Budget VarianceU.S. Equity 9,077,205$ 1,923,514$ 7,153,691$ International Equity 51,771,171 31,945,340 19,825,831 Private Equity 179,476,480 177,784,275 1,692,205 Real Assets 52,368,990 45,742,912 6,626,078 Innovation Portfolio 12,200,000 3,233,599 8,966,401 General Consultants 2,457,940 883,652 1,574,288 Advisory Services Consultants 4,000,000 - 4,000,000 Legal Fees 1,239,550 188,124 1,051,426 Custodian Bank Fees 1,295,120 773,335 521,785 Securities Lending 17,600,060 6,197,912 11,402,148 Cash Management 2,612,850 1,288,342 1,324,508 Cash Overlay 500,000 521,481 (21,481) Directed Brokerage 100,960 40,249 60,711 Investment Acctg Data System 1,249,500 1,145,348 104,152 Telecommunications - 379 (379) Memberships 95,200 77,023 18,177 Research Services 2,788,654 1,940,658 847,996 Subtotal Non Appropriated 338,833,680 273,686,143 65,147,537 TOTAL 352,794,262$ 285,641,949$ 67,152,312$
* The Balance will be carried forward to fiscal year 2011 since we are granted a biennial appropriation
WSIB ANNUAL BUDGETJune 30, 2010

Plans Under Management ................................................... 15Other Plans Under Management ......................................... 18
INVESTMENTS

THIS IS THE DUMBEST THING EVER

Page 15
RETIREMENT FUNDSTo more effi ciently manage investments, reduce administrati ve costs, and minimize investment fees, the defi ned benefi t reti rement fund assets are pooled into the Commingled Trust Fund (CTF). Over the past 10 years, the fund has grown from $42.9 billion to $52.7 billion including employer and employee contributi ons, plus net investment returns, less benefi t payments and fund transfers (this does not include Plan 3 self-directed defi ned contributi on funds).
The WSIB measures fund performance by comparing the performance of investment returns of each asset class in the CTF to appropriate benchmarks. Although quarterly and yearly returns change, our long-term realizati ons should meet or exceed the 8.0% actuarially assumed rate of return.
It is important to remember that individual asset classes diff er in their behavior and volati lity from one year to the next. The fair market value of most public market investments can be determined and priced instantly. However, real estate and private equity investments are very illiquid and not easily priced, so it may take years before expected returns are apparent and realized.
STRATEGIC ASSET ALLOCATIONStrategic asset allocati on is the process of selecti ng a mix of asset classes, such as stocks and bonds, and determining their proporti ons within an investment portf olio. Asset allocati on decisions account for nearly 92% of the variati on between returns on diff erent portf olios and it is oft en considered to be the most important driver of investment performance. Portf olio assets are diversifi ed to help off set declines in any one class, smooth out marketplace ups and downs, and reduce overall investment risk.
The CTF is invested in six basic asset classes: global equity, global fi xed income, private equity, real estate, tangible assets, and cash. The Board establishes long-term policy targets for each asset class and also sets acceptable ranges within which those targets can vary. The WSIB formally reviews its strategic asset allocati ons at least every four years.
Highlights The Board reviewed the allocati on for the CTF in
2009 and made no changes.
FIXED INCOMEThe fi xed income program for the CTF is acti vely managed by WSIB staff against a performance benchmark of the Barclays Universal Index.
The main sectors in the portf olio are U.S. treasury securiti es, U.S. treasury infl ati on protecti on securiti es (TIPS), credit bonds, mortgage backed securiti es (MBS), collateralized mortgage obligati ons (CMO), asset-backed securiti es (ABS), and commercial mortgage-backed securiti es (CMBS).
During fi scal year 2010, $1.1 billion in cash was moved out of the portf olio. In that same ti me period, the yield on the 10-year treasury went from 3.54% to 2.93%, hitti ng a high of 3.99% in April 2010 and a low of 2.93% as of June 30, 2010.
Highlights The portf olio outperformed the Barclays Universal
Index for the year, returning 12.47% vs. 10.60% for the Universal Index.
Treasuries, agencies, mortgages, and ABS were underweighted for the portf olio, while TIPS, CMO, CMBS and credits were overweighted.
Transacti ons totaled $2.2 billion in sales and $3.0 billion in purchases.
TANGIBLE ASSETSThe tangible asset portf olio primarily targets investments in the infrastructure, natural resource rights (such as oil and natural gas), and ti mber. Each of these sectors has diff erent return att ributes and, thus, provides diversifi cati on benefi ts to the overall CTF portf olio.
Like the real estate program, the WSIB’s tangible asset program is primarily focused
PLANS UNDER MANAGEMENTon creati ng high-quality, long-term, stable income streams for the CTF. The majority of these externally-managed partnerships focus on income generati on as their primary goal which, when combined with the potenti al upside from appreciati on, generate returns that are expected to fall between performance expectati ons for fi xed income and equiti es. In general, appreciati on is targeted to be approximately commensurate with infl ati on.
The tangible asset program was established in 2008. Over ti me, we expect to create a well-diversifi ed, global tangible asset portf olio with a variety of partners spread among the target sectors noted above, each with their own investment style and geographic diversifi cati on.
Highlights Although this asset class is sti ll relati vely new,
investment performance for the past two years is largely encouraging.
Returns for FY 2010 were 10.10%
REAL ESTATE The WSIB’s real estate program focuses on creati ng high-quality, long-term, stable income streams for the CTF. Our partnership investments target risk-adjusted returns consistent with our long-term expectati ons for the
$42.9$39.0$38.8
$43.5$47.5
$53.8$63.9
$62.2$47.6
$52.7
2001200220032004200520062007200820092010
CTF Historical Market Values (Billions)

Page 16
asset class. The majority of these externally-managed partnerships invest in properti es leased to third parti es. The steady income from lease payments, combined with potenti al appreciati on, generate returns that are expected to fall between performance expectati ons for fi xed income and equiti es over the long term.
Many of the WSIB’s real estate partnerships do not involve co-investment with other fi nancial investors. This provides us with superior governance provisions related to acquisiti on, dispositi on, and annual business planning processes. The majority of our partners own real estate assets as private market investments, so they are bett er able to withstand the potenti al volati lity of the public markets. Capital is widely diversifi ed among a variety of partners, each with their own investment style, and real estate assets are geographically diversifi ed, including outside the U.S. Investments are made in a variety of property types to provide further diversifi cati on. Finally, diversifi cati on is enhanced by our partners investi ng at diff erent points in the real estate capital structure and at diff erent ti mes in the property life cycle. These varying kinds of diversifi cati on provide a degree of stability within a cyclical investment class.
The excepti onal disrupti on of global credit markets starti ng in late 2008 has dramati cally impacted the value of real estate investments across the globe over the past two years. The sharp appreciati on in commercial property values in prior years violently reversed course and most property types have seen declines of more than 30% in value from their peak. While the WSIB fared bett er than many other investors, some WSIB holdings were strongly impacted. The majority of the WSIB’s Real Estate portf olio is performing relati vely well given challenging market conditi ons and conti nues to produce att racti ve income yields—the primary goal of the program. The importance of having a long-term investment horizon is evident in the att racti ve returns for the real estate portf olio over a ten-year period.
Many real estate experts and researchers believe the worst of this down cycle is behind us. While this may be the case from a valuati on standpoint, our view is that returns are likely to be tepid at best over the next two years, as expiring leases are re-writt en with terms refl ecti ve of the current market weakness. Additi onally, a considerable overhang of commercial mortgages needing to be refi nanced in the next several years
is present, which has the potenti al to impact values negati vely. Not all the news is negati ve, however, as some markets—parti cularly in Asia—have rebounded more quickly than those in the Americas and Europe.
Because the WSIB is a well-capitalized, long-term investor, we are able to pati ently work through the current challenges, and our partners have begun to acquire high-quality property at att racti ve valuati ons in this environment. This bodes well for the long-term returns from the asset class.
Highlights For the one-year period ending June 30, 2010,
the portf olio was down slightly but outperformed the Nati onal Council of Real Estate Investment Fiduciaries (NCREIF) Index, earning -3.82% versus -9.60% for the index.
The ten-year return for the WSIB’s real estate portf olio was 9.17% versus 7.12% for the NCREIF index. This also exceeded the WSIB’s return benchmark for real estate, which is 8.00% over a rolling ten-year period.
The strongest drivers of the good long-term returns were the WSIB’s investments in real estate operati ng companies (REOCs) and geographic diversifi cati on, parti cularly outside the U.S.
PUBLIC EQUITYThe public equity program uses a global benchmark, the Dow Jones Global Total Stock Market Index, refl ecti ng the globalizati on of capital markets. The program is being restructured but currently the public equity portf olio in the CTF remains a combinati on of separate U.S. and internati onal components.
Because U.S. equity markets are generally effi cient, all of the WSIB’s domesti c equity investments are in a low-cost, broad-based passive index fund. We believe that effi ciency in internati onal equity markets is increasing so the WSIB’s developed markets internati onal equity program has increased its use of passive strategies, but the majority of the program remains in acti ve mandates. The enti re emerging markets equity program is acti vely managed.
During the year, the enhanced indexing program was disconti nued and the funds were reallocated to passive. Additi onally, the allocati on to emerging markets was increased. These markets have higher growth and are in bett er fi scal shape than the developed nati ons. As a result of the change, the WSIB hired three additi onal emerging markets managers. The weight in emerging markets is approximately equal to the Dow Jones Global Total Stock Markets Index.
Furthermore, in a world in which American companies like Coca-Cola get most of its revenue from overseas and many so-called foreign companies operate mainly in the U.S., disti ncti ons between “U.S. stocks” and “internati onal stocks” have become increasingly blurred. The WSIB believes that the future success of the program depends on investment managers fi nding the most att racti ve stock opportuniti es wherever they are in the world. During FY 2010 staff launched a search to identi fy and select global or internati onal managers with a strong preference for integrated global (U.S. and internati onal) equity strategies.
Volati lity in equity markets conti nued around the globe in FY 2010. Early on, equity markets staged a strong recovery from the lows of the previous year, but in the second quarter concerns about the sustainability of the recovery caused signifi cant pull-backs. Nonetheless, the WSIB’s global equity markets program posted a positi ve return of 13.52%.
Highlights The U.S. equity program slightly outperformed
its benchmark with a return of 16.38% versus the benchmark’s 16.15% return.
The developed internati onal equity program outperformed signifi cantly with a return of 9.54% versus the benchmark at 7.98%
The emerging markets equity program lagged the benchmark slightly with a return of 24.19% versus the benchmark at 24.57%
The CTF was underweight emerging markets equity most of the year unti l the new emerging markets managers were selected and funded in March/April 2010.

Page 17
PRIVATE EQUITYAs of June 30, 2010, the private equity portf olio was valued at $13.6 billion, or approximately 25.7% of the CTF, compared with $10.4 billion and 21.9% at the previous fi scal year-end. The increase in the portf olio’s value refl ects the mark-to-market of underlying portf olio companies to refl ect increasing multi ples, due primarily to the strong rebound in public market comparables during the year.
Private equity fund-raising remained diffi cult during the fi scal year as many investors conti nued to have concerns about allocati on capacity, liquidity, and the prospects for economic recovery. The pace of investi ng began to pick up modestly as fi nancing markets began to recover, although acti vity levels were sti ll relati vely low by historical standards. Exits from existi ng portf olio company holdings also began to increase, due in part to very strong public equity markets, which allowed some companies to achieve liquidity through initi al public off erings (IPO’s) or secondary sales. Prospects for selling companies to strategic buyers and other fi nancial sponsors also improved during the year.
The WSIB conti nues its focus on building a well-diversifi ed portf olio of high quality partnerships. During the year, the Board adopted a model portf olio for private equity, designed to manage risk and increase expected returns through a more balanced general partner allocati on, a more diversifi ed strategy compositi on, and a more global geographic mix.
Highlights $0.9 billion in net new commitments to funds were
closed during FY 2010 compared to $2.2 billion in FY 2009.
$2.0 billion of committ ed capital was drawn for investment during the year compared to $1.9 billion in the prior year.
$1.5 billion in distributi ons were returned to the WSIB compared with $0.7 billion in FY 2009.
INNOVATION PORTFOLIOThe primary investment strategy of the Innovati on portf olio gives staff the ability to make investments that fall outside the traditi onal asset classes currently used by the Board. Secondly, this portf olio provides the Board with comfort and demonstrated success before committi ng large dollar amounts to diff erent investment strategies.
Highlights Mezzanine debt was added in FY 2009 and initi ally
funded in FY 2010. Global equiti es is the only other investment in the
portf olio and had no additi onal funding in FY 2010.

Page 18
objecti ve is to protect current income and preserve principal. The Savings Pool is a diversifi ed portf olio of guaranteed investment contracts (GICs) and short-term cash funds.
LABOR AND INDUSTRIES' FUNDS$12.0 BillionThe WSIB manages Industrial Insurance funds on behalf of the Department of Labor and Industries (L&I). The L&I portf olio consists of four separate funds.
The Accident Fund primarily pays disability benefi ts. The Medical Aid Fund pays for services required by
injured workers and L&I administrati ve costs. The Pension Reserve Fund is maintained by transfers
of money from the Accident Fund at the ti me that a new pensioner is setup.
The Supplemental Pension Fund supplements ti me loss and compensates for cost-of-living increases.
PERMANENT FUNDS$861.0 MillionThe Permanent Funds are non-expendable trusts. The principal for each fund remains intact and investment earnings, less expenses, are reinvested or distributed to a benefi ciary fund. Five of these funds were established through federal government land grants to help Washington’s schools and colleges with bond repayment, capital development, and faciliti es maintenance. The Department of Natural Resources transfers proceeds from the sale of land and ti mber to the WSIB for investment purposes. Fund proceeds are invested in fi xed income and short-term holdings, with the excepti on of the Common School Fund, which is also invested in the U.S. Equity Market Index Fund.
OTHER FUNDS$116.6 MillionThese funds were created by the Legislature to fund various mandates and can be liquidated as needed. These funds are invested by the WSIB unti l they are completely liquidated or closed by legislati on.
GUARANTEED EDUCATION TUITION FUND$1.4 BillionThe Guaranteed Educati on Tuiti on (GET) program allows individuals or groups to purchase state college and university tuiti on units for future use at current prices. Program administrati on is under the authority of the Committ ee on Advanced Tuiti on Payment. The WSIB serves as trustee for the funds and invests them in a mix of short-term holdings, TIPS, U.S. Equity, and Internati onal Equity.
DEVELOPMENTAL DISABILITIES ENDOWMENT TRUST FUND$22.7 MillionThe Developmental Disabiliti es Endowment Trust Fund (DDEF) supports individuals with developmental disabiliti es through private contributi ons and public appropriati ons. The WSIB invests the fund in a mix of short-term holdings, TIPS, fi xed income, and U.S. Equity.
OTHER PLANS UNDER MANAGEMENTDEFINED CONTRIBUTION RETIREMENT PLANSThe WSIB oversees the investment opti ons in Plan 3, the Deferred Compensati on Program (DCP), and the Judicial Reti rement Account (JRA). However, these programs are accounted for and reported on by the DRS. Therefore, performance informati on and the fi nancial statements are provided by DRS.
PERS 3$1.4 Billion
SERS 3$1.0 Billion
TRS 3$4.0 Billion
Deferred Compensation Program$2.4 Billion
Judicial Retirement Account$11.4 Million
DAILY-VALUED FUNDS FOR SELF-DIRECTED INVESTMENT PROGRAMSBond Market Fund $616.4 MillionThe goal of this daily-valued fund is to provide parti cipants of the self-directed defi ned contributi on reti rement plans (TRS/SERS/PERS Plan 3’s, DCP, and JRA) att racti ve returns while controlling risk by investi ng in high-quality corporate bonds. The fund is internally managed by the WSIB and is intended for those who want an intermediate-term investment designed to match or moderately exceed the returns of the Lehman Intermediate Credit Index
Savings Pool$964.6 MillionThe savings pool is intended as a conservati ve, short-term investment opportunity where the primary

FINANCIALSOverview of Financial Statements ....................................... 21Reti rement Funds ................................................................ 22Labor & Industries' Funds .................................................... 35Permanent Funds ................................................................ 43Other Funds ........................................................................ 50Guaranteed Educati on Tuiti on Fund ..................................... 55Developmental Disabiliti es Endowment Trust Fund ............. 61

THIS IS THE DUMBEST THING EVER

Page 21
This discussion and analysis serves as an introducti on to the WSIB’s basic fi nancial statements and notes to the fi nancial statements. The statements included are for the Reti rement funds, L&I Funds, Permanent Trust Funds, Other Funds, GET, and DDEF. The fi nancial statements are reported separately due to the unique goals and objecti ves for each set of funds.
BASIC FINANCIAL STATEMENTSThe basic fi nancial statements presented include the Statement of Net Assets, which reports the assets by general asset category, the Statement of Changes in Net Assets, which reports the contributi ons to, withdrawals from and investment earnings for the fi scal year ending June 30, 2010.
This year, the statements and notes were prepared by the investment accounti ng unit of the WSIB.
NOTES TO THE FINANCIAL STATEMENTSThe notes to the fi nancial statements presented are an integral part of the fi nancial statements and include additi onal informati on not readily evident in the statements themselves.
CONTACTING WSIB'S FINANCIAL MANAGEMENTThis fi nancial report is designed to provide a general overview of WSIB’s investment acti viti es.
If you have any questi ons about this report or need additi onal informati on, contact:The Washington State Investment Board2100 Evergreen Park Drive SWPO Box 40916, Olympia, WA 98504-0916
Phone: 360-956-4600Website: htt p://www.sib.wa.gov
OVERVIEW OF FINANCIAL STATEMENTS

Page 22
INDEPENDENT AUDITOR'S REPORTTo the Members of the Washington State Investment BoardOlympia, WashingtonWe have audited the accompanying statement of net assets for the Reti rement Funds (Commingled Trust Fund and Plan-Specifi c Investments) of the State of Washington as managed by the Washington State Investment Board (“the Reti rement Funds”) as of June 30, 2010, and the related statement of changes in net assets for the year then ended. These fi nancial statements are the responsibility of the Washington State Investment Board’s management. Our responsibility is to express an opinion on these fi nancial statements based on our audit.
We conducted our audit in accordance with auditi ng standards generally accepted in the United States. Those standards require that we plan and perform the audit to obtain reasonable assurance about whether the fi nancial statements are free of material misstatement. An audit includes examining, on a test basis, evidence supporti ng the amounts and disclosures in the fi nancial statements. An audit also includes assessing the accounti ng principles used and signifi cant esti mates made by management, as well as evaluati ng the overall fi nancial statement presentati on. We believe that our audit provides a reasonable basis for our opinion.
The fi nancial statements referred to in the fi rst paragraph present only the investment acti vity of the Reti rement Funds as managed by the Washington State Investment Board. The fi nancial statements do not purport to, and do not, present the fi nancial acti vity of the Washington State Investment Board or of the State of Washington.
In our opinion, the fi nancial statements referred to in the fi rst paragraph present fairly, in all material respects, the net assets of the Reti rement Funds as of June 30, 2010, and the changes in net assets for the year then ended in conformity with accounti ng principles generally accepted in the United States.
As explained in Note 1, the fi nancial statements include investments valued at $21,654,098,699 (41% of net assets), whose fair values have been esti mated by management in the absence of readily determinable fair values. Management’s esti mates are based on informati on provided by the fund managers or, in the case of investments in partnerships, the general partners. Our audit was conducted for the purpose of forming an opinion on the fi nancial statements of the Reti rement Funds. Management’s Discussion and Analysis preceding the fi nancial statements is presented for purposes of additi onal analysis and is not a required part of the fi nancial statements referred to in the fi rst paragraph. We have applied certain limited procedures, which consisted principally of inquiries of management regarding the methods of measurement and presentati on of the supplementary informati on. However, we did not audit the informati on and express no opinion on it. The introducti on secti on of the annual report has not been subjected to the auditi ng procedures applied in the audit of the fi nancial statements and, accordingly, we express no opinion on it.
/S/ PETERSON SULLIVAN LLP
October 28, 2010
CERTIFIED PUBLIC ACCOUNTANTS
601 UNION STREET, SUITE 2300
SEATTLE, WASHINGTON 98101
TEL 206.382.7777 • FAX 206.382.7777
http://www.pscpa.com
PETERSON SULLIVAN LLP
RETIREMENT FUNDS

Page 23
Management’s Discussion and Analysis for the Reti rement Funds of the state of Washington, managed by the Washington State Investment Board (WSIB), is presented as an introducti on to the fi nancial statements. It is meant to assist the reader in understanding the fi nancial statements by providing an overall review of the fi nancial acti viti es during the year as well as to provide a comparison to the prior year’s acti viti es and results. In additi on to the Reti rement Funds, the WSIB also manages funds for other state of Washington departments. This secti on of this report represents only the Reti rement Funds porti on. The Reti rement Funds are the largest investor in funds managed by the WSIB.
Following this secti on of the report are the fi nancial statements and footnotes. The Statement of Net Assets provides informati on on the types of investments and the liabiliti es of the Reti rement Funds. This informati on is summarized in Table 1. Table 1 also compares the asset, liability, and net asset balances at June 30, 2010, with those at June 30, 2009. The Statement of Changes in Net Assets provides informati on on investment performance and other increases and decreases in the net assets of the Reti rement Funds for the year ended June 30, 2010. This informati on is summarized in Table 2. Table 2 also compares the fi nancial acti viti es of the Reti rement Funds for the year ended June 30, 2010, with those of the year ended June 30, 2009. The Notes to the Financial Statements provide additi onal informati on that is essenti al to a full understanding of the data provided in the fi nancial statements of the Reti rement Funds.
As shown in Table 1, the net assets of the Reti rement Funds increased by $5.2 billion during the fi scal year ended June 30, 2010. Realized and unrealized gains within the portf olio increased net assets by $4.9 billion. All asset classes, with the excepti on of real estate, experienced positi ve investment
MANAGEMENT DISCUSSION & ANALYSIS
returns for the fi scal year, with a total fund return of 13.2 percent. Distributi ons to the reti rement system decreased net assets by $(1.1) billion. Net investment income reinvested in the portf olio increased net assets by $1.4 billion.
The following summarizes changes within each grouping listed in Table 1:
Liquid assets decreased by $(.6) billion. Cash income net of expenses reinvested in money market funds from all asset classes totaled $2.5 billion during the current fi scal year. Distributi ons to the Department of Reti rement System decreased liquid assets by $(1.1) billion. Transfers of cash to other asset classes for investment purposes totaled $(2.0) billion.
Fixed income increased by $.9 billion. Unrealized gains due to favorable market conditi ons increased this asset class by $.8 billion. As interest rates fell during the fi scal year, the price of fi xed income securiti es rose, which resulted in substanti al increases to fi xed income invested balances. Investment return for the current fi scal year for fi xed income securiti es was 12.5 percent. A decrease in fi xed income securiti es of $(.2) billion resulted from
a transfer to other asset classes. The change in net pending trades increased fi xed income by $.3 billion. The majority of this increase is current year pending fi xed income security purchases in the cash overlay program.
Equiti es increased by $2.2 billion. Unrealized gains increased invested balances by $1.2 billion due to equity market appreciati on experienced during the fi scal year. Global equity returns within the portf olio were 13.5 percent for the year ended June 30, 2010. Transfers in from other asset class totaled $.1 billion. The remaining increase of $.9 billion was due to the reinvestment of income within the equity portf olio.
Alternati ve investments increased by $2.9 billion. General partners called an additi onal $1.1 billion of capital, net of returns of capital and management fees, which increased this asset class. Net capital contributi ons were funded by $.7 billion of transfers from other asset classes and $.4 billion of income received from general partners throughout the year. Positi ve returns in all capital markets impacted private equity and tangible asset as well. The modest negati ve fi scal year end return in real estate of (3.8) percent was off set by investment returns in
TABLE 1 - SUMMARIZED NET ASSETS 2010 2009 DOLLAR CHANGE PERCENT CHANGE
Liquid Assets $1,061,656,998 $1,645,037,085 $(583,380,087) (35.5%)
Fixed Income Securites 11,758,744,355 10,889,254,491 869,489,864 8.0%
Equiti es 18,368,529,098 16,160,833,082 2,207,696,016 13.7%
Alternati ve Investments 21,654,098,699 18,798,267,278 2,855,831,421 15.2%
Total Investments 52,843,029,150 47,493,391,936 5,349,637,214 11.3%
Collateral Held Under Securiti es Lending Agreements 3,667,614,598 2,913,892,402 753,722,196 25.9%
Open Foreign Exchange Contracts Receivable 1,660,341,559 2,246,734,403 (586,392,844) (26.1%)
Other Receivables 308,314,933 582,669,089 (274,354,156) (47.1%)
Total Assets 58,479,300,240 53,236,687,830 5,242,612,410 9.8%
Obligati ons Under Securiti es Lending Agreements 3,667,614,598 2,913,892,402 753,722,196 25.9%
Open Foreign Exchange Contracts Payable 1,662,130,312 2,252,713,200 (590,582,888) (26.2%)
Other Payables 421,649,716 494,089,199 (72,439,483) (14.7%)
Total Liabiliti es 5,751,394,626 5,660,694,801 90,699,825 1.6%
Net Assets $52,727,905,614 $47,575,993,029 $5,151,912,585 10.8%
Page 24
private equity and tangible assets of 24.0 percent and 10.1 percent, respecti vely.
Collateral held and obligati ons under securiti es lending agreements increased by $.7 billion. During the prior fi scal year the Reti rement Funds ceased lending corporate bonds due to an increase in failed sale transacti ons. The Reti rement Funds conti nue to lend public equiti es and U.S. Government securiti es. The increase in collateral balances refl ects an overall increase in value of the underlying securiti es lent. In additi on, the Reti rement Funds hold Treasury and Agency securiti es which are in high demand in the lending marketplace.
Open foreign exchange contracts receivable and payable decreased by $(.6) billion. Internati onal managers had less open trades at June 30, 2010 compared to the prior year, resulti ng in less open exchange contracts to cover the sett lement currency of those trades.
Other receivables decreased by $(.3) billion and other payables decreased by $(.1) billion mainly from a decrease in open and unsett led security trades. Trading volumes can vary substanti ally based on the ti ming of additi onal cash fl ows, market movements, and rebalancing of asset classes within a portf olio. Accordingly, there is generally minimal correlati on to invested balances.
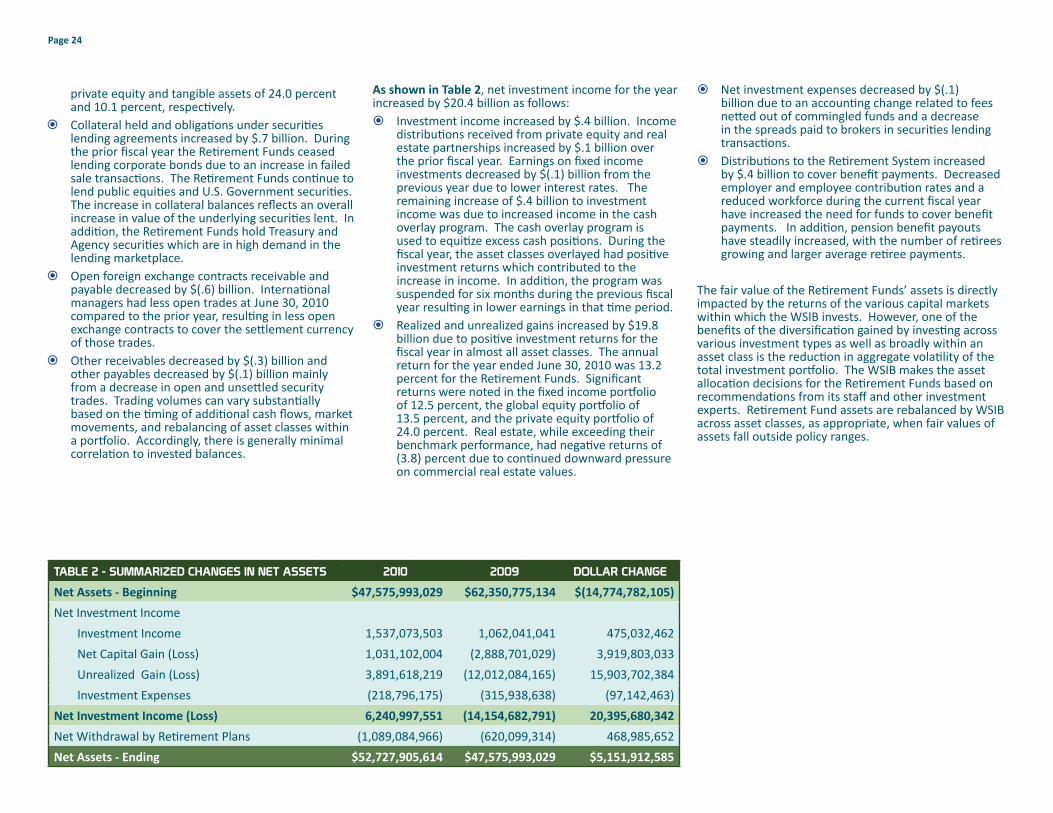
As shown in Table 2, net investment income for the year increased by $20.4 billion as follows:
Investment income increased by $.4 billion. Income distributi ons received from private equity and real estate partnerships increased by $.1 billion over the prior fi scal year. Earnings on fi xed income investments decreased by $(.1) billion from the previous year due to lower interest rates. The remaining increase of $.4 billion to investment income was due to increased income in the cash overlay program. The cash overlay program is used to equiti ze excess cash positi ons. During the fi scal year, the asset classes overlayed had positi ve investment returns which contributed to the increase in income. In additi on, the program was suspended for six months during the previous fi scal year resulti ng in lower earnings in that ti me period.
Realized and unrealized gains increased by $19.8 billion due to positi ve investment returns for the fi scal year in almost all asset classes. The annual return for the year ended June 30, 2010 was 13.2 percent for the Reti rement Funds. Signifi cant returns were noted in the fi xed income portf olio of 12.5 percent, the global equity portf olio of 13.5 percent, and the private equity portf olio of 24.0 percent. Real estate, while exceeding their benchmark performance, had negati ve returns of (3.8) percent due to conti nued downward pressure on commercial real estate values.
TABLE 2 - SUMMARIZED CHANGES IN NET ASSETS 2010 2009 DOLLAR CHANGE
Net Assets - Beginning $47,575,993,029 $62,350,775,134 $(14,774,782,105)
Net Investment Income
Investment Income 1,537,073,503 1,062,041,041 475,032,462
Net Capital Gain (Loss) 1,031,102,004 (2,888,701,029) 3,919,803,033
Unrealized Gain (Loss) 3,891,618,219 (12,012,084,165) 15,903,702,384
Investment Expenses (218,796,175) (315,938,638) (97,142,463)
Net Investment Income (Loss) 6,240,997,551 (14,154,682,791) 20,395,680,342
Net Withdrawal by Reti rement Plans (1,089,084,966) (620,099,314) 468,985,652
Net Assets - Ending $52,727,905,614 $47,575,993,029 $5,151,912,585
Net investment expenses decreased by $(.1) billion due to an accounti ng change related to fees nett ed out of commingled funds and a decrease in the spreads paid to brokers in securiti es lending transacti ons.
Distributi ons to the Reti rement System increased by $.4 billion to cover benefi t payments. Decreased employer and employee contributi on rates and a reduced workforce during the current fi scal year have increased the need for funds to cover benefi t payments. In additi on, pension benefi t payouts have steadily increased, with the number of reti rees growing and larger average reti ree payments.
The fair value of the Reti rement Funds’ assets is directly impacted by the returns of the various capital markets within which the WSIB invests. However, one of the benefi ts of the diversifi cati on gained by investi ng across various investment types as well as broadly within an asset class is the reducti on in aggregate volati lity of the total investment portf olio. The WSIB makes the asset allocati on decisions for the Reti rement Funds based on recommendati ons from its staff and other investment experts. Reti rement Fund assets are rebalanced by WSIB across asset classes, as appropriate, when fair values of assets fall outside policy ranges.

Page 25
Commingled Trust Fund Plan-Specific Investments Total Percent of Plan AssetsASSETS Investments: LIQUIDITY Money Market Funds 880,802,179$ 95,754,912$ 976,557,091$ Currency 85,099,907 - 85,099,907 Total Liquidity 965,902,086 95,754,912 1,061,656,998 2.0%
FIXED INCOME SECURITIES (U.S. DOLLAR DENOMINATED) Asset Backed Securities 188,397,863 - 188,397,863 Residential Mortgage Backed Securities 2,875,073,669 - 2,875,073,669 Commercial Mortgage Backed Securities 478,293,349 - 478,293,349 Corporate Bonds - Domestic 1,624,171,354 - 1,624,171,354 Corporate Bonds - Foreign 4,405,322,481 - 4,405,322,481 US Government Treasury Securities 1,520,937,489 - 1,520,937,489 Total Fixed Income Securities (U.S. Dollar Denominated) 11,092,196,205 - 11,092,196,205 21.0%
FIXED INCOME SECURITIES (NON U.S. DOLLAR DENOMINATED) Corporate Bonds - Foreign 666,548,150 - 666,548,150 1.3%
CORPORATE STOCK (U.S. DOLLAR DENOMINATED) Corporate Stock - Domestic 301,108,237 - 301,108,237 Corporate Stock - Foreign 358,221,380 - 358,221,380 Total Corporate Stock (U.S. Dollar Denominated) 659,329,617 - 659,329,617 1.2%
CORPORATE STOCK (NON U.S. DOLLAR DENOMINATED) Corporate Stock - Domestic 4,037,760 - 4,037,760 Corporate Stock - Foreign 7,500,356,000 - 7,500,356,000 Total Corporate Stock (Non U.S. Dollar Denominated) 7,504,393,760 - 7,504,393,760 14.2%
COMMINGLED EQUITY INDEX FUNDS Commingled Index Funds - Domestic 7,630,735,162 - 7,630,735,162 Commingled Index Funds - Foreign 2,574,070,559 - 2,574,070,559 Total Commingled Equity Index Funds 10,204,805,721 - 10,204,805,721 19.3%
ALTERNATIVE INVESTMENTS: Private Equity 13,560,127,191 - 13,560,127,191 Real Estate 7,483,583,863 - 7,483,583,863 Tangible Assets (Infrastructure, Natural Resources) 610,387,645 - 610,387,645 Total Alternative Investments 21,654,098,699 - 21,654,098,699 41.0%
Total Investments 52,747,274,238 95,754,912 52,843,029,150 100.0%
Investment Earnings Receivable 168,896,463 26,883 168,923,346 Receivables for Investments Sold 139,391,587 - 139,391,587 Open Foreign Exchange Contracts Receivable 1,660,341,559 - 1,660,341,559 Collateral Held Under Securities Lending Agreements 3,667,614,598 - 3,667,614,598 Total Assets 58,383,518,445 95,781,795 58,479,300,240 LIABILITIES Obligations Under Securities Lending Agreements 3,667,614,598 - 3,667,614,598 Investment Management Fees Payable 10,906,195 - 10,906,195 Payable for Investments Purchased 410,400,171 - 410,400,171 Open Foreign Exchange Contracts Payable 1,662,130,312 - 1,662,130,312 Due to Other Agencies - 343,350 343,350 Total Liabilities 5,751,051,276 343,350 5,751,394,626 NET ASSETS 52,632,467,169$ 95,438,445$ 52,727,905,614$
RETIREMENT FUNDS STATEMENT OF NET ASSETS - JUNE 30, 2010See notes to financial statements

Page 26
Commingled Trust Fund Plan-Specific Investments TotalNet Investment Income Investment Income: Interest, Dividends, and Other Investment Income 1,517,121,416$ 606,200$ 1,517,727,616$ Securities Lending Income 19,345,887 - 19,345,887 Realized Capital Gains 2,465,666,640 - 2,465,666,640 Realized Capital Losses (1,434,564,636) - (1,434,564,636) Unrealized Gains 3,891,618,219 - 3,891,618,219 Less: Investment Expenses (204,253,314) (208,133) (204,461,447) Securities Lending Broker Rebates Paid and Bank Fees (5,985,769) - (5,985,769) WSIB Operating Expenses (8,005,609) (343,350) (8,348,959) Net Investment Income 6,240,942,834 54,717 6,240,997,551
Net Withdrawal by Retirement Plans - (1,089,084,966) (1,089,084,966)
Investments in Commingled Funds 946,849,475 (946,849,475) - Withdrawals from Commingled Funds (1,941,758,000) 1,941,758,000 - Increase (Decrease) in Net Assets 5,246,034,309 (94,121,724) 5,151,912,585
NET ASSETS, JUNE 30, 2009 47,386,432,860 189,560,169 47,575,993,029 NET ASSETS, JUNE 30, 2010 52,632,467,169$ 95,438,445$ 52,727,905,614$
RETIREMENT FUNDS STATEMENT OF CHANGES IN NET ASSETS - YEAR ENDED JUNE 30, 2010See notes to financial statements

Page 27
NOTE 1. DESCRIPTION OF FUNDS AND SIGNIFICANT ACCOUNTING POLICIESDescription of FundsThe Reti rement Funds consist of reti rement contributi ons from employer and employee parti cipants and related earnings on those contributi ons, in the Washington state Reti rement System. The Reti rement System is administered by the Department of Reti rement Systems (DRS). The fi nancial statements present only the acti vity of the Reti rement Funds as managed by the WSIB. The WSIB has exclusive control of the investment of all money invested in the Reti rement Funds. The fi nancial statements do not present the fi nancial positi on or the results of operati ons of the WSIB or DRS.
Basis of AccountingThe accompanying fi nancial statements have been prepared in conformity with accounti ng principles generally accepted in the United States for governments prescribed by the Governmental Accounti ng Standards Board (GASB) on the accrual basis of accounti ng.
Valuation of InvestmentsInvestments are reported at fair value. Unrealized gains and losses are included as investment income in the Statement of Changes in Net Assets.
The net assets of the Reti rement Funds are valued on a monthly basis using the following sources:
Publicly Traded Securities (Corporate stock, Commingled Funds, and Fixed Income): Fair values are based on published market prices, quotati ons from nati onal security exchanges, and security pricing services as of each month end closing of the New York Stock Exchange.
Limited Partnerships: The fair value of investments that are organized as limited partnerships and have no readily ascertainable fair value (such as private equity, real estate, and tangible assets) has been determined by management based on the individual investment’s capital account balance, reported at fair value by the general partner, at the closest available reporti ng period, adjusted for subsequent contributi ons, distributi ons, management fees, and changes in values of foreign
currency and published market prices for certain securiti es.
The limited partnerships’ annual fi nancial statements are audited by independent auditors. These investments are valued at $21.7 billion (41.0 percent of total net assets) as of June 30, 2010. Because of the inherent uncertainti es in esti mati ng fair values, it is at least reasonable possible that the esti mates will change in the near-term.
Private Equity Limited Partnerships: The fair value of individual capital account balances is based on the valuati ons reported by private equity partnerships using the following methodologies to value the underlying portf olio companies:
Valuati ons of publicly traded portf olio companies are based on acti ve exchanges using quoted market prices as of the close of trading for each month-end.
When a portf olio company investment does not have a readily available market price, but has a return that is determined by reference to an asset for which a market price is readily available, valuati ons are based on the closing market price of the reference asset on the valuati on date, adjusted for factors that aff ect the fair value of the investment held.
When the portf olio company investments are private holdings and are not traded on acti ve security exchanges, valuati on methodologies used consist primarily of income and market approaches. The income approach involves a discounted cash fl ow analysis based on a portf olio companies’ projecti ons. The market approach involves valuing a company at a multi ple of a specifi ed fi nancial measure (generally EBITDA) based on multi ples at which comparable companies trade.
Real Estate Limited Partnerships: Real estate partnerships provide quarterly valuati ons based on the most recent capital account balance to WSIB management. Individual properti es are valued by the partnerships at least annually, and are adjusted as frequently as quarterly if material market or operati onal changes have occurred. Properti es are generally externally valued every one to fi ve years, depending
upon the partnership. Structured fi nance investments receive quarterly value adjustments by the partners, generally applying the assumpti on that all such positi ons will be held to maturity. Annual audits of most partnerships include a review of compliance with the partnership’s valuati on policies.
Revenue RecognitionInterest and dividend income is recognized when earned. Capital gains and losses are recognized on a trade-date basis. Purchases and sales of investments are also recorded on a trade-date basis.
Securities LendingThe Reti rement Funds record collateral received under securiti es lending agreements where the Reti rement Funds have the ability to spend, pledge, or sell the collateral without borrower default. Liabiliti es resulti ng from these transacti ons are also reported. Additi onally, costs associated with securiti es transacti ons, broker commissions paid, and lending agent management fees are reported as investment expenses in the accompanying fi nancial statements. The Statement of Net Assets does not include detailed holdings of securiti es lending collateral by investment classifi cati on.
Investments and WithdrawalsInvestments and withdrawals are recorded when received or paid.
Use of EstimatesThe preparati on of fi nancial statements in conformity with accounti ng principles generally accepted in the United States requires management to make esti mates and assumpti ons that aff ect certain reported amounts and disclosures. Actual results could diff er from the esti mated amounts.
NOTE 2. THE COMMINGLED TRUST FUND (CTF) AND PLAN SPECIFIC INVESTMENTSThe Commingled Trust Fund (CTF) is a diversifi ed pool of investments which is used as an investment vehicle for 14 separate reti rement plans, excluding the Judicial reti rement plan which is not part of the CTF. These plans hold “units” in the CTF, which represent a percentage ownership in the pool of investments. Plans are allowed
NOTES TO FINANCIAL STATEMENTS

Page 28
to purchase or sell units in the CTF, based on the fair value of the underlying assets, on the fi rst business day of each month.
In additi on to unit ownership in the CTF, each reti rement plan holds short-term investments. These short-term investments are referred to as “plan-specifi c investments” in the accompanying fi nancial statements and are used to manage the cash needs of each reti rement plan.
The CTF consists of the PERS 1 and 2/3; TRS Plans 1 and 2/3; SERS Plans 2/3; LEOFF Plans 1 and 2; WSP Reti rement Systems Plan 1 and 2; VFF, and PSERS Plan 2. The CTF includes both the defi ned benefi t and defi ned contributi on porti on of PERS Plan 3, SERS Plan 3 and TRS Plan 3, which are hybrid defi ned benefi t/defi ned contributi on plans. The parti cipants also have the opti on to invest their defi ned contributi ons in other external opti ons not managed by the WSIB.
NOTE 3. BREAKDOWN OF PLAN ASSETSThe following schedule presents the net assets broken down by ownership by the various pension plans. “DC” means “defi ned contributi on” and “DB” means “defi ned benefi t,” two diff erent types of reti rement plans.
SCHEDULE OF PARTICIPATIONRETIREMENT PLANS: Commingled Trust Fund Plan-Specific Investments Total Plan Assets Percent of Plan AssetsPERS 1 7,623,144,373$ 1,265,694$ 7,624,410,067$ 14.5%PERS 2/3 (DC and DB Plans) 17,090,257,329 31,877,543 17,122,134,872 32.5%TEACHERS 1 6,399,164,898 3,469,677 6,402,634,575 12.1%TEACHERS 2/3 (DC and DB Plans) 7,925,424,570 24,652,695 7,950,077,265 15.1%VOLUNTEER FIREFIGHTERS 122,949,027 (704) 122,948,323 0.2%LEOFF 1 4,582,803,118 2,176,019 4,584,979,137 8.7%LEOFF 2 5,048,927,202 17,171,091 5,066,098,293 9.6%SCHOOL EMPLOYEES 2/3 (DC and DB Plans) 2,989,442,748 7,662,131 2,997,104,879 5.7%STATE PATROL 1 755,118,643 596,584 755,715,227 1.4%STATE PATROL 2 7,089,034 300,835 7,389,869 TracePUBLIC SAFETY EMPLOYEES 2 88,146,227 2,700,120 90,846,347 0.2%JUDICIAL - 3,566,760 3,566,760 TraceTotal Net Assets at June 30, 2010 52,632,467,169$ 95,438,445$ 52,727,905,614$ 100.0%
NOTE 4. FEES AND EXPENSESInvestment fees and expenses are accounted for as a reducti on of investment income or are nett ed directly from the asset value of Reti rement Fund investments. These fees include investment management fees and commissions, investment consultant fees, legal fees, and other investment management related expenses and are summarized below. The WSIB operati ng expenses are charged to the funds based upon actual costs incurred to manage the investments. WSIB operati ng expenses are allocated to the funds under management based on relati ve market values, in accordance with state statutes.
SCHEDULE OF INVESTMENT FEES AND EXPENSES
NOTE 5. UNFUNDED COMMITMENTS The Reti rement Funds have entered into a number of agreements that commit the Reti rement Funds, upon request, to make additi onal investment purchases up to predetermined amounts. As of June 30, 2010, the Reti rement Funds had the following unfunded investment commitments:
Private Equity $7,589,665,972
Real Estate $7,386,663,568
Tangible Assets $481,950,877
NOTE 6. PUBLIC EMPLOYEES’ RETIREMENT SYSTEM PLAN 3, TEACHERS’ RETIREMENT SYSTEM PLAN 3, AND THE SCHOOL EMPLOYEES’ RETIREMENT SYSTEM PLAN 3The fi nancial statements only include the porti on of the PERS Plan 3, TRS Plan 3, and SERS Plan 3, which are invested in the CTF. The CTF does not include PERS Plan 3, TRS Plan 3, or SERS Plan 3 self-directed investments, which are accounted for and reported on by DRS.
EQUITY SECURITIES: Fees Paid Netted Fees * Total Fees Assets Under ManagementU.S. Active Equity Manager 437,084$ -$ 437,084$ -$ International Active Equity Managers 25,468,803 - 25,468,803 7,282,739,734 International Passive Equity Managers 1,688,645 9,152,831 10,841,476 3,027,955,340 U.S. Passive Equity Manager 999,273 529,240 1,528,513 7,630,735,162 Innovation Portfolio 2,814,849 443,551 3,258,400 427,098,863
ALTERNATIVE INVESTMENTS:Private Equity 144,862,277 - 144,862,277 13,560,127,191 Real Estate 23,018,937 - 23,018,937 7,483,583,863 Tangible Assets 704,747 7,137,246 7,841,993 610,387,645
CASH MANAGEMENT 851,560 - 851,560 1,061,656,998
OTHER FEES:Consultants and Advisors 557,904 - 557,904 - Accounting 882,006 - 882,006 - Legal Fees 162,188 - 162,188 - Research Services 1,943,041 - 1,943,041 - Miscellaneous Fees 70,133 - 70,133 - Total Investment Expenses 204,461,447$ 17,262,868$ 221,724,315$ 41,084,284,796$
* Netted fees are included in unrealized gains (losses) in the accompanying financial statements

Page 29
NOTE 7. DEPOSIT AND INVESTMENT RISK DISCLOSURES Custodial Credit Risk – DepositsCustodial credit risk for deposits is the risk that in the event of a bank failure the Reti rement Funds’ deposits may not be returned to it. The Reti rement Funds do not have a deposit policy for custodial credit risk. As of June 30, 2010 there were no deposits with the custodial bank.
Custodial Credit Risk – InvestmentsCustodial credit risk for investments is the risk that, in the event of a failure of the counterparty to a transacti on, the Reti rement Funds will not be able to recover the value of investments that are in the possession of an outside party. The Reti rement Funds miti gates custodial credit risk by having its investment securiti es held by its custodian. Also, investment securiti es are registered in the name of the Washington State Investment Board for the benefi t of the Reti rement Funds, excluding cash and cash equivalents and repurchase agreements held as securiti es lending collateral.
The WSIB has been authorized by statute as having the investment management responsibility for Reti rement Funds. The WSIB is authorized to invest as provided by statute (Chapter 43.33A RCW) and WSIB policy. The WSIB is authorized and invests in the following: U.S. Treasury Bills; discount notes; repurchase agreements; reverse repurchase agreements; banker’s acceptances; commercial paper; guaranteed investment contracts; U.S. Government and Agency (government sponsored corporati ons eligible for collateral purposes at the Federal Reserve) securiti es; non-U.S. dollar bonds; investment grade corporate bonds; non-investment grade corporate bonds; publicly traded mortgage-backed securiti es; privately placed mortgages; private placements of corporate debt; U.S. and foreign common stock; U.S. preferred stock; converti ble securiti es; private equity including but not limited to investment corporati ons, partnerships, and limited liability companies for venture capital, leveraged buy-outs, real estate and other tangible assets, or other forms of private equity; asset-backed securiti es; and derivati ve securiti es including futures, opti ons, opti ons on futures, forward contracts, and swap transacti ons. There have been no violati ons of these investment restricti ons during fi scal year 2010.
Interest Rate RiskInterest rate risk is the risk that changes in interest rates over ti me will adversely aff ect the fair value of an investment. Eff ecti ve durati on is the measure of a debt investment’s exposure to fair value changes arising from changes in interest rates. Eff ecti ve durati on uses the present value of future cash fl ows, weighted for those fl ows as a percentage of the investment’s full price. Increases in prevailing interest rates generally translate into decreases in fair values of those investments, and decreases in interest rates result in increases in valuati ons. The Reti rement Funds’ fi xed income investments are to be acti vely managed to exceed the return of the Barclays Capital Universal Index, with a durati on that is not higher or lower twenty percent than the durati on of the index. As of June 30, 2010, the Reti rement Funds’ durati on was within the durati on target of this index.
Schedule 1 provides informati on about the interest rate risks associated with the CTF investments as of June 30, 2010. The schedule displays various asset classes held by maturity in years, eff ecti ve durati ons, and credit rati ngs. Residenti al mortgage backed, commercial mortgage backed, and asset-backed securiti es are reported using the average life within the portf olio. The average life is a calculated esti mate of the average ti me (in years) unti l maturity for these securiti es taking into account possible prepayments of principal. All other securiti es on this schedule are reported using the stated maturity date.
Credit RiskCredit risk is the risk that an issuer or other counterparty to an investment will not fulfi ll its obligati ons. The Reti rement Funds’ rated debt investments as of June 30, 2010, were rated by Moody’s and/or an equivalent nati onal rati ng organizati on. Investment types with multi ple rati ngs are presented in Schedule 2 using the Moody’s rati ng scale.
Concentration of Credit RiskConcentrati on of credit risk is the risk of loss att ributed to the magnitude of an investment in a single issuer. The Reti rement Funds’ policy states no corporate fi xed income issue shall exceed 3 percent of cost at the ti me of purchase or 6 percent of fair value thereaft er of the fund, and no high yield issues shall exceed 1 percent of cost or 2 percent of fair value of the fund. There was
no concentrati on of credit risk exceeding these policy guidelines as of June 30, 2010.
Foreign Currency RiskForeign currency risk is the risk that changes in exchange rates will adversely aff ect the fair value of an investment or a deposit. The Reti rement Funds do not have a formal policy to limit foreign currency risk. The Reti rement Funds manage their exposure to fair value loss by requiring their internati onal securiti es investment managers to maintain diversifi ed portf olios by sector and by issuer to limit foreign currency and security risk. The Reti rement Funds exposure to foreign currency risk is presented in Schedule 3 which provides informati on on deposits and investments held in various foreign currencies. The schedule is stated in U.S. dollars.
NOTE 8. SECURITIES LENDINGWashington state law and WSIB policy permit the Reti rement Funds to parti cipate in securiti es lending programs to augment investment income. The WSIB has entered into an agreement with JPMorgan to act as agent for the WSIB in securiti es lending transacti ons. As JPMorgan is the custodian bank for the WSIB, it is counterparty to securiti es lending transacti ons.
The Reti rement Funds report securiti es lent (the underlying securiti es) as assets in the Statement of Net Assets. Cash received as collateral on securiti es lending transacti ons and investments made with that cash are reported as assets. Securiti es received as collateral are reported as assets if the Reti rement Funds have the ability to pledge or sell them without a borrower default. Liabiliti es resulti ng from these transacti ons are also reported in the Statement of Net Assets. Securiti es lending transacti ons collateralized by securiti es that Reti rement Funds do not have the ability to pledge or sell unless the borrower defaults are not reported as assets and liabiliti es.
Securiti es were loaned (consisti ng of fi xed income and equiti es) and collateralized by the Reti rement Funds’ agent with cash and U.S. government securiti es (exclusive of mortgage backed securiti es and lett ers of credit), and irrevocable lett ers of credit. When the loaned securiti es had collateral denominated in the same currency, the collateral requirement was 102

Page 30
percent of the fair value, including accrued interest, of the securiti es loaned. All other securiti es were required to be collateralized at 105 percent of the fair value, including accrued interest, of the loaned securiti es. The collateral held and fair value of securiti es on loan at June 30, 2010, was $3,971,347,906 and $3,860,195,764, respecti vely. As of June 30, 2010, the amounts the Reti rement Fund owed the borrowers exceeded the amounts the borrowers owed the Reti rement Funds, resulti ng in no credit risk exposure.
As of June 30, 2010, the Reti rement Funds held the following securiti es as lending collateral (in thousands):
Cash and Cash Equivalents $2,720,225
Commercial Paper 358,716
Securiti zed Debt Instruments 275,477
Repurchase Agreements 205,632
Medium Term Notes 173,961
Corporate Bonds 103,143
Miscellaneous 95,104
U.S. Government Securiti es 39,090
Total Collateral Held $3,971,348
During fi scal year 2010, securiti es lending transacti ons could be terminated on demand by either the Reti rement Funds or the borrower. The weighted average maturity of loans for 2010 was 2.2 days.
Cash collateral was invested by the Reti rement Funds’ agents in securiti es in the WSIB’s separately managed short-term investment pool (average fi nal maturity of 30 days). Because the securiti es lending agreements were terminable at will, their durati on did not generally match the durati on of the investments made with the cash collateral. Non-cash collateral could not be pledged or sold absent borrower default. Accordingly, non cash collateral held under securiti es lending contracts with a value of $303,733,308 has not been included in the Statement of Net Assets. There are no restricti ons on the amount of securiti es that can be lent.
Securiti es were lent with the agreement that they would be returned in the future for exchange of the collateral.
JPMorgan indemnifi ed the WSIB by agreeing to purchase replacement securiti es or return the cash collateral in the event a borrower failed to return the loaned securiti es or pay distributi ons thereon. JPMorgan’s responsibiliti es included performing appropriate borrower and collateral investment credit analyses, demanding adequate types and levels of collateral, and complying with applicable federal regulati ons concerning securiti es lending.
During fi scal year 2010, there were no signifi cant violati ons of legal or contractual provisions, no failures by any borrowers to return loaned securiti es or to pay distributi ons thereon. Further, the Reti rement Funds incurred no losses during fi scal year 2010 resulti ng from a default by either the borrowers or the securiti es lending agents.
NOTE 9. DERIVATIVESReti rement Funds are authorized to uti lize various derivati ve fi nancial instruments, including mortgage-backed securiti es, fi nancial futures, forward contracts, interest rate swaps, credit default swaps, equity swaps, and opti ons. Derivati ve transacti ons involve, to varying degrees, market and credit risk. In connecti on with the internati onal and domesti c acti ve equity strategy, at June 30, 2010, the Reti rement Funds held investments in fi nancial futures, forward currency contracts and other derivati ve securiti es that are recorded at fair value with changes in value recognized in investment income in the Statement of Changes in Net Assets in the period of change.
Derivati ves are generally used to achieve the desired market exposure of a security, index or currency, adjust portf olio durati on, or rebalance the total portf olio to the target asset allocati on. Derivati ve contracts are instruments that derive their value from underlying assets, indices, reference interest rates, or a combinati on of these factors. A derivati ve instrument could be a contract negogiated on behalf of the Reti rement Funds and a specifi c counterparty. This would typically be referred to as an “over the counter (OTC) contract” such as forward contracts and to be announced (TBA) securiti es. Alternati vely, a derivati ve instrument, such as futures, could be listed and traded on an exchange and referred to as “exchange traded”.
Inherent in the use of OTC derivati ves, the Reti rement Funds are exposed to counterparty credit risk on all open OTC positi ons. Counterparty credit risk is the risk that a derivati ve counterparty may fail to meet its payment obligati on under the derivati ve contract. As of June 30, 2010, the Reti rement Funds counterparty risk was not deemed to be signifi cant, whether evaluati ng counterparty exposure outright or netti ng collateral against net asset positi ons on contracts with each counterparty.
Mortgage TBA’s are used to achieve the desired market exposure of a security or asset class or adjust portf olio durati on. A TBA is a contract for the purchase or sale of agency mortgage-backed securiti es to be delivered at a future agreed-upon date. TBA’s carry future sett lement risk due to the possibility of not receiving the asset or associated gains specifi ed in the contract and such loss upon failure by counterparti es to deliver under the contracts would not be material at June 30, 2010. The fair value of TBA derivati ves is including in Residenti al Mortgage Backed Securiti es in the statement of net assets.
Futures contracts are standardized, exchange-traded contracts to purchase or sell a specifi c fi nancial instrument at a predetermined price. Gains and losses on futures contracts are sett led daily based on a noti onal (underlying) principal value and do not involve an actual transfer of the specifi c instrument. The exchange assumes the risk that the counterparty will not pay and generally requires margin payments to minimize such risk. Futures are generally used to achieve the desired market exposure of a security or index or rebalance the total portf olio.
Forward currency contracts are agreements to exchange the currency of one country for the currency of another country at an agreed-upon price and sett lement date. These forward commitments are not standardized and carry credit risk due to the possible nonperformance by one of the counterparti es. The maximum potenti al loss is the aggregate face value in U.S. dollars at the ti me the contract was opened; however, the likelihood of such loss is remote. At June 30, 2010, the Reti rement Funds had outstanding forward currency contracts to purchase foreign currencies with a fair value of $1,634,777,158 and outstanding contracts to sell foreign currencies with a fair value of $1,632,983,411 reported as a component

Page 31
of open foreign currency contracts payable and receivable in the accompanying Statement of Net Assets. The net unrealized loss of $1,793,747 is included in the accompanying Statement of Changes in Net Assets. The contracts have varying maturity dates ranging from July 1, 2010, to November 10, 2010.
At June 30, 2010, the Reti rement Funds fi xed income portf olio held derivati ve securiti es consisti ng of collateralized mortgage obligati ons with a fair value of $1,080,375,154. Domesti c and foreign passive equity index fund managers may also uti lize various derivati ve securiti es to manage exposure to risk and increase portf olio returns. Informati on on the extent of use and holdings of derivati ve securiti es by passive equity index fund managers is unavailable.
Derivati ves which are exchange traded are not subject to credit risk. The maximum loss that would be recognized at June 30, 2010, if all counterparti es fail to perform as contracted is $1,809,909 of unrealized gain on TBA
securiti es. This maximum exposure is reduced by $1,793,747 of unrealized losses (recorded as liabiliti es) on forward currency contracts, resulti ng in de minimis exposure to credit risk.
At June 30, 2010, the counterparti es’ credit rati ngs for forwards currency contracts that are subject to credit risk had a credit rati ng of no less than A2 using the Moody’s rati ng scale.
NOTE 10. SUMMARY OF INVESTMENT POLICIESUnder RCW 43.33A.030, Trusteeship of the Reti rement Funds is vested within the voti ng members of the WSIB. The Legislature has established a standard of care for investment of these funds in RCW 43.33A.140. Additi onally, the WSIB and its staff must comply with other state laws, such as the Ethics in Public Service Act, RCW 42.52, as it makes its investment decisions and seeks to meet the following investment objecti ves.
Strategic Objectives In accordance with RCW 43.33.110, the portf olio is managed to achieve a maximum return at a prudent level of risk.
The Retirement Fund Asset AllocationWSIB establishes asset allocati on targets that must be considered at all ti mes when making investment decisions. The asset mix may deviate from the target. Deviati ons greater than predetermined acceptable levels require rebalancing back to the target. When an asset class exceeds its range, the goal of rebalancing will be to meet the target allocati on within considerati on of the other remaining asset classes.
Asset Class TargetPolicy Range
Asset Class
Range
Fixed Income 20% 16 - 24% + or - 4%
Tangible Assets 5% 3 - 7% + or - 2%
Real Estate 13% 10 - 16% + or - 3%
Global Equity 37% 32 - 42% + or - 5%
Private Equity 25% 21 - 29% + or - 4%
Innovati on Portf olio 0% 0 - 5% + 5%
Cash 0% 0 - 2% + 3%
Reti rement funds are invested in the CTF. The CTF’s performance benchmark objecti ve is to exceed the return of a policy benchmark consisti ng of public market indices weighted according to asset allocati on targets. The asset allocati on for the CTF is formally reviewed at least every 4 years. The allocati on policy will be reviewed more frequently if the WSIB believes there has been a fundamental change in the structure of the capital markets or in the underlying cash fl ow or liability structure of the reti rement systems.
Public Markets EquityIn October 2007, the public equity program adopted a global benchmark, the Dow Jones Global Total Stock Markets Index, refl ecti ng the globalizati on of capital markets. The CTF also reduced its asset allocati on to public equity from 46 percent to 37 percent to facilitate increased allocati ons to alternati ve investments (private equity, real estate, and tangible assets). Even though the fund moved to a global benchmark, the program was not substanti ally restructured and, thus, the public equity portf olio remains a combinati on of separate U.S. and internati onal components.
Changes in Fair Value - Included in Investment Income
Fair Value at June 30, 2010 - Investment Derivative
Amount Amount Notional
FUTURES CONTRACTS:Bond Index Futures 4,952,240$ 4,952,240$ 3,588 Equity Index Futures 19,262,382 (1,990,468) 3,359
24,214,622 2,961,772 6,947
TO BE ANNOUNCED SECURITES:FNMA TBA 1,809,909 257,135,300 242,000,000
FORWARD CURRENCY CONTRACTS:Australian Dollar 2,177,220 1,791,196 61,633,050 Canadian Dollar 5,355,028 (1,026,623) 133,531,474 Czech Koruna 361,116 (29,200) (179,502,645) Danish Krone (56,524) (44,006) (35,713,935) Euro (2,611,710) (2,304,514) (70,242,743) Hong Kong Dollar (53,228) (53,570) (294,795,693) Hungarian Forint 674,830 409,468 (920,416,298) Israeli Shekel 237 237 1,280,568 Japanese Yen (478,502) 2,813,123 6,747,047,532 Mexican Peso (385) (385) (2,322,932) New Zealand Dollar 116,840 (1,432) (1,955) Norwegian Krone 21,375 19,740 (87,284,559) Polish Zloty 2,242,201 478,903 (17,929,556) Pound Sterling (554,597) (1,003,012) 19,898,526 Singapore Dollar 4,174 1,346 (2,189,529) South African Rand (94,255) (89,128) (16,362,343) Swedish Krona (3,089,709) (2,606,262) (442,845,219) Swiss Franc 33,839 (149,628) (3,234,485) Thai Baht 247 - - U.S. Dollar - - (60,698,562)
4,048,197$ (1,793,747)$ 4,829,850,696

Page 32
Because U.S. equity markets are generally effi cient, all of the WSIB’s investments in this segment are in a low-cost, broad-based passive index fund. In keeping with our belief that internati onal equity markets are less effi cient while acknowledging that internati onal effi ciency is increasing, the WSIB’s developed markets internati onal equity program has increased its use of passive strategies to 35 percent, but kept the majority of the program in acti ve mandates. The enti re emerging markets equity program is acti vely managed.
During 2010, WSIB disconti nued the enhanced indexing program with those funds reallocated to passive, resulti ng in the increase in passive noted above. The WSIB also increased the asset allocati on of emerging markets equal to their weight within the Dow Jones Global Total Stock Markets Index.
Fixed IncomeThe portf olio is constrained by policy from investi ng more than 1 percent of the portf olio’s par holdings in any single issuer with a quality rati ng below investment grade (as defi ned by Barclays Capital Global Family of Fixed Income Indices). Total holdings of below investment grade credit bonds shall not exceed 15 percent of total bond holdings. The durati on of the portf olio (the sensiti vity of the portf olio’s fair value to changes in the level of interest rates) is to be targeted within 20 percent of the durati on of the Barclays Capital Universal Index. In additi on, the major sector allocati ons are limited to the following ranges:
Range
U.S. Treasuries and Government Agencies 10% – 45%
Credit Bonds 10% – 60%
Asset-Backed Securiti es 0% – 10%
Commercial Mortgage-Backed Securiti es 0% – 10%
Mortgage-Backed Securiti es 5% – 45%
Private Equity InvestingThe Reti rement Funds can invest in any appropriate private equity investment opportunity which has the potenti al for returns superior to traditi onal investment opportuniti es and which is not prohibited by the WSIB’s policies or by law. These investment types are divided
into venture capital investments, corporate fi nance, distressed, internati onal and mezzanine investments. Private equity investments are made through limited partnership vehicles.
To meet the return and plan objecti ves, the private equity portf olio has diversifi ed investments in companies in a variety of growth stages. The portf olio also includes a broad cross-secti on of opportuniti es in diff erent industries and geographic regions.
The portf olio is managed to meet or exceed the returns of the Russell 3000 (lagged by one quarter) plus 300 basis points.
Real Estate ProgramThe WSIB’s real estate program is an externally managed pool of selected partnership investments, intended to provide alternati ve portf olio characteristi cs when compared to traditi onal stock and bond investments. The majority of the WSIB’s partnerships invest in insti tuti onal-quality real estate assets that are leased to third parti es. The combinati on of income generated from bond-like lease payments, coupled with the hard asset qualiti es of commercial real estate, combine to generate returns that are expected to fall between the return expectati ons for fi xed income and equiti es over the long term. The real estate portf olio is managed to deliver risk-adjusted returns that are consistent with the WSIB’s long term return expectati ons for the asset class. The Reti rement Fund’s real estate partnerships typically invest in private real estate assets that are held for long-term income and appreciati on. Many of the Reti rement Fund’s investment partnerships do not involve co-investment with other fi nancial enti ti es, thereby providing the WSIB with control provisions, related transacti ons and ongoing operati onal decisions for annual capital expenditures.
Volati lity including the real estate portf olio is minimized through a combinati on of factors. First, the majority of the Reti rement Fund’s partners own real estate assets in a private investment form which are not subject to public market volati lity. Secondly, real estate capital is diversifi ed among a host of partners with varying investment styles. Thirdly, partnership assets are invested in numerous economic regions, including foreign markets, and in various property types. Finally,
Reti rement Fund’s partners invest at diff erent points within the properti es’ capital structure and life cycle.The WSIB’s current benchmark seeks to earn an 8 percent annual investment return over a rolling 10-year period.
Innovation PortfolioThe innovati on portf olio investment strategy is to provide WSIB with the ability to invest in assets that fall outside of traditi onal asset classes and to provide the WSIB with comfort and demonstrated success before committi ng large dollar amounts to the strategy. The overall benchmark for the innovati on portf olio is the weighted average of the underlying benchmark for each asset in the portf olio.
Currently, all Innovati on Portf olio investment managers are investi ng in publicly traded common stock. Their individual holdings have been presented according to asset class on the Statement of Net Assets.
Tangible AssetsThe primary goal of the tangible asset portf olio is to generate a long-term, high quality, stable income stream. The secondary goal is to generate appreciati on approximately commensurate with infl ati on. The structure of the investments are primarily targeted to be tangible asset operati ng companies providing the WSIB with governance provisions related to acquisiti on, dispositi ons, and ongoing operati onal decisions for annual capital expenditures. The tangible asset portf olio invests in a number of sectors, but the primary focus is infrastructure, ti mber, and natural resource rights (oil and natural gas).
The WSIB’s current return objecti ve for tangible assets calls for a target benchmark of 4 percent above the U.S. Consumer Price Index over a long-term investment horizon defi ned as at least fi ve years.

Page 33
Investment Type Aaa Aa1 Aa2 Aa3 A1 A2 A3 Baa1 Baa2 Baa3 Ba1 or LowerAsset Backed Securities 188,397,863$ 146,601,521$ -$ 531,210$ 6,978,601$ -$ -$ -$ 3,115,918$ -$ -$ 31,170,613$ Residential Mortgage Backed Securities 2,875,073,669 2,816,711,059 3,997,074 8,077,061 3,534,453 2,864,382 - - 4,581,978 2,732,965 2,336,124 30,238,573 Commercial Mortgage Backed Securities 478,293,349 385,754,801 - 52,032,380 40,506,168 - - - - - - - Corporate Bonds Domestic (USD) 1,624,171,354 102,048,607 - - 143,149,960 112,531,487 226,212,308 71,016,737 389,579,656 367,526,127 60,952,663 151,153,809 Corporate Bonds Foreign (USD) 4,405,322,481 27,343,500 - 186,560,030 252,737,809 492,133,800 163,997,277 364,398,421 419,844,909 851,575,284 814,481,474 832,249,977 Corporate Bonds Foreign (Non USD) 666,548,150 511,085,695 - - - - 787,973 29,213,561 - 26,834,258 61,793,990 36,832,673
- - - - - - - - -Total 10,237,806,866$ 3,989,545,183$ 3,997,074$ 247,200,681$ 446,906,991$ 607,529,669$ 390,997,558$ 464,628,719$ 817,122,461$ 1,248,668,634$ 939,564,251$ 1,081,645,645$
Total Fair Value Moody's Equivalent Credit Rating
Investment Type Total Fair Value Less than 1 year 1-5 years 6-10 years More than 10 yearsEffective Duration
Credit Rating
Asset Backed Securities 188,397,863$ 19,141,468$ 155,121,594$ 7,499,426$ 6,635,375$ 0.08 Sched 2Residential Mortgage Backed Securities 2,875,073,669 360,807,754 2,502,014,695 12,251,220 - 1.56 Sched 2Commercial Mortgage Backed Securities 478,293,349 60,363,171 416,905,204 1,024,974 - 3.43 Sched 2Corporate Bonds Domestic (USD) 1,624,171,354 15,092,100 450,787,927 982,961,260 175,330,067 5.92 Sched 2Corporate Bonds Foreign (USD) 4,405,322,481 103,819,005 979,625,966 2,639,195,456 682,682,054 4.78 Sched 2Corporate Bonds Foreign (Non USD) 666,548,150 - 242,744,814 307,067,504 116,735,832 6.27 Sched 2US Government Treasuries 673,678,191 - 673,678,191 - - 1.43 AaaTreasury Inflation Protected Securities (TIPS) 847,259,298 - 847,259,298 - - 0.94 AaaTotal Retirement Funds Investment Categorized 11,758,744,355 559,223,498$ 6,268,137,689$ 3,949,999,840$ 981,383,328$
Investments Not Required to be CategorizedCommingled Equity Index Funds 10,204,805,721 Corporate Stock - U.S. Dollar Denominated 659,329,617 Corporate Stock - Non U.S. Dollar Denominated 7,504,393,760 Alternative Investments 21,654,098,699 Liquidity 1,061,656,998 Total Investments Not Categorized 41,084,284,795 Total Investments 52,843,029,150$
MaturitySCHEDULE 1: SCHEDULE OF MATURITIES AND CREDIT QUALITY
SCHEDULE 2: ADDITIONAL CREDIT RATING DISCLOSURES

Page 34
SCHEDULE 3: FOREIGN CURRENCY EXPOSURE BY COUNTRY
Foreign Currency Denomination Currency Fixed Income Common Stock Commingled Index
FundsPrivate Equity Real Estate Total
Percent of Total Retirement Funds
InvestmentsAustralia-Dollar 4,377,643$ 373,360,443$ 365,689,693$ -$ -$ 18,282,451$ 761,710,230$ 1.4%Brazil-Real 399,110 134,078,749 100,423,576 - - - 234,901,435 0.4%Canada-Dollar 1,858,317 - 453,622,687 - - - 455,481,004 0.9%Denmark-Krone 347,880 - 81,981,633 - - 82,329,513 0.2%E.M.U.-Euro 41,009,921 - 2,006,480,418 - 1,575,004,830 120,529,030 3,743,024,199 7.1%Hong Kong-Dollar 1,164,697 - 332,591,123 - - - 333,755,820 0.6%India - Rupee 1,148,312 - 81,183,523 - - - 82,331,835 0.2%Indonesia-Rupiah 4,001 26,068,363 36,854,084 - - - 62,926,448 0.1%Japan-Yen 11,053,532 - 1,302,333,321 - - - 1,313,386,853 2.5%Mexico-Peso 338,151 29,213,561 36,480,078 - - - 66,031,790 0.1%Norway-Krone 1,168,736 43,247,119 72,110,290 - - - 116,526,145 0.2%Poland-Zloty 504,017 - 18,298,440 - - - 18,802,457 0.1%Singapore-Dollar 413,095 - 111,556,047 - - - 111,969,142 0.2%South Africa-Rand 113,164 - 97,343,272 - - - 97,456,436 0.2%South Korea-Won 391,865 - 116,471,660 - - - 116,863,525 0.2%Sweden-Krona 849,388 - 184,502,923 - 694,140 - 186,046,451 0.4%Switzerland-Franc 3,181,579 - 505,957,026 - - - 509,138,605 1.0%Taiwanese-Dollar 11,532,757 - 106,170,138 - - - 117,702,895 0.2%Turkey-Lira 265,275 49,027,633 94,902,968 - - - 144,195,876 0.3%United Kingdom - Pound 3,556,251 787,973 1,274,107,771 - 9,485,698 - 1,287,937,693 2.4%Other - Miscellaneous 1,422,216 10,764,309 125,333,089 - - - 137,519,614 0.3%
85,099,907 666,548,150 7,504,393,760 - 1,585,184,668 138,811,481 9,980,037,966 19.0%Foreign Investments Denominated in U.S. Dollars - 4,405,322,481 358,221,380 2,574,070,559 2,861,732,377 2,443,231,637 12,642,578,434 23.9%
85,099,907$ 5,071,870,631$ 7,862,615,140$ 2,574,070,559$ 4,446,917,045$ 2,582,043,118$ 22,622,616,400$ 42.9%
Investment Type In U.S. Dollar Equivalent

Page 35
CERTIFIED PUBLIC ACCOUNTANTS
601 UNION STREET, SUITE 2300
SEATTLE, WASHINGTON 98101
TEL 206.382.7777 • FAX 206.382.7777
http://www.pscpa.com
PETERSON SULLIVAN LLP
LABOR AND INDUSTRIES' FUNDS
INDEPENDENT AUDITORS’ REPORTTo the Members of the Washington State Investment BoardOlympia, WashingtonWe have audited the accompanying statement of net assets for the Labor & Industries’ Funds of the State of Washington as managed by the Washington State Investment Board (“the Labor & Industries’ Funds”) as of June 30, 2010, and the related statement of changes in net assets for the year then ended. These fi nancial statements are the responsibility of the Washington State Investment Board’s management. Our responsibility is to express an opinion on these fi nancial statements based on our audit.
We conducted our audit in accordance with auditi ng standards generally accepted in the United States. Those standards require that we plan and perform the audit to obtain reasonable assurance about whether the fi nancial statements are free of material misstatement. An audit includes examining, on a test basis, evidence supporti ng the amounts and disclosures in the fi nancial statements. An audit also includes assessing the accounti ng principles used and signifi cant esti mates made by management, as well as evaluati ng the overall fi nancial statement presentati on. We believe that our audit provides a reasonable basis for our opinion.
The fi nancial statements referred to in the fi rst paragraph present only the investment acti vity of the Labor & Industries’ Funds as managed by the Washington State Investment Board. The fi nancial statements do not purport to, and do not, present the fi nancial acti vity of the Department of Labor & Industries of the State of Washington. Further, they do not purport to, and do not, present the fi nancial acti vity of the Washington State Investment Board or of the State of Washington.
In our opinion, the fi nancial statements referred to in the fi rst paragraph present fairly, in all material respects, the net assets of the Labor & Industries’ Funds as of June 30, 2010, and the changes in net assets for the year then ended in conformity with accounti ng principles generally accepted in the United States. Our audit was conducted for the purpose of forming an opinion on the fi nancial statements of the Labor & Industries’ Funds. Management’s Discussion and Analysis preceding the fi nancial statements is presented for purposes of additi onal analysis and is not a required part of the fi nancial statements referred to in the fi rst paragraph. We have applied certain limited procedures, which consisted principally of inquiries of management regarding the methods of measurement and presentati on of the supplementary informati on. However, we did not audit the informati on and express no opinion on it. The introducti on secti on of the annual report has not been subjected to the auditi ng procedures applied in the audit of the fi nancial statements and, accordingly, we express no opinion on it.
/S/ PETERSON SULLIVAN LLP
October 28, 2010

Page 36
Management’s Discussion and Analysis for the Labor & Industries’ Funds of Washington state (L&I Funds), managed by the Washington State Investment Board (WSIB), is presented as an introducti on to the fi nancial statements. It is meant to assist the reader in understanding the fi nancial statements by providing an overall review of the fi nancial acti viti es during the year as well as to provide a comparison to the prior year’s acti viti es and results. The WSIB manages funds for other Washington state departments. This secti on represents only the L&I Funds porti on. The L & I Funds are the second largest pool of investments managed by the WSIB.
Following this secti on of the report are the fi nancial statements and footnotes. The Statement of Net Assets provides informati on on the types of investments and the liabiliti es of the L&I Funds. This informati on is summarized in Table 1. Table 1 also compares the asset, liability, and net asset balances at June 30, 2010, with those at June 30, 2009. The Statement of Changes in Net Assets provides informati on on investment performance and other increases and decreases in the net assets of the L&I Funds for the year ended June 30, 2010. This informati on is summarized in Table 2. Table 2 also compares the fi nancial acti viti es of the L&I Funds for the year ended June 30, 2010, with those of the year ended June 30, 2009. The Notes to the Financial Statements
provide additi onal informati on that is essenti al to a full understanding of the data provided in the fi nancial statements of the L&I Funds.
As shown in Table 1, the net assets of the L&I Funds increased by $992.0 million during the fi scal year ended June 30, 2010. Net investment income reinvested in the fund totaled $488.0 million. Net realized and unrealized gains for the year increased net assets by $953.8 million. Distributi ons to L&I reduced net assets by $(449.8) million.
The following summarizes the changes within each grouping listed within Table 1:
Money market funds decreased by $(209.1) million. Net investment income reinvested in this short term investment vehicle totaled $470.5 million. Distributi ons to L&I decreased money market funds by $(449.8) million. The remaining decrease of $(229.8) million was the result of investi ng excess cash balances longer term and rebalancing to asset allocati on policy targets.
Fixed income securiti es increased by $1,054.4 million. Transfers into this asset class from money market funds totaled $229.7 million. Pending trades payable increased fi xed income securiti es by $20.8 million. Net realized and unrealized gains due to
favorable market conditi ons increased this asset class by $803.9 million. As interest rates fell during the fi scal year, the price of fi xed income securiti es rose which resulted in substanti al increases to fi xed income invested balances. Returns for the current fi scal year for TIPS ranged from 9.6 to 9.9 percent. Other fi xed income securiti es returned between 13.5 to 14.2 percent.
Equity investments increased by $165.0 million. Reinvested income increased commingled fund equity holdings by $14.8 million. Cash transfers increased this asset class by $.2 million. Net realized and unrealized gains incurred increased equiti es by $150.0 million due to positi ve investment returns in the equity markets. The equity portf olio returned 14.2 percent for the current fi scal year.
Collateral held and obligati ons under securiti es lending agreements increased by $571.5 million. Due to market volati lity and diffi culty recalling securiti es on loan to sett le bond sales, lending acti viti es were halted on all corporate bonds in December 2008. Despite the decrease in lendable balances, the WSIB was able to increase the amount of securiti es on loan of Treasury and Agency securiti es. As interest rates fell, the value of securiti es increased which required higher collateral balances held within the portf olio.
MANAGEMENT DISCUSSION & ANALYSIS
TABLE 1: SUMMARIZED NET ASSETS 2010 2009 DOLLAR CHANGE PERCENT CHANGE
Money Market Funds $220,859,845 $429,911,030 $(209,051,185) (48.6%)
Fixed Income Investments 10,349,546,363 9,295,176,393 1,054,369,970 11.3%
Equity Investments 1,323,968,985 1,158,922,170 165,046,815 14.2%
Total Investments 11,894,375,193 10,884,009,593 1,010,365,600 9.3%
Collateral Held Under Securiti es Lending Agreements 2,377,679,109 1,806,129,610 571,549,499 31.6%
Investment Receivables - Other 102,328,608 99,743,124 2,585,484 2.6%
Total Assets 14,374,382,910 12,789,882,327 1,584,500,583 12.4%
Obligati ons Under Securiti es Lending Agreements 2,377,679,109 1,806,129,610 571,549,499 31.6%
Investment Payables - Other 31,167,051 10,226,431 20,940,620 204.8%
Total Liabiliti es 2,408,846,160 1,816,356,041 592,490,119 32.6%
Net Assets $11,965,536,750 $10,973,526,286 $992,010,464 9.0%

Page 37
Investments payable increased by $20.9 million due to an increase in pending trades payable, which is a functi on of open trades as of a specifi c point in ti me. This balance can fl uctuate a great deal from period to period based on trading strategies, asset allocati on, and market movements.
As shown in Table 2, the net amount withdrawn by L&I increased by $110.8 million. Net premiums collected by L&I decreased due to a reducti on in the hours reported by employers caused by current economic conditi ons. In additi on, benefi t payments to insured individuals increased requiring additi onal funds to be withdrawn from the invested balances. Interest and other investment income decreased by $(44.2) million due mainly to a decline in interest rates during the current fi scal year. Net realized and unrealized gains increased by $61.2 million and $1.2 billion, respecti vely. Both fi xed income and equity securiti es experienced signifi cant appreciati on due to the market environment during the current fi scal year. Securiti es lending broker rebates decreased by $12.6 million due to a narrowing of the spreads paid to brokers in the current lending environment.
The fair value of L&I assets is directly impacted by the returns of the various capital markets within which the WSIB invests. The returns are expected to have a
signifi cant eff ect on fi nancial positi on and results of operati ons in the future. However, one of the benefi ts of the diversifi cati on gained by investi ng across various investment types as well as broadly within an asset class is the reducti on in aggregate volati lity of the total investment portf olio. The WSIB, upon receiving recommendati ons from L&I staff , WSIB staff , and other investment experts, makes the asset allocati on decisions for the L&I assets. Staff rebalances the L&I Funds’ assets between asset classes as markets move pursuant to WSIB policy.
TABLE 2: SUMMARIZED CHANGES IN NET ASSETS 2010 2009 DOLLAR CHANGE
Net Investment Income
Interest, Dividends and Other Investment Income $495,143,895 $539,329,671 $(44,185,776)
Net Capital Gains (Losses) 19,164,992 (42,047,114) 61,212,106
Unrealized Gains (Losses) 934,668,092 (262,347,652) 1,197,015,744
Less:
Securiti es Lending Broker Rebates and Management Fees (4,147,907) (16,698,040) (12,550,133)
Investment Expenses (1,146,479) (731,555) 414,924
WSIB Operati ng Expenses (1,841,961) (1,911,246) (69,285)
Net Investment Income 1,441,840,632 215,594,064 1,226,246,568
Net Amount Withdrawn (449,830,168) (339,040,631) 110,789,537
Net Assets - Beginning 10,973,526,286 11,096,972,853 (123,446,567)
Net Assets - Ending $11,965,536,750 $10,973,526,286 $992,010,464

Page 38
Accident Fund Medical Aid Fund Pension Reserves Fund Supplemental Pension Fund TotalNet Investment Income
Investment Income: Interest, Dividends and Other Investment Income 191,201,723$ 150,551,907$ 143,501,541$ 699,173$ 485,954,344$ Securities Lending Income 3,377,928 3,862,415 1,941,419 7,789 9,189,551 Realized Capital Gains 11,938,734 9,240,220 10,873,079 1,439,993 33,492,026 Realized Capital Losses (2,208,727) (11,193,064) (925,014) (229) (14,327,034) Unrealized Gains and Losses 347,364,313 329,571,045 258,708,650 (975,916) 934,668,092
Less: Securities Lending Broker Rebates and Management Fees (1,544,907) (1,725,970) (873,741) (3,289) (4,147,907) Investment Expenses (424,716) (397,990) (319,129) (4,644) (1,146,479) WSIB Operating Expenses (688,631) (635,313) (510,626) (7,391) (1,841,961) Net Investment Income 549,015,717 479,273,250 412,396,179 1,155,486 1,441,840,632
Residual Equity Transfer (75,300,000) - 75,300,000 - - Net Amount Contributed (Withdrawn) (296,989,957) (125,754,785) 12,422,610 (39,508,036) (449,830,168)
Increase (Decrease) in Net Assets 176,725,760 353,518,465 500,118,789 (38,352,550) 992,010,464
Net Assets - June 30, 2009 4,196,421,346 3,766,892,030 2,957,035,490 53,177,420 10,973,526,286 Net Assets - June 30, 2010 4,373,147,106$ 4,120,410,495$ 3,457,154,279$ 14,824,870$ 11,965,536,750$
Accident Fund Medical Aid Fund Pension Reserves Fund Supplemental Pension Fund Total Percent of TotalASSETS Investments: LIQUIDITY: Money Market Funds 101,968,103$ 56,372,278$ 50,989,002$ 11,530,462$ 220,859,845$ 1.9% FIXED INCOME INVESTMENTS: Residential Mortgage Backed Securities 769,029,306 524,177,069 454,358,351 36,172 1,747,600,898 Commercial Mortgage Backed Securities 244,342,794 153,316,199 156,792,457 - 554,451,450 Corporate Bonds - Domestic 1,114,741,151 935,852,462 1,029,077,253 2,141,330 3,081,812,196 Corporate Bonds - Foreign (U.S. Dollar Denominated) 1,011,674,479 848,517,883 892,662,444 1,037,090 2,753,891,896 U.S. Government Treasuries 211,085,604 152,865,915 241,340,005 - 605,291,524 U.S. Treasury Inflation Protected Securities 454,523,457 847,474,634 304,500,308 - 1,606,498,399 Total Fixed Income Investments 3,805,396,791 3,462,204,162 3,078,730,818 3,214,592 10,349,546,363 87.0%
EQUITY INVESTMENTS: Commingled Index Funds - Domestic 263,197,408 339,563,968 172,966,300 - 775,727,676 Commingled Index Funds - Foreign 185,637,516 240,115,239 122,488,554 - 548,241,309 Total Equity Investments 448,834,924 579,679,207 295,454,854 - 1,323,968,985 11.1%
Total Investments 4,356,199,818 4,098,255,647 3,425,174,674 14,745,054 11,894,375,193 100.0%
Investment Earnings Receivable 37,807,206 32,364,204 32,066,425 80,016 102,317,851 Receivable for Investments Sold 3,985 4,997 1,775 - 10,757 Collateral Held Under Securities Lending Agreements 763,436,380 1,001,947,817 612,294,912 - 2,377,679,109 Total Assets 5,157,447,389 5,132,572,665 4,069,537,786 14,825,070 14,374,382,910
LIABILITIES Obligations Under Securities Lending Agreements 763,436,380 1,001,947,817 612,294,912 - 2,377,679,109 Accounts Payable 102,628 135,076 67,260 - 304,964 Payable for Investments Purchased 20,733,500 10,053,200 - - 30,786,700 Due to Other Agencies 27,775 26,077 21,335 200 75,387 Total Liabilities 784,300,283 1,012,162,170 612,383,507 200 2,408,846,160
NET ASSETS 4,373,147,106$ 4,120,410,495$ 3,457,154,279$ 14,824,870$ 11,965,536,750$
L&I FUNDS STATEMENT OF NET ASSETS - June 30, 2010See notes to financial statements
L&I FUNDS STATEMENT OF CHANGES IN NET ASSETS - YEAR ENDED JUNE 30, 2010See notes to financial statements

Page 39
NOTE 1. DESCRIPTION OF FUNDS AND SIGNIFICANT ACCOUNTING POLICIESDescription of FundsThe L&I Funds consist mainly of the investment of insurance premiums collected from employers in the state of Washington. The fi nancial statements present only the acti vity of the L&I Funds as managed by the WSIB. The WSIB has exclusive control of the investments held by the L&I Funds. The fi nancial statements do not present the fi nancial positi on and results of operati ons of the WSIB or L&I.
Basis of AccountingThe accompanying fi nancial statements have been prepared in conformity with accounti ng principles generally accepted in the United States for governments prescribed by the Governmental Accounti ng Standards Board (GASB) on the accrual basis of accounti ng.
Valuation of InvestmentsInvestments are reported at fair value. Fair values are based on published market prices, quotati ons from nati onal security exchanges, and security pricing services. Investments are adjusted to fair values monthly. Unrealized gains and losses are included as investment income in the Statement of Changes in Net Assets.
Revenue RecognitionInterest and dividend income are recognized when earned. Capital gains and losses are recognized on a trade date basis. Purchases and sales of investments are also recorded on a trade date basis.
Securities LendingThe L&I Funds record collateral received under securiti es lending agreements where the L&I Funds have the ability to spend, pledge, or sell the collateral without borrower default. Liabiliti es resulti ng from these transacti ons are also recorded. Additi onally, costs associated with securiti es lending transacti ons, including broker commissions paid and lending fees paid to the custodian bank, are reported as investment expenses in the accompanying fi nancial statements. The Statement of Net Assets does not include detailed holdings of securiti es lending collateral by investment classifi cati on.
Use of EstimatesThe preparati on of fi nancial statements in conformity with accounti ng principles generally accepted in the United States requires management to make esti mates and assumpti ons that aff ect certain reported amounts and disclosures. Actual results could diff er from the esti mated amounts.
Contributions and WithdrawalsContributi ons and withdrawals are recorded when received or paid.
NOTE 2. FEES AND EXPENSESInvestment fees and expenses are accounted for as a reducti on of investment income or are nett ed directly from the asset value of the L&I Fund’s investments. These fees include investment management fees and commissions, investment consultant fees, legal fees, and other investment management related expenses. The WSIB operati ng expenses are charged to the funds based upon actual costs incurred to manage the investments. WSIB operati ng expenses are allocated to the funds under management based on relati ve market values, in accordance with state statutes.
NOTE 3. DEPOSIT AND INVESTMENT RISK DISCLOSURES Custodial Credit Risk – DepositsCustodial credit risk for deposits is the risk that in the event of a bank failure the L&I Fund’s deposits may not be returned to it. The L&I Funds do not have a deposit policy for custodial credit risk. As of June 30, 2010, there were no deposits with the custodial bank.
Custodial Credit Risk – InvestmentsCustodial credit risk for investments is the risk that, in the event of a failure of the counterparty to a transacti on, the L&I Funds will not be able to recover the value of investments that are in the possession of an outside party. The L&I Funds miti gates custodial credit risk by having its investment securiti es held by its custodian. Also, investment securiti es are registered in the name of the Washington State Investment Board for the benefi t of the L&I Funds, excluding cash and cash equivalents and repurchase agreements held as securiti es lending collateral.
Interest Rate RiskInterest rate risk is the risk that changes in interest rates over ti me will adversely aff ect the fair value of an investment. Eff ecti ve durati on is the measure of a debt investment’s exposure to fair value changes arising from changes in interest rates. Eff ecti ve durati on uses the present value of cash fl ows, weighted for those fl ows as a percentage of the investment’s full price. Increases in prevailing interest rates generally translate into decreases in fair values of those investments. As of June 30, 2010, the L&I Funds’ portf olio durati ons were within the durati on targets documented in Note 6.
Schedule 1 provides informati on about the interest rate risks associated with the L&I Funds’ investments as of June 30, 2010. The schedule displays various asset classes held by maturity in years, eff ecti ve durati ons, and credit rati ngs. Residenti al mortgage backed, commercial mortgage backed, and asset-backed securiti es are reported using the average life within the portf olio. The average life is a calculated esti mate of the average ti me (in years) unti l maturity for these securiti es taking into account possible prepayments of principal. All other securiti es on this schedule are reported using the stated maturity date.
Credit RiskCredit risk is the risk that an issuer or other counterparty to an investment will not fulfi ll its obligati ons. The L&I Funds’ rated debt investments as of June 30, 2010, were rated by Moody’s and/or an equivalent nati onal rati ng organizati on. Investment types with multi ple rati ngs are presented in Schedule 2 using the Moody’s rati ng scale.
Concentration of Credit RiskConcentrati on of credit risk is the risk of loss att ributed to the magnitude of an investment in a single issuer. The L&I Funds’ policy states no corporate fi xed income issue’s cost shall exceed 3 percent of the fund’s fair value at the ti me of purchase, nor shall its fair value exceed 6 percent of the fund’s fair value at any ti me. There was no concentrati on of credit risk as of June 30, 2010.
Foreign Currency RiskForeign currency risk is the risk that changes in exchange rates will adversely aff ect the fair value of an investment or a deposit. The L&I Funds do not have a formal policy
NOTES TO FINANCIAL STATEMENTS

Page 40
to limit foreign currency risk. The only security held by the L&I Funds with foreign currency risk at June 30, 2010, consists of $548,241,309 invested in an internati onal commingled equity index fund.
NOTE 4. SECURITIES LENDINGState law and WSIB policy permit the L&I Funds to parti cipate in securiti es lending programs to augment investment income. The WSIB has entered into an agreement with JPMorgan to act as agent for the WSIB in securiti es lending transacti ons. As JPMorgan is the custodian bank for the WSIB, it is counterparty to securiti es lending transacti ons.
The L&I Funds report securiti es lent (the underlying securiti es) as assets in the Statement of Net Assets. Cash received as collateral on securiti es lending transacti ons and investments made with that cash are reported as assets. Securiti es received as collateral are reported as assets if the L&I Funds have the ability to pledge or sell them without a borrower default. Liabiliti es resulti ng from these transacti ons are also reported in the Statement of Net Assets. Securiti es lending transacti ons collateralized by securiti es that the L&I Funds do not have the ability to pledge or sell unless the borrower defaults are not reported as assets and liabiliti es.
Fixed income securiti es were loaned and collateralized by the L&I Funds’ agent with cash and U.S. government securiti es (exclusive of mortgage backed securiti es and lett ers of credit), and irrevocable lett ers of credit. When the loaned securiti es had collateral denominated in the same currency, the collateral requirement was 102 percent of the fair value, including accrued interest, of the securiti es loaned. All other securiti es were required to be collateralized at 105 percent of the fair value, including accrued interest, of the loaned securiti es. The collateral held and fair value of securiti es on loan at June 30, 2010 was $2,574,586,477 and $2,513,515,139, respecti vely. As of June 30, 2010, the amounts the L&I Funds owed the borrowers exceeded the amounts the borrowers owed the L&I Funds, resulti ng in no credit risk exposure.
As of June 30, 2010, the L&I Funds held the following securiti es as collateral (in thousands)
Cash and Cash Equivalents $1,763,496
Commercial Paper 232,552
Securiti zed Debt Instruments 178,589
Repurchase Agreements 133,309
Medium Term Notes 112,777
Corporate Bonds 66,867
Miscellaneous 61,655
U.S. Government Securiti es 25,341
Total Collateral Held $2,574,586
During fi scal year 2010, securiti es lending transacti ons could be terminated on demand by either the L&I Funds or the borrower. The weighted average maturity of loans for 2010 was 2.2 days. Cash collateral was invested by the L&I Funds’ in the WSIB’s short-term investment pool (average fi nal maturity of 30 days). Because the securiti es lending agreements were terminable at will, their durati on did not generally match the durati on of the investments made with the cash collateral. Non-cash collateral could not be pledged or sold absent borrower default. Accordingly, non cash collateral held under securiti es lending contracts with a value of $196,907,369 has not been included in the Statement of Net Assets. There are no restricti ons on the amount of securiti es that can be lent.
Securiti es were lent with the agreement that they would be returned in the future for exchange of the collateral. JPMorgan indemnifi ed the WSIB by agreeing to purchase replacement securiti es or return the cash collateral in the event a borrower failed to return the loaned securiti es or pay distributi ons thereon. JPMorgan’s responsibiliti es included performing appropriate borrower and collateral investment credit analyses, demanding adequate types and levels of collateral, and complying with applicable federal regulati ons concerning securiti es lending.
During fi scal year 2010, there were no signifi cant violati ons of legal or contractual provisions, no failures by any borrowers to return loaned securiti es or to pay distributi ons thereon. Further, the L&I Funds incurred no
losses during fi scal year 2010 resulti ng from a default by either the borrowers or the securiti es lending agents.
NOTE 5. DERIVATIVESL&I Funds are authorized to uti lize various derivati ve fi nancial instruments, including mortgage-backed securiti es, fi nancial futures, forward contracts, interest rate and equity swaps, and opti ons to manage its exposure to fl uctuati ons in interest and currency rates while increasing portf olio returns. Derivati ve transacti ons involve, to varying degrees, market and credit risk. L&I Funds miti gate market risks arising from derivati ve transacti ons by requiring collateral in cash and investments to be maintained equal to the securiti es positi ons outstanding, and thereby prohibiti ng the use of leverage or speculati on. Credit risks arising from derivati ve transacti ons are miti gated by selecti ng and monitoring creditworthy counterparti es and collateral issuers.
Consistent with the L&I Funds’ authority to invest in derivati ves, internati onal acti ve equity managers may make limited investments in fi nancial futures, forward contracts or other derivati ve securiti es to manage exposure to currency rate risk and equiti ze excess cash holdings. No such derivati ve securiti es were held as of June 30, 2010. Domesti c and foreign passive equity index fund managers may also uti lize various derivati ve securiti es to manage exposure to risk and increase portf olio returns. Informati on on the extent of use and holdings of derivati ve securiti es by passive equity index fund managers is unavailable. At June 30, 2010, the only derivati ve securiti es held directly by L&I Funds were collateralized mortgage obligati ons of $1,746,487,279.
NOTE 6. SUMMARY OF INVESTMENT POLICYUnder RCW 43.33A.030, Trusteeship of the L&I Funds is vested in the voti ng members of the WSIB. The Legislature has established a standard of care for investment of these funds in RCW 43.33A.140. Additi onally, the WSIB and its staff must comply with other state laws, such as the Ethics in Public Service Act, RCW 42.52, as it makes its investment decisions and seeks to meet the following investment objecti ves.

Page 41
Strategic ObjectivesIn accordance with RCW 43.33.110, these portf olios are to be managed to limit fl uctuati ons in the industrial insurance premiums, and subject to this purpose, achieve a maximum return at a prudent level of risk. Based on this requirement, the order of the objecti ves shall be:
Maintain the solvency of the funds; Maintain premium rate stability; Ensure suffi cient assets are available to fund the
expected liability payments; and Subject to those above, achieve a maximum return
at a prudent level of risk.
Performance ObjectivesThe performance objecti ves are intended to provide the WSIB and L&I Funds with a way to measure the success of this investment policy, the overall asset allocati on strategy, and the implementati on of that strategy over ti me. First and foremost, the performance of the investment portf olios shall be judged relati ve to the strategic objecti ves. With the fi rst three criteria met, the actual rates of return of the portf olios will be compared to the Comparable Market Index (CMI) for each fund. The CMI’s are developed and calculated with the goal to construct a hypotheti cal passive portf olio with the durati on, asset allocati on, and appropriate mix of fi xed income sectors based on the individual targets for each L&I fund. The return for each fund’s portf olio should not be signifi cantly diff erent from that of its CMI over the long term.
Portfolio Constraints All assets under the management of the WSIB are to
be invested to maximize return at a prudent level of risk in accordance with RCW 43.33A.110 and RCW 43.33A.140, which state, in part, that the WSIB is to “…establish investment policies and procedures designed to att empt to limit fl uctuati ons in industrial insurance premiums, and subject to this purpose, to maximize return at a prudent level of risk.”
No corporate fi xed income issue’s cost shall exceed 3 percent of the fund’s fair value at the ti me of purchase, nor shall its fair value exceed 6 percent of the funds’ fair value at any ti me (RCW 43.33A.140).
Asset Allocation – Target and Ranges
Fixed Income TIPS Equity
Accident Fund
80%±4 10%±2 10%±2
Pension Reserve Fund
80%±4 10%±2 10%±2
Medical Aid Fund
65%±5 20%±3 15%±3
Supplemental Pension Fund
100% NA NA
Asset allocati on will be reviewed every 3-4 years, or sooner, if there are signifi cant changes in funding levels or the liability durati ons.
Market conditi ons, funding status, and liability assumpti ons are dynamic, not stati c; therefore, WSIB staff will meet quarterly with L&I staff to review the investment portf olio, the status of the funding levels, the liability durati ons and to evaluate the percentage of the supplemental pension fund that is to be considered non-cash.
Assets will be rebalanced across asset classes when the fair value of the assets falls outside the policy ranges. The ti ming of any rebalancing will be based on market opportuniti es, cash fl ows, and the considerati on of transacti on costs; therefore, they need not occur immediately.
Asset Class StructureAsset class structure is established by the WSIB with guidelines for staff to move assets in order to achieve the Fund’s overall objecti ves.
Equity
Equity Allocati on Target Range
U.S. Equity 60% 55%-65%
Internati onal Equity 40% 35%-45%
The benchmark and structure for U.S. equiti es will be the broad U.S. stock market as defi ned by the Dow Jones U.S. Total Stock Market Index. The benchmark and structure for internati onal equiti es will be the Morgan Stanley Capital Internati onal All Country World Ex U.S. Investable Market Index (MSCI ACW Ex U.S. IMI). Both portf olios will be 100 percent passively managed in commingled index funds. The commingled funds may use futures for hedging or establishing a long positi on.
Treasury Inflation Protection SecuritiesThe treasury infl ati on protecti on securiti es (TIPS) will be managed to plus or minus 20 percent of the durati on of the Barclays Capital U.S. TIPS Index.
Fixed IncomeThe fi xed income portf olios’ structure will vary widely among funds depending upon the required durati on target.
Accident Fund (608): within plus or minus 20 percent of a durati on target of 7.
Pension Reserve Fund (610): within plus or minus 20 percent of a durati on target of 7.
Medical Aid Fund (609): within plus or minus 20 percent of a durati on target of 6.
Supplemental Pension Fund (881): a durati on of less than 2.
The durati on targets will be reviewed every 3 years, or sooner, if there are signifi cant changes in the funding levels or the liability durati ons.
It is the goal of the fi xed income portf olios to match the target durati ons. Although there may be diff erences from the targets due to market conditi ons, over any extended period of ti me those diff erences should not be material.
Permissible Fixed Income Investments U.S. Treasuries and Government Agencies Credit Bonds Mortgage-Backed Securiti es rated investment grade,

Page 42
Investment Type Aaa Aa1 Aa2 Aa3 A1 A2 A3 Baa1 Baa2 Baa3 Ba1 or LowerCommercial Mortgage Backed Securities 554,451,450$ 485,784,381$ -$ 28,160,900$ 40,506,169$ -$ -$ -$ -$ -$ -$ -$ Corporate Bonds - Domestic 3,081,812,196 116,121,045 - - 364,886,031 307,415,919 786,111,184 290,627,309 510,698,970 513,004,187 169,785,047 23,162,504 Corporate Bonds - Foreign (USD) 2,753,891,896 375,070,745 - 245,090,635 316,123,844 329,247,969 84,836,028 240,359,857 288,580,524 522,372,868 300,244,426 51,965,000
Total 6,390,155,542$ 976,976,171$ -$ 273,251,535$ 721,516,044$ 636,663,888$ 870,947,212$ 530,987,166$ 799,279,494$ 1,035,377,055$ 470,029,473$ 75,127,504$
Total Fair ValueMoody's Equivalent Credit Rating
Investment Type Total Fair Value Less than 1 year 1-5 years 6-10 years More than 10 yearsEffective Duration
Credit Rating
Residental Mortgage Backed Securities 1,747,600,898$ 23,934,769$ 889,862,228$ 732,074,209$ 101,729,692$ 6.11 AaaCommercial Mortgage Backed Securities 554,451,450 56,490,112 351,053,946 146,124,748 782,644 3.91 Schedule 2Corporate Bonds - Domestic 3,081,812,196 125,038,619 680,589,196 1,016,490,488 1,259,693,893 8.07 Schedule 2Corporate Bonds - Foreign (USD) 2,753,891,896 118,325,759 824,661,513 1,029,889,168 781,015,456 6.67 Schedule 2Government Securities-Domestic: U.S. Government Treasuries 605,291,524 - 605,291,524 - - 1.63 Aaa U.S. Treasury Inflation Protected Securities 1,606,498,399 89,365,204 246,322,861 704,526,952 566,283,382 4.35 Aaa
10,349,546,363 413,154,463$ 3,597,781,268$ 3,629,105,565$ 2,709,505,067$
Investments Not Required to be Categorized
Commingled Index Funds-Domestic 775,727,676 Commingled Index Funds-Foreign 548,241,309 Money Market Funds 220,859,845 Total Investments Not Categorized 1,544,828,830
Total L & I Funds Investments 11,894,375,193$
Maturity
as defi ned by Barclays Capital Global Family of Fixed Income Indices
Asset-Backed Securiti es rated investment grade, as defi ned by Barclays Capital Global Family of Fixed Income Indices
Commercial Mortgage-Backed Securiti es rated investment grade, as defi ned by Barclays Capital Global Family of Fixed Income Indices
Investment Grade Non-U.S. Dollar Bonds
Sector AllocationsSector Allocati ons are to be managed within the ranges presented below. These targets are long-term in nature. Deviati ons may occur in the short-term as a result
SCHEDULE 1: SCHEDULE OF MATURITIES AND CREDIT RATINGS
SCHEDULE 2: ADDITIONAL CREDIT RATING DISCLOSURES
of interim market conditi ons. However, if a range is exceeded, the portf olios must be rebalanced as soon as it is practi cal to the target allocati ons.
Target allocati ons for the Fixed Income Sectors:
U.S. Treasuries and Government Agencies 5% - 25%
Credit Bonds 20% - 70%
Asset-Backed Securiti es 0% - 10%
Commercial Mortgage Backed Securiti es 0% - 10%
Mortgage Backed Securiti es 0% - 25%
Total holdings of below investment grade credit bonds (as defi ned by Barclays Capital Global Family of Fixed Income Indices) should not exceed 5 percent of total fi xed income holdings.

Page 43
INDEPENDENT AUDITORS’ REPORTTo the Members of the Washington State Investment BoardOlympia, WashingtonWe have audited the accompanying statement of net assets for the Permanent Funds (Millersylvania Park, American Indian Scholarship Endowment, Agricultural School, Normal School, Common School, Scienti fi c School, and State University) of the State of Washington as managed by the Washington State Investment Board (“the Permanent Funds”) as of June 30, 2010, and the related statement of changes in net assets for the year then ended. These fi nancial statements are the responsibility of the Washington State Investment Board’s management. Our responsibility is to express an opinion on these fi nancial statements based on our audit.
We conducted our audit in accordance with auditi ng standards generally accepted in the United States. Those standards require that we plan and perform the audit to obtain reasonable assurance about whether the fi nancial statements are free of material misstatement. An audit includes examining, on a test basis, evidence supporti ng the amounts and disclosures in the fi nancial statements. An audit also includes assessing the accounti ng principles used and signifi cant esti mates made by management, as well as evaluati ng the overall fi nancial statement presentati on. We believe that our audit provides a reasonable basis for our opinion.
The fi nancial statements referred to in the fi rst paragraph present only the investment acti vity of the Permanent Funds as managed by the Washington State Investment Board. The fi nancial statements do not purport to, and do not, present the fi nancial acti vity of the Permanent Funds of other state agencies. Further, they do not purport to, and do not, present the fi nancial acti vity of the Washington State Investment Board or of the State of Washington.
In our opinion, the fi nancial statements referred to in the fi rst paragraph present fairly, in all material respects, the net assets of the Permanent Funds as of June 30, 2010, and the changes in net assets for the year then ended in conformity with accounti ng principles generally accepted in the United States. Our audit was conducted for the purpose of forming an opinion on the fi nancial statements of the Permanent Funds. Management’s Discussion and Analysis preceding the fi nancial statements is presented for purposes of additi onal analysis and is not a required part of the fi nancial statements referred to in the fi rst paragraph. We have applied certain limited procedures, which consisted principally of inquiries of management regarding the methods of measurement and presentati on of the supplementary informati on. However, we did not audit the informati on and express no opinion on it. The introducti on secti on of the annual report has not been subjected to the auditi ng procedures applied in the audit of the fi nancial statements and, accordingly, we express no opinion on it.
/S/ PETERSON SULLIVAN LLP
October 28, 2010
PERMANENT FUNDS
CERTIFIED PUBLIC ACCOUNTANTS
601 UNION STREET, SUITE 2300
SEATTLE, WASHINGTON 98101
TEL 206.382.7777 • FAX 206.382.7777
http://www.pscpa.com
PETERSON SULLIVAN LLP

Page 44
Management’s Discussion and Analysis for the Permanent Funds of the state of Washington, managed by the Washington State Investment Board (WSIB), is presented as an introducti on to the fi nancial statements. It is meant to assist the reader in understanding the fi nancial statements by providing an overall review of the fi nancial acti viti es during the year as well as to provide a comparison to the prior year’s acti viti es and results. The WSIB manages funds for other state of Washington departments. This secti on of the report represents only the Permanent Funds porti on.
Following this secti on of the report are the fi nancial statements and footnotes. The Statement of Net Assets provides informati on on the types of investments and the liabiliti es of the Permanent Funds. This informati on is summarized in Table 1. Table 1 also compares the asset, liability, and net asset balances at June 30, 2010, with those at June 30, 2009. The Statement of Changes in Net Assets provides informati on on investment performance and other increases and decreases in the net assets of the Permanent Funds for the year ended June 30, 2010. This informati on is summarized in Table 2. Table 2 also compares the fi nancial acti viti es of the Permanent Funds for the year ended June 30, 2010, with those of the year ended June 30, 2009. The Notes to the Financial Statements provide additi onal informati on that is essenti al to a full understanding of the data provided in the fi nancial statements of the Permanent Funds.
As shown in Table 1, the net assets of the Permanent Funds increased by $60.0 million during the fi scal year ended June 30, 2010. Contributi ons from the Department of Natural Resources (DNR) increased net assets by $17.3 million, which were invested in fi xed income securiti es. Unrealized gains in the fi xed income portf olio totaled $43.1 million and the equity portf olio amounted to $1.2 million for a total net asset value increase of $44.3 million. Distributi ons to benefi ciary funds reduced net assets by $(32.8) million. The remaining increase of $31.2 million represents reinvestment of other net investment income within the portf olio.
The following summarizes the changes within each grouping listed within Table 1:
Money market funds increased by $.9 million. This cash balance represents less than 1 percent of total invested balances and is within policy targets. Cash is held to cover potenti al cash needs of DNR and to cover distributi ons to benefi ciary funds and can fl uctuate within policy targets.
Fixed income investments increased by $57.7 million. Unrealized gains for the year totaled $43.1 million. With the excepti on of Treasury Infl ati on Protected Securiti es (TIPS) held in the Commingled Monthly Bond Fund (CMBF), the change in the value of the fi xed income investments increased due to the decreases in interest rates experienced throughout the fi scal year. Distributi ons to benefi ciary funds exceeded contributi ons from DNR and reduced fi xed income investments by $(15.5) million to cover these net disbursements. The remaining increase in this asset class was the
MANAGEMENT DISCUSSION & ANALYSISresult of reinvestment of earnings into fi xed income securiti es.
Equity investments increased $1.2 million due exclusively to unrealized gains resulti ng from the positi ve investment returns during the fi scal years.
The change in net receivables and payables was insignifi cant.
WSIB staff rebalances the Permanent Funds’ assets between asset classes as markets move pursuant to WSIB policy.
As shown in Table 2, net investment income increased by $28.9 million, almost enti rely due to the positi ve investment returns within the portf olio. The fi xed income investments returned 9.4 percent and the equity
TABLE 1: SUMMARIZED NET ASSETS 2010 2009 DOLLAR CHANGE PERCENT CHANGE
Money Market Funds $1,814,592 $855,893 $958,699 112.0%
Fixed Income Investments 850,437,115 792,722,965 57,714,150 7.3%
Equity Investments 8,877,267 7,640,232 1,237,035 16.2%
Total Investments 861,128,974 801,219,090 59,909,884 7.5%
Earnings Receivable 2,613,321 2,559,978 53,343 2.1%
Total Assets 863,742,295 803,779,068 59,963,227 7.5%
Distributi ons Payable 2,704,082 2,742,895 (38,813) (1.4%)
Net Assets $861,038,213 $801,036,173 $60,002,040 7.5%
TABLE 2: SUMMARIZED CHANGES IN NET ASSETS 2010 2009 DOLLAR CHANGE PERCENT CHANGE
Net Investment Income
Interest, Dividends and Other Investment Income $31,390,640 $32,334,977 $(944,337) (2.9%)
Unrealized Gains 44,254,927 14,445,815 29,809,112 206.4%
Less:
Investment Fees (126,818) (141,031) (14,213 ) (10.1%)
Net Investment Income 75,518,749 46,639,761 28,878,988 61.9%
Net Amount Contributed 17,292,912 8,809,178 8,483,734 96.3%
Distributi ons to Benefi ciaries (32,809,621) (35,293,475) (2,483,854) (7.0%)
Net Assets - Beginning 801,036,173 780,880,709 20,155,464 2.6%
Net Assets - Ending $861,038,213 $801,036,173 $60,002,040 7.5%

Page 45
Millersylvania Park
American Indian Scholarship Endowment
Agricultural School
NormalSchool
Common School Scientific School State University Total
Net Investment Income Investment Income: Interest, Dividends and Other Investment Income 12$ 13,218$ 7,062,145$ 8,956,357$ 6,604,373$ 7,611,720$ 1,138,658$ 31,386,483$ Realized Capital Gains - 341 - - 2,994 - 822 4,157 Unrealized Gains - 17,498 9,495,313 12,340,095 10,344,767 10,486,865 1,570,389 44,254,927 Less: Investment Expenses - - - - (905) - - (905) WSIB Operating Expenses (1) (97) (27,503) (35,724) (27,703) (30,341) (4,544) (125,913) Net Investment Income 11 30,960 16,529,955 21,260,728 16,923,526 18,068,244 2,705,325 75,518,749
Other Changes in Net Assets Net Amount Contributed - 97 5,837,503 4,141,724 1,539,703 5,184,341 589,544 17,292,912 Income Distributions to Beneficiaries (10) (17,930) (7,252,382) (9,410,395) (6,935,390) (7,997,071) (1,196,443) (32,809,621)
Increase in Net Assets 1 13,127 15,115,076 15,992,057 11,527,839 15,255,514 2,098,426 60,002,040
Net Assets - June 30, 2009 5,152 633,557 174,171,730 227,827,903 176,368,348 192,912,582 29,116,901 801,036,173 Net Assets - June 30, 2010 5,153$ 646,684$ 189,286,806$ 243,819,960$ 187,896,187$ 208,168,096$ 31,215,327$ 861,038,213$
PERMANENT FUNDS STATEMENT OF NET ASSETS - JUNE 30, 2010See notes to financial statements
PERMANENT FUNDS STATEMENT OF CHANGES IN NET ASSETS - YEAR ENDED JUNE 30, 2010See notes to financial statements
Millersylvania Park
American Indian Scholarship Endowment
Agricultural School
NormalSchool
Common School Scientific School State University TotalPercent of
Total
ASSETS Investments: Money Market Funds 5,152$ 296,249$ 286,421$ 469,132$ 81,571$ 350,673$ 325,394$ 1,814,592$ 0.2% Commingled Monthly Bond Fund - 349,344 189,020,824 243,377,182 178,956,582 207,839,909 30,893,274 850,437,115 98.8% Commingled Equity Index Fund - Domestic - - - - 8,877,267 - - 8,877,267 1.0% Total Investments 5,152 645,593 189,307,245 243,846,314 187,915,420 208,190,582 31,218,668 861,128,974 100.0% Investment Earnings Receivable 2 1,091 580,838 747,874 549,901 638,668 94,947 2,613,321 Total Assets 5,154 646,684 189,888,083 244,594,188 188,465,321 208,829,250 31,313,615 863,742,295
LIABILITIES Distributions and Other Payables 1 - 601,277 774,228 569,134 661,154 98,288 2,704,082 NET ASSETS 5,153$ 646,684$ 189,286,806$ 243,819,960$ 187,896,187$ 208,168,096$ 31,215,327$ 861,038,213$
portf olio had a return of 16.2 percent during the current fi scal year. Interest rates during the year have declined resulti ng in less distributable income to the Permanent Funds from the CMBF.
Contributi ons received from the Department of Natural Resources increased by $8.5 million due to increased prices on ti mber sales during the current fi scal year.
Distributi ons to benefi ciaries decreased by $2.5 million. The decrease in income collecti ons in the CMBF due to falling interest rates caused distributi ons to benefi ciary funds to decrease as well.
The fair value of the Permanent Fund assets is directly impacted by the returns of the various capital markets within which the WSIB invests and the returns are
expected to have a signifi cant eff ect on fi nancial positi on and results of operati ons in the future. However, one of the benefi ts of diversifi cati on gained by investi ng across various investment types as well as broadly within an asset class is the reducti on in aggregate volati lity of the total investment portf olio.

Page 46
NOTE 1. DESCRIPTION OF FUNDS AND SIGNIFICANT ACCOUNTING POLICIESDescription of FundsThe Permanent Funds of the state of Washington include funds established by the State Enabling Act and funds created by private donati on. Funds established by the State Enabling Act consist of the Agricultural School Permanent Fund, the Normal School Permanent Fund, the Common School Permanent Fund, the Scienti fi c School Permanent Fund, and the State University Permanent Fund. Originally, land was granted to the state by the federal government at statehood to establish these permanent funds. The Permanent Funds consist of proceeds from sales of these lands and related natural resources. The proceeds from these sales are deposited by the Department of Natural Resources in each respecti ve Permanent Fund account for investment by the WSIB. The Permanent Fund known as the Millersylvania Park Permanent Fund was established in 1931 from a gift of cash and securiti es for the establishment, maintenance, and upkeep of the Millersylvania State Park. The American Indian Scholarship Endowment Fund was created in 1990 to help American Indian students obtain a higher educati on and contains both private donati ons and matching funds appropriated by the state.
The fi xed income investments held by the Permanent Funds are commingled into one fund called the Commingled Monthly Bond Fund (CMBF). The Permanent Funds hold units of shares of the CMBF. The CMBF complies with the Permissible Investments and Portf olio Constraints of the WSIB Permanent Funds investment policy.
The fi nancial statements present only the acti vity of the Permanent Funds as managed by the WSIB. The WSIB has exclusive control of the investments held by the Permanent Funds. The fi nancial statements do not present the fi nancial positi on and results of operati ons of the WSIB.
Basis of AccountingThe accompanying fi nancial statements have been prepared in conformity with accounti ng principles generally accepted in the United States for governments prescribed by the Governmental Accounti ng Standards Board (GASB) on the accrual basis of accounti ng.
Valuation of InvestmentsInvestments are reported at fair value. Fair values are based on published market prices, quotati ons from nati onal security exchanges, and security pricing services. Investments are adjusted to fair value monthly. Unrealized gains and losses are included as investment income in the Statement of Changes in Net Assets.
Revenue RecognitionInterest and dividend income is recognized when earned. Capital gains and losses are recognized on a trade date basis. Purchases and sales of investments are also recorded on a trade date basis.
Withdrawal PolicyCapital losses are deferred and amorti zed against future income distributi ons to benefi ciary funds when the cumulati ve losses for the year exceed the expendable fund balance, net of unrealized gains and losses, as of the fi scal year end. Net capital gains for the fi scal year are retained as corpus, increasing expendable fund balance, and are used to off set potenti al future capital losses. This process is necessary to meet legal requirements that do not allow capital losses to erode the corpus of the invested funds. Interest earnings are distributed to benefi ciary funds on a monthly basis.
Securities LendingThe Permanent Funds invest in the CMBF which holds the securiti es and parti cipates in lending acti viti es. Each Permanent Fund owns units in the CMBF and does not directly parti cipate in securiti es lending acti viti es. Accordingly, the lending acti vity is not presented within each individual fund in the accompanying fi nancial statements.
The collateral received under securiti es lending agreements, where the funds have the ability to spend, pledge, or sell the collateral without borrower default, is included in the CMBF net assets. Liabiliti es resulti ng from these transacti ons are also included in the CMBF net assets. Additi onally, costs associated with securiti es lending transacti ons, including broker rebates and investment management fees paid, are part of the CMBF and are not reported directly by the Permanent Funds. Securiti es lending income received by the CMBF
during fi scal year 2010 was $457,515. Securiti es lending expenses during the fi scal year totaled $205,688.
Use of EstimatesThe preparati on of fi nancial statements in conformity with accounti ng principles generally accepted in the United States requires management to make esti mates and assumpti ons that aff ect certain reported amounts and disclosures. Actual results could diff er from the esti mated amounts.
NOTE 2. FEES AND EXPENSESInvestment fees and expenses are accounted for as a reducti on of investment income or are nett ed directly from the asset value of Permanent Funds and CMBF investments. These fees include investment management fees and commissions, investment consultant fees, legal fees, and other investment management related expenses. The WSIB operati ng expenses are charged to the funds based upon actual costs incurred to manage the investments. WSIB operati ng expenses are allocated to the funds under management based on relati ve market values, in accordance with State statutes.
NOTE 3. DEPOSIT AND INVESTMENT RISK DISCLOSURES Custodial Credit Risk – DepositsCustodial credit risk for deposits is the risk that in the event of a bank failure the Permanent Funds deposits may not be returned to it. The Permanent Funds do not have a deposit policy for custodial credit risk. As of June 30, 2010, there were no deposits with the custodial bank.
Custodial Credit Risk – InvestmentsCustodial credit risk for investments is the risk that, in the event of a failure of the counterparty to a transacti on, the Permanent Funds will not be able to recover the value of investments that are in the possession of an outside party. The Permanent Funds miti gates custodial credit risk by having its investment securiti es held by its custodian. Also, investment securiti es are registered in the name of the Washington State Investment Board for the benefi t of the Permanent Funds, excluding cash and cash equivalents and
NOTES TO FINANCIAL STATEMENTS

Page 47
repurchase agreements held as securiti es lending collateral.
Interest Rate RiskInterest rate risk is the risk that changes in interest rates over ti me will adversely aff ect the fair value of an investment. Eff ecti ve durati on is the measure of a debt investment’s exposure to fair value changes arising from changes in interest rates. Eff ecti ve durati on uses the present value of cash fl ows, weighted for those fl ows as a percentage of the investment’s full price. Increases in prevailing interest rates generally translate into decreases in fair values of those investments. As of June 30, 2010, the Permanent Funds’, including the CMBF, durati ons of the various fi xed income classes were within the durati on targets of the Barclays Capital Aggregate Index.
Schedule 1 provides informati on about the interest rate risks associated with the CMBF investments as of June 30, 2010. The schedule displays various asset classes held by maturity in years, eff ecti ve durati ons, and credit rati ngs. Residenti al mortgage backed, commercial mortgage backed, and asset-backed securiti es are reported using the average life within the portf olio. The average life is a calculated esti mate of the average ti me (in years) unti l maturity for these securiti es taking into account possible prepayments of principal. All other securiti es on this schedule are reported using the stated maturity date.
Credit RiskCredit risk is the risk that an issuer or other counterparty to an investment will not fulfi ll its obligati ons. The Permanent Funds’ CMBF rated debt investments as of June 30, 2010, were rated by Moody’s and/or an equivalent nati onal rati ng organizati on. Investment types with multi ple rati ngs are presented in Schedule 1 using the Moody’s rati ng scale.
Concentration of Credit RiskConcentrati on of credit risk is the risk of loss att ributed to the magnitude of an investment in a single issuer. The Permanent Funds’ policy states no corporate fi xed income issue’s cost shall exceed 3 percent of the fund’s fair value at the ti me of purchase, nor shall its fair value exceed 6 percent of the fund’s fair value at any ti me.
There was no concentrati on of credit risk in the CMBF that exceeded these limits as of June 30, 2010.
Foreign Currency RiskForeign currency risk is the risk that changes in exchange rates will adversely aff ect the fair value of an investment or a deposit. The Permanent Funds have no formal policy to limit foreign currency risk. Currently, the only foreign securiti es held by the CMBF are traded and denominated in U.S. dollars. The Permanent Funds had no investments with foreign currency risk exposure.
NOTE 4. SECURITIES LENDINGWashington state law and WSIB policy permit the Permanent Funds to parti cipate in securiti es lending programs to augment investment income. The WSIB has entered into an agreement with JPMorgan to act as agent for the WSIB in securiti es lending transacti ons. As JPMorgan is the custodian bank for the WSIB, it is counterparty to securiti es lending transacti ons.
The CMBF reports securiti es lent (the underlying securiti es) as assets. Securiti es lending acti vity is part of the CMBF and, accordingly, is not reported directly by the Permanent Funds in the accompanying fi nancial statements. The Permanent Funds own units in the CMBF, similar to a mutual fund. The CMBF engages in all lending acti vity and reports the net lending income acti vity within the fund as increases in the share price of the CMBF. Cash received as collateral on securiti es lending transacti ons and investments made with the cash are reported as assets with an off setti ng liability. Securiti es lending transacti ons collateralized by securiti es the CMBF does not have the ability to pledge or sell unless the borrower defaults are not reported as assets and liabiliti es.
Fixed income securiti es were loaned and collateralized by the WSIB’s agent with cash and U.S. government securiti es (exclusive of mortgage backed securiti es and lett ers of credit), and irrevocable lett ers of credit. When the loaned securiti es had collateral denominated in the same currency the collateral requirement was 102 percent of the fair value, including accrued interest, of the securiti es loaned. All other securiti es were required to be collateralized at 105 percent of the fair value, including accrued interest, of the loaned securiti es. The
collateral held and fair value of securiti es on loan at June 30, 2010 and 2009, was $216,996,926 and $212,570,458, respecti vely. As of June 30, 2010, the amounts the CMBF owed the borrowers exceeded the amounts the borrowers owed the CMBF, resulti ng in no credit risk exposure.
During fi scal year 2010, securiti es lending transacti ons within the CMBF could be terminated on demand by either the WSIB or the borrower. The weighted average maturity of loans for 2010 was 2.2 days.
Cash collateral was invested by the WSIB’s agents in the WSIB’s short-term investment pool (average fi nal maturity of 30 days) or term loans. Because the securiti es lending agreements were terminable at will, their durati on did not generally match the durati on of the investments made with the cash collateral. Non-cash collateral could not be pledged or sold absent borrower default. Accordingly, non cash collateral held under securiti es lending contracts with a value of $16,596,177 have not been included in the CMBF. There are no restricti ons on the amount of securiti es that can be lent.
As of June 30, 2010, the CMBF held the following securiti es as lending collateral (in thousands):
Cash and Securiti es Held as Collateral
Cash and Cash Equivalents $148,635
Commercial Paper 19,600
Securiti zed Debt Instruments 15,052
Repurchase Agreements 11,236
Medium Term Notes 9,505
Corporate Bonds 5,636
Miscellaneous 5,197
U.S. Government Securiti es 2,136
Total Collateral Held $216,997 Securiti es were lent with the agreement that they would be returned in the future for exchange of the collateral. JPMorgan indemnifi ed the WSIB by agreeing to purchase replacement securiti es or return the cash collateral in the event a borrower failed to return the loaned securiti es
Page 48
or pay distributi ons thereon. JPMorgan’s responsibiliti es included performing appropriate borrower and collateral investment credit analyses, demanding adequate types and levels of collateral, and complying with applicable federal regulati ons concerning securiti es lending.
During fi scal year 2010, there were no signifi cant violati ons of legal or contractual provisions, no failures by any borrowers to return loaned securiti es or to pay distributi ons thereon. Further, the CMBF incurred no losses during fi scal year 2010 resulti ng from a default by either the borrowers or the securiti es lending agents.
NOTE 5. DERIVATIVESPermanent Funds are authorized to uti lize various derivati ve fi nancial instruments, including mortgage-backed securiti es, fi nancial futures, forward contracts, interest rate and equity swaps, and opti ons to manage its exposure to fl uctuati ons in interest and currency rates while increasing portf olio returns. Derivati ve transacti ons involve, to varying degrees, market and credit risk. Permanent Funds miti gate market risks arising from derivati ve transacti ons by requiring collateral in cash and investments to be maintained equal to the securiti es positi ons outstanding, and thereby prohibiti ng the use of leverage or speculati on. Credit risks arising from derivati ve transacti ons are miti gated by selecti ng and monitoring creditworthy counterparti es and collateral issuers.
Consistent with the Permanent Funds’ authority to invest in derivati ves, internati onal acti ve equity managers may make limited investments in fi nancial futures, forward contracts or other derivati ve securiti es to manage exposure to currency rate risk and equiti ze excess cash holdings. No such derivati ve securiti es were held as of June 30, 2010. Domesti c and foreign passive equity index fund managers may also uti lize various derivati ve securiti es to manage exposure to risk and increase portf olio returns. Informati on on the extent of use and holdings of derivati ve securiti es by passive equity index fund managers is unavailable.
At June 30, 2010, the only derivati ve securiti es held directly by the Permanent Funds CMBF were collateralized mortgage obligati ons of $194,252,286.
NOTE 6. SUMMARY OF INVESTMENT POLICYUnder RCW 43.33A.030, Trusteeship of the Permanent Funds is vested in the voti ng members of the WSIB. The Legislature has established a standard of care for investment of this fund in RCW 43.33A.140. Additi onally, the WSIB and its staff must comply with other state laws, such as the Ethics in Public Service Act, 42.52 RCW, as it makes its investment decisions and seeks to meet the following investment objecti ves.
Strategic ObjectivesThe Permanent Fund investments are to be managed to achieve the highest return possible consistent with the desire to emphasize high current yield to maturity opportuniti es and to add value through acti ve management. The objecti ves include:
Safety of principal; Current income; Long-term stability of purchasing power; and Preservati on of the public’s trust.
Taken together, these objecti ves imply portf olios for which growth keeps pace with infl ati on over ti me (preservati on of capital), and are able to provide a stable level of income suffi cient to meet each fund’s consti tuent needs.
Performance ObjectivesThe Permanent Funds’ investment objecti ves are to emphasize stability and maximize income to support the operati ons of its irreducible principal. These Permanent Funds do have a small equity allocati on which incorporates limited exposure to portf olio growth. Within the required accounti ng guidelines, the Funds’ portf olio is to be managed, so that its individual performance meets or exceeds the return of its specifi c benchmark with a volati lity of returns that, over ti me, is similar to or less than the benchmarks for a similar level of returns. For the Permanent Funds, which have both equity and fi xed income holdings, the performance benchmark shall be a combinati on of the Dow Jones U.S. Total Stock Market Index and the Barclay’s Capital Aggregate Index, weighted by the exposure the fund has to each asset class. The WSIB will measure both the
book value income return and the marked-to-market total rate of return on the fund.
Risk ToleranceRisk will be managed in a prudent manner. Since the stakeholder only receives the current income and net capital appreciati on of the assets, Permanent Funds have a below average ability to tolerate volati lity in current income.
Portfolio Constraints All assets under the management of the WSIB are to
be invested to maximize return at a prudent level of risk in accordance with RCW 43.33A.110 and RCW 43.33A.140, which state, in part, that the WSIB is to “invest and manage the assets entrusted to it with reasonable care, skill, prudence and diligence under circumstances then prevailing which a prudent person acti ng in a like capacity and familiar with such matt ers would use in the conduct of an acti vity of like character and purpose.”
No corporate fi xed income issue’s cost shall exceed 3 percent of the fund’s fair value at the ti me of purchase, nor shall its fair value exceed 6 percent of the funds’ fair value at any ti me (RCW 43.33A.140).
Permissible Investments Any WSIB managed fund that meets a fund’s
investment objecti ves and its permissible investment constraints.
U.S. and non-U.S. public equity. Investment Grade Fixed Income – defi ned using the
method employed by the Lehman Brothers Global Family of Fixed Income Indices. Although fi xed income securiti es that are rated below investment grade may not be purchased, portf olio holdings that are downgraded to those levels or are no longer rated may conti nue to be held.
Permissible Fixed Income Market Segments
U.S. Treasuries and Government Agencies Credit Bonds

Page 49
Investment Type Total Fair Value Less than 1 year 1-5 years 6-10 years More than 10 years Effective Duration Credit Rating
Residential Mortgage Backed 195,256,277$ 12,520,538$ 147,188,809$ 33,323,188$ 2,223,742$ 3.45 AaaCommercial Mortgage Backed Securities 32,451,245 - 17,789,560 14,661,685 - 4.23 Aaa/Aaa2Corporate Bonds - Domestic 218,715,159 5,004,850 86,871,458 94,553,416 32,285,435 6.02 See BelowCorporate Bonds - Foreign (USD) 149,644,686 10,111,600 70,277,923 63,941,636 5,313,527 4.59 See BelowVariable Rate - Domestic 9,999,000 9,999,000 - - - 0.08 Aa2Government Securities-Domestic: U.S. Government Treasuries and Agencies 198,752,051 4,032,040 147,176,514 47,543,497 - 2.44 Aaa Treasury Inflation Protected Securities 17,137,335 17,137,335 - 1.93 Aaa
821,955,753 41,668,028$ 486,441,599$ 254,023,422$ 39,822,704$
Money Market Funds 24,651,888 Investment Earnings Receivable 6,442,677 Collateral Held Under Securities Lending Agreements 200,400,749 Total Commingled Bond Fund Investments 1,053,451,067
Due to Other Funds (2,613,203) Obligations Under Securities Lending Agreements (200,400,749) CMBF Net Asset Value - June 30, 2010 850,437,115$
Maturity
SCHEDULE 1: COMMINGLED MONTHLY BOND FUND (CMBF) SCHEDULE OF NET ASSET VALUE
Mortgage Backed Securiti es Asset-Backed Securiti es Commercial Backed Mortgage Securiti es Converti ble Securiti es Eurodollar Bonds Non-U.S. Dollar Bonds Other fi xed income segments and instruments may
be added from ti me to ti me as they are developed or deemed appropriate
Sector AllocationsPortf olio allocati ons are to be managed with the ranges presented below. These targets are long-term in nature.
Deviati ons may occur in the short-term as a result of interim market conditi ons. However, if a range is exceeded, the portf olio must be rebalanced to the target allocati ons, as soon as it is practi cal.
U.S. Treasuries and Government Agencies (The policy calls this Government Securiti es)
10% – 50%
Credit Bonds 10% – 50%
Asset-Backed Securiti es 0% – 10%
Commercial Mortgage Backed Securiti es 0% – 10%
Mortgage Backed Securiti es 5% – 40%
SCHEDULE 2: COMMINGLED MONTHLY BOND FUND (CMBF) CREDIT RATING (MOODY’S)
Duration TargetThe fi xed income portf olio’s durati on is to be targeted within plus or minus 20 percent of the durati on of the portf olio’s performance benchmark, the Barclays Capital Aggregate Index.
RatingCorporate Bonds
DomesticCorporate Bonds
Foreign (USD)
AAA 10,775,649$ 37,463,773$ Aa1 - - Aa2 - 23,443,734 Aa3 22,914,806 10,896,465 A1 25,500,842 16,392,842 A2 64,502,604 5,211,800 A3 28,425,650 5,313,527
Baa1 16,422,052 13,330,263 Baa2 34,560,218 22,038,930 Baa3 15,613,338 15,553,352
218,715,159$ 149,644,686$
Page 50
INDEPENDENT AUDITORS’ REPORTTo the Members of the Washington State Investment BoardOlympia, WashingtonWe have audited the accompanying statement of net assets for the Other Funds (Budget Stabilizati on, Reclamati on Revolving, Game & Special Wildlife, Pension Stabilizati on, Health Insurance, and Radiati on Perpetual) of the State of Washington as managed by the Washington State Investment Board (“the Other Funds”) as of June 30, 2010, and the related statement of changes in net assets for the year then ended. These fi nancial statements are the responsibility of the Washington State Investment Board’s management. Our responsibility is to express an opinion on these fi nancial statements based on our audit.
We conducted our audit in accordance with auditi ng standards generally accepted in the United States. Those standards require that we plan and perform the audit to obtain reasonable assurance about whether the fi nancial statements are free of material misstatement. An audit includes examining, on a test basis, evidence supporti ng the amounts and disclosures in the fi nancial statements. An audit also includes assessing the accounti ng principles used and signifi cant esti mates made by management, as well as evaluati ng the overall fi nancial statement presentati on. We believe that our audit provides a reasonable basis for our opinion.
The fi nancial statements referred to in the fi rst paragraph present only the investment acti vity of the Other Funds as managed by the Washington State Investment Board. The fi nancial statements do not purport to, and do not, present the fi nancial acti vity of the Trust Funds of other state agencies. Further, they do not purport to, and do not, present the fi nancial acti vity of the Washington State Investment Board or of the State of Washington.
In our opinion, the fi nancial statements referred to in the fi rst paragraph present fairly, in all material respects, the net assets of the Other Funds as of June 30, 2010, and the change in net assets for the year then ended in conformity with accounti ng principles generally accepted in the United States. Our audit was conducted for the purpose of forming an opinion on the fi nancial statements of the Other Funds. Management’s Discussion and Analysis preceding the fi nancial statements is presented for purposes of additi onal analysis and is not a required part of the fi nancial statements referred to in the fi rst paragraph. We have applied certain limited procedures, which consisted principally of inquiries of management regarding the methods of measurement and presentati on of the supplementary informati on. However, we did not audit the informati on and express no opinion on it. The introducti on secti on of the annual report has not been subjected to the auditi ng procedures applied in the audit of the fi nancial statements and, accordingly, we express no opinion on it.
/S/ PETERSON SULLIVAN LLP
October 28, 2010
CERTIFIED PUBLIC ACCOUNTANTS
601 UNION STREET, SUITE 2300
SEATTLE, WASHINGTON 98101
TEL 206.382.7777 • FAX 206.382.7777
http://www.pscpa.com
PETERSON SULLIVAN LLP
OTHER FUNDS

Page 51
Management’s Discussion and Analysis for the Other Funds of Washington state, managed by the Washington State Investment Board (WSIB), is presented as an introducti on to the fi nancial statements. It is meant to assist the reader in understanding the fi nancial statements by providing an overall review of the fi nancial acti viti es during the year as well as to provide a comparison to the prior year’s acti viti es and results. The WSIB manages funds for other Washington state departments. This secti on of the report represents only the Other Funds porti on.
Following this secti on of the report are the fi nancial statements and footnotes. The Statement of Net Assets provides informati on on the types of investments and liabiliti es of the Other Funds. This informati on is summarized in Table 1. Table 1 also compares the asset, liability, and net asset balances at June 30, 2010, with those at June 30, 2009. The Statement of Changes in Net Assets provides informati on on investment performance and other increases and decreases in the net assets of the Other Funds for the year ended June 30, 2010. This informati on is summarized in Table 2. Table 2 also compares the fi nancial acti viti es of the Other Funds for the year ended June 30, 2010, with those of the year ended June 30, 2009. The Notes to the Financial Statements provide additi onal informati on that is
essenti al to a full understanding of the data provided in the fi nancial statements of the Other Funds.
As shown in Table 1, the net assets of the Other Funds remained virtually unchanged during the fi scal year ended June 30, 2010. Distributi ons to benefi ciary funds resulted in a decrease in net assets of $(20) thousand. Net investment income was received and reinvested into money market securiti es and amounted to $78.5 thousand for the fi scal year ended June 30, 2010.
The fair value of Other Funds assets is minimally impacted by the returns of the various capital markets within which the WSIB is legislati vely allowed to invest. The majority of the Other Fund investments consist of money market instruments whose value has not been impacted by the current fi nancial market volati lity.
The following summarizes the changes within each major grouping listed on Table 1:
Money market funds increased by 0.2 percent. This increase resulted from investment earnings and maturiti es of municipal bonds both reinvested in this asset class.
MANAGEMENT DISCUSSION & ANALYSIS Fixed income securiti es decreased by (55.4) percent
due to maturiti es of municipal bonds, the proceeds of which were reinvested in money market funds.
Total receivables decreased by (88.4) percent due to the reducti on in short term interest rates throughout the year and reinvestment of cash in lower earning interest bearing securiti es.
As shown in Table 2, net investment income decreased by (99.0) percent due to large reducti ons in invested balances through withdrawals in the prior year and substanti al decreases in short term interest rates throughout the year. The net amount of withdrawals decreased due to withdrawals taken in the prior fi scal years. Substanti al withdrawals were made by the Budget Stabilizati on Fund and the Pension Stabilizati on Fund in 2009 which signifi cantly reduced the beginning invested net assets for the current fi scal year.
TABLE 1: SUMMARIZED NET ASSETS 2010 2009 DOLLAR CHANGE PERCENT CHANGE
Money Market Funds $116,510,543 $116,335,441 $175,102 0.2%
Fixed Income Investments 46,115 103,313 (57,198) (55.4%)
Total Investments 116,556,658 116,438,754 117,904 0.1%
Total Receivables 7,894 67,800 (59,906) (88.4%)
Net Assets $116,564,552 $116,506,554 $57,998 Trace
TABLE 2: SUMMARIZED CHANGES IN NET ASSETS 2010 2009 DOLLAR CHANGE PERCENT CHANGE
Net Assets - Beginning $116,506,554 $663,802,767 $(547,296,213) (82.4%)
Net Investment Income
Investment Income 78,570 7,806,054 (7,727,484) (99.0%)
Net Amount Withdrawn (20,572) (555,102,267) (555,081,695) (100.0%)
Net Assets - Ending $116,564,552 $116,506,554 $57,998 Trace

Page 52
OTHER FUNDS STATEMENT OF CHANGES IN NET ASSETS - YEAR ENDED JUNE 30, 2010See notes to financial statements
OTHER FUNDS STATEMENT OF NET ASSETS - JUNE 30, 2010See notes to financial statements
Budget Stabilization
Reclamation Revolving
Game & Special Wildlife
Pension Stabilization
Health Insurance
Radiation Perpetual
TotalPercent of
Total
ASSETS Investments: Money Market Funds 21,430,834$ 63,622$ 6,549,024$ -$ 88,136,642$ 330,421$ 116,510,543$ 100.0% Municipal Bonds - 46,115 - - - - 46,115 Trace Total Investments 21,430,834 109,737 6,549,024 - 88,136,642 330,421 116,556,658 100.0%
Interest Receivable 1,227 1,229 375 - 5,044 19 7,894
NET ASSETS 21,432,061$ 110,966$ 6,549,399$ -$ 88,141,686$ 330,440$ 116,564,552$
Budget Stabilization
Reclamation Revolving
Game & Special Wildlife
Pension Stabilization
Health Insurance
Radiation Perpetual
Total
Net Investment Income Investment Income 17,085$ 4,663$ 5,221$ 12$ 70,256$ 263$ 97,500$ Less: Investment Expenses (319) (3) (184) - (2,478) (9) (2,993) WSIB Operating Expenses (1,649) (19) (994) 161 (13,386) (50) (15,937) Net Investment Income 15,117 4,641 4,043 173 54,392 204 78,570
Net Amount Contributed (Withdrawn) (713) 19 994 (34,308) 13,386 50 (20,572) Increase (Decrease) in Net Assets 14,404 4,660 5,037 (34,135) 67,778 254 57,998
Net Assets - June 30, 2009 21,417,657 106,306 6,544,362 34,135 88,073,908 330,186 116,506,554 Net Assets - June 30, 2010 21,432,061$ 110,966$ 6,549,399$ -$ 88,141,686$ 330,440$ 116,564,552$

Page 53
NOTE 1. DESCRIPTION OF FUNDS AND SIGNIFICANT ACCOUNTING POLICIESDescription of FundsThe Other Funds of Washington state consist of: the Budget Stabilizati on, Reclamati on Revolving, Game and Special Wildlife, Pension Stabilizati on, Health Insurance, and the Radiati on Perpetual funds. These funds were created over the years by Washington state legislati on to fund various mandates and can be liquidated as needed to fund those mandates. These funds are invested by the WSIB unti l they are completely liquidated or legislati on closes the funds. The fi nancial statements present only the acti vity of the Other Funds as managed by the WSIB. The WSIB has exclusive control of the investments held by the Other Funds. The fi nancial statements do not present the fi nancial positi on and results of operati ons of the WSIB.
Basis of AccountingThe accompanying fi nancial statements have been prepared in conformity with accounti ng principles generally accepted in the United States for governments prescribed by the Governmental Accounti ng Standards Board (GASB) on the accrual basis of accounti ng.
Valuation of InvestmentsInvestments are reported at fair value. Fair values are based on published market prices, quotati ons from nati onal security exchanges and security pricing services. Investments are adjusted to fair values monthly. Unrealized gains and losses are included as investment income in the Statement of Changes in Net Assets.
Revenue RecognitionInterest and dividend income is recognized when earned. Capital gains and losses are recognized on a trade date basis. Purchases and sales of investments are also recorded on a trade date basis.
Contributions and WithdrawalsContributi ons and withdrawals are recorded when received or paid.
Use of EstimatesThe preparati on of fi nancial statements in conformity
with accounti ng principles generally accepted in the United States requires management to make esti mates and assumpti ons that aff ect certain reported amounts and disclosures. Actual results could diff er from the esti mated amounts.
NOTE 2. FEES AND EXPENSESInvestment fees and expenses are accounted for as a reducti on of investment income or are nett ed directly from the asset value of Other Fund investments. These fees include investment management fees and commissions, investment consultant fees, legal fees, and other investment management related expenses. The WSIB operati ng expenses are charged to the funds based upon actual costs incurred to manage the investments. WSIB operati ng expenses are allocated to the funds under management based on relati ve market values, in accordance with state statutes.
NOTE 3. DEPOSIT AND INVESTMENT RISK DISCLOSURES Custodial Credit Risk – DepositsCustodial credit risk for deposits is the risk that in the event of a bank failure the Other Funds’ deposits may not be returned to it. The Other Funds do not have a deposit policy for custodial credit risk. As of June 30, 2010, there were no deposits with the custodial bank.
Custodial Credit Risk – InvestmentsCustodial credit risk for investments is the risk that, in the event of a failure of the counterparty to a transacti on, the Other Funds will not be able to recover the value of investments that are in the possession of an outside party. The Other Funds do not have an investment policy specifi cally for custodial credit risk. As of June 30, 2010, all of the Other Funds’ securiti es were held in the Other Funds’ name and/or are not exposed to custodial credit risk.
Interest Rate RiskInterest rate risk is the risk that changes in interest rates over ti me will adversely aff ect the fair value of an investment. Eff ecti ve durati on is the measure of a debt investment’s exposure to fair value changes arising from changes in interest rates. Eff ecti ve durati on uses the present value of cash fl ows, weighted for those fl ows as
a percentage of the investment’s full price. Increases in prevailing interest rates generally translate into decreases in fair values of those investments. Schedule 1 provides informati on about the interest rate risks associated with the Other Funds’ investments as of June 30, 2010. The schedule displays various asset classes held by maturity in years, eff ecti ve durati ons and credit rati ngs.
Credit RiskCredit risk is the risk that an issuer or other counterparty to an investment will not fulfi ll its obligati ons.
Concentration of Credit RiskConcentrati on of credit risk is the risk of loss att ributed to the magnitude of an investment in a single issuer. The Other Funds have a formal investment policy that limits the amount these funds may invest in any one issuer to no more than 3 percent. At June 30, 2010, the Other Funds have no investment of any commercial or industrial organizati on whose fair value exceeds 3 percent of net assets, except for the Reclamati on Revolving Fund. The Reclamati on Revolving fund was created prior to this investment policy. The Reclamati on Revolving Funds’ municipal bond investments are 74 percent in Chelan County Enti at Irrigati on District, 26 percent in Chelan County Lower Stemilt Irrigati on District.
Foreign Currency RiskThe Other Funds do not have a policy regarding foreign currency risk, which is the risk that changes in exchange rates will adversely aff ect the fair value of an investment or a deposit. There was no foreign investment risk exposure at June 30, 2010.
NOTE 4. INVESTMENT POLICYUnder RCW 43.33A.030, Trusteeship of the Other Funds is vested in the voti ng members of the WSIB. The Legislature has established a standard of care for investment of these funds in RCW 43.33A.140. Additi onally, the WSIB and its staff must comply with other state laws, such as the Ethics in Public Service Act, RCW 42.52, as it makes its investment decisions and seeks to meet the following investment objecti ves.
NOTES TO FINANCIAL STATEMENTS

Page 54
Strategic ObjectivesThese Funds’ investments are to be managed to achieve the highest return possible consistent with the desire to emphasize current income. The objecti ves include:
Safety of Principal; Current Income; and Preservati on of the Public’s Trust.
Performance ObjectivesThese Funds’ investments are to emphasize stability and maximize income to support the operati ons of each program.
Risk ToleranceRisk will be managed in a prudent manner. The funds have a below average ability to tolerate volati lity.
Permissible Investments Government agencies and U.S. Treasuries Short-term Investment Funds (STIF) that invest
strictly in U.S. Government or Government Agency instruments, including Repurchase Agreements for U.S. Government and Agency instruments. The Pension Stabilizati on Fund is currently invested in the Blackrock TempCash short-term investment funds which hold various top rated money market instruments, including repurchase agreements.
Cash collateral for security lending and collateral for repurchase agreements is restricted to U.S. Government and Government Agency securiti es.
Portfolio Constraints All assets under the management of the WSIB are to
be invested to maximize return at a prudent level of risk in accordance with RCW 43.33A.110 and RCW 43.33A.140, which state, in part, that the WSIB is to “invest and manage the assets entrusted to it with reasonable care, skill, prudence and diligence under circumstances then prevailing which a prudent person acti ng in a like capacity and familiar with such matt ers would use in the conduct of an acti vity of like character and purpose.”
SCHEDULE 1: INVESTMENT MATURITIES AND CREDIT RATINGS
Investment Type Total Fair Value Less than 1 year 1-5 years 6-10 yearsMore than 10
yearsEffective Duration
Credit Rating
Municipal Bonds 46,115$ 23,102$ 23,013$ -$ -$ 1.17 AAAMoney Market Funds 116,510,543 N/A N/A N/A N/A N/A N/ATotal Investments 116,556,658$ 23,102$ 23,013$ -$ -$

Page 55
INDEPENDENT AUDITORS’ REPORTTo the Members of the Washington State Investment BoardOlympia, WashingtonWe have audited the accompanying statement of net assets for the Guaranteed Educati on Tuiti on Fund of the State of Washington as managed by the Washington State Investment Board (“the Guaranteed Educati on Tuiti on Fund”) as of June 30, 2010, and the related statement of changes in net assets for the year then ended. These fi nancial statements are the responsibility of the Washington State Investment Board’s management. Our responsibility is to express an opinion on these fi nancial statements based on our audit.
We conducted our audit in accordance with auditi ng standards generally accepted in the United States. Those standards require that we plan and perform the audit to obtain reasonable assurance about whether the fi nancial statements are free of material misstatement. An audit includes examining, on a test basis, evidence supporti ng the amounts and disclosures in the fi nancial statements. An audit also includes assessing the accounti ng principles used and signifi cant esti mates made by management, as well as evaluati ng the overall fi nancial statement presentati on. We believe that our audit provides a reasonable basis for our opinion.
The fi nancial statements referred to in the fi rst paragraph present only the investment acti vity of the Guaranteed Educati on Tuiti on Fund as managed by the Washington State Investment Board. The fi nancial statements do not purport to, and do not, present the fi nancial acti vity of the Washington State Investment Board or of the State of Washington.
In our opinion, the fi nancial statements referred to in the fi rst paragraph present fairly, in all material respects, the net assets of the Guaranteed Educati on Tuiti on Fund as of June 30, 2010, and the changes in net assets for the year then ended in conformity with accounti ng principles generally accepted in the United States.
Our audit was conducted for the purpose of forming an opinion on the fi nancial statements of the Guaranteed Educati on Tuiti on Fund. Management’s Discussion and Analysis preceding the fi nancial statements is presented for purposes of additi onal analysis and is not a required part of the fi nancial statements referred to in the fi rst paragraph. We have applied certain limited procedures, which consisted principally of inquiries of management regarding the methods of measurement and presentati on of the supplementary informati on. However, we did not audit the informati on and express no opinion on it. The introducti on secti on of the annual report has not been subjected to the auditi ng procedures applied in the audit of the fi nancial statements and, accordingly, we express no opinion on it.
/S/ PETERSON SULLIVAN LLP
October 28, 2010
CERTIFIED PUBLIC ACCOUNTANTS
601 UNION STREET, SUITE 2300
SEATTLE, WASHINGTON 98101
TEL 206.382.7777 • FAX 206.382.7777
http://www.pscpa.com
PETERSON SULLIVAN LLP
GUARANTEED EDUCATION TUITION FUND

Page 56
Management’s Discussion and Analysis for the Guaranteed Educati on Tuiti on Fund (GET), managed by the Washington State Investment Board (WSIB), is presented as an introducti on to the fi nancial statements. It is meant to assist the reader in understanding the fi nancial statements by providing an overall review of the fi nancial acti viti es during the year as well as to provide a comparison to the prior year’s acti viti es and results. The WSIB manages funds for other Washington state departments. This secti on of the report represents only the GET Fund porti on.
Following this secti on of the report are the fi nancial statements and footnotes. The Statement of Net Assets provides informati on on the types of investments and the liabiliti es of GET. This informati on is summarized in Table 1. Table 1 also compares the asset, liability, and net asset balances at June 30, 2010, with those at June 30, 2009. The Statement of Changes in Net Assets provides informati on on investment performance and other increases and decreases in the net assets of GET for the year ended June 30, 2010. This informati on is summarized in Table 2. Table 2 also compares the fi nancial acti viti es of GET for the year ended June 30, 2010, with those of the year ended June 30, 2009. The Notes to the Financial Statements provide additi onal informati on that is essenti al to a full understanding of the data provided in the fi nancial statements of GET.
As shown in Table 1, the net assets of the GET Program increased by $308.5 million during the fi scal year ended June 30, 2010. Contributi ons to the GET Program during the year increased net assets by $183.2 million. Unrealized gains increased net assets in the fi xed income portf olio by $31.2 million and the equity portf olio by $74.6 million. Net investment income received and reinvested in the fund increased net assets by $19.5 million during the fi scal year ended June 30, 2010.
The following summarizes the changes within each grouping listed within Table 1:
Money market funds decreased by $(12.3) million. Reinvestment of net investment income increased this asset class by $13.3 million. $(25.6) million was transferred to other asset classes for reinvestment.
Fixed income investments increased by $170.0 million. New funds invested in fi xed income securiti es from contributi ons and transfers of cash were $138.8 million. Unrealized gains for the year increased fi xed income securiti es by $31.2 million. All fi xed income instruments are invested in Treasury Infl ati on Protected Securiti es (TIPS). The value of TIPS is directly impacted by changes in the Consumer Price Index (CPI). The CPI rose during the
year which contributed to the increase in value in the TIPS holdings.
Equity investments increased by $150.0 million. Contributi ons received from the GET Program and transfers of cash were reinvested in this asset class for a total of $69.2 million. These equity investments gained $74.6 million of value due to the stabilizati on and rebounding of global equity markets. Income distributed and reinvested in this asset class totaled $6.2 million.
Net receivables and payables changed substanti ally due to securiti es lending acti viti es. While the lending acti viti es for Treasury securiti es in the overall marketplace decreased due to increased supply, the GET program’s average lendable assets
MANAGEMENT DISCUSSION & ANALYSIS
TABLE 1: SUMMARIZED NET ASSETS 2010 2009 DOLLAR CHANGE PERCENT CHANGE
Money Market Funds $38,126,225 $50,441,769 $(12,315,544) (24.4%)
Fixed Income Investments 582,845,452 412,852,609 169,992,843 41.2%
Equity Investments 749,687,895 599,657,714 150,030,181 25.0%
Total Investments 1,370,659,572 1,062,952,092 307,707,480 28.9%
Collateral Held Under Securiti es Lending Agreements 489,786,760 359,320,484 130,466,276 36.3%
Investment Earnings Receivable 4,434,189 3,603,488 830,701 23.1%
Total Assets 1,864,880,521 1,425,876,064 439,004,457 30.8%
Investment Liabiliti es 489,870,143 359,360,783 130,509,360 36.3%
Net Assets $1,375,010,378 $1,066,515,281 $308,495,097 28.9%
TABLE 2: SUMMARIZED CHANGES IN NET ASSETS 2010 2009 DOLLAR CHANGE PERCENT CHANGE
Net Investment Income
Interest, Dividends and Other Investment Income $17,420,251 $20,013,996 $(2,593,745) (13.0%)
Net Capital Gains (Losses) 3,068,210 (1,816,838) 4,885,048 268.9%
Unrealized Gains (Losses) 105,817,250 (166,058,979) 271,876,229 163.7%
Less:
Securiti es Lending Rebates and Fees (714,001) (2,643,416) (1,929,415) (73.0%)
Other Fees (320,285) (212,643) 107,642 50.6%
Net Investment Income (Loss) 125,271,425 (150,717,880) 275,989,305 183.1%
Net Amount Contributed 183,223,672 177,546,047 5,677,625 3.2%
Net Assets - Beginning 1,066,515,281 1,039,687,114 26,828,167 2.6%
Net Assets - Ending $1,375,010,378 $1,066,515,281 $308,495,097 28.9%

Page 57
increased by 22 percent during the current fi scal year. This increase in lendable securiti es was due to contributi ons reinvested in TIPS.
As shown in Table 2, net investment income increased by $276.0 million during the fi scal year ended June 30, 2010. Interest income on cash and fi xed income securiti es decreased by $(3.5) million due to decreasing interest rates on fi xed income securiti es. This was parti ally off set by increased income distributi ons in the commingled equity index funds of $1 million. Downward pressure on interest rates resulted in increases in the price of fi xed income securiti es. Accordingly, realized and unrealized gains on TIPS increased investment income by $49.5 million. In additi on, the global equity markets rebounded during the year which increased realized and unrealized gains in this asset class by $227.2 million. Rebates paid on securiti es lending transacti ons decreased as the spreads paid to brokers conti nued to narrow during this ti me period, resulti ng in lower fees paid and an increase to net investment income of $1.9 million. The remaining decrease in net investment income of $(.1) million was due to increased management fees which correlate to the increase in assets under management.
Contributi ons from GET parti cipants increased by $5.7 million as parti cipants conti nued to take advantage of lower tuiti on unit purchase prices in anti cipati on of rate increases.
WSIB staff rebalances the GET Funds’ assets between asset classes as markets move pursuant to WSIB policy. The fair value of the GET Fund assets is directly impacted by the returns of the various capital markets within which the WSIB invests. The returns are expected to have a signifi cant eff ect on fi nancial positi on and results of operati ons in the future. However, one of the benefi ts of diversifi cati on gained by investi ng across various investment types as well as broadly within an asset class is the reducti on in aggregate volati lity of the total investment portf olio. The WSIB, aft er discussions with the GET Committ ee, makes the asset allocati on decisions for GET assets.
GET FUND STATEMENT OF NET ASSETS - JUNE 30, 2010See notes to financial statements
GET FUND STATEMENT OF CHANGES IN NET ASSETS - YEAR ENDED JUNE 30, 2010See notes to financial statements
PercentASSETS Investments: Money Market Funds 38,126,225$ 2.8% Treasury Inflation Protected Securities 582,845,452 42.5% Commingled Equity Index Funds - Domestic 498,583,337 36.4% Commingled Equity Index Funds - Foreign 251,104,558 18.3% Total Investments 1,370,659,572 100.0%
Investment Eearnings Receivable 4,434,189 Collateral Held Under Securities Lending Agreements 489,786,760 Total Assets 1,864,880,521
LIABILITIES Obligations Under Securities Lending Agreements 489,786,760 Accounts Payable 83,383 Total Liabilities 489,870,143
NET ASSETS 1,375,010,378$
Net Investment Income Investment Income Interest, Dividends and Other Investment Income 15,497,950$ Securities Lending Income 1,922,301 Realized Capital Gains 3,258,347 Realized Capital Losses (190,137) Unrealized Gains 105,817,250 Less: Securities Lending Rebates and Fees (714,001) Investment Expenses (137,697) WSIB Operating Expenses (182,588) Net Investment Income 125,271,425
Net Amount Contributed 183,223,672 Increase in Net Assets 308,495,097
Net Assets - June 30, 2009 1,066,515,281 Net Assets - June 30, 2010 1,375,010,378$

Page 58
of Net Assets does not include detailed holdings of securiti es lending collateral by investment classifi cati on.
ContributionsContributi ons are recorded when received.
Use of EstimatesThe preparati on of fi nancial statements in conformity with accounti ng principles generally accepted in the United States requires management to make esti mates and assumpti ons that aff ect certain reported amounts and disclosures. Actual results could diff er from the esti mated amounts.
NOTE 2. FEES AND EXPENSESInvestment fees and expenses are accounted for as a reducti on of investment income or are nett ed directly from the asset value of GET’s investments. These fees include investment management fees and commissions, investment consultant fees, legal fees, and other investment management related expenses. The WSIB operati ng expenses are charged to the funds based upon actual costs incurred to manage the investments. WSIB operati ng expenses are allocated to the funds under management based on relati ve market values, in accordance with state statutes.
NOTE 3. DEPOSIT AND INVESTMENT RISK DISCLOSURES Custodial Credit Risk – DepositsCustodial credit risk for deposits is the risk that in the event of a bank failure GET deposits may not be returned to it. GET does not have a deposit policy for custodial credit risk. As of June 30, 2010, there were no deposits with the custodial bank.
Custodial Credit Risk – InvestmentsCustodial credit risk for investments is the risk that, in the event of a failure of the counterparty to a transacti on, the GET Funds will not be able to recover the value of investments that are in the possession of an outside party. The GET Funds miti gates custodial credit risk by having its investment securiti es held by its custodian. Also, investment securiti es are registered in the name of the Washington State Investment Board
for the benefi t of the GET Funds, excluding cash and cash equivalents and repurchase agreements held as securiti es lending collateral.
Interest Rate RiskInterest rate risk is the risk that changes in interest rates over ti me will adversely aff ect the fair value of an investment. Eff ecti ve durati on is the measure of a debt investment’s exposure to fair value changes arising from changes in interest rates. Eff ecti ve durati on uses the present value of cash fl ows, weighted for those fl ows as a percentage of the investment’s full price. Increases in prevailing interest rates generally translate into decreases in fair values of those investments. The long-term goals of the fi xed income portf olio are to return 325 basis points above infl ati on, and to limit volati lity for the total portf olio. The goals are primarily met through the purchase of infl ati on indexed bonds. Schedule 1 provides informati on about the interest rate risks associated with GET investments as of June 30, 2010. The schedule displays various asset classes held by maturity in years, eff ecti ve durati ons and credit rati ngs.
Credit RiskCredit risk is the risk that an issuer or other counterparty to an investment will not fulfi ll its obligati ons.
Concentration of Credit RiskConcentrati on of credit risk is the risk of loss att ributed to the magnitude of an investment in a single issuer. GET policy states no corporate fi xed income issue’s cost shall exceed 3 percent of the fair value at the ti me of purchase, nor shall its fair value exceed 6 percent of the fair value at any ti me. There was no concentrati on of credit risk that exceeded these limits as of June 30, 2010.
Foreign Currency RiskForeign currency risk is the risk that changes in exchange rates will adversely aff ect the fair value of an investment or a deposit. GET has no formal policy to limit foreign currency risk. The only security held by the GET Fund with foreign currency risk at June 30, 2010, consists of $251,104,558 invested in an internati onal commingled equity index fund.
NOTES TO FINANCIAL STATEMENTSNOTE 1. DESCRIPTION OF FUND AND SIGNIFICANT ACCOUNTING POLICIESDescription of FundGuaranteed Educati on Tuiti on Fund (GET) consists of contributi ons from parti cipants planning on att ending advanced educati on programs in Washington state. This Fund is invested by the WSIB unti l parti cipants begin to withdraw funds as needed to pay for educati onal expenses. The fi nancial statements present only the acti vity of GET as managed by the WSIB. The WSIB has exclusive control of the investments held for the GET Program. The fi nancial statements do not present the fi nancial positi on and results of operati ons of the WSIB or the GET Program.
Basis of AccountingThe accompanying fi nancial statements have been prepared in conformity with accounti ng principles generally accepted in the United States for governments prescribed by the Governmental Accounti ng Standards Board (GASB) on the accrual basis of accounti ng.
Valuation of InvestmentsInvestments are reported at fair value. Fair values are based on published market prices, quotati ons from nati onal security exchanges, and security pricing services. Investments are adjusted to fair values monthly. Unrealized gains and losses are included as investment income in the Statement of Changes in Net Assets.
Revenue RecognitionInterest and dividend income is recognized when earned. Capital gains and losses are recognized on a trade date basis. Purchases and sales of investments are also recorded on a trade date basis.
Securities LendingGET records collateral received under securiti es lending agreements where GET has the ability to spend, pledge, or sell the collateral without borrower default. Liabiliti es resulti ng from these transacti ons are also recorded. Additi onally, costs associated with securiti es lending transacti ons, including broker commissions paid and lending fees paid to the custodian bank, are reported in the accompanying fi nancial statements. The Statement

Page 59
NOTE 4. SECURITIES LENDINGWashington state law and WSIB policy permit GET to parti cipate in securiti es lending programs to augment investment income. The WSIB has entered into an agreement with JPMorgan to act as agent for the WSIB in securiti es lending transacti ons. As JPMorgan is the custodian bank for the WSIB, it is counterparty to securiti es lending transacti ons.
GET reports securiti es lent (the underlying securiti es) as assets in the Statement of Net Assets. Cash received as collateral on securiti es lending transacti ons and investments made with that cash are reported as assets. Securiti es received as collateral are reported as assets if GET has the ability to pledge or sell them without a borrower default. Liabiliti es resulti ng from these transacti ons are also reported in the Statement of Net Assets. Securiti es lending transacti ons collateralized by securiti es that GET does not have the ability to pledge or sell unless the borrower defaults are not reported as assets and liabiliti es.
Fixed income securiti es were loaned and collateralized by the GET’s agent with cash and U.S. government securiti es (exclusive of mortgage backed securiti es and lett ers of credit), and irrevocable lett ers of credit. When the loaned securiti es had collateral denominated in the same currency, the collateral requirement was 102 percent of the fair value, including accrued interest, of the securiti es loaned. All other securiti es were required to be collateralized at 105 percent of the fair value, including accrued interest, of the loaned securiti es. The collateral held and fair value of securiti es on loan at June 30, 2010, was $530,348,424 and $517,047,698, respecti vely. As of June 30, 2010, the amount the GET Fund owed the borrowers exceeded the amounts the borrowers owed the GET Fund, resulti ng in no credit risk exposure.
As of June 30, 2010, the GET held the following securiti es as collateral (in thousands)
Cash and Cash Equivalents $363,269
U.S. Government Securiti es 5,221
Commercial Paper 47,904
Securiti zed Debt 36,788
Corporate Bonds 13,774
Miscellaneous 12,701
Medium Term Notes 23,231
Repurchase Agreements 27,460
Total Collateral Held $530,348
During fi scal year 2010, securiti es lending transacti ons could be terminated on demand by either GET or the borrower. The weighted average maturity of loans for 2010 was 2.2 days.
Cash collateral was invested by GET’s agent in securiti es issued or guaranteed by the U.S. government, in the WSIB’s separately managed short-term investment pool (average fi nal maturity of 30 days). Because the securiti es lending agreements were terminable at will, their durati on did not generally match the durati on of the investments made with the cash collateral. Non-cash collateral could not be pledged or sold absent borrower default. Accordingly, non-cash collateral held under securiti es lending contracts with a value of $40,561,664 has not been included in the Statement of Net Assets. There are no restricti ons on the amount of securiti es that can be lent.
Securiti es were lent with the agreement that they would be returned in the future for exchange of the collateral. JPMorgan indemnifi ed the WSIB by agreeing to purchase replacement securiti es or return the cash collateral in the event a borrower failed to return the loaned securiti es or pay distributi ons thereon. JPMorgan’s responsibiliti es included performing appropriate borrower and collateral investment credit analyses, demanding adequate types and levels of collateral, and complying with applicable federal regulati ons concerning securiti es lending.
During fi scal year 2010, there were no signifi cant violati ons of legal or contractual provisions, no failures by any borrowers to return loaned securiti es or to pay distributi ons thereon. Further, GET incurred no losses during fi scal year 2010 resulti ng from a default by either the borrowers or the securiti es lending agents.
NOTE 5. SUMMARY OF INVESTMENT POLICYUnder RCW 43.33A.030, Trusteeship of GET is vested in the voti ng members of the WSIB. The Legislature has established a standard of care for investment of these funds in RCW 43.33A.140. Additi onally, the WSIB and its staff must comply with other state laws, such as the Ethics in Public Service Act, 42.52 RCW, as it makes its investment decisions and seeks to meet the following investment objecti ves.
In accordance with RCW 43.33.110, the portf olio is managed to achieve a maximum return at a prudent level of risk. The key determinate is identi fying the prudent level of risk for the program considering the program’s need to meet or exceed the growth rate of tuiti on costs. Based on this requirement the order of the objecti ves shall be:
Maintain the solvency of the Fund and the fi nancial stability of the program as measured by the external actuary;
Ensure suffi cient assets are available to fund the expected college tuiti on payments;
Subject to the above requirements, achieve a maximum return that will meet or exceed the rate of growth in college tuiti on cost over a ten-year period, at a prudent level risk; and
Invest in a manner that will not compromise public confi dence in the program.
Risk Constraint Standards All assets under management by the WSIB are to
be invested to maximize return at a prudent level of risk in accordance with the requirements of RCW 43.33A.110 and RCW 43.33A.140.
No corporate fi xed income issue’s cost shall exceed 3 percent of the Fund’s fair value at the ti me of purchase, nor shall its fair value exceed 6 percent of the Fund’s fair value at any ti me (RCW 43.33A.140).

Page 60
Investment Type Total Fair Value Less than 1 year 1-5 years 6-10 years More than 10 yearsEffective Duration
Credit Rating
Treasury Inflation Protected Securities 582,845,452$ 14,521,846$ 192,297,232$ 204,809,705$ 171,216,669$ 3.92 Aaa
Investments Not Required to be CategorizedCommingled Equity Index Funds-Domestic 498,583,337 Commingled Equity Index Funds-Foreign 251,104,558 Money Market Funds 38,126,225 Total Investments Not Categorized 787,814,120 Total Investments 1,370,659,572$
Maturity
Diversify the assets at a prudent level to moderate fl uctuati ons in the fair value of the program.
Permissible Investments Internati onal Equity U.S. Equity Infl ati on Indexed Bonds U.S. Treasuries and Government Obligati ons Credit Bonds WSIB Bond Market Fund Cash equivalent funds managed on behalf of the
WSIB
Asset AllocationThe asset allocati on strategy for the GET program is as follows: (Non U.S. Equity within a 4 percent tolerance, all others within a 5 percent tolerance)
Cash 0.0%
Infl ati on Indexed Bonds – Fixed Income 40.0%
U.S. Equity 40.0%
Non U.S. Equity 20.0%
SCHEDULE 1: SCHEDULE OF MATURITIES AND CREDIT RATINGS

Page 61
INDEPENDENT AUDITORS’ REPORTTo the Members of the Washington State Investment BoardOlympia, WashingtonWe have audited the accompanying statement of net assets for the Developmental Disabiliti es Endowment Trust Fund of the State of Washington as managed by the Washington State Investment Board (“the Developmental Disabiliti es Endowment Trust Fund”) as of June 30, 2010, and the related statement of changes in net assets for the year then ended. These fi nancial statements are the responsibility of the Washington State Investment Board’s management. Our responsibility is to express an opinion on these fi nancial statements based on our audit.
We conducted our audit in accordance with auditi ng standards generally accepted in the United States. Those standards require that we plan and perform the audit to obtain reasonable assurance about whether the fi nancial statements are free of material misstatement. An audit includes examining, on a test basis, evidence supporti ng the amounts and disclosures in the fi nancial statements. An audit also includes assessing the accounti ng principles used and signifi cant esti mates made by management, as well as evaluati ng the overall fi nancial statement presentati on. We believe that our audit provides a reasonable basis for our opinion.
The fi nancial statements referred to in the fi rst paragraph present only the investment acti vity of the Developmental Disabiliti es Endowment Trust Fund as managed by the Washington State Investment Board. The fi nancial statements do not purport to, and do not, present the fi nancial acti vity of the Trust Funds of other state agencies. Further, they do not purport to, and do not, present the fi nancial acti vity of the Washington State Investment Board or of the State of Washington.
In our opinion, the fi nancial statements referred to in the fi rst paragraph present fairly, in all material respects, the net assets of the Developmental Disabiliti es Endowment Trust Fund as of June 30, 2010, and the changes in net assets for the year then ended in conformity with accounti ng principles generally accepted in the United States. Our audit was conducted for the purpose of forming an opinion on the fi nancial statements of the Developmental Disabiliti es Endowment Trust Fund. Management’s Discussion and Analysis preceding the fi nancial statements is presented for purposes of additi onal analysis and is not a required part of the fi nancial statements referred to in the fi rst paragraph. We have applied certain limited procedures, which consisted principally of inquiries of management regarding the methods of measurement and presentati on of the supplementary informati on. However, we did not audit the informati on and express no opinion on it. The introducti on secti on of the annual report has not been subjected to the auditi ng procedures applied in the audit of the fi nancial statements and, accordingly, we express no opinion on it.
/S/ PETERSON SULLIVAN LLP
October 28, 2010
DEVELOPMENTAL DISABILITIES ENDOWMENT TRUST FUND
CERTIFIED PUBLIC ACCOUNTANTS
601 UNION STREET, SUITE 2300
SEATTLE, WASHINGTON 98101
TEL 206.382.7777 • FAX 206.382.7777
http://www.pscpa.com
PETERSON SULLIVAN LLP

Page 62
MANAGEMENT DISCUSSION & ANALYSISManagement’s Discussion and Analysis for the Developmental Disabiliti es Endowment Trust Fund (DDEF) of Washington state, managed by the Washington State Investment Board (WSIB), is presented as an introducti on to the fi nancial statements. It is meant to assist the reader in understanding the fi nancial statements by providing an overall review of the fi nancial acti viti es during the year as well as to provide a comparison to the prior year’s acti viti es and results. The WSIB manages funds for other Washington state departments. This secti on of the report covers the DDEF funds only.
Following this secti on of the report are the fi nancial statements and footnotes. The Statement of Net Assets provides informati on on the types of investments, assets, and liabiliti es of the DDEF as of June 30, 2010. This informati on is summarized in Table 1. Table 1 also compares the asset, liability, and net asset balances at June 30, 2010, with those at June 30, 2009. The Statement of Changes in Net Assets provides informati on on investment performance and other increases and decreases in the net assets of the DDEF for the year ended June 30, 2010. This informati on is summarized in Table 2. Table 2 also compares the fi nancial acti viti es of DDEF for the year ended June 30, 2010, with those of the year ended June 30, 2009. The Notes to the Financial Statements provide additi onal informati on that is essenti al to a full understanding of the data provided in the fi nancial statements of the DDEF.
As shown in Table 1, net assets under management within DDEF increased by $4.3 million during the fi scal year ended June 30, 2010. The DDEF consists of a state trust fund and a private trust fund. The increase in net assets was primarily due to the contributi ons to the private trust fund of $2.0 million and realized and unrealized gains of $1.8 million. Net investment income received increased net assets for the funds and amounted to $0.5 million during the year ended June 30, 2010.
The following summarizes the changes within each grouping listed within Table 1:
Money market funds decreased by $0.5 million. The WSIB, in conjuncti on with the DDEF Board, has been cauti ously reinvesti ng the cash balances longer term during the current fi scal year. Money market funds decreased primarily due to this rebalancing process;
Fixed income investments increased by $0.7 million, primarily due to realized and unrealized gains occurring within this asset class. Interest rates have conti nued to drop during the current fi scal year which has resulted in increased market values within the bond market;
Balanced mutual funds received $2.2 million of contributi ons and cash transfers to invest. Realized
and unrealized gains and losses increased this asset class by $1.1 million. Additi onal income reinvested in the fund totaled $0.3 million for a total net increase of $3.6 million in this asset class. Both the bond and equity markets have had substanti al increases in value during the current fi scal year;
Equity investments gained $0.1 million of market value due to the current economic environment. Transfers from money market funds increased equity investments by $0.3 million for a total increase of $0.4 million for this asset class; and
Cash collateral held under securiti es lending contracts and the related obligati on decreased by $0.3 million due to securiti es lending acti viti es.
TABLE 2: SUMMARIZED CHANGES IN NET ASSETS 2010 2009 DOLLAR CHANGE
Net Investment Income
Investment Income $999,172 $411,303 $587,869
Unrealized Gains (Losses) 1,305,054 (1,834,261) 3,139,315
Less:
Investment Expenses (2,668) (2,385) 283
Net Investment Gain (Loss) 2,301,558 (1,425,343) 3,726,901
Net Amount Contributed 1,952,242 1,986,205 (33,963)
Net Assets - Beginning 18,438,559 17,877,697 560,862
Net Assets - Ending $22,692,359 $18,438,559 $4,253,800
TABLE 1: SUMMARIZED NET ASSETS 2010 2009 DOLLAR CHANGE PERCENT CHANGE
Money Market Funds $62,566 $535,620 $(473,054) (88.3%)
Fixed Income Investments 7,438,611 6,688,838 749,773 11.2%
Balanced Funds 13,824,309 10,211,728 3,612,581 35.4%
Equity Investments 1,342,692 957,931 384,761 40.2%
Total Investments 22,668,178 18,394,117 4,274,061 23.2%
Collateral Held Under Securiti es Lending Agreements 2,749,253 3,007,409 (258,156) (8.6%)
Earnings Receivable 24,265 44,442 (20,177) (45.4%)
Total Assets 25,441,696 21,445,968 3,995,728 18.6%
Investment Liabiliti es 2,749,337 3,007,409 (258,072) (8.6%)
Net Assets $22,692,359 $18,438,559 $4,253,800 23.1%

Page 63
Developmental Disabilities
Endowment Trust Fund State
Developmental Disabilities
Endowment Trust Fund Private
Total
Net Investment Income Investment Income: Interest, Dividends and Other Investment Income 108,877$ 360,252$ 469,129$ Realized Capital Gains 530,793 - 530,793 Realized Capital Losses (750) - (750) Unrealized Gains 209,286 1,095,768 1,305,054 Less: Investment Expenses (1,042) (349) (1,391) WSIB Operating Expenses (1,277) - (1,277) Net Investment Income 845,887 1,455,671 2,301,558
Net Amount Contributed 1,277 1,950,965 1,952,242 Increase in Net Assets 847,164 3,406,636 4,253,800 Net Assets, June 30, 2009 7,967,784 10,470,775 18,438,559 Net Assets, June 30, 2010 8,814,948$ 13,877,411$ 22,692,359$
As shown in Table 2, net investment earnings increased substanti ally from the prior year due almost enti rely to increases in the market value of the underlying equity and fi xed income securiti es (realized and unrealized). Interest rates on TIPS are directly correlated to changes in the Consumer Price Index (CPI). The CPI has increased during the current fi scal year and, accordingly, interest earnings on TIPS have as well. All other changes in investment income from the prior year are considered de minimis. The private trust fund net assets have a higher risk profi le and the earnings were impacted by the positi ve investment performance in both the bond and equity markets.
The fair value of DDEF net assets is directly impacted by the returns of the various capital markets within which the WSIB invests and the returns are expected to have a signifi cant eff ect on fi nancial positi on and results of operati ons in the future. However, one of the benefi ts of diversifi cati on gained by investi ng across various investment types as well as broadly within an asset class is the reducti on in aggregate volati lity of the total investment portf olio. The WSIB, with concurrence from the Developmental Disabiliti es Life Opportuniti es Trust Governing Board, makes the asset allocati on decisions for DDEF assets. WSIB staff rebalances the DDEF’s assets between asset classes as markets move, pursuant to WSIB policy.
DDEF STATEMENT OF NET ASSETS - JUNE 30, 2010See notes to financial statements
DDEF STATEMENT OF CHANGES IN NET ASSETS - YEAR ENDED JUNE 30, 2010See notes to financial statements
Developmental Disabilities
Endowment Trust Fund State
Developmental Disabilities
Endowment Trust Fund Private
TotalPercent of
Total
ASSETS Investments: LIQUIDITY: Money Market Funds 9,466$ 53,100$ 62,566$ 0.3% FIXED INCOME INVESTMENTS: Treasury Inflation Protected Securities 3,744,214 - 3,744,214 16.5% Commingled Intermediate Credit 3,694,397 - 3,694,397 16.3% BALANCED FUNDS: Balanced Mutual Funds - Domestic - 13,824,309 13,824,309 61.0% EQUITY INVESTMENTS: Commingled Equity Index Funds - Domestic 714,924 - 714,924 3.1% Commingled Equity Index Funds - Foreign 627,768 - 627,768 2.8% Total Investments 8,790,769 13,877,409 22,668,178 100.0% Investment Earnings Receivable 24,263 2 24,265 Collateral Held Under Securities Lending Agreements 2,749,253 - 2,749,253 Total Assets 11,564,285 13,877,411 25,441,696 LIABILITIES Obligations Under Securities Lending Agreements 2,749,253 - 2,749,253 Accrued Payables 84 - 84 NET ASSETS 8,814,948$ 13,877,411$ 22,692,359$

Page 64
NOTE 1. DESCRIPTION OF FUNDS AND SIGNIFICANT ACCOUNTING POLICIESDescription of FundsThe Developmental Disabiliti es Endowment Fund (DDEF) of Washington state consists of two funds. The State Trust Fund was originally created from a grant by Washington state. The Private Trust Fund consists of contributi ons by private individual parti cipants of the program. These funds are invested by the WSIB unti l parti cipants withdraw these funds as needed. The fi nancial statements present only the acti vity of the DDEF as managed by the WSIB. The WSIB has exclusive control of the investments of all money held by the DDEF. The fi nancial statements do not present the fi nancial positi on and results of operati ons of the WSIB or the acti vity of the DDEF program.
Basis of AccountingThe accompanying fi nancial statements have been prepared in conformity with accounti ng principles generally accepted in the United States for governments prescribed by the Governmental Accounti ng Standards Board (GASB) on the accrual basis of accounti ng.
Valuation of InvestmentsInvestments are reported at fair value. Fair values are based on published market prices, quotati ons from nati onal security exchanges, and security pricing services. Investments are adjusted to fair values monthly. Unrealized gains and losses are included as investment income in the Statement of Changes in Net Assets.
Revenue RecognitionInterest and dividend income is recognized when earned. Capital gains and losses are recognized on a trade date basis. Purchases and sales of investments are also recorded on a trade date basis.
Securities LendingDDEF reports collateral received under securiti es lending agreements where DDEF has the ability to spend, pledge, or sell the collateral without borrower default. Liabiliti es resulti ng from these transacti ons are also recorded. Additi onally, costs associated with securiti es lending transacti ons, including broker commissions paid and
NOTES TO FINANCIAL STATEMENTSlending fees paid to the custodian bank, are reported as investment expenses in the accompanying fi nancial statements. The Statement of Net Assets does not include detailed holdings of securiti es lending collateral by investment classifi cati on.
ContributionsContributi ons are recorded when received.
Use of EstimatesThe preparati on of fi nancial statements in conformity with accounti ng principles generally accepted in the United States requires management to make esti mates and assumpti ons that aff ect certain reported amounts and disclosures. Actual results could diff er from the esti mated amounts.
NOTE 2. FEES AND EXPENSESInvestment fees and expenses are accounted for as a reducti on of investment income or are nett ed directly from the asset value of DDEF’s investments. These fees include investment management fees and commissions, investment consultant fees, legal fees, and other investment management related expenses. The WSIB operati ng expenses are charged to the funds based upon actual costs incurred to manage the investments. WSIB operati ng expenses are allocated to the funds under management based on relati ve market values, in accordance with state statutes.
NOTE 3. DEPOSIT AND INVESTMENT RISK DISCLOSURES Custodial Credit Risk – DepositsCustodial credit risk for deposits is the risk that in the event of a bank failure, DDEF deposits may not be returned to it. DDEF does not have a deposit policy for custodial credit risk. As of June 30, 2010, there were no deposits with the custodial bank.
Custodial Credit Risk – InvestmentsCustodial credit risk for investments is the risk that, in the event of a failure of the counterparty to a transacti on, the DDEF Funds will not be able to recover the value of investments that are in the possession of an outside party. The DDEF Funds miti gates custodial credit risk by having its investment securiti es held by
its custodian. Also, investment securiti es are registered in the name of the Washington State Investment Board for the benefi t of the DDEF Funds, excluding cash and cash equivalents and repurchase agreements held as securiti es lending collateral.
Interest Rate RiskInterest rate risk is the risk that changes in interest rates over ti me will adversely aff ect the fair value of an investment. Eff ecti ve durati on is the measure of a debt investment’s exposure to fair value changes arising from changes in interest rates. Eff ecti ve durati on uses the present value of cash fl ows, weighted for those fl ows as a percentage of the investment’s full price. Increases in prevailing interest rates generally translate into decreases in fair values of those investments.
Schedule 1 provides informati on about the interest rate risks associated with DDEF investments as of June 30, 2010. The schedule displays various asset classes held by maturity in years, eff ecti ve durati ons, and credit rati ngs.
Credit RiskCredit risk is the risk that an issuer or other counterparty to an investment will not fulfi ll its obligati ons. The DDEF’s rated debt investments as of June 30, 2010, were rated by Moody’s or equivalent rati ng methodology.
Concentration of Credit RiskConcentrati on of credit risk is the risk of loss att ributed to the magnitude of an investment in a single issuer. DDEF policy states no corporate fi xed income issue’s cost shall exceed 3 percent of DDEF’s fair value at the ti me of purchase, nor shall its fair value exceed 6 percent of DDEF’s fair value at any ti me. There was no concentrati on of credit risk that exceeded these limits as of June 30, 2010.
Foreign Currency RiskForeign currency risk is the risk that changes in exchange rates will adversely aff ect the fair value of an investment or a deposit. DDEF has no formal policy to limit foreign currency risk. The only security held by the DDEF with foreign currency risk at June 30, 2010, consists of $627,768 invested in an internati onal commingled equity index fund.

Page 65
NOTE 4. SECURITIES LENDINGWashington state law and WSIB policy permit DDEF to parti cipate in securiti es lending programs to augment investment income. The WSIB has entered into an agreement with JPMorgan to act as agent for the WSIB in securiti es lending transacti ons. As JPMorgan is the custodian bank for the WSIB, it is counterparty to securiti es lending transacti ons.
DDEF reports securiti es lent (the underlying securiti es) as assets in the Statement of Net Assets. Cash received as collateral on securiti es lending transacti ons and investments made with that cash are reported as assets. Securiti es received as collateral are reported as assets if DDEF has the ability to pledge or sell them without a borrower default. Liabiliti es resulti ng from these transacti ons are also reported in the Statement of Net Assets. Securiti es lending transacti ons collateralized by securiti es that DDEF does not have the ability to pledge or sell unless the borrower defaults are not reported as assets and liabiliti es.
Fixed income securiti es were loaned and collateralized by the DDEF’s agent with cash and U.S. government securiti es (exclusive of mortgage backed securiti es and lett ers of credit), and irrevocable lett ers of credit. When the loaned securiti es had collateral denominated in the same currency, the collateral requirement was 102 percent of the fair value, including accrued interest, of the securiti es loaned. All other securiti es were required to be collateralized at 105 percent of the fair value, including accrued interest, of the loaned securiti es. The collateral held and fair value of securiti es on loan at June 30, 2010, was $2,976,930 and $2,918,529, respecti vely. As of June 30, 2010, the amounts the DDEF owed the borrowers exceeded the amounts the borrowers owed the DDEF, resulti ng in no credit risk exposure.
As of June 30, 2010, the DDEF held the following securiti es as collateral:
Securiti zed Assets $206,498
Cash and Equivalents 2,039,087
U.S. Government Securiti es 29,302
Commercial Paper 268,894
Corporate Bonds 77,316
Miscellaneous 71,290
Medium Term Notes 130,401
Repurchase Agreements 154,142
Total Collateral Held $2,976,930
During fi scal year 2010, securiti es lending transacti ons could be terminated on demand by either DDEF or the borrower. The weighted average maturity of loans was 2.2 days.
Cash collateral was invested by DDEF’s agent in the WSIB’s separately managed short-term investment pool (average fi nal maturity of 30 days). Because the securiti es lending agreements were terminable at will, their durati on did not generally match the durati on of the investments made with the cash collateral. Non-cash collateral could not be pledged or sold absent borrower default. Accordingly, non-cash collateral held under securiti es lending contracts with a value of $227,677 has not been included in the Statement of Net Assets. There are no restricti ons on the amount of securiti es that can be lent.
Securiti es were lent with the agreement that they would be returned in the future for exchange of the collateral. JPMorgan indemnifi ed the WSIB by agreeing to purchase replacement securiti es or return the cash collateral in the event a borrower failed to return the loaned securiti es or pay distributi ons thereon. JPMorgan’s responsibiliti es included performing appropriate borrower and collateral investment credit analyses, demanding adequate types and levels of collateral, and complying with applicable federal regulati ons concerning securiti es lending.
During fi scal year 2010, there were no signifi cant violati ons of legal or contractual provisions, no failures by any borrowers to return loaned securiti es or to pay distributi ons thereon. Further, DDEF incurred no losses during fi scal year 2010 resulti ng from a default by either the borrowers or the securiti es lending agents.
Note 5. Summary of Investment PolicyUnder RCW 43.33A.030, trusteeship of DDEF is vested within the voti ng members of the WSIB. The Legislature has established a standard of care for investment of these funds in RCW 43.33A.140. Additi onally, the WSIB and its staff must comply with other state laws, such as the Ethics in Public Service Act, 42.52 RCW, as it makes its investment decisions and seeks to meet the following investment objecti ves.
In accordance with RCW 43.33.110, the portf olio is managed to achieve a maximum return at a prudent level of risk. The key determinate is identi fying the prudent level of risk for a program relati ve to the needs of the Developmental Disabiliti es Life Opportuniti es Trust Governing Board and the parti cipants. Based on this requirement, the order of the objecti ves shall be:
Maximize return at a prudent level of risk based on identi fi ed investment ti me horizons;
Ensure suffi cient assets are available to fund the expected needs;
Invest in a manner that will not comprise public confi dence in the program;
RISK CONSTRAINT STANDARDS All assets under management by the WSIB are to
be invested to maximize return at a prudent level of risk in accordance with the requirements of RCW 43.33A.110 and RCW 43.33A.140; and
Diversify the assets at a prudent level to moderate fl uctuati ons in the fair value of the program.

Page 66
Investment Type Total Fair ValueLess than 1
year1-5 years 6-10 years
More than 10 years
Effective Duration
Credit Rating
Government Securities-Domestic:Treasury Inflation Protected Securities 3,744,214$ -$ 129,492$ 3,614,722$ -$ 4.07 Aaa
Investments Not Required to be Categorized Commingled Equity Index Funds - Domestic 714,924 Commingled Equity Index Funds - Foreign 627,768 Commingled Intermediate Credit 3,694,397 Commingled Balanced Trust 13,824,309 Money Market Funds 62,566 Total Investments Not Categorized 18,923,964 Total Investments 22,668,178$
Maturity
SCHEDULE 1: SCHEDULE OF MATURITIES AND CREDIT RATINGS
Permissible Investments
Fixed Income: The fi xed income portf olio will be limited to the Bond Market Fund (WSIB Policy 2.14.200). The Treasury Infl ati on Protecti on Securiti es portf olio will be invested in U.S. Infl ati on Indexed Bonds.
U.S. Equity: The U.S. equity portf olio will be invested in a passive commingled fund managed to track a U.S. broad market index.
Balanced Mutual Funds: DDEF – Private will invest in the Vanguard Balanced Index – Insti tuti onal Share’s mutual fund.
Internati onal Equity: The internati onal equity portf olio will be invested in a passive commingled fund managed to track an internati onal broad market index.
Cash: The cash portf olio will be invested in Short-term Investment Funds and Money Market Funds.
Asset AllocationThe asset allocati on policy has been developed with the performance objecti ves of:
Short term: Earn a rate of return that exceeds infl ati on, with a bias toward preservati on of corpus; and
Long term: Earn a rate of return that exceeds infl ati on plus a set spending rate.
Assets are rebalanced across asset classes when market values fall outside respecti ve policy ranges as follows:
State Funds Target Range
Cash 0% 0-5%
Fixed Income 41% 38-44%
U.S. Equity 9% 6-12%
Internati onal Equity 8% 5-11%
TIPS 42% 39-45%
Private Funds Target
Cash $10,000
Fixed Income 40%
Equity 60%

2100 EVERGREEN PARK DRIVE SW, P.O. BOX 40916, OLYMPIA, WA 98504WWW.SIB.WA.GOV