Annual Report 2007 - Nissan Motor Corporation Global …€¦ · · 2017-10-27This annual report...
93
Annual Report 2007 Nissan: Enriching People’s Lives Year Ended March 31, 2007
Transcript of Annual Report 2007 - Nissan Motor Corporation Global …€¦ · · 2017-10-27This annual report...

Annual Report 2007
Nissan: Enriching People’s Lives
Year Ended March 31, 2007

Fiscal 2006 Performance 10
Fiscal 2007 Outlook 12
Status of Breakthroughs 14
Fiscal 2006 Financial Review 16
Fiscal 2006 Share Performance 19
Financial Highlights 1
Letter from the President and CEO 2
Executives 5
Renault-Nissan Alliance 6
The Nissan Way 7
Japan 22
North America 24
Europe 26
General Overseas Markets 28
Technology 34
India 38
Performance
Regional Action
Investment for the Future
Financial Section
Corporate Data
8
20
32
40
86
Contents
This annual report presents financial results for the fiscal period
ending March 31, 2007. The report also provides shareholders
with insights into Nissan’s management team. Through one-on-
one interviews, various members of executive management,
including President and Chief Executive Officer, Carlos Ghosn,
discuss the philosophy and direction of Nissan.
Sustainability Report
http: //www.nissan-global.com/EN/COMPANY/CSR/LIBRARY/SR/
Annual Report
http: //www.nissan-global.com/EN/IR/LIBRARY/AR/
Profile
http: //www.nissan-global.com/EN/IR/LIBRARY/PROFILE/
VisionNissan: Enriching People’s Lives
MissionNissan provides unique and innovative automotive
products and services that deliver superior measurable
values to all stakeholders* in alliance with Renault.
*Our stakeholders include customers, shareholders, employees, dealers,suppliers, as well as the communities where we work and operate.
This annual report contains forward-looking statements on Nissan’sfuture plans and targets, and related operating investment, productplanning and production targets. Please note that there can be noassurance that these targets and plans will actually be achieved.Achieving them will depend on many factors, including not onlyNissan’s activities and development, but on the dynamics of theautomobile industry worldwide and the global economy.
Our WebsitesCorporate Informationhttp://www.nissan-global.com/EN/COMPANY/IR Informationhttp://www.nissan-global.com/EN/IR/Product Information (by Country)http://www.nissan-global.com/EN/GLOBAL/Product Information (Japan)http://www.nissan.co.jp/Environmental Activitieshttp: //www.nissan-global.com/EN/ENVIRONMENT/Corporate Citizenship Activitieshttp://www.nissan-global.com/EN/CITIZENSHIP/Quality Initiativeshttp://www.nissan-global.com/EN/QUALITY/Safety Activitieshttp://www.nissan-global.com/EN/SAFETY/Latest Technologieshttp://www.nissan-global.com/EN/TECHNOLOGY/Design Activitieshttp://www.nissan-global.com/EN/DESIGN/
Reports

Nissan Annual Report 2006-2007 1
Millions ofU.S. dollars (Note 1)
Millions of yen (except per(except per share amounts and number of employees) share amounts)
2006 2005 2004 2003 2002 2006For the years ended Mar. 31, 2007 Mar. 31, 2006 Mar. 31, 2005 Mar. 31, 2004 Mar. 31, 2003 Mar. 31, 2007
Net sales ¥10,468,583 ¥ 9,428,292 ¥8,576,277 ¥7,429,219 ¥6,828,588 $ 88,717
Operating income 776,939 871,841 861,160 824,855 737,230 6,584
Net income 460,796 518,050 512,281 503,667 495,165 3,905
Net income per share (Note 2) 112.33 126.94 125.16 122.02 117.75 0.95
Cash dividends paid (Note 3) 131,064 105,661 94,236 74,594 50,800 1,111
Net assets (Note 4) ¥ 3,876,994 — — — — $ 32,856
Shareholders’ equity (Note 4) — ¥ 3,087,983 ¥2,465,750 ¥2,023,994 ¥1,808,304 —
Total assets 12,402,208 11,481,426 9,848,523 7,859,856 7,349,183 105,103
Net automotive interest-bearing debt (Note 5) (254,638) (372,893) (205,791) 13,603 107,952 (2,158)
Employees 186,336 183,356 183,607 123,748 127,625
Notes: 1. Unless indicated otherwise, all dollar figures herein refer to U.S. currency. Yen amounts have been translated into U.S. dollars, for convenienceonly, at ¥118= $1, the approximate exchange rate on March 31, 2007.
2. Net income per share amounts are based on the weighted average number of shares of common stock outstanding during each year.Figures for net income per share are in exact yen and U.S. dollars. Number of shares outstanding as of March 31, 2007: 4,520,715,112.
3. Cash dividends during the full year by subsidiary companies to non-Nissan minority shareholders are not included.4. Effective April 1, 2006, the Company adopted a new accounting standard for presentation of net assets in the balance sheet and related
implementation guidance. Under the new accounting standard, net assets represent aggregate of previous shareholders' equity, sharesubscription rights and minority interests.
5. Net automotive interest-bearing debt is calculated by subtracting cash and cash equivalents from interest-bearing debt in the automotiveautomobile and eliminations segment. Negative figure represents that the ending balance of cash and cash equivalents exceeds that of interest-bearing debt.
FINANCIAL HIGHLIGHTS
Nissan Motor Co., Ltd. and Consolidated SubsidiariesFiscal years 2006, 2005, 2004, 2003 and 2002
’02 ’03 ’04 ’05 ’06 ’02 ’03 ’04 ’05 ’06 ’02 ’03 ’04 ’05 ’06
6,828.6
7,429.2
9,428.3
8,576.3
10,468.6
737.2
824.9
871.8
861.2
776.9
495.2
503.7
518.1
512.3
460.8
Net Sales(Billion Yen)
Operating Income(Billion Yen)
Net Income(Billion Yen)

Nissan Annual Report 2006-20072
LETTER FROM THE PRESIDENT AND CEO
The sole purpose of a public company is to create
growing sustainable value. At Nissan, we are totally
focused on this purpose.
However, for the first time in eight years, we missed
our performance objectives in fiscal 2006. As a result,
we have extended the delivery period for all Nissan
Value-Up commitments by one year.
The stock market recognized this shortfall and
our share price mirrored our performance. However,
we believe we are well below our potential.
Fiscal 2006
This past year, all the headwinds we anticipated
materialized and were more severe than expected.
This happened the lowest point of our product cycle.
Although we successfully launched new models,
such as the Altima and G35, they were introduced
late in the fiscal year and did not lead to overall
annual volume growth. And the sales decline in our
existing models offset these successful launches. In
addition, our short-term profit potential was offset by
our heavy investments for the future.
In order to re-boost our profitability, we have
implemented several measures in Japan, U.S.,
Europe, and South Africa to address various issues
including production capacity, dealer networks, and
human resources. Yet, it is important to understand
how our situation today is different from 1999, when
Nissan underwent a major recovery. Today, we are
fine-tuning our operations in order to boost our
performance.
Progress toward long-term value creation
Addressing our short-term issues is important, but
we also believe it is important to achieve long-term
profitable growth that is measurable in the context of
a solid long-term plan.
In our long-term planning, the priority is to
maximize free cash flow. The key drivers will be
top-line growth, profitability, future investment
and economies of scale through the Alliance. We
have made significant progress in each area as
shown below.
The first driver of top-line growth will come from our
future product pipeline and geographical expansion.
Once we complete the 28 model launches for
Nissan Value-Up this year, we will introduce over 33
new products during the next three years. As we
embark on this product offensive, we are focused on
“smoothing out” the product-launch cadence in order
to avoid a new-product drought, such as those we
experienced in 2005 and 2006. This should reduce
the likelihood of profit fluctuations and increase the
possibility for sustainable growth.
Regarding geographical expansion, one of our
breakthroughs under Nissan-Value Up, we have
successfully expanded our geographic presence in
emerging markets as evidenced by the recent
partnership with Renault and Mahindra in India. We
expect significant growth in these markets.
Infiniti, another breakthrough, has also been
successful in accelerating its geographical
expansion. After its introduction in Korea in 2005
and Russia in 2006, Infiniti will enter the Chinese
and Ukrainian markets in 2007 and during 2008
extend across Western Europe.
Top-line growth must be achieved with
profitability. Growing volumes without an appropriate
contribution to profit does not make good business
sense. Profit is also key to maximizing cash flow. In
this regard, brand and product value are crucial.
Several third-party non-financial leading indicators
have exhibited our improvement in brand and
product value.
J. D. Power and Associates APEAL Study in
the U.S. measures owner delight with the design,
content, layout and performance of their new
vehicles. In the 2006 survey, Nissan and Infiniti were

Nissan Annual Report 2006-2007 3
the segment leaders in five out of nineteen
categories. Nissan has three segment-leading
models, more vehicles than any other brand; Murano,
Titan, and Armada. The Infiniti QX56 and M ranked
at the top of their respective segments.
In a recent text, Consumer Reports, an influential
magazine for new car buyers in the U.S., ranked our
new Altima near the top, as it tied for the number-
one vehicle in the family sedan segment. And in
Consumer Reports’ “Ten best cars in America,”
Infiniti’s G35 and M were both recognized as the top
picks for safety and reliability in their respective
categories.
Although improvement in these indicators is not
immediately reflected in our financial results, this is
an engine of our profitable growth for the future.
There is a direct correlation between customer
satisfaction and profits.
But sustaining profits means preparing for the
future today. We are investing massively, especially
in R&D. Since 1999, our annual R&D expenditures
have doubled and will come to nearly ¥500 billion in
fiscal 2007. And through the Alliance, we now have
extensive collaboration with Renault’s R&D.
Our most urgent technical challenge today is to
meet society’s environmental expectations. That’s
why 40 percent of our budget for advanced
engineering is devoted to the Nissan Green Program
2010, our five-year environmental blueprint.
For our industry, environmental sustainability
represents the biggest engineering challenge. And
no matter what you may hear or read, there is no
silver bullet and no quick fix. In this race, the finish
line is nowhere in sight. So along with Renault, we
are pursuing every possible avenue of environmental
progress – from hybrids to fuel-cells to electric and
clean diesels.
In April, we announced that Nissan will introduce
a clean-diesel passenger car for all fifty states in the
U.S. in 2010. We will launch a Nissan Maxima
powered by a clean-diesel engine co-developed by
Nissan and Renault.
A focused technology strategy will once again be
a pillar of Nissan’s competitive strength and the core
of our brand identity.
Our alliance with Renault, the last driver of
profitable growth, is another pillar of future strength.
This model is unique and although not widely
understood, its effectiveness is unparalleled in the
automotive industry.
Together, we now rank fourth in sales volume
and second in total profitability in the global industry.
We share platforms, technologies and best practices
in order to improve our investment efficiency. And we
continue to achieve greater purchasing synergies
each year.
Our collaboration in R&D allows us to cover
every potential avenue of environmental progress.
Together, we advance on all fronts.

Nissan Annual Report 2006-20074
As for purchasing, the Alliance has supported our
breakthrough to develop new supply sources in
“Leading Competitive Countries,” especially in
Eastern Europe. We will also accelerate progress in
India with the Alliance.
There are still more areas of cooperation that
have yet to be realized.
Outlook
In fiscal year 2007, we will launch 11 new products
globally. The most important of these introductions
will be the five models for the U.S. We will launch an
all-new version of the Altima coupe, an all-new
version of the Infiniti G37 coupe, the all-new
compact crossover Rogue, the new compact luxury
crossover Infiniti EX, and an all-new version of the
Murano. Although we will again face a challenging
environment, I believe that we will get back on track
in terms of profit growth with these new models.
Long-term value creation
Despite our commitment to long-term value creation,
in recent years, our market-adjusted total return to
shareholders has been negative. In addition, our key
valuation multiples, including PER, have been lower
than our main competitors. Of course, multiples are
only rough estimates and the differences may be
attributed to various factors, including accounting
differences. However, given the size of this gap to
our competitors, it’s obvious that the market is
discounting the value of Nissan.
Based on our analysis, a significant part of this
gap is due to investor perceptions regarding our
long-term performance. To a lesser extent, our
recent short-term performance has also contributed
to this gap. Since the two perceptions are strongly
interrelated, our weak short-term performance has
negatively influenced perceptions regarding the
viability of our long-term performance.
In order to close this gap, we must first deliver strong
short-term results. And we must do this without
being short-term oriented because the market
always rewards companies that perform over the
long-term. When we can demonstrate strong short-
term performance, the long-term performance
perceptions should improve. What will close it is
consistently delivering strong short-term results.
Of course, we will not stop there. We will further
improve perceptions of our long-term potential via
transparent investor communications. After we
successfully put ourselves on a solid track of
profitable growth, investors’ desires for more
transparency increased significantly. They want to
know more about our future strategy and vision and
have a better understanding of how we will deliver
our plans.
Performance and transparency make for
credibility and that is what it takes to convince the
market of our future potential. In this uncertain
business environment, a company is required to not
only consistently deliver strong performance, but also
communicate to the market in a transparent manner.
A company cannot completely avoid all the ups
and downs in its performance. But it should learn
from past mistakes and never make them twice; this
behavior is part of Nissan’s DNA. We are committed
to gaining the trust of the market and delivering
superior performance.
Carlos Ghosn
President and Chief Executive Officer

Nissan Annual Report 2006-2007 5
EXECUTIVES
BOARD OF DIRECTORS AND AUDITORS
Representative Board MembersCarlos GhosnPresident and Co-Chairman
Itaru KoedaCo-Chairman
Toshiyuki Shiga
Board MembersHiroto SaikawaMitsuhiko YamashitaCarlos TavaresHidetoshi ImazuTadao TakahashiShemaya LévyPatrick Pélata
AuditorsHisayoshi KojimaTakeo OtsuboToshiyuki NakamuraHaruo Murakami
EXECUTIVE COMMITTEE MEMBERS
Carlos GhosnToshiyuki ShigaItaru KoedaHiroto SaikawaMitsuhiko YamashitaCarlos TavaresHidetoshi ImazuJunichi EndoColin Dodge
(As of June 20, 2007)
Carlos Ghosn
Hiroto Saikawa
Hidetoshi Imazu
EXECUTIVE COMMITTEE MEMBERS
Toshiyuki Shiga Itaru Koeda
Mitsuhiko Yamashita Carlos Tavares
Junichi Endo Colin Dodge

Nissan Annual Report 2006-20076
The targets outlined in the Nissan Value-Up plan for
sustainable growth would be far harder to achieve
without the close and continuing cooperation of our
Alliance partner, Renault. With CEO Carlos Ghosn
leading the executive committees of both companies,
the Alliance has become an even greater source of
global insight and solutions.
A distillation of best practices from two
companies is much more potent than what one alone
can produce. The Alliance board meets regularly to
develop strategy and to share perspectives on major
industry issues and opportunities.
Because its scope remains open and flexible, the
Alliance has generated a wide spectrum of projects
and initiatives. For example, one core benefit of the
Alliance is the capacity to carry out in-depth
benchmarking that would not be possible with a third
party. Nissan and Renault’s joint transparency policy
encourages such disclosures, giving us the
advantage of a dual angle on problems and their
potential solutions.
The Alliance presents opportunities in engineering
as well. We have collaborated on powertrain
development, for example, giving both Renault and
Nissan the chance to refine a fundamental
component of the carmaking craft. Across functions
and borders, our engineers are inspiring each other to
devise the vehicles of the future.
Further optimization of the Alliance in areas such
as distribution and shared production capacity lowers
cost and risk—factors that will help us expand faster
in the largely untapped General Overseas Markets
(GOM). Where one partner has a presence and the
other does not, the support and market knowledge is
there to be shared. For a totally new market or
segment, we discuss the best way to enter. Two
recent examples of Alliance cooperation are:
• New diesel engines with market-changing
potential. One is the M1D, a 2.0-liter common-rail
diesel that began rolling out across the Renault
and Nissan ranges in 2006. Another is an all-new
clean diesel engine that will debut in the United
States in 2010 in the Nissan Maxima. This
engine, part of a concerted effort to reduce CO2
emissions and dependence on pure petroleum-
based fuels, will clear stringent U.S. Environmental
Protection Agency emissions requirements.
• In July 2007, Nissan Mexicana introduced a new
vehicle to the Mexican market called the Aprio.
This car is a variation of the Renault Logan
already being marketed in more than fifty
countries under the Renault and Dacia brands.
The Aprio is built at the Renault manufacturing
plant in Curitiba, Brazil, and is the most recent
example of the robust collaboration between
Renault and Nissan.
To make the Alliance thrive, Nissan and Renault
concentrate solely on opportunities with the potential to
benefit both partners. One example is shared sales
financing services in various markets, including Europe.
If a project is not mutually advantageous, we either find
a way to balance the return or abandon the venture.
In the end, the true worth of the Alliance springs
from its virtually limitless potential. We realize that we
each have our own strengths and goals, but that only
energizes us to discover where we can rely on each
other for support. We challenge each other, too, and
in doing so, move our businesses to a higher road.
RENAULT-NISSAN ALLIANCE
A Robust and Fruitful Alliance
The Renault Scenic (left) and Nissan Dualis

Nissan Annual Report 2006-2007 7
THE NISSAN WAY
A global corporation must be nimble in both its
thinking and its actions to thrive in these highly
competitive times. For that reason, the foremost
tenet of the Nissan Way is cross-functionality—a way
to unite all our far-flung businesses and people.
Aligned with the Nissan Value-Up business plan, it is
our most potent management tool.
What does cross-functionality mean in everyday
terms? The easiest way to understand the concept is
to look at our cross-functional teams, or CFTs. A CFT
is a group of Nissan employees formed from various
regions, cultures, organizations and disciplines. Their
experiences and perspectives are often quite
different. What seems perfectly logical to one CFT
member may seem out of context to another.
Not surprisingly, the interactions between these
individuals often generate what we call “healthy
conflict.” Many companies would view such internal
tension as something to be avoided. We do not.
Instead, we believe it produces the kind of energy
and creative vision that sets a company above
the rest.
Behind all of these interactions is the collective
desire to serve Nissan’s customers. We realize that
no single part of our business is capable of
producing everything that our customers need—
exceptional products and the sales, distribution and
services that must accompany them. That is precisely
why cross-functional activities are the core of every
operation within Nissan.
Another fundamental and closely related concept
for us is “stretch.” Frequently a question arises that
potentially affects every facet of our operations.
When that happens, we have to look far and wide for
a definitive answer. One distinct advantage of being
a global business is that we can tap into a wealth of
grassroots knowledge and ways of thinking. In the
process, we often gain solutions that stretch the
organization in new and profitable directions.
Open, constructive exchanges are at the heart of
effective two-way communications. The way we
relate to others, both inside and outside Nissan, is
based on mutual trust and respect. And because
information flows so much faster now, we have
developed sophisticated new communications
channels. Nissan employees can access company
data and transmit what they know to our
stakeholders, suppliers, the media and other
interested parties in a more efficient way.
Nissan’s strength springs from our motivated,
passionate people, and we work to increase their
enthusiasm in many ways. Keeping our management
consistent and promoting empowerment is one of
those ways. Our managers operate with strict
accountability, assess progress objectively, and
readily acknowledge superior performance. Their
attitudes and ethical behavior inspire trust in the
actions and decisions of the company. Employees
readily participate in the decision-making process
because they know the management structure and
feel confident in expressing their own opinions and
ideas. That is how true empowerment grows.
Those are the elements of our corporate
philosophy. As Nissan continues to pursue
sustainable, profitable growth, our thinking will
remain broad. Our ultimate goal is to become the
leading automaker in brand strength, quality,
profitability and performance, and we aim to do it in
every country, region and product segment. The
Nissan Way will continue to give us the flexibility to
redefine who we are, based on the needs and
desires of our customers.
What Keeps Nissan in Motion

Nissan Annual Report 2006-20078
ELEGANT AND SEAMLESS. ATTUNED AND INTUITIVE. DRIVING BEYOND
EXPECTATIONS. THESE ARE ALL NISSAN ATTRIBUTES, INTEGRAL TO OUR CARS
AND HOW WE CREATE THEM. FROM ENTRY-LEVEL VEHICLES TO OUR TIER 1
LUXURY BRAND, INFINITI, SINGULAR PERFORMANCE IS A GIVEN. NISSAN’S
PROFITABLE, COST-COMPETITIVE NATURE REFLECTS THAT, BRINGING US
MORE CUSTOMERS WHO RECOGNIZE AND VALUE QUALITY.
PERFORMANCE
» P E R F O R M A N C E

Nissan Annual Report 2006-2007 9
Performance
P E R F O R M A N C E »

Nissan Annual Report 2006-200710
In fiscal 2006, all the anticipated headwindsmaterialized. There was almost no growth in maturemarkets. And with high levels of incentive spending,the industry had no ability to pass on higher raw-material costs to the consumer.
The result was a tough business climate for theauto industry at the lowest point in Nissan’s productcycle and at a time when Nissan is investing heavilyfor its future.
We knew the first half would be rough. As ourproduct offensive began in the second half, weforecast a recovery in both sales and profit.
However, the full-year results were below ourexpectations and our actions did not match thechallenge. So, for the first time in eight years wehave missed the performance objectives we had setfor ourselves.
Sales performanceOur fiscal 2006 global sales came to 3,483,000units, 2.4 percent below the previous year. Aroundthe world, we introduced ten all-new models—all butone in the second half—including several importantpillars of our line-up:
• An all-new version of Altima, our volume leaderin the U.S.
• The new generation of Infiniti’s volume leader,the G35
• Livina Geniss, the first model in a new family ofglobal cars launched first in China
Fiscal 2006 financial performanceThere is an important note on a change inconsolidation methods which is in line with autoindustry standards: As previously announced, in orderto increase transparency and consistency, we areharmonizing calendar-year results for overseassubsidiaries such as Europe and Mexico with fiscal-year results for Nissan Motor Co., Ltd.
With the exception of some countries wherefiscal-period accounting is precluded by law, all
overseas subsidiaries have been harmonized to alignwith the consolidated fiscal period ending in March.So this year we will align calendar with fiscal byincluding five quarters of results for subsidiariespreviously consolidated on a calendar-year basis.
• Consolidated net revenues was ¥10 trillion468.6 billion, with the inclusion of ¥767.6 billion offifth-quarter results from calendar-year subsidiaries,compared to ¥9 trillion 428.3 billion.
• Operating profit was ¥776.9 billion, with theinclusion of ¥21.4 billion of fifth-quarter results,compared to ¥871.8 billion in fiscal 2005.
• Operating-profit margin was 7.4 percent, withthe inclusion of fifth-quarter results, comparedto 9.2 percent in fiscal 2005.
• Ordinary profit was ¥761.1 billion, with theinclusion of ¥18.5 billion of fifth-quarter,compared to ¥845.9 billion in fiscal 2005.
• Net income reached ¥460.8 billion, with theinclusion of ¥11.6 billion of fifth-quarter,compared to ¥518.1 billion in fiscal 2005.
• We had a net cash position of ¥254.7 billion atthe close of fiscal 2006.
Nissan Value-Up commitmentsNissan Value-Up features three commitments:
• To maintain the top level of operating profitmargin among global automakers for each ofthe three years of the plan
• To achieve global sales of 4.2 million units infiscal 2008
• To achieve a 20 percent return on investedcapital on average over the course of the plan,excluding cash on hand
Fiscal 2006 did not boost results towardsachieving the objectives of Nissan Value-Up.
However, the commitments are still within thepotential of the company and Nissan remainsfocused on delivering them completely. As such, thecompany will extend the delivery period of the NissanValue-Up commitments by one year.
Continuing Challenges on All Fronts
FISCAL 2006 PERFORMANCE
» P E R F O R M A N C E

’02 ’03 ’04 ’05 ’06
6,828.6
7,429.2
8,576.3
9,428.3
10,468.6+11.0%
’02 ’03 ’04 ’05 ’06
737.2
824.9
861.2
871.8
776.9-10.9%
’02 ’03 ’04 ’05 ’06
2,771
3,057
3,389
3,569
3,483-2.4%
7.4%
11.1%10.0%
9.2%10.8%
Nissan Annual Report 2006-2007 11
Consolidated Net Revenue(Billion Yen)
Consolidated OperatingProfit/Margin(Billion Yen/%)
Global Retail Sales(Units: 1000s)
Consolidated Operating ProfitMargin
FY05 9.2%
FY06 7.4%
FY05 19.4%
FY06 15.3%
ROIC=
COP(auto) [Fixed assets + net working capital]
* Same scope of consolidation as P&L
Return on Invested Capital(Auto)
FY05 3,569
FY06 3,483
Global Sales Volume(Units: 1000s)
P E R F O R M A N C E »
Nissan Value-Up Three Commitments

Nissan Annual Report 2006-200712
At our third-quarter financial announcement, we
acknowledged our performance was unsatisfactory
and pledged to take immediate action.
We now have a new leadership team; with an
Executive Committee expanded from seven to nine
members to better cover our business priorities.
We have also taken a number of business
initiatives to improve profitability:
• In Japan, we are restructuring our dealer
network to focus more on the customer with
better-trained resources.
• In the first quarter, our Oppama and Tochigi
plants transitioned to single-shift operations to
be in line with actual demand in Japan.
• Nissan Shatai will close its #1 plant and shift
production to the #2 plant, and to the Kyushu
plant, which is being expanded.
• We have initiated voluntary-retirement programs
across all operations in Japan.
• In the U.S., we have implemented voluntary-
transition programs.
• In Europe, we’re transforming national sales
companies into leaner regional business units.
• In South Africa, we have announced headcount
reductions to boost productivity and
competitiveness.
We are fine-tuning our operations in order to boost
our performance. As we address short-term issues,
we remain focused on our long-term goals, while
keeping a close eye on the motivation and
engagement of our people.
Sales objective
• Global sales at 3.7 million units, a 6.2 percent
increase
• Japan sales at 700,000 units, which is based
on the expectation of a further decline in total
industry volume and a very competitive market
• U.S. sales at 1.1 million units
• European sales at 600,000 units
• General Overseas Markets, including Mexico
and Canada, sales at 1.3 million units
Financial outlook
Throughout fiscal 2007, we will again face a
challenging environment due to high raw-material and
energy prices, rising interest rates, volatile foreign-
exchange rates, high incentive levels and a growing
number of distressed suppliers and competitors.
The only way to overcome all these obstacles is
to remain focused on delivering Nissan Value-Up
effectively and completely.
Taking all of the above into account, our forecast
for fiscal 2007 is as follows. This is based on a
foreign-exchange-rate of ¥117 per dollar and
¥148 per euro, which were the average rates during
fiscal 2006:
• Net revenue of ¥10 trillion 300 billion
• Operating profit of ¥800 billion
• Ordinary profit totaling ¥773 billion
• Net income at ¥480 billion
• Capital expenditures of approximately
¥515 billion
• R&D expenses totaling ¥490 billion
Taking Action to Boost Performance
FISCAL 2007 OUTLOOK
» P E R F O R M A N C E

Nissan Annual Report 2006-2007 13
Europe
X-TRAIL
Japan
Atlas F24GT-R
GOM*
LivinaAprio
Frontier Navara S/C
*General Overseas Markets
U.S.Altima CoupeG37 Coupe
RogueInfiniti EXMurano
New Models for Fiscal 2007
’02 ’03 ’04 ’05 ’06 ’07Forecast
2,771
3,057
3,389
3,569
3,483
3,700+6.2%
848
700-5.4%
740
842
’04 ’05 ’06 ’07Forecast
1,013
1,100+6.3%
1,035
1,075
’04 ’05 ’06 ’07Forecast
544
600+11.2%
540
541
’04 ’05 ’06 ’07Forecast
983
1,300+11.3%
1,168
1,111
’04 ’05 ’06 ’07Forecast
Global Retail Sales Volume(Units: 1000s)
Retail Sales by Region(Units: 1000s)
Japan U.S. Europe GOM *1
*1 Including Mexico and Canada
P E R F O R M A N C E »

Nissan Annual Report 2006-200714
Fiscal 2006 did not boost our results towards
achieving the objectives of Nissan Value-Up. But we
believe the commitments are still within the potential
of the company and we remain focused on delivering
them completely. Accordingly, we will extend the
delivery period for all Nissan Value-Up commitments
by one year. At the same time, we continue to
prepare our next business plan, and we will
announce it next April.
Nevertheless, during fiscal 2006, we made
tangible progress towards the four key
breakthroughs that are central to Nissan Value-Up.
Our first breakthrough aims to establish Infiniti as a
globally recognized luxury brand. In fiscal 2005,
Infiniti was introduced in Korea. And in fiscal 2006,
the brand was successfully launched in the rapidly
growing Russian market. In fiscal 2007, geographic
expansion will accelerate as Infiniti enters the
Chinese and Ukrainian markets and then extends
across Western Europe in 2008. To serve these new
markets, new products are coming. The all-new G35
sedan launched in 2006 will be followed this year by
the G37 coupe and the EX compact luxury
crossover. Infiniti is poised for rapid global growth.
The second breakthrough aims to build a global
presence in Light Commercial Vehicles—or “LCVs.”
Global sales have grown 57 percent, since the start
of Nissan Value-Up, to 490,000 units in fiscal 2006.
More importantly, the LCV business unit over-
achieved its 8 percent operating-margin milestone.
With LCVs now firmly established as a pillar of our
global business, we are building on this momentum.
The third breakthrough involves developing new
sources for parts, machinery & equipment, vendor
tooling and services in what we call “Leading
Competitive Countries.” Sourcing bases are now
established in China and ASEAN for Japan; in Mexico
for North America; and in Eastern Europe for Europe.
To accelerate progress, the next step will be to
develop a new sourcing base in India. In fiscal 2006,
for Japan, North America and Europe, 15 percent of
our purchasing, by value, was sourced from LCCs,
versus 12 percent the previous year. In fiscal 2007,
we will accelerate this trend to source 24 percent of
our purchasing from LCCs. To reduce costs and
focus employees on core tasks, we are outsourcing
back-office functions and a variety of work in
engineering, information services and manufacturing.
In fiscal 2006, this effort yielded gross savings of
¥43 billion in costs reduced or avoided.
The fourth breakthrough expands our geographic
presence in emerging markets, known as BRICs and
beyond. In Brazil, we are investing $150 million in our
operations and targeting sales of 40,000 units by
2009. In Russia, we are investing $200 million in a
plant in St. Petersburg that will have a capacity of
50,000 units when it opens in 2009. In India, we are
joining Renault in a partnership with Mahindra.
Together, we are building a plant in Chennai that
will open in 2009, with a planned capacity of
400,000 units. In China, since 2003, we have
invested $1.6 billion in our partnership with
Dongfeng, with recent investments in a new engine
plant and a new R&D center.
Despite Challenges, Mid-Term Plan and Breakthroughs Continue to Drive Our Business
STATUS OF BREAKTHROUGHS
» P E R F O R M A N C E

Nissan Annual Report 2006-2007 15
During Nissan Value-Up we will pursue four major breakthroughs:
Infiniti Global Top Tier Brand Light Commercial Vehicles (LCVs)
Leading Competitive Countries (LCCs) Geographic Expansion
500
400
300
200
100
0
(Thousand units)
10
8
6
4
2
0
(% of consolidated operating margin)
NRP Nissan180
Nissan Value-Up
’00 ’01 ’02 ’03 ’04 ’05 ’06 ’07
401
490
>8.0%
7.7%
Objective
Middle East Korea ’05Taiwan
North America
Europe ’08
Russia ’06
Ukraine ’07
China ’07
China
Brazil
Russia
India
HungaryRomania
EgyptIndia
China
ThailandVietnam
Mexico
MercosurCountries
P E R F O R M A N C E »
Nissan Annual Report 2006-200716
1,000
850
700
550
FY05O.P.
FY06w/Q5O.P.
Scope of con-solida-
tionPrice/
Volumemix
Sellingexpenses
(Incl.incentives)
Pur-chasingcost reduc-
tionProduct
enrichment and
regulatory costs
R&Dexpenses
Manu-facturing expenses
Warrantyexpenses
G&A others
871.8
FY0612
monthsO.P.
755.5
+8.4
–156.3
–21.8
+170.0
Rawmaterial/Energy
cost
–110.1
–66.3–1.4 –4.9
+1.9–6.6
776.9Q5
Effect
+21.4
FOREX+70.8
Impact on Operating Profit(Billion Yen)
FISCAL 2006 WAS THE FIRST TIME IN EIGHT YEARS WE MISSED THE PERFORMANCE OBJECTIVES
WE HAD SET FOR OURSELVES. ALL THE ANTICIPATED HEADWINDS MATERIALIZED. HOWEVER, OUR ACTIONS
DID NOT MATCH THE CHALLENGE.
WE HAVE TAKEN A NUMBER OF BUSINESS INITIATIVES TO IMPROVE PROFITABILITY AT THE END
OF FISCAL 2006. WE REMAIN FOCUSED ON DELIVERING THE MID-TERM PLAN “NISSAN VALUE-UP”
COMPLETELY.
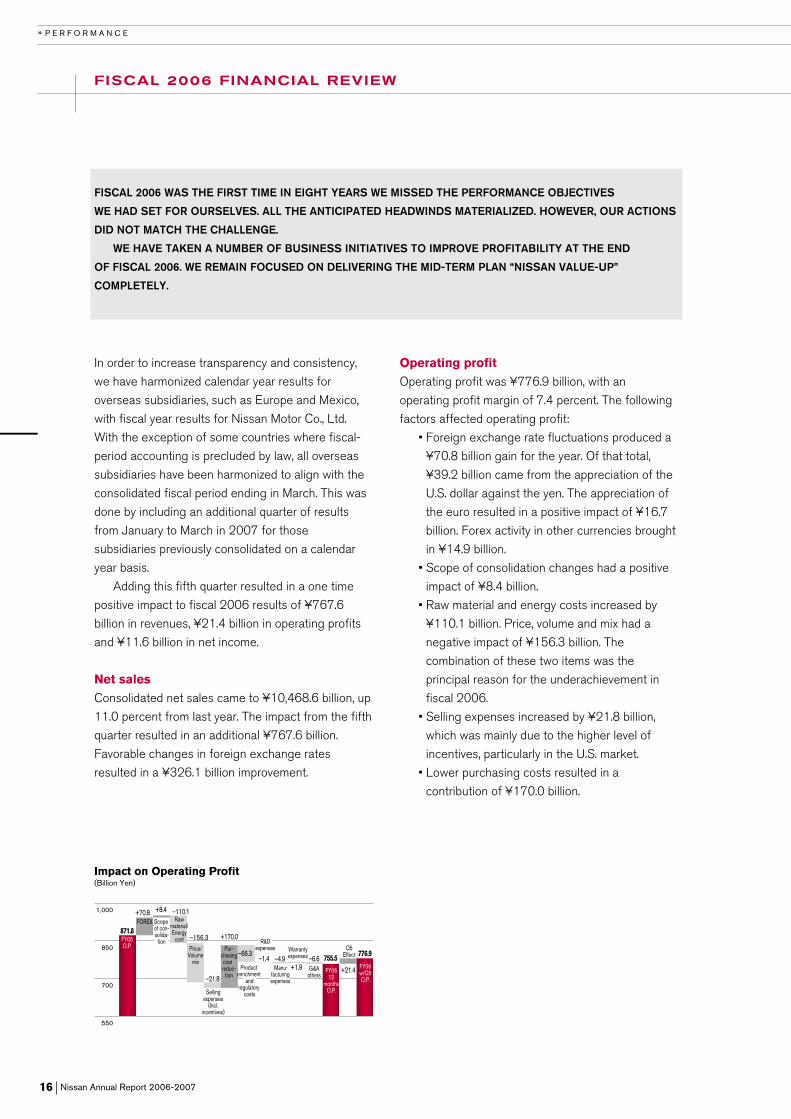
In order to increase transparency and consistency,
we have harmonized calendar year results for
overseas subsidiaries, such as Europe and Mexico,
with fiscal year results for Nissan Motor Co., Ltd.
With the exception of some countries where fiscal-
period accounting is precluded by law, all overseas
subsidiaries have been harmonized to align with the
consolidated fiscal period ending in March. This was
done by including an additional quarter of results
from January to March in 2007 for those
subsidiaries previously consolidated on a calendar
year basis.
Adding this fifth quarter resulted in a one time
positive impact to fiscal 2006 results of ¥767.6
billion in revenues, ¥21.4 billion in operating profits
and ¥11.6 billion in net income.
Net sales
Consolidated net sales came to ¥10,468.6 billion, up
11.0 percent from last year. The impact from the fifth
quarter resulted in an additional ¥767.6 billion.
Favorable changes in foreign exchange rates
resulted in a ¥326.1 billion improvement.
Operating profit
Operating profit was ¥776.9 billion, with an
operating profit margin of 7.4 percent. The following
factors affected operating profit:
• Foreign exchange rate fluctuations produced a
¥70.8 billion gain for the year. Of that total,
¥39.2 billion came from the appreciation of the
U.S. dollar against the yen. The appreciation of
the euro resulted in a positive impact of ¥16.7
billion. Forex activity in other currencies brought
in ¥14.9 billion.
• Scope of consolidation changes had a positive
impact of ¥8.4 billion.
• Raw material and energy costs increased by
¥110.1 billion. Price, volume and mix had a
negative impact of ¥156.3 billion. The
combination of these two items was the
principal reason for the underachievement in
fiscal 2006.
• Selling expenses increased by ¥21.8 billion,
which was mainly due to the higher level of
incentives, particularly in the U.S. market.
• Lower purchasing costs resulted in a
contribution of ¥170.0 billion.
FISCAL 2006 FINANCIAL REVIEW
» P E R F O R M A N C E

Nissan Annual Report 2006-2007 17
1,400
1,050
700
350
0
Free cash flow¥21.0 billion
Financingactivities
–¥165.7 billion
Net automotive
cash at beginning of FY06
Net automotive cash at the
end of FY06
Net cashfrom
operations
Workingcapital
andothers
Investing activities
Dividend paid
FX rate impact
+1,038.6 –255.1
–496.8
Tax paid
–265.7
–131.1372.9
Other financial activities
–53.3 +26.5Treasury
stock
+18.7
254.7
Net Cash Flow (automotive)(Billion Yen)
• Product enrichment, including regulatory costs,
had a negative impact of ¥66.3 billion.
• R&D expenses increased by ¥1.4 billion.
• Manufacturing and logistics expenses went up
by ¥4.9 billion.
• Warranty expenses had a positive impact of
¥1.9 billion.
• General, administrative and other expenses rose
¥6.6 billion.
• As previously mentioned, the inclusion of an
additional quarter from former December
ending companies generated a positive impact
of ¥21.4 billion.
By region, for fiscal 2006, operating profits in
Japan were ¥270.6 billion, which decreased from
¥390.4 billion in fiscal 2005. Although mini cars
remained a profitable business, the deterioration in
mix and decrease in overall volumes in Japan were
the main reasons for the decline in profitability.
Profitability in the U.S. and Canada was ¥282.6
billion, versus ¥345.4 billion last year. Thirty percent
of the decline in U.S. profitability was attributable to
the QR 25 engine recall, which was booked in
regional accounts. In Europe, operating profit
increased to ¥79.6 billion in fiscal 2006 from ¥67.2
billion in fiscal 2005. In the General Overseas
Markets, operating profit was ¥113.3 billion, versus
¥101.2 billion last year. Inter-regional eliminations
resulted in a positive ¥9.4 billion.
Net income
Net non-operating expenses came to ¥15.8 billion,
improving from last year’s ¥25.9 billion due to the
absence of a negative foreign exchange impact.
Net extraordinary items totaled negative ¥63.7
billion, ¥26.8 billion higher than last year. Included in
this year’s extraordinary items were headcount
reduction programs in the U.S. and Japan, which were
announced in April, with an impact of ¥28.0 billion.
Pre-tax income was ¥697.4 billion. Taxes totaled
¥212.1 billion, which represented an effective
consolidated tax rate of 30.4 percent.
Minority interests, which are profits from fully
consolidated companies that Nissan does not own
outright, such as Calsonic Kansei, Aichi Kikai and
Nissan Shatai, amounted to ¥24.5 billion. Net income
reached ¥460.8 billion, versus ¥518.1 billion in
fiscal 2005.
FINANCIAL POSITION
Balance sheet
In fiscal 2006, Nissan’s total consolidated assets
went up by 8.0 percent to ¥12,402.2 billion.
Current assets increased by 7.8 percent to
¥6,492.9 billion. The main reasons were the ¥190.5
billion increase in notes and accounts receivables and
a ¥148.2 billion increase in inventories. Fixed assets
increased to ¥5,909.3 billion, an 8.3 percent rise.
Moody’s
S&P
R&I
A+
AA–
A
A–
BBB+
BBB
BBB–
BB+
Aa3
A1
A2
A3
Baa1
Baa2
Baa3
Ba1
9/01 4/02 9/02 4/03 9/03 4/04 9/04 4/05 9/05 4/06
Corporate Rating
P E R F O R M A N C E »

500
400
300
200
6
5
4
3FY ’99 ’00 ’01 ’02 ’03 ’04 ’05 ’06 ’07(Forecast)
4.0%3.8%
4.2%4.4%
4.8%
4.6% 4.7%4.4%
4.8%
239 232262
300
354
398
448465 490
R&D (left scale) % of net revenue (right scale)
Nissan Annual Report 2006-200718
40
30
20
10
0 FY ’99 ’00 ’01 ’02 ’03 ’04 ’05 ’06 ’07(Forecast)
7
0
8
14
19
24
29
34
40
NRP Nissan 180 Nissan Value-Up
Dividend Policy(Dividend per share, in yen)
Current liabilities went up 14.9 percent to
¥5,575.3 billion. This was due to increases in short
term borrowings. Non-current liability decreased by
9.4 percent from fiscal 2005 to ¥2,949.9 billion.
This was mainly caused by the decrease in long
term borrowings.
Net assets increased 14.8 percent to ¥3,877.0
billion compared to ¥3,377.0 billion in fiscal 2005,
which had been adjusted for related implementation
guidance. This was mainly due to the increase in net
income of ¥460.8 billion, which was offset by the
decrease of ¥131.1 billion in dividends paid.
Automotive net cash change
Cash from operations totaled ¥1,038.6 billion. Free
cash flow totaled ¥21.0 billion by increased working
capital, tax payment and capital expenditures. Cash
outflow from financing activities totaled ¥165.7
billion, including ¥131.1 billion for dividend payments.
We had a net cash position of ¥254.7 billion at
the end of fiscal 2006, which represented a
decrease of ¥118.2 billion compared to the
beginning of the fiscal year. This was due to the
decrease in cash from operations and increase in
capital expenditures.
Credit rating
R&I had Nissan’s long term credit rating listed as A,
as of May 16, 2005. S&P upgraded our rating from
BBB to BBB+ on July 20, 2004, and Moody’s
upgraded us from Baa3 to Baa1 on March 9, 2004.
Investment policy
Capital expenditures were ¥509.0 billion, or 4.9
percent of net revenue. This included the
investments in “New Design Center” and “Nissan
Advanced Technology Center”. R&D expenditures
were ¥464.8 billion. The funds were used for
developing new technologies and products. Our R&D
strategy is focused, sustainable and innovative.
This strategy is a result of our cross-functional
corporate culture.
And through the Alliance, we now have an
extensive collaboration with Renault’s R&D.
Dividend
At the annual general meeting of shareholders on
June 20, 2007, the company proposed increasing its
dividend to ¥34 per share in fiscal 2006, which was
an increase from ¥29 in 2005. And we will maintain
the dividend payment plan of ¥40 per share at the
end of Nissan Value-Up in March 2008.
Return on invested capital
At the end of fiscal 2006, return on invested capital
(ROIC) was 15.3 percent. This decline from 19.4
percent in fiscal 2005 was mainly due to the
decrease in operating profit.
Nissan will continue to ensure that investments
are made within the strict guidelines of its operating
policies.
R&D Expenditure(Billion Yen) (% of net revenue)
» P E R F O R M A N C E

Nissan Annual Report 2006-2007 19
Share performance in fiscal 2006
At the start of fiscal 2006, Nissan’s share price
began at ¥1,398 and ended at ¥1,263, generating a
negative return of 9.7 percent. With the annual
dividend of ¥34, total return to shareholder (TRS)
was a negative 7.2 percent. On a market-adjusted
basis, our TRS was a negative 7.4 percent. While it is
true that our profit declined substantially in fiscal
2006, there are many activities going forward which
are not reflected in our current result. In this report,
corporate officers will explain what actions Nissan
has taken and will take to ensure better performance
for the future.
Payout policy
At the annual general meeting of shareholders on
June 23, 2004, Nissan announced its Nissan Value-
Up three-year dividend policy, covering the period
from fiscal 2005 to fiscal 2007. Nissan proposed
a long-term dividend policy to provide more visibility
and improve transparency into the ways in which the
company rewards its shareholders. Nissan believes
that a long-term dividend policy reduces uncertainty
for investors who currently own or are considering
acquiring Nissan stock.
IR activities
Under Nissan Value-Up, the IR team’s performance
will be evaluated based on the price-earnings ratio
(PER) and volatility relative to our major competitors.
PER is used to measure how successfully the IR
team can manage market expectations about Nissan
in order to maintain share price close to an intrinsic
value. The other measure, volatility, is used to
measure the risk perceived by investors in Nissan’s
stock. If Nissan can successfully reduce volatility, the
minimum return required by investors should decline.
In order to improve both measures, the IR team
believes that it’s essential to improve the company’s
transparency. The team plans to disclose not only
financial results but also forward-looking information
about Nissan’s fundamentals, such as technology
and product. Such information should help investors
forecast the company’s future performance
accurately and reduce uncertainty. In addition, our
top management team will increase their availability
to communicate directly with investors. We believe
that this will further enhance investors’
understanding of Nissan’s future strategy.
FISCAL 2006 SHARE PERFORMANCE
THE INVESTOR RELATIONS TEAM’S ROLE IS TO BETTER ADDRESS THE NEEDS OF INVESTORS
AND ENHANCE THEIR UNDERSTANDING OF NISSAN’S PERFORMANCE. WE ARE COMMITTED TO ENSURING
THAT INVESTORS WILL NOW BE ABLE TO GAIN A MORE IN-DEPTH VIEW OF THE COMPANY’S OPERATIONS
AND PERFORMANCE INDICATORS.
130
120
110
100
90
800.8
1.3
TOPIX Transportation Equipment Index
TOPIX
Nissan
Apr.2006 2007
May June July Aug. Sept. Oct. Nov. Dec. Jan. Feb. Mar.
Fiscal 2006 Share Performance(Index: March 31, 2006=100)
250
200
150
100
50
0 ’03 ’04 ’05 ’06 ’07
TOPIX Transportation Equipment Index
TOPIX
Nissan
Five-Year Share Performance(Index: March 29, 2002=100)
P E R F O R M A N C E »

NISSAN’S CONTINUUM OF CONCERTED GROWTH REACHES INTO MARKETS
AROUND THE WORLD AND MAGNIFIES OUR STRENGTH. EVEN AS OUR PACE
IN THIS PURSUIT QUICKENS AND OUR LINEUP GAINS BRIGHT NEW FACETS,
WE REALIZE THAT ONLY FOCUSED EXPANSION MAKES SENSE. THAT IS WHY,
REGION BY REGION AND CUSTOMER BY CUSTOMER, NISSAN CONTINUES TO
FLOURISH IN BOTH ESTABLISHED MARKETS AND FARFLUNG NEW TERRITORIES.
REGIONAL ACTION
Re Nissan Annual Report 2006-200720
» R E G I O N A L A C T I O N

gional ActionNissan Annual Report 2006-2007 21
R E G I O N A L A C T I O N »

Nissan Annual Report 2006-200722
Our sales volume in Japan during fiscal 2006was 740,000 units, representing a year-on-yeardecline of 12.1 percent. External factorsinfluencing these results included the drop intotal industry volume and a shift in demand tothe mini-car segment. Total industry volumewas down by 4.1 percent from the previous yearto 5.62 million units.
However, internal factors also played a role. For
example, we did not launch any new models in major
segments such as compacts and mini-vans. While
mini-car sales reached an all-time high, the sales of
what are referred to as “registered” cars dropped
significantly, going below 3.6 million units for the first
time since 1977.
As the aging of the population accelerates and
customer values change, the reality is that we can no
longer expect a big rise in total industry volumes in
the future. Competition will continue to get tougher
as well. However, we believe that even in this rapidly
changing environment Nissan can establish a
competitive advantage. Therefore, we have taken a
series of corrective actions, as opposed to passively
following the market environment and shifts in
customer behavior.
One of these essential reforms involved
modifying the sales function. Starting in April 2005,
we began combining our Red and Blue Stage outlets
so that customers would have one-stop access to
the entire range of Nissan products. Having multiple
sales channels for one brand can be effective in a
growing market. But once market growth diminishes,
the multiple channel strategy is an inefficient way to
run a sales network. That structure also forces you to
constantly introduce new models to maintain those
channels, which can have a negative impact on
investment efficiency. It is time for us to examine
how to achieve the highest level of customer
satisfaction, and then accomplish that in the most
efficient manner possible.
Our sales network has historically been built on
regions and channels. Now we offer customers the
full lineup of Nissan products and life-long service
support through our rationalized outlets.
In addition, Nissan is the first company to
optimize its outlet locations as a way to minimize
operational costs and utilize outlet assets more
efficiently. In July 2006, we established Nissan
Network Holdings to manage our 52 consolidated
dealers in Japan. We also split the sales and asset
management functions into separate companies.
Now we are consolidating sales companies and
optimizing our outlets prefecture by prefecture
through consolidation, terminations and new sales
points. In fiscal 2006, we successfully completed this
process in five prefectures and are now working to
duplicate that feat in a dozen more.
As we announced in March 2007, the objective
of the Nissan network strategy is to further
accelerate our restructuring efforts and transform
our networks into a distinct competitive advantage.
We will focus on the quality of our sales interactions
and work to achieve outlet operations with higher
customer satisfaction and profitability. We plan to do
this by sharing best practices between outlet
operations and improving the capabilities of our
employees. Given the tougher competitive
environment we face, we are working on reducing
our indirect activities to improve the cost structure of
our sales companies. At the same time, we are
committed to supporting the sales staff with better
tools and methods.
Maintaining stable sales and higher production in
Japan is crucial for us to secure our competitiveness
as a global manufacturing company. That is why we
need to regain momentum in our domestic
operations and improve profitability. We are working
Establishing a Competitive Advantage in Japan
JAPAN
TOSHIYUKI SHIGAChief Operating Officer
» R E G I O N A L A C T I O N

Nissan Annual Report 2006-2007 23
not only on network reform but also a variety of other
activities, such as launching appealing new models,
developing innovative technologies, and optimizing
the manufacturing cost structure in Japan.
The 12th-generation Skyline, which we launched
last November, has exceeded our initial forecast
thanks to its design, driving performance and
technology. Our Dualis, which we introduced in May,
is also off to a solid start. While customers are
changing their attitudes about car ownership,
treating cars more as commodities, we believe we
can build a stronger brand and presence in Japan if
we provide unique and innovative products.
We believe that the rapid changes in the market
and competition are here to stay and indeed,
intensify. However, we will seek to boost our
competitive advantage in Japan by continuing to
revolutionize our operations and products.
R E G I O N A L A C T I O N »
In order to develop a more powerful sales network by renovating and empowering our outlets (sales front),
Focus on the sales front
Change network management
High-performanceoutlets
As a first step, NML must alter the whole concept of its Domestic Marketing and Sales Divisions.
Switch from NML-led “Across-the-board” management to “Management that focuses on frontline sales communications”
Move from Management by prefecture/dealer to “management by individual outlet”
Inno
vativ
e S
ales
Out
lets
Staff empowerment
Increase and improve outlet support team and field staff
Frontline focusDelegate more discretionary authority to individual outlets(Respect uniqueness and local needs)
Outlet allocationPromote the Prefectural Project(Optimize domestic outlet placement and investment)
Low-cost operation
Reduce indirect costs by leveraging our Business Center (BC) Shared Service Center (SSC)
Unique outlets, Frontline innovations, Better area marketing
Dualis Skyline Serena
Nissan Domestic Sales Network Renovation
Steps to Energizing the Outlets
The automotive market in the United States wasa tale of two halves in fiscal 2006. In the first sixmonths of the year the industry was relativelyhealthy, but we lacked new product offerings.When we launched products in the second half,the economic environment was not as invitingas fuel prices started rising and housing startsslowed. As a consequence, total industryvolume fell rapidly.
As volumes declined, so did the vehicle mix. People
were moving from traditional SUVs to crossover
vehicles and from light trucks to sedans and small
cars. Our sedan lineup performed relatively well,
particularly the cars we launched, but a drop in the
truck segments overshadowed a lot of their success.
Although the U.S. market is still one of the most
vibrant markets in the world, TIV fell to about 16.5
million units last year. This year it’s hovering
between 16 and 16.2 million. In January 2007, we
projected the market would fall to 16 million during
the fiscal year. Unfortunately, to date, we were right.
In two years, the U.S. market will have lost close to a
million units.
The introduction of our new small car, the Versa,
was well timed as fuel prices are climbing. This product
answers the needs of the marketplace, although
admittedly the margins for that segment aren’t as
high as larger cars. Still, it’s better for us to capture
those customers than lose them to somebody else.
The competition in the U.S. market remains
fierce, and that’s reflected by high levels of
incentives and rapid product introductions. Incentives
are a constant in the marketplace now—the only
thing that changes is how fast they’re announced
and how big they are. There was a time during 2006
when some makers, after reducing their prices were
attempting to go without incentives. By the end of
the fiscal year, though, they’d reversed that trend and
were bringing back the incentives again, on top of
the lowered prices, particularly for trucks.
The constant barrage of new products that we’re
planning over the next several years will be the fuel
for our growth in this difficult environment. For the
Nissan Division, we launched the Versa, Sentra and
an all-new Altima sedan. In the summer, we launched
our first-ever coupe version of the Altima. Later in the
year, we will release the Rogue, our new entry in the
midsize crossover segment. Between those two cars,
we’re entering segments that we had no offer in
before. Virtually all those sales should be incremental.
In the second half of fiscal 2006 our sedan sales
were up significantly, driven by the Altima, which is our
Nissan brand volume leader. In the past, the Sentra
covered both the entry-level segment and the compact
car segment. With the introduction of the Versa to the
entry-level market, we elevated the Sentra’s stature to
cover solely the compact car segment.
The Altima coupe is a line extension, and an
exciting one. There are a few other coupes out there,
but none really fulfills the word properly. A coupe
shouldn’t be just a two-door version of the sedan.
Altima will be the first true coupe in that segment. Of
the nine body panels on a vehicle, for example, it only
shares one with the Altima sedan, and we’ve also
shortened the wheelbase. While there’s still a family
resemblance, it’s a dramatic departure from the sedan.
The Rogue is entering the fastest-growing
segment in the market today, and one that so far has
been dominated by a few other models. With fuel
prices so high, some people are migrating from
traditional SUVs to mid-sized crossovers, while
others are going to the small SUVs. This is a real
opportunity to further expand our volume.
On the Infiniti side, we’ll be launching the G37
coupe later in fiscal 2007. This is a replacement vehicle
for a model that was very successful and in fact, the
press coverage has already been very positive.
Nissan Annual Report 2006-200724
Building on a Strong Product Plan in a Shifting Market
DOMINIQUE THORMANNSenior Vice PresidentNissan North America
NORTH AMERICA
» R E G I O N A L A C T I O N

At the New York Auto Show we also unveiled the
Infiniti EX35, our first entry into the small luxury
crossover segment. Those sales will also be virtually
all incremental. The migration from traditional SUVs
to mid-sized crossovers and small SUVs in both
divisions is probably the biggest opportunity we have
in the short run, because those are rapidly growing
segments where we haven’t had a presence before.
Trucks represent a declining segment in which
the competition is very brutal. We’re not shying away
from that challenge, but we’re also not resorting to
deep incentives just to maintain a bigger presence in
a shrinking market. Our number one goal is
profitability, not chasing volumes.
From a brand perspective, our goal on the Nissan
side is to increase customer brand opinion. A lot of
new-car buyers consult Consumer Reports magazine
before deciding what to buy, so we were really pleased
to see that after a recent test by the magazine, they
gave the new Altima a very good review.
On the Infiniti side, the short-term goal is to
enhance brand recognition, because in relative terms
we’re a new brand in the U.S. luxury market.
Consumer Reports recognized Infiniti’s G35 and M
as two of the ten best cars in America for safety and
reliability in their respective categories. In the long
term, our goal is to become one of those Tier 1
luxury players. That’s something that has to be
earned—it’s not something you can just claim.
You have often heard Nissan talk about the
importance of good, competitive products. It’s what
customers see and, ultimately, what makes them choose
the brand they buy. But for products to be competitive
in the marketplace, Nissan must also be profitable. In
the automotive industry, that means cost competitive.
Cost competitiveness means first and foremost
having the right people, but also the right purchase
costs, efficient processes and an effective
organization. It is with this necessity in mind that
NNA moved its corporate headquarter in 2006 to
Nashville, Tennessee.
Customers see one product at the end of a
complex design, manufacturing and sales process.
For the customer to get the best product at the most
competitive cost, NNA must operate as one team.
Moving the sales, marketing, finance and all of the
administrative functions to be with manufacturing,
supply chain management and purchasing gave us
the opportunity to gain in efficiencies and better
understand the needs of customers.
The move went smoothly and the disruption was
minimized by good advanced planning. A corporate
regional headquarter building, Nissan Americas, is
under construction and everyone will relocate in the
summer of 2008.
This building will also help NNA manage more
effectively across the vast and complex region of the
Americas which stretches from Canada to Argentina.
The opportunities to better leverage our
infrastructure are big.
Products made in Mexico, such as Versa and
Sentra are exported within the region, primarily the
United States and also to more distant markets like
Russia. In Brazil, Nissan leverages the alliance with
Renault where we share manufacturing facilities, sales
and distribution as well as administrative functions.
NNA will continue to evolve as a regional entity
with the sole purpose of delivering better, more
competitive products for our customers with a higher
return for all our stakeholders.
Nissan Annual Report 2006-2007 25
Rogue
R E G I O N A L A C T I O N »
Nissan Annual Report 2006-200726
The European market is both mature andsaturated. Overall volume in the region was flatin fiscal 2006, with Western Europe down. Theexception was Russia, which again enjoyedexcellent TIV growth. We ended the year at539,000 units, almost in line with our retail salesperformance last year.
Nissan’s market presence in Western Europe,
however, has eroded. One major reason is that we’re
changing the model lineup, with three models—the
Almera, Almera Tino and Primera exiting most
markets. The one model we launched in 2006, the
Note, couldn’t fully compensate for the loss of those
three vehicles. However, we capitalized on strong
growth in Russia to maintain our total volume and
market share. Our final sales figure for Russia was
around 76,000 units.
Despite the sales challenges, Nissan Europe
reached a record consolidated operating profit again,
becoming the only Nissan region to meet its profit
commitment. We could have improved our sales
performance, but chose to concentrate on profitable
sales rather than chase volume.
Fiscal 2006 saw some significant restructuring,
including revamping the distribution network. In
January we gave one year’s notice to all dealers in
Germany, for example, keeping the best and
dropping those too small or financially insecure to
grow with us. We’re now attracting investors who are
able to offer professionally qualified sales staff in the
stores, a higher quality and wider range of services
for the customer and much better locations.
In the four Nordic territories—Norway, Denmark,
Sweden and Finland—we established a new regional
business unit to replace previous importers, and
restructured the dealer network. We did the same in
Central and Eastern Europe with Hungary, the Czech
Republic, Slovakia and Poland.
A high point for us in 2006 was the launch of our
Infiniti brand in Russia. We did this through three
large dealers, with two showcase showrooms in
Moscow and another in St. Petersburg. All three
meet the IREDI global standard. The launch was very
successful—we were able to deliver around 750
vehicles to customers before January. Sales have
accelerated since then, particularly of the FX. Having
a signature vehicle like the FX, which is very visible in
both cities, got us off to a quick start.
In Western Europe, we plan to launch the Infiniti
brand at the Geneva Motor Show next March—the G
series saloon and coupe, the FX, and a new small
luxury crossover, with sales starting in the last
quarter. We’ll offer a petrol-only line-up initially but
introduce diesel engines later. We plan to open a
large number of sales points in fall 2008, covering
between 15 and 20 countries.
Our two major launches this year are the Qashqai
and the new X-TRAIL. We believe the Qashqai will
be emblematic for the brand, demonstrating that
Nissan can offer something different to the
mainstream. The launch has been very successful,
with sales ahead of our expectations and a large
order bank.
Staying Profitable and Picking Up the Pace
BRIAN CAROLINSenior Vice PresidentNissan Europe
EUROPE
» R E G I O N A L A C T I O N

Nissan Annual Report 2006-2007 27
Through the Alliance with Renault, we have
secured high quality diesel engines that have
allowed us to be very competitive and follow the
growing diesel trend in Europe. That’s very
noticeable in the case of the Qashqai, which we offer
with either a 1.5 dCi diesel or the fantastic 2.0-liter
with 150 horsepower.
We’re launching the X-TRAIL in most markets
around September. The initial press is very positive.
The car is regarded as an evolution on the outside but
a revolution inside—almost 50 percent more trunk
space and a big increase in the perceived quality.
In fiscal 2007, we aim to grow both profit and
volume—something we have not done since the
formation of the Alliance.
Much of that growth is linked to the launch of the
Qashqai. Our brand is still relatively weak in Europe;
our image attributes are predominantly the traditional
rational ones of value for money and reliability, and
we haven’t achieved a significant breakthrough in the
more “emotional” attributes. We plan to capitalize on
cars with a point of difference, like the Qashqai,
using their road presence to alter people’s
perception of Nissan. The Qashqai is already picking
up awards. For instance, it recently scored the
maximum five stars in the European New Car
Assessment Programme (Euro NCAP) adult
occupant safety test.
New X-TRAIL Navara Infiniti FX launch in Russia
R E G I O N A L A C T I O N »

China is a huge, crowded market—the world’ssecond largest—and the competition is fierce.Ten makers currently have shares around 5 to10 percent, and Dongfeng Nissan was at 4.8percent and ranked ninth in 2006. The totalindustry volume exceeded seven million units,including 4.2 million passenger vehicles and 2.8million commercial vehicles. Between 2005 and2006, the TIV for passenger vehicles went up a million units.
We projected sales of 484,000 units for fiscal
2006—including passenger vehicles, LCVs, and
heavy-duty trucks—and sold 482,500. Our numbers
for larger commercial vehicles were down, but
passenger vehicle sales accelerated, reaching
200,000 units. Our LCVs—light commercial
vehicles—were also moving well, and we are now
number two in the Chinese LCV market. Our new
heavy-duty truck developed at Dongfeng Motor Co.
was named both Truck of the Year and most fuel-
efficient high-performance vehicle.
The price competition in China is intense. Of the
156 models currently being offered, just ten sold
over a hundred thousand units. Prices are down even
in the top-end D segment. This top-down pressure
influences C segment prices, which presses down on
the B segment. For example, in the case of the
Sylphy, our focus was on introducing the 2.0-liter
model first. But the drop in price of D segment
vehicles affected sales, so we’ve already introduced
the 1.6-liter Sylphy to recover volume. Those are the
kinds of situations we’re dealing with.
We introduced two new products last year, the
Sylphy and the Livina Geniss. Sales of both models
are virtually in line with our plan. We’re always busy
launching new cars, as are other makers, because
the Chinese customer’s eye is constantly being
drawn to new products. The market is growing, but
because this growth is driven by frequent launches
from various makers it’s very difficult to get major
volumes for each car.
A primary objective of our business plan for
China to date has been to increase brand
recognition. We’ve established the Nissan brand with
Chinese customers through three years of efforts.
Nissan is a relative latecomer to the market, however,
and the younger generation in particular doesn’t
know us well enough. I’m happy to say that our brand
recognition is continually improving—we were
second in the J. D. Powers Customer Satisfaction
Index in 2006, just a bit behind the leader. While we
ranked sixth in the Sales Satisfaction Index or SSI
ratings, there was only a small difference between
number two and number six. Nissan Tiida, our
number one seller, with sales of around 110,000
units, was number one in the entry midsize
segment—one of the most competitive segments—
in both the 2006 J. D. Powers Initial Quality Study
and the 2006 China Automotive Performance,
Execution and Layout (APEAL) Study. Our objective
is to be among the top three in all of these
evaluations in 2007.
To enhance Nissan’s reputation we are also
doing product promotions and some social activities
and making donations to the less fortunate. Through
these activities and good relations with local people,
I believe our image is improving at a grassroots level
as well.
This year is the last one of our first-generation
business plan, which started in 2004 and has mainly
focused on establishing our business base for
Dongfeng Nissan and Dongfeng Motor Co. Ltd. We
were establishing the production site and the new
management method, as well as our new sales
network. We are now developing a second-
generation three-year business plan for 2008 to
2010 based on that foundation. It is essential for
Nissan Annual Report 2006-200728
Great Growth and Great Challenges in China
China
KATSUMI NAKAMURAPresident & CEO, Dongfeng Motor Co., Ltd.
GENERAL OVERSEAS MARKETS
» R E G I O N A L A C T I O N

manufacturers in the Chinese market to invest in
offering new products here, and in the sales
networks and services and so on. Many
manufacturers are developing new services for
customers. If we don’t do the same, our sales
volumes and customer support will shrink.
In fiscal 2007 we have a target of 300,000 units
for Nissan-branded vehicles, which is 50 percent
more than last year. In terms of our passenger
vehicle business, since we plan to introduce more
new products, we’ll be expanding production capacity
at the Guangzhou plant from 270,000 to 360,000
vehicles by 2008. We will also be expanding our
dealer network from the current 300-plus outlets to
four hundred. Over 70 percent of our dealers were
profitable in 2006, and many earn enough on
services to pay virtually all fixed dealership fees. Our
expansion efforts are now focused on establishing
mid-sized dealers in each province.
Our first-quarter results for LCVs show we
increased sales volume by 30 percent, even though
the TIV is only growing by around 10 percent, and we
are trying to improve our sales performance by using
Dongfeng-badged LCV products. We have plans to
bring in a Nissan-branded LCV product for customers
who would like even better quality and performance.
We have no plans to export passenger vehicles
we make, because China is the only market with a
20 percent sales volume increase and more than
four million units. Our Dongfeng-badged commercial
vehicle operation, however, is exporting trucks to
emerging countries such as Pakistan, Africa and
Afghanistan, and to the Middle East. We exported
more than 10,000 units in 2006, and we’re aiming
for 12,000 units in 2007.
This April at the Shanghai Motor Show we
introduced the new Livina. This is a very strategic
vehicle for Dongfeng Nissan because it is priced
between 80,000 and 100,000 yuan, a range
affordable to first-time customers who would
ordinarily buy Chinese makes. The Livina is Nissan-
branded, has Nissan quality and almost the same
interior space as the Tiida. It should appeal to first-
time buyers, especially ones with families. We already
have 4,000 orders in hand one month after its debut,
which is 50 percent more than our expectations. We
hope to use this new vehicle to generate even
greater sales volume.
Nissan Annual Report 2006-2007 29
Tiida Sylphy Auto Shanghai 2007 (April, 2007)
R E G I O N A L A C T I O N »

Nissan Annual Report 2006-200730
Although the competition is tough in China, we
are also gaining sales and profit. We introduced the
Livina there and it’s selling very well. Sales of the
Tiida, which is a major model in GOM in terms of
volume and profit, are now up in many markets. So
far in 2007, the sales of passenger vehicles are
approximately 128,000 units, which is an increase of
30 percent compared to last year.
Since our business in GOM occurs primarily in
emerging markets, we face both huge risks and
huge opportunities. Without taking risks, though, we
cannot penetrate these markets. Fortunately, things
are generally good. Tensions between Pakistan and
India are decreasing, and China hasn’t given us any
big surprises so far.
One of our current initiatives is to further
empower our regional headquarters in GOM to
ensure that we react faster to market changes.
We are also planning to delegate more authority on
the R&D and purchasing sides so that the local
teams can refine products and strategy. We are
already preparing for future geographic expansion
in those areas.
We expect further growth in volume in countries
like China, India, Pakistan and Korea, so we will need
to reinforce their sales networks. This year we are
aiming for sales of about one million units throughout
GOM, which represents around a 14 percent
increase from fiscal 2006.
GOM performed well in fiscal 2006 in an overallsense, increasing by 8 percent, and we reachedaround 860,000 units in total sales during theyear, which is very encouraging.
However, 2006 was a difficult time due to both
external and internal factors. Some markets like
Indonesia, Thailand and Taiwan were sluggish,
primarily because of drops in total industry volume
and a lack of new models. The TIV in Taiwan, for
example, fell by 30 percent, due to both economic
and political causes. Indonesia now imports rather
than exports oil, and is suffering from the higher
prices of oil and other economic factors. TIV there has
basically dropped by 40 percent. In Thailand, many of
our main products were at the end of their model
lives, most critically the Pickup, in a country where
pickups comprise over 50 percent of the market.
There were bright spots, of course. One was the
Infiniti G35, which was named both Import Car of the
Year and Car of the Year in its segment in Korea.
The common platforms and powertrains the Alliance
uses continue to make a positive difference, giving
us the cost benefits of the Renault-Nissan global
sourcing network.
Fiscal 2007 is shaping up nicely. This past
January in Thailand we introduced a completely new
truck, the Frontier Navara. It’s doing extremely well—
we’ve gotten lots of “conquest” sales, meaning that
customers are coming to us from other makers. In
Indonesia our new global strategic model, the Grand
Livina, has received an even better reaction from
customers than we anticipated. Renault will also be
providing us with a new diesel engine. This is a key
success factor in the GOM market, because GOM
customers are sensitive about the running costs of
vehicles, and the cost of ownership for diesels is
much less than for petrol engine models.
Recovering Momentum in GOM
Asia/Oceania
YASUAKI HASHIMOTOCorporate Vice President
GENERAL OVERSEAS MARKETS
» R E G I O N A L A C T I O N
Frontier Navara

Nissan Annual Report 2006-2007 31
The story for fiscal 2006 in our part of GOM—Africa, the Middle East and Latin America—wasmuch the same as in 2005, with double-digitgrowth momentum in all regions. Our totalvolume was up 18 percent, and our averagemarket share rose to 7.7 percent. Our growthwas well balanced across Latin America, the sub-Sahara, the Caribbean, the Maghreb, and theMiddle East. Some countries enjoyed explosivegrowth, including the doubling of our sales inVenezuela and Egypt, 18 percent in South Africa,and more than 20 percent in some parts of LatinAmerica and the sub-Sahara.
Rising prices for raw materials and oil have been a
positive driver for us. For instance, our sales in Chile,
the world’s largest copper producer, are buoyant. The
increased traffic of such goods through the Suez
Canal and Panama Canal has also helped us. We’ve
doubled our volume in Egypt, and our sales in
Panama are thriving.
Last year we launched four new vehicles in Latin
America and the Caribbean, including the Tiida,
which was voted Car of the Year of the Americas.
We also introduced several new models in the Middle
East, such as the Sunny, now sourced from Korea
through our Alliance with Renault. This car is
incredibly successful—our initial sales projections
were too conservative, and we’re having a hard time
keeping our Middle East and African distributors
supplied. In the luxury market, Infiniti sales in the
Middle East totaled 4,700 units, up 28 percent.
That’s good, but in our opinion still far from the
Infiniti’s potential in the region.
We did lose an opportunity in entry-level cars,
simply because we don’t have this type of product in
our lineup yet. However, we recognize the global
opportunity of such products and we’re working very
hard to address this segment.
A Fast-Rising Performer
GILLES NORMANDCorporate Vice President
Middle East, Africa, Latin America and the Caribbean
New Showroom in Qatar opened in June 2007
On the plus side, Nissan’s brand power is
improving, demonstrated by the narrowing of the
price gap against our competitive benchmarks. In
certain markets and segments, we’re even exceeding
them. We also received four gold awards in South
Africa for sales and service quality—one in every
customer satisfaction category.
The company is clearly investing more to secure
growth. Last year we announced a 150 million dollars
investment to introduce a full new product lineup in
Brazil and Argentina. We’re using Brazil as a laboratory
to develop bio-ethanol and flexfuel technology, which
is crucial because we know that mature markets like
the United States and Europe are seriously
considering ethanol and flexfuel as alternatives.
Fiscal 2007 will be another year of progress for
us. We will launch a record eight new cars in the
Middle East, including the Altima sedan and coupe,
the Xterra, the Qashqai, the new Armada, and the
new Navara. We are introducing six new models in
the Maghreb region—another record.
We have also launched a new family of cars
called the Livina. The Livina is a global car, but we’re
introducing it in GOM first. It’s already being sold in
China and Indonesia, with launches in several GOM
countries to follow. As for the Infiniti brand, we will
introduce the G37 coupe, the EX, and other models
in the lineup. Our target this year is 6,000 units.
So, our GOM “revolution” continues. We feel good
about the products, our local operations and
business partners and, most importantly, our ability to
deliver what customers expect from Nissan.
R E G I O N A L A C T I O N »

Nissan Annual Report 2006-200732
NISSAN RUNS FAST AND SURE ON THE HIGH ROAD OF TECHNOLOGY, USING A
NEW R&D CENTER TO FOCUS OUR CREATIVE ENERGIES. WE ARE ALSO INVESTING
BILLIONS IN PRODUCTION CAPACITY ABROAD, INCLUDING NEW PLANTS IN INDIA
AND RUSSIA. DETERMINED TO BE A GLOBAL FORCE WITH A LOCAL PRESENCE,
WE REGULARLY SOURCE PARTS AND SERVICES WHERE WE DO BUSINESS.
INVESTMENT FOR THE FUTURE
Investment
» I N V E S T M E N T F O R T H E F U T U R E

Nissan Annual Report 2006-2007 33
for the Future
I N V E S T M E N T F O R T H E F U T U R E »

Nissan Annual Report 2006-200734
Inspired Technology for the Environment, Safety and Driving Pleasure
Nissan’s R&D operations focus on providing ourcustomers with consummate assurance ofdriving pleasure. That concept covers fourtechnological facets: environment, safety,dynamic performance, and what we refer to as“life on board.” We have set clear targets for eachof these elements, and they are expressed in ourshort-term, mid-term, and long-term R&D plans.
For the environment
Last December we announced our mid-term
environmental action plan, known as Nissan Green
Program 2010. As outlined in this plan, we view the
following three issues as paramount: reducing carbon
dioxide (CO2) emissions; minimizing emissions to
preserve the atmosphere, water and soil; and the
recycling of resources (reduce/reuse/recycle).
Among the many environmental challenges we
face, the issue of reducing CO2 emissions is one of
our highest priorities. Nissan considers the gasoline
engine the primary power plant for cars in the short-
to mid-term, and we are developing technologies to
enable gasoline-powered cars to significantly
improve their fuel consumption. In practical terms,
this will have a major impact because of the sheer
number of gas-driven vehicles on the road. We are
also working on “clean diesels,” as well as cars that
run on bio-ethanol fuels made from plants and other
renewable resources. Concurrently, we are boosting
our efforts to develop cars that will operate on
electric power, such as hybrid and plug-in hybrid
cars, fuel-cell vehicles and electric vehicles.
During fiscal 2007, we will introduce an engine
to world markets that incorporates our VVEL or
Variable Valve Event & Lift system. VVEL optimizes
valve timing and lift, which results in more efficient
airflow through the cylinder. Besides significantly
improving responsiveness, this fine-tunes the
balance between power and environmental
performance, reducing CO2 emissions by
approximately 10 percent. We are developing a
gasoline engine that emits the same level of CO2
that diesel engines do, representing an overall
reduction in CO2 of approximately 20 percent. That
engine will debut worldwide in fiscal 2010. The same
year we will also introduce a “three-liter car” in Japan
that can run approximately 100 kilometers on three
liters of gasoline, exceeding 30 kilometers per liter,
or more than 75 miles per gallon. This also slashes
CO2 emissions by about 30 percent, roughly
equivalent to what a hybrid car achieves.
MITSUHIKO YAMASHITAExecutive Vice President
TECHNOLOGY
» I N V E S T M E N T F O R T H E F U T U R E
500
400
300
200
6
5
4
3FY ’99 ’00 ’01 ’02 ’03 ’04 ’05 ’06 ’07(Forecast)
4.0%3.8%
4.2%4.4%
4.8%
4.6% 4.7%4.4%
4.8%
239 232262
300
354
398
448465 490
R&D (left scale) % of net revenue (right scale)
R&D Expenditure
(Billion Yen) (% of net revenue) 1. Harvest Plan
2. Seeding & Growth
3. Soil Enrichment
The Orchard Concept

Technology Development Concept
Safety Life onBoard
Dynamic Performance
Environment
Vision 2015
Internal combustion engine (ICE) vehicle*
Innovations in engines and transmissions
Expansion of electrically powered vehicles
Hybrid electric vehicle (HEV)
Electric vehicle (EV)Fuel cell vehicle (FCV)
Plug-in hybrid electric vehicle (Plug-in HEV)
*Including gasoline, diesel and biofuel vehicles
Electric vehicle (EV)
Plug-in HEVHybrid electric vehicle (HEV)
Fuel cell vehicle (FCV)
CO2
emissionlevel
2010 2050
Estimated breakdown of vehicles in 2050 by powertrain type
Nissan Annual Report 2006-2007 35
The diesel engines Nissan will offer will meet the
strict emissions standards being established
internationally at an early stage. In the first half of
fiscal 2007, for example, we launched the Qashqai
with the new Euro 4-compliant two-liter diesel
engine for Europe. Starting in fiscal 2010, we will
introduce clean diesel cars that satisfy the Post New
Long-Term Emissions Regulations in Japan, Tier2
BIN5 in North America, Euro5 in Europe, and their
equivalents. In North America, we will be launching a
Nissan Maxima in 2010 powered by a clean-diesel
engine co-developed by Nissan and Renault.
In the area of bio-ethanol, all our gasoline-driven
vehicles sold globally are E10 compatible, meaning
they can run on gasoline that includes 10 percent
bio-ethanol fuel. In North America, we’ve had the
Titan pickup, which is E85 compatible, in our lineup
since 2005. We added the E85-compatible Armada
flex-fuel vehicle in 2007. In three years we will also
have an E100 flex-fuel vehicle ready for Brazil.
A car’s transmission provides another way to cut
emissions. Our CVTs, or continuously variable
transmissions, can also improve fuel efficiency.
Nissan has been the leader in this technology for
some time, in fact, with CVT offerings for small- to
large-displacement engines. We have already
launched six gasoline engine models in Japan
equipped with CVTs. All six have achieved the top
rank for fuel economy performance. In fact, they
already surpass the 2010 standards by 20 percent,
and meet the highest standard for emissions, which
is known as SU-LEV. Within the next fiscal year, we
expect to sell more than a million vehicles equipped
with CVTs globally.
For the coming era of electrically powered
vehicles and electric motivation, we will introduce
hybrid vehicles first, later accelerating our launches
of fuel-cell vehicles and electric vehicles—FCVs and
EVs, respectively. Furthermore, we have widely
acknowledged strength in lithium-ion battery
technology, one of the core technologies for electric-
powered vehicles. We have been working in this area
since 1992 and will further accelerate development.
We are developing a hybrid car using our own
proprietary hybrid system that will debut during fiscal
2010 in North America and Japan. We are
promoting the development of a plug-in hybrid
system as an effective technology for reducing
CO2 emissions.
As for FCVs, we have made several strides
forward so far, such as development of our own
stack and 70Mpa hydrogen tank. We’ve used these
Vision 2015 Nissan’s roadmap for reducing the CO2 from our vehicles
I N V E S T M E N T F O R T H E F U T U R E »

Nissan Annual Report 2006-200736
to power the 2005 model X-TRAIL FCV, which has a
range and acceleration comparable to those of its
gasoline sibling. We will have a high-performance in-
house stack for wider production application by the
early part of the 2010s, starting with the U.S.—where
a fueling infrastructure for hydrogen is currently
being built—and then in Japan.
We think that EV use can be expanded from the
first half of 2010, but we need to extend the range
and establish a network of charging stations in
collaboration with other industries. We will continue
real-world testing in Japan until 2010. Our plan is to
introduce a production version to the market in the
early part of the decade, beginning in Japan.
The three core technologies for any electrically
powered vehicle are the motor, battery and inverter.
To achieve the objective of the Nissan Green
Program 2010 plan, we will continue to improve their
performance and reduce costs to a practical level.
Nissan has long been the leader in lithium-ion
batteries for automobiles, and we’ve now established
a joint-venture company with NEC to develop,
manufacture and market these batteries. This joint
venture will be producing an all-new lithium-ion
battery that will set industry standards for superior
performance and low cost. The batteries the new
company produces will be used on the hybrids, EVs
and FCVs. Some competitors have stopped lithium-
ion battery development, primarily because of safety
issues. Our lithium-ion battery is different from those
our competitors have devised and has much better
safety characteristics.
For safety
Safety, of course, is another critical area, and our
safe driving environment goal is to reduce the
number of accidents to achieve the ultimate
objective expressed in our Vision Zero plan. That
goal is to cut the number of Nissan-related
automobile accidents that resulted in fatalities and
serious injuries in 1995 in half by 2015. And it’s
working. Fatalities and serious injuries among the
10,000 Nissan-related automobile accidents in 2004
declined by 27 percent, and in 2005 by 34 percent.
We have been promoting R&D based on our
original concept, called the “Safety Shield,” since
2004. The Safety Shield refers to active safety
measures that use the vehicle itself to help avoid
accidents. To clarify things, we’ve divided the
accident “environment” into six categories:
unforeseen risk, apparent risk, possible crash,
unavoidable crash, actual crash, and post-crash.
Safety Shield
The vehicle activates various technologies to help the driver, passengers and other road users avoid danger fromnormal driving conditions through post-accident conditions.
Helps the driver maintain comfortable driving
Helps the driver return to a safedriving mode in dangerous conditions
Helps reduce injuries and damagewhen a collision is unavoidable
» I N V E S T M E N T F O R T H E F U T U R E
TECHNOLOGY

Nissan Annual Report 2006-2007 37
Based on the risk factors for each category, our cars
activate the optimal barrier and support functions to
avoid the risk at hand. The fruits of our development
in this area include “world’s first” technologies such
as the Distance Control Assist System, Lane-
Departure Prevention, and Around View Monitor, all
of which we’ll be introducing during fiscal 2007.
Nissan is actively engaged in a wide range of
initiatives to realize a safe driving environment, and
we intend to widen our use of technology to address
the hazards of driving while drunk. The severity of
accidents caused by drunk driving has been
increasing year after year, and naturally that attracts
a great deal of public attention. Nissan is committed
to preventing drunk driving both through technology
and by educating drivers to the dangers of drinking
and driving.
For example, we are carrying out trials of alcohol
interlock equipment in collaboration with the local
government. This system prevents the engine from
starting when a sensor that analyzes the breath
indicates that the driver is drunk. The updated
CARWINGS navigation systems will also display a
drunk-driving alert when the ignition is turned on to
remind the driver of the hazards of driving while
intoxicated by saying “Do not drive after drinking!”
Dynamic performance and life on board
The third of our four key areas is dynamic
performance. We want every Nissan customer to
sense this phenomenon within thirty meters of
putting the car in gear. We expect our customers to
sense that dynamic performance, particularly in the
following four scenarios: high quality when pulling
away, a feeling of security while driving at higher
speeds, an overall sensation of car and driver as one,
and a feeling of exhilaration during acceleration. To
achieve this state, we are continuously refining our
powertrain and suspension technologies.
The last facet, “life on board,” is a concept that
relates to the total car experience. We are working
constantly to perfect a luxurious interior with a
cockpit that makes both inhabiting and driving a car
comfortable, effortless and intuitive.
The Alliance advantage
Our Alliance with Renault continues to work for us in
many ways at the R&D stage. More and more of
Nissan and Renault’s total production is now covered
by common platforms, a trend that will continue. By
using the same powertrains, engines and
transmissions, we also avoid duplicating product
development and parts manufacture.
Seamless driving pleasure is what R&D can
provide to Nissan customers. We remain committed
to creating more value for our customers through
developments in the four technological areas
mentioned, and we believe this will in turn create
greater value for our shareholders.
I N V E S T M E N T F O R T H E F U T U R E »
SU-LEV clean diesel Passenger seat alcohol odor sensor in the antidrink—driving concept car

Nissan Annual Report 2006-200738
Strategic and Competitive Market
CARLOS TAVARESExecutive Vice President
» I N V E S T M E N T F O R T H E F U T U R E
INDIA
The Indian market is as strategic for Nissan asChina was five or six years ago, and all ourdecisions are based on that view. It’s a crucialmarket for the future and we are investing there for the long term. Driven by strong GDPgrowth in India, we expect the total industryvolume to double to over two million unitsannually by 2011.
While India isn’t the most competitive market in
terms of number of players, it is perhaps the world’s
most price-competitive one. It’s a very protected
market, and highly strategic because of this huge
country’s potential. Due to the high import taxes,
you cannot import finished vehicles unless they are
near-luxury cars. We are now importing the X-TRAIL
and the Teana. However, to achieve long-term
growth and sustainability in a market like India, you
clearly cannot sell high volumes unless you
manufacture locally.
In the car world, the B and C segments still have
the biggest growth potential. We will be facing
Korean and other Japanese competitors at first, but
also going up against strong local manufacturers that
have been in business for decades. The market
leader holds a 50 percent share and imposes pricing
pressure on the other players.
For near-luxury cars the market is much more
open, but the volumes are small—between 1,000
and 10,000 cars annually, even with four or five cars
in your portfolio. You can begin building your brand
strategy and image with near-luxury models, but that
won’t build a complete and profitable business. At
some point you need to push the higher-volume cars
by making them locally.
For that reason, we’ve signed a memorandum of
understanding (MOU)—with Mahindra & Mahindra
and Renault to create a manufacturing joint venture
in Chennai. The three partners signed another MOU
with the Tamil Nadu government that secures an
incentive package for the JV. Constructing such a
deal ordinarily takes six to twelve months, but we did
it in less than three. That was only possible because
of the Renault-Nissan Alliance and the already
strong dynamics between Renault and Mahindra.
We will be making two kinds of investments in
Chennai, including some purely related to the JV and
others in assets that Nissan will own. The JV’s scope
will probably be limited to manufacturing, the land,
the power plant, and perhaps the stamping
workshop. All three partners are investing in the
welding lines, painting booth, trim and chassis lines,
however, and to date we’ve jointly committed more
than 900 million dollars.
The growth in exports will be much steeper than
for domestic sales, so initially we’re planning to use
Chennai for exports. Our strategy is to pursue a two-
step manufacturing approach, starting with one
dedicated line at a plant capacity of 30 jobs per hour,
which translates into 180,000 units per year. If
everything goes well, we will go up to 45 or even 60
jobs per hour within three or four years. Although our
plans for using India as an export base aren’t
finalized, potential targets are mature markets such
as Europe, the U.S. and Japan.
Nissan will be entering a new price band through
India. If we are frugal in the way we engineer,
manufacture, and distribute our cars, we can
compete effectively with Chinese manufacturers.
That means leveraging the multiplier effect by
combining excellent design-to-cost engineering with
a well-designed supplier footprint, the most
economical marketing and sales activity—in terms of
fixed market expenses and direct incentives—and
great logistics. In the entry-car world, only the people
who excel in all those areas can survive.
Using the local supplier base is cost-competitive,
and for vehicles sold locally, you’re decreasing the

Nissan Annual Report 2006-2007 39
currency risk between your revenue footprint and
your expense footprint. That’s why it’s so important to
work with local people, and avoid shadow
localization—just assembling parts from abroad.
Our dealership strategy is to build a dedicated
Nissan network without buying the assets, so we’re
going to be making deals with specific partners that will
own those dealerships. To meet our projected growth
in India during the next decade, we will need to grow
our dealer network significantly. We want to hedge
the business risk in India by having one partner for
manufacturing and a different one for distribution,
because understanding local business practices and
labor regulations, as well as managing union
relationships and media relationships, are specific skills.
Using India as an LCC or leading competitive
country is a huge challenge. First you need to have a
localization rate of 90 percent or higher. That’s
possible if the powertrain is localized—at least the
assembly and some core parts. Second, procure
parts from the local supplier base. Third, don’t just
throw the specs on the table and ask your suppliers
to build. That means leveraging the skills of our
engineers, who will continue to shift their mindset.
To compete successfully in India, we need to
redesign our vehicle parts to adjust for local factory
tools, the local way of doing things, and even
different materials.
We will be making cars at Chennai for the
segment in which the price pressure is highest—
compacts. We plan to bring a family of small cars
based on one specific small platform and
progressively expand it for both domestic sales and
exports. There is risk, but if you don’t go to India
there’s a certainty that you’ll be out of the low-end
market—the price band below ten or eleven
thousand dollars worldwide—which is enormous.
Look at Russia. The market is moving so fast
there. When we made the decision to build the
St. Petersburg plant, we were just on the limits of
being too late. The foreign makers are doing well
there by importing finished vehicles, and this could
last for one or two more years. However, if you’re not
localized in Russia by 2009, you’ll be out for
everything between ten and twenty thousand dollars.
India is a similar game.
I N V E S T M E N T F O R T H E F U T U R E »
The signing of MOU with Mahindra & Mahindra, Renault and Nissan Geographic expansion – India
Mumbai
Chennai
Nissan Motor India HQ
Delhi
The new production site in 2009

» F I N A N C I A L S E C T I O N
Nissan Annual Report 2006-200740
FINANCIAL SECTION
Financial Section

F I N A N C I A L S E C T I O N »
Nissan Annual Report 2006-2007 41
Contents
Consolidated Five-Year Summary 42
Business and Other Risks 43
Corporate Governance 45
Consolidated Balance Sheets 48
Consolidated Statements of Income 50
Consolidated Statement of Changes in Net Assets 51
Consolidated Statements of Shareholders’ Equity 53
Consolidated Statements of Cash Flows 54
Notes to Consolidated Financial Statements 55
Report of Independent Auditors 84
Non-consolidated Five-Year Summary 85
Corporate Data
Information on Subsidiaries and Affiliates 86
Corporate Officers 89
Information 90

» F I N A N C I A L S E C T I O N
CONSOLIDATED FIVE-YEAR SUMMARY
Nissan Motor Co., Ltd. and Consolidated SubsidiariesFiscal Years 2006, 2005, 2004, 2003 and 2002
Nissan Annual Report 2006-200742
Millions ofU.S. dollars (Note 1)
Millions of yen (except per(except per share amounts and number of employees) share amounts)
2006 2005 2004 2003 2002 2006For the years ended Mar. 31, 2007 Mar. 31, 2006 Mar. 31, 2005 Mar. 31, 2004 Mar. 31, 2003 Mar. 31, 2007
Net sales ¥10,468,583 ¥ 9,428,292 ¥8,576,277 ¥7,429,219 ¥6,828,588 $ 88,717
Operating income 776,939 871,841 861,160 824,855 737,230 6,584
Net income 460,796 518,050 512,281 503,667 495,165 3,905
Net income per share (Note 2) 112.33 126.94 125.16 122.02 117.75 0.95
Cash dividends paid (Note 3) 131,064 105,661 94,236 74,594 50,800 1,111
Net assets (Note 4) ¥ 3,876,994 — — — — $ 32,856
Shareholders’ equity (Note 4) — ¥ 3,087,983 ¥2,465,750 ¥2,023,994 ¥1,808,304 —
Total assets 12,402,208 11,481,426 9,848,523 7,859,856 7,349,183 105,103
Long-term debt 1,956,661 2,225,603 1,963,173 1,694,793 1,603,246 16,582
Depreciation and amortization 771,223 655,402 525,926 461,037 371,125 6,536
Number of employees 186,336 183,356 183,607 123,748 127,625
Notes: 1. Unless indicated otherwise, all dollar figures herein refer to U.S. currency. Yen amounts have been translated into U.S. dollars for convenienceonly, at ¥118 = $1, the approximate exchange rate on March 31, 2007.
2. Net income per share amounts are based on the weighted average number of shares of common stock outstanding during each year.Figures for net income per share are in exact yen and U.S. dollars.Number of shares outstanding as of March 31, 2007: 4,520,715,112.
3. Cash dividends during the full year by subsidiary companies to non-Nissan minority shareholders are not included.4. Effective April 1, 2006, the Company adopted a new accounting standard for presentation of net assets in the balance sheet and related
implementation guidance. Under the new accounting standard, net assets represent aggregate of previous shareholders’ equity, sharesubscription rights and minority interests.
Sales and Production (units) 2006 2005 2004 2003 2002For the years ended Mar. 31, 2007 Mar. 31, 2006 Mar. 31, 2005 Mar. 31, 2004 Mar. 31, 2003
Global vehicle production 3,428,981 3,340,827 3,293,339 2,883,409 2,586,602
Japan 1,191,937 1,364,868 1,481,563 1,475,063 1,444,314
United States 716,211 808,586 803,556 619,665 392,458
Mexico (Note 2) 534,841 362,591 325,086 308,322 340,658
Spain (Note 2) 266,295 193,604 142,889 116,589 84,919
United Kingdom 384,669 315,297 319,652 331,924 297,719
Others 335,028 295,881 220,593 31,846 26,534
Global unit sales (wholesale) 3,699,747 3,537,614 3,470,422 2,946,782 2,635,686
Japan 716,405 810,968 819,152 799,206 792,767
North America (Notes 1 and 2) 1,444,039 1,369,630 1,394,099 1,204,882 1,040,684
Europe (Note 2) 741,701 597,250 554,901 548,693 458,222
Others 797,602 759,766 702,270 394,001 344,013
Notes; 1. Unit sales in Mexico are included in “North America”.2. In the annual reports for the fiscal year 2006, Sales and Production for Europe and Mexico are on January 2006 to March 2007.
(In the annual reports for the fiscal years 2005, 2004 and 2003, Sales and Production for Europe and Mexico was on January to December basis.)(In the annual report for the fiscal year 2002, production for Europe and Mexico was on April to March basis.)

With regard to disclosure in the Business Overview, FinancialInformation and other parts of this Securities Report, thesalient items which may affect the decisions of our investorscan be grouped under the following risk factors.
Any future forecasts included in the following descriptionsare based on the estimates or judgment of Nissan as of June25, 2007.
(1) Economic FactorsThe demand for products manufactured by the Group is affected bythe economic conditions in each country or market in which they areoffered for sale. The Group conducts its operations all over the worldand, in particular, in the major markets of North America, Europe andthe Global Overseas Market, to say nothing of Japan. While theGroup strives to develop a comprehensive and integrated projectionof the global economic outlook, any greater-than-anticipateddownturn in one of these markets may have a significant effect onthe Group’s financial position and results of operations.
(2) Risks Involved in International Activities and Overseas Expansion
The Group’s manufacturing and marketing activities outside Japanare conducted in the United States, Europe, and general overseasregions. The Group forecasts and evaluates a wide variety of risksinherent in doing business in such overseas markets including thefollowing factors, each of which may entail a greater-than-anticipatedlevel of risk, thereby causing significant effects on the Group’sfinancial position and results of operations:
• Unfavorable political or economic factors• Legal or regulatory changes• Potentially adverse tax consequences• Labor disputes including strikes• Difficulties in recruiting and retaining personnel• Social turmoil due to terrorism, war, or other destabilizing factors.
(3) Research and DevelopmentThe Group’s technology must be useful, pragmatic and easy to use.The Group anticipates the nature and scope of the market demand,and then prioritizes and invests in new technologies. Nonetheless,any sudden and greater-than-anticipated changes in its businessenvironment or in customer preferences may impact negatively oncustomer satisfaction with these new technologies.
(4) Product DefectsThe Group places a high priority on safety and does its best toenhance safety from the standpoint of research and development,manufacturing and sales. Although the Group takes out insurancepolicies to cover product liability, this does not necessarily mean thatall potential defects and the related liabilities are fully covered. If theGroup were to implement significant recalls in volume and amount forthe benefit of customers’ safety, the Group would incur significantadditional expenses which could adversely affect its financial positionand results of operations.
(5) Fluctuation in Foreign Currency Exchange RatesThe Group’s Japanese operations export vehicles to various countriesaround the world. In general, the appreciation of the yen against othercurrencies adversely affects the Group’s financial results ofoperations and, on the contrary, the depreciation of the yen againstother currencies favorably affects the Group’s financial results of
operations. Any sharp appreciation of the currencies of countrieswhere the Group manufactures vehicles against the yen could lead toincreases in both procurement and production costs which wouldadversely affect the Group’s competitiveness.
(6) DerivativesThe Group utilizes derivative transactions for the purpose of hedgingits exposure to risks such as fluctuations in the foreign exchangerates of its receivables and payables denominated in foreigncurrencies, the interest rates of interest-bearing debt and fluctuationsin commodity prices. While the Group can hedge against these risksby using derivatives transactions, the Group, by so doing, may missthe potential gains which could result from seizing the marketopportunities to profit from such fluctuation in exchange rates andinterest rates. In addition, the Group manages its exposure to creditrisk by limiting its counterparties to financial institutions with highcredit ratings. However, a default by any one of these counterpartiescould have an adverse effect on the Group’s financial position andoperating results.
(7) Lawsuits and ClaimsWith respect to various lawsuits and claims which the Groupencounters, the possibility exists that the position defended by theGroup will not be accepted and that the outcome may be significantlydifferent from that anticipated. As a result, any such verdict orsettlement could adversely affect the Group’s financial position andoperating results.
(8) Government RegulationsThe automobile industry worldwide is influenced by a broad spectrumof regulations governing the emission levels of exhaust fumes, fueleconomy guidelines, noise level limitations and safety standards, andthe Group expects these regulations to become increasinglystringent. In order to ensure compliance, it may be necessary for theGroup to make significant ongoing investments in these areas whichwould have an impact on its financial position and results ofoperations.
(9) Intellectual Property RightsThe Group owns a wide variety of proprietary technologies and hasthe expertise to differentiate the Group’s products making themunique from those of its competitors. These assets have proven theirvalue in the growth of the Group’s business and will, no doubt,continue to be of value in the future. The Group strives to protect itsintellectual property assets; however, in certain markets, the Groupmay encounter difficulty in fully protecting the proprietary rights to itsown technologies.
Although the Company has established Intellectual Property RightsManagement Department since April 2004 for protecting intellectualproperty rights in specific areas, strengthening activities to protectNissan’s intellectual property rights, and abstracting new intellectualproperty rights and has been performing various activities to protectand create Nissan Brand, cases may arise where the Group findsitself unable to prohibit others from infringing on its intellectualproperty rights.
(10) Natural DisastersThe Group’s corporate headquarters and many of its manufacturingfacilities are located in Japan, where the statistically provenprobability of earthquakes is higher than in many other countries. The
BUSINESS AND OTHER RISKS
Nissan Annual Report 2006-2007 43
F I N A N C I A L S E C T I O N »

Group has developed risk management guidelines relating toearthquake damage and the CEO has organized a global task forceto direct disaster prevention and recovery activities. In addition, theGroup has been strengthening its manufacturing facilities with anti-seismic reinforcement. However, if a severe earthquake were to hitone of the Group’s key facilities causing a halt in production, thiswould adversely affect the Group’s financial position and results ofoperations.
(11) Sales Financing Business RiskSales financing is an integral part of the Group’s core business,providing strong support to its automotive sales, while maintaininghigh profitability and a sound and stable financial condition throughstrict risk management policies. However, the sales financingcompanies have a high exposure to interest-rate risk, residual valuerisk, and credit risk, any one of which may adversely affect theGroup’s financial position and results of operations.
(12) Counterparty Credit RiskThe Group does business with a variety of counterparties andmanages its counterparty credit risk by conducting a comprehensiveannual assessment of its customers’ financial condition based ontheir financial information. Nonetheless, any significant default by acounterparty would adversely affect the Group’s financial position andresults of operations.
(13) Employee Retirement Benefit Expenses and ObligationsThe amounts of retirement benefit obligation and related expenses ofthe Group are calculated using various actuarial assumptionsincluding the discount rate applied, the projected rate of return onplan assets, and so forth. If the Group’s actual results differ fromthose assumptions or if the assumptions are changed, the resultingeffects will be accumulated and recognized systematically over futureperiods. The cumulative effect could adversely impact the recognitionof expenses and liabilities recorded in future periods.
(14) Purchase of Raw Materials and PartsThe Group purchases raw materials and parts from many suppliers.Market conditions that the Group can’t control and whether or not thesuppliers can procure raw materials and parts continuously mayadversely affect the Group’s financial position and results ofoperations.
Nissan Annual Report 2006-200744
» F I N A N C I A L S E C T I O N

Basic corporate governance policyCorporate governance is an important responsibility of the Company’smanagement, and its most important role is to clarify the duties andresponsibilities of the members of the management team. At theCompany, clear management objectives and policies are publishedfor the benefit of the shareholders and investors, and achievementsand results are announced early and with as much transparency aspossible. The enhancement of corporate governance by full and fairdisclosure is the responsibility of management.
1. The Company’s organization and the status of its internalcontrol systems
(1) The Company’s organizationThe Company’s Board of Directors makes decisions on importantbusiness operations and supervises the execution of duties by therespective Directors. According to a resolution at the 108th annu-al meeting of shareholders held on June 20, 2007, the number ofDirectors has been increased from 9 to 10, of which one is anexternal Director. The structure of Board of Directors is simplifiedin the pursuit of more efficient and flexible management, and theauthority for business execution is clearly delegated whereverpossible to corporate officers and employees. Furthermore, theExecutive Committee deliberates important corporate matters.
The Company adopts a Corporate Auditor system. The Board ofCorporate Auditors consists of four Corporate Auditors, includingthree external Corporate Auditors. Three of the four CorporateAuditors are standing auditors. The Corporate Auditors conductaudits of the Directors’ business execution in accordance with theauditing standards and policies determined by the Board ofCorporate Auditors. In addition, the Company has set up theCorporate Auditors’ Office, the staff of which assists theCorporate Auditors in conducting their duties.
(2) Status of the Company’s internal control systemsThe Company focuses on highly transparent management inter-nally and externally, and aims to conduct consistent and efficientmanagement to firmly achieve its specific commitments. Underthis basic policy, the Company’s Board of Directors has deter-mined “systems to ensure proper and appropriate corporate oper-ations” in accordance with the Company law and the Companylaw Enforcement Regulations, and appointed a Director in chargeof general internal control. The summary and status of such sys-tems are as follows.i) Systems to ensure efficient execution of duties by the Directors
a. The Company has the Board of Directors, which makes deci-sions on important business operations and supervises theexecution of duties by the respective Directors. The Board of Corporate Auditors conducts audits of the Directors’ business execution.
b. The size of the Board of Directors is minimized to ensureefficient and flexible management, and the authority for busi-ness execution is clearly delegated wherever possible to corporate officers and employees.
c. The Company has the Executive Committee for deliberationson important corporate matters.
d. The Company has the Management Committee for delibera-tions on matters specific to a certain region or business field.
e. The Company has the Cross Functional Team (CFT) toencourage cross-functional activities. The CFT identifiestasks and challenges for the Company to address andshares them with each functional line.
f. The Company adheres to clear and transparent standards forthe delegation of authority to expedite internal decision mak-ing and clarify the process of decision making.
ii) Systems to ensure that the execution of duties by the Directorsand employees is compliant with applicable laws and regula-tions, as well as the Company’s Articles of Corporation.a. We take measures to familiarize all employees of domestic
and foreign Group companies with the Nissan Global Codeof Conduct.
b. We offer an extensive range of educational opportunities,including e-learning programs to ensure compliance with theCode of Conduct.
c. The Company’s Directors and Corporate Officers are ex-pected to follow the Compliance Guide for Directors andCorporate Officers.
d. The Global Compliance Committee was established toreview the status of compliance with the Code of Conductand the Compliance Guide so that they are fully obeyed.
e. The Easy Voice System is in operation to allow employees tofreely communicate their opinions, questions and requestsdirectly to a dedicated department.
f. Internal regulations, such as the Regulations for thePrevention of Global Insider Transactions and theRegulations for the Management of Private Information, havebeen established or enhanced, and educational programs areoffered to raise awareness of and familiarize staff with theseregulations.
g. We make ongoing efforts to reinforce internal control sys-tems to maximize the accuracy and reliability of financialreports.
h. For effective and efficient oversight of the Company’s overallactivities, internal audit teams are organized to oversee thebusiness activities at the Company and its group companiesand inspect compliance with laws and regulations, theArticles of Incorporation and corporate ethics on a regularbasis.
iii)Regulations and systems for managing risks of lossa. We make efforts to detect risks as early as possible and
craft and carry out appropriate measures to address suchrisks, and we seek to minimize their incidence and the dam-age caused when they do arise.
b. We make efforts to identify risks arising from the Company’sand its group companies’ activities from a variety of perspec-tives, and prioritize them on the basis of their frequency,damage and control level.
c. Members of the Executive Committee directly monitor risksthat must be controlled at the corporate or cross-functionallevel by taking concrete measures, such as formulating riskmanagement manuals, under their leadership.
d. Individual risks that are not at the corporate level are man-aged with the responsibility of the relevant sections by takingnecessary measures on a daily basis to minimize the occur-rence of such risks.
CORPORATE GOVERNANCE
Nissan Annual Report 2006-2007 45
F I N A N C I A L S E C T I O N »
iv)Systems for storing and managing information associated withthe performance of duties by the Directorsa. In accordance with the applicable laws and rules of the
Board of Directors, the minutes of the meetings of the Boardof Directors that are related to the performance of duties bythe Directors are stored and maintained in an appropriatemanner.
b. When the standards for delegation of authority apply forapprovals that are required in the course of business execu-tion at the Company’s departments, such approvals are madeelectronically or in writing, and such records are stored andmaintained in an appropriate manner.
c. Information as mentioned above is under the strict confiden-tiality control of the relevant sections, and is available forinspection whenever so requested by the Directors and theCorporate Auditors out of necessity for business execution.
d. We make efforts to enhance the regulations for informationsecurity and storage and maintenance of written documentsto ensure the appropriate management of information andprevent leakage and inappropriate use of information.
v) Systems for ensuring the integrity of business activities at theCompany and group companiesa. For effective, efficient and unified management of the Group,
the Management Committees are organized on a cross-com-pany basis.
b. Through the Management Committees, the Company deliv-ers information to its group companies in Japan and over-seas, and shares its management policies with them to helpexpedite their decision-making processes.
c. The Company’s group companies maintain clear and trans-parent standards for the delegation of authority.
d. Under the Nissan Global Code of Conduct, the group com-panies formulate their own codes of conduct, and establishCompliance Committees to ensure legal compliance andenhance corporate ethics. The Global ComplianceCommittee carries out regular checks of the compliance situ-ation at the group companies in Japan and overseas, workingto strengthen the Company’s legal and ethical functions. Thegroup companies adopt the Easy Voice System to facilitateinternal reporting on violations. This system allows employeesto freely communicate their opinions, questions and requestsdirectly to their companies or the Company.
e. The Company’s Internal Audit Office oversees the businessactivities at the group companies and monitors their situa-tions of compliance with laws and regulation, and the statusof risk management. Major group companies have their owninternal audit teams, which carry out individual audit func-tions, under the control of the Internal Audit Office.
f. The Company’s Corporate Auditors regularly exchange infor-mation and opinions with the auditors of the group compa-nies to ensure effective oversight of all of Nissan’s activitiesgroupwide.
vi) Matters concerning employees and their independency fromthe Directors when the Corporate Auditors ask employees toassist them in carrying out their duties.a. The Corporate Auditors’ Office is organized as a unit to
assist the operations of the Corporate Auditors. The Office isstaffed with employees in administrative positions, who per-form their duties under the direction of the CorporateAuditors.
b. Appraisal of the employees placed in the Auditors’ Office ismade through discussions among the Corporate Auditors.The transfer of and disciplinary action against such employ-ees require the prior consent of the Board of CorporateAuditors.
vii) Systems for the Directors and employees to report to theCorporate Auditors and other systems related to reporting tothe Corporate Auditors
a. The Corporate Auditors carry out audits according to theannual auditing plan that they design. The plan specifies thereporting of business activities by various units of theCompany, according to which the Directors and the employ-ees provide such reports.
b. The Directors, whenever they discover facts that cause ormight cause significant damage to the Company, report thatdirectly to the Corporate Auditors.
c. The Directors and the employees, whenever asked by theCorporate Auditors to report on the status of business activi-ties, respond expeditiously.
d. The Internal Audit Office delivers periodic reports on its auditplans and results to the Corporate Auditors.
viii) Other systems for ensuring the effective performance ofaudits by the Corporate Auditors
a. To strengthen independency, more than half of theCompany’s Corporate Auditors are external auditors. TheCorporate Auditors hold regular meetings to exchange andshare information and opinions among themselves. They alsomeet for discussions whenever so required.
b. The Representative Directors, including the President, andthe Corporate Auditors hold regular meetings to exchangeopinions on an extensive range of issues.
(3) Status of internal and corporate auditsIn Japan, the Domestic Internal Audit Office, which is independentfrom other sections and comprises 11 staff, conducts internalaudits of the Company’s and its domestic consolidated sub-sidiaries’ operations, under the President’s direct control. Withrespect to foreign subsidiaries, an effective, efficient and globalinternal audit is conducted by the internal audit teams establishedin the management companies in each region, all of which arecontrolled by the Chief Internal Audit Officer (CIAO).
The Corporate Auditors oversee the business execution of theDirectors by attending the Board of Directors’ meetings and othersignificant meetings and hearing from the Directors on businessactivities regularly and whenever necessary. The CorporateAuditors also meet regularly with the Representative Directors toexchange opinions on an extensive range of issues. The Board ofCorporate Auditors tries to enhance audit efficiency by sharinginformation among the Corporate Auditors. The CorporateAuditors also receive regular reports on the results of inspectionsand plans for future audits from, and exchange opinions with, theinternal audit teams throughout the Company’s organization, mak-ing use of this data as they craft their approaches. In addition, theCorporate Auditors receive such reports from the independentauditors, as well as reports on the status of the quality control ofinternal audits, to confirm whether their oversight is at a suitablelevel.
Nissan Annual Report 2006-200746
» F I N A N C I A L S E C T I O N

(4) Audit of financial statementsThe Company appoints Ernst & Young ShinNihon as its independ-ent auditors. The Certified Public Accountants engaged in theaudits of financial statements are as follows:
The name of the Certified Public Accountants engaged in thefinancial statement auditDesignated and Engagement Partner Yasunobu Furukawa
Designated and Engagement Partner Kenji Ota
Designated and Engagement Partner Yoji Murohashi
Designated and Engagement Partner Takeshi Hori
* As the years of continuous service in audit are less than seven years for all theCertified Public Accountants, the relevant statement is omitted.
* Ernst & Young ShinNihon has taken its own autonomous measures so thateach Engagement Partner is not involved in the audit of the Company’saccounting for a period over a predetermined tenure.
Assistants to the audit of the financial statements include 13Certified Public Accountants, 22 junior accountants and four oth-ers, including system specialists.
(5) Relationships between external Directors and external CorporateAuditors and the CompanyShemaya Levy, the Company’s external Director, had served asSenior Vice President of Renault from March 2002 to March2004, and Renault held 44.3% of the shares of the Company’scommon stock as of March 31, 2007.
Takeo Otsubo and Toshiyuki Nakamura—the Company’s exter-nal Corporate Auditors—have no particular business relationshipwith the Company.
Haruo Murakami, the Company’s external Corporate Auditor,currently serves as a Part-Time Counselor for SOFTBANK TELE-COM Corp. There are business transactions between SOFTBANKTELECOM and the Company: SOFTBANK TELECOM providedthe Company with various services and facilities such as networkmaintenance and telephone lines during the fiscal year underreview. However, Mr. Murakami himself does not have a directbusiness relationship with the Company.
(6) Number of DirectorsThe Company stipulates in the Articles of Incorporation that thenumber of Directors of the Company shall be six or more.
(7) Resolution requirement for election of DirectorsThe Company stipulates in the Articles of Incorporation that resolu-tions for the election of Directors shall be adopted by a majority voteof the shareholders present who hold one-third (1/3) or more of thevoting rights of shareholders entitled to exercise voting rights.
(8) Decision-making organization with respect to interim dividendThe Company stipulates in the Articles of Incorporation that the deci-sion on the payment of interim dividend shall be made by the resolu-tion of the Board of Directors for the purpose of returning profit toshareholders in a flexible manner.
(9) Decision-making organization with respect to acquisition of own sharesThe Company stipulates in the Articles of Incorporation that theCompany may, by resolution of the Board of Directors, acquire itsown shares through market trading etc. as provided for in Article 165,Paragraph 2 of the Corporation Law for the purpose of implementingthe Company’s capital strategy in a flexible manner.
2. Compensation paid to Directors and Corporate AuditorsCompensation paid to the Company’s Directors consists of a fixedamount of remuneration in cash and share appreciation rights asresolved at the 104th annual shareholders’ meeting held on June 19,2003. The cash remuneration is limited to a maximum of ¥2.6 billionper annum as resolved at the 106th annual shareholders’ meetingheld on June 21, 2005, and the amount to be paid to each Director isdetermined based on the business results and reflecting the firm’sglobal competitiveness.
On the other hand, the share appreciation rights are given asincentives to the Directors to stimulate their motivation to the sustain-able and profitable growth of the Company. This incentive is linked tothe Company’s medium- or long-term business results and is limitedto the equivalent of 6 million shares of the Company’s common stockper annum.
The remuneration paid to the Corporate Auditors is limited to ayearly amount of ¥120 million as resolved at the 106th annual share-holders’ meeting held on June 21, 2005. This compensation isdesigned to promote stable and transparent auditing.
For the current fiscal year, the aggregate amount disbursed to theDirectors and the Corporate Auditors was ¥2,518 million to nineDirectors and ¥68 million to four Corporate Auditors. These amountsinclude a total amount of ¥45 million disbursed to an externalDirector and three external Corporate Auditors. In addition, shareappreciation rights equivalent to 5.1 million shares were granted toeight Directors. (For reference, the fair value of these shares calculat-ed using the share price when the appreciation rights were grantedwould be ¥222.30 per share.) The number of share appreciationrights authorized to be exercised will be decided in response to thepredetermined achievement degree of each Director’s performancetargets, with the upper limit corresponding to the aforementioned 5.1million shares.
3. Remuneration to independent auditorsRemuneration paid to the independent auditors is summarized asfollows:• Remuneration for services stipulated by the Certified Public
Accountant Law, Article 2, Paragraph 1 (Law No. 103, 1948), forthe current fiscal year: ¥521 million
• Remuneration for other services for the current fiscal year: ¥17 million
4. Outline of the limited liability contract with external Directorsand Corporate Auditors
The Company’s external Directors and Corporate Auditors hold a limit-ed liability contract with the Company as stipulated by Article 423,paragraph 1, of the Company law. The contract prescribes that themaximum amount for which the external directors and auditors areliable shall be the higher of ¥5 million or the lowest limit specifiedby statute.
Nissan Annual Report 2006-2007 47
F I N A N C I A L S E C T I O N »

Thousands ofMillions of yen U.S. dollars (Note 3)
2006 2005 2006ASSETS As of Mar. 31, 2007 Mar. 31, 2006 Mar. 31, 2007
Current assets:
Cash and cash equivalents (Note 19) ¥ 469,388 ¥ 404,212 $ 3,977,864
Short-term investments (Note 19) 16,792 22,149 142,305
Receivables, less allowance for
doubtful receivables (Notes 4 and 8) 4,140,259 3,989,748 35,086,941
Inventories (Note 5) 1,004,671 856,499 8,514,161
Other current assets 861,776 749,646 7,303,187
Total current assets 6,492,886 6,022,254 55,024,458
Property, plant and equipment, at cost (Notes 6, 8 and 16) 9,226,537 8,516,356 78,190,992
Less accumulated depreciation (4,349,349) (4,077,548) (36,858,890)
Property, plant and equipment, net 4,877,188 4,438,808 41,332,102
Investments and other assets (Notes 8 and 19)
Investment securities:
Unconsolidated subsidiaries and affiliates 362,407 351,667 3,071,246
Other 23,805 51,719 201,737
Other assets 645,922 616,978 5,473,915
Total investments and other assets 1,032,134 1,020,364 8,746,898
Total assets ¥12,402,208 ¥11,481,426 $105,103,458
CONSOLIDATED BALANCE SHEETS
Nissan Motor Co., Ltd. and Consolidated SubsidiariesFiscal years 2006 and 2005
Nissan Annual Report 2006-200748
» F I N A N C I A L S E C T I O N
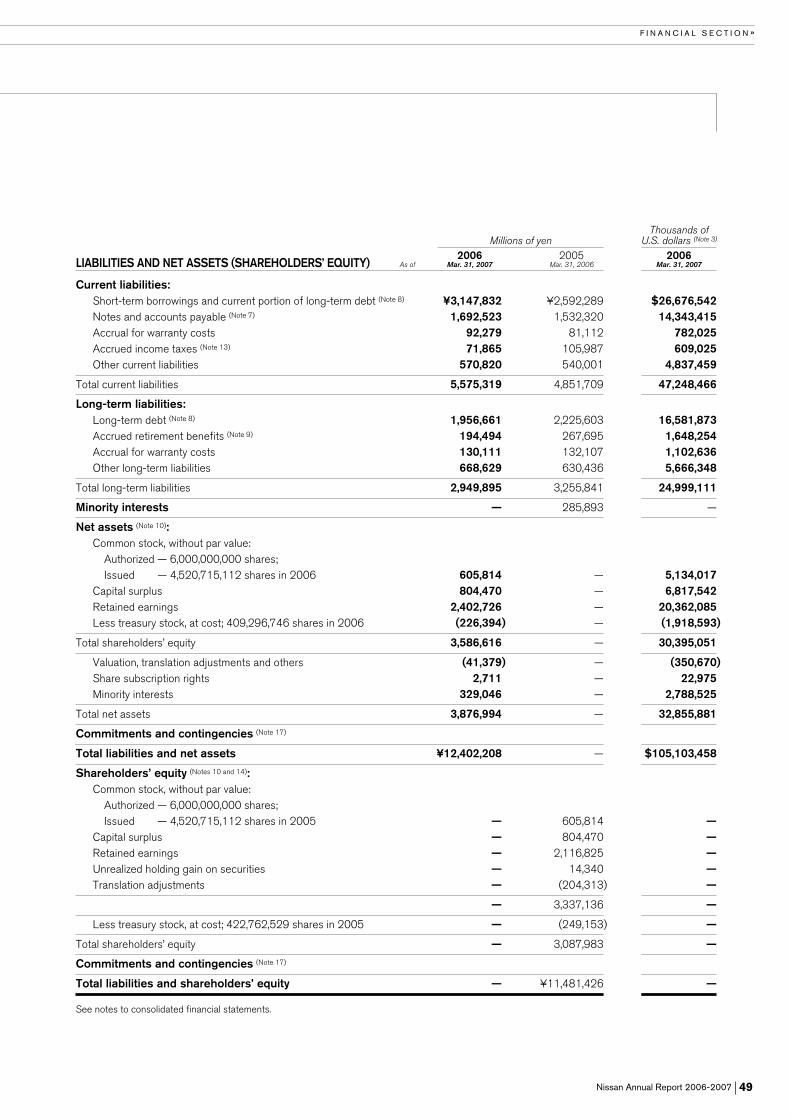
Thousands ofMillions of yen U.S. dollars (Note 3)
2006 2005 2006LIABILITIES AND NET ASSETS (SHAREHOLDERS’ EQUITY) As of Mar. 31, 2007 Mar. 31, 2006 Mar. 31, 2007
Current liabilities:Short-term borrowings and current portion of long-term debt (Note 8) ¥3,147,832 ¥2,592,289 $26,676,542 Notes and accounts payable (Note 7) 1,692,523 1,532,320 14,343,415Accrual for warranty costs 92,279 81,112 782,025Accrued income taxes (Note 13) 71,865 105,987 609,025Other current liabilities 570,820 540,001 4,837,459
Total current liabilities 5,575,319 4,851,709 47,248,466
Long-term liabilities:Long-term debt (Note 8) 1,956,661 2,225,603 16,581,873Accrued retirement benefits (Note 9) 194,494 267,695 1,648,254Accrual for warranty costs 130,111 132,107 1,102,636Other long-term liabilities 668,629 630,436 5,666,348
Total long-term liabilities 2,949,895 3,255,841 24,999,111
Minority interests — 285,893 —
Net assets (Note 10):Common stock, without par value:
Authorized — 6,000,000,000 shares;Issued — 4,520,715,112 shares in 2006 605,814 — 5,134,017
Capital surplus 804,470 — 6,817,542 Retained earnings 2,402,726 — 20,362,085Less treasury stock, at cost; 409,296,746 shares in 2006 (226,394) — (1,918,593)
Total shareholders’ equity 3,586,616 — 30,395,051
Valuation, translation adjustments and others (41,379) — (350,670)Share subscription rights 2,711 — 22,975Minority interests 329,046 — 2,788,525
Total net assets 3,876,994 — 32,855,881
Commitments and contingencies (Note 17)
Total liabilities and net assets ¥12,402,208 — $105,103,458
Shareholders’ equity (Notes 10 and 14):Common stock, without par value:
Authorized — 6,000,000,000 shares;Issued — 4,520,715,112 shares in 2005 — 605,814 —
Capital surplus — 804,470 —Retained earnings — 2,116,825 —Unrealized holding gain on securities — 14,340 —Translation adjustments — (204,313) —
— 3,337,136 —
Less treasury stock, at cost; 422,762,529 shares in 2005 — (249,153) —
Total shareholders’ equity — 3,087,983 —
Commitments and contingencies (Note 17)
Total liabilities and shareholders’ equity — ¥11,481,426 —
See notes to consolidated financial statements.
Nissan Annual Report 2006-2007 49
F I N A N C I A L S E C T I O N »

Thousands ofMillions of yen U.S. dollars (Note 3)
2006 2005 2004 2006For the years ended Mar. 31, 2007 Mar. 31, 2006 Mar. 31, 2005 Mar. 31, 2007
Net sales ¥10,468,583 ¥9,428,292 ¥8,576,277 $88,716,805
Cost of sales (Notes 6 and 11) 8,027,186 7,040,987 6,351,269 68,027,000
Gross profit 2,441,397 2,387,305 2,225,008 20,689,805
Selling, general and administrative
expenses (Notes 6 and 11) 1,664,458 1,515,464 1,363,848 14,105,576
Operating income 776,939 871,841 861,160 6,584,229
Other income (expenses):
Interest income 24,313 17,359 14,934 206,042
Interest expense (30,664) (25,646) (26,656) (259,864)
Equity in earnings of unconsolidated
subsidiaries and affiliates 20,187 37,049 36,790 171,076
Other, net (Note 12) (93,343) (91,562) (92,995) (791,042)
(79,507) (62,800) (67,927) (673,788)
Income before income taxes and
minority interests 697,432 809,041 793,233 5,910,441
Income taxes (Note 13):
Current 202,328 274,463 179,226 1,714,644
Deferred 9,834 (20,055) 78,837 83,339
212,162 254,408 258,063 1,797,983
Minority interests (24,474) (36,583) (22,889) (207,407)
Net income (Note 18) ¥ 460,796 ¥ 518,050 ¥ 512,281 $ 3,905,051
See notes to consolidated financial statements.
CONSOLIDATED STATEMENTS OF INCOME
Nissan Motor Co., Ltd. and Consolidated SubsidiariesFiscal Years 2006, 2005 and 2004
Nissan Annual Report 2006-200750
» F I N A N C I A L S E C T I O N
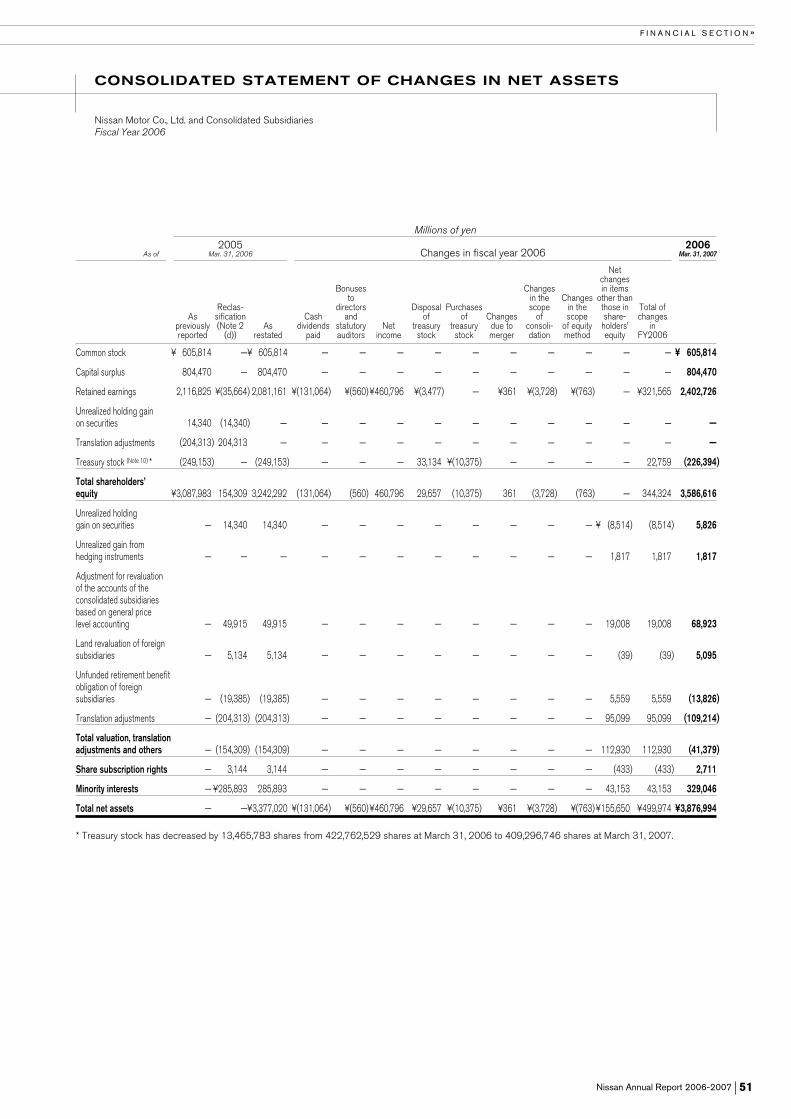
Millions of yen2005 2006
As of Mar. 31, 2006 Changes in fiscal year 2006 Mar. 31, 2007
Common stock ¥ 605,814 —¥ 605,814 — — — — — — — — — — ¥ 605,814
Capital surplus 804,470 — 804,470 — — — — — — — — — — 804,470
Retained earnings 2,116,825 ¥(35,664) 2,081,161 ¥(131,064) ¥(560)¥460,796 ¥(3,477) — ¥361 ¥(3,728) ¥(763) — ¥321,565 2,402,726
Unrealized holding gain on securities 14,340 (14,340) — — — — — — — — — — — —
Translation adjustments (204,313) 204,313 — — — — — — — — — — — —
Treasury stock (Note 10) * (249,153) — (249,153) — — — 33,134 ¥(10,375) — — — — 22,759 (226,394)
Total shareholders’ equity ¥3,087,983 154,309 3,242,292 (131,064) (560) 460,796 29,657 (10,375) 361 (3,728) (763) — 344,324 3,586,616
Unrealized holding gain on securities — 14,340 14,340 — — — — — — — — ¥ (8,514) (8,514) 5,826
Unrealized gain from hedging instruments — — — — — — — — — — — 1,817 1,817 1,817
Adjustment for revaluation of the accounts of the consolidated subsidiaries based on general price level accounting — 49,915 49,915 — — — — — — — — 19,008 19,008 68,923
Land revaluation of foreign subsidiaries — 5,134 5,134 — — — — — — — — (39) (39) 5,095
Unfunded retirement benefit obligation of foreign subsidiaries — (19,385) (19,385) — — — — — — — — 5,559 5,559 (13,826)
Translation adjustments — (204,313) (204,313) — — — — — — — — 95,099 95,099 (109,214)
Total valuation, translation adjustments and others — (154,309) (154,309) — — — — — — — — 112,930 112,930 (41,379)
Share subscription rights — 3,144 3,144 — — — — — — — — (433) (433) 2,711
Minority interests — ¥285,893 285,893 — — — — — — — — 43,153 43,153 329,046
Total net assets — —¥3,377,020 ¥(131,064) ¥(560)¥460,796 ¥29,657 ¥(10,375) ¥361 ¥(3,728) ¥(763)¥155,650 ¥499,974 ¥3,876,994
* Treasury stock has decreased by 13,465,783 shares from 422,762,529 shares at March 31, 2006 to 409,296,746 shares at March 31, 2007.
CONSOLIDATED STATEMENT OF CHANGES IN NET ASSETS
Nissan Motor Co., Ltd. and Consolidated SubsidiariesFiscal Year 2006
Nissan Annual Report 2006-2007 51
F I N A N C I A L S E C T I O N »
As previouslyreported
Reclas-sification(Note 2
(d))As
restated
Cash dividends
paid
Bonusesto
directorsand
statutoryauditors
Netincome
Disposalof
treasurystock
Purchasesof
treasurystock
Changesdue tomerger
Changesin thescope
of consoli-dation
Changesin thescope
of equitymethod
Netchangesin items
other thanthose inshare-
holders’equity
Total ofchanges
inFY2006

Thousands of U.S.dollars2005 2006
As of Mar. 31, 2006 Changes in fiscal year 2006 Mar. 31, 2007
Common stock $ 5,134,017 — $ 5,134,017 — — — — — — — — — — $ 5,134,017
Capital surplus 6,817,542 — 6,817,542 — — — — — — — — — — 6,817,542
Retained earnings 17,939,195 $(302,237) 17,636,958 $(1,110,712) $(4,746) $3,905,051 $(29,466) — $3,059 $(31,593) $(6,466) — $2,725,127 20,362,085
Unrealized holding gain on securities 121,525 (121,525) — — — — — — — — — — — —
Translation adjustments (1,731,466) 1,731,466 — — — — — — — — — — — —
Treasury stock (Note 10) * (2,111,466) — (2,111,466) — — — 280,797 $(87,924) — — — — 192,873 (1,918,593)
Total shareholders’ equity $26,169,347 1,307,704 27,477,051 (1,110,712) (4,746) 3,905,051 251,331 (87,924) 3,059 (31,593) (6,466) — 2,918,000 30,395,051
Unrealized holding gain on securities — 121,525 121,525 — — — — — — — — $(72,153) (72,153) 49,372
Unrealized gain from hedging instruments — — — — — — — — — — — 15,398 15,398 15,398
Adjustment for revaluation of the accounts of the consolidated subsidiaries based on general price level accounting — 423,008 423,008 — — — — — — — — 161,085 161,085 584,093
Land revaluation of foreign subsidiaries — 43,508 43,508 — — — — — — — — (330) (330) 43,178
Unfunded retirement benefit obligation of foreign subsidiaries — (164,279) (164,279) — — — — — — — — 47,110 47,110 (117,169)
Translation adjustments — (1,731,466) (1,731,466) — — — — — — — — 805,924 805,924 (925,542)
Total valuation, translation adjustments and others — (1,307,704) (1,307,704) — — — — — — — — 957,034 957,034 (350,670)
Share subscription rights — 26,644 26,644 — — — — — — — — (3,669) (3,669) 22,975
Minority interests — $2,422,822 2,422,822 — — — — — — — — 365,703 365,703 2,788,525
Total net assets — — $28,618,813 $(1,110,712) $(4,746) $3,905,051 $251,331 $(87,924) $3,059 $(31,593) $(6,466) $1,319,068 $4,237,068 $32,855,881
* Treasury stock has decreased by 13,465,783 shares from 422,762,529 shares at March 31, 2006 to 409,296,746 shares at March 31, 2007.See notes to consolidated financial statements.
Nissan Annual Report 2006-200752
» F I N A N C I A L S E C T I O N
As previouslyreported
Reclas-sification(Note 2
(d))As
restated
Cash dividends
paid
Bonusesto
directorsand
statutoryauditors
Netincome
Disposalof
treasurystock
Purchasesof
treasurystock
Changesdue tomerger
Changesin thescope
of consoli-dation
Changesin thescope
of equitymethod
Netchangesin items
other thanthose inshare-
holders’equity
Total ofchanges
inFY2006

Millions of yen2005 2004
For the years ended Mar. 31, 2006 Mar. 31, 2005
Common stock
Balance at beginning and end of the year
(4,520,715,112 shares) ¥ 605,814 ¥ 605,814
Capital surplus
Balance at beginning and end of the year ¥ 804,470 ¥ 804,470
Retained earnings
Balance at beginning of the year ¥1,715,099 ¥1,286,299
Net income 518,050 512,281
Cash dividends paid (105,661) (94,236)
Bonuses to directors and statutory auditors (573) (404)
Other (Note 14) (10,090) 11,159
Balance at end of the year ¥2,116,825 ¥1,715,099
Unrealized holding gain on securities
Balance at beginning of the year ¥ 7,355 ¥ 4,392
Net change during the year 6,985 2,963
Balance at end of the year ¥ 14,340 ¥ 7,355
Translation adjustments
Balance at beginning of the year ¥ (400,099) ¥ (431,744)
Net change during the year 195,786 31,645
Balance at end of the year ¥ (204,313) ¥ (400,099)
Treasury stock
Balance at beginning of the year ¥ (266,889) ¥ (245,237)
Net change during the year 17,736 (21,652)
Balance at end of the year ¥ (249,153) ¥ (266,889)
Total shareholders’ equity ¥3,087,983 ¥2,465,750
See notes to consolidated financial statements.
CONSOLIDATED STATEMENTS OF SHAREHOLDERS’ EQUITY
Nissan Motor Co., Ltd. and Consolidated SubsidiariesFiscal Years 2005 and 2004
Nissan Annual Report 2006-2007 53
F I N A N C I A L S E C T I O N »

Thousands of Millions of yen U.S. dollars (Note 3)
2006 2005 2004 2006For the years ended Mar. 31, 2007 Mar. 31, 2006 Mar. 31, 2005 Mar. 31, 2007
Operating activitiesIncome before income taxes and minority interests ¥ 697,432 ¥ 809,041 ¥ 793,233 $ 5,910,441
Depreciation and amortization relating to:Leased assets 305,402 236,572 157,346 2,588,153 Other assets 465,821 418,830 368,580 3,947,636
Impairment loss 22,673 26,827 — 192,144 Provision for (reversal of) allowance for doubtful receivables 9,996 4,561 (6,464) 84,712Loss on devaluation of securities 459 212 128 3,890Interest and dividend income (25,546) (21,080) (16,274) (216,492)Interest expense 145,547 104,265 73,220 1,233,449 Gain on sales of tangible fixed assets (28,485) (16,742) (24,038) (241,398)Loss on disposal of fixed assets 25,403 22,213 20,115 215,280 Gain on sales of securities (3,566) (40,223) (7,232) (30,220)Amortization of net retirement benefit obligation at transition 10,928 11,145 11,795 92,610 Provision for accrued retirement benefits 55,438 63,564 65,103 469,814 Retirement benefits paid (157,821) (314,349) (82,924) (1,337,466)Other 12,118 13,587 (115) 102,695Changes in operating assets and liabilities:
Notes and accounts receivable (114,960) 90,391 15,494 (974,237)Finance receivables 44,341 (311,685) (794,349) 375,771 Inventories (88,765) (117,120) (108,903) (752,246)Notes and accounts payable 54,368 88,129 152,213 460,744
Subtotal 1,430,783 1,068,138 616,928 12,125,280 Interest and dividends received 24,622 21,034 16,098 208,661Interest paid (143,650) (102,219) (71,318) (1,217,373)Income taxes paid (268,928) (229,084) (192,293) (2,279,051)
Net cash provided by operating activities 1,042,827 757,869 369,415 8,837,517Investing activities
Decrease (increase) in short-term investments 7,210 7,078 (12,370) 61,102Purchases of investment securities (17,117) (23,930) (31,896) (145,059)Proceeds from sales of investment securities 36,486 46,060 3,098 309,203 Long-term loans made (12,625) (3,549) (4,019) (106,992)Collection of long-term loans receivable 4,211 3,225 4,860 35,686Purchases of fixed assets (546,848) (471,029) (461,146) (4,634,305)Proceeds from sales of property, plant and equipment 72,308 55,790 71,256 612,780 Purchases of leased vehicles (957,356) (953,285) (590,605) (8,113,186)Proceeds from sales of leased vehicles 304,912 264,124 173,812 2,584,000 Purchase of subsidiaries’ shares resulting in changes in scope of consolidation (Note 15) (1,391) — (1,292) (11,788)
Proceeds from sales of subsidiaries’ shares resulting in changes in scope of consolidation (Note 15) 1,308 4,705 7,697 11,085
Additional acquisition of shares of consolidated subsidiaries — (16,020) (500) —Other (5,685) (25,924) (23,930) (48,179)
Net cash used in investing activities (1,114,587) (1,112,755) (865,035) (9,445,653)Financing activities
Increase in short-term borrowings 492,538 376,048 666,191 4,174,051 Increase in long-term borrowings 969,461 883,548 1,050,841 8,215,771Increase in bonds and debentures 123,730 390,706 140,663 1,048,559 Repayment of long-term borrowings (1,102,015) (809,466) (765,588) (9,339,110)Redemption of bonds and debentures (190,515) (200,840) (379,946) (1,614,534)Proceeds from minority shareholders 260 1,321 30 2,203 Purchases of treasury stock (10,375) (22,208) (33,366) (87,924)Proceeds from sales of treasury stock 29,087 26,423 6,816 246,500Repayment of lease obligations (66,775) (76,071) (69,244) (565,890)Cash dividends paid (131,064) (105,661) (94,236) (1,110,712)Cash dividends paid to minority shareholders (7,453) (6,487) (678) (63,161)Other 33 606 (437) 281
Net cash provided by financing activities 106,912 457,919 521,046 906,034Effect of exchange rate changes on cash and cash equivalents 16,640 11,389 4,369 141,017 Increase in cash and cash equivalents 51,792 114,422 29,795 438,915 Cash and cash equivalent at beginning of the year 404,212 289,784 194,164 3,425,525 Increase due to inclusion in consolidation 13,384 6 65,825 113,424 Cash and cash equivalent at end of the year ¥ 469,388 ¥ 404,212 ¥ 289,784 $ 3,977,864
See notes to consolidated financial statements.
CONSOLIDATED STATEMENTS OF CASH FLOWS
Nissan Motor Co., Ltd. and Consolidated SubsidiariesFiscal Years 2006, 2005 and 2004
Nissan Annual Report 2006-200754
» F I N A N C I A L S E C T I O N

(a) Basis of PresentationNissan Motor Co., Ltd. (the “Company”) and its domestic subsidiariesmaintain their books of account in conformity with the financialaccounting standards of Japan, and its foreign subsidiaries maintaintheir books of account in conformity with those of their countries ofdomicile.
The accompanying consolidated financial statements have beenprepared in accordance with accounting principles generallyaccepted in Japan, which are different in certain respects as to theapplication and disclosure requirements of International FinancialReporting Standards, and have been compiled from the consolidatedfinancial statements prepared by the Company as required by theSecurities and Exchange Law of Japan.
Certain amounts in the prior years’ financial statements have beenreclassified to conform to the current year’s presentation.
(b) Principles of consolidation and accounting for investmentsin unconsolidated subsidiaries and affiliates
The accompanying consolidated financial statements include theaccounts of the Company and any significant companies controlleddirectly or indirectly by the Company. Companies over which theCompany exercises significant influence in terms of their operatingand financial policies have been included in the consolidated financialstatements on an equity basis. All significant intercompany balancesand transactions have been eliminated in consolidation.
The financial statements of the Company’s subsidiaries in certainforeign countries including Mexico have been prepared based ongeneral price-level accounting. The related revaluation adjustmentsmade to reflect the effect of inflation in those countries in theaccompanying consolidated financial statements have been chargedor credited to operations and are directly reflected in valuation,translation adjustments and others (retained earnings in 2005).
Investments in subsidiaries and affiliates which are notconsolidated or accounted for by the equity method are carried atcost or less. Where there has been a permanent decline in the valueof such investments, the Company has written down the investments.
Differences between the cost and the underlying net equity at fairvalue of investments in consolidated subsidiaries and in companieswhich are accounted for by the equity method have been amortizedby the straight-line method over periods not exceeding 20 years.
(c) Foreign currency translation The balance sheet accounts of the foreign consolidated subsidiariesare translated into yen at the rates of exchange in effect at thebalance sheet date, except for the components of net assetsexcluding minority interests (shareholders’ equity in 2005) which aretranslated at their historical exchange rates. Revenue and expenseaccounts are translated at the average rate of exchange in effectduring the year. Differences arising from the translation arepresented as translation adjustments and minority interests in itsconsolidated financial statements.
(d) Cash equivalentsAll highly liquid investments with maturity of three months or lesswhen purchased are considered cash equivalents.
(e) InventoriesInventories are stated principally at the lower of cost or market, costbeing determined principally by the first-in, first-out method.
(f) Short-term investments and investment securitiesSecurities other than equity securities issued by subsidiaries andaffiliates are classified into three categories: trading, held-to-maturityor other securities. Trading securities are carried at fair value andheld-to-maturity securities are carried at amortized cost. Marketablesecurities classified as other securities are carried at fair value withchanges in unrealized holding gain or loss, net of the applicableincome taxes, included directly in net assets (shareholders’ equity in2005). Non-marketable securities classified as other securities arecarried at cost. Cost of securities sold is determined by the movingaverage method.
(g) Property, plant and equipment and depreciationDepreciation of property, plant and equipment of the Company and itsconsolidated subsidiaries is calculated principally by the straight-linemethod based on the estimated useful lives and the residual valuedetermined by the Company. Significant renewals and additions arecapitalized at cost. Maintenance and repairs are charged to income.
(h) LeasesNoncancellable lease transactions that transfer substantially all risksand rewards associated with the ownership of assets are accountedfor as finance leases. All other lease transactions are accounted foras operating leases and relating payments are charged to income asincurred.
(i) Retirement benefitsAccrued retirement benefits and prepaid pension cost for employeeshave been recorded mainly at the amount calculated based on theretirement benefit obligation and the fair value of the pension planassets as of balance sheet date, as adjusted for unrecognized netretirement benefit obligation at transition, unrecognized actuarial gainor loss, and unrecognized prior service cost. The retirement benefitobligation is attributed to each period by the straight-line method overthe estimated years of service of the eligible employees. The netretirement benefit obligation at transition is being amortizedprincipally over a period of 15 years by the straight-line method.
Actuarial gain or loss is amortized in the year following the year inwhich the gain or loss is recognized primarily by the straight-linemethod over periods which are shorter than the average remainingyears of service of the employees. Certain foreign consolidatedsubsidiaries have adopted the corridor approach for the amortizationof actuarial gain and loss.
Prior service cost is being amortized as incurred by the straight-linemethod over periods which are shorter than the average remainingyears of service of the employees.
(j) Income taxesDeferred tax assets and liabilities have been recognized in theconsolidated financial statements with respect to the differencesbetween financial reporting and the tax bases of the assets andliabilities, and were measured using the enacted tax rates and lawswhich will be in effect when the differences are expected to reverse.
(k) Research and development costsResearch and development costs are charged to income whenincurred.
(l) Revenue recognitionRevenue is generally recognized on sales of products at the time ofshipment.
1. SUMMARY OF SIGNIFICANT ACCOUNTING POLICIES
NOTES TO CONSOLIDATED FINANCIAL STATEMENTS
Nissan Motor Co., Ltd. and Consolidated SubsidiariesFiscal year 2006 (Year ended March 31, 2007)
Nissan Annual Report 2006-2007 55
F I N A N C I A L S E C T I O N »

(m) Derivative financial instrumentsThe Company and certain consolidated subsidiaries have entered intovarious derivative transactions in order to manage certain risk arisingfrom adverse fluctuations in foreign currency exchange rates, interestrates, and stock and commodity prices. Derivative financialinstruments are carried at fair value with changes in unrealized gainor loss charged or credited to operations, except for those whichmeet the criteria for deferral hedge accounting under whichunrealized gain or loss is deferred as a component of net assets (anasset or a liability in 2005). See Note 2(a).
(n) New Accounting StandardsIn May 2006, the Accounting Standards Board of Japan issued anew accounting guideline to harmonize the accounting policies ofoverseas subsidiaries in the preparation of consolidated financialstatements. This accounting standard will become effective the fiscalyear commencing on or subsequent to April 1, 2008. The Company iscurrently assessing the impact of the adoption of this standard on itsconsolidated financial statements.
Nissan Annual Report 2006-200756
» F I N A N C I A L S E C T I O N
2. ACCOUNTING CHANGES
(a) Until the year ended March 31, 2005, the Company and itsdomestic consolidated subsidiaries applied special treatment toforward foreign exchange contracts entered into to hedge forecastedsales denominated in foreign currencies. These contracts qualified fordeferral hedge accounting as these sales and accounts receivablewere translated and reflected in the consolidated financial statementsat their corresponding contracted rates.
Effective April 1, 2005, the Company and its domestic subsidiarieschanged their method of accounting for such sales, accountsreceivable and forward foreign exchange contracts and beganapplying the benchmark method. Under this method, salesdenominated in foreign currencies are translated into Japanese yenat the exchange rates in effect at each transaction date and therelated accounts receivable are translated at the exchange rates ineffect at the balance sheet dates, with the related exchangedifferences charged or credited to income, whereas the forwardforeign exchange contracts are carried at fair value. This change wasmade as a result of the implementation of a newly modified internaloperating system with respect to forward foreign exchange contractsin order to achieve a better presentation of gain or loss related toopen derivatives positions. The effect of this change on theconsolidated financial statements was immaterial for the year endedMarch 31, 2006.
(b) Effective April 1, 2005, the Company and its domesticconsolidated subsidiaries adopted a new accounting standard for theimpairment of fixed assets. The Group bases its grouping forassessing impairment losses on fixed assets on its businesssegments (automobiles and sales finance) and geographicalsegments. However, the Group determines whether or not an asset isimpaired on an individual asset basis depending on whether the assetis deemed idle or if it is scheduled to be disposed of.
As a result of the adoption of this new standard, the Company andits domestic consolidated subsidiaries have recognized an impairmentloss in the amount of ¥26,827 million on idle assets and assets to bedisposed of due to a significant decline in their market value byreducing their book value to the respective net realizable value ofeach asset. Accordingly, income before income taxes and minorityinterests decreased by the same amount for the year ended March31, 2006 from the corresponding amount which would have beenrecorded under the previous method. The effect of this change onsegment information is explained in Note 21.
(c) Effective April 1, 2006, the Company adopted a new accountingstandard for share-based payment and related implementation
guidance. The effect of this change was to decrease operatingincome, income before income taxes and minority interests by¥1,037 million ($8,788 thousand) from the corresponding amountswhich would have been recorded if the previous method had beenfollowed. The effect of this change on segment information isexplained in Note 21.
(d) Effective April 1, 2006, the Company adopted a new accountingstandard for presentation of net assets in the balance sheet andrelated implementation guidance. Shareholders’ equity under theprevious presentation method amounted to ¥3,543,420 million($30,028,983 thousand) as of March 31, 2007. In addition, effectivethe year ended March 31, 2007, the Company is required to prepareconsolidated statement of changes in net assets instead ofconsolidated statements of shareholders’ equity.
(e) Until the year ended March 31, 2006, since the differencebetween the fiscal year end of the parent company and those of 55consolidated subsidiaries was within three months, the operatingresults of those subsidiaries were consolidated by using theirfinancial statements as of their respective fiscal year ends. Effectivethe year ended March 31, 2007, 22 consolidated subsidiaries havebeen consolidated by using their financial statements as of theparent’s fiscal year end prepared solely for consolidation purposesinstead of those as of their respective fiscal year end. This changewas made, upon the completion of the internal reporting systemswhich allow those subsidiaries to accelerate their financial statementclosing process, in order to make the disclosures of the consolidatedfinancial statements more meaningful by unifying the fiscal year. Inaddition, 33 consolidated subsidiaries have also changed their fiscalyear end to March 31 for the same reason.
Accordingly, the operating results for the 15-month period fromJanuary 1, 2006 to March 31, 2007 of the 55 consolidatedsubsidiaries have been included in the consolidated financialstatements for the year ended March 31, 2007.
As a result, net sales, operating income, income before incometaxes and minority interests and net income increased by ¥767,606million ($6,505,136 thousand), ¥21,443 million ($181,720thousand), ¥15,661 million ($132,720 thousand) and ¥11,589million ($98,212 thousand), respectively, over the correspondingamounts which would have been reported under the previous method.The effect of this change on segment information is explained inNote 21.

F I N A N C I A L S E C T I O N »
Nissan Annual Report 2006-2007 57
3. U.S. DOLLAR AMOUNTS
Amounts in U.S. dollars are included solely for the convenience of the reader. The rate of ¥118 = US$1.00, the approximate rate of exchange ineffect on March 31, 2007, has been used. The inclusion of such amounts is not intended to imply that yen amounts have been or could be readilyconverted, realized or settled in U.S. dollars at that or any other rate.
4. RECEIVABLES
Receivables at March 31, 2007 and 2006 consisted of the following:Thousands of
Millions of yen U.S. dollars
2006 2005 2006As of Mar. 31, 2007 Mar. 31, 2006 Mar. 31, 2007
Notes and accounts receivable......................................................................................................................................... ¥ 679,119 ¥ 488,600 $ 5,755,246Finance receivables.................................................................................................................................................................... 3,557,223 3,589,127 30,145,958Less allowance for doubtful receivables................................................................................................................... (96,083) (87,979) (814,263)..................................................................................................................................................................................................................... ¥4,140,259 ¥3,989,748 $35,086,941
Finance receivables principally represent receivables from customers on loans made by financing subsidiaries in connection with sales ofautomobiles.
5. INVENTORIES
6. PROPERTY, PLANT AND EQUIPMENT
Inventories at March 31, 2007 and 2006 were as follows:Thousands of
Millions of yen U.S. dollars
2006 2005 2006As of Mar. 31, 2007 Mar. 31, 2006 Mar. 31, 2007
Finished products............................................................................................................................................................................... ¥ 712,696 ¥607,149 $6,039,797Work in process and other.......................................................................................................................................................... 291,975 249,350 2,474,364........................................................................................................................................................................................................................... ¥1,004,671 ¥856,499 $8,514,161
Property, plant and equipment at March 31, 2007 and 2006 is summarized as follows: Thousands of
Millions of yen U.S. dollars
2006 2005 2006As of Mar. 31, 2007 Mar. 31, 2006 Mar. 31, 2007
Land......................................................................................................................................................................................................... ¥ 733,651 ¥ 740,716 $ 6,217,382Buildings and structures......................................................................................................................................................... 1,531,902 1,513,774 12,982,220Machinery and equipment..................................................................................................................................................... 6,808,155 6,021,596 57,696,229Construction in progress ........................................................................................................................................................ 152,829 240,270 1,295,161..................................................................................................................................................................................................................... ¥9,226,537 ¥8,516,356 $78,190,992

» F I N A N C I A L S E C T I O N
Nissan Annual Report 2006-200758
The following table set forth the acquisition costs and related accumulated amortization of assets recorded under finance leases included in theabove balances:
Thousands ofMillions of yen U.S. dollars
2006 2005 2006As of Mar. 31, 2007 Mar. 31, 2006 Mar. 31, 2007
Buildings and structures................................................................................................................................................................... ¥ 16,346 ¥ 15,570 $ 138,525Machinery and equipment............................................................................................................................................................... 275,258 322,391 2,332,695............................................................................................................................................................................................................................... 291,604 337,961 2,471,220Accumulated amortization............................................................................................................................................................... (160,851) (187,405) (1,363,144)............................................................................................................................................................................................................................... ¥130,753 ¥150,556 $1,108,076
Depreciation and amortization of property, plant and equipment for each of the three years in the period ended March 31, 2007 was as follows:
Thousands ofMillions of yen U.S. dollars
2006 2005 2004 2006For the years ended Mar. 31, 2007 Mar. 31, 2006 Mar. 31, 2005 Mar. 31, 2007
Depreciation and amortization................................................................................................................. ¥705,380 ¥635,344 ¥514,261 $5,977,797
The Company and certain domestic consolidated subsidiaries have recognized an impairment loss on idle assets and assets to be disposed ofdue to a significant decline in their market value by reducing their net book value to the respective net realizable value of each asset. Such lossamounted to ¥22,673 million ($192,144 thousand) for the year ended March 31, 2007 which consisted of losses on idle assets of ¥9,298million ($78,797 thousand) (land — ¥6,907 million and building and structures—¥2,305 million, and machinery and equipment—¥86 million) andlosses on assets to be sold of ¥1,078 million ($9,136 thousand) (land—¥467 million and buildings and structures—¥611million), and losses of¥12,297 million ($104,212 thousand) on assets disposed of (land—¥7,476 million and buildings and structures—¥4,821 million).
The impairment loss of ¥26,827 million for the year ended March 31, 2006 consisted of losses on idle assets of ¥19,190 million (land—¥17,186 million, buildings—¥1,525 million and others—¥479 million) and losses on assets to be sold of ¥7,637 million (land—¥4,654 million,buildings and structures—¥1,434 million, and others—¥1,549 million).
The net realizable value of the idle assets and those to be disposed of was based on their appraisal value and that of the assets to be sold wasestimated based on their respective sales contracts.
8. SHORT-TERM BORROWINGS AND LONG-TERM DEBT
At March 31, 2007 and 2006, short-term borrowings and the current portion of long-term debt consisted of the following:
Thousands ofMillions of yen U.S. dollars
2006 2005 2006As of Mar. 31, 2007 Mar. 31, 2006 Mar. 31, 2007
Loans, principally from banks............................................................................................................................................. ¥1,056,319 ¥1,159,743 $ 8,951,856 Commercial paper........................................................................................................................................................................ 965,238 366,998 8,179,983Current portion of long-term debt (excluding lease obligations) .......................................................... 1,075,854 1,007,025 9,117,407Current portion of lease obligations.............................................................................................................................. 50,421 58,523 427,296..................................................................................................................................................................................................................... ¥3,147,832 ¥2,592,289 $26,676,542
7. NOTES AND ACCOUNTS PAYABLE
Notes and accounts payable at March 31, 2007 and 2006 consisted of the following:
Thousands ofMillions of yen U.S. dollars
2006 2005 2006As of Mar. 31, 2007 Mar. 31, 2006 Mar. 31, 2007
Notes and accounts payable............................................................................................................................................... ¥1,103,186 ¥ 983,594 $ 9,349,034 Accrued expenses and other.............................................................................................................................................. 589,337 548,726 4,994,381..................................................................................................................................................................................................................... ¥1,692,523 ¥1,532,320 $14,343,415

The annual weighted-average interest rates applicable to short-term borrowings and current portion of long-term debt excluding lease obligationsoutstanding at March 31, 2007 and 2006 were 3.1% and 2.8%, respectively.
The annual weighted-average interest rates applicable to current portion of lease obligations outstanding at March 31, 2007 were 1.3%.At March 31, 2007 and 2006, long-term debt consisted of the following:
Thousands ofMillions of yen U.S. dollars
2006 2005 2006As of Mar. 31, 2007 Mar. 31, 2006 Mar. 31, 2007
Debt with collateral:Loans from banks and other financial institutions due through 2011 with weighted-average interest rate of 4.8% ....................................................... ¥1,423,586 ¥1,583,358 $12,064,288
Debt without collateral:Loans from banks and other financial institutions due through 2026 with weighted-average interest rate of 2.9% ....................................................... 718,923 680,536 6,092,568
Bonds in yen due through 2010 at rates ranging from 0.4% to 2.4%................................... 557,977 642,980 4,728,619Straight Bonds in U.S. dollars due through 2011 at rates ranging from 4.6% to 5.6% ............ 206,391 205,573 1,749,076Medium-term notes in U.S. dollars due through 2008 at rates ranging from 5.4% to 5.6%................................................................................................................. 11,159 29,711 94,568
Euro medium-term notes in U.S. dollars and Euro due through 2006 at rates ranging from 4.1% to 4.7%............................................................................. — 15,416 —
Medium-term notes in Mexican pesos due through 2011 at rates ranging from 7.4% to 7.8%............................................................................. 53,650 — 454,661
Other .............................................................................................................................................................................................. 1,689 3,346 14,313Lease obligations ......................................................................................................................................................................... 109,561 130,231 928,483
............................................................................................................................................................................................................ 3,082,936 3,291,151 26,126,576Less current portion................................................................................................................................................................... 1,126,275 1,065,548 9,544,703
............................................................................................................................................................................................................ ¥1,956,661 ¥2,225,603 $16,581,873
The maturities of long-term debt excluding lease obligations are summarized as follows:Thousands of
Year ending Mar. 31, Millions of yen U.S. dollars
2008............................................................................................................................................................................................................................................... ¥1,075,854 $ 9,117,407 2009............................................................................................................................................................................................................................................... 739,319 6,265,4152010............................................................................................................................................................................................................................................... 636,846 5,397,0002011 and thereafter .......................................................................................................................................................................................................... 521,576 4,420,136............................................................................................................................................................................................................................................................. ¥2,973,595 $25,199,958
The discounts on bonds of ¥220 million ($1,864 thousand) at March 31, 2007 are reported in the consolidated balance sheet as a direct deductionfrom the face amount of the bonds.
The maturities of lease obligations are summarized as follows:Thousands of
Year ending Mar. 31, Millions of yen U.S. dollars
2008............................................................................................................................................................................................................................................... ¥ 50,421 $427,297 2009............................................................................................................................................................................................................................................... 22,839 193,5512010............................................................................................................................................................................................................................................... 10,486 88,8642011 and thereafter .......................................................................................................................................................................................................... 25,815 218,771............................................................................................................................................................................................................................................................. ¥109,561 $928,483
The assets pledged as collateral for short-term borrowings of ¥612,193 million ($5,188,076 thousand) and long-term debt of ¥1,422,841million ($12,057,975 thousand) at March 31, 2007 were as follows:
Thousands ofMillions of yen U.S. dollars
Receivables ............................................................................................................................................................................................................................... ¥1,378,786 $11,684,627 Property, plant and equipment, at net book value ..................................................................................................................................... 1,057,988 8,966,000Other assets ............................................................................................................................................................................................................................. 445 3,771............................................................................................................................................................................................................................................................. ¥2,437,219 $20,654,398
In addition to the above, at March 31, 2007, finance receivables of ¥55,066 million ($466,661 thousand) which have been eliminated from theaccompanying consolidated balance sheet were pledged as collateral for short-term borrowings of ¥54,957 million ($465,737 thousand).
Nissan Annual Report 2006-2007 59
F I N A N C I A L S E C T I O N »

» F I N A N C I A L S E C T I O N
Nissan Annual Report 2006-200760
9. RETIREMENT BENEFIT PLANS
The Company and most of consolidated subsidiaries have defined benefit plans and/or defined contribution plans.The Company and its domestic consolidated subsidiaries have defined benefit plans, i.e., welfare pension fund plans (“WPFP”), tax-qualified
pension plans and lump-sum payment plans, covering substantially all employees who are entitled to lump-sum or annuity payments, the amountsof which are determined by reference to their basic rates of pay, length of service, and the conditions under which termination occurs.
Certain consolidated subsidiaries transferred a portion of the benefit obligations under the above defined benefit plans to defined contributionplans during the years ended March 31, 2007 and 2006. In this connection, the pension assets of ¥4,493 million ($38,076 thousand) and¥45,762 million were also transferred to the defined contribution plans during the years ended March 31, 2007 and 2006, respectively.
The following table sets forth the funded and accrued status of the plans, and the amounts recognized in the consolidated balance sheets asof March 31, 2007 and 2006 for the Company ’s and the consolidated subsidiaries’ defined benefit plans:
Thousands ofMillions of yen U.S. dollars
2006 2005 2006As of Mar. 31, 2007 Mar. 31, 2006 Mar. 31, 2007
Retirement benefit obligation....................................................................................................................................... ¥(1,273,725) ¥(1,239,004) $(10,794,280)Plan assets at fair value .................................................................................................................................................... 1,008,771 817,371 8,548,907Unfunded retirement benefit obligation ............................................................................................................. (264,954) (421,633) (2,245,373)Unrecognized net retirement benefit obligation at transition ........................................................... 89,822 99,966 761,203Unrecognized actuarial loss........................................................................................................................................... 81,493 120,920 690,619 Unrecognized prior service cost................................................................................................................................. (54,049) (66,714) (458,042)Net retirement benefit obligation .............................................................................................................................. (147,688) (267,461) (1,251,593)Prepaid pension cost........................................................................................................................................................... 46,806 234 396,661Accrued retirement benefits ........................................................................................................................................ ¥ (194,494) ¥ (267,695) $ (1,648,254)
The substitutional portion of the benefits under the WPFP has been included in the amounts shown in the above table.Certain domestic subsidiaries received the approval from the Minister of Health, Labor and Welfare in the years ended March 31, 2006 and
2005 with respect to their application for an exemption from the obligation for benefits related to future employee services and for the return ofthe past benefit obligation and related pension plan assets under the substitutional portion of the WPFP.
The components of retirement benefit expenses for the years ended March 31, 2007, 2006 and 2005 are outlined as follows:Thousands of
Millions of yen U.S. dollars
2006 2005 2004 2006For the years ended Mar. 31, 2007 Mar. 31, 2006 Mar. 31, 2005 Mar. 31, 2007
Service cost........................................................................................................................................................................... ¥51,696 ¥41,022 ¥47,802 $438,102Interest cost ......................................................................................................................................................................... 41,209 36,809 33,288 349,229Expected return on plan assets............................................................................................................................ (39,625) (29,581) (17,999) (335,805)Amortization of net retirement benefit obligation at transition.................................................... 11,147 11,265 12,009 94,466Amortization of actuarial loss.................................................................................................................................. 9,031 12,542 12,298 76,534Amortization of prior service cost........................................................................................................................ (6,925) (5,967) (5,431) (58,686)Other ........................................................................................................................................................................................... 3,732 2,476 179 31,626Retirement benefit expenses ................................................................................................................................. 70,265 68,566 82,146 595,466Gain on return of the substitutional portion of welfare pension fund plans..................... — (772) (1,107) —Net (gain) loss on implementation of defined contribution plans............................................. (18,782) 3,570 — (159,169)Total............................................................................................................................................................................................. ¥51,483 ¥71,364 ¥81,039 $436,297
The assumptions used in accounting for the above plans were as follows:2006 2005
For the years ended Mar. 31, 2007 Mar. 31, 2006
Discount rates Domestic companies ....................................................................................................... 2.1% - 2.3% 2.1% - 2.3%Foreign companies............................................................................................................ 2.8% - 6.2% 2.5% - 6.0%
Expected rates of return on plan assets Domestic companies ....................................................................................................... Mainly 3.0% Mainly 3.0%Foreign companies............................................................................................................ 2.8% - 9.0% 3.0% - 9.0%
Amortization period of prior service cost ........................................................................................................................................................... Mainly 9-15 Mainly 9-15years years
Recognition period of actuarial loss ........................................................................................................................................................... Mainly 9-18 Mainly 9-18years years

F I N A N C I A L S E C T I O N »
Nissan Annual Report 2006-2007 61
10. NET ASSETS (SHAREHOLDERS’ EQUITY)
The new Company Law of Japan (the “Law”), which superseded most of the provisions of the Commercial Code of Japan, went into effect onMay 1, 2006. The Law provides that an amount equal to 10% of the amount to be distributed as distributions of capital surplus (other than thecapital reserve) and retained earnings (other than the legal reserve) be transferred to the capital reserve and the legal reserve. respectively, untilthe sum of the capital reserve and the legal reserve equals 25% of the common stock account. Such distributions can be made at any time byresolution of the shareholders, or by the Board of Directors if certain conditions are met, but neither the capital reserve nor the legal reserve isavailable for distributions.
(1) Information regarding changes in net assets for the year ended March 31, 2007 is as follows:
a. Shares issued and outstanding / Treasury stockThousands of shares
Number of shares Number of shares Types of share at March 31, 2006 Increase Decrease at March 31, 2007
Shares issued:Common stock.................................................................................................................................... 4,520,715 — — 4,520,715
Treasury stock:Common stock (Notes 1 and 2) ........................................................................................................ 422,763 16,193 29,659 409,297
(Thousands of shares)Notes: 1. Details of the increase are as follows:Increase in stocks held by affiliates accounted for by the equity method 8,337Increase due to purchase of the stocks 7,810Increase due to purchase of the stocks of less than standard unit 46
2. Details of the decrease are as follows:Decrease due to exercising share subscription rights 29,657Decrease in stocks held by affiliates accounted for by the equity method 2
b. Share subscription rightsNumber of shares to be issued (in thousands)
Common stock 15,937 — 15,937 — — —
Parent company Common stock 44,703 — 11,625 33,078 ¥1,674 $14,187
— 1,037 8,788
Total — ¥2,711 $22,975
Notes: 1. The decrease of Euro-yen bonds with warrants due 2007 reflects the exercise of the warrants. 2. The decrease of Euro-yen bonds with warrants due 2008 reflects the exercise of part of the warrants.
DescriptionCompany
Type ofshares to be
issued
Number ofshares atMarch 31,
2006 Increase Decrease
Number ofshares atMarch 31,
2007
Balance atMarch 31,
2007(Millions of
yen)
Balance atthe end of the current fiscal year
(Thousands ofU.S. dollars)
Euro-yen bonds with warrants due 2007 (Note 1)
Euro-yen bonds with warrants due 2008 (Note 2)
Share subscrip-tion rights asstock options

c. Dividends1) Dividends paid
Annual general meeting of the shareholders on June 27, 2006 (Note) Common stock ¥61,329 ¥15 March 31, June 28, $519,737 $0.13 2006 2006
Meeting of the Board of Directors on October 26, 2006 (Note) Common stock ¥69,735 ¥17 September 30, November 28, $590,975 $0.142006 2006
Note: Total dividends have been adjusted by the portion of dividends paid to Renault.
2) Dividends, of which the cutoff date was in the year ended March 31, 2007 and the effective date will be in the year ending March 31, 2008
Annual general meeting of the shareholders on June 20, 2007 (Note) Common stock ¥69,894 Retained ¥17 March 31, June 21, $592,322 $0.14 earnings 2007 2007
Note: Total dividends have been adjusted by the portion of dividends paid to Renault.
(2) Stock OptionThe Company has implemented adopted a stock option plan under which share subscription rights are granted to directors and employees of theCompany and its subsidiaries and affiliates in accordance with Articles 280-20 and 280-21 of the former Commercial Code of Japan before itsrevision in 2001 and Articles 236, 238 and 239 of the Company Law in 2006.
Stock option plans NESS2003 NESS2004 NESS2005 NESS2006
Individuals covered by the Plan Employees of the Company 548 590 620 456Directors of the Company's subsidiaries 101 96 88 72Employees of the Company's subsidiaries 5 4 4
Total 654 690 712 528
Type and number of shares to be issued upon the exercise of the share subscription rights Common stock 12,405,000 12,770,000 13,150,000 13,075,000
Granted date May 7, 2003 April 16, 2004 April 25, 2005 May 8, 2006
Exercise period
Conditions for the exercise of share subscription rights are as follows:1) Individuals to whom the share subscription rights are granted (the “Holders”) must continue their service with the Company or its subsidiaries and
affiliates in the state of being employed or entrusted until the share subscription rights become exercisable.2) The Company's operating results must meet certain predetermined targets.3) The Holders shall achieve their own predetermined performance targets.
Nissan Annual Report 2006-200762
» F I N A N C I A L S E C T I O N
ResolutionType ofshares
Totaldividends
(Millions ofyen)
Dividends
per share
(Yen) Cut-off dateEffective
date
Total dividends
(Thousands ofU.S. dollars)
Dividends per share
(U.S. dollars)
ResolutionType ofshares
Totaldividends
(Millions ofyen)
Resourcesof
dividends
Dividends
per share
(Yen)Cut-off
dateEffective
date
Total dividends
(Thousands ofU.S. dollars)
Dividends per share
(U.S. dollars)
From May 8, 2005to May 8, 2010
From April 17, 2006to June 19, 2013
From April 26, 2007to June 23, 2014
From May 9, 2008 to June 20, 2015

Number and activity of stock options NESS2003 NESS2004 NESS2005 NESS2006
Share subscription rights which are not yet vested.Outstanding as of March 31, 2006 — 10,078,000 13,150,000 —Granted — — — 13,075,000Forfeited — — 4,728,000 75,000Vested — 10,078,000 — —Outstanding as of March 31, 2007 — — 8,422,000 13,000,000
Share subscription rights which have already been vestedOutstanding as of March 31, 2006 8,655,500 — — —Vested — 10,078,000 — —Exercised 1,434,100 690,400 — —Forfeited 20,000 109,500 — —Outstanding as of March 31, 2007 7,201,400 9,278,100 — —
Exercise price (yen) 932 1,202 1,119 1,526Weighted average exercise price (yen) 1,386 1,403 — —Weighted average fair value per stock at the granted date (yen) — — — 222.3
Stock option expense included in selling, general and administrative expenses for the year ended March 31, 2007 amounted to ¥1,037 million($8,788 thousand). The fair value of options granted is estimated using the binominal model with the following weighted average assumptions.
NESS2006
Expected volatility 21.00%Expected holding period 5.5 yearsExpected dividend 40 yenRisk-free rate 1.50%
Nissan Annual Report 2006-2007 63
F I N A N C I A L S E C T I O N »
12. OTHER INCOME (EXPENSES)
The components of “Other, net” in “Other income (expenses)” for each of the three years in the period ended March 31, 2007 were as follows:
Thousands ofMillions of yen U.S. dollars
2006 2005 2004 2006For the years ended Mar. 31, 2007 Mar. 31, 2006 Mar. 31, 2005 Mar. 31, 2007
Dividend income.............................................................................................................................................................. ¥ 1,233 ¥ 3,721 ¥ 1,340 $ 10,449Gain on sales of fixed assets................................................................................................................................ 28,498 16,742 24,038 241,508Loss on disposal of fixed assets........................................................................................................................ (25,402) (22,213) (20,115) (215,271)Net gain on sales of investment securities ............................................................................................... 9,480 40,223 7,232 80,339Foreign exchange gain (loss)............................................................................................................................... 5,796 (34,836) 801 49,119Amortization of net retirement benefit obligation at transition.................................................. (10,928) (11,145) (11,795) (92,610)Gain on return of the substitutional portion of welfare pension fund plans................... — 772 1,107 —Loss on restructuring of consolidated subsidiaries’ operations............................................... (3,824) (9,404) (8,752) (32,407)Settlement loss on withdrawal from multi-employer retirement benefit plan ............... — — (6,337) —Impairment loss on fixed assets......................................................................................................................... (22,673) (26,827) — (192,144)Net gain (loss) on implementation of defined contribution plans........................................... 18,782 (3,570) — 159,169Expenses for share appreciation rights ....................................................................................................... — (18,332) — —Loss on relocation of the headquarters of a subsidiary in North America...................... (10,827) — — (91,754)Special severance benefits .................................................................................................................................... (31,933) — — (270,619)Other ......................................................................................................................................................................................... (51,545) (26,693) (80,514) (436,821)....................................................................................................................................................................................................... ¥(93,343) ¥(91,562) ¥(92,995) $(791,042)
11. RESEARCH AND DEVELOPMENT COSTS
Research and development costs included in selling, general and administrative expenses and manufacturing costs for the years ended March31, 2007, 2006 and 2005 amounted to ¥464,839 million ($3,939,314 thousand), ¥447,582 million and ¥398,148 million, respectively.

» F I N A N C I A L S E C T I O N
Nissan Annual Report 2006-200764
13. INCOME TAXES
Income taxes in Japan applicable to the Company and its domestic consolidated subsidiaries consist of corporation tax, inhabitants’ taxes andenterprise tax, which, in the aggregate, resulted in a statutory rate of approximately 41% for 2006, 2005 and 2004. Income taxes of the foreignconsolidated subsidiaries are based generally on the tax rates applicable in their countries of incorporation.
The effective tax rates reflected in the consolidated statements of income for the years ended March 31, 2007, 2006 and 2005 differ fromthe statutory tax rate for the following reasons:
2006 2005 2004For the years ended Mar. 31, 2007 Mar. 31, 2006 Mar. 31, 2005
Statutory tax rate .................................................................................................................................................................................................................... 40.6% 40.6% 40.6%Effect of:
Decrease in valuation allowance ................................................................................................................................................................ (0.0) (1.0) (1.9)Different tax rates applied to foreign subsidiaries ....................................................................................................................... (5.4) (3.1) (2.7)Tax credits..................................................................................................................................................................................................................... (2.8) (2.7) (1.5)Equity in earnings of unconsolidated subsidiaries and affiliates...................................................................................... (1.2) (1.9) (1.9)Other .................................................................................................................................................................................................................................. (0.8) (0.5) (0.1)
Effective tax rates .................................................................................................................................................................................................................. 30.4% 31.4% 32.5%
The significant components of deferred tax assets and liabilities at March 31, 2007 and 2006 were as follows:Thousands of
Millions of yen U.S. dollars
2006 2005 2006As of Mar. 31, 2007 Mar. 31, 2006 Mar. 31, 2007
Deferred tax assets:Net operating loss carryforwards ................................................................................................................................ ¥ 56,141 ¥ 20,343 $ 475,771Accrued retirement benefits............................................................................................................................................ 128,515 157,319 1,089,110Accrual for warranty costs ................................................................................................................................................ 70,364 67,461 596,305Other ................................................................................................................................................................................................... 499,960 454,878 4,236,950
Gross deferred tax assets .......................................................................................................................................................... 754,980 700,001 6,398,136Valuation allowance......................................................................................................................................................................... (72,601) (38,880) (615,263)Total deferred tax assets ............................................................................................................................................................ 682,379 661,121 5,782,873 Deferred tax liabilities:
Reserves under Special Taxation Measures Law, etc. .............................................................................. (451,404) (440,939) (3,825,458)Difference between cost of investments and their underlying net equity at fair value ............................................................................................................... (78,917) (81,634) (668,788)
Unrealized holding gain on securities...................................................................................................................... (4,166) (14,828) (35,305)Other ................................................................................................................................................................................................... (182,082) (155,465) (1,543,068)
Total deferred tax liabilities ....................................................................................................................................................... (716,569) (692,866) (6,072,619)Net deferred tax liabilities........................................................................................................................................................... ¥ (34,190) ¥ (31,745) $ (289,746)

F I N A N C I A L S E C T I O N »
Nissan Annual Report 2006-2007 65
14. RETAINED EARNINGS
Other changes in retained earnings for each of the two years in the period ended March 31, 2006 were as follows:
Millions of yen
2005 2004For the years ended Mar. 31, 2006 Mar. 31, 2005
Adjustments for revaluation of the accounts of the consolidated subsidiaries based on general price-level accounting (Note 1 (b)) ............................................................................................................................................................ ¥ 9,331 ¥12,942
Loss on disposal of treasury stock .................................................................................................................................................................................................. (11,507) (4,700)
Decrease due to increase in unfunded retirement benefit obligation of foreign subsidiaries........................................................ (884) (369)
Adjustments to retained earnings at beginning of the year for inclusion in or exclusion from consolidation or the equity method of accounting for subsidiaries and affiliates, and certain other adjustments.......................................................................................................................................................................................................... (2,672) 1,104
Changes in land revaluation of foreign subsidiaries.......................................................................................................................................................... 1,646 2,182
Decrease due to an affiliate's transition to International Financial Reporting Standards................................................................... (6,004) —
....................................................................................................................................................................................................................................................................................... ¥(10,090) ¥11,159
15. SUPPLEMENTARY CASH FLOW INFORMATION
The following is a summary of the assets and liabilities of Calsonic Kansei Corporation and its 11 subsidiaries, which were newly consolidated asa result of the acquisition of their shares through the private placement for the year ended March 31, 2005:
Millions of yen
2004For the year ended Mar. 31, 2005
Current assets............................................................................................................................................................................................................................................................................. ¥ 69,926Fixed assets.................................................................................................................................................................................................................................................................................. 126,242
Total assets ................................................................................................................................................................................................................................................................................... ¥196,168
Current liabilities ....................................................................................................................................................................................................................................................................... ¥ (21,146)Long-term liabilities ................................................................................................................................................................................................................................................................ (55,714)
Total liabilities.............................................................................................................................................................................................................................................................................. ¥ (76,860)
The following is a summary of the assets and liabilities of Dongfeng Motor Co., Ltd., which was newly consolidated as a result of the transfer of allits shares to the Company’s consolidated subsidiary, Nissan China Investment Co., Ltd. during the year ended March 31, 2005:
Millions of yen
2004For the year ended Mar. 31, 2005
Current assets............................................................................................................................................................................................................................................................................. ¥ 106,744Fixed assets.................................................................................................................................................................................................................................................................................. 44,094
Total assets ................................................................................................................................................................................................................................................................................... ¥ 150,838
Current liabilities ....................................................................................................................................................................................................................................................................... ¥(109,922)Long-term liabilities ................................................................................................................................................................................................................................................................ (22,218)
Total liabilities.............................................................................................................................................................................................................................................................................. ¥(132,140)

» F I N A N C I A L S E C T I O N
Nissan Annual Report 2006-200766
In addition to the above, at March 31, 2007, the Company was committed to provide guarantees of indebtedness of certain unconsolidatedsubsidiaries and affiliates in the aggregate amount of ¥1,064 million ($9,017 thousand) at the request of the lending banks. The outstandingbalance of installment receivables sold with recourse amounted to ¥6,076 million ($51,492 thousand) at March 31, 2007.
Certain consolidated subsidiaries have entered into overdraft and loan commitment agreements amounting to ¥229,767 million ($1,947,178thousand) with their customers and others. The loans receivable outstanding and the unused balances under these credit facilities at March 31,2007 amounted to ¥63,039 million ($534,229 thousand) and ¥166,728 million ($1,412,949 thousand), respectively. Since many of these creditfacilities expire without being utilized and the related borrowings are sometimes subject to a review of the borrowers' creditworthiness, anyunused amount may not necessarily be fully utilized.
17. COMMITMENTS AND CONTINGENCIES
At March 31, 2007, the Company and its consolidated subsidiaries had the following contingent liabilities:
Thousands ofMillions of yen U.S. dollars
As endorser of notes receivable discounted with banks....................................................................................................................... ¥ 5,229 $ 44,314 As guarantor of employees’ housing loans from banks and others ............................................................................................. 211,585 1,793,093
............................................................................................................................................................................................................................................................... ¥216,814 $1,837,407
16. LEASE TRANSACTIONS
a) Lessees’ accountingFuture minimum lease payments subsequent to March 31, 2007 for noncancelable operating leases are summarized as follows:
Thousands ofYear ending Mar. 31, Millions of yen U.S. dollars
2008................................................................................................................................................................................................................................................. ¥ 7,098 $ 60,1532009 and thereafter ............................................................................................................................................................................................................ 25,470 215,847
Total................................................................................................................................................................................................................................................... ¥32,568 $276,000
b) Lessors’ accountingFuture minimum lease income subsequent to March 31, 2007 for noncancelable operating leases are summarized as follows:
Thousands ofYear ending Mar. 31, Millions of yen U.S. dollars
2008................................................................................................................................................................................................................................................. ¥382,028 $3,237,5252009 and thereafter ............................................................................................................................................................................................................ 418,280 3,544,746
Total................................................................................................................................................................................................................................................... ¥800,308 $6,782,271

F I N A N C I A L S E C T I O N »
Nissan Annual Report 2006-2007 67
Basic net income per share is computed based on the net income available for distribution to shareholders of common stock and the weightedaverage number of shares of common stock outstanding during the year, and diluted net income per share is computed based on the net incomeavailable for distribution to the shareholders and the weighted average number of shares of common stock outstanding during each year aftergiving effect to the dilutive potential of shares of common stock to be issued upon the exercise of warrants and stock subscription rights.
Net assets per share are computed based on the net assets excluding share subscription rights and minority interests (the amount ofshareholders' equity in 2005) and the number of common stock outstanding at the year end.
Cash dividends per share represent the cash dividends proposed by the Board of Directors as applicable to the respective years together withany interim cash dividends paid.
19. SECURITIES
a) Information regarding marketable securities classified as held-to-maturity debt securities and other securities at March 31, 2007 and 2006 isas follows:
Marketable held-to-maturity debt securitiesMillions of yen Thousands of U.S. dollars
Carrying Estimated Unrealized Carrying Estimated UnrealizedFiscal year 2006 (As of Mar. 31, 2007) value fair value gain (loss) value fair value gain (loss)
Securities whose carrying value exceeds their fair value:Debt securities............................................................................................................. ¥294 ¥294 ¥ — $2,492 $2,492 $ —Corporate bonds......................................................................................................... 59 59 — 500 500 —
Total............................................................................................................................................... ¥353 ¥353 ¥ — $2,992 $2,992 $ —
Millions of yen
Carrying Estimated UnrealizedFiscal year 2005 (As of Mar. 31, 2006) value fair value gain (loss)
Securities whose carrying value exceeds their fair value:Corporate bonds......................................................................................................... ¥59 ¥59 ¥ —
Total............................................................................................................................................... ¥59 ¥59 ¥ —
18. AMOUNTS PER SHARE
Yen U.S. dollars
2006 2005 2004 2006For the years ended Mar. 31, 2007 Mar. 31, 2006 Mar. 31, 2005 Mar. 31, 2007
Net income:Basic ...................................................................................................................................................................................... ¥112.33 ¥126.94 ¥125.16 $0.952Diluted .................................................................................................................................................................................. 111.71 125.96 124.01 0.947
Cash dividends applicable to the year................................................................................................................. ¥ 34.00 ¥ 29.00 ¥ 24.00 $0.288
Yen U.S. dollars
2006 2005 2006As of Mar. 31, 2007 Mar. 31, 2006 Mar. 31, 2007
Net assets .................................................................................................................................................................................................................. ¥862.29 ¥753.40 $7.308

» F I N A N C I A L S E C T I O N
Nissan Annual Report 2006-200768
Marketable other securities
Millions of yen Thousands of U.S. dollars
Acquisition Carrying Unrealized Acquisition Carrying UnrealizedFiscal year 2006 (As of Mar. 31, 2007) cost value gain (loss) cost value gain (loss)
Securities whose carrying value exceeds their acquisition cost:
Stock .............................................................................................................................. ¥3,508 ¥14,613 ¥11,105 $29,729 $123,839 $94,110Others ............................................................................................................................. 2,704 2,751 47 22,915 23,314 399
Subtotal................................................................................................................................... ¥6,212 ¥17,364 ¥11,152 $52,644 $147,153 $94,509Securities whose acquisition cost exceeds their carrying value:
Stock................................................................................................................................ ¥ 926 ¥ 708 ¥ (218) $ 7,847 $ 6,000 $ (1,847)Debt securities......................................................................................................... 20 20 — 169 169 —Others ............................................................................................................................. 1,869 1,868 (1) 15,840 15,831 (9)
Subtotal................................................................................................................................... ¥2,815 ¥ 2,596 ¥ (219) $23,856 $ 22,000 $ (1,856)Total........................................................................................................................................... ¥9,027 ¥19,960 ¥10,933 $76,500 $169,153 $92,653
Millions of yen
Acquisition Carrying UnrealizedFiscal year 2005 (As of Mar. 31, 2006) cost value gain (loss)
Securities whose carrying value exceeds their acquisition cost:
Stock................................................................................................................................ ¥4,646 ¥29,549 ¥24,903Debt securities......................................................................................................... 19 20 1
Subtotal................................................................................................................................... ¥4,665 ¥29,569 ¥24,904
Securities whose acquisition cost exceeds their carrying value:
Stock................................................................................................................................ ¥ 766 ¥ 539 ¥ (227)
Subtotal................................................................................................................................... ¥ 766 ¥ 539 ¥ (227)
Total........................................................................................................................................... ¥5,431 ¥30,108 ¥24,677
b) Sales of securities classified as other securities and the aggregate gain and loss are summarized as follows:
Thousands ofMillions of yen U.S. dollars
2006 2005 2004 2006For the years ended Mar. 31, 2007 Mar. 31, 2006 Mar. 31, 2005 Mar. 31, 2007
Sales proceeds....................................................................................................................................................................... ¥25,700 ¥6,156 ¥2,032 $217,797Aggregate gain....................................................................................................................................................................... 11,996 305 1,225 101,661Aggregate loss ....................................................................................................................................................................... — (37) (13) —
c) The redemption schedule for securities with maturity dates classified as other securities and held-to-maturity debt securities at March 31, 2007is summarized as follows:
Millions of yen
Due in Due after one Due after fiveone year or year through years through Due after
Fiscal year 2006 (As of Mar. 31, 2007) less five years ten years ten years
Debt securities........................................................................................................................................................................ ¥314 ¥ — ¥ — ¥ —Corporate bonds ................................................................................................................................................................... — — 59 —Total................................................................................................................................................................................................. ¥314 ¥ — ¥59 ¥ —

F I N A N C I A L S E C T I O N »
Nissan Annual Report 2006-2007 69
Thousands of U.S. dollars
Due in Due after one Due after fiveone year or year through years through Due after
Fiscal year 2006 (As of Mar. 31, 2007) less five years ten years ten years
Debt securities........................................................................................................................................................................ $2,661 $ — $ — $ —Corporate bonds ................................................................................................................................................................... — — 500 —Total................................................................................................................................................................................................. $2,661 $ — $500 $ —
20. DERIVATIVE TRANSACTIONS
Hedging PoliciesThe Company and its consolidated subsidiaries (collectively, the“Group”) utilize derivative transactions for the purpose of hedgingtheir exposure to fluctuation in foreign exchange rates, interest ratesand market prices. However, based on an internal management ruleon financial market risk (the “Rule”) approved by the Company’sBoard of Directors, they do not enter into transactions involvingderivatives for speculative purposes. The Rule prescribes that (i) theGroup’s financial market risk is to be controlled by the Company in acentralized manner, and that (ii) no individual subsidiary can initiate ahedge position without the prior approval of and regular reporting tothe Company.
Risk to be hedged by derivative transactions(1) Market riskThe financial market risk to which the Group is generally exposed inits operations and the relevant derivative transactions primarily usedfor hedging are summarized as follows:• Foreign exchange risk associated with assets and liabilities
denominated in foreign currencies: forward foreign exchangecontracts, foreign currency options, and currency swaps;
• Interest rate risk associated with sourcing funds and investing:interest-rate swaps;
• Risk of fluctuation in stock prices: options on stocks;• Risk of fluctuation in commodity prices (mainly for precious metals):
commodity futures contracts
(2) Credit riskThe Group is exposed to the risk that a counterparty to its financialtransactions could default and jeopardize future profits. We believethat this risk is insignificant as the Group enters into derivativetransactions only with financial institutions which have a sound creditprofile. The Group enters into these transactions also with RenaultFinance S.A. (“RF”), a specialized financial subsidiary of the RenaultGroup which, we believe, is not subject to any such material risk.
This is because RF enters into derivative transactions to coversuch derivative transactions with us only with financial institutions ofthe highest caliber carefully selected by RF based on its own ratingsystem which takes into account each counterparty's long-term creditrating and shareholders' equity.
(3) Legal riskThe Group is exposed to the risk of entering into a financialagreement which may contain inappropriate terms and conditions aswell as to the risk that an existing contract may subsequently beaffected by revisions to the relevant laws and regulations.
The Company’s Legal Department and Finance Department makeevery effort to minimize legal risk by reviewing any new agreementsof significance and by reviewing the related documents in acentralized manner.
Risk Management All strategies to manage financial market risk and risk hedgeoperations of the Group are carried out pursuant to the Rule whichstipulates the Group’s basic policies for derivative transactions,management policies, management items, procedures, criteria for theselection of counterparties, and the reporting system, and so forth.The Rule prescribes that (i) the Group’s financial market risk is to becontrolled by the Company in a centralized manner, and that (ii) noindividual subsidiary is permitted to initiate a hedging operationwithout the prior approval of and regular reporting to the Company.
The basic hedge policy is subject to the approval of the MonthlyHedge Policy Meeting attended by the corporate officer in charge ofTreasury Department. Execution and management of all deals are tobe conducted pursuant to the Rule.
Derivative transactions are conducted by a special section of theTreasury Department and monitoring of contracts for suchtransactions and confirming the balance of all open positions are theresponsibility of back office and risk management section.
Commodity futures contracts are to be handled also by TreasuryDepartment under guidelines which are to be drawn up by the MRMC(Materials Risk Management Committee).
The MRMC is chaired by the corporate officer in charge of thePurchasing Department and the corporate officer in charge ofTreasury Department and it will meet approximately once every sixmonths.
The status of derivative transactions is reported on a daily basis tothe chief officer in charge of Treasury Department and on an annualbasis to the Board of Directors.
Credit risk is monitored quantitatively with reference to Renault’srating system based principally on the counterparties’ long-termcredit ratings and on their shareholders’ equity.
The Finance Department sets a maximum upper limit on positionswith each of the counterparties for the Group and monitors thebalances of open positions every day.

Summarized below are the notional amounts and the estimated fair value of the derivative instruments outstanding at March 31, 2007 and 2006:
1) Currency-related transactionsMillions of yen Thousands of U.S. dollars
Notional Unrealized Notional UnrealizedFiscal year 2006 (As of Mar. 31, 2007) amount Fair value gain (loss) amount Fair value gain (loss)
Forward foreign exchange contractsSell:
USD .......................................................................................................................... ¥12,849 ¥12,928 ¥ (79) $108,890 $109,559 $ (669)EUR........................................................................................................................... 1,064 1,080 (16) 9,017 9,153 (136)ZAR........................................................................................................................... 695 694 1 5,890 5,881 9 GBP .......................................................................................................................... 22 22 0 186 186 0 Others ..................................................................................................................... 12 12 0 102 102 0
Buy:EUR........................................................................................................................... 757 763 6 6,415 6,466 51 USD .......................................................................................................................... 3,483 3,477 (6) 29,517 29,466 (51)Others ..................................................................................................................... 10 10 0 85 85 0
Currency swaps:EUR........................................................................................................................... ¥59,657 ¥ (269) ¥(269) $505,568 $ (2,280) $(2,280)USD .......................................................................................................................... 20,816 424 424 176,407 3,593 3,593 AUD.......................................................................................................................... 1,291 (29) (29) 10,941 (246) (246)CAD .......................................................................................................................... 4,353 (42) (42) 36,890 (356) (356)THB........................................................................................................................... 25,513 (81) (81) 216,212 (686) (686)
Total ...................................................................................................................................... — — ¥ (91) — — $ (771)
Millions of yen
Notional UnrealizedFiscal year 2005 (As of Mar. 31, 2006) amount Fair value gain (loss)
Forward foreign exchange contractsSell:
USD .......................................................................................................................... ¥ 8,326 ¥ 8,523 ¥ (197)EUR........................................................................................................................... 1,117 1,134 (17)ZAR........................................................................................................................... 668 717 (49)GBP .......................................................................................................................... 9 9 —Others ..................................................................................................................... 33 32 1
Buy:EUR........................................................................................................................... 876 828 (48)USD .......................................................................................................................... 3,078 3,082 4 Others ..................................................................................................................... 174 168 (6)
Currency swaps:EUR........................................................................................................................... ¥105,906 ¥ (253) ¥ (253)GBP .......................................................................................................................... 16,771 (16) (16)USD .......................................................................................................................... 37,049 422 422 AUD.......................................................................................................................... 39,199 (605) (605)HKD.......................................................................................................................... 5,222 100 100 CAD .......................................................................................................................... 4,106 (1,120) (1,120)ZAR........................................................................................................................... 2,450 (27) (27)
Total ...................................................................................................................................... — — ¥(1,811)
Note: The notional amounts of the forward foreign exchange contracts and currency swaps presented above exclude those entered into to hedgereceivables and payables denominated in foreign currencies which have been translated and are reflected at their corresponding contracted rates in the accompanying consolidated balance sheets.
Nissan Annual Report 2006-200770
» F I N A N C I A L S E C T I O N
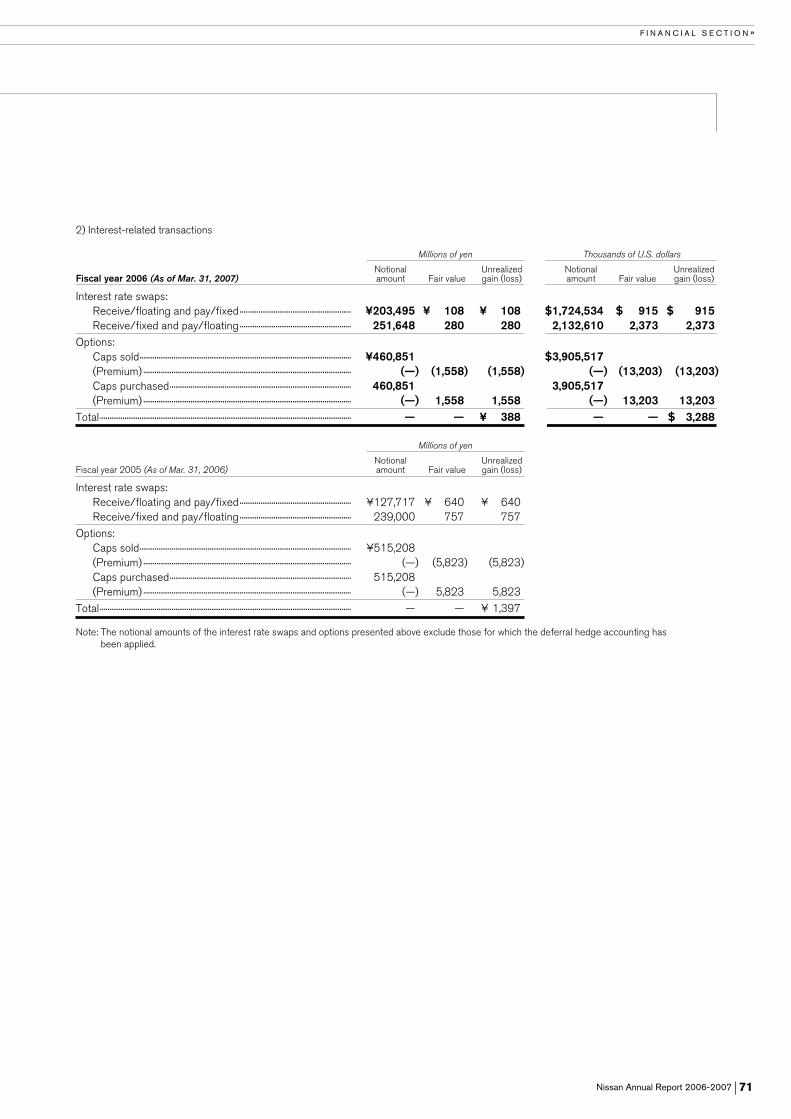
2) Interest-related transactions
Millions of yen Thousands of U.S. dollars
Notional Unrealized Notional UnrealizedFiscal year 2006 (As of Mar. 31, 2007) amount Fair value gain (loss) amount Fair value gain (loss)
Interest rate swaps:Receive/floating and pay/fixed........................................................... ¥203,495 ¥ 108 ¥ 108 $1,724,534 $ 915 $ 915 Receive/fixed and pay/floating........................................................... 251,648 280 280 2,132,610 2,373 2,373
Options:Caps sold................................................................................................................ ¥460,851 $3,905,517 (Premium) .............................................................................................................. (—) (1,558) (1,558) (—) (13,203) (13,203)Caps purchased................................................................................................ 460,851 3,905,517(Premium) .............................................................................................................. (—) 1,558 1,558 (—) 13,203 13,203
Total..................................................................................................................................... — — ¥ 388 — — $ 3,288
Millions of yen
Notional UnrealizedFiscal year 2005 (As of Mar. 31, 2006) amount Fair value gain (loss)
Interest rate swaps:Receive/floating and pay/fixed........................................................... ¥127,717 ¥ 640 ¥ 640Receive/fixed and pay/floating........................................................... 239,000 757 757
Options:Caps sold................................................................................................................ ¥515,208(Premium) .............................................................................................................. (—) (5,823) (5,823)Caps purchased................................................................................................ 515,208(Premium) .............................................................................................................. (—) 5,823 5,823
Total..................................................................................................................................... — — ¥ 1,397
Note: The notional amounts of the interest rate swaps and options presented above exclude those for which the deferral hedge accounting has been applied.
Nissan Annual Report 2006-2007 71
F I N A N C I A L S E C T I O N »

Business segments
The business segment information for the Company and its consolidated subsidiaries for the years ended March 31, 2007, 2006 and 2005 is asfollows:
Fiscal year 2006 (For the year ended Mar. 31, 2007)
SalesAutomobile Financing Total Eliminations Consolidated
Millions of yen
I. Sales and operating incomeSales to third parties ........................................................................... ¥9,790,484 ¥ 678,099 ¥10,468,583 ¥ — ¥10,468,583Inter-segment sales and transfers........................................... 28,767 16,613 45,380 (45,380) —Total sales.................................................................................................... 9,819,251 694,712 10,513,963 (45,380) 10,468,583Operating expenses ............................................................................ 9,171,272 618,959 9,790,231 (98,587) 9,691,644Operating income.................................................................................. ¥ 647,979 ¥ 75,753 ¥ 723,732 ¥ 53,207 ¥ 776,939
II. Assets, depreciation, impairment loss and capital expendituresTotal assets ................................................................................................ ¥7,910,116 ¥5,910,380 ¥13,820,496 ¥(1,418,288) ¥12,402,208Depreciation and amortization .................................................... ¥ 447,924 ¥ 323,299 ¥ 771,223 ¥ — ¥ 771,223Impairment loss on fixed assets ................................................ ¥ 22,673 ¥ — ¥ 22,673 ¥ — ¥ 22,673Capital expenditures ........................................................................... ¥ 578,363 ¥ 925,841 ¥ 1,504,204 ¥ — ¥ 1,504,204
Fiscal year 2006 (For the year ended Mar. 31, 2007)
SalesAutomobile Financing Total Eliminations Consolidated
Thousands of U.S. dollars
I. Sales and operating incomeSales to third parties ............................................................. $82,970,203 $ 5,746,602 $ 88,716,805 $ — $ 88,716,805Inter-segment sales and transfers............................. 243,788 140,788 384,576 (384,576) —Total sales...................................................................................... 83,213,991 5,887,390 89,101,381 (384,576) 88,716,805Operating expenses .............................................................. 77,722,644 5,245,415 82,968,059 (835,483) 82,132,576Operating income.................................................................... $ 5,491,347 $ 641,975 $ 6,133,322 $ 450,907 $ 6,584,229
II. Assets, depreciation, impairment loss and capital expendituresTotal assets .................................................................................. $67,034,881 $50,087,966 $117,122,847 $(12,019,389) $105,103,458Depreciation and amortization ...................................... $ 3,795,966 $ 2,739,822 $ 6,535,788 $ — $ 6,535,788Impairment loss on fixed assets .................................. $ 192,144 $ — $ 192,144 $ — $ 192,144Capital expenditures ............................................................. $ 4,901,382 $ 7,846,110 $ 12,747,492 $ — $ 12,747,492
Nissan Annual Report 2006-200772
» F I N A N C I A L S E C T I O N
21. SEGMENT INFORMATION
The Company and its consolidated subsidiaries are primarily engaged in the manufacture and sales of products in the automobile segment and inproviding various financial services to users of the Company’s products in the sales financing segment. These products, which are sold in Japanand overseas, principally in North America and Europe, include passenger cars, buses and trucks as well as the related components. Financialservices include primarily leases and credits principally in Japan and North America.

Fiscal year 2005 (For the year ended Mar. 31, 2006)
SalesAutomobile Financing Total Eliminations Consolidated
Millions of yen
I. Sales and operating incomeSales to third parties ........................................................................... ¥8,895,143 ¥ 533,149 ¥ 9,428,292 ¥ — ¥ 9,428,292Inter-segment sales and transfers........................................... 28,563 14,794 43,357 (43,357) —
Total sales.................................................................................................... 8,923,706 547,943 9,471,649 (43,357) 9,428,292Operating expenses ............................................................................ 8,160,292 478,218 8,638,510 (82,059) 8,556,451
Operating income.................................................................................. ¥ 763,414 ¥ 69,725 ¥ 833,139 ¥ 38,702 ¥ 871,841
II. Assets, depreciation, impairment loss and capital expendituresTotal assets ................................................................................................ ¥7,152,144 ¥5,710,239 ¥12,862,383 ¥(1,380,957) ¥11,481,426 Depreciation and amortization .................................................... ¥ 400,787 ¥ 254,615 ¥ 655,402 ¥ — ¥ 655,402 Impairment loss on fixed assets ................................................ ¥ 26,794 ¥ 33 ¥ 26,827 ¥ — ¥ 26,827 Capital expenditures ........................................................................... ¥ 503,916 ¥ 920,398 ¥ 1,424,314 ¥ — ¥ 1,424,314
Fiscal year 2004 (For the year ended Mar. 31, 2005)
SalesAutomobile Financing Total Eliminations Consolidated
Millions of yen
I. Sales and operating incomeSales to third parties ................................................................................... ¥8,177,841 ¥398,436 ¥8,576,277 ¥ — ¥8,576,277 Inter-segment sales and transfers................................................... 23,742 13,509 37,251 (37,251) —
Total sales............................................................................................................ 8,201,583 411,945 8,613,528 (37,251) 8,576,277Operating expenses .................................................................................... 7,429,760 338,388 7,768,148 (53,031) 7,715,117
Operating income.......................................................................................... ¥ 771,823 ¥ 73,557 ¥ 845,380 ¥ 15,780 ¥ 861,160
II. Assets, depreciation and capital expendituresTotal assets ........................................................................................................ ¥6,646,594 ¥4,596,322 ¥11,242,916 ¥(1,394,393) ¥9,848,523 Depreciation and amortization ............................................................ ¥ 349,163 ¥ 176,763 ¥ 525,926 ¥ — ¥ 525,926 Capital expenditures ................................................................................... ¥ 469,283 ¥ 582,468 ¥ 1,051,751 ¥ — ¥1,051,751
Nissan Annual Report 2006-2007 73
F I N A N C I A L S E C T I O N »
a) As described in Note 2 (b), effective April 1, 2005, the Company and its domestic consolidated subsidiaries adopted a new accountingstandard for the impairment of fixed assets. The effect of this change was to decrease total assets by ¥26,794 million and ¥33 million in the“Automobile” segment and “Sales Financing” segment, respectively, as of March 31, 2006 as compared with the corresponding amounts whichwould have been recorded if the previous method had been followed.
b) As described in Note 2 (c), effective April 1, 2006, the Company adopted a new accounting standard for share-based payment and relatedimplementation guidance. The effect of this change was to decrease operating income of automobile segment by ¥1,037 million ($8,788thousand) for the year ended March 31, 2007.
c) As described in Note 2 (e), effective the year ended March 31, 2007, 22 consolidated subsidiaries have been consolidated by using theirfinancial statements as of the parent's fiscal year end prepared solely for consolidated purposes instead of those as of their respective fiscalyear end. In addition, during fiscal year 2006, 33 consolidated subsidiaries have changed their fiscal year end to March 31. The effect of thischange was to increase net sales of the automobile and sales financing segments and increase the elimination of inter-group net sales by¥759,391 million ($6,435,517 thousand), ¥9,586 million ($81,237 thousand) and ¥1,371million ($11,618 thousand), respectively, for theyear ended March 31, 2007. In addition, due to this change, operating income of the automobile, sales financing segments and the eliminationof inter-group increased by ¥18,785 million ($159,195 thousand), ¥1,796 million ($15,220 thousand) and ¥862 million ($7,305 thousand),respectively, for the year ended March 31, 2007.

The following tables set forth the summarized financial statements by business segment for the years ended Mar 31, 2007, 2006 and 2005.Amounts for the sales financing segment represent the aggregate of the figures for the sales financing subsidiaries and operations in Japan, theUnited States, Canada, Mexico and Thailand. Amounts for the automobile and Eliminations segment represent the differences between theconsolidated totals and those for the sales financing segment.
1) Summarized consolidated balance sheets by business segment
Millions of yen Thousands of U.S. dollars
Automobile and Sales Consolidated Automobile and Sales ConsolidatedFiscal year 2006 (As of Mar. 31, 2007) Eliminations Financing total Eliminations Financing total
Cash and cash equivalents................................... ¥ 459,964 ¥ 9,424 ¥ 469,388 $ 3,898,000 $ 79,864 $ 3,977,864Short-term investments ........................................... 16,610 182 16,792 140,763 1,542 142,305Receivables, less allowance for doubtful receivables........................................ 437,415 3,702,844 4,140,259 3,706,907 31,380,034 35,086,941
Inventories .......................................................................... 986,150 18,521 1,004,671 8,357,203 156,958 8,514,161Other current assets .................................................. 594,434 267,342 861,776 5,037,576 2,265,611 7,303,187Total current assets .................................................... 2,494,573 3,998,313 6,492,886 21,140,449 33,884,009 55,024,458
Property, plant and equipment, net ................ 3,097,369 1,779,819 4,877,188 26,248,890 15,083,212 41,332,102Investment securities................................................. 384,337 1,875 386,212 3,257,093 15,890 3,272,983 Other assets...................................................................... 515,549 130,373 645,922 4,369,060 1,104,855 5,473,915Total assets ....................................................................... ¥6,491,828 ¥5,910,380 ¥12,402,208 $55,015,492 $50,087,966 $105,103,458
Short-term borrowings and current portion of long-term debt .................................... ¥ (245,284) ¥3,393,116 ¥ 3,147,832 $(2,078,678) $28,755,220 $26,676,542
Notes and accounts payable............................... 1,637,666 54,857 1,692,523 13,878,525 464,890 14,343,415 Accrued income taxes.............................................. 51,588 20,277 71,865 437,186 171,839 609,025Other current liabilities ............................................. 575,215 87,884 663,099 4,874,704 744,780 5,619,484Total current liabilities............................................... 2,019,185 3,556,134 5,575,319 17,111,737 30,136,729 47,248,466
Long-term debt .............................................................. 448,692 1,507,969 1,956,661 3,802,475 12,779,398 16,581,873Other long-term liabilities....................................... 612,435 380,799 993,234 5,190,128 3,227,110 8,417,238Total long-term liabilities......................................... 1,061,127 1,888,768 2,949,895 8,992,603 16,006,508 24,999,111Total liabilities .................................................................. 3,080,312 5,444,902 8,525,214 26,104,340 46,143,237 72,247,577
Common stock................................................................ 513,167 92,647 605,814 4,348,873 785,144 5,134,017Capital surplus................................................................. 773,623 30,847 804,470 6,556,127 261,415 6,817,542Retained earnings........................................................ 2,092,036 310,690 2,402,726 17,729,119 2,632,966 20,362,085Treasury stock................................................................. (226,394) — (226,394) (1,918,593) — (1,918,593)Total shareholders' equity...................................... 3,152,432 434,184 3,586,616 26,715,526 3,679,525 30,395,051
Valuation, translation adjustment and others........................................................................ (69,979) 28,600 (41,379) (593,043) 242,373 (350,670)
Share Subscription Rights..................................... 2,711 — 2,711 22,975 — 22,975Minority interests........................................................... 326,352 2,694 329,046 2,765,694 22,831 2,788,525Total net assets.............................................................. 3,411,516 465,478 3,876,994 28,911,152 3,944,729 32,855,881Total liabilities and net assets ............................ ¥6,491,828 ¥5,910,380 ¥12,402,208 $55,015,492 $50,087,966 $105,103,458
Nissan Annual Report 2006-200774
» F I N A N C I A L S E C T I O N

Millions of yen
Automobile and Sales ConsolidatedFiscal year 2005 (As of Mar. 31, 2006) Eliminations Financing total
Cash and cash equivalents..................................... ¥ 392,505 ¥ 11,707 ¥ 404,212 Short-term investments ............................................. 22,051 98 22,149 Receivables, less allowance for doubtful receivables .................................................. 228,405 3,761,343 3,989,748
Inventories ............................................................................ 847,243 9,256 856,499 Other current assets .................................................... 481,236 268,410 749,646
Total current assets ...................................................... 1,971,440 4,050,814 6,022,254
Property, plant and equipment, net .................. 2,926,753 1,512,055 4,438,808 Investment securities................................................... 401,520 1,866 403,386 Other assets........................................................................ 471,474 145,504 616,978 Total assets ......................................................................... ¥5,771,187 ¥5,710,239 ¥11,481,426
Short-term borrowings and current portion of long-term debt ...................................... ¥ (608,176) ¥3,200,465 ¥ 2,592,289
Notes and accounts payable................................. 1,482,002 50,318 1,532,320 Accrued income taxes................................................ 90,428 15,559 105,987 Other current liabilities ............................................... 539,351 81,762 621,113 Total current liabilities................................................. 1,503,605 3,348,104 4,851,709
Long-term debt ................................................................ 627,788 1,597,815 2,225,603 Other long-term liabilities......................................... 677,426 352,812 1,030,238
Total long-term liabilities........................................... 1,305,214 1,950,627 3,255,841
Total liabilities .................................................................... 2,808,819 5,298,731 8,107,550
Minority interests............................................................. 284,062 1,831 285,893
Common stock.................................................................. 514,489 91,325 605,814 Capital surplus................................................................... 773,623 30,847 804,470 Retained earnings.......................................................... 1,855,971 260,854 2,116,825 Unrealized holding gain on securities............ 14,156 184 14,340 Translation adjustments ............................................ (230,780) 26,467 (204,313)Treasury stock................................................................... (249,153) — (249,153)
Total shareholders’ equity........................................ 2,678,306 409,677 3,087,983
Total liabilities and shareholders’ equity ...... ¥5,771,187 ¥5,710,239 ¥11,481,426
Nissan Annual Report 2006-2007 75
F I N A N C I A L S E C T I O N »

(Interest-bearing debt)Millions of yen Thousands of U.S. dollars
Automobile and Sales Consolidated Automobile and Sales ConsolidatedFiscal year 2006 (As of Mar. 31, 2007) Eliminations Financing total Eliminations Financing total
Short-term borrowings from third parties ........... ¥ 693,500 ¥2,403,911 ¥3,097,411 $ 5,877,119 $20,372,127 $26,249,246 Internal loans to sales financing companies ..... (988,603) 988,603 — (8,377,992) 8,377,992 —Short-term borrowings per the balance sheet .... (295,103) 3,392,514 3,097,411 (2,500,873) 28,750,119 26,249,246 Bonds and debentures............................................. 349,689 380,018 729,707 2,963,466 3,220,492 6,183,958 Long-term borrowings from third parties............ 65,168 1,102,646 1,167,814 552,271 9,344,457 9,896,728 Internal loans to sales financing companies ..... (25,305) 25,305 — (214,449) 214,449 —Long-term borrowings per the balance sheet..... 39,863 1,127,951 1,167,814 337,822 9,558,906 9,896,728Lease obligations.......................................................... 108,959 602 109,561 923,381 5,102 928,483 Internal Loans from Sales Financing............ 1,918 (1,918) — 16,255 (16,255) —Total interest-bearing debt ................................... 205,326 4,899,167 5,104,493 1,740,051 41,518,364 43,258,415
Cash and cash equivalents................................... 459,964 9,424 469,388 3,898,000 79,864 3,977,864
Net interest-bearing debt (net cash and cash equivalents).................... (254,638) 4,889,743 4,635,105 (2,157,949) 41,438,500 39,280,551
Debt for Canton Plant included in the above....... 94,861 — 94,861 803,907 — 803,907Lease obligation included in the above ............... 108,959 602 109,561 923,381 5,102 928,483 Net interest-bearing debt (net cash and cash equivalents)(excluding that related to Canton Plant and lease obligations) .......................................... ¥(458,458) ¥4,889,141 ¥4,430,683 $(3,885,237) $41,433,398 $37,548,161
Millions of yen
Automobile and Sales ConsolidatedFiscal year 2005 (As of Mar. 31, 2006) Eliminations Financing total
Short-term borrowings from third parties ............. ¥ 302,471 ¥2,231,295 ¥2,533,766Internal loans to sales financing companies ....... (968,451) 968,451 —Short-term borrowings per the balance sheet ...... (665,980) 3,199,746 2,533,766
Bonds and debentures............................................... 381,346 326,861 708,207
Long-term borrowings from third parties.... 174,734 1,270,954 1,445,688 Internal loans to sales financing companies ....... — — —Long-term borrowings per the balance sheet....... 174,734 1,270,954 1,445,688
Lease obligations............................................................ 129,512 719 130,231
Total interest-bearing debt ..................................... 19,612 4,798,280 4,817,892
Cash and cash equivalents..................................... 392,505 11,707 404,212
Net interest-bearing debt (net cash and cash equivalents)...................... (372,893) 4,786,573 4,413,680
Debt for Canton Plant included above.......... 98,500 — 98,500
Lease obligations included above..................... 129,512 719 130,231
Net interest-bearing debt (net cash and cash equivalents)(excluding that related to Canton Plant and lease obligations) ............................................ ¥(600,905) ¥4,785,854 ¥4,184,949
Nissan Annual Report 2006-200776
» F I N A N C I A L S E C T I O N

2) Summarized consolidated statements of income by business segment
Millions of yen Thousands of U.S. dollars
Automobile and Sales Consolidated Automobile and Sales ConsolidatedFiscal year 2006 (For the year ended Mar. 31, 2007) Eliminations Financing total Eliminations Financing total
Net sales.................................................................................... ¥9,773,871 ¥694,712 ¥10,468,583 $82,829,415 $5,887,390 $88,716,805Cost of sales........................................................................... 7,498,350 528,836 8,027,186 63,545,339 4,481,661 68,027,000 Gross profit .............................................................................. 2,275,521 165,876 2,441,397 19,284,076 1,405,729 20,689,805 Operating income............................................................... 701,186 75,753 776,939 5,942,254 641,975 6,584,229 Operating income as a percentage of net sales ...... 7.2% 10.9% 7.4% 7.2% 10.9% 7.4%Net financial cost................................................................ (5,664) 546 (5,118) (48,000) 4,627 (43,373)Income before income taxes and minority interests.............................................................. 621,236 76,196 697,432 5,264,712 645,729 5,910,441
Net income............................................................................... ¥ 413,529 ¥ 47,267 ¥ 460,796 $ 3,504,483 $ 400,568 $ 3,905,051 Total net financial cost ................................................... ¥ (5,664) ¥ 546 ¥ (5,118) $ (48,000) $ 4,627 $ (43,373)
Interest on lease obligations ..................................... (3,323) (13) (3,336) (28,161) (110) (28,271)Intersegment eliminations ........................................... (55,569) — (55,569) (470,924) — (470,924)Net financial cost for segment ................................ 53,228 559 53,787 451,085 4,737 455,822
Millions of yen
Automobile and Sales ConsolidatedFiscal year 2005 (For the year ended Mar. 31, 2006) Eliminations Financing total
Net sales.................................................................................... ¥8,880,349 ¥547,943 ¥9,428,292
Cost of sales........................................................................... 6,649,937 391,050 7,040,987 Gross profit .............................................................................. 2,230,412 156,893 2,387,305
Operating income............................................................... 802,116 69,725 871,841Operating income as a percentage of net sales ...... 9.0% 12.7% 9.2%Net financial cost................................................................ (4,555) (11) (4,566)
Income before income taxes and minority interests.............................................................. 739,962 69,079 809,041
Net income............................................................................... ¥ 476,688 ¥ 41,362 ¥ 518,050
Total net financial cost ................................................... ¥ (4,555) ¥ (11) ¥ (4,566)
Interest on lease obligations ..................................... (3,952) (16) (3,968)Intersegment eliminations ........................................... (37,507) — (37,507)Net financial cost for segment ................................ 36,904 5 36,909
Millions of yen
Automobile and Sales ConsolidatedFiscal year 2004 (For the year ended Mar. 31, 2005) Eliminations Financing total
Net sales.................................................................................... ¥8,164,332 ¥411,945 ¥8,576,277
Cost of sales........................................................................... 6,094,196 257,073 6,351,269 Gross profit .............................................................................. 2,070,136 154,872 2,225,008
Operating income............................................................... 787,603 73,557 861,160 Operating income as a percentage of net sales ...... 9.6% 17.9% 10.0%Net financial cost................................................................ (10,371) (11) (10,382)
Income before income taxes and minority interests.............................................................. 720,764 72,469 793,233
Net income............................................................................... ¥ 472,680 ¥ 39,601 ¥ 512,281
Total net financial cost ................................................... ¥ (10,371) ¥ (11) ¥ (10,382)
Interest on lease obligations ..................................... (4,097) (20) (4,117)Intersegment eliminations ........................................... (12,524) — (12,524)Net financial cost for segment ................................ 6,250 9 6,259
Nissan Annual Report 2006-2007 77
F I N A N C I A L S E C T I O N »

3) Summarized consolidated statements of cash flows by business segment
Millions of yen Thousands of U.S. dollars
Automobile and Sales Consolidated Automobile and Sales ConsolidatedFiscal year 2006 (For the year ended Mar. 31, 2007) Eliminations Financing total Eliminations Financing total
Operating activitiesIncome before income taxes and minority interests............................................................... ¥621,236 ¥ 76,196 ¥ 697,432 $5,264,712 $ 645,729 $5,910,441
Depreciation and amortization .................................. 447,924 323,299 771,223 3,795,966 2,739,822 6,535,788 Increase (decrease) in finance receivables.... (22,914) 67,255 44,341 (194,187) 569,958 375,771Others ........................................................................................... (528,386) 58,217 (470,169) (4,477,847) 493,364 (3,984,483)Net cash provided by operating activities........ 517,860 524,967 1,042,827 4,388,644 4,448,873 8,837,517
Investing activitiesProceeds from sales of investment securities including shares of subsidiaries............................ 37,794 — 37,794 320,288 — 320,288
Proceeds from sales of property, plant and equipment....................................................... 72,308 0 72,308 612,780 0 612,780
Purchases of fixed assets ............................................ (537,129) (9,719) (546,848) (4,551,941) (82,364) (4,634,305)Purchases of leased vehicles .................................... (41,234) (916,122) (957,356) (349,440) (7,763,746) (8,113,186)Proceeds from sales of leased vehicles ........... 7,253 297,659 304,912 61,466 2,522,534 2,584,000 Others ........................................................................................... (35,804) 10,407 (25,397) (303,425) 88,195 (215,230)Net cash used in investing activities.................... (496,812) (617,775) (1,114,587) (4,210,272) (5,235,381) (9,445,653)
Financing activitiesIncrease in short-term borrowings......................... 418,824 73,714 492,538 3,549,356 624,695 4,174,051 Decrease or redemption of long-term debt ... (215,299) (107,770) (323,069) (1,824,568) (913,305) (2,737,873)Increase in bonds and debentures........................ — 123,730 123,730 — 1,048,559 1,048,559 Others ........................................................................................... (186,460) 173 (186,287) (1,580,169) 1,466 (1,578,703)Net cash provided by financing activities......... 17,065 89,847 106,912 144,619 761,415 906,034
Effect of exchange rate changes on cash and cash equivalents ................................................. 16,775 (135) 16,640 142,161 (1,144) 141,017
Increase (Decrease) in cash and cash equivalents ......................................................................... 54,888 (3,096) 51,792 465,152 (26,237) 438,915
Cash and cash equivalents at beginning of year...... 392,505 11,707 404,212 3,326,314 99,211 3,425,525 Increase due to inclusion in consolidation ............... 12,571 813 13,384 106,534 6,890 113,424 Cash and cash equivalents at end of year ............... ¥459,964 ¥ 9,424 ¥ 469,388 $3,898,000 $ 79,864 $3,977,864
Nissan Annual Report 2006-200778
» F I N A N C I A L S E C T I O N

Millions of yen
Automobile and Sales ConsolidatedFiscal year 2005 (For the year ended Mar. 31, 2006) Eliminations Financing total
Operating activitiesIncome before income taxes and minority interests................................................................................................... ¥739,962 ¥ 69,079 ¥ 809,041Depreciation and amortization...................................................................................................................................................... 400,787 254,615 655,402 (Increase) decrease in finance receivables ....................................................................................................................... 19,341 (331,026) (311,685)Others ............................................................................................................................................................................................................... (468,999) 74,110 (394,889)
Net cash provided by operating activities............................................................................................................................ 691,091 66,778 757,869
Investing activitiesProceeds from sales of investment securities including shares of subsidiaries ................................. 50,765 — 50,765 Proceeds from sales of property, plant and equipment ........................................................................................... 55,789 1 55,790 Purchases of fixed assets ................................................................................................................................................................ (456,550) (14,479) (471,029)Purchases of leased vehicles........................................................................................................................................................ (47,366) (905,919) (953,285)Proceeds from sales of leased vehicles ............................................................................................................................... 37,523 226,601 264,124 Others ............................................................................................................................................................................................................... (59,951) 831 (59,120)
Net cash used in investing activities........................................................................................................................................ (419,790) (692,965) (1,112,755)
Financing activitiesIncrease in short-term borrowings ........................................................................................................................................... 16,565 359,483 376,048 (Decrease) increase or redemption of long-term debt............................................................................................. (228,985) 102,227 (126,758)Increase in bonds and debentures............................................................................................................................................ 227,386 163,320 390,706 Others ............................................................................................................................................................................................................... (183,960) 1,883 (182,077)
Net cash provided by (used in) financing activities ..................................................................................................... (168,994) 626,913 457,919
Effect of exchange rate changes on cash and cash equivalents ............................................................................. 10,016 1,373 11,389 Increase in cash and cash equivalents .......................................................................................................................................... 112,323 2,099 114,422 Cash and cash equivalents at beginning of year.................................................................................................................... 280,176 9,608 289,784 Increase due to inclusion in consolidation................................................................................................................................... 6 — 6
Cash and cash equivalents at end of year................................................................................................................................... ¥392,505 ¥ 11,707 ¥ 404,212
Nissan Annual Report 2006-2007 79
F I N A N C I A L S E C T I O N »

Millions of yen
Automobile and Sales ConsolidatedFiscal year 2004 (For the year ended Mar. 31, 2005) Eliminations Financing total
Operating activitiesIncome before income taxes and minority interests................................................................................................... ¥720,764 ¥ 72,469 ¥793,233Depreciation and amortization...................................................................................................................................................... 349,163 176,763 525,926 (Increase) decrease in finance receivables ....................................................................................................................... 17,131 (811,480) (794,349)Others ............................................................................................................................................................................................................... (207,813) 52,418 (155,395)
Net cash provided by (used in) operating activities .................................................................................................... 879,245 (509,830) 369,415
Investing activitiesProceeds from sales of investment securities including shares of subsidiaries ................................. 10,285 510 10,795 Proceeds from sales of property, plant and equipment ........................................................................................... 71,256 — 71,256 Purchases of fixed assets ................................................................................................................................................................ (453,357) (7,789) (461,146)Purchases of leased vehicles........................................................................................................................................................ (15,926) (574,679) (590,605)Proceeds from sales of leased vehicles ............................................................................................................................... 16,143 157,669 173,812 Others ............................................................................................................................................................................................................... (79,115) 9,968 (69,147)
Net cash used in investing activities........................................................................................................................................ (450,714) (414,321) (865,035)
Financing activitiesIncrease in short-term borrowings ........................................................................................................................................... 174,500 491,691 666,191 (Decrease) increase or redemption of long-term debt............................................................................................. (391,244) 296,551 (94,693)Increase in bonds and debentures............................................................................................................................................ — 140,663 140,663 Others ............................................................................................................................................................................................................... (191,998) 883 (191,115)
Net cash provided by (used in) financing activities ..................................................................................................... (408,742) 929,788 521,046
Effect of exchange rate changes on cash and cash equivalents ............................................................................. 4,427 (58) 4,369 Increase in cash and cash equivalents .......................................................................................................................................... 24,216 5,579 29,795 Cash and cash equivalents at beginning of year.................................................................................................................... 190,135 4,029 194,164 Increase due to inclusion in consolidation................................................................................................................................... 65,825 — 65,825
Cash and cash equivalents at end of year................................................................................................................................... ¥280,176 ¥ 9,608 ¥289,784
Nissan Annual Report 2006-200780
» F I N A N C I A L S E C T I O N
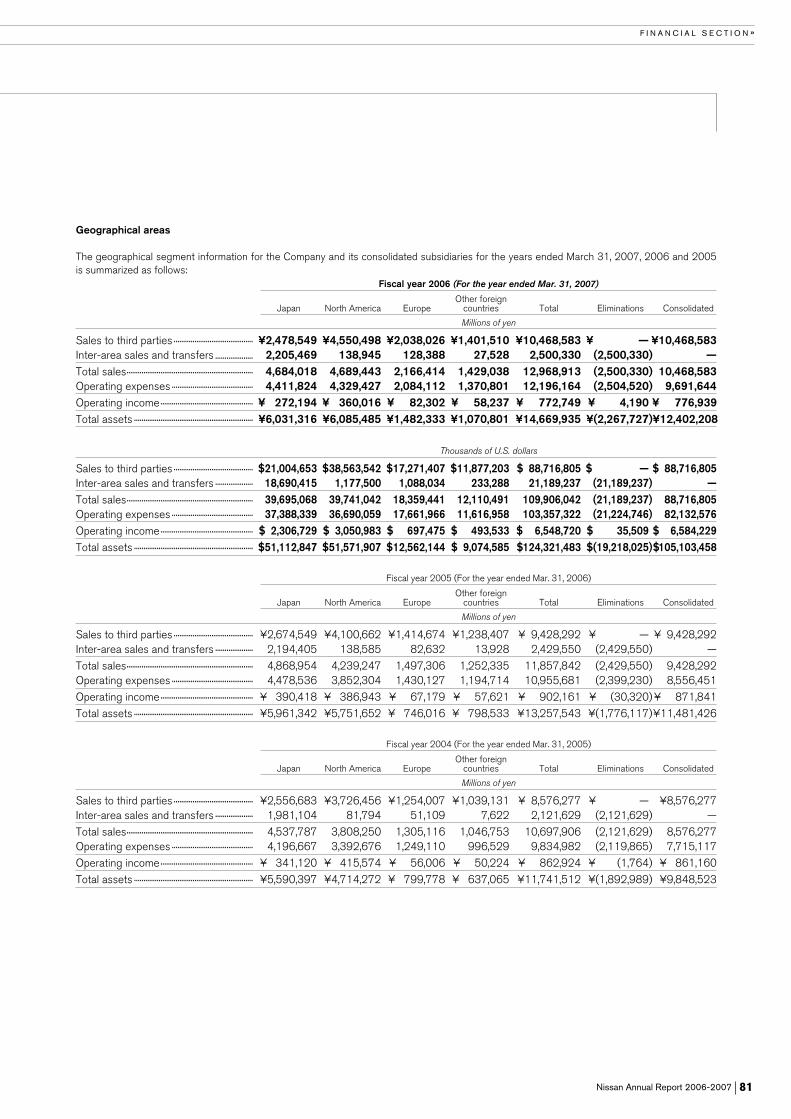
Geographical areas
The geographical segment information for the Company and its consolidated subsidiaries for the years ended March 31, 2007, 2006 and 2005is summarized as follows:
Fiscal year 2006 (For the year ended Mar. 31, 2007)
Other foreign Japan North America Europe countries Total Eliminations Consolidated
Millions of yen
Sales to third parties .......................................... ¥2,478,549 ¥4,550,498 ¥2,038,026 ¥1,401,510 ¥10,468,583 ¥ — ¥10,468,583 Inter-area sales and transfers .................... 2,205,469 138,945 128,388 27,528 2,500,330 (2,500,330) —Total sales................................................................... 4,684,018 4,689,443 2,166,414 1,429,038 12,968,913 (2,500,330) 10,468,583Operating expenses ........................................... 4,411,824 4,329,427 2,084,112 1,370,801 12,196,164 (2,504,520) 9,691,644Operating income................................................. ¥ 272,194 ¥ 360,016 ¥ 82,302 ¥ 58,237 ¥ 772,749 ¥ 4,190 ¥ 776,939 Total assets ............................................................... ¥6,031,316 ¥6,085,485 ¥1,482,333 ¥1,070,801 ¥14,669,935 ¥(2,267,727)¥12,402,208
Thousands of U.S. dollars
Sales to third parties .......................................... $21,004,653 $38,563,542 $17,271,407 $11,877,203 $ 88,716,805 $ — $ 88,716,805Inter-area sales and transfers .................... 18,690,415 1,177,500 1,088,034 233,288 21,189,237 (21,189,237) —Total sales................................................................... 39,695,068 39,741,042 18,359,441 12,110,491 109,906,042 (21,189,237) 88,716,805 Operating expenses ........................................... 37,388,339 36,690,059 17,661,966 11,616,958 103,357,322 (21,224,746) 82,132,576 Operating income................................................. $ 2,306,729 $ 3,050,983 $ 697,475 $ 493,533 $ 6,548,720 $ 35,509 $ 6,584,229Total assets ............................................................... $51,112,847 $51,571,907 $12,562,144 $ 9,074,585 $124,321,483 $(19,218,025)$105,103,458
Fiscal year 2005 (For the year ended Mar. 31, 2006)
Other foreign Japan North America Europe countries Total Eliminations Consolidated
Millions of yen
Sales to third parties .......................................... ¥2,674,549 ¥4,100,662 ¥1,414,674 ¥1,238,407 ¥ 9,428,292 ¥ — ¥ 9,428,292 Inter-area sales and transfers .................... 2,194,405 138,585 82,632 13,928 2,429,550 (2,429,550) —
Total sales................................................................... 4,868,954 4,239,247 1,497,306 1,252,335 11,857,842 (2,429,550) 9,428,292Operating expenses ........................................... 4,478,536 3,852,304 1,430,127 1,194,714 10,955,681 (2,399,230) 8,556,451
Operating income................................................. ¥ 390,418 ¥ 386,943 ¥ 67,179 ¥ 57,621 ¥ 902,161 ¥ (30,320) ¥ 871,841
Total assets ............................................................... ¥5,961,342 ¥5,751,652 ¥ 746,016 ¥ 798,533 ¥13,257,543 ¥(1,776,117)¥11,481,426
Fiscal year 2004 (For the year ended Mar. 31, 2005)
Other foreign Japan North America Europe countries Total Eliminations Consolidated
Millions of yen
Sales to third parties .......................................... ¥2,556,683 ¥3,726,456 ¥1,254,007 ¥1,039,131 ¥ 8,576,277 ¥ — ¥8,576,277Inter-area sales and transfers .................... 1,981,104 81,794 51,109 7,622 2,121,629 (2,121,629) —
Total sales................................................................... 4,537,787 3,808,250 1,305,116 1,046,753 10,697,906 (2,121,629) 8,576,277Operating expenses ........................................... 4,196,667 3,392,676 1,249,110 996,529 9,834,982 (2,119,865) 7,715,117
Operating income................................................. ¥ 341,120 ¥ 415,574 ¥ 56,006 ¥ 50,224 ¥ 862,924 ¥ (1,764) ¥ 861,160
Total assets ............................................................... ¥5,590,397 ¥4,714,272 ¥ 799,778 ¥ 637,065 ¥11,741,512 ¥(1,892,989) ¥9,848,523
Nissan Annual Report 2006-2007 81
F I N A N C I A L S E C T I O N »

» F I N A N C I A L S E C T I O N
Nissan Annual Report 2006-200782
a) As described in Note 2 (b), effective April 1, 2005, the Company and its domestic consolidated subsidiaries adopted a new accountingstandard for the impairment of fixed assets. The effect of this change was to decrease total assets in the “Japan”segment by ¥26,827 millionas of March 31, 2006 as compared with the corresponding amounts which would have been recorded if the previous method had beenfollowed.
b) As described in Note 2 (c), effective April 1, 2006, the Company adopted a new accounting standard for share-based payment and relatedimplementation guidance. The effect of this change was to decrease operating income of Japan segment by ¥1,037 million ($8,788thousand) for the year ended March 31, 2007.
c) As described in Note 2 (e), effective the year ended March 31, 2007, 22 consolidated subsidiaries have been consolidated by using theirfinancial statements as of the parent's fiscal year end prepared solely for consolidated purposes instead of those as of their respective fiscalyear end. In addition, during fiscal year 2006, 33 consolidated subsidiaries have changed their fiscal year end to March 31. The effect of thischange was to increase net sales of the Japan, North America, Europe segment and Other segments and increase the elimination of inter-group net sales by ¥62,479 million ($529,483 thousand), ¥219,878 million ($1,863,373 thousand), ¥454,769 million ($3,853,975 thousand),¥87,087 million ($738,025 thousand) and ¥56,607 million ($479,720 thousand), respectively, for the year ended March 31, 2007. In addition,because of this change, operating income of the Japan, North America, Europe and Other segments increased by ¥1,586 million ($13,441thousand), ¥21,403 million ($181,381 thousand), ¥2,744 million ($23,254 thousand) and ¥210 million ($1,780 thousand), respectively, andoperating income of inter-group elimination decreased by ¥4,500 million ($38,136 thousand) for the year ended March 31, 2007.
Overseas sales
Overseas sales, which include export sales of the Company and its domestic consolidated subsidiaries and sales (other than exports to Japan) ofthe foreign consolidated subsidiaries, for the years ended March 31, 2007, 2006 and 2005 are summarized as follows:
Fiscal year 2006 (For the year ended Mar. 31, 2007)
Other foreign North America Europe countries Total
Millions of yen
Overseas sales.................................................................................................................................................... ¥4,410,531 ¥2,023,772 ¥1,829,617 ¥ 8,263,920Consolidated net sales................................................................................................................................. 10,468,583
Thousands of U.S. dollars
Overseas sales................................................................................................................................................ $37,377,381 $17,150,610 $15,505,229 $70,033,220 Consolidated net sales............................................................................................................................. 88,716,805 Overseas sales as a percentage of consolidated net sales ...................................... 42.1% 19.3% 17.5% 78.9%
Fiscal year 2005 (For the year ended Mar. 31, 2006)
Other foreign North America Europe countries Total
Millions of yen
Overseas sales.................................................................................................................................................... ¥4,014,475 ¥1,414,929 ¥1,655,630 ¥7,085,034Consolidated net sales................................................................................................................................. 9,428,292
Overseas sales as a percentage of consolidated net sales .......................................... 42.6% 15.0% 17.6% 75.2%
Fiscal year 2004 (For the year ended Mar. 31, 2005)
Other foreign North America Europe countries Total
Millions of yen
Overseas sales.................................................................................................................................................... ¥3,662,436 ¥1,269,204 ¥1,401,592 ¥6,333,232Consolidated net sales................................................................................................................................. 8,576,277
Overseas sales as a percentage of consolidated net sales .......................................... 42.7% 14.8% 16.3% 73.8%
a) As described in Note 2 (e), effective the year ended March 31, 2007, 22 consolidated subsidiaries have been consolidated by using theirfinancial statements as of the parent's fiscal year end prepared solely for consolidated purposes instead of those as of their respective fiscalyear end, and 33 consolidated subsidiaries have also changed their fiscal year end to March 31. The effect of this change was to increaseoverseas sales of North America by ¥177,178 million ($1,501,508 thousand), Europe by ¥402,598 million ($3,411,847 thousand) and otherforeign countries by ¥138,990 million ($1,177,881thousand).

F I N A N C I A L S E C T I O N »
Nissan Annual Report 2006-2007 83
22. SUBSEQUENT EVENT
The Company issued the following bonds in yen without collateral for working capital on June 19, 2007:
Thousands ofMillions of yen U.S. dollars
1.76% bonds in yen due 2012....................................................................................................................................................................................... ¥65,000 $550,847 1.95% bonds in yen due 2014....................................................................................................................................................................................... 35,000 296,610

The Board of DirectorsNissan Motor Co., Ltd.
We have audited the accompanying consolidated balance sheets of Nissan Motor Co., Ltd. and consolidated subsidiaries as ofMarch 31, 2007 and 2006, and the related consolidated statements of income and cash flows for each of the three years in theperiod ended March 31, 2007, changes in net assets for the year ended March 31, 2007 and shareholders’ equity for the yearsended March 31, 2006 and 2005, all expressed in yen. These financial statements are the responsibility of the Company’smanagement. Our responsibility is to express an opinion on these financial statements based on our audits.
We conducted our audits in accordance with auditing standards generally accepted in Japan. Those standards require that weplan and perform the audit to obtain reasonable assurance about whether the financial statements are free of materialmisstatement. An audit includes examining, on a test basis, evidence supporting the amounts and disclosures in the financialstatements. An audit also includes assessing the accounting principles used and significant estimates made by management,as well as evaluating the overall financial statement presentation. We believe that our audits provide a reasonable basis for ouropinion.
In our opinion, the financial statements referred to above present fairly, in all material respects, the consolidated financial positionof Nissan Motor Co., Ltd. and consolidated subsidiaries at March 31, 2007 and 2006, and the consolidated results of theiroperations and their cash flows for each of the three years in the period ended March 31, 2007 in conformity with accountingprinciples generally accepted in Japan.
Supplementary Information
(1) As described in Note 2(a) and (b), effective April 1, 2005, the Company and certain domestic consolidated subsidiarieschanged their method of accounting for forward exchange contracts and adopted a new accounting standard for theimpairment of fixed assets.
(2) As described in Note 2(d), effective April 1, 2006, the Company adopted a new accounting standard for presentation of netassets in the balance sheet.
(3) As described in Note 2(e), effective the year ended March 31, 2007, 22 consolidated subsidiaries have been consolidated byusing their financial statements as of the parent’s fiscal year end prepared solely for consolidated purposes instead of thoseas of their respective fiscal year end. In addition, 33 consolidated subsidiaries have changed their fiscal year end to March 31.
The U.S. dollar amounts in the accompanying consolidated financial statements with respect to the year ended March 31, 2007are presented solely for convenience. Our audit also included the translation of yen amounts into U.S. dollar amounts and, in ouropinion, such translation has been made on the basis described in Note 3.
June 20, 2007
REPORT OF INDEPENDENT AUDITORS
Nissan Annual Report 2006-200784
» F I N A N C I A L S E C T I O N
Certified Public AccountantsHibiya Kokusai Bldg.2-2-3, Uchisaiwai-choChiyoda-ku, Tokyo, Japan 100-0011C.P.O. Box 1196, Tokyo, Japan 100-8641
Tel : 03 3503 1100Fax: 03 3503 1197

Millions ofU.S. dollars (Note 1)
Millions of yen (except per(except per share amounts and number of employees) share amounts)
2006 2005 2004 2003 2002 2006For the years ended Mar. 31, 2007 Mar. 31, 2006 Mar. 31, 2005 Mar. 31, 2004 Mar. 31, 2003 Mar. 31, 2007
Net sales ¥3,608,934 ¥3,895,553 ¥3,718,720 ¥3,480,290 ¥3,419,068 $30,584
Operating income 185,561 254,159 231,764 245,836 316,059 1,573
Net income 79,481 240,593 102,415 80,713 72,869 674
Net income per share (Note 2) 18.01 54.88 23.24 18.15 16.09 0.15
Cash dividends paid (Note 3, 4) 34.00 29.00 24.00 19.00 14.00 0.29
Net assets (Note 5) ¥1,775,413 — — — — $15,046
Shareholders' equity (Note 5) — ¥1,827,030 ¥1,685,893 ¥1,709,705 ¥1,798,716 —
Total assets 3,804,369 3,845,041 3,981,914 4,055,579 3,933,993 32,240
Long-term debt 417,220 508,463 489,151 653,392 902,118 3,536
Depreciation and amortization 133,493 127,543 115,180 102,107 56,760 1,131
Number of employees 32,489 32,180 32,177 31,389 31,128
Notes: 1. Unless indicated otherwise, all dollar figures herein refer to U.S. currency. Yen amounts have been translated into U.S. dollars, for convenienceonly, at ¥118=$1, the approximate exchange rate on March 31, 2007.
2. Net income per share amounts are based on the weighted average number of shares of common stock outstanding during each year.Figures for net income per share are in exact yen and U.S. dollars.Number of shares outstanding as of March 31, 2007: 4,520,715,112
3. Cash dividends paid represent the amounts proposed by the board of Directors as applicable to the respective years, together with the interimcash dividends paid.
4. Cash dividends applicable to fiscal year 2006 is ¥34 per share.5. Effective April 1, 2006, the Company adopted a new accounting standard for presentation of net assets in the balance sheet and related
implementation guidance. Under the new accounting standard, net assets represent aggregate of previous shareholders' equity and sharesubscription rights.
NON-CONSOLIDATED FIVE-YEAR SUMMARY
Nissan Motor Co., Ltd. Fiscal years 2006, 2005, 2004, 2003 and 2002
Nissan Annual Report 2006-2007 85
F I N A N C I A L S E C T I O N »

» C O R P O R A T E D A T A
Consolidated subsidiaries As of Mar. 31, 2007
The company’sCapital share-
Subsidiary Location Principal business (millions) holding*(%)
Japan
Nissan Shatai Co., Ltd. Hiratsuka, Kanagawa Manufacture and sales of automobiles and parts ¥7,905 43.09
Aichi Machine Industry Co., Ltd. Nagoya, Aichi Manufacture and sales of automotive parts ¥8,518 41.47
JATCO Ltd. Fuji, Shizuoka Manufacture and sales of automotive parts ¥29,935 74.96
Nissan Kohki Co., Ltd. Samukawa, Kanagawa Manufacture and sales of automotive parts ¥2,020 97.73
Calsonic Kansei Corporation Tokyo Manufacture and sales of automotive parts ¥41,455 41.47
Nissan Motor Car Carrier Co., Ltd. Tokyo International automobile transport ¥640 60.00
Nissan Trading Co., Ltd. Yokohama, Kanagawa Import and export of automobiles, parts, etc. ¥320 100.00
Nissan Financial Services Co., Ltd. Chiba, Chiba Automobile financing and leasing ¥16,388 100.00
Autech Japan, Inc. Chigasaki, Kanagawa Development, manufacture and sales of ¥480 100.00limited-edition automobiles
Nissan Network Holdings Corporation Tokyo Real estate sales, purchase and leasing ¥1,510 100.00
Nissan Finance Co., Ltd. Tokyo Finance and accounting support ¥2,491 100.00
Aichi Nissan Motor Co., Ltd. Nagoya, Aichi Sales of automobiles and parts ¥90 100.00
Nissan Tokuhan Co., Ltd. Tokyo Sales of automobiles and parts ¥480 100.00
Nissan Prince Tokyo Motor Sales Tokyo Sales of automobiles and parts ¥95 100.00Co., Ltd.
Nissan Chuo Parts Sales Co., Ltd. Yokohama, Kanagawa Sales of automobiles and repair parts ¥545 80.61
US
Nissan North America, Inc. Nashville, Tennessee Management of North American subsidiaries, $1,792 100.00manufacture and sales of automobiles and parts
Nissan Motor Acceptance Corporation Nashville, Tennessee Finance of wholesale and retail automobile sales $500 100.00in US
Nissan Technical Center Farmington Hills, Research and development, testing $16 100.00North America, Inc. Michigan
Nissan Motor Insurance Corporation Honolulu, Hawaii Casualty insurance $10 100.00
Nissan Forklift Co., North America Marengo, Illinois Manufacture and sales of forklifts and parts $34 100.00
Canada
Nissan Canada, Inc. Mississauga, Ontario Sales of automobiles and parts CAN$68 100.00
Mexico
Nissan Mexicana, S.A. de C.V. Mexico D.F. Manufacture and sales of automobiles and parts P17,056 100.00
INFORMATION ON SUBSIDIARIES AND AFFILIATES
Nissan Annual Report 2006-200786
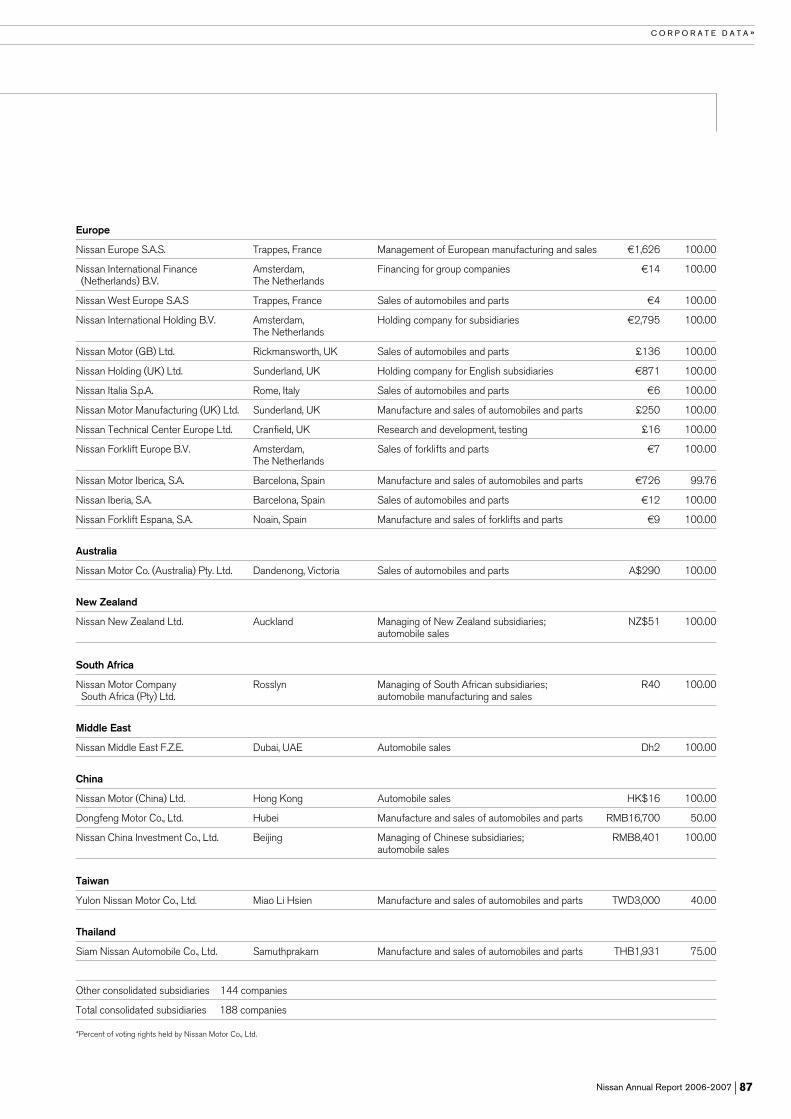
Europe
Nissan Europe S.A.S. Trappes, France Management of European manufacturing and sales €1,626 100.00
Nissan International Finance Amsterdam, Financing for group companies €14 100.00(Netherlands) B.V. The Netherlands
Nissan West Europe S.A.S Trappes, France Sales of automobiles and parts €4 100.00
Nissan International Holding B.V. Amsterdam, Holding company for subsidiaries €2,795 100.00The Netherlands
Nissan Motor (GB) Ltd. Rickmansworth, UK Sales of automobiles and parts £136 100.00
Nissan Holding (UK) Ltd. Sunderland, UK Holding company for English subsidiaries €871 100.00
Nissan Italia S.p.A. Rome, Italy Sales of automobiles and parts €6 100.00
Nissan Motor Manufacturing (UK) Ltd. Sunderland, UK Manufacture and sales of automobiles and parts £250 100.00
Nissan Technical Center Europe Ltd. Cranfield, UK Research and development, testing £16 100.00
Nissan Forklift Europe B.V. Amsterdam, Sales of forklifts and parts €7 100.00The Netherlands
Nissan Motor Iberica, S.A. Barcelona, Spain Manufacture and sales of automobiles and parts €726 99.76
Nissan Iberia, S.A. Barcelona, Spain Sales of automobiles and parts €12 100.00
Nissan Forklift Espana, S.A. Noain, Spain Manufacture and sales of forklifts and parts €9 100.00
Australia
Nissan Motor Co. (Australia) Pty. Ltd. Dandenong, Victoria Sales of automobiles and parts A$290 100.00
New Zealand
Nissan New Zealand Ltd. Auckland Managing of New Zealand subsidiaries; NZ$51 100.00automobile sales
South Africa
Nissan Motor Company Rosslyn Managing of South African subsidiaries; R40 100.00South Africa (Pty) Ltd. automobile manufacturing and sales
Middle East
Nissan Middle East F.Z.E. Dubai, UAE Automobile sales Dh2 100.00
China
Nissan Motor (China) Ltd. Hong Kong Automobile sales HK$16 100.00
Dongfeng Motor Co., Ltd. Hubei Manufacture and sales of automobiles and parts RMB16,700 50.00
Nissan China Investment Co., Ltd. Beijing Managing of Chinese subsidiaries; RMB8,401 100.00automobile sales
Taiwan
Yulon Nissan Motor Co., Ltd. Miao Li Hsien Manufacture and sales of automobiles and parts TWD3,000 40.00
Thailand
Siam Nissan Automobile Co., Ltd. Samuthprakarn Manufacture and sales of automobiles and parts THB1,931 75.00
Other consolidated subsidiaries 144 companies
Total consolidated subsidiaries 188 companies
*Percent of voting rights held by Nissan Motor Co., Ltd.
Nissan Annual Report 2006-2007 87
C O R P O R A T E D A T A »

» C O R P O R A T E D A T A
Subsidiaries and affiliates accounted for by the equity method As of Mar. 31, 2007
The company’sCapital share-
Subsidiary and affiliate Location Principal business (millions) holdings*(%)
Japan
Kinugawa Rubber Industrial Co., Ltd. Chiba, Chiba Manufacture and sales of automotive parts ¥5,655 20.28
France
Renault Billancourt Manufacture and sales of automobiles and parts €1,086 15.42
Other subsidiaries and affiliates accounted for by the equity method 45 companies
Total subsidiaries and affiliates accounted for by the equity method 47 companies
*Percent of voting rights held by Nissan Motor Co., Ltd.
Nissan Annual Report 2006-200788

CORPORATE OFFICERS
Nissan Annual Report 2006-2007 89
C O R P O R A T E D A T A »
Chief Executive OfficerCarlos GhosnGlobal Communications, CSR and IRGlobal Internal AuditTreasury
Chief Operating OfficerToshiyuki ShigaJapan Operations (MC-J)Human Resources
Executive Vice PresidentItaru KoedaMC-DealerDomestic Network ManagementAdministration for AFLs (MC-AFL)External and Government AffairsIntellectual Asset ManagementIndustrial MachineryMarine
Executive Vice PresidentHiroto SaikawaAmerican Operations (MC-America & MC-US)Purchasing
Executive Vice PresidentMitsuhiko YamashitaResearch and DevelopmentTCSX (Total Customer Satisfaction Function)
Executive Vice PresidentCarlos TavaresCorporate PlanningProduct PlanningMarket IntelligenceBrand ManagementDesignProgram ManagementLCV BusinessInfiniti BusinessControl
Executive Vice PresidentHidetoshi ImazuEuropean Operations (MC-E)ManufacturingSCM
Vice ChairmanTadao Takahashi
External and Government AffairsIntellectual Asset Management
Senior Vice PresidentsShiro Nakamura
Kazuhiko Toida
Kimiyasu Nakamura
Junichi Endo
Hitoshi Kawaguchi
Minoru Shinohara
Yo Usuba
Shigeo Shingyoji
Yoshiaki Watanabe
Colin Dodge
Kazumasa Katoh
Philippe Klein
Toshiharu Sakai
Corporate Vice PresidentsAsako Hoshino
Akira Kaetsu
Akira Sato
Toshio Aoki
Yasuaki Hashimoto
Shoichi Miyatani
Keiichi Murata
Shuichi Otani
Simon Sproule
Celso Guiotoko
Shigeaki Kato
Haruyoshi Kumura
Akihiro Otomo
Andy Palmer
Emmanuel Delay
Akihiro Ishiwatari
Thomas Lane
Gilles Normand
Atsushi Shizuta
Joji Tagawa
Thierry Viadieu
Yasuhiro Yamauchi
Toshifumi Hirai
Atsushi Hirose
Takao Katagiri
Mark McNabb
Masaaki Nishizawa
FellowKimio Tomita
(As of June 20, 2007)
INFORMATION
Nissan Annual Report 2006-200790
» C O R P O R A T E D A T A
Nissan Motor Co., Ltd. 17-1, Ginza 6-chome, Chuo-ku Tokyo 104-8023, Japan
Investor RelationsGlobal Communications and CSR DivisionTel: 81 (0)3-5565-2334Fax: 81 (0)3-3546-2669
Corporate CommunicationsGlobal Communications and CSR Division Tel: 81 (0)3-5565-2141Fax: 81 (0)3-3546-2669
Corporate Information Websitehttp://www.nissan-global.com/
Investor Relations Websitehttp://www.nissan-global.com/EN/IR/
FOR FURTHER INFORMATION, PLEASE CONTACT


![BMC Public Health - COnnecting REpositories · · 2017-04-27This Provisional PDF corresponds to the article as it appeared upon acceptance. Fully formatted ... [5]. Walking ...](https://static.fdocuments.in/doc/165x107/5ad5eb107f8b9a5c638daf96/bmc-public-health-connecting-repositories-provisional-pdf-corresponds-to-the-article.jpg)