ANNUAL REPORT 2004 IMPALA PLATINUM HOLDINGS LIMITED
157
ANNUAL REPORT 2004 IMPALA PLATINUM HOLDINGS LIMITED
Transcript of ANNUAL REPORT 2004 IMPALA PLATINUM HOLDINGS LIMITED

ANNUAL REPORT 2004
IMPALA PLATINUM HOLDINGS LIMITED
W W W . I M P L A T S . C O . Z A
IMPALA PLATINUM
HOLDINGS LIMITED ANNUAL REPORT 2004

This annual report covers the period 1 July 2003 to 30 June 2004. Information has beenprovided for comparative purposes for five years (FY2000 to FY2004). Additional statisticsgoing back to FY1997 are provided on the company’s website at www.implats.co.za.Information relating to the market has been provided per calendar year.
The report has been prepared in accordance with South African Statements of GenerallyAccepted Accounting Practice, International Financial Reporting Standards and in themanner required by the South African Companies Act and in line with the regulations of theJSE Securities Exchange South Africa (JSE). It has also taken into account the guidelines ofthe King Report 2002, the JSE Social Responsibility Index and the Global Reporting Initiative(GRI), particularly those applicable to Implats’ direct economic impact, environmental andhuman capital performance.
No significant changes have occurred in terms of the size, structure and operation of thegroup during the year under review,other than the sale of 83.2% stake in Barplats InvestmentsLimited. The transaction for the sale of a significant strategic interest (Implats’ stake inWestern Platinum Limited and Eastern Platinum Limited) is nearing finalisation and isreported on fully in this document.
Reporting of reserves and resources is in accordance with each company’s listingrequirements. Mineral Reserves and Mineral Resources for Implats’ South African operationsare reported in accordance with the principles and guidelines of the South African Code forReporting of Minerals Reserves and Mineral Resources (SAMREC Code). Both Zimplats andMimosa report Ore Reserves and Mineral Resources in accordance with the AustralasianCode for Reporting of Mineral Resources and Ore Reserves (JORC Code).Competent personsdefined by both the SAMREC and JORC codes have prepared, reviewed and signed off theMineral Reserves and Mineral Resources reported in this publication.
This annual report should be read in conjunction with the group’s Corporate ResponsibilityReport 2004. In the interests of good disclosure and to improve communication withshareholders, Implats publishes:
• The 2004 Annual Report in August 2004, coinciding with the release of the results for theyear-ended June 2004. The annual report is also available in interactive HTML anddownloadable pdf versions on the company’s website.
• The Corporate Responsibility Report in October 2004.This report will be posted to thoseshareholders who elect to receive it (response form on page 153 of this report). It willbe available on the company’s website and from the contacts detailed on page 152 ofthis report.
The statutory portions of this report on pages 84 to 143 have been audited by independentauditors PricewaterhouseCoopers. In addition, PricewaterhouseCoopers provided guidancein the development of the non-financial sections of both the Annual and CorporateResponsibility reports, drawing on, inter alia, its proprietary reporting framework,ValueReportingTM, and internationally recognized principles of reporting. Both reports areprepared by the company and are reviewed by the board.
Additional information on the group may be found on the company’s website or obtainedfrom the contact persons listed on page 152 of this report.
Produced by Russell and Associates
Report profile
Dollar, or $, refers to US Dollars unless specified. Numbers given in both SA Rands and Dollars have been
converted at the average exchange rate for the year under review or at year-end rates when relating to closing
balances.
Safety performance (LTIFR) improves by 15%
Gross platinum production up by 17% to 1.96 Moz
Impala Platinum production at 1.09 Moz platinum –highest in a decade
Sales revenue maintained at R11.81 billion
Gross margin of 36%
Profit down 13% to R2.96 billion, largely due toRand appreciation
Unit cost per platinum ounce up by 4.1%
Year at a glance
FY2004 FY2003 % changeFinancialSales (Rm) 11 809 11 807 0Gross profit (Rm) 4 260 5 284 (19)Profit before tax (Rm) 4 122 5 060 (19)Profit (Rm) 2 963 3 415 (13)Headline earnings per share (cps) 3 966 5 140 (23)Dividends per share (proposed basis) (cps) 2 100 2 650 (21)Cash net of short-term debt (Rm) 636 2 120 (70)Sales revenue per platinum ounce sold ($/oz) 1 116 935 19Sales revenue per platinum ounce sold (R/oz) 7 678 8 471 (9) Average Rand exchange rate achieved (R/$) 6.88 9.06 (24)ProductionTotalRefined platinum production (000 oz) 1 961 1 673 17Refined PGM production (000 oz) 3 725 3 162 18ImpalaRefined platinum production (000 oz) 1 090 1 040 5Refined PGM production (000 oz) 1 976 1 924 3
1
IMPLATS ANNUAL REPORT 2004
Key performance highlights (SA Rand)

2
IMPLATS ANNUAL REPORT 2004
Safety performance (LTIFR) improves by 15%
Gross platinum production up by 17% to 1.96 Moz
Impala Platinum production at 1.09 Moz platinum –highest in a decade
Sales revenue increased by 32% to $1.72 billion
Gross margin of 36%
Profit up 15% to $428 million
Unit cost per platinum ounce rose by 37%,reflecting impact of Rand appreciation
Key performance highlights (US Dollar)
Year at a glance
FY2004 FY2003 % changeFinancialSales ($m) 1 716 1 303 32Gross profit ($m) 616 580 6Profit before tax ($m) 596 555 7Profit ($m) 428 373 15Headline earnings per share (cps) 571 561 2Dividends per share (proposed basis) (cps) 306 294 4Cash net of short-term debt 103 282 (63)Sales revenue per platinum ounce sold ($/oz) 1 116 935 19ProductionTotalRefined platinum production (000 oz) 1 961 1 673 17Refined PGM production (000 oz) 3 725 3 162 18ImpalaRefined platinum production (000 oz) 1 090 1 040 5Refined PGM production (000 oz) 1 976 1 924 3

OVERVIEW
REVIEW OF THE YEAR
ACCOUNTABILITY
ANNUAL FINANCIALSTATEMENTS ANDSHAREHOLDERS’INFORMATION
Corporate profile 4
Chairman’s letter to shareholders 7
Our scorecard and ojectives 9
Chief Executive’s review 11
Group value-added statement 17
Responding to the Mining Charter 18
Statistics 20
Corporate governance 25
Executives and senior management 33
Board and management 34
Financial review 37
Market review 41
Review of operations and interests 45
Impala Platinum 45
Marula Platinum 52
Zimplats 55
Mimosa Platinum 59
Impala Refining Services 62
Strategic holdings 64
Exploration, mineral reserves and mineral resources 67
Glossary of terms 78
Contents of the annual financial statements 81
Approval of annual financial statements 82
Report of the independent auditors 83
Annual financial statements 84
Notice of meeting, proxy and voting instruction form 144
Shareholders’ information 151
Contact details and administration 152
Corporate Responsibility report request form 153
3
IMPLATS ANNUAL REPORT 2004
Contents

Implats
Mine to marketoperations
Impala RefiningServices (IRS) Strategic holdings
ImpalaPlatinum
MarulaPlatinum
Zimplats
Mimosa
AquariusPlatinum (SA)
Lonplats*
Two Rivers
100%
100%†
83%
50%
27%
25%
45%
100%
Toll refining
Concentrateofftake
agreements
† 20% to be allocated to BEE ownership
* Implats is currently finalising the transactionfor the sale of this asset
Impala Platinum Holdings Limited (Implats) produced 1.96 Moz of platinum and 3.73 Mozof platinum group metals (PGMs) in FY2004, making it one of the most significant PGMproducers globally.The group’s operations on the Bushveld Complex in South Africa and theGreat Dyke in Zimbabwe give it an attributable reserve and resource base of 247 Moz ofplatinum. Implats also has offshore exploration projects in Australia, Brazil and the UnitedStates.
The company’s cost-efficient expansion and joint venture programmes have been devisedto ensure platinum production of 2 Moz of platinum by 2006 (3.8 Moz PGMs). There ispotential for this to grow to 2.3 Moz of platinum (4.5 Moz PGMs) by 2008.
Implats employs approximately 31 600 people across its operations and is one of the mostefficient and lowest cost platinum producers in the world.
Implats’primary listing (IMP) is on the JSE Securities Exchange South Africa with a secondarylisting (IPLA) on the London Stock Exchange. The company also has a sponsored level1 ADR programme (IMPUY) in the United States.
4
IMPLATS ANNUAL REPORT 2004
Corporate profile
Corporate structure
Pt 67% Rh 6%
Pd 9% Ni 11%
Other 7%
% contribution to salesby metal (FY2004)
Distribution of employeesincluding contractors (FY2004)
Impala 87% Zimplats 5%
Marula 3% Mimosa 5%
OV
ERV
IEW
CO
RPO
RATE
PRO
FILE
OVERVIEW
5
IMPLATS ANNUAL REPORT 2004
Rustenburg
Johannesburg
ZIMBABWE
BOTSWANA
SOUTH AFRICA
Zimplats
Mimosa PlatinumMine
Harare
Bulawayo
Great Dyke
BushveldComplex
MarulaPlatinum
Impala Refineries
Impala Platinum
Kroondal
MarikanaUSA
Brazil
Australia
Franconia(Duluth)
Niquelandia Catete
Three Kings
OperationsStrategic interestsExploration projects
Two Rivers
Everest South
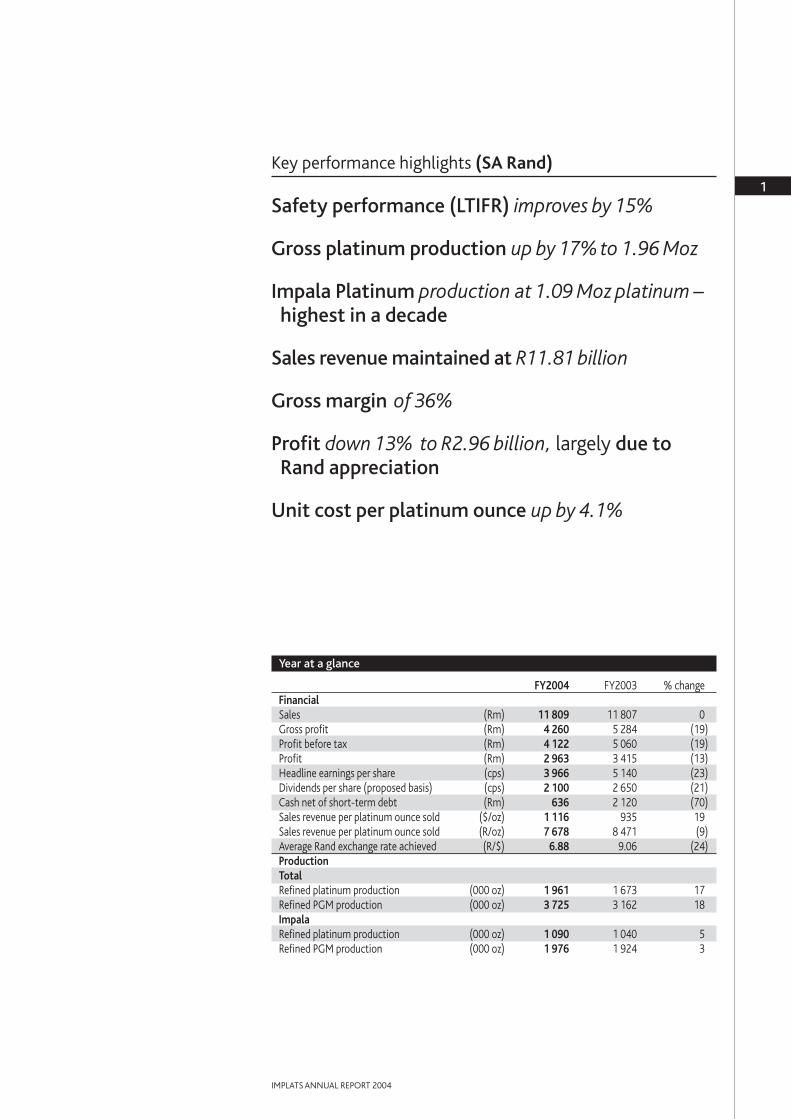
To be the world’s best platinum producing company, delivering superior returnsto shareholders relative to our peers
The Implats values are:• Safeguarding the health and safety of our employees, and caring for the environment in
which we operate• Acting with integrity and openness in all that we do and fostering a workplace in which
honest and open communication thrives• Being a responsible employer,developing people to the best of their abilities and fostering
a culture of mutual respect amongst employees• Promoting and rewarding teamwork, innovation, continuous improvement and the
application of best practice• Being accountable and responsible for our actions as a company and as individuals• Continuously to improve our performance and create sustainable value• Being a good corporate citizen to the communities in which we live and work
Location of operations, strategic interests and exploration projects
Vision
Values
OV
ERV
IEW
CO
RPO
RATE
PRO
FILE

Creating a meaningful stake forBEE partners and the community– mining entrepreneur, BridgetteRadebe, CEO of Mmakau Mining,chosen as one of Implats’ partnersin the newly developed MarulaPlatinum mine.At inception, Implatsallocated a 20% stake in theoperation for BEE interests. Of this,10% has been allocated to MmakauMining, with the remaining 10% tobe shared equally between a localcommunity trust and local businesspeople.

OV
ERV
IEW
C
HA
IRM
AN
’S L
ETTE
R
Dear shareholder
During the year under review, significantproduction milestones and high platinumprices were overshadowed by the effectsof the continued strength of the Rand,which resulted in earnings decliningto R2 963 million ($428 million).Increasingly, the strong Rand is broadlyrecognized as seriously hampering theeconomic growth of the country. Inprovinces which contain PGM orebodiesand where there has been vigorousdevelopment in the platinum miningsector, GDP growth well above thenational figure has been shown. Theincreasing pressure of the strong Rand hasmeant that many of the projects in theseprovinces are now being reviewed orslowed. The Chamber of Mines of SouthAfrica has estimated that some R6 billionwas lost in government taxes from themining industry alone in 2003. Thecountry needs a broader based macro-economic overview than prevails atpresent.
The industry’s preoccupation with newlegislation continues. The Minerals andPetroleum Resources Development Actcame into effect on 1 May 2004. Stateroyalties will now be imposed from 2009in terms of the Royalties Bill. Following thediscussions leading to the imposition ofthose royalties, it is to be hoped that eagerinvestment will be solicited by setting acompetitive level based on earnings.
Implats’ plans to meet both the letter andspirit of the draft Mining Charter are wellunderway and are discussed in furtherdetail on pages 18 and 19 of this report.The conclusion of the Lonplats/Incwalatransaction should see ownership creditsof some 9% allocated to Implats and,together with the current 1.5% holding ofRoyal Bafokeng Resources (Pty) Limited,only approximately 4% to 5% ownershipneeds to be secured at the Impala leasearea level over the next five years. Webelieve that we are well placed to achievethis and also to accommodate the further11% required by 2014.
We have continued to develop a compre-hensive response to all facets of the newmining legislation and are cognisant of, andprepared for, all elements of the Charter,such as skills development, employmentequity, beneficiation and affirmativeprocurement.
The sale of our stake in Barplats and theproposed sale of our 27.1% interest inLonplats have ensured that the group hasmade good progress on the corporate frontrealizing value for shareholders in line withour stated objectives. The Lonplats sale inparticular will result in a significant cashinjection into Implats that will more thancomfortably provide for the capital expen-diture requirements at Impala, Marula andthe Zimbabwean operations over the nextfew years. Implats is committed to returningthe benefits of any excess cash to share-holders, and several options are beingreviewed.
Although Implats remains very positiveabout the potential of the Zimbabweanoperations and is allocating capital there,both in the immediate future and themedium to long term, the group remainscautious in its approach.Every effort is beingmade to minimize any risk to shareholders,and we are extremely mindful of both theeconomic and moral dilemmas we face indoing business in Zimbabwe. That said, weare intent on maintaining our competitiveadvantage, having secured access to asubstantial portion of the Great Dyke,which is the only significant known,unexploited platinum orebody in the world.
Driving the decision-making process withinthe group is the Implats board, which hasbeen transformed markedly during the year.I extend a formal welcome to our new boardmembers, Lex van Vught, Sifiso Dabengwa,Thandi Orleyn, Dr Khotso Mokhele andDr Fred Roux. Their appointments come atan important time for our group and are inline with the broader process of trans-formation and the world-class levels ofcorporate governance to which we aspire.On the transformation front, an advisorycommittee reporting to the board has been
FY01 FY02 FY03
Implats – Gross platinumproduction (000oz)
FY00
1 1991 291
1 387
FY04
1 673
1 961
7
IMPLATS ANNUAL REPORT 2004
Chairman’s letter to shareholders
Peter Joubert, Chairman

OV
ERV
IEW
C
HA
IRM
AN
’S L
ETTE
R
formed with this particular responsibility.Insofar as corporate governance is con-cerned, not only are we committed tomeeting the requirements of King II,but alsothose practices that support an increasinglyinternationalized shareholder base.
Having made progress in concluding a rangeof corporate activities in the past few years,and having progressed our United Statesoffering to a level 1 sponsored AmericanDepositary Receipt (ADR) programme, wecontinue to explore the notion of a fullUnited States listing. Should our plansproceed as expected, shareholders couldexpect such a move to take place in the 2006financial year.
In conclusion, I extend my thanks to theboard for the leadership and dedication theyhave displayed during the year. I also extendthe board’s thanks to the CEO, KeithRumble,and his management team for theircontinued vision and efforts during the year.
It is with sadness that I have decided not tomake myself available for re-election to theImplats board as I am retiring from manysuch duties. It has been a privilege to be apart of the group for many years as it hastransformed itself from being what manyconsidered the underdog in the industry tothe investment of choice in the platinumsector. I take my leave knowing thatmanagement will continue to propel thegroup along the right path, supported by adiverse and strong board, under theleadership of Dr Fred Roux as a very ablechairman.
Peter JoubertChairman
27 August 2004
8
IMPLATS ANNUAL REPORT 2004
CHAIRMAN’S LETTER

50
100
150
200
250
300
Comparative performanceagainst HSBC Global MiningIndex and MSCI Free MarketIndex
Jul9
9
Jan0
0
Jul0
0
Jan0
1
Jul0
1
Jan0
2
Jul0
2
Jan0
3
Jul0
3
Jan0
4
Jul0
4
Implats HSBC
MSCI
9
IMPLATS ANNUAL REPORT 2004
OV
ERV
IEW
O
UR
SCO
REC
ARD
What we said in FY2003
Produce efficiently and responsibly, whileremaining in the lowest cost quartile in theindustry
Grow the business to 2 Moz of platinum by 2006
Deliver a superior stock market performance.
What we have achieved in FY2004
• 23% decrease in number of fatalities• 15% decrease in lost time injury
frequency rate• Gross operating margin of 36%• Group unit cost increase of 4.1%• Unit cost increase at Impala held to 5.0%
(as compared to an inflation rate of 5.0%)
• Mine-to-market production of 1.23 Mozplatinum, up by 8%
• With IRS production, refined platinumprocessed through Refineries of1.96 Moz (3.73 Moz PGMs)
• On track to produce 2 Moz in FY2006
• Delivery of shareholder value a keyelement of business plan
• Total shareholder return over the lastfive years of 33%
• Share price maintains its levels year-on-year – a 12-month high of R641
Objectives for FY2005
• 50% improvement in all safety indicators• Unit cost increase to be held to less than
rate of inflation and associated marginprotection
• Mine-to-market production of 1.29 Mozplatinum
• Formulate plans to increase productionto 2.3 Moz platinum, by FY2008
• Complete sale of stake in Lonplats • Consider listing in the USA
Our scorecard and objectives
Share price performance(R)
FY01 FY02 FY03 FY04100
200
300
400
500
600
700
800
FY00
Share price performance($)
FY01 FY02 FY03 FY0420
30
40
50
60
70
80
90
100
FY00
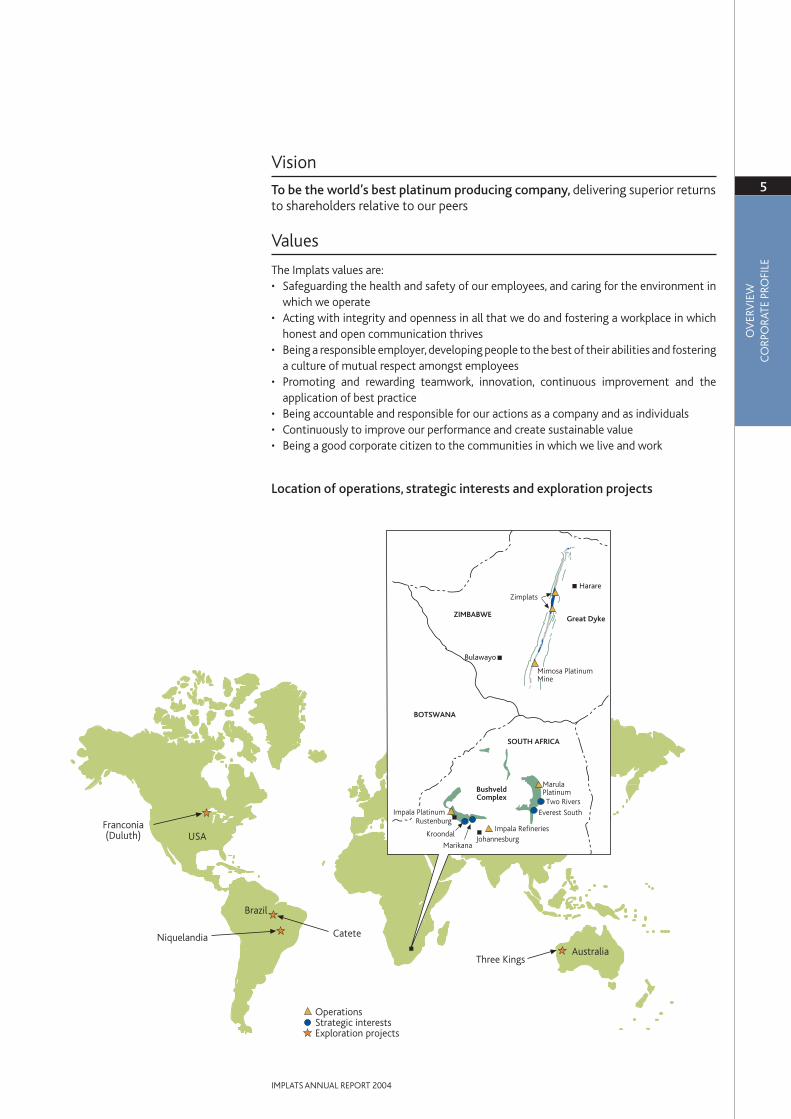
When we say that people are our greatest asset,we really mean it. Because we have not always hadthe Mineral Resources that our competitors have,we have had to tap into the resourcefulness of ourpeople – and in so doing we have ensured that oursare among the most efficient operations in theworld. Shadwick Bessitt, General Manager: Miningat Impala Platinum, has as one of his mostimportant tasks the motivation and leadership ofthe people who make things happen on the ground.

OV
ERV
IEW
C
HIE
F EX
ECU
TIV
E’S
REV
IEW
IntroductionA highlight of the year was undoubtedly the17% increase in platinum production to arecord level of 1.961 Moz, reflecting Implats’continued delivery against the targets that wehave set ourselves.This included 232 000 ozplatinum that was refined by Impala RefiningServices (IRS) as a once-off during therefurbishment of Lonplats’ smelter.
Comparative year-on-year results wereinfluenced by a number of factors,dominated by the strengthening of thelocal currency against the Dollar. Positivecontributions from higher sales volumes(R1 014 million) and Dollar metal prices(R2 582 million) were effectively negatedby the stronger local currency (negativeR3 594 million). Unit costs increased in linewith South African inflation – a creditableperformance. Cost of sales increased byR1 026 million, of which R700 millionrelated to the increased volumes and thebalance related to inflationary increases.The cumulative impact of these factors isthat gross profit declined by 19%.
R millionGross profit FY2003 5 284Positive volume growth 1 014Increase in metal prices 2 582Total 8 880Cost of sales increases (1 026)– Volume increases (700)– Inflation (326)Exchange rate impact (3 594)Gross profit FY2004 4 260
Contributions from investments in asso-ciated business (mainly Lonplats) weresimilarly affected by currency movements,and equity earnings from associates wereR397 million (55%) lower year-on-year.Theprofit on disposal from the sale of Barplats(R322 million) represents a positive con-tribution to earnings. After providing for tax,royalties and amortisation etc, profitdeclined by 13% to R2 963 million,compared to the previous year. In Dollarterms this represents a 15% increase to$428 million. Capital expenditure increasedby 2% to R1 822 million ($265 million).As a result, the board has declared a
final dividend of R16 per share which willresult in a total dividend payout of someR1 399 million ($204 million), equivalent toR21 per share ($3.06 per share).
The marketA number of factors supported the platinumprice during the period with the metaltrading between a low of $655/oz and a highof $937/oz in April 2004. These includedweak Dollar and equity markets, strongdemand in commodities in general,a signifi-cant increase in global speculative activityand the perception that supply may notkeep up with growing demand as a numberof expansion plans have been cut back.Implats’ average price received for platinumwas $773/oz, being an increase of 30% onthe previous year’s average received priceof $597/oz.
The palladium market was not as fortunate,as a combination of growing supply andstatic demand – which followed therunaway prices of the late 1990s/early2000s – saw the metal trading between$160/oz and $333/oz. The thin market forrhodium, the price of which has spiked inrecent months, belies the underlying poorfundamentals for the metal. This will keepprices under pressure.
Nickel, on the other hand, enjoyed a farhealthier year with supply lagging demandas the metal benefited not only from a strikeat a major producer, but also a significantincrease in demand from a burgeoningChinese economy.
Given that we produce a range of metals,weuse a basket price based on weighted pricesto monitor price performance. Implatsachieved an average basket price of $1 116for the year. Although this is an increase of19% on the previous year in Dollar terms,the average basket price in Rand terms wasR7 678/oz, a decrease of 9.4% on theprevious year.
Contribution to profitThe strategy to focus on mine-to-marketoperations continued and this was reflectedin a simplification of the group’s structure.
FY00 FY01 FY02 FY04
Revenue per platinum ounce sold(R/oz Pt)
5 786
10 145
9 489
7 678
FY03
8 471
FY00 FY01 FY02 FY04
Revenue per platinum ounce sold($/oz Pt)
904
1 321
934
1 116
FY03
935
11
IMPLATS ANNUAL REPORT 2004
Chief Executive’s Review
Keith Rumble, Chief Executive Officer

OV
ERV
IEW
C
HIE
F EX
ECU
TIV
E’S
REV
IEW
• During the year, the group’s mine-to-market operations (Impala Platinum,Marula Platinum, Zimplats and Mimosa)contributed about 66% of profit. Theseoperations together reported a margin of41%.
• IRS, which processes third partyconcentrates and undertakes toll-refining, contributed 13% to profit.Although IRS’s margins are in the regionof 15%, this operation is undertaken atvery little risk to the group and uses spareprocessing and refining capacity, therebyreducing the unit costs associated withthe mine-to-market operations.
• Contributions from strategic alliancesremained satisfactory – at 11%. Lonplatswas still accounted for during the year.
• The net impact of the consolidated lossfor Barplats and the profit on disposalcontributed 10% to profit for the year.
Safety and healthRegrettably, 10 people lost their lives as aresult of occupational accidents during theyear and we extend our condolences to thefamilies, friends and communities of thosewho died. More positively, the lost timeinjury frequency rate (LTIFR) reached anall-time low for the group of 4.80 permillion man hours worked, while thereportable injury frequency rate (RIFR) was2.75 per million man hours worked –another record.
The fall of ground safety campaign and theground control districts programme atImpala Platinum have played an importantpart in this achievement, and – with theprogrammes that we have in place acrossthe group – we are committed to achievingfurther significant improvements in the yearahead.Indeed,we have set ourselves a targetof improving all our safety statistics by 50%year-on-year.
Sustainable developmentIssues relating to safety and health, andsustainable development are dealt withbriefly in the Review of operations andinterests that follows on pages 45 to 63 ofthis report. In addition, a report producedin line with the Global Reporting Initiative
– the international guidelines forsustainable development reporting – willbe published by Implats duringOctober 2004.
We have endeavoured to integrate theprinciples of sustainable development intothe fundamentals of our business. Linemanagement is responsible for safety andhealth,environmental,community and socialissues, although specialist personnel are onhand as a resource to provide guidance andsupport when necessary. This is as true atboard and executive levels, as it is for allemployees.During the year, the values of thegroup (as set out on page 5) were reviewedand updated by a team representing all theoperations to ensure that the principlesembodied in these values are still valid.(The initial values were developed 10 yearsago through a process of employeeconsultation). The challenge remains one ofintegrating responsibility and accountabilityfor factors that have an economic, social andenvironmental impact with the traditionalfinancial and operational indicators againstwhich both investors and management are soused to gauging performance.
Operational overviewImplats had an excellent year from anoperational perspective. The year wascharacterized by record performance fromour mining operations in Rustenburg andZimbabwe, ably supported by improvedmetallurgical performance at ourconcentrators and refineries. In addition,Impala Refining Services (IRS) deliveredspectacular results although this did includethe significant contribution from theprocessing of Lonplats concentrate (whichhas now ceased).
The single operating lowlight was the slowermining ramp-up at our new mine onthe Eastern Bushveld, Marula Platinum.Thisissue is dealt with further in a Review ofoperations and interests on pages 45 to 66.
Specific operating achievements worthhighlighting are:
• Ex-mine platinum production for theImpala lease area (1.09 Moz), the highestlevel in a decade,Zimplats (84300oz) andMimosa (52 800 oz).
12
IMPLATS ANNUAL REPORT 2004
CHIEF EXECUTIVE’S REVIEW
Mine-to-marketoperations contributed
66% of profit
FY01 FY02 FY03
Implats – Fatal injury frequencyrate (FIFR) per million man hours
0.158
FY04
0.134
0.087
0.139
0.104
FY00
FY01 FY02 FY03
Implats – Lost time injuryfrequency rate (LTIFR) per millionman hours
8.43
FY04
7.90
12.64
5.65
4.80
FY00

• An improvement of 1.3% in metallurgicalrecoveries to 83.2% at Impala operations.
• A world-class performance at ourPrecious Metals Refinery, with no deteri-oration in cost performance, metalrecoveries and pipeline inventories,despite operating well above nameplatecapacity,and simultaneously undertakinga major expansion.
• Group unit costs were well containedwith resultant unit costs per platinumounce only increasing by 4.1% comparedto an increase of 5.0% in the SouthAfrican inflation rate (CPIX) over thesame period. The bulk of group costsrelate to wages at Impala wheretotal headcount was reduced by900 employees (3.2%). In spite of this,mining efficiencies disappointinglydecreased to 39m2/panel employee dueto a combination of shorter panel widths(for safety reasons) and the slower thanexpected roll-out of the programme toimprove drilling rates, primarily as aresult of resistance by some employeesto new work methods.
• High underlying wage pressures remainan issue of concern for the industry.A two-year wage agreement wasreached providing for an increase of9.5% from July 2003 in year one and anincrease of 1.5% above CPIX in year two.Should the result in the second year bean increase of less than 7.5% or morethan 9% either party has the right toreopen negotiations on wages only.With CPIX currently at 5%, this hasnecessitated re-opening negotiations forthe current year.
• Industrial relations issues remain chal-lenging with a number of work stoppageshaving taken place during the year atImpala and Zimplats.
StrategyImplats’focus is to remain a platinum-basedresources company. A key objective is toprovide superior returns to shareholders,relative to our peers.
An important part of our strategy is to focusour attention on those assets andoperations where we can add value, wherewe have a competitive advantage and wherewe have a strategic influence.We are com-mitted to ensuring that what we do can befully analysed and valued by our investors.
During the past year,two major transactionswere announced: the sale of Implats’ 27.1%holding in Western Platinum Limited andEastern Platinum Limited (collectivelyLonplats), and the sale of Barplats.
The Minister of Minerals and Energy,Ms Phumzile Mlambo-Ngcuka has indi-cated that, as presented, the Lonplatstransaction is in line with the requirementsof the new mining law. Although theDepartment of Minerals and Energy (DME)will only evaluate compliance with thelegislation when the parties formally applyfor conversion to new order mining rights,the Minister has acknowledged that,having both facilitated this transaction,Implats and Lonmin will be allocatedcredits proportional to the percentagesand ounces they have sold to their BEEpartners. We anticipate that in ImpalaPlatinum’s hands this will equate to creditsof 9%.
13
IMPLATS ANNUAL REPORT 2004
OV
ERV
IEW
C
HIE
F EX
ECU
TIV
E’S
REV
IEW
Implats’ focus is toremain a platinum-based
resources company
Impala Platinum 56%
Other IRS 26%
Zimplats 4%
Mimosa 1%
Barplats 1%
Lonplats 12%
Marula 0.1%
Percentage contribution togross platinum production
Platinum production
FY2004 FY2003 FY2004 FY2003(000 oz) Platinum Platinum PGMs PGMs
Impala Platinum 1 090 1 040 1 976 1 924Barplats 22 25 34 51Marula 5 11Zimplats 84 60 179 131Mimosa (50%) 27 12 51 24Mine-to-market 1 228 1 137 2 251 2 130Lonplats 232 159 492 277Other IRS 501 377 982 755Gross production 1 961 1 673 3 725 3 162
OV
ERV
IEW
C
HIE
F EX
ECU
TIV
E’S
REV
IEW
The board is satisfied that this transactionis in the group’s best stategic interestand that it has been concluded to thebenefit of shareholders. In addition to theempowerment credits, the purchase priceof $800 million represents a premium of8% on the implied market valuationof Lonplats at the time of the firstannouncement. This transaction enablesImplats to meet some of its obligations interms of the Mining Charter at a discountamounting to 1% of the purchase price.Thecash flowing through to Implats from thistransaction will be used to fund Implats’capital expenditure requirements, bothhere and in Zimbabwe. Any excess cashwill be returned to shareholders.
The Barplats transaction follows a decisionby the board to cease mining operations atthe Crocodile River mine when thisoperation defied all efforts towardsprofitability (reported on fully in last year’sAnnual Report), and subsequently, to sellthe operation for R389 million to theSalene Platinum Consortium. The transac-tion received the approval of the SouthAfrican competitions authorities in June2004 and the new owners took over fromthe beginning of July.
IRS has a long-term agreement in placewith the Crocodile River mine to processany concentrate that may be producedwhen this mine comes back into operation.The new owners have announced theirintention to re-open the mine.
Sustaining operationsImplats’ primary operation, ImpalaPlatinum, continues to be the mainstay ofthe group not only in a production sense,but also as a resource in terms of skillsand expertise and as a leader in terms ofresearch and development. Sustainingoperations at Impala at a level of 1.0 to1.1 Moz of platinum over the next 30 yearsand beyond is an important element of theImplats strategy.The decline developmentprogramme is now coming to fruition, withall five new declines scheduled to be inproduction within the next few years.
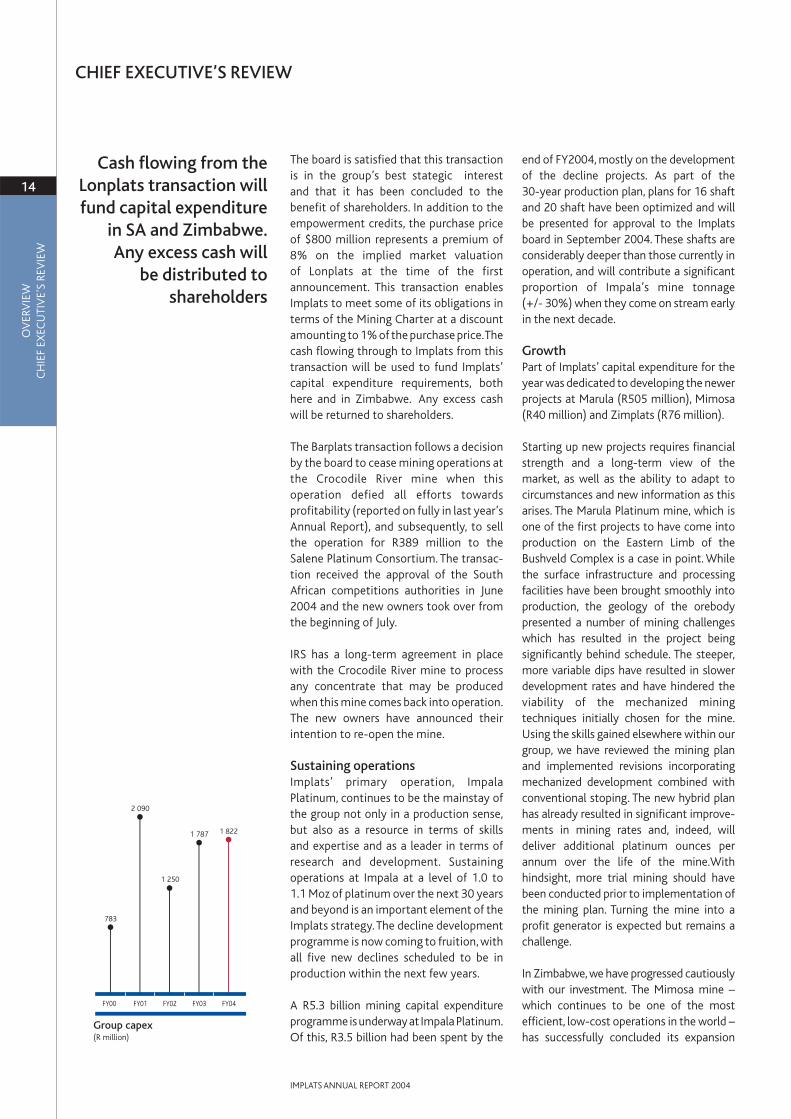
A R5.3 billion mining capital expenditureprogramme is underway at Impala Platinum.Of this, R3.5 billion had been spent by the
end of FY2004, mostly on the developmentof the decline projects. As part of the 30-year production plan, plans for 16 shaftand 20 shaft have been optimized and willbe presented for approval to the Implatsboard in September 2004. These shafts areconsiderably deeper than those currently inoperation, and will contribute a significantproportion of Impala’s mine tonnage (+/- 30%) when they come on stream earlyin the next decade.
GrowthPart of Implats’ capital expenditure for theyear was dedicated to developing the newerprojects at Marula (R505 million), Mimosa(R40 million) and Zimplats (R76 million).
Starting up new projects requires financialstrength and a long-term view of themarket, as well as the ability to adapt tocircumstances and new information as thisarises. The Marula Platinum mine, which isone of the first projects to have come intoproduction on the Eastern Limb of theBushveld Complex is a case in point. Whilethe surface infrastructure and processingfacilities have been brought smoothly intoproduction, the geology of the orebodypresented a number of mining challengeswhich has resulted in the project beingsignificantly behind schedule. The steeper,more variable dips have resulted in slowerdevelopment rates and have hindered theviability of the mechanized miningtechniques initially chosen for the mine.Using the skills gained elsewhere within ourgroup, we have reviewed the mining planand implemented revisions incorporatingmechanized development combined withconventional stoping. The new hybrid planhas already resulted in significant improve-ments in mining rates and, indeed, willdeliver additional platinum ounces perannum over the life of the mine.Withhindsight, more trial mining should havebeen conducted prior to implementation ofthe mining plan. Turning the mine into aprofit generator is expected but remains achallenge.
In Zimbabwe, we have progressed cautiouslywith our investment. The Mimosa mine –which continues to be one of the mostefficient, low-cost operations in the world –has successfully concluded its expansion
14
IMPLATS ANNUAL REPORT 2004
CHIEF EXECUTIVE’S REVIEW
Cash flowing from theLonplats transaction willfund capital expenditure
in SA and Zimbabwe.Any excess cash will
be distributed toshareholders
FY01 FY02 FY03
Group capex(R million)
2 090
FY04
1 250
783
1 787 1 822
FY00
programme this year, and still furtherexpansion is now being considered by thejoint venture partners. The current plan atZimplats is to expand in stages therebyminimising the risk, while maximizing thebenefits to be gained through our pre-eminent position on the Great Dyke.
Operating in Zimbabwe can be difficultgiven both the socio-political dynamicsand hyper-inflationary economic circum-stances. Recent government moves onintroducing additional indigenizationquotas without due consultation are ofgreat concern to us. Nonetheless, bothMimosa and Zimplats have continued tooperate and grow in line with ourexpectations, and our relationship with thegovernment has been amicable, driven byissues of mutual concern. We await clarityon the impending changes to the mining lawin that country as a prerequisite to anyfurther significant investments.
Positioning the group at homeand abroadEnsuring that we not only comply with localempowerment or indigenization legislation,but that we are positioned to take advan-tage of the opportunities that presentthemselves, is an important element in ourstrategy.
In South Africa, this entails grappling withissues such as transformation in such a waythat we not only comply with legislationthat has been set, but that we also addressthe issues so as to provide the group with acompetitive advantage. Implats has ahistory of a participative approach, andusing the full capacity of the people withinthe organization – be they female or male,black or white – makes business sense. Todrive this process, the board has appointeda transformation committee, to developstrategy, set targets and monitor progressand I look forward to reporting on this inyears to come.
In line with government’s increased focus onbeneficiation, Implats recognizes the impor-tance of developing a local beneficiationindustry and to this end has entered into aplatinum jewellery beneficiation venture,Silplat, with Silmar S.p.A., a leading Italian
jewellery manufacturer, South Africanjewellery producer, SA Link, specialistcorporate finance house Micofin CorporateServices and Swedish-UK consortium,Saab-BAE Systems. Silplat, which is based in CapeTown, was officially opened by the Ministerof Minerals and Energy in April 2004.
Implats’contribution to the venture is in twoparts; firstly, a direct equity investment of $2 million for a stake in Silplat of 17.5%.(Investment, both foreign and local, inSilplat totals $25 million.) Secondly, Implatswill facilitate the supply of metal through aplatinum loan of up to 1 000 kg, of which171 kg has already been taken up.Silplat willonly pay Implats for the metal once it hasdespatched the platinum jewellery fromits premises and will pay a commerciallease rate on the outstanding portion of theplatinum loan.
I have touched briefly on the issues relatingto mining in Zimbabwe. The ultimate truthfor mining companies is that we must gowhere the orebodies are, and we mustensure that we can develop those assetswith a long-term vision. Who would havethought 10 years ago that, today, resourcescompanies from all over the globe would beinvesting in Russia or China.
In this context, it is incumbent on manage-ment to mitigate the risks of investing in thisregion to an acceptable level.This will requireongoing dialogue with the governments ofZimbabwe and South Africa to ensure thatour business investments can be secured,andour aspirations for those businesses realised,while working within the socio-politicalframeworks required by these governments.
Shareholder returnsOur primary driver is the delivery ofshareholder returns. Among the issuescurrently being considered by the group arethe optimization of the balance sheet, thedistribution of excess cash, the broadeningof our shareholder base and increasingliquidity.
We anticipate that, in the absence of anyacquisition opportunities, just more thanhalf the net inflow from the Lonplats trans-action in FY2005 (of $668 million) could be
15
IMPLATS ANNUAL REPORT 2004
OV
ERV
IEW
C
HIE
F EX
ECU
TIV
E’S
REV
IEW
Mining companies must go where the
orebodies are
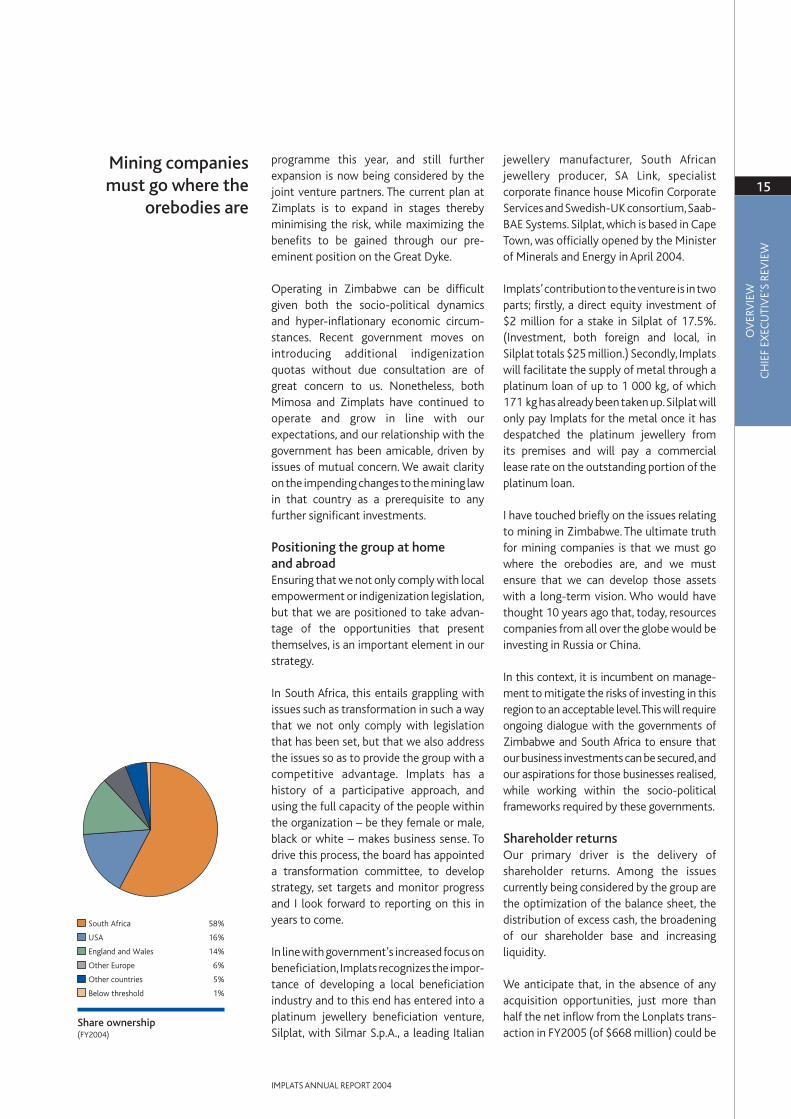
South Africa 58%
USA 16%
England and Wales 14%
Other Europe 6%
Other countries 5%
Below threshold 1%
Share ownership(FY2004)

OV
ERV
IEW
C
HIE
F EX
ECU
TIV
E’S
REV
IEW
available for distribution to shareholders insome form after allowing for our substantialcapital requirements for our growthprojects. Having consulted broadly withshareholders, we are considering a numberof avenues including a share buy-back or aspecial dividend.
For some years now we have been engagedin an active investor relations programme toboth broaden our investment base and tointeract with shareholders. Having em-barked on a sponsored level 1 ADRprogramme in January 2003, a further ADRsplit and a Dividend Reinvestment Plan forADR holders was implemented in early2004. We are currently consideringupgrading this programme to a Level 2 andapplying to list on a major US stockexchange.This will be initiated once we haveconcluded the corporate activity with whichwe are currently involved.
ProspectsThe market fundamentals for platinum areforecast to remain sound. Automotivedemand will be the key driver for platinum,with a recovery in jewellery providing amore supportive role. However, palladiumand rhodium may fall victim to growingsupply and above ground inventories whilstnickel should remain firm on the back ofstrong demand and very little growthin supply.
Implats’ consistent growth in production isset to continue over the next four years,withproduction potentially rising to about2.3 Moz in FY2008. Production for FY2005will grow from Implats’ managedproduction and from its traditional IRSproduction, but the once-off windfall ofplatinum processed on behalf of Lonplatswill not be repeated. Consequently, refinedplatinum production is expected to declineto about 1.8 Moz in FY2005. At the sametime, unit cost increases are expected to bein line with inflation.
Whereas profit should be significantlyenhanced by the proceeds from the sale ofthe interest in Lonplats, headline earningsare expected to decrease modestly, but thiswill depend to a substantial extent on theprevailing exchange rate.
ThanksA group the size of ours owes thanks tomany. Five new members have joined ourboard in anticipation of a number ofretirements and in embracing transfor-mation and best practices in corporategovernance at the board level.
Sadly, we bid farewell to Peter Joubert (ourChairman for the past two years and boardmember for nine). We thank him for thesignificant contributions he has made toImplats and for his leadership during aperiod of growth and change at Implats.
We look forward to working with Dr FredRoux, our new Chairman, and to thecontribution he will make to the board.
Our management team has remainedintentionally small and lean,despite the factthat we have significantly grown our assetbase and interests, has continued to bemulti-disciplinary and innovative, and ourperformance in meeting our objectives is –in large part – a result of its efforts.
And our thanks too are extended to our loyalemployees who have continued to make thedifference at an operational level, deliveringa sterling performance, under sometimesadverse circumstances.
Keith RumbleChief Executive27 August 2004
16
IMPLATS ANNUAL REPORT 2004
CHIEF EXECUTIVE’S REVIEW
Whereas profit shouldbe significantly
enhanced by theproceeds from the
sale of the interest inLonplats, headline
earnings are expectedto decrease modestly,but this will depend to
a substantial extenton the prevailing
exchange rate

17
IMPLATS ANNUAL REPORT 2004
OV
ERV
IEW
C
HIE
F EX
ECU
TIV
E’S
REV
IEW
For the year ended 30 June(R million) 2004 2003 % change Sales 11 809.1 11 807.0 0.0Net cost of products and services 4 694.8 4 421.2 (6.2)Value added by operations 7 114.3 7 385.8 (3.7)Income from investments and interest 495.8 1 280.5 (61.3)TOTAL VALUE ADDED 7 610.1 8 666.3 (12.2)Applied as follows to:Employees as salaries, wages and fringe benefits 2 452.0 2 231.1 (9.9)The state as direct taxes 1 141.3 1 936.4 41.1Royalty recipients 414.4 598.0 30.7Providers of capital 1 565.1 2 363.0 (33.8)Financing costs 67.1 33.3 (101.5)Dividends 1 498.0 2 329.7 35.7
TOTAL VALUE DISTRIBUTED 5 572.8 7 128.5 (21.8)Re-invested in the group 2 037.3 1 537.8 32.5Amortisation and depreciation 572.3 452.4 (26.5)Reserves retained 1 465.0 1 085.4 35.0
7 610.1 8 666.3 (12.2)
Employee costs 32.2%
Retained for future growth 26.8%
Capital providers 20.6%
Taxation and royalties 20.4%
FY2004
Employee costs 25.8%
Retained for future growth 17.7%
Capital providers 27.3%
Taxation and royalties 29.2%
FY2003
Group value-added statement
OV
ERV
IEW
RESP
ON
DIN
G T
O T
HE
MIN
ING
CH
ART
ER
The Minerals and Petroleum Resources Development Act, which came into effect in May 2004, willplay an important role in the transformation of the mining industry as a whole. Implats has begunto establish processes and put in place structures to enable it to comply (and to monitor thiscompliance),with the new minerals legislation and the accompanying Broad-Based Socio-EconomicCharter for the Mining Industry. Implats recognises the rights of employees and communitiesaffected by its operations. It also aims to develop the potential of employees, both inside and outof the workplace. The board has appointed a Transformation Committee to lead the process ofchange and to ensure compliance with legislation.The following is a brief response to the Charter.A more detailed response may be found in the Corporate Responsibility Report 2004.
1 Human Resource Development• Implats offers every employee the opportunity to be functionally literateand numerate.
Some 21.4% of all employees are functionally literate and numerate. Adult BasicEducation (ABET) classes are available at all the group’s operations on a full or part-timebasis. In FY2004, 571 employees participated in ABET at a cost to the company ofR5.1 million.
• Implats’ Integrated Workplace Skills Development Plan has been accepted by the MineQualifications Authority (MQA). R130 million was spent on skills developmentprogrammes in FY2004, with some 85% of the workforce having undergone formaltraining during the year. A particular emphasis is placed on skills development forHistorically Disadvantaged South Africans (HDSAs). (HDSA is defined as any person orcommunity disadvantaged by unfair discrimination prior to the new constitution cominginto effect in 1993. It includes people of colour, women and disabled persons.) R50 millionwas spent specifically on the development of HDSA employees on accelerateddevelopment programmes.
• Mentorship programmes have been developed for those identified with potential,predominantly amongst HDSA employees and employees from the Royal BafokengNation.
2 Employment equity• Implats has published its employment equity plan which has been submitted to the
Department of Labour. But, in order to meet the targets set by the new mineralslegislation, the group has embarked on additional measures to advance employmentequity related both to previously disadvantaged employees and women. These includerevised recruiting procedures, additional funding, a “space creation” programme,mentorship schemes, bursaries and graduate recruitment.
• The group’s employment equity framework has been developed in consultation withemployee representatives,and consultative employment equity committees have beenset up at all operations.Progress in employment equity has become an important featurein the performance evaluations of managers.
• Currently,33% of the group’s manager’s comprise HDSAs (22% at the mining and mineralprocessing operations, 42% at Refineries and 33% at the corporate office).
• Talent pools have been identified within the HDSA ranks, with individual developmentplans being established. A strategy has been developed to fast track HDSA employeesinto the Paterson E-level band.
• Only 2.6% of the overall workforce are women (2.9% at mines, 15% at Refineries, 13.4%at Mineral Processes, and 30.6% at corporate office). In addition to the employmentequity programme, specific interventions include the development of champions andincentives, diversity management programmes and the evaluation and provision of therequisite facilities and policies. (Management is defined as everyone from D level up on thePaterson Grading System.)
3. Foreign labour• Currently, 23.6% of the Implats’ workforce is foreign. (A foreign labourer is defined as a
person who is engaged in a paid activity in a country of which he or she is not a national.)Implats does not discriminate against foreign labour. The group subscribes to the ILOconventions which accord migrant workers equality before the law regarding humanrights and labour legislation.An important aim of the group’s Transformation Departmentis to promote a culture of respect for diversity.
4. Mine community and rural development• Implats takes seriously its commitment to maximize the sustainable socio-economic
development of communities in which it operates to act as a catalyst for developmentonce the mining cycle ends.
✓
✓
✓
✓
18
IMPLATS ANNUAL REPORT 2004
Responding to the Mining Charter
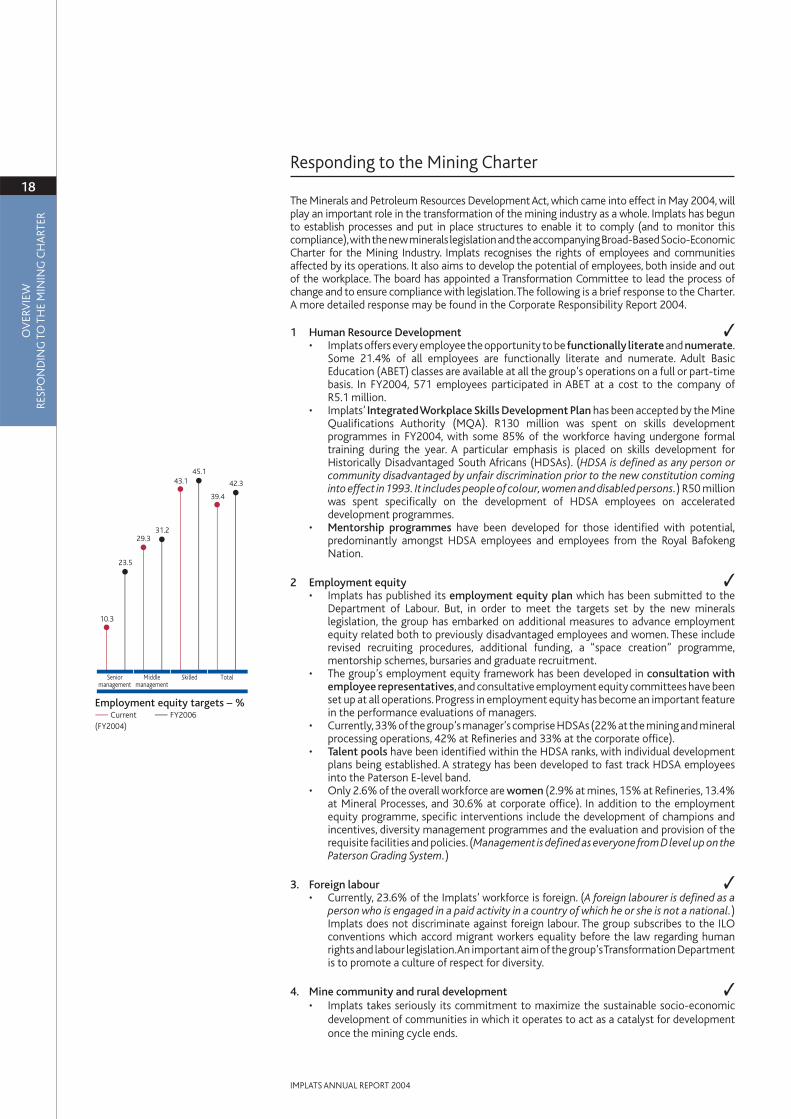
Seniormanagement
Employment equity targets – %Current FY2006
(FY2004)
10.3
29.3
39.4
45.1
23.5
31.2
43.1 42.3
Middlemanagement
Skilled Total

4. Mine community and rural development (continued)• Implats’ strategy includes co-operating in the formulation of Integrated Development
Plans (IDPs) at a national, regional and local level. Involvement includes taking aleadership role where this is necessary, facilitating industry co-operation and engagingwith mine communities. This co-operation is now being extended to labour-sendingareas. Key areas of co-operation and influence are the areas around Rustenburg (theRustenburg Local Municipality, the Bojanale Platinum District Municipality),Springs andSteelpoort (the Sekhukhuneland and Greater Tubatse district municipalities).
5. Housing and living conditions• The company subscribes to the ideal that employees should reside with their families in
a stable healthy environment within commuting distance of their workplace.• A housing forum, established on 18 February 2004 and comprising representatives of
management and unions, is investigating all accommodation issues, including upgradingcompany houses and hostels and promoting home ownership through the in-house HomeOwnership Scheme.In FY2004,190 employees became home owners through this scheme.
• It remains a reality though that there will always be a sizeable portion of employees whowill choose not to move their families to their region of work and it is the company’sintention to convert current hostels into private single accommodation units.
• A recent evaluation of the nutritional value of the meals served to Impala Platinumhostel residents resulted in the appointment of a new contractor to serve more nutritious,balanced meals with effect from September 2004.
6. Procurement• Implats has developed a procurement policy which will encourage both the identifi-
cation and development of accredited HDSA suppliers,and increase the company’s spendwith such suppliers. (The policy can be found on the company’s website atwww.implats.co.za).The principles contained in the policy were communicated to morethan 4 000 existing suppliers to encourage them to transform their businesses, and tonew and potential suppliers so that they may understand the company’s requirements.
• Targets are in place for procurement from HDSA companies, at both a group and anoperational level.Total affirmative procurement spend in FY2004 was R500 million, wellin excess of the target of R400 million. A target of 20% of total procurement throughHDSA companies has been set for FY2009.
7. Ownership and joint ventures• Implats is committed to achieving the ownership targets set in the minerals legislation
and is on track to achieve this within the specified timeframe. The group has – since aland-mark deal in the late 1990s – had the Royal Bafokeng Nation (RBN) as a significantshareholder (1.5%) in the group. This is over and above the royalty agreement with theRBN that exists over the Impala lease area that has seen the payment to the RBN of someR2.5 billion for the last five years. The recently announced sale of Implats’ 27.1% stakein Lonplats will lead directly to the creation of Incwala, intended to become a leadingempowerment company in the South African resources sector. Implats’Marula operation,has since project inception in 2000, envisaged a broad-based BEE stake.
8 Beneficiation • Implats supports the efforts by government to establish industries that add value to
the metals and minerals mined in South Africa.Through its world-class precious and basemetals refineries Implats is not only able to refine the metals to the required specificationsof end users – from ingots to salts – but also offer these facilities to other producers locallyand internationally.Through its agreement with A1 Services and Supplies Inc in the UnitedStates, Implats is the largest recyler of autocatalysts in the world, all of which are broughtinto the country from the US.
• Implats has participated in the first platinum jewellery beneficiation project in the country.It also provides metals to one of the largest producers of autocatalysts for local production.
9 Reporting • Implats published its first “scorecard” in response to the charter in the 2003 Annual Report.
The scorecard has been updated in this report and is reported on more fully in the group’sCorporate Responsibility Report 2004.
✓
✓
✓
✓
✓
19
IMPLATS ANNUAL REPORT 2004
OV
ERV
IEW
RESP
ON
DIN
G T
O T
HE
MIN
ING
CH
ART
ER
FY92 FY00 FY10
Hostel occupancy(No of employees)* Target
21 119
12 933
5 900*
FY04
9 881

OV
ERV
IEW
STAT
ISTI
CS
Income statements (for the years ended 30 June)
(R million) 2004 2003 2002 2001 2000
Sales 11 809.1 11 807.0 11 901.5 11 969.1 7 003.6 Platinum 7 941.2 7 390.5 6 137.4 5 253.2 3 017.2 Palladium 1 119.2 1 682.5 2 580.9 3 129.0 1 689.2 Rhodium 677.0 1 158.8 1 788.3 2 199.1 1 218.0Nickel 1 283.6 938.3 681.6 700.2 600.4 Other 788.1 636.9 713.3 687.6 478.8
Cost of sales (7 549.4) (6 523.3) (5 561.0) (5 003.2) (3 804.2) On-mine operations (3 667.7) (3 251.1) (2 567.5) (2 330.1) (1 997.6) Concentrating and smelting operations (967.4) (801.1) (642.6) (492.5) (440.7) Refining operations (477.2) (411.5) (354.7) (333.3) (307.9) Amortisation of mining assets (572.3) (452.4) (248.8) (212.2) (139.9) Metals purchased (2 259.2) (1 474.1) (1 883.4) (1 968.8) (698.8) Increase/(decrease) in metal inventories 394.4 (133.1) 136.0 333.7 (219.3)
Gross profit 4 259.7 5 283.7 6 340.5 6 965.9 3 199.4 Net foreign exchange transaction (losses)/gains (216.0) (328.8) 130.8 157.7 20.0Other operating expenses (241.2) (252.6) (203.9) (117.1) (96.6) Other income/(expenses) 11.4 (54.7) (98.0) (63.2) 42.0 Profit from sale of subsidiaries 322.3Finance income – net 71.5 285.8 265.5 383.3 228.2 Share of profit of associates 328.4 725.0 697.3 647.3 220.0Royalty expense (414.4) (598.0) (804.4) (890.3) (406.4)Profit before tax 4 121.7 5 060.4 6 327.8 7 083.6 3 206.6Income tax expense (1 141.3) (1 622.1) (1 736.4) (2 431.1) (949.1)Profit for the year 2 980.4 3 438.3 4 591.4 4 652.5 2 257.5Attributable to minority interest (17.4) (23.2) (9.9) (5.4) (2.5)Profit attributable to equity holders of the company 2 963.0 3 415.1 4 581.5 4 647.1 2 255.0Earnings per share (cents)
– basic 4 450 5 131 6 902 7 024 3 422– headline (basic) 3 966 5 140 6 877 7 035 3 394
Dividends per share (cents)– interim + proposed 2 100 2 650 3 700 3 800 1 760 – special 3 000
A more comprehensive history going back to 1997 is available in the online Annual Report on the corporate website atwww.implats.co.za
20
IMPLATS ANNUAL REPORT 2004
Statistics

Balance sheets (as at 30 June)
(R million) 2004 2003 2002 2001 2000
ASSETSNon-current assets 12 357.7 11 391.2 9 324.1 6 833.4 4 321.1 Property, plant and equipment 9 635.6 8 808.9 6 218.4 5 230.6 3 357.3 Investments and other 2 722.1 2 582.3 3 105.7 1 602.8 963.8 Current assets 4 680.2 4 878.1 5 448.3 5 162.3 4 504.3 Total assets 17 037.9 16 269.3 14 772.4 11 995.7 8 825.4 EQUITY AND LIABILITIESCapital and reserves 10 684.8 9 877.4 9 284.0 6 715.6 5 716.4 Minority interest 128.1 418.9 61.6 19.2 13.8 Non-current liabilities 2 541.5 2 213.1 1 683.4 1 465.2 1 195.1 Borrowings 62.7 86.3 113.1 137.6 Deferred income tax liabilities 2 271.9 1 886.7 1 389.6 1 156.1 889.7 Provision for long-term responsibilities 269.6 263.7 207.5 196.0 167.8 Current liabilities 3 683.5 3 759.9 3 743.4 3 795.7 1 900.1 Total equity and liabilities 17 037.9 16 269.3 14 772.4 11 995.7 8 825.4
Cash, net of short-term borrowings 635.6 2 119.8 3 123.5 3 013.1 3 081.4 Cash, net of all borrowings 635.6 2 057.1 3 037.2 2 900.0 2 943.8 Current liquidity (net current
assets excluding inventories) (233.1) 270.8 784.8 587.3 2 164.6
IMPLATS SHARE STATISTICSNo. of shares in issue at year-end (m) 66.6 66.6 66.6 66.3 66.1 Average number of issued shares 66.6 66.6 66.4 66.2 65.9 Number of shares traded 65.5 71.3 50.0 36.4 31.7 Highest price traded (cps) 64 100 65 001 72 000 47 300 29 600 Lowest price traded 41 650 34 600 28 700 23 980 15 400 Year-end closing price 47 100 44 600 57 180 40 360 25 220
A more comprehensive history going back to 1997 is available in the online Annual Report on the corporate website atwww.implats.co.za
21
IMPLATS ANNUAL REPORT 2004
OV
ERV
IEW
STAT
ISTI
CS

OV
ERV
IEW
STAT
ISTI
CS
22
IMPLATS ANNUAL REPORT 2004
STATISTICS
US Dollar statistics (for the years ended 30 June)
($ million) 2004 2003 2002 2001 2000
Sales 1 716.4 1 303.3 1 184.2 1 572.8 1 108.2 Cost of sales (1 100.0) (723.2) (548.8) (657.5) (601.6)
On-mine operations (534.4) (360.4) (253.3) (306.2) (315.9) Concentrating and smelting operations (141.0) (88.8) (63.4) (64.7) (69.7) Refining operations (69.5) (45.6) (35.0) (43.8) (48.7) Amortisation of mining assets (83.4) (50.2) (24.6) (27.9) (22.1) Metals purchased (329.2) (163.4) (185.9) (258.7) (110.5) Increase/(decrease) in metal inventories 57.5 (14.8) 13.4 43.8 (34.7)
Gross profit 616.4 580.1 635.4 915.3 506.6 Net foreign exchange transaction (losses)/gains (31.5) (36.5) 12.9 20.7 3.2Other operating expenses (35.1) (28.0) (20.1) (15.4) (15.3) Other income/(expenses) 48.6 (6.1) (9.6) (8.3) 6.6 Financial income – net 10.4 31.7 26.2 50.4 36.1 Share of results of associates before tax 47.9 80.4 68.8 85.1 34.8 Royalty expense (60.4) (66.3) (79.4) (117.0) (64.3)Profit before tax 596.3 555.3 634.2 930.8 507.7 Taxation (166.3) (179.9) (171.4) (319.5) (150.1) Profit for the year 430.0 375.4 462.8 611.3 357.6 Attributable to minority interest (2.5) (2.6) (1.0) (0.7) (0.4) Profit attributable to equity holders of the company 427.5 372.8 461.8 610.6 357.2 Earnings per share (cents) 642 560 696 923 542
Note: Income and expenditure have been converted at the average exchange rate for the year. Sales reflects actual Dollar receipts.
A more comprehensive history going back to 1997 is available in the online Annual Report on the corporate website atwww.implats.co.za

23
IMPLATS ANNUAL REPORT 2004
OV
ERV
IEW
STAT
ISTI
CS
Operating statistics (for the years ended 30 June)
2004 2003 2002 2001 2000
Gross refined productionPlatinum (000 oz) 1 961 1 673 1 387 1 291 1 199Palladium (000 oz) 1 046 893 732 681 636Rhodium (000 oz) 251 215 177 164 155Nickel (000 t) 16.4 14.7 13.0 14.0 13.8
Impala refined productionPlatinum (000 oz) 1 090 1 040 1 025 1 002 1 020Palladium (000 oz) 501 478 489 481 493Rhodium (000 oz) 116 134 123 128 131Nickel (000 t) 6.9 8.0 7.7 7.0 7.2
IRS refined productionPlatinum (000 oz) 871 633 362 289 179Palladium (000 oz) 545 415 243 200 143Rhodium (000 oz) 135 81 54 36 24Nickel (000 t) 9.5 6.7 5.3 7.0 6.6
IRS returned metal (Toll refined)Platinum (000 oz) 501 252 152 164 102Palladium (000 oz) 314 174 102 116 93Rhodium (000 oz) 97 18 16 21 17
Consolidated statisticsExchange rate: (R/$)
Closing rate on 30 June 6.17 7.52 10.32 8.06 6.92Average rate achieved 6.88 9.06 10.16 7.68 6.40
Free market revenue per platinum ounce sold ($/oz) 1 140 939 934 1 376 1 005Revenue per platinum ounce sold ($/oz) 1 116 935 934 1 321 904
(R/oz) 7 678 8 471 9 489 10 145 5 786Prices achieved
Platinum ($/oz) 773 597 485 586 428Palladium ($/oz) 223 264 389 773 465Rhodium ($/oz) 548 646 1 098 2 001 1 223Nickel ($/t) 11 843 7 664 5 594 6 951 7 500
Sales volumesPlatinum (000 oz) 1 495 1 373 1 251 1 177 1 209Palladium (000 oz) 733 688 663 543 656Rhodium (000 oz) 179 193 165 145 171Nickel (000 t) 15.8 13.9 12.0 14.1 14.0
Financial ratiosGross margin achieved (%) 36.1 44.8 53.3 58.2 45.7Return on equity (%) 30.0 36.8 68.2 81.3 55.7Return on assets (%) 24.0 30.0 49.1 68.0 52.2Debt to equity (%) 5.3 2.7 1.2 2.0 2.8Current ratio 1.3:1 1.3:1 1.5:1 1.4:1 2.4:1
Operating indicatorsTonnes milled ex-mine (000 t) 19 065 17 483 15 607 15 184 14 662PGM refined production (000 oz) 3 725 3 162 2 639 2 464 2 308Capital expenditure (Rm) 1 822 1 787 1 250 2 090 783
($m) 265 198 123 275 124Group unit cost per platinum ounce (R/oz) 4 132 3 970
($/oz) 602 440
A more comprehensive history going back to 1997 is available in the online Annual Report on the corporate website atwww.implats.co.za

We are more than just amining company at Implats –we are an integral part of ourcommunity.As the unionrepresentative on themanagement/union HIV/AIDSforum,Abram Zulu plays apivotal role in ensuring thatthe company assists the localcommunity in developing AIDSawareness on the one hand,and in providing care andsupport for those in need onthe other. Increasingly we areextending our support to thecommunities from which ouremployees are drawn.

AC
CO
UN
TABI
LITY
CO
RPO
RATE
GO
VER
NA
NC
E
Implats supports and applies the Code ofCorporate Practices and Conduct asadvocated in the King Report 2002 (King II).Following the release of this report in March2002, a full audit of the group’s corporategovernance procedures was conducted atmanagement’s request and areas of possibleconcern were identified and are beingaddressed. Developments and enhance-ments to achieve best practice for thebenefit of all stakeholders are ongoing.
A focus on sustainable value for share-holders will benefit all the group’s otherstakeholders.
Board of directorsThe board is based on a unitary structure andretains full and effective control over thegroup. An approval framework defines theauthority of management and mattersreserved for board approval. The boardmeets regularly, six times a year, to reviewthe operational performance of the group,strategic issues, the business plan, acquisi-tions, disposals and other major contractsand commitments, group policies andstakeholder reporting. In addition to the sixscheduled board meetings, the board alsomeets on an ad hoc basis to consider specificissues, as the need arises. During the yearunder review, two such meetings were held.
The board has adopted a formal board charterregulating the role of the board and outliningmatters reserved for board approval. Theboard charter is available on the company’swebsite www.implats.co.za. All committeesof the board operate within agreed terms ofreference approved by the board.These wererevised in May 2003 to ensure compliancewith King II. The terms of reference areconsidered as dynamic documents which arereviewed regularly.The committees comprisemainly independent directors.
There are 11 independent and four executivedirectors on the board. Mr TV Mokgatlha, anon-executive director, is not considered tobe independent given his relationship withthe Royal Bafokeng Nation, with whom thecompany has a significant contractualarrangement.
The positions of Chairman and ChiefExecutive Officer are separate, and theChairman is an independent director.
Five new independent appointments weremade to the board during the course of theyear to ensure that successors exist for keyboard positions and to increase the range ofskills and experience at the board’s disposal.It is necessary to propose these appoint-ments for election at the forthcomingannual general meeting (AGM).
The board now comprises 38% HistoricallyDisadvantaged South Africans (includingwomen), and 19% women.
Board members are elected for three-yearterms. Re-election of board members is ona staggered basis to ensure board continuity.Executive directors retire at the AGMfollowing their 63rd birthday, and non-executive directors following their 67thbirthday, provided that, in the case of non-executive directors, their terms of officecontinue on an annual basis, if a majority oftheir co-directors so request.
Mr PG Joubert,having reached the age of 71,has indicated his intention of resigning atthe end of the next AGM. Mr MF Pleming,having reached the age of 68, has beenrequested by his co-directors and has agreedto continue in office until the end of thecalendar year, to ensure a smooth transitionof the Health, Safety and Environmental(HSE) Audit Committee.
The curriculum vitae of all directors tobe elected or re-elected at the AGM are setout below:
To be electedMr RSN Dabengwa (46)BSc (Elect Eng.) MBA, EDP(Independent director)Managing director of MTN(SA). Previously amember of ESKOM’s management boardresponsible for the implementation of thenational electrification programme.
ACCOUNTABILITY
25
IMPLATS ANNUAL REPORT 2004
Corporate governanceImplats supports andapplies the practices
and conduct advocatedin King II

AC
CO
UN
TABI
LITY
CO
RPO
RATE
GO
VER
NA
NC
E
Dr K Mokhele (48)BSc, MSc (Food Science); PhD (Micro-biology)(Independent director)President and chief executive officer of theNational Research Foundation; Director,Iscor Limited.
Ms NDB Orleyn (48)B Juris, B Proc; LLB(Independent director)Director and senior attorney at the law firmRoutledge-Modise where she practices asattorney, facilitator, mediator and trainer.Previously CEO at the Council for Concilia-tion, Mediation and Arbitration and atIMMS, a South African non-governmentalorganization which provides mediationfacilitation, arbitration and training servicesto employers.
Dr FJP Roux (56)BSc, MSc, PhD, MBA.(Independent director)Non-executive director of Xstrata plc.Previously Chairman of Alusaf and an
executive director of Gencor Limited.Prior tothat a director of Rustenburg Platinum Minesand senior general manager in JCI’s PlatinumDivision responsible for worldwide marketingand strategic planning.
LC van Vught (61)BSc (Hons) (Chemistry); B Comm.(Independent director)Non-executive director of AECI Limited andTiger Brands Limited.Previously CEO of AECILimited and Chairman of Chemical ServicesLimited.
To be re-electedJV Roberts (62) FCIS,ACMA, MBA (Henley)(Independent director)Has held numerous positions at board levelas executive, non-executive and represen-tative of holding company both in SouthAfrica and foreign countries. Managingdirector of Meta Solutions and director ofSenwes. Joined the board in 1998 as a non-executive director.
26
IMPLATS ANNUAL REPORT 2004
CORPORATE GOVERNANCE
Board of Audit Remuneration HSE Audit NominationsDirectors Committee Committee Committee Committee
PG Joubert √ √ √ √ √ √ √ √ 8 8 i i i i 4 4 √ √ √ √ 4 4 √ √ √ √ 4 4 √ √ √ 3 3KC Rumble √ √ √ √ √ √ √ √ 8 8 i i i i 4 4 i i i i 4 4 i i i i 4 4 i i i 3 3DH Brown √ √ √ √ √ √ √ √ 8 8 i i i i 4 4RSN Dabengwa √ √ a a 4 2CE Markus √ √ √ √ √ √ √ √ 8 8 i 1 1JM McMahon √ √ √ √ √ √ √ √ 8 8 √ √ √ √ 4 4 √ √ √ √ 4 4MV Mennell √ √ √ √ √ √ √ √ 8 8 √ √ √ √ 4 4 √ √ √ 3 3TV Mokgatlha √ √ √ √ √ √ √ √ 8 8 i 1 1K Mokhele a 1 0DM O'Connor √ √ √ √ √ √ √ √ 8 8 √ √ √ √ 4 4NDB Orleyn √ √ √ 3 3LJ Paton √ √ √ √ √ √ 6 6MF Pleming √ √ a √ √ √ √ √ 8 7 √ √ √ √ 4 4 √ √ √ 3 3JV Roberts √ √ √ √ √ √ √ √ 8 8 a √ √ √ 4 3 √ √ √ √ 4 4FJP Roux √ √ 2 2LC van Vught √ √ √ a 4 3
Key* = special board meetings i = invitation√ = attended = not applicablea = apology
29/0
7/20
03*
22/0
8/20
0318
/09/
2003
07/1
1/20
0310
/02/
2004
20/0
4/20
04*
13/0
5/20
0408
/06/
2004
No.
of m
eeti
ngs
No.
atte
nded
11/0
8/20
0328
/10/
2003
02/0
2/20
0404
/05/
2004
No.
of m
eeti
ngs
No.
atte
nded
18/0
8/20
0330
/10/
2003
30/0
1/20
0420
/04/
2004
No.
of m
eeti
ngs
No.
atte
nded
18/0
8/20
0320
/10/
2003
29/0
1/20
0405
/05/
2004
No.
of m
eeti
ngs
No.
atte
nded
29/0
7/20
0321
/01/
2004
20/0
4/20
04N
o.of
mee
ting
sN
o.at
tend
ed
During the year directors attended board and committee meetings as follows:

CE Markus (47) BA; LLB(Executive director )Graduated from the University of Witwaters-rand in 1981.Admitted Attorney, Notary andConveyancer. Articled clerk and professionalassistant for Bell Dewar and Hall attorneys.Legal advisor and company secretary forDorbyl Limited. Non-executive director ofIscor Limited. Joined Implats in 1991 as LegalAdvisor and appointed to the board in 1998.
JM McMahon (57)Pr.Eng; BSc (Mech Eng)(Independent director) Graduated from Glasgow University,Scotland as an Engineer in 1968. Heldnumerous engineering positions on variousmining operations and projects. Managingdirector and executive chairman of Implatsfrom 1990 to 1998. Executive chairmanof Gencor Limited and Non-executiveChairman of Implats from 1998 to 2002.Non-executive director since 2002.
Remuneration CommitteeMembersJohn Roberts – ChairmanPeter JoubertMichael McMahonThandi Orleyn
The Remuneration Committee comprisesfour independent directors,and is chaired byan independent director. During the year,Ms Orleyn was appointed as an additionalmember of the committee. The ChiefExecutive Officer is invited to attend allRemuneration Committee meetings,exceptwhen his own remuneration is underconsideration.
The policy of the group is based on thepremise that fair and competitive remune-ration should motivate individual achieve-ment to enhance company prosperity,through a balanced mixture of bothguaranteed and performance-enhancingincentives to attract and retain highly skilledemployees in the group.
The main functions of the RemunerationCommittee are to:• propose the remuneration (including
incentive schemes) of executive directorsand senior executive schemes
• benchmark remuneration practicesagainst both local and internationalbest practice
• prepare innovative policies to attract andretain the services of highly skilledexecutives
• ensure that the terms and conditions ofservice of all staff are equitable andcompetitive
• ensure that a succession planningprocess is in place
• monitor employment equity ratios andtargets
• administer the share incentive scheme
Employees participate in a bonus scheme,which is based on individual achievements,certain value-added criteria (such as volumeand cost) and safety improvements. Thisisolates the effect of metal prices andexchange rates over which managementhas no control. All senior employees setobjectives for the year and apportionmentof the bonus is based on the achievement ofthese objectives.
Nomination CommitteeMembersVivienne Mennell – ChairpersonPeter JoubertMike Pleming
The Committee comprises three inde-pendent directors. It assists the board inensuring that the structure, size, effec-tiveness and composition of the board andits committees:• are reviewed regularly• comprise the requisite mix of skills, expe-
rience, diversity and other qualities; and• are maintained at appropriate levels in
order to– meet the requirements of sound
corporate governance; and– function properly and effectively.
The Nomination Committee is responsiblefor arranging assessments of the board, itsdirectors and its committees; proposingadjustments to the board and its com-mittees, as appropriate; planning forthe succession of directors; recommendingappointments and re-elections of directors;establishing a formal induction processandensuring that a training and developmentprogramme is in place for board members.
27
IMPLATS ANNUAL REPORT 2004
AC
CO
UN
TABI
LITY
CO
RPO
RATE
GO
VER
NA
NC
E

AC
CO
UN
TABI
LITY
CO
RPO
RATE
GO
VER
NA
NC
E
During the year, self-evaluation exerciseswere conducted on the Audit Committee andHSE Audit Committee to ensure that thecommittees were effective in fulfilling theirmandates and discharging the board’sresponsibilities. As a result, various issuesidentified are being addressed. Self-assessments of the Remuneration andNomination Committees are in progress.
At the last AGM, the maximum number ofdirectors on the Implats board wasincreased from 14 to 16. During this pastyear, various additional appointmentswere recommended to the board (andapproved) to ensure that successors existfor key board positions, to increase therange of skills and experience at the board’sdisposal, and to transform the compositionof the board.
Health, Safety and EnvironmentalAudit CommitteeMembersMike Pleming – ChairmanSifiso DabengwaPeter JoubertMichael McMahonTony Scurr (External consultant)Dirk Theuninck (Executive)
A board appointed Health, Safety andEnvironmental (HSE) Audit Committee hasbeen in place since 1998. Its role in terms ofits mandate is to monitor and review health,safety and environmental performance andstandards. The HSE Audit Committeesupplements and gives support, advice andguidance on the effectiveness or otherwiseof management’s efforts in the HSE arena.The committee consists of four inde-pendent directors, one executive and aconsultant. The Chairman is an independentnon-executive director. Mr RSN Dabengwawas appointed as an additional member ofthe committee during the year.
The Committee meets at least once a quarter.Meetings are held alternately at theoperations, coinciding with visits to sites ofHSE importance/ relevance, or at Implats’head office. At all meetings, Implats’ overallperformance in all areas of health, safety andthe environment is critically appraised.Internal Audit regularly reviews reportingsystems to ensure that accidents and injuries
sustained by employees/contractors arereported timeously and effectively.
Audit CommitteeMembersLex van Vught – ChairmanVivienne MennellThabo MokgatlhaJohn Roberts
During the year, Mr DM O’Connor resignedas Chairman of the Audit Committee andMr L van Vught was appointed in his stead.Mr T Mokgatlha was appointed as anadditional member. Mr Mokgatlha, a non-executive director, contributes the specificskills associated with his qualification(CA(SA)). The Audit Committee comprisesthree independent and one non-executivedirector. Its role is to provide assurance thatrelevant board duties are discharged by:• monitoring the integrity of the financial
statements and other relevant externalfinancial reports of Implats andreviewing all significant inputs, judge-ments and outputs in order to present abalanced and understandable assessmentof the position, performance and pros-pects of Implats, as appropriate
• reviewing the company’s internalfinancial control and financial risk man-agement systems in order to safeguardImplats’ assets
• monitoring and reviewing the effective-ness of Implats’ internal audit functions
• recommending to the board the appoint-ment of the external auditors, approvingthe remuneration and terms of engage-ment of the external auditors andmonitoring their independence, objec-tivity and effectiveness, taking intoconsideration relevant professional andregulatory requirements
The committee, in carrying out its tasks, hasa wide range of powers to consult bothinternally and externally. The overridingprinciple is that the committee shall beprovided with sufficient resources toundertake its duties.
Its terms of reference allow the investi-gation into any activity of the company andpermit the seeking of information or advicefrom any employee in the course of itsduties.The Chairman of the Audit Commit-
28
IMPLATS ANNUAL REPORT 2004
CORPORATE GOVERNANCE

tee meets once a year on an individual basiswith the external and internal auditors, theChief Executive Officer and the ChiefFinancial Officer, without any other execu-tive member of the board in attendance.
The Audit Committee oversees the RiskManagement Committee. A “whistleblowing” toll-free helpline is in place tofacilitate the confidential reporting ofalleged incidents which are communicatedto the Chairman of the board.
Risk managementMembership of the Risk ManagementCommittee is set out on page 33. Implats’philosophy on risk management is foundedon the conviction that the most successfulmining operations in the long run are thosethat are able to understand and effectivelymanage the inherent uncertaintiesassociated with mining. For Implats, riskmanagement is about maintaining anappropriate balance between reapingrewards and the concomitant risks.
In 2002, the board directed management toestablish a programme aimed at integratingthe current risk management activities inthe various operations and core functions.
The programme was initiated in early 2003with the appointment of a group riskmanager and the establishment of a groupRisk Management Committee. Thiscommittee functions as an integral part ofthe board’s governance structures.
The Risk Management Committee Charterapproved by the board defines thecommittee’s terms of reference andresponsibilities.
The following critical steps towards theestablishment of an integrated or enter-prise-wide risk management system havebeen completed:• approval of the Risk Management
Committee Charter by the board.• development of a common Implats risk
assessment methodology which isdefined by a framework, process andsystem that are based on contemporarybest practice. This methodology will beused in all Implats’ operations andfunctions.
• establishment of and communication toall managers of a Risk Management Policyand Code of Practice applicable to alloperations and activities of Implats. Thecode of practice was used to develop thetraining material for risk champions.
• appointment and training of risk cham-pions in all areas and functions of Implats.
• development of a common risk man-agement system and informationrepository.
• development of an Implats Assets andBusiness Interruption Insurance Under-writers Guide that serves to integrate andalign the activities of risk managementand insurance.
• development of a group risk frameworkand profile following a strategic review ofall risks faced by Implats.
• the inherent strategic risks identified arereviewed and monitored by the board onan ongoing basis.
Furthermore,the board reviews and monitorsall management activities in the areasidentified to ensure sustainabilityand continuous improvement in themanagement of these risks and thatappropriate and timely action is taken on theinevitable changes in the external andinternal business environment
Internal control systemsThe group maintains accounting and admin-istrative control systems designed to providereasonable assurance that the accountingrecords accurately reflect all transactions;areexecuted and recorded in accordance withsound business practices; that the assets aresafeguarded; and that protection is providedagainst serious risk of error or loss, in a cost-effective manner.
An internal audit department, which holdsregular meetings with management and theAudit Committee and has direct access to theChairman of the board, independentlymonitors these controls. Nothing has cometo the attention of the directors to indicatethat any material breakdown in thefunctioning of these controls has occurredduring the year under review.
Insurable risksWith the hardening in insurance marketsworldwide, particularly in the wake of the
29
IMPLATS ANNUAL REPORT 2004
AC
CO
UN
TABI
LITY
CO
RPO
RATE
GO
VER
NA
NC
E

AC
CO
UN
TABI
LITY
CO
RPO
RATE
GO
VER
NA
NC
E
30
IMPLATS ANNUAL REPORT 2004
CORPORATE GOVERNANCE
tragic events of 11 September 2001,the com-pany has not been able to secure full-valueinsurance coverage. A review of the group’smajor insurable risks and associated potentialmonetary losses revealed that the companyhas adequate cover. The company has takensteps to ameliorate potential losses through avariety of means, including “normal”insurance and a degree of self-insurance androbust, pure risk management programmes.
Despite the company’s best endeavours,certain conditions within insurance policiesdo not allow the company full insurancecover for tailings dams which could, uponfailure, result in a partially uninsured loss.Tomitigate this loss, the company has steppedup monitoring procedures of the tailingsdams.There also remains an uninsured layerunder the current insurance policy, this isnot considered material (from R51 millionto R100 million).
LegislationThe new Mineral and Petroleum ResourcesDevelopment Act (the Act),which came intoeffect on 1 May 2004, has profoundimplications for the mining industry.
Together with the Broad-Based Socio-Economic Empowerment Charter for theMining Industry (Mining Charter), theScorecard for the Mining Charter and theRoyalty Bill, this represents a significantdeparture from the previous legislativeregime and will govern the security of tenureof mineral resource and reserve assets for allSouth African mining and prospectingoperations. Although the interim arrange-ments provided for in the Act allow for a five-year period to complete the conversionprocess, Implats is fully committed toconverting all the old order mining rightsobtained in terms of the Minerals Act of 1991during FY2005. Significant milestones suchas the BEE participation at Marula and theIncwala Resources arrangement are in thepublic domain and are detailed elsewhere inthe annual report.
In terms of the new minerals legislation, amining right may be granted for a period notexceeding 30 years. It is presently envisagedthat most of Implats’ mineral resources andreserves areas within South Africa will bemined out within this period. An extension
will be required for some areas. Mineralresources presently contained within oldorder prospecting right areas also form animportant part of the long-term mine plansand due priority will be allocated to these forthe eventual progression to new ordermining rights.
TransformationThe business plan of the organisationincludes interventions to support thetransformation process, to develop andempower our workforce and to accom-modate both anticipated and recentlypromulgated legislation.
Our commitment to the process of unlockingthe potential of our employees applies inparticular to those who fall into the categoryof designated groups.All our developmentalprogrammes, succession planning, careerpath programmes and bursary projects takecognisance of this commitment.
Numerous steering committees have beenestablished and specific numerical targetshave been set over a five-year period toachieve a workplace free of discrimination.The planned target levels and the levels ofachievement are set out in the table onpage 32. Some progress against targets hasbeen made, particularly at supervisory andmanagement levels but there is still someway to go to meet the set targets.
The report (on page 32) is a requirement interms of the Employment Equity Act, thetargets of which will be reviewed periodically.
Employee participationThe group is committed to open and trans-parent communication with employees andemployee participation is encouragedthrough various short-term and long-terminitiatives and campaigns. A quarterlyLeadership Summit facilitates communica-tion between management and employeerepresentatives across the organisation. Inaddition,representatives of all unions serve onkey committees such as Impala’s HIV/AIDSand Best Practice Committees.
Code of valuesThe group has adopted a code of valuesgoverning the manner in which it doesbusiness with its stakeholders and, in par-

31
IMPLATS ANNUAL REPORT 2004
AC
CO
UN
TABI
LITY
CO
RPO
RATE
GO
VER
NA
NC
E
ticular, covering business integrity anddevelopment, and the safety of employees.These are detailed on page 5 of this report.The process whereby employees havecommitted themselves to these values hasresulted in the development of the principlesof that code into a “Value Statement” whichinterprets those values in a practical andeasily understandable form. All employeesand directors are required to adhere to theethical standards contained in this code.
EthicsImpala has a bona fide code of businesspractices to which all employees andsuppliers are expected to adhere.The policyoutlines conflicts of interest, the preventionof dissemination of company information,the acceptance of donations and gifts, andprotection of the intellectual property andpatent rights of the company. The policyoutlines the disciplinary action (includingdismissal or prosecution) which will betaken in the event of any contravention.
A formal, comprehensive, ethics policyembracing all operations in the group isbeing prepared for formal adoption duringthe forthcoming year.Procedures will be putin place to ensure compliance with recentlypromulgated legislation by all operations.
ShareholdersImplats communicates regularly withshareholders and other stakeholdersregarding its financial and operationalperformance. Communication withinterested institutional and privateinvestors pays due regard to the statutoryand regulatory requirements on thecommunication of price sensitive infor-mation by the company and its officers.
Investors, fund managers, analysts, themedia and the market are kept fully,timeously and honestly informed on alldevelopments. It is company policy to paydividends twice a year, at the end of theinterim financial period (when approxi-mately one-third of the dividend is paid) andat the end of the financial year (when usuallythe remaining two-thirds are paid). Whilethe payment of dividends is not guaranteed,they have been paid consistently for theprevious five years. Currently, the dividendcover is 1.9. The company has paid a special
dividend previously and would considerdoing so again if there was cash available inexcess of the company‘s requirements andit elected not to pursue any other means ofreturning excess cash to shareholders.
The shareholder communication functionsof the group secretary and the share registrarare supported by an investor relations pro-gramme which operates in South Africa,Europe and the United States. This pro-gramme is aimed at maintaining contactwith institutional shareholders, fundmanagers and analysts in these countries,and the media, and to undertake formalfinancial disclosure through the interim andannual results announcements, the annualreport, roadshows, press releases, ad hocinvestor meetings, participation in invest-ment conferences and the website. In parti-cular, roadshows and teleconference callsalso provide investors with the opportunityto communicate with management and tomake recommendations to the board.Management is also open to meetingsrequested by shareholders and contactdetails are available on the website.
The results announcements, both interimand annual, take the form of live presenta-tions which are webcast simultaneously.Inter-national conference calls are also held.All presentations, webcasts and conferencecall transcripts are available on the website.In addition, copies of all presentations madeby executive management are posted onthe website.
Access to informationImplats has complied with the requirementsof the Promotion of Access to Information Actof 2000.The corporate manual is available onthe website and from the Group Secretary.
The group observes a closed period from theend of the relevant accounting period to theannouncement of interim or year-endresults, during which neither directors noremployees can deal, either directly orindirectly, in the shares of Implats or itslisted subsidiaries.
SponsorDeutsche Bank is the corporate sponsor,in compliance with the JSE’s listingrequirements.

AC
CO
UN
TABI
LITY
CO
RPO
RATE
GO
VER
NA
NC
E
Effects and implications of theannual general meetingThe AGM provides an opportunity forshareholders to question the boardincluding the chairpersons of the variousboard committees.
The notice of the AGM set out on page 144will have the following effects andimplications.
Item 1. To approve the annual financial state-
ments for the year ended 30 June 2004.2. To elect Messrs RSN Dabengwa and
LC van Vught, Drs FJP Roux andK Mokhele, and Ms NDB Orleyn asdirectors of the company.
3. Re-elect as directors of the companyMs CE Markus, Messrs JV Roberts andJM McMahon, who retire from office atthe meeting.
4. To approve the remuneration of thenon-executive directors for the forth-coming year.
5. To grant the directors general authorityto issue shares in the capital of thecompany subject to a maximum of 10%of the issued capital and the provisionsof the Companies Act.
6. To extend for a further year theauthority of the directors to issue sharesin the capital of the company for cashsubject to the provisions of the JSESecurities Exchange South Africa’slistings requirements. The annualamount, which can be issued, is limitedto 15% of the issued share capital. Theresolution requires a 75% majority voteof members present at the meeting toapprove the resolution.
Special business7. To extend for a further year the
authority of the directors to buy-back amaximum of 10% of the company’sissued share capital. The specialresolution requires approval by a 75%majority of members present at themeeting.
32
IMPLATS ANNUAL REPORT 2004
CORPORATE GOVERNANCE
Employment equity targets
Current Current Current FY2006**Total Total % %
employees designated* designated* target*
Senior management 78 8 10.3 23,5Middle management 454 133 29.3 31,2Skilled 1 844 794 43.1 45,1Total 2 376 935 39.4 42,3
* The term “designated employee” refers to those employees designated in terms of the Employment Equity Act as having beenhistorically disadvantaged.
** Negotiated targets as required in terms of the Employment Equity Act.
33
IMPLATS ANNUAL REPORT 2004
AC
CO
UN
TABI
LITY
EXEC
UTI
VES
AN
D S
ENIO
R M
AN
AG
EMEN
T
Executives and senior management
Executive committeeKeith Rumble Chief Executive Officer
David BrownChief Financial Officer
Rob DeyGroup Engineering Manager
Derek EngelbrechtMarketing Executive
Ramun MahadeveyGroup Secretary and Senior ManagerLegal Services
Cathie MarkusExecutive Director
Humphrey OliphantHuman Resources Executive
Les PatonExecutive Director
Mike RossouwGroup Consulting Engineer – Assets and Risk
Dirk TheuninckOperations Executive – Refineries
Paul VisserOperations Executive – Rustenburg
Risk Management CommitteeArea of responsibility: Minimising risk toassets and income earning capacityMike Rossouw (Chairman)David BrownRob DeyBob GilmourCathie MarkusChris McDowellHumphrey OliphantDirk TheuninckHenk van VeenPaul Visser
Hedging CommitteeArea of responsibility: Hedging metal salesand conversion of foreign exchangeproceeds to RandsKeith Rumble (Chairman)David BrownDerek EngelbrechtJohan van Deventer
Implats EnvironmentalManagement CommitteeArea of responsibility: Managing andrectifying the impact which miningand processing have on the environmentDirk Theuninck (Chairman)Paul DunnePierre LourensCathie MarkusJohan van DeventerGeorge Watson
Business Development CommitteeArea of responsibility: Identifying newbusiness opportunitiesBob Gilmour (Chairman)Rob DeyPaul FinneyLes JaggerDeon JanssenChris McDowellLes PatonJohan Theron

AC
CO
UN
TABI
LITY
BOA
RD A
ND
MA
NA
GEM
ENT
34
IMPLATS ANNUAL REPORT 2004
Board and management
Peter Joubert (71) (Chairman)BA DPWM. Chairman, General
Motors (SA), Munich Reinsurance ofAfrica, BDFM Publishers and
Sandvik. Director Delta ElectricalIndustries and Hudaco. Joined the
board in 1995 and appointed asChairman in 2002.
Khotso Mokhele (48)BSc (Agriculture), MSc (Food
Science), PhD (Microbiology).Director Iscor Limited,
President and Chief ExecutiveOfficer of the National
Research Foundation. Joinedthe board in 2004.
Sifiso Dabengwa (46)BSc (Elec Eng) MBA, EDA,Managing Director of MTN(SA).Joined the board in 2004.
▼
▼
Mike Pleming (68)Pr Eng. FIMM. Director, Harmony
Gold Mining Company. Joinedthe board in 1998.
▼
Lex van Vught (61)BSc (Hons) (Chemistry), B Comm.Director AECI and Tiger BrandsLimited. Joined the board in 2004.
▼
John Roberts (62)FCIS ACMA. MBA (Henley)
Director, Senwes Limited. Joinedthe board in 1998.
Daryl O’Connor (66)CA (SA). Joined the board in 1995.
▼
Thandi Orleyn (48)B Juris, B Proc, LLB. Director ofRoutledge-Modise attorneys.Joined the board in 2004.
▼
▼
▼
Fred Roux (56)BSc, MSc, PhD, MBA. Joined theboard in 2004. Non-executivedirector of Xstrata plc.
▼

35
IMPLATS ANNUAL REPORT 2004
AC
CO
UN
TABI
LITY
BOA
RD A
ND
MA
NA
GEM
ENT
Keith Rumble(Chief Executive Officer) (50)
BSc (Hons) MSc (Geology).Joined the group in 2001
in that capacity.
▼
Vivienne Mennell (61) BA, MBA, FCMA,THD. Joined the
board in 1990 as financial director.Re-joined the board in 1998 as a
non-executive director.
▼
Les Paton (Executive Director) (52)BSc (Hons) (Geology), B Comm.Joined the group as geologist in 1975and appointed to the board in 2003.
▼
David Brown(Executive Director and CFO) (42)CA (SA). Joined the group in 1999 inthat capacity.
▼
Cathie Markus(Executive Director) (47)
BA LLB. Joined the group as legaladviser in 1991 and appointed to
the board in 1998.Non-executive director
of Iscor Limited
▼
Michael McMahon* (57)Pr.Eng. BSc (Mech Eng). Director of Gold FieldsLimited. Joined the group in 1990 as ManagingDirector, appointed Chairman in 1993 and anon-executive director in 2002.
▼
Thabo Mokgatlha (29)CA (SA), Financial Director of Royal BafokengResources Management Services (Pty) Limited.Joined the board in 2003 as nominee of theRoyal Bafokeng Nation.
▼
* British
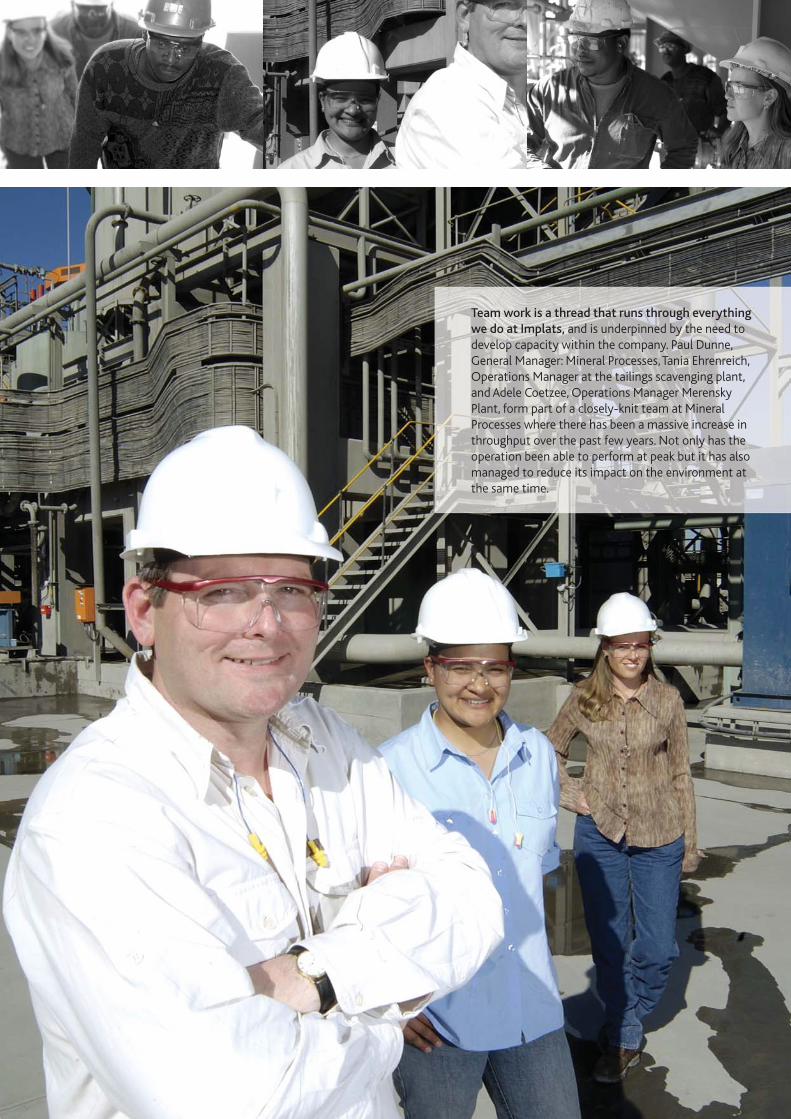
Team work is a thread that runs through everythingwe do at Implats, and is underpinned by the need todevelop capacity within the company. Paul Dunne,General Manager: Mineral Processes,Tania Ehrenreich,Operations Manager at the tailings scavenging plant,and Adele Coetzee, Operations Manager MerenskyPlant, form part of a closely-knit team at MineralProcesses where there has been a massive increase inthroughput over the past few years. Not only has theoperation been able to perform at peak but it has alsomanaged to reduce its impact on the environment atthe same time.
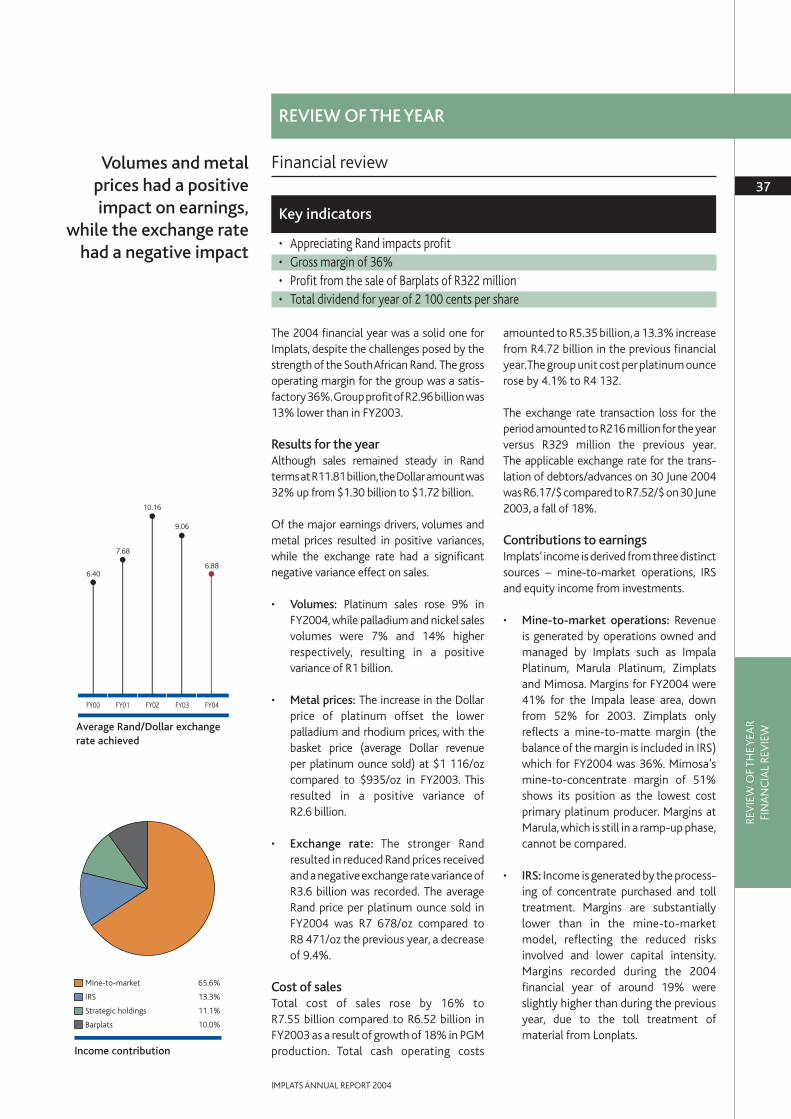
Volumes and metalprices had a positiveimpact on earnings,
while the exchange ratehad a negative impact
The 2004 financial year was a solid one forImplats, despite the challenges posed by thestrength of the South African Rand. The grossoperating margin for the group was a satis-factory 36%.Group profit of R2.96billion was13% lower than in FY2003.
Results for the yearAlthough sales remained steady in Randterms at R11.81 billion,the Dollar amount was32% up from $1.30 billion to $1.72 billion.
Of the major earnings drivers, volumes andmetal prices resulted in positive variances,while the exchange rate had a significantnegative variance effect on sales.
• Volumes: Platinum sales rose 9% inFY2004, while palladium and nickel salesvolumes were 7% and 14% higherrespectively, resulting in a positivevariance of R1 billion.
• Metal prices: The increase in the Dollarprice of platinum offset the lowerpalladium and rhodium prices, with thebasket price (average Dollar revenueper platinum ounce sold) at $1 116/ozcompared to $935/oz in FY2003. Thisresulted in a positive variance ofR2.6 billion.
• Exchange rate: The stronger Randresulted in reduced Rand prices receivedand a negative exchange rate variance ofR3.6 billion was recorded. The averageRand price per platinum ounce sold inFY2004 was R7 678/oz compared toR8 471/oz the previous year, a decreaseof 9.4%.
Cost of salesTotal cost of sales rose by 16% to R7.55 billion compared to R6.52 billion inFY2003 as a result of growth of 18% in PGMproduction. Total cash operating costs
amounted to R5.35 billion,a 13.3% increasefrom R4.72 billion in the previous financialyear.The group unit cost per platinum ouncerose by 4.1% to R4 132.
The exchange rate transaction loss for theperiod amounted to R216 million for the yearversus R329 million the previous year.The applicable exchange rate for the trans-lation of debtors/advances on 30 June 2004was R6.17/$ compared to R7.52/$ on 30June2003, a fall of 18%.
Contributions to earningsImplats’income is derived from three distinctsources – mine-to-market operations, IRSand equity income from investments.
• Mine-to-market operations: Revenueis generated by operations owned andmanaged by Implats such as ImpalaPlatinum, Marula Platinum, Zimplatsand Mimosa. Margins for FY2004 were41% for the Impala lease area, downfrom 52% for 2003. Zimplats onlyreflects a mine-to-matte margin (thebalance of the margin is included in IRS)which for FY2004 was 36%. Mimosa’smine-to-concentrate margin of 51%shows its position as the lowest costprimary platinum producer. Margins atMarula,which is still in a ramp-up phase,cannot be compared.
• IRS: Income is generated by the process-ing of concentrate purchased and tolltreatment. Margins are substantiallylower than in the mine-to-marketmodel, reflecting the reduced risksinvolved and lower capital intensity.Margins recorded during the 2004financial year of around 19% wereslightly higher than during the previousyear, due to the toll treatment ofmaterial from Lonplats.
FY00 FY01 FY02 FY04
Average Rand/Dollar exchangerate achieved
6.40
7.68
10.16
6.88
FY03
9.06
Mine-to-market 65.6%
IRS 13.3%
Strategic holdings 11.1%
Barplats 10.0%
Income contribution
Key indicators
• Appreciating Rand impacts profit• Gross margin of 36%• Profit from the sale of Barplats of R322 million• Total dividend for year of 2 100 cents per share
37
IMPLATS ANNUAL REPORT 2004
Financial review
REV
IEW
OF
THE
YEA
RFI
NA
NC
IAL
REV
IEW
REVIEW OF THE YEAR

Operating margins
(%) FY2004 FY2003
Impala (ex-mine) 41.5 52.3Zimplats 35.7 26.6Mimosa 51.3 37.0Impala Refining Services 18.6 17.2Implats 36.1 44.8
Contribution to profit from the various operations
(R million) FY2004 % FY2003 %
Impala Platinum 1 700 57.3 2 563 75.1Impala Refining Services 394 13.3 151 4.4Marula Platinum (23) (0.8)Barplats* 295 10.0 (35) (1.0)Lonplats 290 9.8 646 18.9Mimosa 112 3.8 11 0.3Zimplats (Makwiro) 156 5.3 46 1.3Aquarius Platinum 39 1.3 33 1.0Implats 2 963 100.0 3 415 100.0* includes profit on disposal
• Equity income: Income is generated bythose companies in which Implats hasequity accountable interests. Thisincludes Lonplats, Aquarius Platinumand Two Rivers, which has not yet comeinto production. In FY2004, equityincome amounted to R328 million.
Impala Platinum’s mining operations con-tinued to be the major contributor toearnings,accounting for 57% of group profitin FY2004. Following a 38% increase inplatinum production through IRS this year,profit from IRS improved by 161% toR394 million.This represents 13% of groupprofit, compared to a contribution of 4%last year.
Contributions to profit by both Zimbabweoperations increased substantially. Thatfrom Mimosa increased from R11 millionin FY2003 to R112 million. With itsincreased production levels, thecontribution by Zimplats/Makwiro rosesubstantially from R46 million to a profitof R156 million, accounting for almost5.3% of group profit.
Earnings from Implats’ investment inLonplats continue to make a contribution togroup income.Attributable income declinedby 55% to R290 million, and thecontribution to group earnings decreased to
10% from 19% last year.Dividends receivedfrom this investment for the period underreview were R285 million (R176 million inFY2003).
Aquarius Platinum (South Africa) increasedits contribution in the 2004 financial periodwith a R39 million profit to the group, ascompared to a contribution of R33 millionin FY2003.
EarningsHeadline earnings per share for the yeardeclined by 23% to 3 966 cents. This com-pares with 5 140 cents per share in FY2003.The 9.4% decrease in the Rand revenue perplatinum ounce sold during FY2004 resultedin headline earnings per share decreasing by1 174 cents. Without this impact, earningsper share would have been on par withFY2003. Given the contribution to profit ofR322 million in June 2004 from the sale ofBarplats, profit for the group as a wholedeclined by 13%.
The impact of a 10% change in the Randrevenue per platinum ounce sold (basketprice) would result in a 30% change inheadline earnings.
There was a slight increase in the number ofweighted shares in issue to 66.58 millionshares.
38
IMPLATS ANNUAL REPORT 2004
FINANCIAL REVIEW
Without the impact ofthe Rand, headline
earnings would havebeen on a par with
FY2003
FY01 FY02 FY03
Headline earnings per share(SA cents)
FY04FY00
3 394
7 035 6 877
5 140
3 966
REV
IEW
OF
THE
YEA
R FI
NA
NC
IAL
REV
IEW

Contribution to attributable production
FY2004 FY2003 FY2004 FY2003(000 oz) Platinum Platinum PGMs PGMs
Impala Platinum 1 090 1 040 1 976 1 924IRS* 871 633 1 749 1 238Lonplats (27.1%) 269 206 505 399Total ounces in which Implats group has an economic interest 2 230 1 879 4 230 3 561Less: Lonplats (269) (206) (505) (399)Gross Implats production 1 961 1 673 3 725 3 162Less: IRS metal returned to toll customers (501) (252) (1 012) (467)Retained for sale by Implats group 1 460 1 421 2 713 2 695
* Lonplats material treated included in IRS production
Note: In line with the attributable earnings stream, it should be noted that for FY2004, Implats had a total economic interestin about 2.2 Moz of platinum and 4.2 Moz PGMs compared to 1.9 Moz and 3.6 Moz respectively in FY2003.
DividendsThe total dividend proposed for the year is 2 100 cents per share,comprising an interimdividend per share of 500 cents, which waspaid in March 2004, and a final dividend pershare of 1 600 cents.This is 21% lower thanthe total dividend declared and proposed inthe last financial year of 2 650 cents a share.
Dividend cover remains at 1.9 times,which isin line with the board’s stated dividend policy.
Exchange rateThe average Rand/Dollar exchange rateachieved for the 12 months to June 2004was R6.88/$,24% stronger than the averagerate of R9.06/$ for the preceding 12 months.This was to Implats’disadvantage given thatalmost all of the group’s earnings aregenerated in Dollars. Implats is generallyunhedged with regard to currencies andmetals.
Balance sheet, structure andcash flowA strong balance sheet is maintained inorder to meet working capital requirementsand to provide internal funding for the bulkof the group’s future capital projects. Thegroup generated cash from operatingactivities of R1.8 billion ($262 million)during the financial year. After funding thegroup’s capital expenditure programmes,dividends and investments, the net closingcash position at the end of the financial year
was R636 million ($103million), down fromR2.1 billion ($282 million) at the end ofFY2003.
Implats continues to maintain a low gearingratio and has substantial debt capacity.Consequently,the group’s weighted averagecost of capital (WACC) is not optimal. Thegroup has short-term borrowings ofR569 million. The use of these borrowingswas driven by the attractive pricing availablefor shorter-term debt.The group will assumelonger-dated debt during the first half of thenext financial year.
With the receipt of the proceeds from thesale of Barplats, the group’s net debtposition as previously forecast did noteventuate.
Investing activitiesGroup capital expenditure amounted to R1 822 million ($265 million) in FY2004.Capital expenditure at the Impala Platinumlease area was R1 197 million ($174 million)compared to R1 079 million ($120 million)the previous year. This was largelyaccounted for by expenditure on the declineprojects. An amount of R505 million($74 million) was spent on Marula Platinumand R116 million ($17 million) onZimbabwean operations.
The group invested R632 million in acquir-ing its additional stake in Zimplats.
39
IMPLATS ANNUAL REPORT 2004
Strong balance sheetmaintained to meet
working capitalrequirements and future
capital projects
FY01 FY02 FY03
Dividend per share (cps)
FY04FY00
1 760
6 800
3 700
2 650
2 100
Dividend per share Special dividend
FY01 FY02 FY03
Gross cash position at year-end(Rm) * includes proceeds from sale of Barplats
FY00
3 107 3 0383 150
FY04
2 325
1 204*
REV
IEW
OF
THE
YEA
RFI
NA
NC
IAL
REV
IEW

When we invested in down-stream beneficiation, it wasnot only about the metal, but also about creating jobsand developing local skills and expertise. Ms PhumzileMlambo-Ncguka, the Minister of Minerals and Energy,officiated at the official opening of the Silplat project (inwhich Implats is a significant partner, along with BAE-SAAB, Silmar SpA and Micofin) in Cape Town in April2004. By supporting this project through both an equityinvestment and an innovative platinum loan facility,Implats has played a role in this export-focussed facilityto attract hard currencies into the country.

Markets characterized by extreme volatility
The markets for PGMs have once again beencharacterized by extreme volatility,which hasbeen mirrored across most commodities andthe major currencies in FY2004.
A combination of a strong Chinese appetitefor commodities and a weak Dollar saw theplatinum price peak at $937/oz in April2004, from a low of $655/oz in July 2003.These highs were unsustainable as marginpressure from Chinese jewellery fabricatorsforced a retreat from the metal, resulting ina drop in demand of close on 20%. Pricessubsequently retraced to the high $700/ozrange, allowing fabricators to replenishinventory pipelines at more realistic levels.
Growth in automotive demand wasinsufficient to prevent overall demand fromdeclining, but still left the market in deficit.
Palladium demand fell once again as thriftingprogrammes from automotive users,resultingfrom the metal’s meteoric rise in the late 90s,reached their peak. The platinum/palladiumprice difference should see more palladiumbeing used at the expense of platinum. Thepalladium price was driven from a low for theyear of $160/oz to its high of $333/oz, onthe back of speculative activity and anannouncement by Umicore that it couldsubstitute palladium for up to 25% of theplatinum used in its own diesel catalysts.
Sustained Dollar weakness and Randstrength are of some concern as this couldimpact on the future availability ofplatinum, and this could drive prices higheronce again. This in turn should stimulatefurther substitution into palladium in theautomotive industry.
Speculative rather than fundamental interestpushed rhodium prices up some 80% to$900/oz. While nickel had an even moredramatic year with its price more thandoubling to $17,770/t on the back of world-wide growth in stainless steel production.
Review of calendar 2003PlatinumThe platinum market registered its fifthconsecutive year of deficit in 2003.However,
the gap narrowed as another year of growingdemand by the automotive industry wasoutweighed by a decline in jewellery demandcoupled with increasing supply.
Jewellery demandThe rising and volatile platinum price finallytook its toll on jewellery consumption withdemand falling by 12% to 2.5 Moz.
In China,the major jewellery market,demandfell by almost 17% to 1.25 Moz.The declineresulted from manufacturers withdrawingfrom the market as margins came underpressure. This is because platinum jewelleryin China is sold at the metal price,unlike othermetal jewellery which is sold on a piece basis.This situation was further exacerbated byreluctance on the part of retailers to increasetheir prices in line with that of the free marketand the outbreak of SARS during the first halfof the year, which curtailed sales. However,platinum still remains the metal of choice inthe fashion jewellery category at theconsumer level. In addition to continuing toextend into the secondary and tertiary cities,platinum has begun to make inroads intothe bridal sector, which has proved to be thecornerstone of other major markets. Thecommencement of platinum trading on theShanghai Gold Exchange in August helpedthe manufacturing industry by eliminatingthe 17% VAT and reducing the consumptiontax on platinum jewellery from 10% to 5%,the onus for payment of which was switchedto the retailer.
Low margins and inventory sales coupledwith a sluggish economy resulted in Japanesedemand dropping by 15% to 675 000 oz.Total sales on a piece and value basis declinedby 11% and 1% respectively compared withthe previous year. This decline was almostentirely due to a 20% decrease in sales in thelower price brackets of up to ¥50 000. Salesin the higher price segments in most casesrecovered.The strong in-roads made by whitegold at the expense of platinum since thestart of the decade ceased in 2003.Platinum’smarket share on a piece basis was unchangedat 26%,with white gold’s 5% increase to 37%coming at the expense of its sister metal,yellow gold.
Free market platinum price($/oz) (monthly average)
FY2000 FY2001 FY2002 FY2003 FY2004300
400
500
600
700
800
900
0
500
1000
1500
2000
2500
3000
Jewellery demand – platinum(000oz)
2000 2001 2002 2003 2004*
China North America
Europe India and other
Japan
* estimate
41
IMPLATS ANNUAL REPORT 2004
Market review
REV
IEW
OF
THE
YEA
RM
ARK
ET R
EVIE
W

Platinum supply and demand
Calendar years (000 oz) 2004* 2003 2002 2001 2000
DemandAutomobile 2 800 2 735 2 615 2 205 1 950Jewellery 2 170 2 500 2 845 2 590 2 830Industrial 1 660 1 590 1 565 1 560 1 490Investment 10 15 80 90 (60)Demand 6 640 6 840 7 105 6 445 6 210SupplySouth Africa 4 885 4 650 4 455 4 120 3 780Russia 800 1 000 950 1 100 1 150Other 430 400 635 495 400Recycling 650 615 590 555 535Supply 6 765 6 665 6 630 6 270 5 865Surplus/(Deficit) 125 (175) (475) (175) (345)* Estimate
In the US, sales of platinum jewellery werevirtually unchanged at around 300 000 oz.Sales in the bridal sector were up year-on-year despite the introduction of new lines inwhite metal such as titanium weddingbands for men. As was the case last year, itwas fashion jewellery and in particular thelower price brackets, that bore the brunt ofthe rising and fluctuating metal price asmanufacturers moved into white gold. Onthe other hand, sales at the top end of thissegment remained resilient.
Automotive industryPlatinum demand for use in autocatalystsrose by 5% in 2003 to 2.74 Moz. Stronggrowth in European diesel car sales,tightening emission legislation and anincrease in light duty vehicle sales in the restof the world drove the increase in demand.
Low interest rates and cash-back incentiveson new vehicle purchases continued tounderpin US light vehicle sales whichtotaled 16.7 million units, only 1% lowerthan the previous year. Light trucks onceagain took market share from cars and nowaccount for just over 53% of the total lightvehicle market. Because of their largerengine size, light trucks generally requirelarger catalysts with higher loadings to meetthe emission standards than do their pas-senger car counterparts.The pre-empting bysome auto manufacturers of the Tier 2 andLEV2 standards (both of which took effectfrom the start of 2004) in order to obtainemission credits, also boosted demand.
Diesel car sales continue to be the main driverof platinum demand in Europe. In 2003,dieselsales grew by almost 7% to 6.2 million unitsand now account for 43.6% of total new carregistrations. Compared to gasoline engines,diesels operate with more air,which results incooler combustion and lower exhausttemperatures. This environment requires aplatinum catalyst,often with higher loadings,to enable the required oxidation performance.
Demand in the rest of the world was drivenby a combination of rising car sales,particularly in Asia, and the spread andadoption of tighter standards.
PalladiumThe fundamentals for palladium have beenanaemic, with falling demand and risingprimary supply and stockpiles. The biggestimpact on the market was the dramaticincrease in Russian deliveries,which resultedin a surplus of approximately 800 000 oz.
The cycle of substitution of palladium-basedsystems with platinum has probably ended,asthe huge price gap between the two metalshas rendered the switch uneconomic. Usagefor 2003, at just over 4.3 Moz was at a five-year low.
Consumption of palladium by the electonicsindustry fell by 13% to 850 000 oz, despitean almost 20% increase in the growth ofmulti-layer ceramic capacitors.This was dueto a combination of miniaturization,thriftingand displacement by base metals.
42
IMPLATS ANNUAL REPORT 2004
MARKET REVIEW
The automotive industrywill be the major driver
of platinum demand in the medium to
long term
Free market palladium price($/oz) (monthly average)
FY2000 FY2001 FY2002 FY2003 FY2004100
200
300
400
500
600
700
800
900
1 000
1 100
Automotive demand – platinum(000oz)
2000 2001 2002 2003 2004*0
500
1000
1500
2000
2500
3000
Europe Asia**
North America Other
* estimate
** includes China since 2003
REV
IEW
OF
THE
YEA
R M
ARK
ET R
EVIE
W

Rhodium supply and demand
Calendar years (000 oz) 2004* 2003 2002 2001 2000
DemandAutomobile 628 630 632 614 574Other 93 90 92 101 98Demand 721 720 724 715 672SupplySouth Africa 557 523 505 455 414Russia 80 120 90 125 290Other 37 26 28 22 19Recycling 127 115 107 98 90Supply 801 784 730 700 813Surplus/(Deficit) 80 64 6 (15) 141* Estimate
Palladium supply and demand
Calendar years (000 oz) 2004* 2003 2002 2001 2000
DemandAutomobile 4 690 4 325 4 530 5 435 5 275Dental 870 835 785 720 820Electronics 865 850 980 1 275 2 160Other 605 585 605 550 570Demand 7 030 6 595 6 900 7 980 8 825SupplySouth Africa 2 425 2 250 2 175 1 985 1 830Russia 2 700 3 400 1 900 4 500 5 200Other 1 860 1 300 2 680 2 140 935Recycling 520 450 390 340 280Supply 7 505 7 400 7 145 8 965 8 245Surplus/(Deficit) 475 805 245 985 (580)* Estimate
RhodiumRhodium demand was essentiallyunchanged during 2003 due to the shiftfrom petrol to diesel vehicles. An increasein Russian supplies during the year ledthe market to a surplus of some60 000 oz, resulting in the low pricesachieved.
NickelNickel had a spectacular year in 2003with the price starting from just above$8 000/t and rising to a high of over$17 500/t in January 2004.
This growth was on the back of a deficit inthe physical market due to huge globaldemand led by China, and tight supply as aresult of the Inco strike. Prices cooled downsubsequently on attempts by the Chineseauthorities to slow their economy.
Market prospectsCurrently, all indications are that theautomotive industry will be the major driverof platinum demand in the medium to longerterm. A significant portion of this futuredemand will come from both light-duty andheavy-duty diesel emission control tech-nologies that are dominated by platinumformulations.
Supported by jewellery demand, the marketis forecast to remain in equilibrium which inturn will be supportive of a firm pricing regime.
A combination of rekindled automotivedemand together with new applications in amore stable price environment should boostpalladium demand in the longer term. In thecase of rhodium, stricter emmission controllegislation will continue to drive demand inthe future.
43
IMPLATS ANNUAL REPORT 2004
Free market nickel price($/t) (monthly average)
FY2000 FY2001 FY2002 FY2003 FY20044 000
6 000
8 000
10 000
12 000
14 000
16 000
Free market rhodium price($/oz) (monthly average)
FY2000 FY2001 FY2002 FY2003 FY20040
500
1 000
1 500
2 000
2 500
Automotive demand – metal(000oz)
2000 2001 2002 2003 2004*0
1000
2000
3000
4000
5000
6000
7000
8000
9000
Platinum Palladium
Rhodium
* estimate
REV
IEW
OF
THE
YEA
RM
ARK
ET R
EVIE
W

Mining companies must gowhere the orebodies are, andone of the greatest unexploitedplatinum orebodies in the worldis the Great Dyke in Zimbabwe.Its investments in Mimosa andZimplats give Implats accessto a significant resource and, bya considered, conservative andphased approach to a build-upin production, is developing oneof the great platinum producingregions of the world. HerbMashanyare is the TechnicalDirector at Mimosa.

REV
IEW
OF
THE
YEA
RIM
PALA
PLA
TIN
UM
Implats has four mining (mine-to-market) operations, Impala Platinum and Marula Platinum,located on the Bushveld Complex in South Africa, and Zimplats and Mimosa Platinum, on theGreat Dyke in Zimbabwe.These operations, together with Impala Refining Services (IRS) whichhouses Implats’ offtake and toll refining agreements, employed approximately 31 600 peopleand produced 1.961 Moz attributable platinum ounces (3.725 Moz PGMs) during FY2004.
Barplats, in which Implats had an 83.2% stake,was sold in May 2004 for R389 million,followingthe cessation of mining operations at Crocodile River, Barplats’ wholly-owned operatingsubsidiary, in December 2003.
A detailed discussion on these issues as well as other matters pertaining to sustainabledevelopment can be found in the group’s Corporate Responsibility Report 2004 to be publishedin October 2004.
REVIEW OF OPERATIONS AND INTERESTS
45
IMPLATS ANNUAL REPORT 2004
Introduction
Implats’ primary mining operation, ImpalaPlatinum,operates on the Impala lease area,on the western limb of the BushveldComplex, north of the town of Rustenburg,North West Province, South Africa. Inaddition to the mining operation, ImpalaPlatinum includes Mineral Processes, thegroup’s smelting and concentrating plants,also located on the Impala lease area, andthe Refineries, which includes both the baseand precious metals refineries, in the townof Springs, Gauteng, South Africa.
The Impala Platinum mining operationproduces around 1.0 to 1.1 Moz platinum(1.9 to 2.0 Moz PGMs) annually. An essentialelement of Impala’s 30-year life-of-mineplan is to maintain production at this level.With recent expansion programmes, bothMineral Processes and Refineries will havethe capacity to process 2 Moz of platinum,with much of this additional spare capacitybeing utilised by IRS to process materialfrom Implats’ other managed operationsand toll refining.
During FY2004, Impala reported recordproduction of both 15.6 Mt milled andrefined platinum production of 1.09 Moz.Atthe same time, increases in costs were well-contained. The cost per platinum ounceproduced rose by only 5%, in spite of anincrease in wages of 9.5%.
Safety, health and environmentSafety: Regrettably, eight fatal accidentsoccurred during the year of which six werecaused by falls of ground. Intensified effortsregarding the safety and health ofemployees continued. LTIFR decreased by13% year-on-year to 5.30 per million manhours, while the FIFR remained constant at0.10 per million man hours.
A campaign to reduce the number andimpact of falls of ground continued todeliver some improvement with fall ofground incidents decreasing by 6%.As partof this campaign, an underground fall ofground simulation centre was set up andduring the course of next year, all
Implats produced arecord 1.961 Moz
platinum during FY2004
FY01 FY02 FY03
Impala – Lost time injuryfrequency rate (LTIFR) per millionman hours
8.54
FY04
8.58
12.64
6.07
5.30
FY00
Key features of the year
• LTIFR improved by 13%• Increase in cost per platinum ounce limited to 5.0%• 4% increase in tonnes milled to 15.6 Mt• 5% increase in platinum production to 1.090 Moz• Concentrator recoveries rise to 83.2%• Productivity per platinum ounce up 8%
Impala Platinum

REV
IEW
OF
THE
YEA
RIM
PALA
PLA
TIN
UM
employees will be exposed to this. TheTsiboga intervention (Tsiboga means “onthe look out” in Tswana), which is based onthe well-known Du Pont safety principles,continued. All shaft supervisors are nowtrained to conduct safety audits.
The Refineries had another satisfactoryyear with an LTIFR of 0.45. The Tsibogaprogramme continues to run well, withover 2 000 internal audits having beenundertaken during the year.
Health: Pre-employment and exit medicalexaminations are undertaken for allemployees and contractors.Noise-inducedhearing loss and tuberculosis (TB) remainthe primary occupational health chal-lenges at Impala.
A hearing conservation programme,including annual audiometric testing of all
employees, has continued. A baseline riskassessment for noise was conducted todetermine the noise levels that employeesare exposed to. Some R6 million was spentduring the year on fitting all employees withcustom-made hearing protection devices.
Pulmonary TB is classified as an occu-pational disease in terms of the regulationsgoverning the South African miningindustry. Of the total Impala workforce,297 employees developed pulmonary TBduring the year (289 in FY2003). Theincrease is attributed to HIV-positiveindividuals who are at a higher risk ofcontracting TB; 95% of TB patients are HIV-positive. World-class programmes arein place to combat the disease, includingeducation, contact tracing, and directlyobserved treatment (DOT) regimes. Thesehave been supported by the introduction ofprophylactic TB treatment for HIV-positiveemployees and the inclusion of all con-tractor employees within the TB treatmentprogramme.
HIV/AIDS: There was continued focus onHIV/AIDS education and management foremployees, dependents and surroundingcommunities during the year.HIV test datacollected by Impala Medical Services andmodelling undertaken by external con-sultants indicates that the HIV-prevalencerate among employees on the Impala leasearea has levelled off at around 16%, whichis lower than levels for similar adult groupsin the country as a whole. At the Refineries,3.5% of employees are currently known tobe HIV-positive.
Regrettably 75 employees (FY2003:86 employees) died in service as a result ofknown AIDS-related illnesses during the year.
The cost of care of HIV-positive employeestotalled R6.2 million in medical treatmentduring the year. Although Impala’s preva-lence level is lower than that reported foradult populations around the country, theimpact of HIV on the individual and thecompany cannot be underestimated. Themajor challenge remains overcoming thestigma associated with the disease, whichwould encourage more employees toundertake voluntary counselling and testingand to access treatment.
46
IMPLATS ANNUAL REPORT 2004
IMPALA PLATINUM
Current shafts
Decline Projects
New planned shafts
Anomalies and major faulting
18#
17# Dec
16# Dec
16#
11C#Dec
14#Dec
11#
14#
12#
8#
6#
7#
7A#
4#
5#
2A# 2#9#
1#
17#
17A#
19#
19#Dec
21#
20#
12N#
12S#
14B#Dec
10#
N
FY01 FY02 FY03
Impala – Fatal injury frequencyrate (FIFR) per million man hours
0.161
FY04
0.146
0.088
0.099 0.099
FY00
Location map of the Impala lease area

47
IMPLATS ANNUAL REPORT 2004
REV
IEW
OF
THE
YEA
RIM
PALA
PLA
TIN
UM
Environment: Highlights of the year werethe maintenance of the ISO 14001certification and the significant reductionin SO2 stack emissions as a result of theexcellent performance of the Sulfacidplant. Prior to the commissioning of thisplant in FY2003, SO2 emissions averaged37 t/day.At commissioning this decreasedto 29 t/day and for FY2004, SO2 emissionsaveraged less than 20 t/day, in line withscheduled process permit conditions.
The Environmental Impact Assessment forthe Refineries expansion projects wassuccessfully concluded during the year,andall environmental pre-requisites for theexpansion have now been met. TheRefineries maintained their NOSCARstatus for the sixth year, and their NOSA 5-star safety grading for the twentieth year,an excellent achievement. In addition, theISO 9001 and ISO 14001 certifications forquality and environmental systems weresuccessfully maintained.
Mining Impala Platinum’s mining operations coveran area of approximately 250 km2 andinclude 13 shaft systems and five declines,of which two are currently at full productionand three are in development.
During FY2004, the record level of tonnesmilled was largely a result of higher levels ofoutput from both mechanized and opencastmining on the Merensky reef.
Among the best performing shafts were 4,7, 7A and 12 shafts, with the latterincreasing production due to mech-anisation. In particular, opencast produc-tion rose by 32% to 711 000 t. Difficultieswere experienced at 5 and 11 shafts wheretonnes mined did not achieve business plantarget. The complex geological structuresat 11 shaft continued to be problematicand the reduced panel lengths, aconsequence of tighter safety standardsimplemented in the ground controldistricts, also played a part in constrainingproduction. At 5 shaft, which is nearing theend of its life, production was affectedby decreasing ore reserves and a lack ofavailable face.
The liquidation of the mining contractorresponsible for semi-mechanized opera-tions at 14 shaft had a temporarily adverseeffect on production. New employees arebeing recruited and trained to manage andoperate this section and production hassince improved markedly.
Volumes were also supported by theincreased mining of so-called white areas(unmined remnants in old mining areas).Much work has been done to identify andestimate the resources contained in thewhite areas and to convert these resourcesinto proven reserves. This has enabledthe identification of around 12 Mt(800 000 platinum ounces) of additionalreserves.
Current shafts
20 Shaft
E&FBlock
14B Shaft
11C Shaft
16 Shaft17 Shaft
18 Shaft
19 Shaft
21 Shaft
16 Decl
17 DeclOpencast UG2Opencast Merensky
Planned 30-year production profile by shaft
Mill
ions
of t
onne
s min
ed
0
2
4
6
8
10
12
14
16
18
FY05
FY07
FY08
FY10
FY12
FY14
FY16
FY18
FY20
FY22
FY24
FY26
FY28
FY30
FY32
FY34
FY06
FY09
FY11
FY13
FY15
FY17
FY19
FY21
FY23
FY25
FY27
FY29
FY31
FY33
Volumes were supportedby mining ‘white areas’ –unmined remnants in old
mining areas

There was an expected decline in theheadgrade from 5.06 g/t to 4.91 g/t, largelybecause of changes in the ore mix withgreater volumes originating frommechanized and opencast mining. Platinumcontent relative to PGM content increasedwith production rising to 1.090 Mozplatinum and that of PGMs to 1.976 Moz.
The cash operating cost per ounce ofrefined platinum produced rose by 5.0% toR4 023/oz.The total cash cost per tonne roseby only 5.7%. On-mine costs were up 6.4%from R188/t mined to R200/t mined.Increases in the prices of steel,power and fuelwere largely responsible for this rise in costs.
Productivity measured as centares per panelman decreased from 40.7 m2 par panel manto 39.2m2 per panel man. This was a resultof the reduced panel lengths which in turnwas due to the implementation of tightersafety standards related to the fall of ground
safety programme.Overall platinum ouncesper employee rose by 8% as a result of thedecline in the number of support employeesof around 900, higher mined volumes fromless labour intensive areas (opencastand mechanized mining), and highermetallurgical recoveries.
Planned mining projectsA major R5.3 billion capital expenditureprogramme on mining projects is currentlyunderway at Impala, of which R3.5 billionhad been spent by the end of the 2004financial year, mostly on the developmentof the decline projects. This programmeaims to maintain production from the leasearea at between 1 Moz and 1.1 Moz ofplatinum annually and involves extendingthe lives of existing shaft systems andcreating new access to deeper reserves.Thesecond generation shafts, which extend toabout 800 m below surface, are nearing theend of their working lives.
REV
IEW
OF
THE
YEA
RIM
PALA
PLA
TIN
UM
48
IMPLATS ANNUAL REPORT 2004
IMPALA PLATINUM
Five-year key operating statistics
FY2004 FY2003 FY2002 FY2001 FY2000
Tonnes milled (000 t) 15 639 15 042 14 850 14 840 14 662UG2 milled (%) 46.1 45.7 53.6 49.6 50.6Headgrade (g/t 5PGE+Au) 4.91 5.06 5.05 4.90 4.97Platinum production (000 oz) 1 090 1 040 1 025 1 002 1 020PGM refined production (000 oz) 1 976 1 924 1 895 1 877 1 913Total cost/tonne milled (R/t) 280 265 239 213 189
($/t) 40.8 29.4 23.6 28.0 29.8Cost/platinum ounce refined (R/oz) 4 023 3 832 3 459 3 156 2 711
($/oz) 586 425 341 415 429Net of revenue received for (R/oz) 2 182 899 (708) (1 879) (510)other metals ($/oz) 318 100 (70) (247) (81)Cost/PGM ounce refined (R/oz) 2 220 2 072 1 872 1 685 1 445
($/oz) 323 230 185 221 229Capital expenditure (Rm) 1 197 1 079 1 009 978 732
($m) 174 120 100 129 116Total Impala labour complement (000) 27.5 28.4 27.9 28.0 28.3Productivity (m2/panel man) 39.2 40.7 40.2 40.7 39.6
(Ounces/employee) 40 37 37 36 36
Production
(000 t) FY2004 FY2003 % change
Conventional miningMerensky 7 087 7 631 (7.1)UG2 7 217 6 873 5.0
Mechanized mining (Merensky) 624 36 1 633.3Opencast mining (Merensky) 711 538 32.3Total mining 15 639 15 042 4.0

The development of a series of decline shaftsystems below the current third generationshafts, is progressing on schedule. Two outof the five declines are functioning at fullproduction and a further two will reach fullproduction in the next financial year.
As part of the 30-year production plan, 16and 20 shafts were reviewed to optimize theirmining plans.These plans will be presented tothe Implats board for approval in September2004. This follows in-depth and extensiveinvestigation and feasibility studies whichwere undertaken during FY2004.
Development of new technologyMechanisation, particularly in hazardousareas, should enhance safety as the moredangerous, arduous work will be done withthe aid of machines. This will reduceemployee exposure in high-risk areas andenable the introduction of more effectivesupport in the stope face.
The in-stope drill-jig allows for more accuratedrilling and reduced drilling time, improvedface advance per blast, as well as betterinitiation efficiencies and reduced blastdamage to surrounding rock. Impala hasengaged with representatives of the NationalUnion of Mineworkers (NUM),to facilitate itsintroduction into the workplace. Progress onthe hard-rock cutting technology project hasbeen satisfactory and the dust problems thatare being experienced are being addressed.Underground trials of the extra-low profiletrackless equipment, which can operate at amining height of less than 1.3 m, continued.
Employee relationsA significant achievement of the period wasthe signing of a two-year wage agreementwith all three recognized trade unions.Although some difficulties were experiencedregarding the implementation of aspects ofthe agreement The rockdrill operators whoembarked on an unprotected strike in Junewere re-engaged upon signing of a strikeagreement with NUM. The grievances thattriggered the strike are being addressed.
The company and NUM are currently indiscussions to re-negotiate wages under thetwo-year agreement reached last year. Thatagreement provides for an increase of 1.5%above CPIX in the second year but allowed
either party to re-open negotiations onwages only should the resultant increases beless than 7.5% or more than 9%. CPIX forFY2004 was 5%, necessitating the re-opening of negotiations which are currentlyunderway.
Mineral ProcessesMineral Processes houses the group’sconcentrating and smelting operations, andprocesses ore and concentrate from bothImpala’s own mining operations and onbehalf of IRS. Mineral Processes performedexceptionally well during the year withtonnes milled, recovery rates and smelterthroughputs at record levels.
Tonnes milled for the year amounted to15.6 Mt, 4% up on FY2003. Overall con-centrator recoveries improved to give arecord overall recovery rate, given the oremix, of 83.2% for the year. This was largelythe outcome of various process optimiza-tion initiatives undertaken at the UG2 plantand additional initiatives are in place toincrease UG2 recoveries further in thecoming financial year.
A full-scale high-energy tails scavengingplant at the tailings dam was commissionedin December 2003 and has proved capableof yielding an extra 10 000 oz of platinumannually. The plant treats current arisingflotation tailings and will contribute 1% tothe overall recovery rate in FY2005.
The performance of the smelter exceededexpectations, especially once the new No 6dryer became operational. This, combinedwith record mining production, enabledMineral Processes to process record grossoutput.
RefineriesThe Refineries excelled in all areas ofoperation. The all-time high gross refinedplatinum production reflected an increaseof 17% on the previous financial year, andresulted in a decrease in gross costsper platinum ounce of 1% and a 2%decrease in gross cost per PGM ounce. Theincreased throughput was achieved in spiteof certain process bottlenecks, which arebeing addressed through expansion capital.Metal recoveries and pipeline inventorieswere unchanged.
49
IMPLATS ANNUAL REPORT 2004
REV
IEW
OF
THE
YEA
RIM
PALA
PLA
TIN
UM
The performance of thesmelter exceeded
expectations

REV
IEW
OF
THE
YEA
RIM
PALA
PLA
TIN
UM
At the Base Metals Refinery, the new mill isoperating satisfactorily, the expandedsecond stage leach is being commissionedand the construction of an additional nickelsintering furnace has progressed well. Thenew 132kV sub-station (with interruptionprotection) has been operating since Apriland has resulted in the Refineries beingspared the all too-frequent interruptions inpower due to cable theft and power dips.
At the Precious Metals Refinery, an engi-neering, procurement and constructionmanagement contract has been signed forthe second phase of the expansion and theearly civil work has begun. This workfocusses on control and the attenuation ofgaseous and liquid effluent streams.
The first high-purity hydrogen gas wasreceived from SASOL 1 plant at the end ofMarch 2004.The conversion to piped hydro-gen (as opposed to the on-site reforming ofhydrogen-rich producer gas) has been ahuge success and places the Refineries in astrong position for future expansion.Hydro-gen consumption (used for the metalliza-tion of nickel and cobalt) declinedimmediately and there has been a virtualelimination of the venting of the green-house gas CO2, a by-product of thereforming process.
Research and developmentAs a significant user of ion-exchangetechnology in the refining of PGMs, theresearch and development programme hasfocussed on furthering the advantages ofthis technology. This has been a two-foldapproach in both optimising existing ion-exchange resins, and exploring new, moreefficient and cost-effective alternative ionexchange methods. Significant progress
has been made in this regard whichwill manifest itself in commerciallyadvantageous systems within the next twoyears.
In addition,the programme aimed at furtherimproving the Refineries’ ability to recyclesecondary materials internally (that werepreviously sent to external toll refiners atsignificant cost) has progressed withappreciable savings being realised.
Capital expenditure Total capital expenditure for FY2004 wasR1 197 million of which R814 million (68%)was on mining, R146 million (12%) onMineral Processes and services, andR237 million (20%) on Refineries. Spend onmining was below budget as decisionsrelating to the planned 16 and 20 shaftswere postponed as these projects were re-evaluated and optimized.Provided the plansfor these shafts are approved by the board inSeptember 2004, they are likely to come onstream in FY2009 and FY2011 respectively.
OutlookTonnes milled are expected to remainsteady in the forthcoming year at around16 Mt with attention being focussedoperationally on improving headgrade,recoveries and productivity, in particular.Refined platinum production by Impalawill increase to around 1.1 Moz for FY2005.Plans are in place to limit cost increasesin line with inflation.
Capital expenditure on the Base MetalsRefinery will be on the holistic expansion ofthat plant,while that on the Precious MetalsRefinery will be to ensure that its expansionto 2 Moz complies with environmentallegislation.
50
IMPLATS ANNUAL REPORT 2004
IMPALA PLATINUM
Capital expenditure wasR1 197 million – 68%
on mining, 12% atMineral Processes and
20% at Refineries
Mining 68%
Mineral Processes 12%
Refineries 20%
Impala – Capital expendituresplit FY2004
Mining 60%
Mineral Processes 11%
Refineries 29%
Impala – Capital expendituresplit FY2005
Impala lease area – cash operating costs
FY2004 FY2003 % change
Per tonne milled (R) 280 265 (5.7)($) 41 29 (41.4)
Per PGM ounce (R) 2 220 2 072 (7.1)($) 323 230 (40.4)
Per platinum ounce (R) 4 023 3 832 (5.0)($) 586 425 (37.9)

Impala Platinum key statistics
FY2004 FY2003 % change
Mining sales (Rm) 7 679.2 8 877.5 (13.5)Platinum 5 667.6 5 826.2 (2.7)Palladium 711.5 1 220.9 (41.7)Rhodium 422.0 936.2 (54.9)Nickel 575.2 545.1 5.5Other 302.9 349.1 (13.2)
Mining cost of sales (4 495.9) (4 230.4) (6.3)On-mine operations (3 122.4) (2 824.3) (10.6)Concentrating and smelting operations (715.6) (624.9) (14.5)Refining operations (337.3) (312.3) (8.0)Amortisation of mining assets (481.5) (344.0) (40.0)Increase/(decrease) in metal inventories 160.9 (124.9) (228.8)
Gross profit from mining 3 183.3 4 647.1 (31.5)(Loss)/profit from metal purchase transactions (Rm) (1.7) 14.3 (111.9)Metal purchase sales 3 419.5 2 463.2 38.8
– IRS 3 187.5 2 459.8 29.6– Other 232.0 3.4 6 723.5
Metal purchase cost of sales (3 421.2) (2 448.9) (39.7)– IRS (3 176.8) (2 445.5) (29.9)– Other (244.4) (3.4) (7 088.2)
Gross profit 3 181.6 4 661.4 (31.7)Gross margin ex-mine (%) 41.5 52.3Other operating expenses (210.6) (224.6) 6.2
Sales volumes ex-minePlatinum (000 oz) 1 070.5 1 080.0 (0.9)Palladium (000 oz) 471.9 498.6 (5.4)Rhodium (000 oz) 116.1 154.9 (25.0)Nickel (000 t) 7.1 7.9 (10.1)
Sales volumes metals purchased – IRS
Platinum (000 oz) 383.2 273.7 40.0Palladium (000 oz) 257.6 179.5 43.5 Rhodium (000 oz) 49.0 35.3 38.8 Nickel (000 t) 5.4 3.7 45.9
Sales volumes metals purchased – Other
Platinum (000 oz) 26.1 –Palladium (000 oz) – –Rhodium (000 oz) 11.2 0.2
Prices achieved ex-minePlatinum ($/oz) 767 596 28.7Palladium ($/oz) 219 265 (17.4)Rhodium ($/oz) 519 650 (20.2)Nickel ($/t) 11 758 7 518 56.4
Exchange rate achieved ex-mine (R/$) 6.92 9.11 (24.0)Production ex-mine
Tonnes milled ex-mine (000 t) 15 639 15 042 4.0 Platinum refined (000 oz) 1 090.3 1 040.1 4.8 Palladium refined (000 oz) 501.2 477.6 4.9 Rhodium refined (000 oz) 116.1 134.3 (13.6)Nickel refined (000 t) 6.9 8.0 (13.7)PGM refined production (000 oz) 1 975.5 1 923.5 2.7
Total costper tonne milled (R/t) 280 265 (5.7)
($/t) 41 29 (41.4)per PGM ounce refined (R/oz) 2 220 2 072 (7.1)
($/oz) 323 230 (40.4)per platinum ounce refined (R/oz) 4 023 3 832 (5.0)
($/oz) 586 425 (37.9) net of revenue received for other metals (R/oz) 2 182 899 (142.7)
($/oz) 318 100 (218.0)Capital expenditure (Rm) 1 197 1 079 (10.9)
($m) 174 120 (45.0)
51
IMPLATS ANNUAL REPORT 2004
REV
IEW
OF
THE
YEA
RIM
PALA
PLA
TIN
UM

52
IMPLATS ANNUAL REPORT 2004
A new plan incorporatinga revised mining
method has beendeveloped
Marula Platinum, Implats’ second SouthAfrican mining operation, is located on theeastern limb of the Bushveld Complex inLimpopo Province. Ownership of 20% ofMarula has been allocated to BEE interests.Of that 20%,10% will be owned by MmakauMining, (a BEE mining company), 5% by theMarula Community Trust (representingmembers of the local communities) and 5%will be held directly by local business andcommunities.
Marula is managed by a small core Implatsteam and the mining, concentratoroperations and associated services areoutsourced to contractors.Marula has a life-of-mine concentrate offtake agreementwith IRS.
Safety, health and environmentSafety: Regrettably, there was one fatalaccident during the year, at the Claphamdecline, a result of a fall of ground and theLTIFR increased to 3.87 per million manhours. This deterioration was largely afunction of the mine being in a ramp-upphase with a corresponding increase in thenumber of employees displayed under-ground. A number of initiatives have beenlaunched at Marula to improve safety,including a fall of ground campaign and the
assessment of the safety behaviour oftrainees in the workplace.
Health:Two clinics have been established totreat occupational injuries or diseases andto provide primary health care for allemployees and contractors working at themine and plant. Emergency air ambulanceevacuation services have been contracted totransport seriously injured patients to thenearest trauma centre in Polokwane. Allemployees and contractors undergo annualoccupational health fitness examinations inaccordance with group standards at thenearby Dilakong Clinic.
HIV/AIDS: Marula has implemented theImpala HIV/AIDS education andmanagement model for its employees andcontractors.
Environment: The Impala environmentalmanagement system, which had beenadopted at Marula, was extended to includethe principles embodied in ISO 14001 witha view to having an ISO audit in the future.
Water, both its management and quality, isa key environmental focus area at Marula,particularly as the mine operates in an aridregion and both the Clapham and Driekop
Key features of the year
• LTIFR of 3.87• Metallurgical plant and surface infrastructure commissioned and fully operational• Mining development behind schedule, hampered by geological conditions and
inappropriate mining method• Platinum in concentrate production of 13 280 oz for FY2004• Revised mining plan developed• Capital expenditure to date of R1.2 bn• BEE plans being finalised
Marula Platinum
Key statisticsMineral Reserves UG2 41.3 MtMineral Resource Merensky and UG2 66.6 MtLife-of-mine Phase 1 25 yearsCurrent production (Phase 1) Platinum in concentrate 13 280 ozPlanned production (Phase 1) Platinum in concentrate 125 000 ozCapital expenditure Phase 1 R1.8 bnNo. of employees At full production 2 650
FY02 FY03
Marula Platinum – Lost timeinjury frequency rate (LTIFR) permillion man hours
FY04
2.36
1.65
3.87
FY02 FY03
Marula Platinum – Fatal injuryfrequency rate (FIFR) per millionman hours
FY04
0.00.00.2
REV
IEW
OF
THE
YEA
RM
ARU
LA P
LATI
NU
M

FY04 FY05 FY06
Marula Platinum – Ramp-up intonnes mined(000t)
585
FY07
1 304
178
1 953
2 123
FY03
FY05 FY06
Marula Platinum – Platinum inconcentrate(000oz)
46.4
FY07
13.3
88.7
114.8
FY04
REV
IEW
OF
THE
YEA
RM
ARU
LA P
LATI
NU
M
53
IMPLATS ANNUAL REPORT 2004
shafts will have to be de-watered as miningprogresses. Waste management is alsoreceiving attention.
Mining operationsMarula is one of the first operations to havebeen developed on the relatively under-exploited eastern limb. Although themetallurgical plant and surface infra-structure were delivered on schedule,development of underground miningoperations at Marula is substantiallybehind schedule. This is as a result of aninitially inappropriate mining method andunexpected geological conditions. Inparticular, the steeper dips affectedmechanized machine efficiencies whichalso aggravated the extent of dilution bywaste. Consequently, production wasseverely affected with only 13 280 ouncesof platinum in concentrate being producedin FY2004.This compares with planned fullproduction of 100 000 platinum ouncesper annum, scheduled for the first quarterof FY2005 in terms of the original plan.
A new plan incorporating a revised miningmethod has been developed. The revisedmethod is based on conventional stopingtechniques and mechanized strikedevelopment. This will entail a reducedmining height which will, in turn, limit thedilution significantly and improve the run-of-mine grade, thus improving theeconomics of the operation.
On-reef development was hampered by arolling reef and steeper dips. Changes weremade to the mine layout in order to allowfor the development of the decline inthe footwall. This will allow for fasterdevelopment rates.
The new mining plan will focus onthe entire UG2 orebody, and fullproduction is planned at 211 000 run-of-mine tonnes a month. There will also be aslower build-up in tonnage than originallyplanned but of a higher grade, yielding125 000 oz of platinum in concentrateannually. The initial target of 100 000platinum ounces (annualised) is nowscheduled for FY2006 with full productionexpected to be reached in the last quarterof FY2007.
ProcessingThe metallurgical plant was cold com-missioned on schedule in December 2003with hot commissioning completed inFebruary 2004. The dense mediaseparation (DMS) plant was commissionedbut subsequently by-passed as the mills,which have a capacity of 6 000 t/day, areable to cope with current levels of mineproduction.The DMS plant will be broughtback into production as tonnages increase.The overall metallurgical recovery isexpected to be in the region of 87% of run-of-mine grades.
Capital expenditureFor the 2004 financial year, capital expen-diture amounted to R505 million, bringingthe total project cost to R1.2 billion. Capitalexpenditure during FY2005 is planned atR342 million.
OutlookThe revised mining plan, which projectsrefined platinum production of 125 000 ozannually by FY2008, indicates a life-of-mineof 25 years. A pre-feasibility study on themining of the Merensky Reef (Phase 2) hasbeen completed. A decision on whether toproceed with this phase will be made in duecourse, depending on the Rand/Dollarexchange rate and market circumstances.
FY03 FY05
Marula Platinum – Capitalexpenditure(Rm)
544
FY07
173
505
200
FY02 FY06FY04
342
131
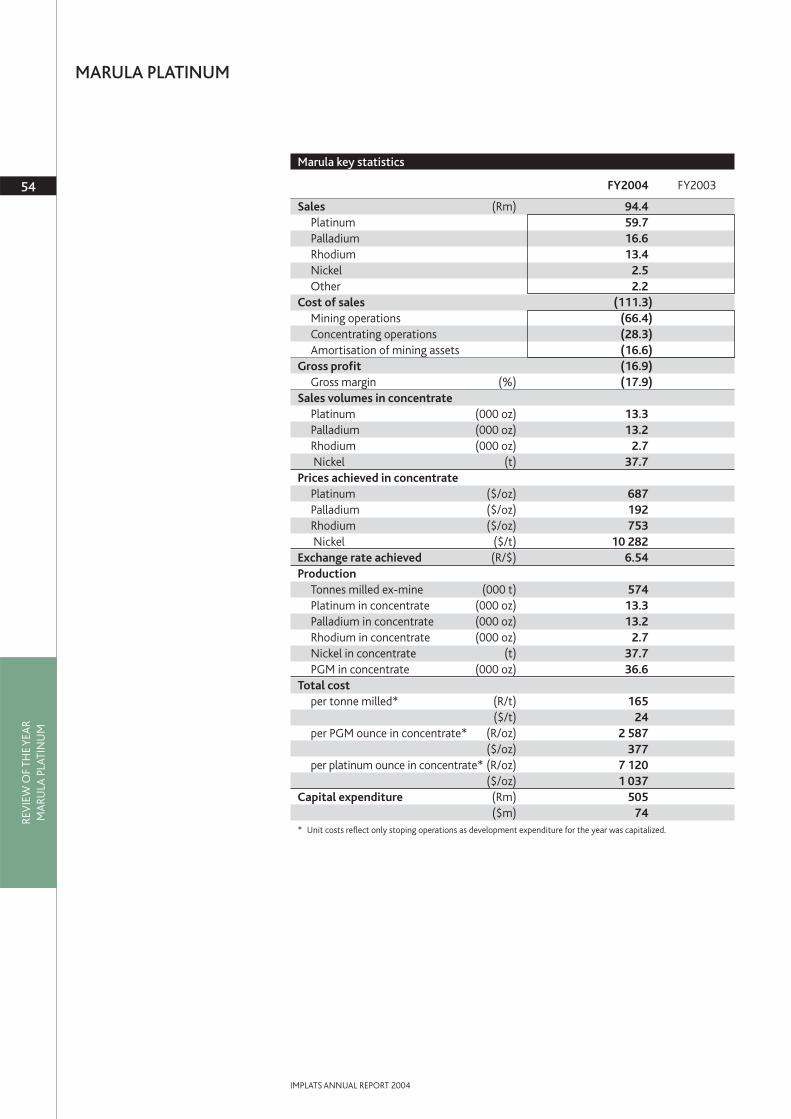
REV
IEW
OF
THE
YEA
RM
ARU
LA P
LATI
NU
M
54
IMPLATS ANNUAL REPORT 2004
MARULA PLATINUM
Marula key statistics
FY2004 FY2003
Sales (Rm) 94.4Platinum 59.7Palladium 16.6Rhodium 13.4Nickel 2.5Other 2.2
Cost of sales (111.3)Mining operations (66.4)Concentrating operations (28.3)Amortisation of mining assets (16.6)
Gross profit (16.9)Gross margin (%) (17.9)
Sales volumes in concentratePlatinum (000 oz) 13.3Palladium (000 oz) 13.2Rhodium (000 oz) 2.7Nickel (t) 37.7
Prices achieved in concentratePlatinum ($/oz) 687Palladium ($/oz) 192Rhodium ($/oz) 753Nickel ($/t) 10 282
Exchange rate achieved (R/$) 6.54Production
Tonnes milled ex-mine (000 t) 574Platinum in concentrate (000 oz) 13.3Palladium in concentrate (000 oz) 13.2Rhodium in concentrate (000 oz) 2.7Nickel in concentrate (t) 37.7PGM in concentrate (000 oz) 36.6
Total costper tonne milled* (R/t) 165
($/t) 24per PGM ounce in concentrate* (R/oz) 2 587
($/oz) 377per platinum ounce in concentrate* (R/oz) 7 120
($/oz) 1 037Capital expenditure (Rm) 505
($m) 74* Unit costs reflect only stoping operations as development expenditure for the year was capitalized.

55
IMPLATS ANNUAL REPORT 2004
REV
IEW
OF
THE
YEA
RZ
IMPL
ATS
Implats’ holding inZimplats had increasedto 83.44% by year-end
FY02 FY03
Zimplats – Fatal injury rate (FIFR)per million man hours
FY04
0.4
0.0 0.0
FY02 FY03
Zimplats – Lost time injuryfrequency rate (LTIFR) per millionman hours
FY04
2.00
1.05
0.46
Key features of the year
• LTIFR improved by 77% • Tonnes milled rose by 3.6% to 2.0 Mt• Refined platinum production of 84 300 oz, up 17.2%• Unit costs decreased by 3% to R5 074/oz• Furnace off-line for seven weeks due to smelter breakout• Contractor strike at opencast operations affected mining production • Potential for significant expansion – Phase 1 on track
Zimplats
Zimplats mining operations, the opencastand underground trial mine, are located77 km south of Selous. Zimplats’ miningoperation, Makwiro Platinum, is situated inthe Hartley Complex in the northernreaches of the Great Dyke, Zimbabwe.Makwiro comprises the Ngezi opencastmine, underground trial mine as well as theSelous Metallurgical Complex (SMC). Theconvertor matte produced is sold to IRS inSouth Africa and processed in terms of along-term off-take agreement.
By the end of the 2004 financial year,Implats had increased its holding inZimplats, which is listed on the AustralianStock Exchange, to 83.44%. Implats andZimplats hold 30% and 70% respectivelyin Makwiro Platinum (Pvt) Ltd, givingImplats an effective holding of 88.4% inMakwiro.
Safety and healthSafety:The safety performance at Zimplatsimproved significantly during the year. TheLTIFR for Makwiro was 0.46 per million manhours, an improvement of 77% on theprevious year. The mine recorded no fatalinjuries.
Much effort has been focused on safetyas the expansion continued and additionalemployees, new to the mining discipline,were recruited. Safety action plans thathave been put in place include hazardidentification, the development of a safetymanagement plan, behavioural-basedtraining for management, and theformulation of and training on proceduresand standards.
Health: Tests have been conducted inrespect of exhaust emissions and respirabledust sampling. All employees are screenedfor pneumoconiosis prior to employment,asis legally required in all dust-proneoccupations in Zimbabwe.
Personal protective equipment is providedto all employees to minimize the level ofnoise, dust, noxious gases, heat andexposure to lead and nickel.
HIV/AIDS: An HIV/AIDS awareness infor-mation programme is in place and a surveyconducted during the year indicated thatthe workforce has a sound understanding ofHIV/AIDS. A workplace HIV/AIDS policy isbeing developed.
Environment: Air quality requires themonitoring of dust fall-out and greenhousegas emissions from the use of heavy mobileequipment at the opencast operations andemissions from the smelter at the SMC. Aspart of this initiative, the smelter hasstopped using limestone, thus reducing CO2
emissions. Some $52 000 will be spent onupgrading air quality monitoring at thesmelter during the year ahead.
Efforts to reduce water consumption havebeen increased with some benefits alreadybeing felt. Decreased consumption hasbecome imperative, not only as part of theenvironmental effort, but also because rawwater prices increased almost eightfold inthe past year.
A new National Environmental Policy iscurrently being developed by the Ministry of

Environment and Tourism in Zimbabwe inconsultation with all stakeholders. In termsof legislation, an Environmental ImpactAssessment (EIA) and subsequent approvalthereof is required by government prior tothe development of the Ngezi ExpansionProject.
MiningIn FY2004, volumes mined amounted to2.1 Mt, 4% more than in FY2003. This wasmade up of 1.9 Mt from the opencast mineand 185 000 t from the underground trialmine. Ore sizing presented a problem in themills, constraining the volumes milled and astudy is presently underway to seeksolutions to this problem.
A go-slow by employees of the opencastcontractor, arising from a dispute overwages and shift cycles began on 4 June.Thisresulted in opencast operations beinghalted for three weeks. The operation usedthis time to conduct scheduled mainte-nance work on all equipment. The process-ing facility continued milling as it was ableto draw from the 120 000 t run-of-minestockpile and oxide ore. This stockpile hasnow been severely depleted, and con-sequently, the first three months of FY2005will be critical for the opencast operation.Aschedule is in place to expose ore at a maxi-mum rate to keep mined ore at the requiredvolumes. During this period a third shift willbe recruited for the opencast operation toensure that mining volumes are maintainedat levels sufficient to build up depletedstock levels.
Bench drilling underperformed by 12% thisyear, largely as a result of breakdowns onthe drill rigs and lower-than-expectedpenetration rates which was caused by thehardness of the rock.Two extra drill rigs areon order and due for delivery withinmonths.
Plans are in place to restrict dilution in theunderground mine and opencast operationto achieve target head grades of 3.29 g/t and3.23 g/t respectively.
The underground mine is achievingthe required 20 000 t/month per suite ofequipment and is scheduled to ramp up to55 500 t/month by year-end.The challengewill be to do this efficiently and on time.
The support system for the undergroundmine must still be finalised and tests arecurrently being conducted on various typesof roof bolts. The current mechanizedsupport drill rig, although performing tospecification, is unable to drill the number ofholes required per shift because of the densesupport pattern and the hardness of therock. Tests are being done with a morepowerful drill rig, and if not successful, moremachines will be required.
Whereas total costs were higher thanbudgeted, due mainly to increased miningcosts, Rand costs per tonne milled and perounce produced were around 3% lower thanFY2003.
ProcessingRecoveries improved to 83% (up by 1% overthe previous year) despite the patches ofoxidised material encountered from theopencast operation which had a negativeeffect on recoveries.The understanding of therelationship of the oxidized ore to sulphideore is improving and, consequently, steps arebeing taken to minimise recovery losseswhen treating the oxidised material.
Although a major break-out at the smelterin July 2003 resulted in the furnace beingout of operation for seven weeks, theconcentrate stockpiled during this periodwas successfully processed during thefinancial year. Platinum in concentrate
REV
IEW
OF
THE
YEA
RZ
IMPL
ATS
56
IMPLATS ANNUAL REPORT 2004
ZIMPLATS
Key statisticsOre Reserves 340.8 Mt MSZMineral Resource 2 492 Mt MSZCurrent refined production 84 300 Pt ozLife-of-mine (Phase 1) 20 yearsCapital expenditure $11 million in FY2004
$20 million planned in FY2005No. of employees 1 500, including contractor employees
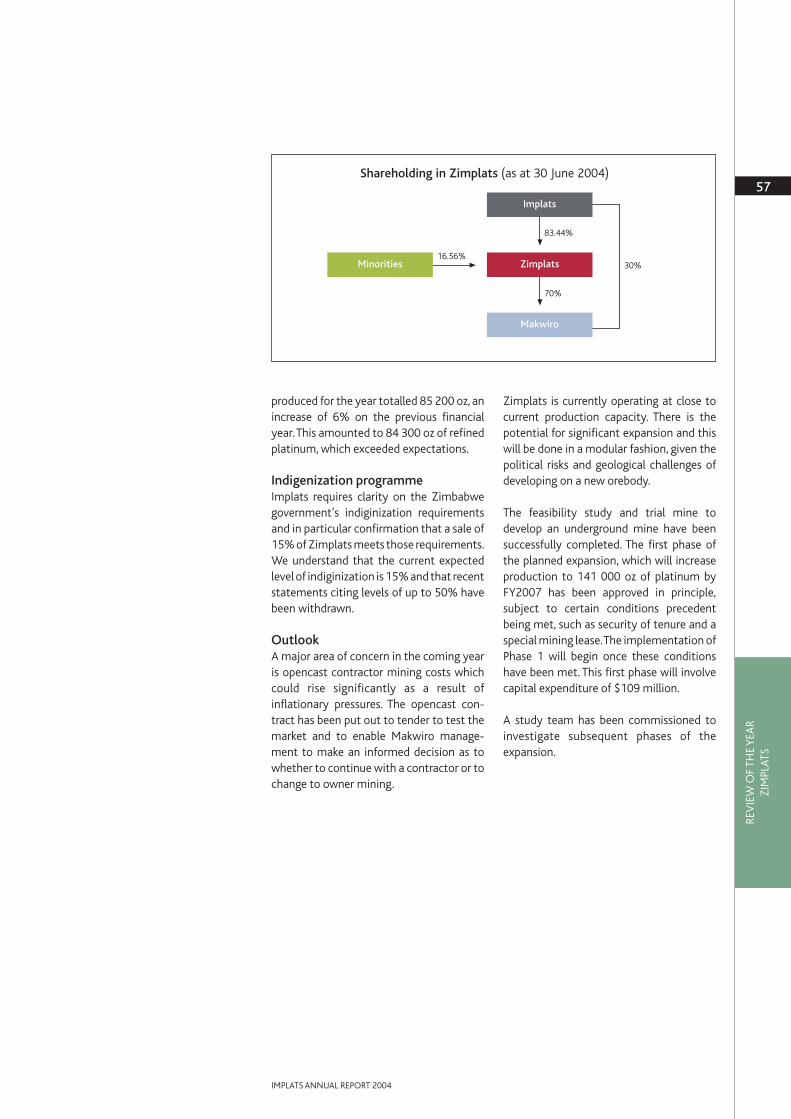
57
IMPLATS ANNUAL REPORT 2004
REV
IEW
OF
THE
YEA
RZ
IMPL
ATS
Shareholding in Zimplats (as at 30 June 2004)
83.44%
Zimplats
Makwiro
Implats
70%
30%Minorities16.56%
produced for the year totalled 85 200 oz, anincrease of 6% on the previous financialyear.This amounted to 84 300 oz of refinedplatinum, which exceeded expectations.
Indigenization programmeImplats requires clarity on the Zimbabwegovernment’s indiginization requirementsand in particular confirmation that a sale of15% of Zimplats meets those requirements.We understand that the current expectedlevel of indiginization is 15% and that recentstatements citing levels of up to 50% havebeen withdrawn.
Outlook A major area of concern in the coming yearis opencast contractor mining costs whichcould rise significantly as a result ofinflationary pressures. The opencast con-tract has been put out to tender to test themarket and to enable Makwiro manage-ment to make an informed decision as towhether to continue with a contractor or tochange to owner mining.
Zimplats is currently operating at close tocurrent production capacity. There is thepotential for significant expansion and thiswill be done in a modular fashion, given thepolitical risks and geological challenges ofdeveloping on a new orebody.
The feasibility study and trial mine todevelop an underground mine have beensuccessfully completed. The first phase ofthe planned expansion, which will increaseproduction to 141 000 oz of platinum byFY2007 has been approved in principle,subject to certain conditions precedentbeing met, such as security of tenure and aspecial mining lease.The implementation ofPhase 1 will begin once these conditionshave been met. This first phase will involvecapital expenditure of $109 million.
A study team has been commissioned toinvestigate subsequent phases of theexpansion.

REV
IEW
OF
THE
YEA
RZ
IMPL
ATS
58
IMPLATS ANNUAL REPORT 2004
ZIMPLATS
Zimplats key statistics
FY2004 FY2003
Sales (Rm) 689.2 649.8Platinum 425.6 355.4Palladium 92.3 137.6Rhodium 23.6 34.9Nickel 109.4 70.1Other 38.3 51.8
Cost of sales (443.3) (476.7)Mining operations (297.7) (318.1)Concentrating operations (114.6) (106.6)Amortisation of mining assets (46.9) (58.0)Increase in metal inventories 15.9 6.0
Gross profit 245.9 173.1Intercompany adjustment* (13.6)
Gross profit in Implats group 232.3Gross margin (%) 35.7 26.6Other operating expenses (20.5) (5.7)
* Adjustment note:The adjustment relates to sales from Zimplats to the Implats group which at year-end were still in
the pipeline.
Sales volumes in concentratePlatinum (000 oz) 85.2 80.2Palladium (000 oz) 73.2 70.0Rhodium (000 oz) 7.8 7.5Nickel (t) 1 627 1 349
Prices achieved in concentratePlatinum ($/oz) 724 500Palladium ($/oz) 183 222Rhodium ($/oz) 438 526Nickel ($/t) 9 738 5 858
Exchange rate achieved ex-mine (R/$) 6.90 9.09Production
Tonnes milled ex-mine (000 t) 2 006 1 937Platinum in matte (000 oz) 85.3 82.4Palladium in matte (000 oz) 73.1 70.5Rhodium in matte (000 oz) 7.8 7.6Nickel in matte (t) 1 627 1 381PGM in matte (000 oz) 186.7 185.2
Total costper tonne milled (R/t) 216 222
($/t) 31 24per PGM ounce in concentrate (R/oz) 2 318 2 324
($/oz) 336 256per platinum ounce in concentrate (R/oz) 5 074 5 223
($/oz) 735 574Capital expenditure (Rm) 76.3 27.3
($m) 11.1 3.0Only 10 months of FY2003 were attributable to Implats

59
IMPLATS ANNUAL REPORT 2004
REV
IEW
OF
THE
YEA
RM
IMO
SA P
LATI
NU
M
FY01 FY02 FY03
Mimosa Platinum – Lost timeinjury frequency rate (LTIFR) permillion man hours
2.64
FY04
4.89
2.92
4.72
2.61
FY00
FY01 FY02 FY03
Mimosa Platinum – Fatal injuryfrequency rate (FIFR) per millionman hours
0.0
FY04
0.0
0.45
0.16
FY00
0.0
Mimosa completed itsexpansion programme to
reach an annualproduction of 69 000 oz
platinum in FY2004
Key features of the year
• LTIFR improved by 45%• Recoveries improved from 76% to 79%• Platinum in concentrate production of 61 400 oz for FY2004• Expansion to deliver 69 000 oz of platinum in concentrate complete• Remains one of the lowest cost platinum producers in the world• Further potential for expansion• Indigenisation discussion progressing
Mimosa Platinum
Mimosa Platinum is located on the southernpart of the Great Dyke in Zimbabwe, on theWedza Geological Complex and is wholly-owned by Mimosa Investments, based inMauritius. Mimosa Investments is in turnjointly owned by Implats and AquariusPlatinum Limited.
During FY2004, the mine completed itsexpansion programme to reach an annualproduction level of 69 000 oz. Mimosa hasa life-of-mine concentrate offtake agree-ment with IRS.
Safety and healthSafety: Regrettably, the company had onefatal accident during the year, bringing theFIFR to 0.16. The LTIFR for Mimosa,however, improved significantly during theyear to 2.61 per million man hours (FY2003:4.72). This follows the deteriorationexperienced the previous year when a largenumber of new, inexperienced personneljoined the company as part of theexpansion project.
Training programmes incorporating induc-tion, hazard identification, risk assessmentand safety awareness have continued. Riskprofiles are linked to standard job proce-dures and high-risk jobs are prioritizedfor training.
Self-contained self-rescuers are beingacquired for all employees.
Health: The company has adopted ImpalaPlatinum’s occupational health standardswhich required both a reassessment andredeployment of staff. Noise and dustlevels are monitored.Congestion at the local
Mimosa clinic has been reduced as thenewly refurbished Kandodo Clinic hasbecome available.
The company maintained its NOSA four-platinum star status during the year.
HIV/AIDS: A comprehensive survey onemployee HIV/AIDS levels has been con-ducted and, following benchmarkingvisits to Impala Platinum, other miningcompanies and non-governmental organ-izations (NGOs) in Zimbabwe and neigh-bouring countries, an employee wellnessprogramme is being established. Thisprogramme was launched in July 2004 andwill focus initially on HIV/AIDS awareness tochange behaviour. An NGO, PopulationServices International, has been engaged toconduct the awareness training. Theprogramme will be extended to include theprovision of voluntary counselling andtesting as well as treatment programmesby the end of this year.
Environment: One significant environ-mental spill was recorded during the yearfrom the tailings pipe.A report was made togovernment, and a follow-up site visit washeld. The area was cleaned up accordingto plan.
An environmental risk baseline was estab-lished during the year.
MiningMining at Mimosa extends to a depth of200 m with a well-defined orebody.
Tonnes milled rose by 77% to 1.33 Mtfor the year in line with the expansion,

resulting in the production of 61 400 oz ofplatinum in concentrate. Costs continuedto be well-contained given the hyper-inflationary conditions prevailing inZimbabwe. Significant increases wereexperienced in the cost of power and fuel.As a result, costs rose to $28/t, from $24/tthe previous year but were lower in Randterms. Nonetheless, Mimosa remains oneof the most productive and lowest costplatinum mines in the world.
Efforts to develop staff capabilitiescontinue, especially regarding productiontechniques, safety and work cycles so as tocreate a sustainable operation for thefuture.There has been much improvementin the performance of undergroundteams with the worst performing teamachieving no less than 45 centares perman month.
ProcessingRecoveries at the mine’s concentrator haverisen to 79%.The concentrate is transportedby road to Mineral Processes in Rustenburg interms of the operation’s agreement with IRS.The cost per platinum ounce in concentratewas $609/oz.
Indigenization programmeNegotiations on the sale of 15% of Mimosato a consortium of Zimbabweans continued,in line with Zimbabwe’s indigenizationrequirements.Both Implats and Aquarius willmake available 7.5% of their respectiveholdings for purchase by the consortium.
OutlookA feasibility study to assess the potentialfor further expansion is scheduled forcompletion by June 2005. Initial indicationsare that production from Mimosa could bedoubled within four years.
REV
IEW
OF
THE
YEA
RM
IMO
SA P
LATI
NU
M
60
IMPLATS ANNUAL REPORT 2004
FY01 FY02
Mimosa Platinum – Platinum inconcentrate(000oz)
16.9
FY04
15.0
36.0
61.4
FY00 FY03
16.0
Key statisticsOre Reserves 29.8 Mt MSZMineral Resource 128.9 Mt MSZLife-of-mine 50 yearsCurrent refined production 61 400 oz in concentrate in FY2004Planned refined production Steady-state of 69 000 oz in concentrate in FY2005Capital expenditure $13.5 million in FY2004No. of employees 1 507
MIMOSA PLATINUM
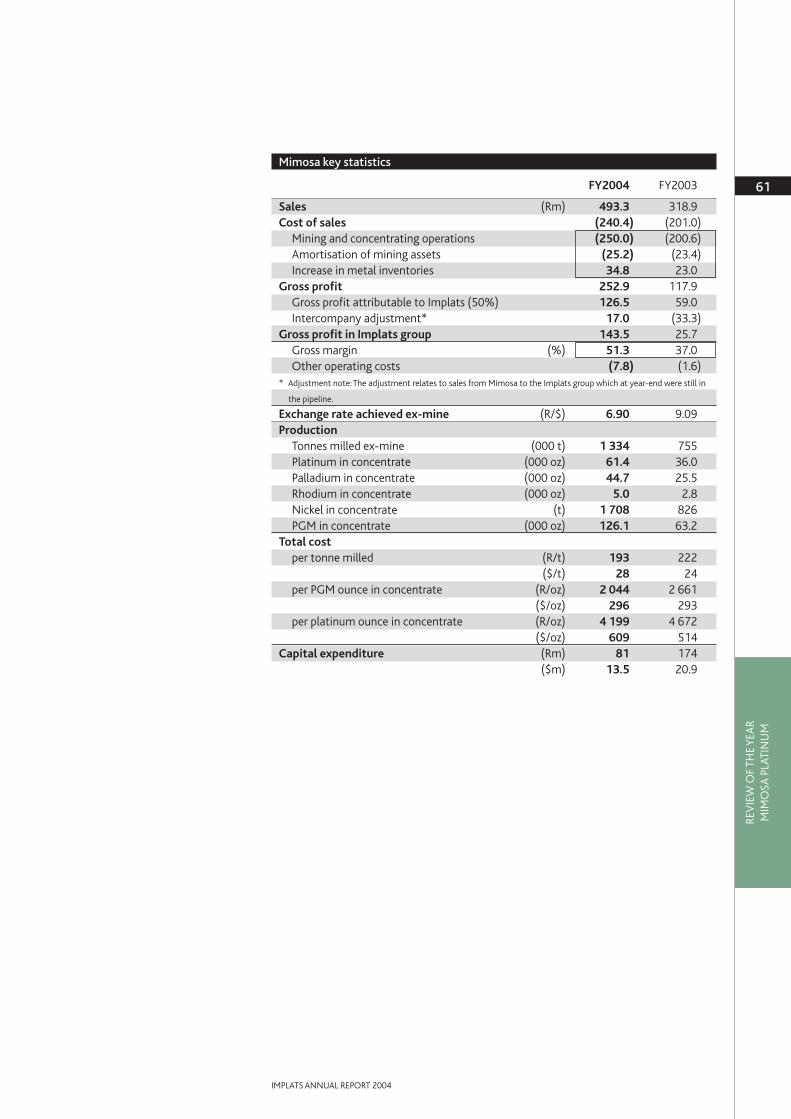
61
IMPLATS ANNUAL REPORT 2004
REV
IEW
OF
THE
YEA
RM
IMO
SA P
LATI
NU
M
Mimosa key statistics
FY2004 FY2003
Sales (Rm) 493.3 318.9Cost of sales (240.4) (201.0)
Mining and concentrating operations (250.0) (200.6)Amortisation of mining assets (25.2) (23.4)Increase in metal inventories 34.8 23.0
Gross profit 252.9 117.9Gross profit attributable to Implats (50%) 126.5 59.0Intercompany adjustment* 17.0 (33.3)
Gross profit in Implats group 143.5 25.7Gross margin (%) 51.3 37.0Other operating costs (7.8) (1.6)
* Adjustment note:The adjustment relates to sales from Mimosa to the Implats group which at year-end were still in
the pipeline.
Exchange rate achieved ex-mine (R/$) 6.90 9.09Production
Tonnes milled ex-mine (000 t) 1 334 755Platinum in concentrate (000 oz) 61.4 36.0Palladium in concentrate (000 oz) 44.7 25.5Rhodium in concentrate (000 oz) 5.0 2.8Nickel in concentrate (t) 1 708 826PGM in concentrate (000 oz) 126.1 63.2
Total costper tonne milled (R/t) 193 222
($/t) 28 24per PGM ounce in concentrate (R/oz) 2 044 2 661
($/oz) 296 293per platinum ounce in concentrate (R/oz) 4 199 4 672
($/oz) 609 514Capital expenditure (Rm) 81 174
($m) 13.5 20.9

REV
IEW
OF
THE
YEA
RIM
PALA
REF
ININ
G S
ERV
ICES
62
REVIEW OF OPERATIONS AND INTERESTS
FY00 FY01 FY02 FY04
IRS – Growth in platinumproduction(000oz)
179
289
362
871
FY03
633
FY01 FY02 FY03
IRS – production by metal
FY04FY00
395
587
744
1 238
1 749
Platinum Other PGMs
Impala Refining Services (IRS) leveragesImpala Platinum’s additional smelting andrefining capacity as well as its technical andmarketing expertise to generate additionalrevenue flows and to reduce costsassociated with Impala’s own productionthrough a contribution for the use of ImpalaPlatinum’s fixed assets. An arm’s lengthagreement exists between Impala and IRSin terms of which Impala guaranteesrecoveries and the length of the processingpipeline, and IRS pays Impala market-related processing costs.
IRS engages in metal purchase agreements,toll-refining agreements or a combinationof both. With metal purchase agreements,IRS purchases metal after a pre-determinedprocessing period,and with toll-refining, IRScharges clients a processing fee and returnsthe metal to the client after a pre-determined processing period.
Exchange rate losses/gains are a feature ofIRS’s financial results. IRS advances paymentto purchase-agreement clients to take intoconsideration the processing pipeline.Whilethese advances offer very considerablebenefits to clients – particularly in respectof smaller working capital operators – theycan also lead to exchange rate losses/gainsfor IRS.
IRS sources a wide variety of material fromaround the world, including flotation
concentrate and smelter matte. IRS alsohas a long-standing relationship with A1Specialized Services and Suppliers Incregarding the supply of spent autocatalysts,making IRS one of the largest refiners ofspent autocatalysts in the world.
Operating performanceIRS produced unprecedented volumes ofplatinum and other PGMs during FY2004.This performance was boosted by concen-trate processing on behalf of Lonplatsfollowing their furnace failure of December2002. As a result, attributable platinumproduction grew by 38% year-on-year to871 000 oz, which is equivalent toapproximately 44% of throughput from theImplats’group.Palladium production for theyear rose by 31% to 545 000 oz, while totalPGM production rose 41% to 1.749 Moz.Notwithstanding the net increase in profitgenerated to R243 million, IRS’s capacity toprocess these substantial volumes whileconsistently meeting their contractualobligations was clearly established,support-ing the group’s plans to produce 2 Moz by2006 and, possibly, 2.3 Moz by 2008.
Excluding the Lonplats contribution,platinum production through IRS stillincreased by a most creditable 35% year-on-year with major input contributionsfrom Aquarius’ Kroondal operation plusramp-up from its Marikana operation, anincrease in delivery from both Zimplats and
Key features of the year
• 38% increase in metal produced to 871 000 oz platinum• 41% increase in PGMs to 1.749 Moz• 43% increase in gross profit to R716 million
Impala Refining ServicesExchange ratelosses/gains are a
feature of IRS’s financialresults
IMPLATS ANNUAL REPORT 2004
IRS – profit and contribution to the Implats Group
Profit (Rm) % contribution to group
2000 117 5.22001 300 6.52002 416 9.12003 151 4.42004 394 13.3
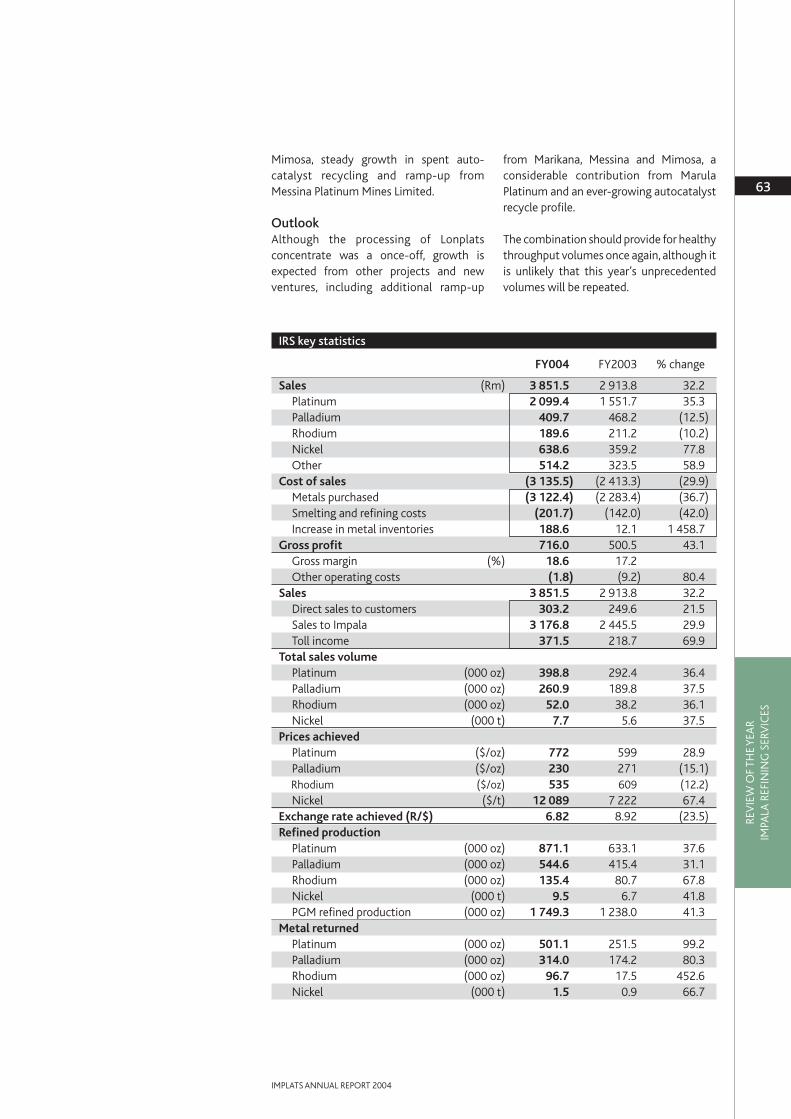
Mimosa, steady growth in spent auto-catalyst recycling and ramp-up fromMessina Platinum Mines Limited.
OutlookAlthough the processing of Lonplatsconcentrate was a once-off, growth isexpected from other projects and newventures, including additional ramp-up
from Marikana, Messina and Mimosa, aconsiderable contribution from MarulaPlatinum and an ever-growing autocatalystrecycle profile.
The combination should provide for healthythroughput volumes once again, although itis unlikely that this year’s unprecedentedvolumes will be repeated.
63
IMPLATS ANNUAL REPORT 2004
REV
IEW
OF
THE
YEA
RIM
PALA
REF
ININ
G S
ERV
ICES
IRS key statistics
FY004 FY2003 % change
Sales (Rm) 3 851.5 2 913.8 32.2Platinum 2 099.4 1 551.7 35.3Palladium 409.7 468.2 (12.5)Rhodium 189.6 211.2 (10.2)Nickel 638.6 359.2 77.8Other 514.2 323.5 58.9
Cost of sales (3 135.5) (2 413.3) (29.9)Metals purchased (3 122.4) (2 283.4) (36.7)Smelting and refining costs (201.7) (142.0) (42.0)Increase in metal inventories 188.6 12.1 1 458.7
Gross profit 716.0 500.5 43.1Gross margin (%) 18.6 17.2Other operating costs (1.8) (9.2) 80.4
Sales 3 851.5 2 913.8 32.2Direct sales to customers 303.2 249.6 21.5Sales to Impala 3 176.8 2 445.5 29.9Toll income 371.5 218.7 69.9
Total sales volumePlatinum (000 oz) 398.8 292.4 36.4Palladium (000 oz) 260.9 189.8 37.5Rhodium (000 oz) 52.0 38.2 36.1Nickel (000 t) 7.7 5.6 37.5
Prices achievedPlatinum ($/oz) 772 599 28.9Palladium ($/oz) 230 271 (15.1)Rhodium ($/oz) 535 609 (12.2)Nickel ($/t) 12 089 7 222 67.4
Exchange rate achieved (R/$) 6.82 8.92 (23.5)Refined production
Platinum (000 oz) 871.1 633.1 37.6Palladium (000 oz) 544.6 415.4 31.1Rhodium (000 oz) 135.4 80.7 67.8Nickel (000 t) 9.5 6.7 41.8PGM refined production (000 oz) 1 749.3 1 238.0 41.3
Metal returnedPlatinum (000 oz) 501.1 251.5 99.2Palladium (000 oz) 314.0 174.2 80.3Rhodium (000 oz) 96.7 17.5 452.6Nickel (000 t) 1.5 0.9 66.7
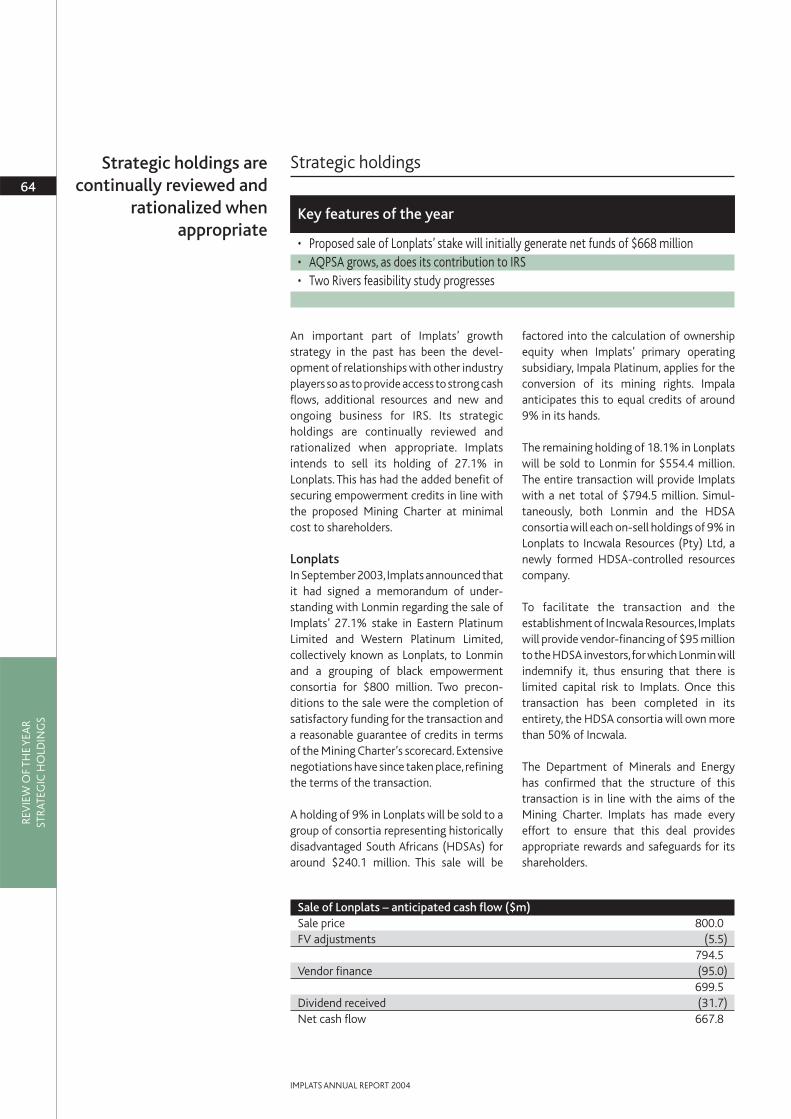
An important part of Implats’ growthstrategy in the past has been the devel-opment of relationships with other industryplayers so as to provide access to strong cashflows, additional resources and new andongoing business for IRS. Its strategicholdings are continually reviewed andrationalized when appropriate. Implatsintends to sell its holding of 27.1% inLonplats. This has had the added benefit ofsecuring empowerment credits in line withthe proposed Mining Charter at minimalcost to shareholders.
LonplatsIn September 2003, Implats announced thatit had signed a memorandum of under-standing with Lonmin regarding the sale ofImplats’ 27.1% stake in Eastern PlatinumLimited and Western Platinum Limited,collectively known as Lonplats, to Lonminand a grouping of black empowermentconsortia for $800 million. Two precon-ditions to the sale were the completion ofsatisfactory funding for the transaction anda reasonable guarantee of credits in termsof the Mining Charter’s scorecard. Extensivenegotiations have since taken place, refiningthe terms of the transaction.
A holding of 9% in Lonplats will be sold to agroup of consortia representing historicallydisadvantaged South Africans (HDSAs) foraround $240.1 million. This sale will be
factored into the calculation of ownershipequity when Implats’ primary operatingsubsidiary, Impala Platinum, applies for theconversion of its mining rights. Impalaanticipates this to equal credits of around9% in its hands.
The remaining holding of 18.1% in Lonplatswill be sold to Lonmin for $554.4 million.The entire transaction will provide Implatswith a net total of $794.5 million. Simul-taneously, both Lonmin and the HDSAconsortia will each on-sell holdings of 9% inLonplats to Incwala Resources (Pty) Ltd, anewly formed HDSA-controlled resourcescompany.
To facilitate the transaction and theestablishment of Incwala Resources, Implatswill provide vendor-financing of $95 millionto the HDSA investors,for which Lonmin willindemnify it, thus ensuring that there islimited capital risk to Implats. Once thistransaction has been completed in itsentirety, the HDSA consortia will own morethan 50% of Incwala.
The Department of Minerals and Energyhas confirmed that the structure of thistransaction is in line with the aims of theMining Charter. Implats has made everyeffort to ensure that this deal providesappropriate rewards and safeguards for itsshareholders.
Key features of the year
• Proposed sale of Lonplats’ stake will initially generate net funds of $668 million• AQPSA grows, as does its contribution to IRS • Two Rivers feasibility study progresses
Strategic holdings
REV
IEW
OF
THE
YEA
RST
RATE
GIC
HO
LDIN
GS
64
IMPLATS ANNUAL REPORT 2004
Strategic holdings arecontinually reviewed and
rationalized whenappropriate
Sale of Lonplats – anticipated cash flow ($m)Sale price 800.0FV adjustments (5.5)
794.5Vendor finance (95.0)
699.5Dividend received (31.7)Net cash flow 667.8

REV
IEW
OF
THE
YEA
RST
RATE
GIC
HO
LDIN
GS
65
IMPLATS ANNUAL REPORT 2004
FY01 FY02 FY04
Aquarius Platinum – refinedplatinum production(000oz)
81
122
188
FY03
134
Attributable contribution of Implats’ interest in Lonplats
Year to March 2004 2003 % change
Financial (Rm)Sales 1 725 1 744 (1)Profit before tax 460 935 (51)Profit 290 654 (56)Dividends received 285 176 62Refined production (000 oz)Platinum 269 206 31Palladium 119 95 25Rhodium 37 32 16PGMs 505 399 27
This transaction will achieve an initial netcash inflow for Implats of $667.8 million,netof the dividend of $31.7 million alreadyreceived for Lonmin’s financial year toSeptember 2003,and the amount of vendorfinance to be provided.
The HDSA consortia have raised funding andthe South African Competition Tribunal hasapproved the transaction. Subject to futherregulatory approvals, including that of theSouth African Reserve Bank, Lonmin share-holder support and the conclusion of variouslegal agreements, the transaction isexpected to be concluded in the first halfof FY2005.
Aquarius PlatinumImplats holds stakes in both AquariusPlatinum Limited, which is listed on the LSEand the ASX, and unlisted subsidiary,Aquarius Platinum South Africa (Pty)Limited (AQP(SA)). Implats and Aquarius
Platinum are the joint owners of MimosaInvestments which owns Mimosa PlatinumLimited in Zimbabwe.
During the year, Aquarius Platinum imple-mented a private placement of shares whicheffectively reduced Implats’ holding in thecompany to 8.6%. Implats also has a stakeof 25% in AQPSA, which will be reducedonce a transaction to sell a portion ofAQPSAto a BEE consortium led by SavannahResources has been finalised. Implats hasstructured a deal to ensure its shareholdingremains at 20% and thus will continue toequity account the AQPSA results. This hasbeen achieved by converting part of theinterest-bearing shareholder’s loanaccount.
Production problems at Kroondal, a resultof severe potholing, have been overcomewith platinum production of 134 000 oz forFY2004.
Aquarius Platinum – Shareholding structure
* This stake will decline to a minimum of 20%, on conclusion of the proposed BEE deal with Savannah Resources
50%25%*
Mimosa InvestmentsLimited
Aquarius PlatinumLimited
Aquarius PlatinumSouth Africa(Pty) Limited
Implats
50%
8.6%
75%
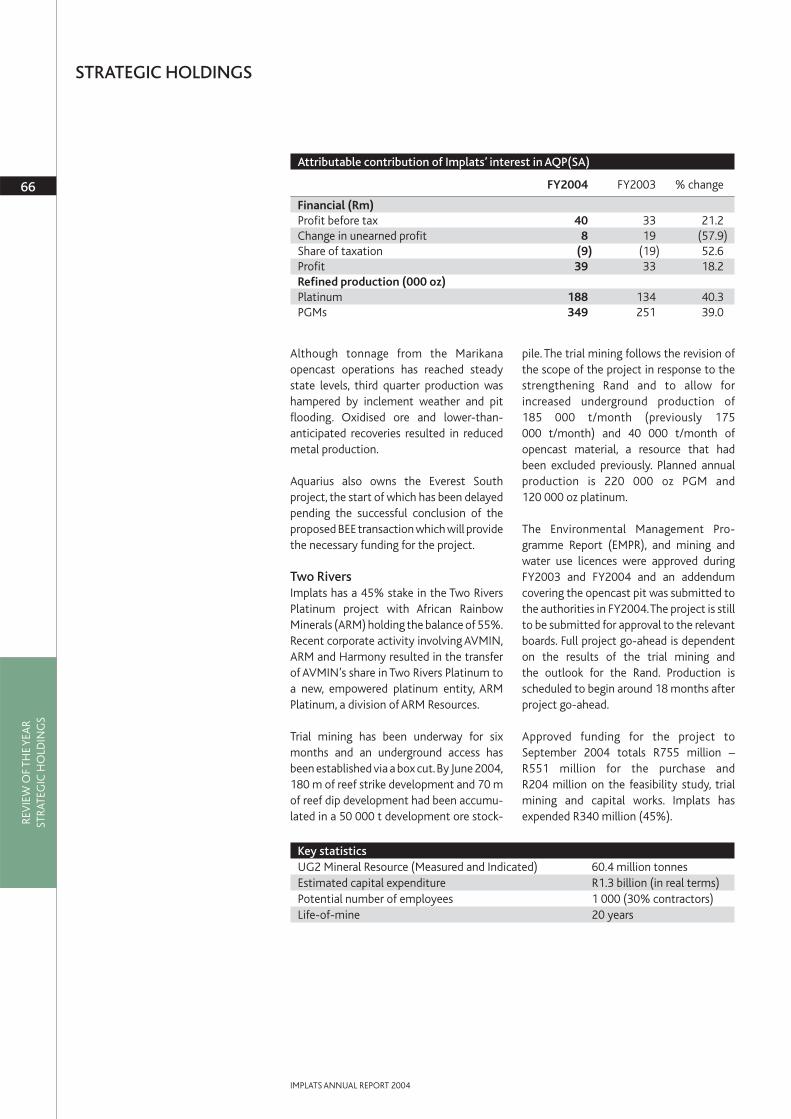
Key statisticsUG2 Mineral Resource (Measured and Indicated) 60.4 million tonnes Estimated capital expenditure R1.3 billion (in real terms)Potential number of employees 1 000 (30% contractors)Life-of-mine 20 years
REV
IEW
OF
THE
YEA
RST
RATE
GIC
HO
LDIN
GS
Although tonnage from the Marikanaopencast operations has reached steadystate levels, third quarter production washampered by inclement weather and pitflooding. Oxidised ore and lower-than-anticipated recoveries resulted in reducedmetal production.
Aquarius also owns the Everest Southproject, the start of which has been delayedpending the successful conclusion of theproposed BEE transaction which will providethe necessary funding for the project.
Two RiversImplats has a 45% stake in the Two RiversPlatinum project with African RainbowMinerals (ARM) holding the balance of 55%.Recent corporate activity involving AVMIN,ARM and Harmony resulted in the transferof AVMIN’s share in Two Rivers Platinum toa new, empowered platinum entity, ARMPlatinum, a division of ARM Resources.
Trial mining has been underway for sixmonths and an underground access hasbeen established via a box cut.By June 2004,180 m of reef strike development and 70 mof reef dip development had been accumu-lated in a 50 000 t development ore stock-
pile. The trial mining follows the revision ofthe scope of the project in response to thestrengthening Rand and to allow forincreased underground production of185 000 t/month (previously 175000 t/month) and 40 000 t/month ofopencast material, a resource that hadbeen excluded previously. Planned annualproduction is 220 000 oz PGM and120 000 oz platinum.
The Environmental Management Pro-gramme Report (EMPR), and mining andwater use licences were approved duringFY2003 and FY2004 and an addendumcovering the opencast pit was submitted tothe authorities in FY2004.The project is stillto be submitted for approval to the relevantboards. Full project go-ahead is dependenton the results of the trial mining andthe outlook for the Rand. Production isscheduled to begin around 18 months afterproject go-ahead.
Approved funding for the project toSeptember 2004 totals R755 million –R551 million for the purchase andR204 million on the feasibility study, trialmining and capital works. Implats hasexpended R340 million (45%).
66
IMPLATS ANNUAL REPORT 2004
STRATEGIC HOLDINGS
Attributable contribution of Implats’ interest in AQP(SA)
FY2004 FY2003 % change
Financial (Rm)Profit before tax 40 33 21.2Change in unearned profit 8 19 (57.9)Share of taxation (9) (19) 52.6Profit 39 33 18.2Refined production (000 oz)Platinum 188 134 40.3PGMs 349 251 39.0

67
IMPLATS ANNUAL REPORT 2004
REV
IEW
OF
THE
YEA
REX
PLO
RATI
ON
,RES
ERV
ES A
ND
RES
OU
RCES
Geology Implats’mining operations focus on the twolargest known deposits of platinum groupmetals (PGMs) in the world, namely theBushveld Complex in South Africa and theGreat Dyke in Zimbabwe.
Geology of the Bushveld ComplexThe Bushveld Complex is a 2-billion-year oldlayered igneous intrusion.Although it sharescharacteristics with other layered complexesaround the world, the Bushveld is uniqueboth in its size, covering an aerial extent ofsome 66 000 km2, and in the economicimportance of its mineral deposits.Geologically, the complex comprises anarray of diverse igneous rocks ranging incomposition from ultramafic to felsic.
Contained within a well-layered ultramaficto mafic succession, called the RustenburgLayered Suite, are two horizons which hosteconomically exploitable quantities ofPGMs, namely the Merensky Reef and theunderlying UG2 Chromitite Layer. Thesetwo economic horizons can be traced forhundreds of kilometres around the complexand are the focus of Implats’ operations inwhich the PGMs platinum, palladium,rhodium, ruthenium and iridium arerecovered together with quantities of gold,nickel, copper and cobalt. Implats’ opera-tions here comprise Impala PlatinumLimited, located near Rustenburg in NorthWest Province, and Marula Platinumsituated near Burgersfort in LimpopoProvince.
Geology of the Great DykeThe Great Dyke is a linear geological featureextending some 550 km north-south witha maximum width of 11 km. Within theDyke, four layered complexes aredeveloped, similar to the BushveldComplex.From north to south,these are theMusengezi, Hartley, Selukwe and Wedzacomplexes. The stratigraphy is broadlydivided between a lower ultramafic and anoverlying mafic sequence. The ultramaficsequence hosts the P1 pyroxenite, directlybelow the mafic-ultramafic contact, whichin turn hosts the economic PGM-bearingMain Sulphide Zone (MSZ). The MSZ is
Exploration, Mineral Reserves and Mineral Resources
Bushveld Complex
Pretoria
Johannesburg
Rustenburg
Impala
Marula
Burgersfort
Middelburg
Mokopane
100 Km
N
Great Dyke
Bulawayo
Ngezi
SelousMetallurgicalComplex
MusengeziComplex
Harare
HartleyComplex
SelukweComplex
WedzaComplex
ZIMBABWE
BOTSWANA
NAMIBIA
ZAMBIA
Victoria Falls
SOUTH AFRICA
MOZAMBIQUE
Great Dyke
2000
Kilometres
100
Mimosa
N
generally 2-3 m thick. Optimal mineralisa-tion varies and, in contrast to the BushveldComplex, is often difficult to follow visually.Peak values for the PGM and base metals arecommonly offset, while the proportionsbetween platinum and palladium also varyvertically. As at 30 June 2004, Implats held83.44% of Zimbabwe Platinum MinesLimited (Zimplats), an Australian-listedcompany. Zimplats operates the NgeziPlatinum mine situated in the south of theHartley Complex, and mines both byopencast and trial underground methods.Zimplats owns extensive resources withinthe Hartley Complex. In addition, Implatsowns 50% of Mimosa Investments Limitedwhich owns and operates Mimosa MiningCompany,an underground mine situated onthe Wedza Complex.
Exploration reviewIn FY2004, exploration focussed onevaluating Implats’ Mineral Resources insouthern Africa, and to a lesser degree,internationally. Particular emphasis wasplaced on the Great Dyke since theacquisition of the majority shareholding inZimplats. In South Africa, explorationendeavours were hampered by permittingissues prior to the introduction of theMineral and Petroleum Resources Develop-ment Act 28/2002 (the Act).
Exploration expenditure increased to someR42 million,particularly due to brownfieldsexploration conducted at the ImpalaRustenburg operations. Going forward, theImplats single-commodity strategyremains firmly entrenched and thus theemphasis on platinum-dominant projectswill continue.
Southern Africa Bushveld Complex: Brownfields explora-tion at the Impala operations at Rustenburgwas aligned to support the revised long-term mine plan. Emphasis during the pastyear has been on the evaluation of the 20,11c and 16 Shaft blocks, with a particularfocus on enhancing the 3D seismic data,geotechnical studies and mineral resourceevaluation.
At Marula Platinum, an infill-drilling pro-gramme,targeted at the Merensky Reef,wasconducted and a pre-feasibility study was
undertaken. Only limited work wasconducted at the Spitzkop, Kalkfontein andBuffelshoek properties. An extensive 3Dseismic orientation survey was undertakento test the viability of this technique atshallow depths. Final results are expectedearly in FY2005.
Great Dyke: A full-time explorationmanager was appointed in October 2003 tomanage future exploration endeavours atZimplats. A review of the available infor-mation has been completed followed by theformulation of a long-term explorationstrategy.The focus for the next few years willbe to support the growth strategy,particularly in the Ngezi area, as well as theevaluation of other mineral resourcesamenable for shallow mechanized mining.Work in FY2004 entailed compiling thegeology and Mineral Resources and Reservesfor the Phase 1 expansion feasibility study,follow-up investigations in the proposedportal 3 area and the establishment of anexploration base at Selous.
North and South America, and AustraliaAlliance with Falconbridge: The alliancewith Falconbridge has continued. TheNarndee project in Western Australiawas terminated after an 18 hole-drillingprogramme failed to identify significantPGE mineralization.The Cateté joint venturein the Carajás region of Brazil was advancedwith several targets having been drill tested;to date no significant encouragement hasbeen encountered.
During the year, Implats concluded anotheragreement with Falconbridge to explorepart of the Niquelândia lobe in the GoiásLayered Igneous Complex of central Brazil.Falconbridge had previously conductedextensive geochemical and geophysicalsurveys and defined specific target areas.The new scheme of arrangement includes acommitment of CD$500 000 from Implatsfor the first phase. Payment of an additionalCD$1.5 million will entitle Implats to a 50%interest in the project.
Three Kings: Implats entered into anagreement with De Grey Mining regardingtheir Three Kings project in WesternAustralia during FY2004. The initial com-mitment is A$400 000 for Phase 1 which is
REV
IEW
OF
THE
YEA
REX
PLO
RATI
ON
,RES
ERV
ES A
ND
RES
OU
RCES
68
IMPLATS ANNUAL REPORT 2004
Exploration focussed onevaluating Implats’
Mineral Resources insouthern Africa

69
IMPLATS ANNUAL REPORT 2004
REV
IEW
OF
THE
YEA
REX
PLO
RATI
ON
,RES
ERV
ES A
ND
RES
OU
RCESPt 57.3% Ru 8.2%
Pd 24.8% Ir 1.7%
Rh 4.3% Au 6.7%
Impala metal splits – Merensky
Pt 47.4% Ru 13.6%
Pd 25.7% Ir 3.4%
Rh 9.0% Au 0.7%
Impala metal splits – UG2
designed to test the grade potential and lateral continuity of earlier successes.This first phaseis scheduled for completion by the second quarter of FY2005. Should Implats elect toproceed with a second phase, additional expenditure of A$800 000 will give Implats aninterest of 60% in the project.
Franconia JV: The exploration JV with Franconia Minerals Corporation is continuing in twotarget areas in the Duluth Complex, in the USA.Permitting regulations and the weather havedelayed the programme.Exploration completed to date has failed to generate a viable targetfor follow-up work.
Impala PlatinumMineral Reserves and Mineral Resources: Impala Platinum holds contiguous old ordermining and prospecting rights for a total area of 27 573 hectares.
Mineral Reserves as at 30 June 2004
Orebody Category Tonnage (millions) Grade 5 PGE & Au (g/t) Pt oz (millions)
Merensky Proved 17.1 5.12 1.6Probable 72.7 4.97 6.6
UG2 Proved 20.5 5.15 1.6Probable 99.9 5.11 7.8
Total 210.2 5.07 17.7
Mineral Resources as at 30 June 2004
Orebody Category Tonnage (millions) Grade 5 PGE & Au (g/t) Pt oz (millions)
Merensky Measured 60.7 7.46 8.3Indicated 101.5 7.66 14.3Inferred 75.9 8.26 11.5
UG2 Measured 49.5 8.90 6.7Indicated 70.2 9.45 10.1Inferred 62.1 9.28 8.8
Total 419.9 8.42 59.7
No 1 & 2 Tailings Complex – Mineral Resources as at 30 June 2004
Orebody Category Tonnage (millions) Pt grade (g/t) Pt oz (millions)
Tailings Indicated 48.1 0.42 0.6
Notes:– Where Mineral Reserves and Mineral Resources are quoted for the same property,Mineral
Resources are additional to Mineral Reserves.
– The Mineral Reserves quoted reflect the grade delivered to the mill rather than an in situchannel grade quoted in respect of Mineral Resources.
– The modifying factors utilised to convert the Mineral Resource to a Mineral Reserve arederived from an in-house Ore Inventory System. The system is able to provide all thediluting factors that are applied to the in situ estimates to yield the final product deliveredto the mill.
– Grade estimates for the Impala Platinum Rustenburg operations are obtained by meansof ordinary kriging using an extensive database of both underground samples (33 800Merensky sections and 29 400 UG2 sections) and surface boreholes (746 Merensky and650 UG2 intersections). Sampling allows for a vertical definition of the grade distributionthroughout the reef and the surrounding host units.
Mineral Reserves and Mineral Resources

– Compared with the previous published figures, the material differences are attributed toevaluation work undertaken during the last year, which has allowed a significant transferof resources from the Indicated to the Measured category.This is reflected in the figuresquoted above both in resource tonnage and grade.
– An external audit was conducted by SRK (SA) at the conclusion of the 2004 financial yearon the Mineral Resource and Mineral Reserve figures.The methodology was found to besound and the Mineral Resource estimates developed were compliant with therequirements and recommendations of the SAMREC Code.
– The Mineral Reserves and Resources quoted are held under four old order mining rights,two old order prospecting rights as well as an unused old order right. Impala Platinum willbe applying for the conversion of these rights during FY2005. In terms of the new Mineraland Petroleum Resources Development Act, 28/2002 (the Act), a prospecting right may begranted for a period of up to five years, renewable for a further three years. Under the Act,a mining right may be granted for up to 30 years, renewable for a further 30 years subjectto the holder meeting the requirements of the Act.The Impala Platinum Mineral Resources
REV
IEW
OF
THE
YEA
REX
PLO
RATI
ON
,RES
ERV
ES A
ND
RES
OU
RCES
70
IMPLATS ANNUAL REPORT 2004
EXPLORATION MINERAL RESERVES AND MINERAL RESOURCES
Merensky UG2
N
5 100
Kilometres
Mined out areas
Mineral Reserves
Measured Mineral Resources
Indicated Mineral Resources
Inferred Mineral Resources
Seismic anomalies
Prospecting rights
Outcrop
Boreholes
●
●
●●
●
●●
●
●
●●●●●
●
●
●
●
●
●
●
●●
●
●
●
●●●
●
●
●●
●
●
●●
●●
●
●●
●
●
●
●●
●
●
●●●
●
●
● ●
●●
●
●●
●●●
●
●●
●
●
● ●●● ●●
●
●●
●●●●●
●●
●●●●
●●
●●●
●
●
●
●●
●●
●
●
●●●●
●●
●●
●
●● ●
●●●
●
●
●
●
●
●
●
●
●
●● ●●
● ● ●
●●●
●
●●●
●●
● ●
●●●●●
●●●
●●
●●●●●●●
●●●●●●
●●●●●
●
●●
●●●
●
●
●●●●
●
●●
●●
●●
●●
●●
●●●
●
●●
●●●
●● ●
●
● ●●
●
●
●●
●
●
●●
●●
●●
●●
●
●
●●
●●
● ●
●
●
●
●
●
●
●●
●
●
●
●
●●
●●
●
●
● ●
●●
● ● ●
●
●● ● ●● ●
●
●●
●
●
●
● ●
●
●
●
●
●
●
● ●●
● ●
●●
●
●
●●
●
●
●●
●● ●
●●
●
●
●●
●
● ●
●
●
●
●
●
●●
●●
●●
● ●●●
●●
●●
●
●●
●●
●●
●●
●●
●
●
●
● ●●
●
●
●● ●
●
● ●●
●●●
● ●●
●
●●●
●●●●
●●●
●●● ● ●●
●●
●
●●
●●
●
●●
●●●
●
●● ●
●●
●
●
● ●●
●
●
● ●
●
●
●
●●
●
●
●●
●
●●
●
●
●
●
●
●●
●
● ●
●
●●
●
●
●
●
●●
●
●
●●
●●
●●
●
●
●●
●●
●
●
●
●●
● ●
●●
●
●●
●
●
●●
●●
●
●
●
●●
●
●
●
● ●
● ●
●
●
●
●
●
●
●
●
●●●
●
●
●●
●●●
●
●
●
●
●
●
●
●
●
●
●
●
●
●
●
●
●
●
●●
●
●●
●
●
●●●●●
●
●
●
●
●
●
●
●●
●
●
●
●●●
●
●
●●
●
●
●●
●●
●
●●
●
●
●
●●
●
●
●●●
●
●
● ●
●●
●
●●
●●●
●
●●
●
●●
●
●● ●
●● ●●
●
●●
●●●●●
●●
●●●●
●●
●
●●●●●●●●
●●● ●●
●●
●
●●● ●
●●●
●
●
●
●●
●●
●●●
●
●●●
●●● ●
●
●●
●●
●
●
●●●●
●●
●●
●
●● ●
●●●
●
●
●
●
●
●
●
●
●
●● ●●
●
●●●
●
●
● ●
●●●
●
●●●
●●
● ●
●●●●●
●●●
●●
●●●●●●●
●●●●●●
●●●●●
●
●●
●●●
● ●
●
●
●
●
●●●
●
●●●
●●●●
●●●
●●●●●
●●
●●
●●
●●
●●
●●●
●
●●
●●
●●●
●● ●
●
● ●●
●
●
●●
●
●
●●
●●
●●
●●
●
●
●●
●●
● ●
●
●
●
●
●
●
●●
●
●
●
●
●●
●
●
●
● ●
●●
● ● ●
●
●● ● ●● ●
●
●●
●
●
●
● ●
●
●
●
●
●
●
● ●●
● ●
●●
●
●
●●
●
●
●●
●● ●
●●
●
●
●●
●
● ●
●
●
●
●
●
●●
●●
●●
● ●●●
●●
●●
●
●●
●●
●●
●●
●●
●
●
●
● ●●
●
●
●● ●
●
● ●●
●●●
● ●●
●
●●●
●●●●
●●●
●●● ● ●●
●●
●
●●
●●
●
●●
●●●
●
●● ●
●●
●
●
● ●●
●
●
● ●
●
●
●
●●
●
●
●●
●
●●
●
●
●
●
●
●●
●
● ●
●
●●
●
●
●
●
●●
●
●
●●
●●
●●
●
●
●●
●●
●
●
●
●●
● ●
●●
●
●●
●
●
●●
●●
●
●
●
●●
●
●
●
● ●
● ●
●
●
●
●
●
●
●
●
●●●
●
●
●●
●●●
●
●
●
●
●
●
●
●
●
●
●
●
●
●
●
●
●
Impala Platinum mining and prospecting areas

71
IMPLATS ANNUAL REPORT 2004
REV
IEW
OF
THE
YEA
REX
PLO
RATI
ON
,RES
ERV
ES A
ND
RES
OU
RCES
for both the UG2 and Merensky are seen to be in excess of the 30-year requirement atplanned production levels and would therefore be subject to renewal after a 30-year period.
Marula PlatinumMineral Reserves and Mineral Resources: Marula Platinum holds old order mining rightson the farms Winnaarshoek 250 KT, Clapham 118 KT, and portions of the farms Driekop 253KT and Forest Hill 117 KT, comprising 2 765 hectares. No prospecting has been conductedon the portion of the farm Hackney 116 KT which is held under an unused old order right.
Mineral Reserves as at 30 June 2004
Orebody Category Tonnage (millions) Grade 5 PGE & Au (g/t) Pt oz (millions)
UG2 Probable 41.3 4.76 2.3
Mineral Resources as at 30 June 2004
Orebody Category Tonnage (millions) Grade 5 PGE & Au (g/t) Pt oz (millions)
Merensky Indicated 44.2 5.47 4.2UG2 Indicated 22.4 9.27 2.5Total 66.6 6.75 6.7
Pt 53.8% Ru 5.5%
Pd 30.4% Ir 0.9%
Rh 2.6% Au 6.8%
Marula metal splits – Merensky
Pt 36.8% Ru 11.3%
Pd 40.4% Ir 2.6%
Rh 7.7% Au 1.2%
Marula metal splits – UG2
Merensky UG2
Dyke
Boreholes
Probable Mineral Reserve
Indicated Mineral Resource
Inferred Mineral Resource
N
●
●
●
●
●
●
●
●
●
●
●
●
●
●
●
●
●
●
●
●
●
●●
●●
●
●●●●●●
●●●●●●●●●
●
●
●
●
●
●
●
●
●
●
●
●
●
●
●
●
●
●
●
●
●
●
●
●
●
●
●
● ●
●
●
● ●●
●●
●
●●
●●
●●
●
● ●
●●
● ●
●
●
●
●
●
●
●
●
●
●
●
●
●
●
●●
●
●
●
●
●
●
●●
●
●
●
●
●
●
●
●
●
●
●
●
●
●●
●
●
●
●
●
●
●
●
●
●
●
●
●
●
●
●
●
●
●
●
●
●
●
●
●
●
●
●
●
●
●
●
●
●
●
●
●
●
●
●
●
●
●
●
●
●
●
●●
●
●
●●
●
●
●
●
●
●
●
●
●
●
DRIEKOP 253 KT
HACKNEY116 KT
DSJATE249 KT
FOREST HILL 117 KT
●
WINNAARSHOEK 250 KT
●
●●
●
●
●
●
●
●
●
●
●
●
●
●
●
●
●
●
●
●●
●
●
●
●
●
●
●
●
●
●
●
●
●
●
●
●
●
●
●
●
●
●
●
●
●
●
●
●●
●
●●
●
●
●●●
●●●●●●
●●●
●●●
●●●
●
●●
●●●
●●●
●●●
●
●
●
●
●●●●●
●
●
●●
●
●●
●
●
●
●
●
●
●
●
●●
●
●
●●●
●
●
● ●
●
●
●
●
●
●
●●●
●
●
●
●
●
●
●
●
●
●●●
●
●●
●
●
●
●
●
●
●●
●
●
●●
●
●
●●
●
●
●
●●
●●
●
●●●●
●
●
●
●
●●●●●
●●
●●● ●●● ●●
●●
●●●●●●
●●
●●●●●●●●●
●●
●
●
●
●
●
●●●●
●●
●
●●
●●
●●
●●
●
●
●●●●●
●
●
●
●
●●
●●
●
●
●
●
●
●
●
● ●●●
●●●●●
●
●
●
●●
●
●
●
●
●
●
●
●
●
●
●●
●
●
●
●
●
●
●
●
●
●
●
●
●
●
●
●
●
●
●
●
●
●●●●●
●●●●●●●●●
●●●●●
●●●●●●●
●●
●●●
●●●
●
●
●
●●
●●●●●●
●
●●●●●
●●●●
●●●
●●●●
●●●●
●
●
●
●
●
●
●
●
●●
●
●●
●
●
●
●●
●
●
●
●
●
●
●
●
● ●
DRIEKOP 253 KT
HACKNEY116 KT
DSJATE 249 KT
FOREST HILL 117 KT
CLAPHAM 118 KT
WINNAARSHOEK 250 KT●
Boxcut
Farm boundaries
Potholes/Dunite pipe0 1 2
Kilometers
●
●● ●
●
●
●
●
●
●
●●
●●
●
●
●
●
● ●●●
●●●●●●
●●
● ●●●●●●●●
●●●
●●●●
●●
●
● ● ●●
●
●●●●
●●
●
●
●●● ●●
●●●●●
●●●●●
●●●●●●●●
●●●●
●●
●●
●●
●●●
●●●●●
● ●
●●●●●●
●
●●●●●●
Marula Platinum Mining Area

Hackney Mineral Resources as at 30 June 2004
Orebody Category Tonnage (millions) Grade 5 PGE & Au (g/t) Pt oz (millions)
Merensky Inferred 5.2 5.73 0.5UG2 Inferred 3.5 8.88 0.4Total 8.7 6.99 0.9
Notes:– Where Mineral Reserves and Mineral Resources are quoted for the same property,Mineral
Resources are additional to Mineral Reserves.
– The Mineral Reserves quoted reflect the grade delivered to the mill rather than an in situchannel grade quoted in respect of Mineral Resources
– The modifying factors used in the UG2 mineral reserve calculation are based on the revisedmine plan which envisages conventional breast mining operations.The detailed mine planis being optimized and the mineral reserve estimate will be updated in due course.
– Estimated geological losses and rock engineering pillars have been accounted for in themineral resource calculations; which reflect the revised mine plan methodology.The UG2mineral resources merely accounts for the UG2 Chromitite Layer whilst the MerenskyReef mineral resources are based on a minimum width of 80cm.
– Grade estimates at Marula Platinum were obtained by means of ordinary kriging of UG2and Merensky Reef borehole intersections.
– Minor changes to the individual PGE metal splits have occurred due to additionalinformation being accrued during the past year.
– Marula Platinum will be applying for the conversion of the two old order mining licencesduring FY2005, whilst a new order prospecting right application for the Hackney portionis in preparation. In terms of the new Act, a prospecting right may be granted for a periodof up to five years, renewable for a further three years.A mining right may be granted forup to 30 years, renewable for a further 30 years subject to the holder meeting therequirements of the Act. The Marula Mineral Resources for both the UG2 and Merenskyare seen to be in excess of the 30-year requirement at planned production levels andwould therefore be subject to renewal after a 30-year period.
REV
IEW
OF
THE
YEA
REX
PLO
RATI
ON
,RES
ERV
ES A
ND
RES
OU
RCES
72
IMPLATS ANNUAL REPORT 2004
EXPLORATION MINERAL RESERVES AND MINERAL RESOURCES

ZimplatsOre Reserves and Mineral Resources: Zimplats holds virtually the whole of the HartleyComplex as claims and mining leases through various subsidiary companies, all of which arewholly owned by Zimplats apart from Makwiro Platinum (Pvt) Limited which is owned 70%
73
IMPLATS ANNUAL REPORT 2004
REV
IEW
OF
THE
YEA
REX
PLO
RATI
ON
,RES
ERV
ES A
ND
RES
OU
RCES
●
●
Selous Metallurgical ComplexHartley Platinum Mine
To Chegutu
To Harare
Selous/ Ngezi Road
Ngezi Platinum Mine
Ngezi River
Msweswe River
Mupture River
0 5000m
N
●
●
●●●
●● ●●●
●
●●● ● ●
● ●●●●
●
●
●●
●
●
●●
●
●●
●
●●
●
●
●
●
● ●●
●
● ●● ● ● ●●●● ● ● ●
●●●●
●●●
●● ● ●●●
●●
●●
●
●
● ●●●●
●●
●●●
● ● ●
●●●
●●●●●●● ●
●
●
●●●
●
●●●
●●●●●
● ●
●●●●●
●●●●●●●
●●●● ●●●●
●●●
●●
●
●
●
●
●
●
●●
●
●● ●
●
●●●●
●●●●
●
●● ● ●
●●
● ●●
●●● ● ●
●●●
●● ● ● ●
●●●
● ● ●● ●
●●
●●●●●●
●●●● ●●●
●●●●●
●●●●
●
●●●●
●●●
●●●●
●
●●●●
●
●●●●●●
●●●
●●●●●●
●●●●●
●●●●●
● ●●●
●●●●
●●●●
●
●●
●
● ●
●
●●
●
●●●
●●
●●
●
●
●
●
●
●
●●
●●
●●
●
● ●●●
●● ● ●
●
Open Pit Ore Reserves
Underground Ore Reserves
Measured Mineral Resources
Indicated Mineral Resources
Inferred Mineral Resources
MSZ outcrop
Ngezi: SMC all weather road
Tenements
Faults
Boreholes
Pt 48.6% Rh 4.7%
Pd 39.9% Au 6.7%
Zimplats metal splitsMSZ
Zimplats – Main Sulphide Zone Mineral Reserves and Resources

by Zimplats and 30% by Implats. Makwiro owns Special Mining Lease 1 containing theHartley Platinum Mine and the Selous Metalurgical Complex (SMC) and has a tributecovering the open pit Ngezi Platinum Mine.
Ore Reserves as at 30 June 2004
Orebody Category Tonnage (millions) Grade 3 PGE & Au (g/t) Pt oz (millions)
MSZ Proved 45.1 3.23 2.3Probable 295.7 3.35 15.6
Total 340.8 3.34 17.9
Mineral Resources as at 30 June 2004
Orebody Category Tonnage (millions) Grade 3 PGE & Au (g/t) Pt oz (millions)
MSZ Measured 102.9 4.19 6.8Indicated 860.6 4.13 55.7Inferred 1 528.0 4.11 98.6
Total 2 491.5 4.12 161.1
Notes:– The figures quoted above refer to the total Ore Reserve and Mineral Resource. As at
30 June 2004, Implats effectively owned 83.44% of Zimplats.
– Mineral Resources are quoted inclusive of Ore Reserves.
– A full revision of the Resources and Reserves is underway at Zimplats.The Zimplats MineralResources and Ore Reserves reflected in the tabulation are based on 30 June 2003estimates with depletions.
Mimosa PlatinumOre Reserves and Mineral Resources: The lease encompasses four areas, North Hill, SouthHill, Mtshingwe Block and Far South Hill, separated by major faults, covering an area of6 590 hectares.
Ore Reserves as at 30 June 2004
Orebody Category Tonnage (millions) Grade 3 PGE & Au (g/t) Pt oz (millions)
South Hill (1.8 m cut) Proved 16.1 3.75 1.0
Probable 13.7 3.51 0.8Total 29.8 3.64 1.8
Mineral Resources as at 30 June 2004
Orebody Category Tonnage (millions) Grade 3 PGE & Au (g/t) Pt oz (millions)
South Hill(1.8m cut) Measured 31.8 4.07 2.1
Indicated 31.7 3.81 1.9Inferred 18.2 3.95 1.2Inferred (Oxides) 7.2 3.81 0.4
Total 88.9 3.93 5.6North Hill(1.8m cut) Inferred 40.0 2.96* 2.2* (2E grade)
REV
IEW
OF
THE
YEA
REX
PLO
RATI
ON
,RES
ERV
ES A
ND
RES
OU
RCES
74
IMPLATS ANNUAL REPORT 2004
EXPLORATION MINERAL RESERVES AND MINERAL RESOURCES
Pt 50.0% Rh 4.1%
Pd 38.1% Au 7.8%
Mimosa South Hill metal splitsMSZ

Notes:– The figures quoted above refer to the total Ore Reserve and Mineral Resource for North
and South Hill. As at 30 June 2004, Implats owned a 50% shareholding in MimosaInvestments Limited (with Aquarius Platinum Limited owning the remaining 50%).
– The figures have been completely revisited following a joint due diligence exercise andre-interpretation of the Resource and Reserve areas and the grade estimates betweenMimosa, Implats, Aquarius,SRK (Harare) and independent consultants Venmyn Rand Ltd.
– Compared with the previous published figures, the material differences are:– • There has been an increase in the Ore Reserve tonnage as a result of extending the
area that can convert from Measured Resource to a 1.5 km strike limit from the inclinesof the Blore and Wedza shafts and extending this area to the western boundary ofSouth Hill.
75
IMPLATS ANNUAL REPORT 2004
REV
IEW
OF
THE
YEA
REX
PLO
RATI
ON
,RES
ERV
ES A
ND
RES
OU
RCES
Measured Resource
Indicated Resource
Inferred Resources
Mined out areas
Proved reserve
Probable reserve
●
●●
●
●
●
●●
●
● ●
●
●
●
●
●
●
●●
●
●●
●
●
●
●
●
●
●
●●
●
●
●●
●●
●●●
●
●●
●
●● ●
●
● ●
●●
●
●
●
●●
●●
●
●
● ●●
●
●●●●
●●●
●
●●
●●
●
●
●●●
●●
●●●●
●
●●●●
●●●● ●
●●●
●
●
●●
●
●
●
●●●
●●●
●
●
●●
●●
●●
●
●●●
●●
●●
●●
● ●
●
●
●
●
●
●●
●
●
●
●
●
●●
●
●
●●
●
●
●
●
●
●
●●
●
●
●
●
●
●
●
●
0
Kilometres
1
Oxides and bad ground
due to major faults
Low grade zones
Boreholes
N
South Hill Deposit MSZ Mineral Resources and Ore Reserves

REV
IEW
OF
THE
YEA
REX
PLO
RATI
ON
,RES
ERV
ES A
ND
RES
OU
RCES
– • The Inferred Resources exclude 38 Mt previously reported for Mtshingwe Block and FarSouth Hill (this due to limited information used to derive these estimates).
– • Low grade zones have been redefined following in-fill drilling to determine the lateralextent of these features.
– • Oxide material is now quoted separately as on-going metallurgical test work is beingconducted to verify the economic viability of these resources. The Phase 3 plant up-grade was commissioned on the basis that the Phase 2 plant could be used to separatelycampaign the oxides without compromising the sulphide ore processing recoveries
– The above Ore Reserves have been quoted as fully diluted delivered to mill, taking intoaccount an additional 11% loss for pillars and 7% tonnage loss from mine to mill.
– The Mineral Resources are quoted inclusive of Ore Reserves.
– The Mineral Resources have taken into account the following extraction discounts:– 3% – Dykes and faults– 3% – Adverse ground conditions– 8% – Washouts and abnormal reef
– In situ grade has been used for the calculation of Mineral Resources.
– Trial mining is currently ongoing at wider widths in order to optimize extraction from theMineral Resource base.This has indicated a potential increase at a 2.4 m cut in the SouthHill Resources of 29.61 Mt and 0.94 Moz (Pt) and the North Hill Resource of 13.33 Mtand 0.68 Moz (Pt).
Regulatory complianceThe reporting of Mineral Reserves and Mineral Resources for Implats’ South Africanoperations is done in accordance with the principles and guidelines of the South African Codefor Reporting of Mineral Reserves and Mineral Resources (SAMREC Code). (See Glossary ofterms on page 78).
Zimplats, as an Australian Stock Exchange listed company, reports its Ore Reserves andMineral Resources in accordance with the Australasian Code for Reporting of MineralResources and Ore Reserves (JORC Code). Mimosa Investments Limited, a Mauritius-basedcompany,does not fall under any regulatory reporting codes but has adopted the JORC Codefor its reporting.
Various Competent Persons as defined by the SAMREC Code and JORC Code have preparedthe Mineral Reserve and Mineral Resource figures quoted in this report.They were reviewedand signed off by the Implats competent person:
P. MellowshipPr.Sci.Nat. B.Sc. (Hon), M.Sc.General Manager: Mining Services: Impala Platinum Limited.
The competent person has 30 years experience in a wide range of mineral and miningprojects,of which 18 years have been in the evaluation and exploitation of Bushveld ComplexPGM deposits.
76
IMPLATS ANNUAL REPORT 2004
EXPLORATION MINERAL RESERVES AND MINERAL RESOURCES

Attributable ouncesIn addition to its own Mineral Reserves and Mineral Resources detailed above, Implats hasaccess to attributable platinum ounces through its equity participation in Two Rivers,Aquarius Platinum and Lonplats, thus bringing the total for Implats to 247.3 millionattributable platinum ounces. These reserves and resources have not necessarily beendefined in terms of the SAMREC code and have not been verified by the competent person.The extent of this interest is set out below.
Implats consolidated platinum ounces (Resource and Reserves) as at 30 June 2004
Source Platinum ounces (millions)
Impala Platinum 78.0Marula Platinum 9.9Zimplats 134.3Mimosa Platinum 3.9Lonplats* 15.4Aquarius Platinum* 2.0Two Rivers* 3.7Total 247.2* Based on latest available public information
77
IMPLATS ANNUAL REPORT 2004
REV
IEW
OF
THE
YEA
REX
PLO
RATI
ON
,RES
ERV
ES A
ND
RES
OU
RCES
REV
IEW
OF
THE
YEA
RG
LOSS
ARY
AN
D T
ERM
S
78
IMPLATS ANNUAL REPORT 2004
BEE: Black Economic Empowerment
Bord-and-pillar: Underground mining method where ore is extracted from rectangular shaped rooms, leaving parts of the ore as pillarsto support the roof. Pillars are usually rectangular and arranged in a regular pattern.
Concentrating: A process of splitting the ground ore in two fractions, one containing the valuable minerals, the other waste.
Cost per tonne/refined platinum ounce/ refined PGM ounce: The cost of mining, concentrating, smelting, refining, marketing andcorporate office expressed per unit of measure.
Decline: A shallow dipping mining excavation used to access the orebody.
Dense media separation: A means of separating reef from waste exploiting differences in density.
Development: Underground excavation for the purpose of accessing ore reserves.
FIFR: Number of fatal injuries expressed as a rate per million man hours worked.
g/t: grammes per tonne.The unit of measurement of grade, equivalent to parts per million.
Group unit cost per refined platinum ounce/refined PGM ounce: The cost of mining, concentrating and other operating expenses(marketing, corporate office) expressed per unit of mine-to-market measure, as well as the cost of smelting and refining expressed pergross unit of measure.
HDSA: Historically Disadvantaged South Africans, being South African nationals who were, prior to 1994, disadvantaged whether bylegislation or convention.
Headgrade: The value, usually expressed in parts per million or grammes per tonne, of the contained PGE mineralisation of economicinterest in material delivered to the mill.
In situ: In its natural position or place.
IRS: Impala Refining Services Limited
Kriging: A geostatistical estimation method that gives the best unbiased linear estimates of point values or of block averages.
LTIFR: Number of lost time injuries expressed as a rate per million man hours worked.
Merensky Reef: A horizon in the Critical Zone of the Bushveld Igneous Complex often containing economic grades of PGM. The termMerensky Reef as it is generally used refers to that part of the Merensky unit that is economically exploitable, regardless of the rock type.
Milling: Grinding of ore into the fine particles to expose the valuable minerals.
NGO: Non-governmental organization.
NOx: Nitrous oxides contained in exhaust emissions.
Ore Reserves: The term for Mineral Reserves (SAMREC Code) under the JORC Code.
PGE: Platinum group elements comprising six elemental metals of the platinum group. The metals are platinum, palladium, rhodium,ruthenium, iridium and osmium.
PGM: Platinum group metals being the metals derived from PGE.
Return on assets (ROA): ROA is calculated using current year attributable income expressed as a percentage of fixed assets andinvestments as at the balance sheet date.
Return on equity (ROE): ROE is calculated using current year attributable income expressed as a percentage of the opening balance ofshareholders’ equity.
Seismic surveys: A geophysical exploration method whereby rock layers can be mapped based on the time taken for energy reflectedfrom these layers to return to surface.
Smelting: A smelting process to upgrade further the fraction containing the valuable minerals.
Stoping: Underground excavations to effect the removal of ore.
UG2: A distinct chromitite horizon in the Critical Zone of the Bushveld Igneous Complex often containing economic grades of PGM.
Glossary of terms

REV
IEW
OF
THE
YEA
RG
LOSS
ARY
AN
D T
ERM
S
79
IMPLATS ANNUAL REPORT 2004
Resource and Reserve definitions
SAMREC Code – The South African Code for Reporting of Mineral Resources and Mineral Reserves sets out minimum standards,recommendations and guidelines for Public Reporting of Exploration Results, Mineral Resources and Mineral Reserves in South Africa.SAMREC was established in 1998 and modelled its Code on the Australasian Code for Reporting of Mineral Resources and Ore Reserves(JORC Code).
A Competent Person is a person who is a member of the South African Council for Natural Scientific Professions (SACNASP), or theEngineering Council of South Africa (ECSA),or the South African Council for Professional Land Surveyors and Technical Surveyors (PLATO)or any other statutory South African or international body that is recognised by SAMREC.A Competent Person should have a minimumof five years experience relevant to the style of mineralisation and type of deposit under consideration and to the activity which thatperson is undertaking. If the Competent Person is estimating,or supervising the estimation of Mineral Resources, the relevant experiencemust be in the estimation, assessment and evaluation of Mineral Resources. If the Competent Person is estimating, or supervising theestimation of Mineral Reserves, the relevant experience must be in the estimation, assessment, evaluation and economic extraction ofMineral Reserves.
A Mineral Resource is a concentration (or occurrence) of material of economic interest in or on the Earth’s crust in such form, qualityand quantity that there are reasonable and realistic prospects for eventual economic extraction.The location, quantity, grade, continuityand other geological characteristics of a Mineral Resource are known, estimated from specific geological evidence and knowledge, orinterpreted from a well constrained and portrayed geological model. Mineral Resources are subdivided, in order of increasing confidencein respect of geoscientific evidence, into Inferred, Indicated and Measured categories.
An Inferred Mineral Resource is that part of a Mineral Resources for which tonnage, grade and mineral content can be estimated witha low level of confidence. It is inferred from geological evidence and assumed but not verified geological and/or grade continuity. It isbased on information gathered through appropriate techniques from locations such as outcrops, trenches, pits, workings and drill holesthat may be limited or of uncertain quality and reliability.
An Indicated Mineral Resource is that part of a Mineral Resource for which tonnage, densities, shape, physical characteristics, grade andmineral content can be estimated with a reasonable level of confidence. It is based on exploration, sampling and testing informationgathered through appropriate techniques from locations such as outcrops, trenches, pits, workings and drill holes.The locations are toowidely or inappropriately spaced to confirm geological and/or grade continuity but are spaced closely enough for continuity to beassumed.
A Measured Mineral Resource is that part of a Mineral Resource for which tonnage, densities, shape, physical characteristics, grade andmineral content can be estimated with a high level of confidence. It is based on detailed and reliable exploration, sampling and testinginformation gathered through appropriate techniques from locations such as outcrops, trenches, pits, workings and drill holes. Thelocations are spaced closely enough to confirm geological and grade continuity.
A Mineral Reserve is the economically mineable material derived from a Measured and/or Indicated Mineral Resource. It is inclusive ofdiluting materials and allows for losses that may occur when the material is mined.Appropriate assessments,which may include feasibilitystudies, have been carried out, including consideration of, and modification by, realistically assumed mining, metallurgical, economic,marketing, legal,environmental,social and governmental factors.These assessments demonstrate at the time of reporting that extractionis reasonably justified. Mineral Reserves are sub-divided in order of increasing confidence into Probable Mineral Reserves and ProvedMineral Reserves.
A Probable Mineral Reserve is the economically mineable material derived from a Measured and/or Indicated Mineral Resource. It isestimated with a lower level of confidence than a Proved Mineral Reserve. It is inclusive of diluting materials and allows for losses thatmay occur when the material is mined.Appropriate assessments, which may include feasibility studies, have been carried out, includingconsideration of, and modification by, realistically assumed mining, metallurgical, economic, marketing, legal, environmental, social andgovernmental factors.These assessments demonstrate at the time of reporting that extraction is reasonably justified.
A Proved Mineral Reserve is the economically mineable material derived from a Measured Mineral Resource. It is estimated with ahigh level of confidence. It is inclusive of diluting materials and allows for losses that may occur when the material is mined.Appropriate assessments, which may include feasibility studies, have been carried out, including consideration of and modificationby realistically assumed mining, metallurgical, economic, marketing, legal, environmental, social and governmental factors. Theseassessments demonstrate at the time of reporting that extraction is reasonably justified.

Implats understands its responsibilities concerningthe effect that its operations have both socially andon the environment, and serious efforts are made tolimit and counter the consequences of mining andprocessing, which are by nature invasive. One sucheffort is the “woodchips” project which involvesusing two waste products (sewage sludge andwoodchips) to rehabilitate the tailings dams atImpala Platinum.This project has also created jobsand business opportunities for the local community.Suan Mulder, Environmental Manager at Impala, andthe community project team leaders, inspect thetailings dam where the grassing trials have just beencompleted.

ANNUAL FINANCIAL STATEMENTS
81
IMPLATS ANNUAL REPORT 2004
ANNUAL FINANCIALSTATEMENTS ANDSHAREHOLDERS’INFORMATION
Approval of the annual financial statements 82
Report of the independent auditors 83
Directors’ report 84
Group
Consolidated balance sheet 92
Consolidated income statement 93
Consolidated statement of changes in shareholders' equity 94
Consolidated cash flow statement 95
Notes to the consolidated financial statements 96
Company
Balance sheet 136
Income statement 136
Statement of changes in shareholders’ equity 137
Cash flow statement 138
Notes to the financial statements 139
Contents

AN
NU
AL
FIN
AN
CIA
L ST
ATEM
ENTS
The annual financial statements for the year ended 30 June 2004, which appear on pages 84 to 143 were approved by the board ofdirectors on 27 August 2004.
The directors are responsible for the fair presentation to shareholders of the affairs of the company and of the group as at the end ofthe financial year, and of the results for the period, as set out in the annual financial statements. The directors are responsible for theoverall co-ordination, preparation and presentation, and approval of the financial statements. Responsibility for the initial preparationof these statements was delegated to the officers of the company and the group.
The auditors are responsible for auditing and reporting on the financial statements in the course of executing their statutory duties.Thefinancial statements have been prepared on a going concern basis, conform with applicable accounting standards and are presentedapplying consistent accounting policies supported by reasonable and prudent judgements and estimates.To discharge this responsibility,the group maintains accounting and administrative control systems designed to provide reasonable assurance that assets are safeguardedand that transactions are executed and recorded in accordance with generally accepted business practices and procedures.The accountingpolicies of the group are set out on pages 96 to 105 of this report.
P G Joubert K C RumbleChairman Chief Executive Officer
Johannesburg27 August 2004
82
IMPLATS ANNUAL REPORT 2004
Approval of the annual financial statements
I, the undersigned, in my capacity as Group Secretary, do hereby confirm that for the financial year ended 30 June 2004, Implats haslodged with the Registrar of Companies all such returns as are required of a public company in terms of the Companies Act 61 of 1973,as amended, and that all such returns are true, correct and up to date.
R MahadeveyGroup Secretary
Certificate by group secretary

83
IMPLATS ANNUAL REPORT 2004 AN
NU
AL
FIN
AN
CIA
L ST
ATEM
ENTS
To the members of Impala Platinum Holdings Limited
We have audited the annual financial statements and group annual financial statements of Impala Platinum Holdings Limited as set outon pages 84 to 143 for the year ended 30 June 2004.These financial statements are the responsibility of the directors of the company.Our responsibility is to express an opinion on these financial statements, based on our audit.
ScopeWe conducted our audit in accordance with Generally Accepted Auditing Standards in South Africa and in accordance with InternationalStandards on Auditing issued by the International Federation of Accountants.Those standards require that we plan and perform the auditto obtain reasonable assurance that the financial statements are free of material misstatements.An audit includes:
• Examining, on a test basis, evidence supporting the amounts and disclosures in the financial statements;
• Assessing the accounting principles used and significant estimates made by management; and
• Evaluating the overall financial statement presentation.
We believe that our audit provides a reasonable basis for our opinion.
Audit opinionIn our opinion, the financial statements fairly present, in all material respects, the financial position of the group and of the company at30 June 2004 and the results of their operations and cash flows for the year then ended in accordance with South African Statementsof Generally Accepted Accounting Practice, International Financial Reporting Standards and in the manner required by the South AfricanCompanies Act.
PricewaterhouseCoopers IncChartered Accountants (SA)Registered Accountants and Auditors
Johannesburg27 August 2004
Report of the independent auditors

AN
NU
AL
FIN
AN
CIA
L ST
ATEM
ENTS
ProfileBusiness of the companyImpala Platinum Holdings Limited (Implats/company/group) is principally in the business of producing and supplying platinum groupmetals (PGMs) to industrial economies. The company’s holdings in various mining and exploration activities as at 30 June 2004 aredescribed below:
Effective Company Short name Interest % Activity
Impala Platinum Limited Impala 100 PGM mining, processing and refiningImpala Refining Services Limited IRS 100 Purchase of concentrate, smelting,
refining and sale of resultant PGMs andbase metals, and toll refining
Marula Platinum Limited Marula 100* PGM mining Makwiro Platinum Mines (Pvt) Limited Makwiro 88 PGM miningZimbabwe Platinum Mines Limited Zimplats 83 PGM miningMimosa Investments Limited Mimosa 50 PGM mining Two Rivers Platinum (Pty) Limited Two Rivers 45 PGM mine developmentEastern Platinum Limited EPL 27** PGM mining and processingWestern Platinum Limited WPL 27** PGM mining, processing and refining Aquarius Platinum (SA) (Pty) Limited AQP (SA) 25*** PGM mining Aquarius Platinum Limited Aquarius Platinum 9 PGM mining
* subject to 20% participation by empowerment partners** agreement entered into for the sale of this shareholding*** will reduce to 20% on completion of BEE transaction
CapitalAuthorised capitalThe company’s authorised share capital of 100 000 000 ordinary shares of 20 cents each remained unchanged during the year.
Issued capitalDuring the year 27 188 new ordinary shares were issued in terms of the Implats share option scheme. Following allotments, the issuedcapital of the company was 66 621 177 ordinary shares of 20 cents each (2003: 66 593 989).
In terms of a resolution passed at the last annual general meeting, 10% of the unissued share capital is under the control of the directorsuntil the forthcoming annual general meeting. Shareholders granted a general authority for the company or any of its subsidiaries toacquire up to 10% of the shares issued by the company in terms of the Companies Act No 61 of 1973 and the Listing Requirements ofthe JSE Securities Exchange South Africa (JSE).
In addition, shareholders authorised the directors to issue for cash up to 15% of the company’s issued share capital in any one year.
These general authorities expire at the forthcoming annual general meeting. Shareholders will be asked to consider resolutions renewingthese general authorities.The proposed resolutions are set out in the notice convening the annual general meeting.
Share option schemeThe directors are authorised to issue, allot or grant options to acquire up to a maximum of 2 177 000 ordinary shares in the unissuedshare capital of the company in terms of employee share options schemes.The rules of the share option scheme were amended at thelast annual general meeting. Details of participation in the share option scheme are set out in Note 13 of the financial statements.
The trustees of the scheme are Messrs PG Joubert, JV Roberts and JM McMahon.
84
IMPLATS ANNUAL REPORT 2004
Directors’ report
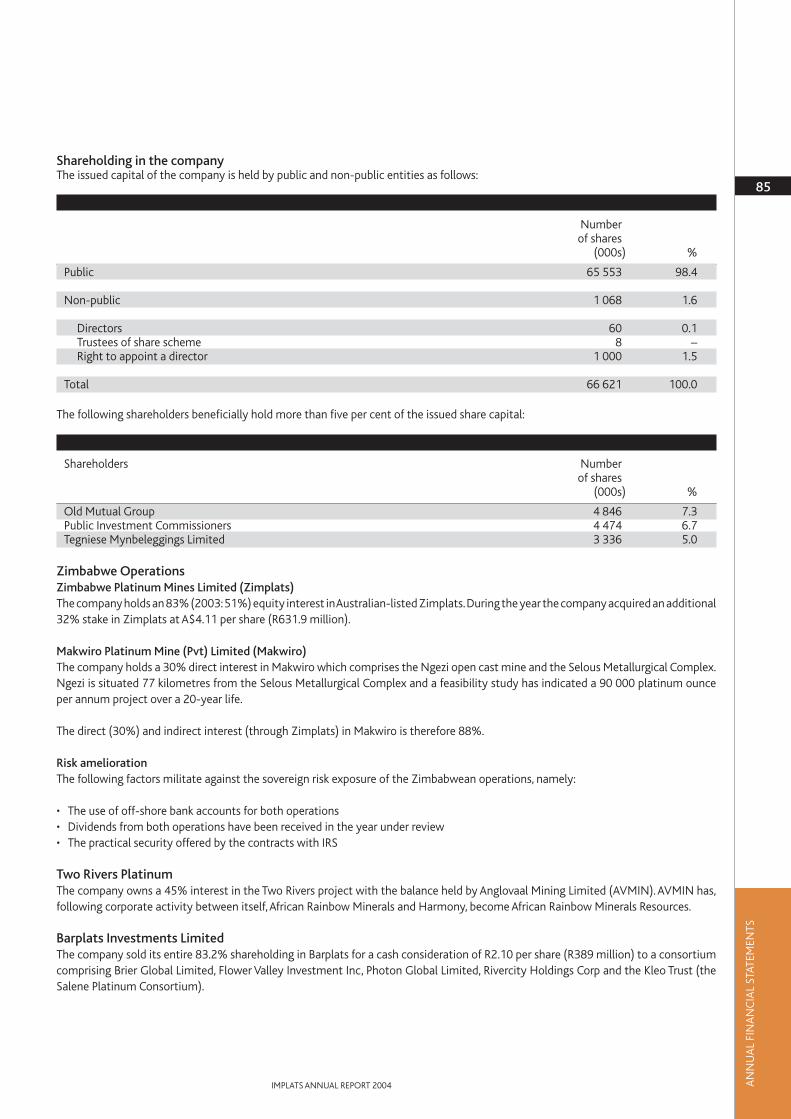
Shareholding in the companyThe issued capital of the company is held by public and non-public entities as follows:
Numberof shares
(000s) %
Public 65 553 98.4
Non-public 1 068 1.6
Directors 60 0.1Trustees of share scheme 8 –Right to appoint a director 1 000 1.5
Total 66 621 100.0
The following shareholders beneficially hold more than five per cent of the issued share capital:
Shareholders Number of shares
(000s) %
Old Mutual Group 4 846 7.3Public Investment Commissioners 4 474 6.7Tegniese Mynbeleggings Limited 3 336 5.0
Zimbabwe OperationsZimbabwe Platinum Mines Limited (Zimplats)The company holds an 83% (2003:51%) equity interest in Australian-listed Zimplats.During the year the company acquired an additional32% stake in Zimplats at A$4.11 per share (R631.9 million).
Makwiro Platinum Mine (Pvt) Limited (Makwiro)The company holds a 30% direct interest in Makwiro which comprises the Ngezi open cast mine and the Selous Metallurgical Complex.Ngezi is situated 77 kilometres from the Selous Metallurgical Complex and a feasibility study has indicated a 90 000 platinum ounceper annum project over a 20-year life.
The direct (30%) and indirect interest (through Zimplats) in Makwiro is therefore 88%.
Risk ameliorationThe following factors militate against the sovereign risk exposure of the Zimbabwean operations, namely:
• The use of off-shore bank accounts for both operations• Dividends from both operations have been received in the year under review• The practical security offered by the contracts with IRS
Two Rivers PlatinumThe company owns a 45% interest in the Two Rivers project with the balance held by Anglovaal Mining Limited (AVMIN).AVMIN has,following corporate activity between itself,African Rainbow Minerals and Harmony, become African Rainbow Minerals Resources.
Barplats Investments LimitedThe company sold its entire 83.2% shareholding in Barplats for a cash consideration of R2.10 per share (R389 million) to a consortiumcomprising Brier Global Limited, Flower Valley Investment Inc, Photon Global Limited, Rivercity Holdings Corp and the Kleo Trust (theSalene Platinum Consortium).
85
IMPLATS ANNUAL REPORT 2004 AN
NU
AL
FIN
AN
CIA
L ST
ATEM
ENTS
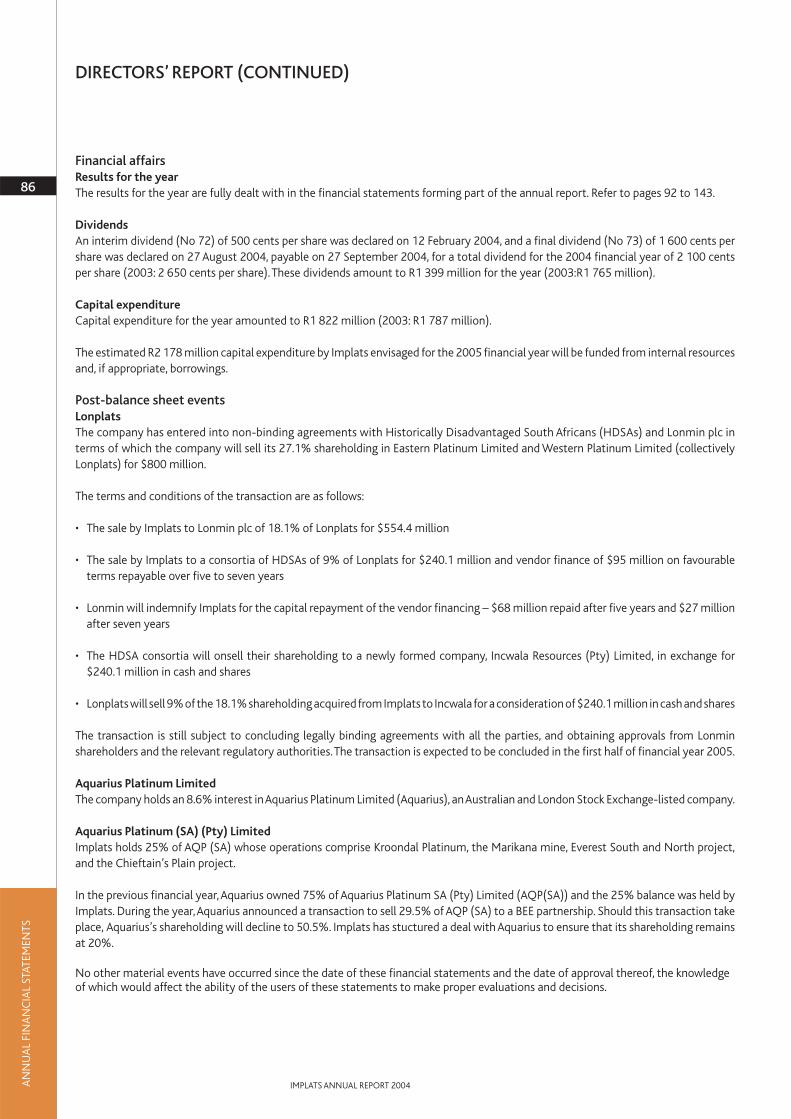
AN
NU
AL
FIN
AN
CIA
L ST
ATEM
ENTS
Financial affairsResults for the yearThe results for the year are fully dealt with in the financial statements forming part of the annual report. Refer to pages 92 to 143.
DividendsAn interim dividend (No 72) of 500 cents per share was declared on 12 February 2004, and a final dividend (No 73) of 1 600 cents pershare was declared on 27 August 2004, payable on 27 September 2004, for a total dividend for the 2004 financial year of 2 100 centsper share (2003: 2 650 cents per share).These dividends amount to R1 399 million for the year (2003:R1 765 million).
Capital expenditureCapital expenditure for the year amounted to R1 822 million (2003: R1 787 million).
The estimated R2 178 million capital expenditure by Implats envisaged for the 2005 financial year will be funded from internal resourcesand, if appropriate, borrowings.
Post-balance sheet eventsLonplatsThe company has entered into non-binding agreements with Historically Disadvantaged South Africans (HDSAs) and Lonmin plc interms of which the company will sell its 27.1% shareholding in Eastern Platinum Limited and Western Platinum Limited (collectivelyLonplats) for $800 million.
The terms and conditions of the transaction are as follows:
• The sale by Implats to Lonmin plc of 18.1% of Lonplats for $554.4 million
• The sale by Implats to a consortia of HDSAs of 9% of Lonplats for $240.1 million and vendor finance of $95 million on favourableterms repayable over five to seven years
• Lonmin will indemnify Implats for the capital repayment of the vendor financing – $68 million repaid after five years and $27 millionafter seven years
• The HDSA consortia will onsell their shareholding to a newly formed company, Incwala Resources (Pty) Limited, in exchange for$240.1 million in cash and shares
• Lonplats will sell 9% of the 18.1% shareholding acquired from Implats to Incwala for a consideration of $240.1 million in cash andshares
The transaction is still subject to concluding legally binding agreements with all the parties, and obtaining approvals from Lonminshareholders and the relevant regulatory authorities.The transaction is expected to be concluded in the first half of financial year 2005.
Aquarius Platinum LimitedThe company holds an 8.6% interest in Aquarius Platinum Limited (Aquarius), an Australian and London Stock Exchange-listed company.
Aquarius Platinum (SA) (Pty) LimitedImplats holds 25% of AQP (SA) whose operations comprise Kroondal Platinum, the Marikana mine, Everest South and North project,and the Chieftain’s Plain project.
In the previous financial year,Aquarius owned 75% of Aquarius Platinum SA (Pty) Limited (AQP(SA)) and the 25% balance was held byImplats. During the year,Aquarius announced a transaction to sell 29.5% of AQP (SA) to a BEE partnership. Should this transaction takeplace, Aquarius’s shareholding will decline to 50.5%. Implats has stuctured a deal with Aquarius to ensure that its shareholding remainsat 20%.
No other material events have occurred since the date of these financial statements and the date of approval thereof, the knowledgeof which would affect the ability of the users of these statements to make proper evaluations and decisions.
86
IMPLATS ANNUAL REPORT 2004
DIRECTORS’ REPORT (CONTINUED)

Going concernThe financial statements have been prepared using the appropriate accounting policies,supported by reasonable and prudent judgementsand estimates.The directors have a reasonable expectation that the group has adequate resources to continue as a going concern in theforeseeable future.
Associated and subsidiary companiesInformation regarding the company’s associated companies are given in Note 6 and regarding subsidiaries in Annexure A, both to thefinancial statements.
PropertyDetails of the freehold and leasehold land and buildings of the various companies are contained in registers, which are available forinspection at the registered offices of those companies.
DirectorateComposition of the boardDuring the year, the following appointments were made to the board:
Directors Date of appointmentRSN Dabengwa 1 January 2004LC van Vught 1 January 2004NDB Orleyn 1 April 2004FJP Roux 11 May 2004K Mokhele 1 June 2004
Shareholders will be asked to confirm these appointments at the forthcoming annual general meeting.
The directors who retire at the next general meeting are Ms CE Markus, Messrs PG Joubert, JV Roberts and JM McMahon. Mr Joubert,having attained the retirement age for non-executive directors, has decided not to stand for re-election. Ms CE Markus, and Messrs JVRoberts and JM McMahon, being eligible, offer themselves for re-election.
Interest of directorsThe interests of directors and senior management in the shares of the company were as follows and did not individually exceed 1% ofthe issued share capital or voting control of the company.
Number of shares Direct Indirect
30 June 2004 2003 2004 2003
Beneficial 63 345 66 651 14 240 14 240DirectorsDH Brown 10 000 9 306PG Joubert 14 000 14 000CE Markus 18 011 18 011MV Mennell 7 726 7 726LJ Paton 9 000 12 000 100 100MF Pleming 600 600LC van Vught 140 140Senior management 18 008 19 008Non-beneficial – – – –
The board consists of 11 independent directors, one non-executive director and four executive directors.
87
IMPLATS ANNUAL REPORT 2004 AN
NU
AL
FIN
AN
CIA
L ST
ATEM
ENTS

AN
NU
AL
FIN
AN
CIA
L ST
ATEM
ENTS
Directors’ and senior management remuneration for the year under review was in aggregate as follows:
Gains onshare
30 June 2004 Retirement Other options 2004 2003(R000) Fees Package Funds benefits* Bonus† exercised Total Total
ExecutiveKC Rumble 3 286 345 224 1 350 2 370 7 575 5 008DH Brown 1 774 186 53 589 354 2 956 3 022CE Markus 1 565 313 40 580 1 761 4 259 2 826LJ Paton 1 293 206 64 432 162 2 157 –Senior Management 7 073 1 022 283 2 499 2 510 13 387 11 230SecretaryR Mahadevey 944 99 40 69 1 152 –Non-executive DirectorsPG Joubert 400 400 226RSN Dabengwa 63 63 –JM McMahon 225 225 144MV Mennell 285 285 156TV Mokgatlha 133 133 23K Mokhele 10 10 –DM O’Connor 226 226 140NDB Orleyn 31 31 –MF Pleming 275 275 160FJP Roux 18 18 –JV Roberts 285 285 160LC van Vught 81 81 –L Molotlegi – – 68
2 032 15 935 2 171 704 5 519 7 157 33 518 23 163
Details of share options outstanding and exercised by executive directors and senior management are as follows:
Additions DisposalsBalance Allocated No. of Balance at First
Director’s at 1 July during Date of shares Date at 30 June No. of Allocation ReleaseName 2003 the year Allocation sold sold 2004 shares price date
Executive DirectorsKC Rumble 64 417 5 993 27 Aug 03 1 000 15 Jul 03 33 000 281.00 17 Jul 03
9 000 16 Jul 03 11 801 507.00 18 Feb 041 000 5 Sep 03 2 974 484.10 16 Aug 04
5 642 594.25 21 Jan 0559 410 5 993 515.82 27 Aug 05
DH Brown 27 522 439 27 Aug 03 1 550 29 Aug 03 1 550 146.00 30 Jun 012 350 200.00 14 Mar 023 394 344.00 11 Jan 031 982 507.00 18 Feb 019 454 507.00 18 Feb 041 198 556.00 6 Jun 042 851 484.10 16 Aug 041 555 594.25 21 Jan 051 638 381.00 5 May 05
26 411 439 515.82 27 Aug 05* Other benefits excludes:– Any leave not taken during the year which the recipient could elect to have paid out in cash.– A performance-based staff retention scheme using an endowerment investment vehicle which only accrues to the individual after five years from the
date of joining the scheme.† Bonus is based on individual achievement, value-added criteria such as volumes and costs, and safety achievements.This isolates the effects of metal
prices and exchange rates over which management has no control.
88
IMPLATS ANNUAL REPORT 2004
DIRECTORS’ REPORT (CONTINUED)

89
IMPLATS ANNUAL REPORT 2004 AN
NU
AL
FIN
AN
CIA
L ST
ATEM
ENTS
Details of share options outstanding and exercised by executive directors and senior management are as follows: (continued)
Director’s Balance Allocated Balance at FirstName at 1 July during Date of No. of Date at 30 June No. of Allocation Release
2003 the year Allocation shares sold 2004 shares price date
Executive Directors (continued)CE Markus 29 976 389 27 Aug 03 1 375 5 Sep 03 1 375 146.00 30 Jun 01
1 800 5 Sep 03 3 600 200.00 14 Mar 021 019 5 Sep 03 3 056 344.00 11 Jan 031 214 5 Sep 03 694 507.00 18 Feb 02
8 227 507.00 18 Feb 041 477 556.00 6 Jun 042 735 484.10 16 Aug 04
41 589.99 25 Nov 041 498 594.25 21 Jan 051 865 381.00 5 May 05
24 957 389 515.82 27 Aug 05LJ Paton 16 734 142 27 Aug 03 470 23 Jul 03 500 146.00 30 Jun 01
3 840 18 Sep 03 357 507.00 18 Feb 022 625 200.00 14 Mar 002 475 344.00 11 Jan 035 422 507.00 18 Feb 04
959 556.00 6 Jun 041 878 484.10 16 Aug 04
844 594.25 21 Jan 051 204 381.00 5 May 05
142 515.82 27 Aug 0520 246 3 840 539.40 18 Sep 05
Senior 104 380 6 386 27 Aug 03 13 889 Various 3 600 50-100 Jul 1999>Management 2 133 16 Feb 04 17 025 101-200 Jun 2001>
7 683 22 Apr 04 19 857 301-400 Jan 2003>17 759 401-500 Aug 2004>
106 693 48 452 501-600 Feb2004>SecretaryR Mahadevey 8 978 8 978 8 978 401.00 2 Apr 05

AN
NU
AL
FIN
AN
CIA
L ST
ATEM
ENTS
90
IMPLATS ANNUAL REPORT 2004
DIRECTORS’ REPORT (CONTINUED)
The gains on share options exercised are as follows:
No. of Allocation Market Gain on price at share options
Director’s name Purchased shares sold Total Price time of sale (R’000)
Executive DirectorsKC Rumble 11 000 11 000 281.00 496.46 2 370DH Brown 694 856 1 550 146.00 560.00 * 354CE Markus 1 375 1 375 146.00 608.05 635
1 800 1 800 200.00 608.05 7341 019 1 019 344.00 608.05 2691 219 1 214 507.00 608.05 123
LJ Paton 500 500 146.00 470.00 152
Senior Management1 750 4 625 6 375 146.00 461.07 *1 457
500 900 1 400 200.00 560.69 *3251 781 2 837 4 618 344.00 568.19 *636
32 1 464 1 496 507.00 569.59 *92* Excludes any gains on shares purchased as these have not yet been realised.
No share options were granted to independent non-executive directors.Other benefits accruing to executive directors are set out below.
There were no contracts of significance during or at the end of the financial year in which the directors of the company were materiallyinterested.
No material change in the aforegoing interests has taken place between 30 June and the date of this report.
Directors’ feesIn terms of the Articles of Association, the fees for services as directors are determined by the company in general meeting. Directors’fees for services as a director are currently R125 000 per annum per director with an amount of R400 000 for the Chairman (whichincludes attendance at all board committee meetings). Directors serving on board committees are paid as set out below:
In view of the increased responsibilities being placed on directors in terms of the King II report and the revised JSE listings requirementsas well as the need to attract suitable candidates for board appointment, it is proposed to increase directors fees as follows:
1 July 2003 1 July 2004Member Chairman Member Chairman
Board member 125 000 400 000* 150 000 700 000*Audit Committee 60 000 120 000 75 000 180 000HSE Committee 50 000 100 000 60 000 135 000Nomination Committee 50 000 100 000 60 000 135 000Remuneration Committee 50 000 100 000 60 000 135 000
* includes attendance at all board committee meetings
These fees have been waived by the executive directors.
Directors’ benefitsA group-owned residential property is made available to Mr KC Rumble on a rent-free basis. Mr Rumble has an option to purchase theproperty at market value at any time while in the employ of the company.
In the event of corporate action giving rise to a loss of office, demotion or the blighting of any career (in the opinion of the RemunerationCommittee) of an executive director, that executive director is entitled to a severance package of 24 months salary.
AdministrationSpecial resolutionsAt the last annual general meeting, the following special resolutions were passed:
Acquisition of sharesAllowing the company and its subsidiaries to acquire up to 10% of the shares in the company subject to the Companies Act 1973and the Listing Requirements of the JSE, provided that the authority expires at the next annual general meeting and may not extendbeyond 15 months from the date of granting of the authority.
Articles of associationThe articles of association were amended by special resolution to allow for the appointment of a maximum number of 16 directorson the board and to require only that directors’ written resolutions be approved by the majority of the board.
Financial, administrative and technical advisersIn terms of a service agreement, Impala Platinum Limited acted as financial, administrative and technical advisors to the Implats groupduring the year on a fee basis. Messrs DH Brown, PG Joubert, LJ Paton, KC Rumble and Ms CE Markus had an interest in this contract tothe extent that they are directors of Impala and of the company, but they do not beneficially own any shares in Impala.
SecretariesDuring the year Mr R Mahadevey was appointed Group Secretary to Implats and Impala, assisted by Mr AM Snashall. Impala acted asSecretaries to other subsidiaries in the Implats group.The business and postal addresses of the Secretaries are set out on page 152.
London SecretariesThe business and postal addresses of the London Secretaries are set out on page 152.
Public OfficerMr J van Deventer acted as public officer for the group for the year under review.
91
IMPLATS ANNUAL REPORT 2004 AN
NU
AL
FIN
AN
CIA
L ST
ATEM
ENTS

AN
NU
AL
FIN
AN
CIA
L ST
ATEM
ENTS
As at 30 June(All amounts in Rand millions unless otherwise stated) Notes 2004 2003
ASSETSNon-current assetsProperty, plant and equipment 5 9 635.6 8 808.9Investments in associates 6 2 304.6 2 208.9Deferred income tax assets 16 9.4 –Available-for-sale financial investments 7 186.4 229.7Held-to-maturity investments 8 89.0 74.9Other receivables 9 132.7 68.8
12 357.7 11 391.2Current assetsInventories 10 1 229.8 847.4Trade and other receivables 11 2 246.2 1 706.2Cash and cash equivalents 12 1 204.2 2 324.5
4 680.2 4 878.1Total assets 17 037.9 16 269.3
EQUITYCapital and reserves attributable to the equity holders of the holding companyShare capital 13 625.3 617.8Other reserves 14 (626.3) 38.8Retained earnings 10 685.8 9 220.8
10 684.8 9 877.4Minority interest 128.1 418.9Total equity 10 812.9 10 296.3
LIABILITIESNon-current liabilitiesBorrowings 15 – 62.7Deferred income tax liabilities 16 2 271.9 1 886.7Retirement benefit obligations 17 62.3 63.5Provision for future rehabilitation 18 207.3 200.2
2 541.5 2 213.1Current liabilitiesTrade and other payables 19 2 875.1 2 844.5Current income tax liabilities 239.8 710.7Borrowings 15 568.6 204.7
3 683.5 3 759.9Total liabilities 6 225.0 5 973.0Total equity and liabilities 17 037.9 16 269.3
The consolidated financial statements have been approved by the board of directors for issue on 27 August 2004.The notes on pages 96 to 135 are an integral part of these consolidated financial statements.
92
IMPLATS ANNUAL REPORT 2004
Consolidated balance sheet Implats group – as at 30 June 2004

93
IMPLATS ANNUAL REPORT 2004 AN
NU
AL
FIN
AN
CIA
L ST
ATEM
ENTS
Year ended 30 June(All amounts in Rand millions unless otherwise stated) Notes 2004 2003
Sales 4 11 809.1 11 807.0
On-mine operations 20 (3 667.7) (3 251.1)Concentrating and smelting operations 21 (967.4) (801.1)Refining operations 22 (477.2) (411.5)Amortisation of mining assets (572.3) (452.4)Metals purchased (2 259.2) (1 474.1)Increase/(decrease) in metal inventories 394.4 (133.1)Cost of sales (7 549.4) (6 523.3)
Gross profit 4 259.7 5 283.7Net foreign exchange transaction losses 23 (216.0) (328.8)Other operating expenses 24 (241.2) (252.6)Other income/(expense) 26 11.4 (54.7)Other gains – net 27 138.6 319.1Finance costs 28 (67.1) (33.3)Share of profit of associates 29 328.4 725.0Royalty expense (414.4) (598.0)Profit from disposal of Barplats Investments Limited 30 322.3 –Profit before tax 31 4 121.7 5 060.4Income tax expense 32 (1 141.3) (1 622.1)Profit for the year 2 980.4 3 438.3
Profit attributable to:Equity holders of the company 2 963.0 3 415.1Minority interest 17.4 23.2
2 980.4 3 438.3Earnings per share (expressed in cents per share) 33– basic 4 450 5 131– diluted 4 442 5 119Headline earnings per share (expressed in cents per share) 33– basic 3 966 5 140– diluted 3 959 5 128
Dividends to group shareholders (expressed in cents per share) 34– final dividend June 2004/3 proposed 1 600 1 750– interim dividend December 2003/2 paid 500 900
2 100 2 650The notes on pages 96 to 135 are an integral part of these consolidated financial statements.
Consolidated income statement Implats group – Year ended 30 June 2004

AN
NU
AL
FIN
AN
CIA
L ST
ATEM
ENTS
Attributable to equity(All amounts in Rand millions holders of the companyunless otherwise stated) Share Other Retained Minority Total
Notes capital reserves earnings interest equity
Balance at 30 June 2002 602.9 545.7 8 135.4 61.6 9 345.6
Fair value losses net of tax:Available-for-sale financial assets 14 (192.8) (192.8)
Currency translation differences 14 (314.1) (314.1)Net expense recognised directly in equity (506.9) (506.9)Profit for the year 3 415.1 23.2 3 438.3
(506.9) 3 415.1 23.2 2 931.4
Employee share option scheme:Proceeds from shares issued 13 14.9 14.9
Dividend relating to 2002 34 (1 730.4) (1 730.4)Dividend relating to 2003 34 (599.3) (599.3)Business combinations:
Currency translation differences (251.0) (251.0)Acquisition of subsidiaries – Zimbabwe Platinum Mines Limited 38 775.2 775.2Transfer from Makwiro Platinum Mines (Private) Limited on consolidation of Zimbabwe Platinum Mines Limited (190.1) (190.1)
14.9 (2 329.7) 334.1 (1 980.7)Balance at 30 June 2003 617.8 38.8 9 220.8 418.9 10 296.3
Fair value losses net of tax:Available-for-sale financial assets 14 (48.6) (48.6)
Currency translation differences 14 (265.8) (33.4) (299.2)Net expense recognised directly in equity (314.4) (33.4) (347.8)Profit for the year 2 963.0 17.4 2 980.4
(314.4) 2 963.0 (16.0) 2 632.6
Employee share option scheme:Adjustment as a result of consolidating share trust 13 (18.7) (18.7)Proceeds from shares issued 13 26.2 26.2
Zimbabwe Platinum Mines Limited shares issued in terms of offer to minorities 17.8 17.8Dividend relating to 2003 34 (1 165.4) (1 165.4)Dividend relating to 2004 34 (332.6) (332.6)Disposal of Barplats Investments Limited 30 (11.4) (11.4)Business combinations:
Purchase of additional shares in Zimbabwe Platinum Mines Limited 14, 38 (350.7) (281.2) (631.9)
7.5 (350.7) (1 498.0) (274.8) (2 116.0)Balance at 30 June 2004 625.3 (626.3) 10 685.8 128.1 10 812.9
The notes on pages 96 to 135 are an integral part of these consolidated financial statements.
94
IMPLATS ANNUAL REPORT 2004
Consolidated statement of changes in shareholders’ equity Implats group – Year ended 30 June 2004

95
IMPLATS ANNUAL REPORT 2004 AN
NU
AL
FIN
AN
CIA
L ST
ATEM
ENTS
Year ended 30 June(All amounts in Rand millions unless otherwise stated) Notes 2004 2003
Cash flows from operating activitiesCash generated from operations 35 3 140.1 4 335.3Interest paid 28 (63.0) (20.7)Income tax paid (1 264.5) (1 823.5)Net cash from operating activities 1 812.6 2 491.1
Cash flows from investing activitiesAcquisition of interest in subsidiary and joint venture, net of cash acquired 38 (631.9) (110.4)Disposal of subsidiary, net of cash sold 30 388.6 –Purchase of property, plant and equipment 5 (1 824.7) (1 754.9)Proceeds from sale of property, plant and equipment 5 7.8 43.3Increase in investments in associates 6 (42.0) 492.8Purchase of unlisted investments 7 (14.7) –Loan repayments received 9 – 18.5Payments made to environmental trust 18 (8.3) (8.9)Interest received 85.7 301.4Dividends received 295.8 192.4Net cash used in investing activities (1 743.7) (825.8)
Cash flows from financing activitiesIssue of ordinary shares 25.2 14.9Proceeds from/(repayments of) short-term borrowings 15 380.9 (152.7)Repayments of long-term borrowings 15 (74.7) (23.6)Dividends paid to company’s shareholders (1 498.0) (2 329.7)Net cash used in financing activities (1 166.6) (2 491.1)
Net decrease in cash and cash equivalents (1 097.7) (825.8)
Cash and cash equivalents at beginning of year 12 2 324.5 3 150.3
Effects of exchange rate changes on monetary assets (39.8) –
Cash and cash equivalents at end of year 12 1 187.0 2 324.5
The notes on pages 96 to 135 are an integral part of these consolidated financial statements.
Consolidated cash flow statement Implats group – Year ended 30 June 2004

AN
NU
AL
FIN
AN
CIA
L ST
ATEM
ENTS
96
IMPLATS ANNUAL REPORT 2004
1 Summary of significant accounting policiesThe principal accounting policies applied in the preparation of these consolidated financial statements are set out below.
1.1 Basis of preparationThe consolidated financial statements have been prepared in accordance with International Financial Reporting Standards(IFRS), South African Statements of Generally Accepted Accounting Practice and the South African Companies Act. Theconsolidated financial statements have been prepared under the historical cost convention, as modified by the revaluationof available-for-sale financial assets, and financial assets and financial liabilities (including derivative instruments) at fairvalue through the income statement or the statement of changes in equity. The principal accounting policies used by thegroup are consistent with those of the previous year, except for early adoption of revised/issued standards set out below.
Notes to the consolidated financial statements Implats group – Year ended 30 June 2004
(All amounts in Rand millions unless otherwise stated)
StandardRevised/issued Description Impact
Earlyadopted
Retro-spectivechange
2004changes
2003changes
IAS 1
IAS 2
IAS 8
IAS 10
IAS 16
IAS 17
IAS 21
IAS 24
IAS 27
IAS 28
IAS 31
IAS 32
IAS 33
IAS 36
IAS 38
IAS 39
2003
2003
2003
2003
2003
2003
2003
2003
2003
2003
2003
2003
2003
2004
2004
2003
Presentation of FinancialStatements
Inventories
Accounting Policies, Changes inAccounting Estimates and Errors
Events after the Balance Sheet Date
Property, Plant and Equipment
Leases
The Effects of Changes in ForeignExchange Rates
Related Party Disclosures
Consolidated and Separate Financial Statements
Investments in Associates
Interest in Joint Ventures
Financial Instruments: Disclosureand Presentation
Earnings per Share
Impairment of Assets
Intangible Assets
Financial Instruments: Recognitionand Measurement
Affected the presentation of minorityinterest and other disclosures.Disclosed critical judgements and keyassumptions.Tax of associates adjusted to be includedwith income from associates before tax.
No material effect on the group’s policies.
No material effect on the group’s policies.Disclosed the impact of new standards notyet adopted.
No material effect on the group’s policies.
As set out below.
No material effect on the group’s policies.
As set out below.
Affected the identification of relatedparties and some other related-partydisclosures.
No material effect on the group’s policies.
No material effect on the group’s policies.
No material effect on the group’s policies.
No material effect on the group’s policies.
No material effect on the group’s policies.
No material effect on the group’s policies.
Ceased to amortise goodwill.
No material effect on the group’s policies.
✓
✓
✓
✓
✗
✓
✗
✓
✓
✓
✓
✓
✓
✓
✓
✓
✓
✓
✓
✓
✓
✓
✓
✓
✓
✓
✓
✓
✓
✓
✓
✗
✓
✗
✗
✗
✗
✗
✗
✓
✗
✗
✗
✗
✗
✗
✓
✗
✓
✗
✗
✗
✗
✗
✗
✓
✗
✗
✗
✗
✗
✗
✗
✗
Summary of standards revised/issued

97
IMPLATS ANNUAL REPORT 2004 AN
NU
AL
FIN
AN
CIA
L ST
ATEM
ENTS
The preparation of financial statements in conformity with IFRS requires the use of certain critical accounting estimates.It also requires management and the board to exercise its judgement in the process of applying the group’s accountingpolicies. The areas involving a higher degree of judgement or complexity, or areas where assumptions and estimates aresignificant to the consolidated financial statements, are disclosed in Note 3.
The group has not yet adopted the following standards which are only effective for financial years commencing on or after1 January 2005.The group will adopt these statements by no later than 1 July 2005:
IAS 16 Property, plant and equipment (revised 2003)The impact of the early adoption of IAS 16 (revised 2003) would be the separate classification and amortisation/depreciationof significant components of property, plant and equipment.The group is currently in the process of determining the impactof such classification.The future implementation should not substantially affect the financial statements.
IAS 21 The effects of changes in foreign exchange rates (revised 2003)This standard provides guidance on determining the functional currency of an operation.Although no effect on the group'spolicies is anticipated, the impact of this standard on the group's Zimbabwean operations is currently being assessed.
IFRS 2 Share-based paymentThe estimated effect of the early adoption of IFRS 2 would have impacted on current year results as follows:Decrease in retained earnings:
Estimated cost of share-based payment R21.7 millionDecrease in basic and diluted earnings per share (cents per share) 32.6 centsEstimated adjustment to opening retained income R10.9 million
IFRS 4 Insurance contractsThe impact of adoption of the standard is currently being assessed. No material effect on the group’s policies is anticipated.
IFRS 5 Non-current assets held for sale and discontinued operationsThe impact of the early adoption of IFRS 5 would be the separate disclosure on the face of the income statement of the lossfrom the discontinued operations of Barplats Investments Limited (Note 30). Non-current assets held-for-sale would bereclassified as current assets in the balance sheet.
StandardRevised/issued Description Impact
Earlyadopted
Retro-spectivechange
2004changes
2003changes
IFRS 2
IFRS 3
IFRS 4
IFRS 5
2004
2004
2004
2004
Share-based Payment
Business Combinations
Insurance Contracts
Non-current Assets Held for Saleand Discontinued Operations
As set out below.
Accumulated amortistion as at 30 June2003 has been eliminated with acorresponding decrease in the costof goodwill.From the year ended 30 June 2003onwards, goodwill, which is includedin the carrying value of the investmentin associates, is tested annuallyfor impairment.Acquiree’s indentifiable contingentliabilities to be recognised at fair valueat acquisition date.
As set out below.
As set out below.
✗
✓
✗
✗
✓
✗
✓
✓
✗
✓
✗
✗
✗
✗
✗
✗

AN
NU
AL
FIN
AN
CIA
L ST
ATEM
ENTS
1.2 ConsolidationThe consolidated financial statements include those of Impala Platinum Holdings Limited, its subsidiaries, associates, jointventures and special purpose entities.
SubsidiariesSubsidiary undertakings, are those companies (including special purpose entities) in which the group, directly or indirectly,has an interest of more than one half of the voting rights or otherwise has power to exercise control over the operations.Subsidiaries are consolidated from the date on which effective control is transferred to the group and are no longerconsolidated from the date that control ceases.
The purchase method of accounting is used to account for the acquisition of subsidiaries by the group. The cost of anacquisition is measured as the fair value of the assets given, equity instruments issued and liabilities incurred or assumed atthe date of exchange, plus costs directly attributable to the acquisition. Identifiable assets acquired and liabilities andcontingent liabilities assumed in a business combination are measured initially at their fair values at the acquisition date,irrespective of the extent of any minority interest.
The excess of the cost of acquisition over the fair value of the group’s share of the identifiable net assets acquired is recordedas goodwill. If the cost of acquisition is less than the fair value of the net assets of the subsidiary acquired, the difference isrecognised directly in the income statement (see Note 1.5).
Inter-company transactions, balances and unrealised gains on transactions between group companies are eliminated.Unrealised losses are also eliminated unless the transaction provides evidence of an impairment of the asset transferred.Accounting policies of subsidiaries have been changed where necessary to ensure consistency with the policies adopted bythe group.
Subsidiary undertakings are accounted for at cost in the company.
AssociatesAssociates are undertakings in which the group has a long-term interest and over which it exercises significant influence butnot control, generally accompanying a shareholding of between 20% and 50% of the voting rights. Investments in associatedundertakings are accounted for by the equity method of accounting in the group. The group’s investment in associatesincludes goodwill (net of any accumulated impairment loss) identified on acquisition (see Note 1.5).
The purchase method of accounting is used to account for the acquisition of associates by the group.The cost of an acquisitionis measured as the fair value of the assets given, equity instruments issued and liabilities incurred or assumed at the date ofexchange, plus costs directly attributable to the acquisition.
Equity accounting involves recognising in the income statement the group's share of the associate's post-acquisition profitor loss for the year, and its share of post-acquisition movements in reserves is recognised in reserves.The cumulative post-acquisition movements are adjusted against the carrying amount of the investment.
The group's interest in the associate is carried in the balance sheet at an amount that reflects its share of the net assets ofthe associate and includes the excess or deficit of the purchase price over the fair value of attributable assets of the associateat date of acquisition, net of any accumulated impairment loss. In addition, the carrying value of the investment in foreignassociates includes any exchange differences arising on translation.
When the group’s share of losses in an associate equals or exceeds its interest in the associate, including any other unsecuredreceivables, the group does not recognise further losses, unless it has incurred obligations or made payments on behalf ofthe associate.
Unrealised gains on transactions between the group and its associates are eliminated to the extent of the group’s interestin the associates. Unrealised losses are also eliminated unless the transaction provides evidence of an impairment of theasset transferred.
Associated undertakings are accounted for at cost in the company.
98
IMPLATS ANNUAL REPORT 2004
NOTES TO THE CONSOLIDATED FINANCIAL STATEMENTS Implats group – Year ended 30 June 2004(All amounts in Rand millions unless otherwise stated)

99
IMPLATS ANNUAL REPORT 2004 AN
NU
AL
FIN
AN
CIA
L ST
ATEM
ENTS
Joint venturesThe group’s interest in jointly controlled entities are accounted for by proportionate consolidation.The group combines itsshare of the joint ventures’ individual income and expenses, assets and liabilities and cash flows on a line-by-line basis withsimilar items in the group’s financial statements.The group recognises the portion of gains or losses on the sale of assets bythe group to the joint venture that is attributable to the other venturers.The group does not recognise its share of profits orlosses from the joint venture that result from the purchase of assets by the group from the joint venture until it resells theassets to an independent party. However, if a loss on the transaction provides evidence of a reduction in the net realisablevalue of current assets or an impairment loss, the loss is recognised immediately.
Joint ventures are accounted for at cost in the company.
Special purpose entitiesSpecial purpose entities (SPEs) are those undertakings that are created to satisfy specific business needs of the group, whichhas the right to obtain the majority of the benefits of the SPE and is exposed to risk incident to the activities thereof.
SPEs are consolidated in the same manner as subsidiaries when the substance of the relationship indicates that the SPE iscontrolled by the group.
In order to comply with the directive issued by the JSE Securities Exchange South Africa on 16 February 2004, the groupresults include the consolidation of the Implats Share Incentive Trust.
1.3 Foreign currency translationFunctional and presentation currencyItems included in the financial statements of each entity in the group are measured using the currency that best reflects theeconomic substance of the underlying events and circumstances relevant to that entity. The consolidated financialstatements are presented in South African Rand, which is the functional and presentation currency of Impala PlatinumHoldings Limited.
Group companiesIncome statements of foreign subsidiaries, associates and joint ventures are translated into South African Rand at averageexchange rates for the year and the assets and liabilities are translated at rates ruling at the balance sheet date.The exchangedifferences arising on translation of assets and liabilities of foreign subsidiaries and associates are transferred directly to otherreserves. On disposal of the foreign entity such translation differences are recognised in the income statement as part of thegain or loss on sale.
Goodwill and fair value adjustments arising on the acquisition of a foreign entity are treated as assets and liabilities of theforeign entity and translated at the closing rate.
Transactions and balancesForeign currency transactions are accounted for at the rates of exchange ruling at the date of the transaction. Monetaryassets and liabilities are translated at year-end exchange rates. Gains and losses arising on settlement of such transactionsand from the translation of foreign currency monetary assets and liabilities are recognised in the income statement, exceptwhen deferred in equity as qualifying cash flow hedges and qualifying net investment hedges.
Translation differences on non-monetary items, such as equities held at fair value through profit or loss, are reported as partof the fair value gain or loss.Translation differences on non-monetary items, such as equities classified as available-for-salefinancial assets, are included in the fair value reserve in equity.
1.4 Property, plant and equipmentMining assetsMining assets are recorded at cost less accumulated amortisation and less any accumulated impairment losses.Expenditure, including evaluation costs, incurred to establish or expand productive capacity, to support and maintain thatproductive capacity and working costs incurred on mines prior to the commencement of production, are capitalised tomining assets. Interest on borrowings, specifically to finance establishment of mining assets, is capitalised until productionis achieved.

AN
NU
AL
FIN
AN
CIA
L ST
ATEM
ENTS
Mining assets are amortised using the units-of-production method based on estimated economically recoverable provedand probable Mineral Reserves, limited to a maximum period of 25 years.
Mining explorationExpenditure on mining exploration in new areas of interest is charged against income as incurred. Costs related to propertyacquisitions, surface and mineral rights are capitalised to mining assets and are recorded at cost less accumulatedamortisation and less any accumulated impairment losses.
Other fixed assetsOther fixed assets are recorded at cost less accumulated depreciation and less any accumulated impairment losses. Land isnot depreciated. Other assets are depreciated on the straight line basis over their useful lives as follows:
Rolling stock, heavy vehicles and earthmoving equipment 10 yearsMotor vehicles 5 yearsInformation technology assets 3 yearsBuildings 30 years
Buildings are not depreciated when the residual value equals or exceeds the carrying value.
An asset's carrying amount is written down immediately to its recoverable amount if the asset’s carrying amount is greaterthan its estimated recoverable amount (Note1.6).
Subsequent costs are included in the asset's carrying amount only when it is probable that future economic benefitsassociated with the item will flow to the group and the cost of the item can be reliably measured. All other repairs andmaintenance are charged to the income statement during the financial period in which they are incurred.
1.5 GoodwillGoodwill represents the excess of the cost of an acquisition over the fair value of the group’s share of the net identifiableassets of the acquired subsidiary/associate at the date of acquisition. Goodwill on acquisitions of subsidiaries is included inintangible assets. Goodwill on acquisitions of associates is included in investments in associates. Goodwill is tested annuallyfor impairment and carried at cost less accumulated impairment loss. Gains and losses on the disposal of an entity includethe carrying amount of goodwill relating to the entity sold. Goodwill is allocated to cash-generating units for the purposeof impairment testing (Note 1.6).
1.6 Impairment of assetsAssets that have an indefinite useful life are not subject to amortisation and are tested annually for impairment.Assets thatare subject to amortisation are reviewed for impairment whenever events or changes in circumstances indicate that thecarrying amount may not be recoverable.Assets are considered to be impaired when the higher of the asset’s fair value, lesscost to sell, and its value in use is less than the carrying amount.
The recoverability of the long-lived assets is reviewed by management on a regular basis, based on estimates of futurediscounted cash flows. These estimates are subject to risks and uncertainties including future metal prices and exchangerates. It is therefore possible that changes could occur which may affect the recoverability of the mining assets.The recoverableamounts of non-mining assets are determined by reference to market values.Where the recoverable amount is less than thecarrying value, the impairment is charged against income to reduce the carrying value to the recoverable amount of theasset. The revised carrying amounts are amortised over the remaining lives of such affected assets. For the purposes ofassessing impairment, assets are grouped at the lowest levels for which there are separately identifiable cash flows (cash-generating units).
1.7 InvestmentsThe group classifies its investments in the following categories: financial assets held for trading at fair value through profitand loss, loans and receivables, held-to-maturity investments and available-for-sale financial assets. The classification isdependent on the purpose for which the investments were acquired. Management determines the classification of itsinvestments at the time of the purchase and re-evaluates such designation on a regular basis. Purchases and sales ofinvestments are recognised on the trade date – the date on which the group commits to purchase or sell the asset. Investmentsare initially recognised at fair value plus transaction costs. Investments are derecognised when the rights to receive cashflows from the investments have expired or have been transferred and the group has transferred substantially all risks andrewards of ownership.
100
IMPLATS ANNUAL REPORT 2004
NOTES TO THE CONSOLIDATED FINANCIAL STATEMENTS Implats group – Year ended 30 June 2004(All amounts in Rand millions unless otherwise stated)
101
IMPLATS ANNUAL REPORT 2004 AN
NU
AL
FIN
AN
CIA
L ST
ATEM
ENTS
Financial assets held for trading at fair value through profit and lossInvestments that are acquired principally for the purpose of generating a profit from short-term fluctuations in price areclassified as financial assets held for trading at fair value through profit and loss and included in current assets.
Loans and receivablesLoans and receivables are non-derivative financial assets with fixed or determinable payments that are not quoted in anactive market.They arise when the group provides money, goods or services directly to a debtor with no intention of tradingthe receivable.They are included in current assets, except for maturities greater than 12 months after the balance sheet date.These are classified as non-current assets. Loans and receivables are included in trade and other receivables in the balancesheet (Note 1.13). Loans and receivables are subsequently carried at amortised cost using the effective interest method lessany accumulated impairment loss.
Held-to-maturity investmentsHeld-to-maturity investments are non-derivative financial assets with fixed or determinable payments and fixed maturitiesthat the group’s management has the positive intention and ability to hold to maturity, and are included in non-currentassets, except for maturities within 12 months from the balance sheet date which are classified as current assets. Held tomaturity investments are subsequently carried at amortised cost using the effective interest method less any accumulatedimpairment loss.
Available-for-sale financial assetsAvailable-for-sale financial assets are non-derivatives that are either designated in this category or not classified in anyof the other categories.They are included in non-current assets unless management intends to dispose of the investmentwithin 12 months of the balance sheet date. Available-for-sale financial assets are subsequently carried at fair value.Unrealised gains and losses arising from changes in the fair value of non-monetary securities classified as available-for-sale are recognised in equity. When securities classified as available-for-sale are sold or impaired, the accumulated fairvalue adjustments are included in the income statement as gains and losses from investment securities.
The fair values of listed investments are based on current closing market prices. If the market for a financial asset is not active(and for unlisted securities), the group establishes fair value by using valuation techniques. These include the use of recentarm’s length transactions, reference to other instruments that are substantially the same, discounted cash flow analysis andoption pricing models refined to reflect the issuer’s specific circumstances.
The group assesses at each balance sheet date whether there is objective evidence that a financial asset or a group offinancial assets is impaired. In the case of equity securities classified as available-for-sale, a significant or prolonged declinein the fair value of the security below its cost is considered in determining whether the securities are impaired. If any suchevidence exists for available-for-sale financial assets, the cumulative loss – measured as the difference between theacquisition cost and the current fair value, less any impairment loss on that financial asset previously recognised in profitor loss – is removed from equity and recognised in the income statement. Impairment losses recognised in the incomestatement on equity instruments are reversed through the income statement.
1.8 Cash and cash equivalentsCash and cash equivalents are carried in the balance sheet at cost. For the purposes of the cash flow statement, cash andcash equivalents comprise cash on hand, deposits held at call with banks, other short-term highly liquid investments withoriginal maturities of three months or less and bank overdrafts. Bank overdrafts are included within borrowings in currentliabilities on the balance sheet.
1.9 LeasesLeases where the group assumes substantially all of the benefits and risks of ownership are classified as finance leases.Finance leases are capitalised at the lower of the estimated present value of the underlying lease payments and thefair value of the asset. Each lease payment is allocated between the liability and finance charges so as to achieve aconstant rate on the balance outstanding. The corresponding rental obligations, net of finance charges, are included inother long-term payables. The interest element is expensed to the income statement, as a finance charge, over thelease period.
The property, plant and equipment acquired under finance leasing contracts is amortised in terms of the group accountingpolicy. (Paragraph 1.4).

AN
NU
AL
FIN
AN
CIA
L ST
ATEM
ENTS
102
IMPLATS ANNUAL REPORT 2004
NOTES TO THE CONSOLIDATED FINANCIAL STATEMENTS Implats group – Year ended 30 June 2004(All amounts in Rand millions unless otherwise stated)
Leases of assets under which substantially all the benefits and risks of ownership are effectively retained by the lessor areclassified as operating leases. Payments made under operating leases are charged to the income statement in the period inwhich they occur.When an operating lease is terminated before the lease period has expired, any payment required to bemade to the lessor by way of penalty is recognised as an expense in the period in which termination takes place.
1.10 InventoriesMetal inventoriesPlatinum, palladium and rhodium are treated as main products and other platinum group and base metals produced as by-products. Metals mined by the group, including in-process metal contained in matte produced by the smelter and preciousmetal concentrate in the base and precious metal refineries, are valued at the lower of average cost of production and fairvalue less cost to complete and sell. Quantities of in-process metals are based on latest available assays.The average cost ofproduction is taken as total costs incurred on mining and refining, including amortisation, less net revenue from the sale ofby-products, allocated to main products on a units produced basis. Refined by-products are valued at their fair value less costto sell. Stocks of metals purchased or recycled by the group are valued at the lower of cost or fair value less cost to sell.
Stores and materialsStores and materials are valued at the lower of cost or net realisable value, on a first-in-first-out basis. Obsolete, redundantand slow moving stores are identified and written down to net realisable values. Net realisable value is the estimated sellingprice in the ordinary course of business, less selling expenses.
1.11 Financial instrumentsFinancial instruments carried on the balance sheet include cash and bank balances, money market instruments, investments,receivables, trade creditors, metal leases, borrowings and forward commitments.
The group participates in financial instruments that reduce risk exposure to foreign currency and future metal pricefluctuations.The recognition methods adopted are disclosed in the individual policy statements associated with each item.
1.12 Derivative financial instrumentsMetal futures,options and lease contracts are entered into to preserve and enhance future revenue streams.Forward exchangecontracts are entered into to hedge anticipated future transactions.
Derivative financial instruments are initially recognised in the balance sheet at cost and subsequently remeasured at fairvalue.The method of recognising the resulting gain or loss is dependant on the nature of the item being hedged. On the datethat the derivative contract is entered into, the group designates derivatives as either a hedge of the fair value of a recognisedasset or liability (fair value hedge) or a hedge of a forecasted transaction or a firm commitment (cash flow hedge).
Changes in the fair value of derivatives that are designated and qualify as cash flow hedges and that are highly effective arerecognised in equity. Changes in the fair value of derivatives that are designated as fair value hedges are recognised in theincome statement.
Certain derivative transactions, while providing effective economic hedges under group's risk management policies, do notqualify for hedge accounting. Changes in the fair value of any such derivative instruments are recognised immediately in theincome statement.
1.13 Trade receivablesTrade receivables are recognised initially at fair value and subsequently measured at amortised cost using the effective interestmethod, less provision for impairment.A provision for impairment of trade receivables is established when there is objectiveevidence that the group will not be able to collect all amounts due according to the original terms of receivables.The amountof the provision is the difference between the asset’s carrying amount and the present value of estimated future cash flows,discounted at the effective interest rate.The amount of the provision is charged to the income statement.
1.14 BorrowingsBorrowings are recognised initially at fair value, net of transaction costs incurred. Borrowings are subsequently stated atamortised cost; any difference between the proceeds (net of transaction costs) and the redemption value is recognised inthe income statement over the period of the borrowings using the effective interest method.

103
IMPLATS ANNUAL REPORT 2004 AN
NU
AL
FIN
AN
CIA
L ST
ATEM
ENTS
Borrowing costs are charged to finance costs in the income statement.When borrowings are utilised to fund qualifying capitalexpenditure, such borrowings costs that are directly attributable to the capital expenditure are capitalised from the point atwhich the capital expenditure and related borrowing cost are incurred.
1.15 ProvisionsProvisions are recognised when the group has a present legal or constructive obligation as a result of past events where it isprobable that an outflow of resources embodying economic benefits will be required to settle the obligation, and a reliableestimate of the amount of the obligation can be made. Provisions are not recognised for future operating losses.
1.16 Environmental obligationsRehabilitation costsThe net present value of future rehabilitation cost estimates of disturbances at year-end are recognised and provided for infull in the financial statements.The estimates are reviewed annually to take into account the effects of inflation and changesin the estimates. Discount rates that reflect the time value of money are utilised in calculating the net present value.
Annual increases in the provision, as a result of the change in the net present value, are charged to income and are splitbetween finance costs and inflationary adjustments.
The net present value of additional environmental disturbances and changes in the cost estimates are capitalised to miningassets along with a corresponding increase in the rehabilitation provision. The rehabilitation asset is amortised in terms ofthe group's accounting policy (Refer paragraph 1.4).
Rehabilitation projects undertaken, included in the estimates, are charged to the provision as incurred.
Ongoing rehabilitation costThe cost of the ongoing current programmes to prevent and control pollution is charged against income as incurred.
Impala Pollution, Rehabilitation and Closure Trust FundAnnual contributions are made to this trust fund, created in accordance with statutory requirements, to provide for theestimated cost of rehabilitation during and at the end of the life of Impala Platinum Limited's mines. Income earned onmonies paid to the trust is accounted for as investment income.The trust investments are included under held-to-maturityinvestments.
1.17 Employee benefitsDefined benefit and defined contribution retirement plansThe group operates or participates in a number of defined benefit and defined contribution retirement plans for its employees.The pension plans are funded by payments from the employees and by the relevant group companies and contributions tothese funds are expensed as incurred.The assets of the different plans are held by independently managed trust funds.Thesefunds are governed by either the South African Pension Fund Act of 1956 or Zimbabwean law.The defined benefit plans aremulti-employer plans, where sufficient information is not available to account for them as defined benefit plans, and theyare in substance accounted for as defined contribution plans. Defined benefit plans are subject to actuarial valuations atintervals of no more than three years.
Post-employment medical obligationsThe group provides post-retirement healthcare benefits to qualifying employees and retirees.The expected costs of thesebenefits are accrued over the period of employment. Valuations of these obligations are carried out annually byindependent qualified actuaries. Actuarial gains or losses as a result of these valuations, are recognised in the incomestatement as incurred.
Termination benefitsTermination benefits are payable when employment is terminated before the normal retirement date, or whenever anemployee accepts voluntary redundancy in exchange for these benefits.The group recognises termination benefits when itis demonstrably committed to either: terminating the employment of current employees according to a detailedformal plan without possibility of withdrawal; or providing termination benefits as a result of an offer made toencourage voluntary redundancy. Benefits falling due more than 12 months after balance sheet date are discounted topresent value.

AN
NU
AL
FIN
AN
CIA
L ST
ATEM
ENTS
104
IMPLATS ANNUAL REPORT 2004
NOTES TO THE CONSOLIDATED FINANCIAL STATEMENTS Implats group – Year ended 30 June 2004(All amounts in Rand millions unless otherwise stated)
Bonus plansThe group recognises a liability and an expense for bonuses based on a formula that takes into consideration production andsafety performance.The group recognises a provision where contractually obliged or where there is a past practice that hascreated a constructive obligation.
Equity compensation plansThe group's share option plan provides for the granting of options to key employees who are able to purchase shares at aprice equal to the middle market price on the trading day preceding the date upon which the remuneration committeeapproved the granting of the options.
The scheme is administrated through the Impala Share Incentive Trust. Shares are issued to the trust as required. Employeesare entitled to exercise their options at the option price.
The maximum number of share options outstanding in terms of the share scheme may not exceed 3.5% of the issued sharecapital of Impala Platinum Holdings Limited.
Vesting of options first occurs two years after the granting of the options, limited to a maximum of 25% of the total optionsgranted. In subsequent years an additional 25% per year vests.All outstanding options expire within 10 years from the dateof granting the options.
1.18 Deferred income taxDeferred income tax is provided, using the liability method, on temporary differences arising between the tax bases of assetsand liabilities and their carrying amounts in the consolidated financial statements. However, if the deferred income tax arisesfrom initial recognition of an asset or liability in a transaction other than a business combination that at the time of thetransaction affects neither accounting nor taxable profit or loss, it is not accounted for. Deferred income tax is determinedusing tax rates (and laws) that have been enacted or substantially enacted by the balance sheet date and are expected to applywhen the related deferred income tax asset is realised or the deferred income tax liability is settled.
Deferred income tax assets are recognised to the extent that it is probable that future taxable profit will be available againstwhich the temporary differences can be utilised.
Deferred income tax is provided on temporary differences arising on investments in subsidiaries and associates,except wherethe timing of the reversal of the temporary difference is controlled by the group and it is probable that the temporarydifference will not reverse in the foreseeable future. Deferred income tax assets and deferred income tax liabilities of thesame taxable entity are offset when they relate to taxes levied by the same taxation authority and the entity has a legallyenforceable right to set off current tax assets against current tax liabilities.
The principal temporary differences arise from amortisation and depreciation on property, plant and equipment, provisions,post-retirement medical benefits, tax losses carried forward and fair value adjustment on assets acquired from businesscombinations.
1.19 Revenue recognitionRevenue comprises the fair value in respect of the sale of metals produced, metals purchased and toll income received bythe group. Revenue is recognised when the risks and rewards of ownership transfer, net of sales taxes and discounts.
Sales of metals mined and metals purchasedSales are recognised when a group entity has delivered products to the customer and collectibility of the related receivablesis reasonably assured.
Toll incomeToll refining income is recognised at date of declaration or dispatch of metal from the refinery in accordance with the relevantagreements with customers.
Interest incomeInterest income is recognised on a time-proportion basis using the effective interest method. When a receivable isimpaired, the group reduces the carrying amount to its recoverable amount, being the estimated future cash flow

105
IMPLATS ANNUAL REPORT 2004 AN
NU
AL
FIN
AN
CIA
L ST
ATEM
ENTS
discounted at original effective interest rate of the instrument, and continues unwinding the discount as interestincome. Interest income on impaired loans is recognised either as cash is collected or on a cost–recovery basis as conditionswarrant.
Dividend incomeDividend income is recognised when the shareholder's right to receive payment is established, at the accrual date.
1.20 Dividend distributionDividend distribution to the company’s shareholders is recognised as a liability in the group’s financial statements in theperiod in which the dividends are approved by the board of directors.
1.21 ComparativesThe group previously disclosed interest and dividend income within ‘finance costs – net’. Current inclusion in ‘other gains –net’ is in terms of the provisions of IAS 1. 'Share of profit of associates' previously excluded the income tax charge ofR98.5 million (2003: R215.7 million). Inclusion of the tax charge in 'share of profit of associates' is in terms of the provisionsof IAS 1. The group has separately disclosed the Marula business segment for segmental reporting purposes. The grouppreviously included the Marula business segment under the Impala business segment.
2 Financial risk management2.1 Financial risk factors
The group’s activities expose it to a variety of financial risks: market risk (including currency risk, fair value interest risk andprice risk), credit risk, liquidity risk and cash flow interest-rate risk.The group’s overall risk management programme focuseson the unpredictability of financial markets and seeks to minimise potential adverse effects on the group’s financialperformance.The group, from time to time, uses derivative financial instruments to hedge certain risk exposures.
Risk management is carried out by a central treasury department (Group treasury/hedging committee) under policiesapproved by the Board of Directors, which identifies, evaluates and hedges financial risks in close co-operation with thegroup’s operating units.The risk committee approves written principles for overall risk management,as well as written policiescovering specific areas, such as foreign exchange risk, interest-rate risk, credit risk, use of derivative financial instruments,non-derivative financial instruments and investing excess liquidity.
2.1.1 Market riskForeign exchange riskThe group operates internationally and is exposed to foreign exchange risk arising from various currency exposures,primarily with respect to the US dollar. Foreign exchange risk arises from future commercial transactions, recognisedassets and liabilities and net investments in foreign operations.
To manage foreign exchange risk arising from future commercial transactions, recognised assets and liabilities, thegroup, from time to time, uses forward contracts within board approval limits. Group treasury/hedging committee isresponsible for managing the net position in each foreign currency.
Securities price riskThe group is exposed to equity securities price risk because of investments held by the group and classified on theconsolidated balance sheet as available-for-sale financial assets. Group treasury continually monitors this exposure.
Commodity price risk managementThe group is exposed to fluctuations in metal prices. From time to time, the group enters into metal futures, optionsor lease contracts to manage the fluctuations in its metal prices thereby preserving and enhancing its revenue streams.At 30 June 2004, the group had no metal futures, options or lease contracts in place (2003: nil).
2.1.2 Credit risk managementThe group has no significant concentrations of credit risk. It has policies in place to ensure that sales of products aremade to customers with an appropriate credit history.The group has policies that limit the amount of credit exposureto any single financial institution.
The potential concentration of credit risk consists mainly of cash and cash equivalents,trade debtors and other receivables.
AN
NU
AL
FIN
AN
CIA
L ST
ATEM
ENTS
106
IMPLATS ANNUAL REPORT 2004
NOTES TO THE CONSOLIDATED FINANCIAL STATEMENTS Implats group – Year ended 30 June 2004(All amounts in Rand millions unless otherwise stated)
The group limits its counter party exposures from its money market investment operations by only dealing with well-established financial institutions of high quality credit standing. The credit exposure to any one counter party ismanaged by setting exposure limits which are reviewed regularly by the board of directors.
The group is exposed to credit-related losses in the event of non-performance by counter parties to derivativesinstruments.The counter parties to these contracts are major financial institutions.The group continually monitors itspositions and the credit ratings of its counter parties and limits the amount of contracts it enters into with any one party.
Trade debtors comprise a number of customers, dispersed across different geographical areas. Ongoing creditevaluations are performed on the financial condition of these and other receivables.Trade debtors are presented netof the allowance for doubtful debts.
2.1.3 Interest rate risk managementThe group monitors its exposure to fluctuating interest rates. Cash and cash equivalents are primarily invested withshort-term maturity dates.The group's primary exposures in respect of long term borrowings are detailed in note 15.At 30 June 2004, the group did not consider there to be any significant concentration of interest rate risk.
2.1.4 Liquidity riskPrudent liquidity risk management implies maintaining sufficient cash and cash equivalents, the availability of fundingthrough an adequate amount of committed credit facilities and the ability to close out market positions. Due to thedynamic nature of the underlying businesses, the group treasury/hedging committee aims to maintain flexibility infunding by keeping committed credit lines available.
2.2 Accounting for derivative financial instruments and hedging activitiesThe group's risk management policy on hedging is not prescriptive regarding the available financial instruments to be used,but financial limits and exposures are set by the Board. Due to the extent of these hedges, hedge accounting is not appliedand therefore changes in the fair value of any derivative instruments are recognised in the income statement immediately.
2.3 Fair value estimationThe fair value of financial instruments traded in active markets is based on quoted market prices at the balance sheet date.The listed market price used for financial assets held by the group is the current bid price; the appropriate quoted marketprice for financial liabilities is the current ask price.
The fair value of forward foreign exchange contracts is determined using forward exchange market rates at the balance sheetdate.
The nominal value less estimated credit adjustments of trade receivables and payables are assumed to approximate theirfair values.The fair value of financial liabilities for disclosure purposes is estimated by discounting the future contractual cashflows at the current market interest rate that is available to the group for similar financial instruments.
3 Critical accounting estimates and judgementsEstimates and judgements are continually evaluated and are based on historical experience and other factors, including expectationsof future events that are believed to be reasonable under the circumstances.
The group makes estimates and assumptions concerning the future.The estimates and assumptions that have a significant risk ofcausing a material adjustment to the carrying amounts of assets and liabilities within the next financial year are discussed below.
Estimated impairment of assetsThe group tests whether assets have suffered any impairment, in accordance with the accounting policy stated in Note 1.6. Therecoverable amounts of cash-generating units have been determined based on value-in-use calculations.These calculations requirethe use of estimates of future commodity prices and exchange rates. Estimates are based on management's interpretation ofmarket forecasts.
The main assumptions include:– long-term real platinum index price of R6 100.00 (2003: R6 100.00) per ounce and– long-term real discount rate, a range of 10% to 12% (2003: 10% to 12%) for South African and 15% to 17% (2003: 15% to
17%) for Zimbabwean assets.

107
IMPLATS ANNUAL REPORT 2004 AN
NU
AL
FIN
AN
CIA
L ST
ATEM
ENTS
ProvisionsProvisions for post-retirement medical liability and future rehabilitation cost have been determined, based on calculations whichrequire the use of estimates. (Note 17, 18)
Post-employment medical benefitsActuarial parameters used by independent valuators assume 7.35% (2003: 8.00%) as the long-term medical inflation rate and a9.5% (2003: 10.0%) risk free interest rate corresponding to the yields on long-dated high-quality bonds.
Future rehabilitation obligationThe net present value of current rehabilitation estimates is based on the assumption of a long-term net real interest rate of 4%(2003: 4%).
4 Segment informationSegment reportingThe group is an integrated PGM and associated base metal producer. On a primary basis, the business segments are:– mine-to-market primary PGM producer, including marketing of metals produced by the group (Impala);– mine-to-concentrate local and foreign primary PGM producers (Marula, Barplats, Zimbabwe) and– toll-refiner for third party material (Impala Refining Services– IRS).
The comparative for 2003 has been restated to separately disclose the Marula segment.
Primary reporting format – business segments Year ended 30 June 2004
Impala Barplats Inter-(All amounts in Rand millions lease area Marula disposed Zimbabwe IRS segmentunless otherwise stated) segment segment segment segment segment adjustment Total
Sales from:Metals mined 7 679.2 71.5 7 750.7Metals purchased 3 419.5 3 480.0 (3 176.8) 3 722.7Toll income 371.5 (35.8) 335.7Inter-company concentrate sales 94.4 112.9 864.4 (1 071.7) –Total sales 11 098.7 94.4 112.9 935.9 3 851.5 (4 284.3) 11 809.1
Segment operating expenses for:Metals mined 4 656.8 111.3 117.8 597.0 5 482.9Metals purchased 3 421.2 3 122.4 (4 284.4) 2 259.2Other cost 201.7 201.7Gross cost 8 078.0 111.3 117.8 597.0 3 324.1 (4 284.4) 7 943.8Adjusted for increase in metal inventories (160.9) (33.3) (188.6) (11.6) (394.4)Cost of sales 7 917.1 111.3 117.8 563.7 3 135.5 (4 296.0) 7 549.4Gross profit 3 181.6 (16.9) (4.9) 372.2 716.0 11.7 4 259.7
Segment assets 8 580.5 2 203.2 1 724.7 1 654.3 14 162.7Unallocated assets 570.6 570.6Associates 2 304.6Total assets 17 037.9
Segment liabilities 1 709.3 97.4 163.3 1 024.9 2 994.9Unallocated liabilities 3 230.1 3 230.1Total liabilities 6 225.0

AN
NU
AL
FIN
AN
CIA
L ST
ATEM
ENTS
Impala Barplats Inter-(All amounts in Rand million lease area Marula disposed Zimbabwe IRS segmentunless otherwise stated) segment segment segment segment segment adjustment Total
Other segment items:Capital expenditure (mining and other) 1 200.8 504.7 3.8 142.9 1 852.2Depreciation 3.6 4.1 7.7Amortisation 481.5 16.6 14.7 59.5 572.3
Statistical information:Total metals producedPlatinum (000 oz) 1 090 871 1 961Palladium (000 oz) 501 545 1 046Rhodium (000 oz) 116 135 251Nickel (000 t) 6.9 9.5 16.4PGM in concentrate produced included in IRS refined metal (000 oz) 36.6 37.3 249.8 323.7
Gross margin analysis:Metals mined (%) 41.5 41.5Metals purchased – Impala (%) 0.0 0.0Metals purchased – IRS (%) 18.6 18.6Inter-company concentrate sales (%) (17.9) (4.3) 39.8 30.7
Year ended 30 June 2003
Sales from:Metals mined 8 877.5 38.0 8 915.5Metals purchased 2 463.2 2 695.6 (2 445.5) 2 713.3Toll income 218.2 (40.0) 178.2Inter-company concentrate sales 154.6 658.1 (812.7) –Total sales 11 340.7 154.6 696.1 2 913.8 (3 298.2) 11 807.0
Segment operating expenses for:Metals mined 4 105.5 189.8 518.8 (40.0) 4 774.1Metals purchased 2 448.9 2 283.4 (3 258.2) 1 474.1Other cost 142.0 142.0Gross cost 6 554.4 189.8 518.8 2 425.4 (3 298.2) 6 390.2Adjusted for decrease/(increase) in metal inventories 124.9 (17.5) (12.1) 37.8 133.1Cost of sales 6 679.3 189.8 501.3 2 413.3 (3 260.4) 6 523.3Gross profit 4 661.4 (35.2) 194.8 500.5 (37.8) 5 283.7
Segment assets 8 618.0 1 661.0 248.7 1 276.3 1 502.2 13 306.2Unallocated assets 754.2 754.2Associates 2 208.9Total assets 16 269.3
Segment liabilities 2 381.3 4.5 79.9 376.3 829.2 3 671.2Unallocated liabilities 2 301.8 2 301.8Total liabilities 5 973.0
108
IMPLATS ANNUAL REPORT 2004
NOTES TO THE CONSOLIDATED FINANCIAL STATEMENTS Implats group – Year ended 30 June 2004
4 Segment information (continued)

109
IMPLATS ANNUAL REPORT 2004 AN
NU
AL
FIN
AN
CIA
L ST
ATEM
ENTS
Impala Barplats Inter- (All amounts in Rand million lease area Marula disposed Zimbabwe IRS segmentunless otherwise stated) segment segment segment segment segment adjustment Total
Other segment items:Capital expenditure (mining and other) 1 135.5 544.4 112.2 1 792.1Depreciation 2.3 1.2 3.5Amortisation 344.0 45.3 63.1 452.4
Statistical information:Total metals producedPlatinum (000 oz) 1 040 633 1 673Palladium (000 oz) 478 415 893Rhodium (000 oz) 134 81 215Nickel (000 t) 8.0 6.7 14.7PGM in concentrate produced included in IRS refined metal (000 oz) 48.8 180.6 229.4
Gross margin analysis:Metals mined (%) 52.3 52.3Metals purchased – Impala (%) 0.6 0.6Metals purchased – IRS (%) 17.2 17.2Inter-company concentrate sales (%) (22.8) 28.0 18.8
Notes to business segment analysis:
Assets, liabilities and capital expenditure.Segment assets consist primarily of property, plant and equipment, intangible assets, inventories, receivables and operatingcash.They exclude deferred taxation, investments and derivatives held for trading or designated as hedges of borrowings.
Segment liabilities comprise operating liabilities.They exclude items such as taxation and corporate borrowings.
Capital expenditure comprises additions to property, plant and equipment (Note 5), including additions resulting fromacquisitions through business combinations (Notes 5, 38).
SalesMetals minedReflect the mine-to-market sales primarily from the Impala lease area.
Metals purchasedRevenue from metals purchased is recognised within two separate legal entities:– for Impala Platinum this incorporates sales of metals purchased principally from IRS of R3 176.8 million (2003: R2 445.5
million).– for IRS this includes sales from purchases of metals from refining customers.The majority of sales are to Impala Platinum, and
a portion directly to the market.
Toll incomeFees earned by IRS for treatment of metals from third party refining customers.
4 Segment information (continued)

AN
NU
AL
FIN
AN
CIA
L ST
ATEM
ENTS
4 Segment information (continued)
Inter-company concentrate salesSales of concentrate from Barplats (discontinued operation), Marula and Zimbabwe mining activities to IRS.
Segment operating expenses for:Gross costComprises total costs associated with the mining, refining and purchase of metals.Inter-segment adjustmentsElimination of inter-segment sales, purchases and unrealised profit in the group.Inter-segment transfersInter-segment transfers are based on market related prices.
Secondary reporting format – geographical segmentsAlthough the group’s business segments are managed on a world-wide basis, they operate in two geographical areas. South Africa is the home country of the parent company and the main operating company.The areas of operation are principally mining and toll-refining activities in South Africa and Zimbabwe.
Analysis of sales by destinationMain productsAsia 3 400.5 3 467.0North America 3 044.0 2 987.9Europe 1 641.9 1 489.6South Africa 820.6 1 629.3
8 907.0 9 573.8By-productsSouth Africa 1 873.4 1 452.1North America 238.8 232.5Asia 331.6 235.7Europe 122.6 134.7
2 566.4 2 055.0Toll incomeSouth Africa 324.5 148.5North America 9.9 8.1Asia 1.1 1.5Europe 0.2 20.1
335.7 178.211 809.1 11 807.0
Sales and toll income are allocated based on the country in which the customer is located.Zimbabwe operations did not contribute more than 10% of consolidated sales.
Analysis of sales by categorySales of goods
Precious metals 10 051.3 10 569.8 Base metals 1 422.1 1 059.0
Revenue from servicesToll-refining 335.7 178.2
11 809.1 11 807.0
110
IMPLATS ANNUAL REPORT 2004
NOTES TO THE CONSOLIDATED FINANCIAL STATEMENTS Implats group – Year ended 30 June 2004
(All amounts in Rand millions unless otherwise stated) 2004 2003

111
IMPLATS ANNUAL REPORT 2004 AN
NU
AL
FIN
AN
CIA
L ST
ATEM
ENTS
(All amounts in Rand millions unless otherwise stated) 2004 2003
4 Segment information (continued)
Other segment informationSales Total assets Capital expenditure
2004 2003 2004 2003 2004 2003 South Africa 11 737.6 11 769.0 13 000.4 12 776.4 1 709.3 1 679.9Zimbabwe 71.5 38.0 1 724.7 1 276.3 142.9 112.2Other 8.2 7.7 Investment in associates 2 304.6 2 208.9
11 809.1 11 807.0 17 037.9 16 269.3 1 852.2 1 792.1
Total assets and capital expenditure are allocated based on where the assets are located. Sales are allocated based on thecountry in which the sale orginated.
5 Property, plant and equipment
Mining assetsThese comprise expenditure on shafts, plant and equipment, mining development and general capital expenditure.Cost
Opening book amount 11 086.6 7 996.3 Acquisition of subsidiaries and joint venture (Note 38) – 1 822.6 Disposal of subsidiary (215.7) – Exchange adjustment on translation of foreign subsidiaries and joint venture (236.0) (469.5)Additions 1 794.7 1 749.7 Addition of rehabilitation asset (Note 18) 27.5 37.2 Disposals (15.5) (49.7)
12 441.6 11 086.6Accumulated amortisation
Opening book amount 2 308.0 1 811.5 Acquisition of subsidiaries and joint venture (Note 38) – 44.1 Exchange adjustment on translation of foreign subsidiaries and joint venture (18.5) – Charge for the year 572.3 452.4 Disposals (13.0) –
2 848.8 2 308.0 Net book amount 9 592.8 8 778.6
Other assetsThese comprise expenditure on freehold land and buildings, plant and equipment, motor vehicles,furniture and leased equipment.Cost
Opening book amount 42.1 46.9 Acquisition of subsidiaries and joint venture (Note 38) – 6.4 Exchange adjustment on translation of foreign subsidiaries and joint venture (6.6) –Additions 30.0 5.2Disposals (2.5) (16.4)
63.0 42.1
AN
NU
AL
FIN
AN
CIA
L ST
ATEM
ENTS
5 Property, plant and equipment (continued)
Accumulated depreciationOpening book amount 11.8 13.3Acquisition of subsidiaries and joint venture (Note 38) – 3.0Exchange adjustment on translation of foreign subsidiaries and joint venture (2.1) – Charge for the year 7.7 3.5 Adjustment/(disposals) 2.8 (8.0)
20.2 11.8 Net book amount 42.8 30.3Closing net book amount 9 635.6 8 808.9
6 Investments in associates
i) Lonplats (comprising Western Platinum Limited and Eastern Platinum Limited)Share of post acquisition retained income 2 874.9 2 585.4 Shares at cost 430.8 430.8Amortisation of goodwill arising on acquisition (102.9) (102.9)Dividends received (1 741.4) (1 456.8)Net book amount 1 461.4 1 456.5
A loan facility of nil (2003: R81.5 million) has been guaranteed in favour of banking institutions, available for utilisation by the associates, of which nil was utilised at year-end (2003: R81.5 million).The guarantee was no longer required and withdrawn during April 2004.
Goodwill included in carrying value:At cost 185.0 185.0 Accumulated amortisation (102.9) (102.9)Net book amount 82.1 82.1
Shares beneficially owned in the undermentioned companies involved in the business of mining, refining and marketing of PGMs:Number of sharesWestern Platinum Limited
Ordinary shares 7 319 924 6 779 924 Participating preference shares – 540 000 Effective holding: 27.1%
Eastern Platinum LimitedOrdinary shares 149 110 134 444 Participating preference shares – 14 666 Effective holding: 27.1%
Summarised balance sheet as at 31 March
Capital and reserves 5 071.8 5 065.9 Non-current liabilities 2 059.8 1 785.5 Current liabilities 605.9 524.3
7 737.5 7 375.7
112
IMPLATS ANNUAL REPORT 2004
NOTES TO THE CONSOLIDATED FINANCIAL STATEMENTS Implats group – Year ended 30 June 2004
(All amounts in Rand millions unless otherwise stated) 2004 2003

113
IMPLATS ANNUAL REPORT 2004 AN
NU
AL
FIN
AN
CIA
L ST
ATEM
ENTS
6 Investments in associates (continued)
Non-current assets 7 036.3 6 139.9Current assets 701.2 1 235.8
7 737.5 7 375.7
The associate companies prepare their financial statements to 30 September to conform to the financial year of their holding company. Only publicly available information for these associate companies has been used for equity accounting purposes. Consequently, results for the twelve months to 31 March have been included in the equity accounted earnings for the year, of which the results for the last six months are reviewed by the company’s auditors.There were no changes in the percentage ownership interests in the associates during the year ended 30 June 2004.
The group is currently in the process of negotiating a deal in terms of the requirements of the mining charter (refer directors’ report).
ii) Two Rivers Platinum (Proprietary) LimitedShares at cost 45.0 45.0Shareholder's loan 271.8 229.8 Net book amount 316.8 274.8
The company holds various PGM mineral rights.Trial mining is presently being conducted and the result will be evaluated towards the end of calendar year 2004.
ShareholdingNumber of shares
Ordinary shares 270 270Effective holding: 45.0%
There was no change in the percentage ownership interest in the associate during the year ended 30 June 2004.
Summarised balance sheet as at 30 JuneCapital and reserves 101.6 101.0Non-current liabilities 604.3 510.8Current liabilities 5.6 1.6
711.5 613.4
Non-current assets 690.0 604.8 Current assets 21.5 8.6
711.5 613.4The results of the associate are based on audited financial statements.
(All amounts in Rand millions unless otherwise stated) 2004 2003

AN
NU
AL
FIN
AN
CIA
L ST
ATEM
ENTS
114
IMPLATS ANNUAL REPORT 2004
NOTES TO THE CONSOLIDATED FINANCIAL STATEMENTS Implats group – Year ended 30 June 2004
6 Investments in associates (continued)
iii) Aquarius Platinum (South Africa) (Proprietary) LimitedShare of results 53.6 22.6Unearned profit in the group (10.1) (18.0)
43.5 4.6Shares at cost 16.9 16.9Shareholder's loan 466.0 456.1Net book amount 526.4 477.6
Impala Platinum Holdings Limited has provided a guarantee to Investec Bank Limited on behalf of Aquarius Platinum (South Africa) (Proprietary) Limited for a loan facility granted of R175.0 million (2003: R175.0 million), of which R175.0 million (2003: R175.0 million) has been utilised at year-end.
This guarantee is set to expire upon completion of certain project completion tests, relating to the Marikana project. If the project completion tests are not met, then the guarantee will reduce proportionally in line with the loan repayments to Investec Bank Limited, which are expected to start by no later than the end of calendar year 2004.
Shares beneficially owned in the undermentioned company involved in the business of mining,refining and marketing of PGMs:
ShareholdingNumber of sharesOrdinary shares 250 250Effective holding: 25.0%
There was no change in the percentage ownership interest in the associate during the year ended 30 June 2004.
Summarised balance sheet as at 30 JuneCapital and reserves 231.5 107.4 Non-current liabilities 2 171.4 2 110.0Current liabilities 388.0 495.7
2 790.9 2 713.1
Non-current assets 2 191.4 2 116.3Current assets 599.5 596.8
2 790.9 2 713.1The equity accounted results of the associate for the year are based on audited financial statements.
Summary of investments in associates
Lonplats (comprising Western Platinum Limited and Eastern Platinum Limited) 1 461.4 1 456.5Two Rivers Platinum (Proprietary) Limited 316.8 274.8Aquarius Platinum (South Africa) (Proprietary) Limited 526.4 477.6Total investments in associates 2 304.6 2 208.9
(All amounts in Rand millions unless otherwise stated) 2004 2003

115
IMPLATS ANNUAL REPORT 2004 AN
NU
AL
FIN
AN
CIA
L ST
ATEM
ENTS
7 Available-for-sale financial investments
Investments in listed sharesComprise shares in the following listed company:Aquarius Platinum Limited
Beginning of the year 229.7 422.5 Exchange differences (27.7) (41.6)Share price movement (30.3) (151.2)End of the year 171.7 229.7
During the year, the group maintained its strategic shareholding in Aquarius Platinum Limited, holding 7 141 966 shares (2003: 7 141 966) which amounts to approximately 8.6% (2003: 8.9%) of the issued share capital of that company.The shares are listed on the Australian Stock Exchange and the London Stock Exchange.The fair value of these shares as at the close of business on 30 June 2004 by reference to Stock Exchange quoted prices and closing exchange rates was R171.7 million (2003: R229.7 million).
Investment in unlisted sharesShares beneficially owned in the undermentioned concern at fair value:
Silplat (Proprietary) Limited 14.7 –
Total available-for-sale investments 186.4 229.7
8 Held-to-maturity investments
Investment in interest-bearing securities 89.0 74.9
The investment is held through the Impala Pollution, Rehabilitation and Closure Trust Fund (Note 18).The fund is an irrevocable trust under the group's control.The funds are invested primarily in interest-bearing securities.
9 Non-current receivables and prepayments
LoansBarplats Investments Limited 114.8 –Less: current portion of loan (Note 11) (45.9) –Messina Platinum Mines Limited – 23.5 Less: current portion of loan (Note 11) – (23.5)
68.9 –
The Barplats Investments Limited loan bears interest at the Johannesburg Interbank Acceptance Rate (JIBAR) plus 3% nominal annual compounded and capitalised monthly in arrears.The loan capital is repayable in three annual instalments: 40% on 31 May 2005 and equal payments of the balance in the second and third year respectively on the anniversary date.The loan is secured by a mortgage bond over property and mineral rights.
The Messina Platinum Mines Limited loan bore interest at JIBAR plus 6% and was repaid in 2004.
(All amounts in Rand millions unless otherwise stated) 2004 2003

AN
NU
AL
FIN
AN
CIA
L ST
ATEM
ENTS
116
IMPLATS ANNUAL REPORT 2004
NOTES TO THE CONSOLIDATED FINANCIAL STATEMENTS Implats group – Year-ended 30 June 2004
9 Non-current receivables and prepayments (continued)
The carrying amount of the loan approximates its fair value.
PrepaymentsRoyalty prepayment 73.7 78.6Charged to the income statement during the year (4.9) (4.9)
68.8 73.7Less: current portion of prepayment (Note 11) (5.0) (4.9)
63.8 68.8Royalty prepayment represents the payment of royalties settled through an issue of shares to the mineral right holders of the Impala mining lease area during 1999.
Total non-current receivables and prepayments 132.7 68.8
10 Inventories
Refined metalAt cost 290.7 172.2 At fair value less cost to sell 34.6 37.4
325.3 209.6 In-process metal 790.9 512.2 Exchange adjustment on translation of foreign subsidiaries and joint venture (15.9) – Metal inventories 1 100.3 721.8 Stores and materials inventories 129.5 125.6
1 229.8 847.4
11 Current receivables and prepaymentsTrade receivables 1 362.2 1 070.4 Receivables from related parties (Note 39) 246.3 82.0 Advances and loan facilities provided to related parties (Note 39) 245.8 70.0 Other receivables 163.8 129.4 Employee receivables 84.4 82.2 South African Revenue Services (Value Added Tax) 53.3 173.4Current portion of loans (Note 9) 45.9 23.5 Prepayments 37.6 37.6 Current portion of prepayments (Note 9) 5.0 4.9Interest receivable 1.9 13.7Implats Share Incentive Trust – 19.1
2 246.2 1 706.2
Trade and other foreign receivables include advances of R789.8 million (2003: R551.8 million) to customers which are secured by in-process metal inventories held as collateral against these advances.
The uncovered foreign currency denominated balances as at 30 June were as follows:Trade and other receivables (US$ million) 208.3 118.5
The credit exposures by country are as follows:North America 624.6 574.8 South Africa 544.0 354.1 Asia 159.9 97.6 Europe 33.7 43.9
1 362.2 1 070.4 Other receivables represent primarily a South African exposure.
(All amounts in Rand millions unless otherwise stated) 2004 2003

117
IMPLATS ANNUAL REPORT 2004 AN
NU
AL
FIN
AN
CIA
L ST
ATEM
ENTS
12 Cash and cash equivalents
Short-term bank deposits 900.4 2 014.3 Cash at bank 303.8 310.2
1 204.2 2 324.5
The weighted average effective interest rate on short-term bank deposits was 8.4% (2003: 12.1%) and these deposits have an average maturity of 30 days.
Cash and bank overdrafts include the following for the purposes of the cash flow statement:Cash and cash equivalents 1 204.2 2 324.5 Bank overdrafts (Note 15) (17.2) –
1 187.0 2 324.5
The uncovered foreign currency denominated balances as at 30 June were as follows:Bank balances (US$ million) 61.0 65.4
The credit exposures by country are as follows:South Africa 1 006.3 2 158.1 Europe 141.8 5.2 Mauritius 45.4 157.4 Zimbabwe 6.5 2.2 Asia 4.2 1.6
1 204.2 2 324.5
13 Ordinary shares, share premium and share options
Share capital and share premiumNumber of Ordinary Share
shares shares premium Total(millions) R million R million R million
At 30 June 2002 66.554 13.3 589.6 602.9Issued to the share option scheme 0.040 0.0 14.9 14.9At 30 June 2003 66.594 13.3 604.5 617.8Adjustment as a result of consolidating share trust (0.084) (0.0) (18.7) (18.7)Issued by the share option scheme 0.103 0.0 26.2 26.2At 30 June 2004 66.613 13.3 612.0 625.3
The total authorised ordinary share capital comprise 100 million (2003: 100 million) shares with a par value of 20 cents each.All issued shares are fully paid.
Authorised amount 20.0 20.0
Up to 10% of the unissued shares may be issued by the directors at their discretion until the next annual general meeting.The directors' report sets out additional details in respect of the share option scheme.
(All amounts in Rand millions unless otherwise stated) 2004 2003

AN
NU
AL
FIN
AN
CIA
L ST
ATEM
ENTS
118
IMPLATS ANNUAL REPORT 2004
NOTES TO THE CONSOLIDATED FINANCIAL STATEMENTS Implats group – Year ended 30 June 2004
13 Ordinary shares, share premium and share options (continued)
Share options
Movement in the number of share options outstanding was as follows (000):
At beginning of year 960.3 613.1Granted 335.4 511.7Exercised (102.4) (98.6)Lapsed/forfeited (98.9) (65.9)At end of year 1 094.4 960.3
Refer to the directors’ report for details on share options held by directors and key management personnel.
Share options were granted to employees during the year at an average market share price of R575.00 per share (2003: R558.76 per share) and expire during 2014 (2003: share options expire during 2013).
The number of shares held by the Trust at year end totalled 8 350 (2003: 83 584).
Share options outstanding (number in thousands) at the end of the year have the following terms:
Option price Vesting years TotalRand per share 2001 2002 2003 2004 2005 2006 2007 2008 2009 number
52.50 0.1 0.3 1.4 1.857.50 2.5 2.5
146.00 3.8 4.5 19.8 28.1200.00 0.8 4.2 17.5 21.3 43.8281.00 11.0 11.0 11.0 33.0344.00 1.5 5.6 11.7 11.7 30.5381.00 1.0 7.6 7.6 7.6 7.6 31.4401.00 4.5 4.5 4.5 4.5 18.0482.61 1.0 1.0 1.0 1.0 4.0484.10 1.0 15.1 15.1 15.1 15.1 61.4507.00 0.8 2.1 7.0 52.2 53.8 51.9 50.9 218.7507.12 33.1 33.1 33.1 33.1 132.4515.82 0.3 7.4 7.4 7.4 7.4 29.9522.00 0.5 0.5 0.5 0.5 2.0539.40 1.0 1.0 1.0 1.0 4.0556.00 5.7 5.2 5.2 5.2 21.3587.00 17.0 17.0 17.0 17.0 68.0589.99 4.6 4.6 4.6 4.6 18.4594.25 1.4 15.7 15.7 15.7 15.7 64.2600.00 1.4 67.7 67.7 67.7 67.7 272.2611.48 2.2 2.2 2.2 2.2 8.8Total 2004 0.9 7.0 21.1 117.4 218.7 257.2 233.5 176.9 61.7 1 094.4
Total 2003 1.1 9.3 73.0 138.6 229.1 202.0 188.7 118.5 – 960.3
(All amounts in Rand millions unless otherwise stated) 2004 2003

119
IMPLATS ANNUAL REPORT 2004 AN
NU
AL
FIN
AN
CIA
L ST
ATEM
ENTS
13 Ordinary shares, share premium and share options (continued)
Share options were granted to directors and employees at the market share price on the following dates:
Market Number share price Amount
During financial year 2004 Date of shares (Rand) (R million)
27 Aug 2003 31 804 515.82 16.418 Sep 2003 3 840 539.40 2.16 Nov 2003 27 232 611.48 16.716 Feb 2004 136 194 587.00 79.922 Apr 2004 132 235 507.12 67.16 May 2004 4 102 482.61 2.0
Total 335 407 184.2
Market Number share price Amount
During financial year 2003 Date of shares (Rand) (R million)
16 Aug 2002 68 232 484.10 33.08 Nov 2002 294 867 600.00 176.9
25 Nov 2002 19 545 557.35 10.921 Jan 2003 72 512 594.25 43.12 Apr 2003 17 956 401.00 7.2
5 May 2003 38 654 381.00 14.7Total 511 766 285.8
14 Other reservesSurplus of Totalcost over Available- Translation
carrying value for-sale of foreignof minorities investments subsidiaries
Balance 1 July 2002 393.4 152.3 545.7Revaluation (Note 7) (192.8) (192.8)Currency translation differences (314.1) (314.1)
Balance 30 June 2003 200.6 (161.8) 38.8Revaluation (Note 7, 16) (48.6) (48.6)Currency translation differences (265.8) (265.8)Acquisition of Zimbabwe Platinum Mines Limited minorities (350.7) (350.7)
Balance 30 June 2004 (350.7) 152.0 (427.6) (626.3)
(All amounts in Rand millions unless otherwise stated)
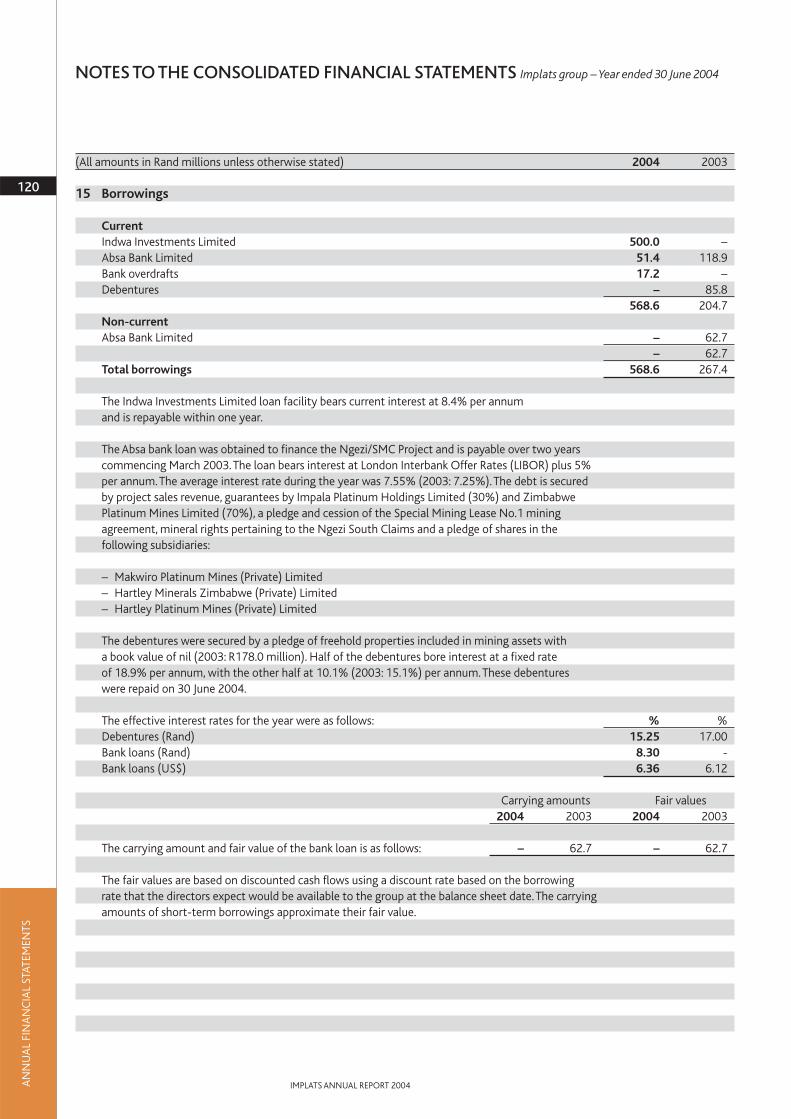
AN
NU
AL
FIN
AN
CIA
L ST
ATEM
ENTS
120
IMPLATS ANNUAL REPORT 2004
NOTES TO THE CONSOLIDATED FINANCIAL STATEMENTS Implats group – Year ended 30 June 2004
15 Borrowings
CurrentIndwa Investments Limited 500.0 – Absa Bank Limited 51.4 118.9Bank overdrafts 17.2 – Debentures – 85.8
568.6 204.7 Non-currentAbsa Bank Limited – 62.7
– 62.7Total borrowings 568.6 267.4
The Indwa Investments Limited loan facility bears current interest at 8.4% per annum and is repayable within one year.
The Absa bank loan was obtained to finance the Ngezi/SMC Project and is payable over two years commencing March 2003.The loan bears interest at London Interbank Offer Rates (LIBOR) plus 5% per annum.The average interest rate during the year was 7.55% (2003: 7.25%).The debt is secured by project sales revenue, guarantees by Impala Platinum Holdings Limited (30%) and Zimbabwe Platinum Mines Limited (70%), a pledge and cession of the Special Mining Lease No.1 mining agreement, mineral rights pertaining to the Ngezi South Claims and a pledge of shares in the following subsidiaries:
– Makwiro Platinum Mines (Private) Limited– Hartley Minerals Zimbabwe (Private) Limited– Hartley Platinum Mines (Private) Limited
The debentures were secured by a pledge of freehold properties included in mining assets with a book value of nil (2003: R178.0 million). Half of the debentures bore interest at a fixed rate of 18.9% per annum, with the other half at 10.1% (2003: 15.1%) per annum.These debentures were repaid on 30 June 2004.
The effective interest rates for the year were as follows: % %Debentures (Rand) 15.25 17.00 Bank loans (Rand) 8.30 -Bank loans (US$) 6.36 6.12
Carrying amounts Fair values2004 2003 2004 2003
The carrying amount and fair value of the bank loan is as follows: – 62.7 – 62.7
The fair values are based on discounted cash flows using a discount rate based on the borrowing rate that the directors expect would be available to the group at the balance sheet date.The carrying amounts of short-term borrowings approximate their fair value.
(All amounts in Rand millions unless otherwise stated) 2004 2003

121
IMPLATS ANNUAL REPORT 2004 AN
NU
AL
FIN
AN
CIA
L ST
ATEM
ENTS
15 Borrowings (continued)
Maturity of non-current borrowings:Between 1 and 2 years – 62.7
Borrowing powers
In terms of the articles of association of the companies in the group, the borrowing powers of the group are determined by the directors but are limited to ordinary shareholders' interest.
Ordinary shareholders' interest 10 684.8 9 877.4Currently utilised 568.6 267.4
16 Deferred income tax assets and liabilities
Deferred income tax assets and liabilities are offset when there is a legally enforceable right to offset current tax assets against current tax liabilities and when the deferred income taxes relate to the same fiscal authority.The offset amounts are as follows:
Deferred tax assets– Deferred tax asset to be recovered after more than 12 months (9.4) –
Deferred tax liabilities – netDeferred tax assets:– Deferred tax asset to be recovered after more than 12 months (131.0) (161.4)
Deferred tax liabilities:– Deferred tax liability to be recovered after more than 12 months 2 402.9 2 048.1
2 271.9 1 886.7
Deferred income taxes are calculated at the prevailing tax rates of the different fiscal authorities where the asset or liability originates.The movement on the deferred income tax account is as follows:At the beginning of the year 1 886.7 1 389.6 Acquisition of interest in subsidiaries and joint venture (Note 38) 56.7 49.9 Exchange adjustment on translation of foreign subsidiaries and joint venture (10.9) 46.4 Tax charged to equity (Note 14) (9.4) – Income statement charge (Note 32) 339.4 400.8 Net deferred tax liability at the end of the year 2 262.5 1 886.7
Deferred tax assets and liabilities are attributable to the following items:
Deferred tax liabilitiesProperty, plant and equipment 2 356.4 1 874.2 Other 46.5 173.9
2 402.9 2 048.1 Deferred tax assetsSubstantially long term provisions (123.5) (119.2)Other (16.9) (42.2)
(140.4) (161.4)Net deferred tax liability 2 262.5 1 886.7
(All amounts in Rand millions unless otherwise stated) 2004 2003

AN
NU
AL
FIN
AN
CIA
L ST
ATEM
ENTS
122
IMPLATS ANNUAL REPORT 2004
NOTES TO THE CONSOLIDATED FINANCIAL STATEMENTS Implats group – Year ended 30 June 2004
17 Pension and other post-retirement obligations
Pension and provident plansIndependent funds provide pension and other benefits to all permanent employees and their dependants.At the end of the financial year the following funds were in existence:
– Impala Provident Fund – Mine Employees Pension Fund (industry fund)– Impala Platinum Refineries – Mining Industry Pension Fund Zimbabwe (industry fund)
Provident Fund – National Social Security Scheme Zimbabwe (industry fund)– Impala Workers Provident Fund – Old Mutual – Zimasco Pension Fund– Impala Supplementary Pension Fund– Sentinel Pension Fund (industry fund)
Post-employment medical benefitsThe amounts recognised in the income statement were as follows:
Current service cost 3.0 3.3The total charge is included in operating expenses (Note 25)
Movement in the liability recognised in the balance sheet:At beginning of year 63.5 66.9Total expense – as shown above 3.0 3.3Contributions paid (4.2) (6.7)At end of year 62.3 63.5
18 Provision for future rehabilitation
Future rehabilitation obligationAt beginning of year 200.2 140.6 Acquisition of subsidiaries and joint venture net of foreign currency exchange adjustment – 6.2 Disposal of subsidiary (Note 30) (24.2) – Exchange adjustment on translation of foreign subsidiaries and joint venture (1.0) – Present value of additional rehabilitation obligations (Note 5) 27.5 37.2 Charge to the income statement 11.6 31.6
214.1 215.6 Less: utilised during year (6.8) (15.4)At end of year 207.3 200.2
Current cost rehabilitation estimate is R455.7 million (2003: R404.4 million)
The movement of the investment in the Impala Pollution, Rehabilitation and Closure Trust Fund, is as follows:At beginning of year 74.9 60.9 Interest accrued 5.8 5.1 Contributions 8.3 8.9 At end of year 89.0 74.9
(All amounts in Rand millions unless otherwise stated) 2004 2003
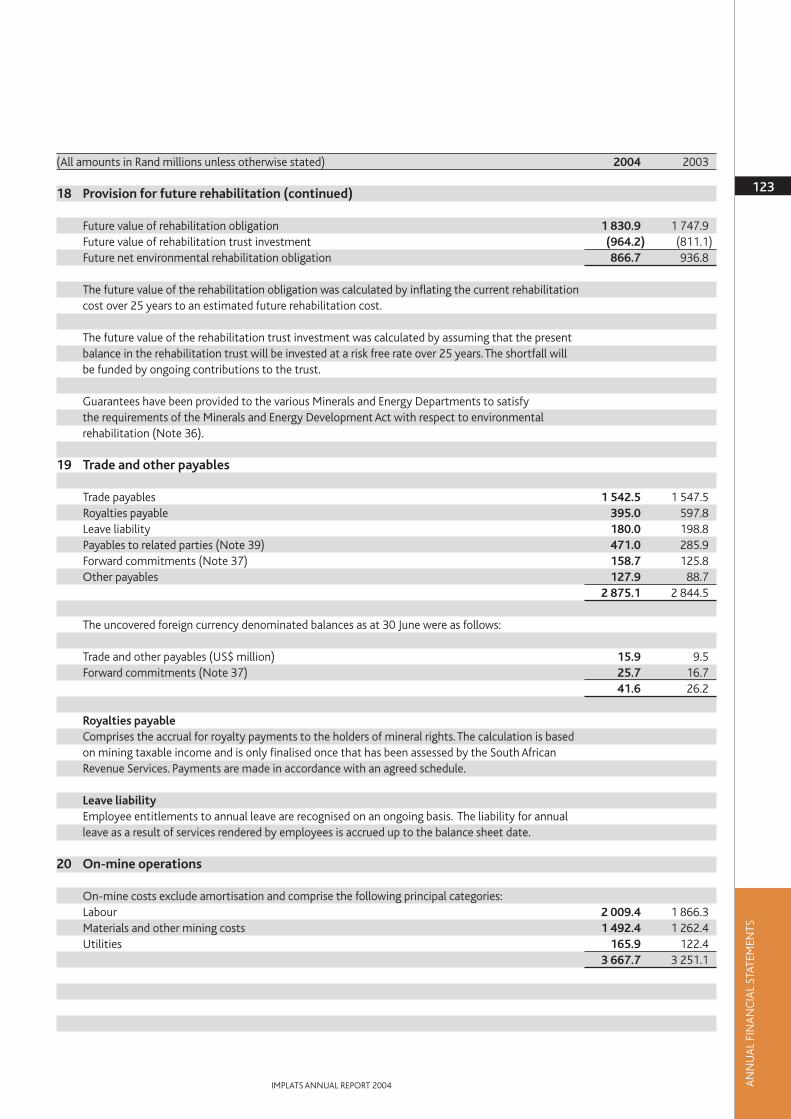
123
IMPLATS ANNUAL REPORT 2004 AN
NU
AL
FIN
AN
CIA
L ST
ATEM
ENTS
18 Provision for future rehabilitation (continued)
Future value of rehabilitation obligation 1 830.9 1 747.9 Future value of rehabilitation trust investment (964.2) (811.1)Future net environmental rehabilitation obligation 866.7 936.8
The future value of the rehabilitation obligation was calculated by inflating the current rehabilitation cost over 25 years to an estimated future rehabilitation cost.
The future value of the rehabilitation trust investment was calculated by assuming that the present balance in the rehabilitation trust will be invested at a risk free rate over 25 years.The shortfall will be funded by ongoing contributions to the trust.
Guarantees have been provided to the various Minerals and Energy Departments to satisfy the requirements of the Minerals and Energy Development Act with respect to environmental rehabilitation (Note 36).
19 Trade and other payables
Trade payables 1 542.5 1 547.5 Royalties payable 395.0 597.8 Leave liability 180.0 198.8 Payables to related parties (Note 39) 471.0 285.9 Forward commitments (Note 37) 158.7 125.8 Other payables 127.9 88.7
2 875.1 2 844.5
The uncovered foreign currency denominated balances as at 30 June were as follows:
Trade and other payables (US$ million) 15.9 9.5 Forward commitments (Note 37) 25.7 16.7
41.6 26.2
Royalties payableComprises the accrual for royalty payments to the holders of mineral rights.The calculation is based on mining taxable income and is only finalised once that has been assessed by the South African Revenue Services. Payments are made in accordance with an agreed schedule.
Leave liabilityEmployee entitlements to annual leave are recognised on an ongoing basis. The liability for annual leave as a result of services rendered by employees is accrued up to the balance sheet date.
20 On-mine operations
On-mine costs exclude amortisation and comprise the following principal categories:Labour 2 009.4 1 866.3 Materials and other mining costs 1 492.4 1 262.4 Utilities 165.9 122.4
3 667.7 3 251.1
(All amounts in Rand millions unless otherwise stated) 2004 2003
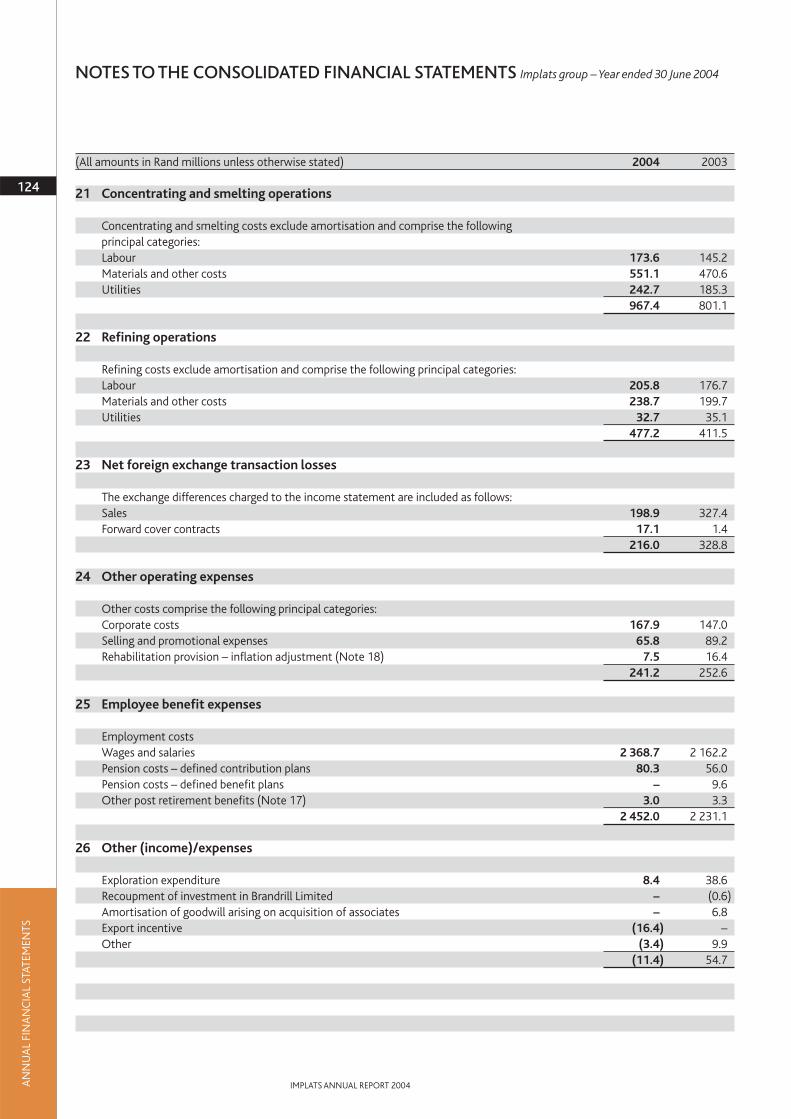
AN
NU
AL
FIN
AN
CIA
L ST
ATEM
ENTS
124
IMPLATS ANNUAL REPORT 2004
NOTES TO THE CONSOLIDATED FINANCIAL STATEMENTS Implats group – Year ended 30 June 2004
21 Concentrating and smelting operations
Concentrating and smelting costs exclude amortisation and comprise the following principal categories:Labour 173.6 145.2 Materials and other costs 551.1 470.6 Utilities 242.7 185.3
967.4 801.1
22 Refining operations
Refining costs exclude amortisation and comprise the following principal categories:Labour 205.8 176.7 Materials and other costs 238.7 199.7 Utilities 32.7 35.1
477.2 411.5
23 Net foreign exchange transaction losses
The exchange differences charged to the income statement are included as follows:Sales 198.9 327.4 Forward cover contracts 17.1 1.4
216.0 328.8
24 Other operating expenses
Other costs comprise the following principal categories:Corporate costs 167.9 147.0 Selling and promotional expenses 65.8 89.2 Rehabilitation provision – inflation adjustment (Note 18) 7.5 16.4
241.2 252.6
25 Employee benefit expenses
Employment costs Wages and salaries 2 368.7 2 162.2 Pension costs – defined contribution plans 80.3 56.0 Pension costs – defined benefit plans – 9.6 Other post retirement benefits (Note 17) 3.0 3.3
2 452.0 2 231.1
26 Other (income)/expenses
Exploration expenditure 8.4 38.6 Recoupment of investment in Brandrill Limited – (0.6)Amortisation of goodwill arising on acquisition of associates – 6.8 Export incentive (16.4) – Other (3.4) 9.9
(11.4) 54.7
(All amounts in Rand millions unless otherwise stated) 2004 2003

125
IMPLATS ANNUAL REPORT 2004 AN
NU
AL
FIN
AN
CIA
L ST
ATEM
ENTS
27 Other gains – net
Other gains consist of the following principal categories:Interest income
Short-term bank deposits 70.8 251.4 Loans and advances 11.8 32.9Settlement discounts 9.3 10.7Interest bearing securities 8.0 5.1Employee loans 6.9 7.5Other 0.6 0.9
107.4 308.5Fair value gains/(losses) on financial instruments 18.1 (8.0)Dividends received 11.2 16.2 Metal lease fees 1.9 2.4
31.2 10.6 Total other gains – net 138.6 319.1
28 Finance costs
Bank borrowings (56.4) (7.8)Debentures (3.9) (10.5)Other (2.7) (2.4)Rehabilitation provision – adjustment for time value of money (Note 18) (4.1) (12.6)
(67.1) (33.3)
29 Share of profit of associates
Lonplats (comprising Western Platinum Limited and Eastern Platinum Limited) (Note 6 i) 289.5 653.7 Makwiro Platinum Mines (Private) Limited – 25.0 Zimbabwe Platinum Mines Limited – 17.0 Mimosa Investments Limited (formerly ZCE Platinum Limited) – (4.0)Aquarius Platinum (South Africa) (Proprietary) Limited (Note 6 iii) 38.9 33.3
328.4 725.0
30 Sale of subsidiary
i) Barplats Investments LimitedOn 10 February 2004 the board of directors announced its intention to dispose of Barplats Investments Limited (Barplats), a subsidiary and reporting segment. Barplats houses the Crocodile River Mine and the Kennedy's Vale Mine. On 9 March 2004 a contract was signed with the Salene Consortium for the sale of Barplats for R388.8 million.
The decision to sell Barplats was based on several factors which included difficult mining conditions, complex geology, high cost structure and, given current market conditions, the mine was unprofitable.A further aggravating factor was the pre-feasibility study at Kennedy’s Vale Mine resulting in a project that is not viable due to current market conditions.
The process of selling Barplats was completed on 31 May 2004 with the approval of the Competitions Board of the transaction.
(All amounts in Rand millions unless otherwise stated) 2004 2003

AN
NU
AL
FIN
AN
CIA
L ST
ATEM
ENTS
126
IMPLATS ANNUAL REPORT 2004
NOTES TO THE CONSOLIDATED FINANCIAL STATEMENTS Implats group – Year ended 30 June 2004
30 Sale of subsidiary (continued)
Barplats Investments Limited (continued)The income statement of Barplats for the 11 months ended 31 May (2003: 12 months ended 30 June) is as follows:Sales 112.9 154.6 Operating expenses (107.5) (198.2)Other (expense)/income (33.5) 11.1 Tax 0.0 0.0 Loss for the year (28.1) (32.5)Profit on sale of subsidiary 322.3 –
294.2 (32.5)
Barplats business segmentBalance sheet as at 31 May 2004/30 June 2003
Non-current assets 206.2 217.9 Current assets 1.3 30.8 Total assets 207.5 248.7
Capital and reserves attributable to the equity holders of the holding company 67.2 102.2 Non-current liabilities 24.2 29.4 Current liabilities 116.1 117.1 Total equity and liabilities 207.5 248.7
Cash flow statementCash flows from operating activities (29.5) 3.9 Cash flows from investing activities (3.0) (34.8)Cash flows from financing activities 32.5 30.9 Net movement in cash and cash equivalents – –
Cash effect of sale of subsidiary
Property, plant and equipment 215.7Inventories 0.2Trade and other receivables 2.1Cash and cash equivalents 0.2Provision for future rehabilitation (24.2)Trade and other payables (116.1)Book value of net assets sold 77.9Minority interest (11.4)Profit on sale of subsidiary 322.3Proceed from sale of investment 388.8Cash balance disposed (0.2)Net cash effect 388.6
(All amounts in Rand millions unless otherwise stated) 2004 2003

127
IMPLATS ANNUAL REPORT 2004 AN
NU
AL
FIN
AN
CIA
L ST
ATEM
ENTS
31 Profit before tax
The following items have been charged in arriving at profit before tax:Auditors' remuneration
Fees for audit services 2.9 2.3 Fees for other services 0.2 0.3
ProvisionsPost-retirement medical benefits (Note 17) 3.0 3.3 Environmental rehabilitation charge (Note 18) 11.6 31.6
Amortisation of assetsGoodwill of associate (Note 26) – 6.8 Mining assets (Note 5) 572.3 452.4
Depreciation of other assets (Note 5) 7.7 3.5 Repairs and maintenance expenditure on property, plant and equipment 161.5 141.3Operating lease rentals 1.5 1.5 Professional fees 57.9 49.4 Employee benefit expense (Note 25) 2 452.0 2 231.1
32 Income tax expense
Current taxMining 395.0 724.1 Non-mining 223.2 188.6 Prior year under provision – 1.6
618.2 914.3 Deferred tax (Note 16)
Current year 360.9 400.8 Change in rate (21.5) –
339.4 400.8
Secondary tax on companies 140.3 251.0 Foreign tax 43.4 55.6 Capital gains tax – 0.4
183.7 307.0 Tax for the year 1 141.3 1 622.1
(All amounts in Rand millions unless otherwise stated) 2004 2003
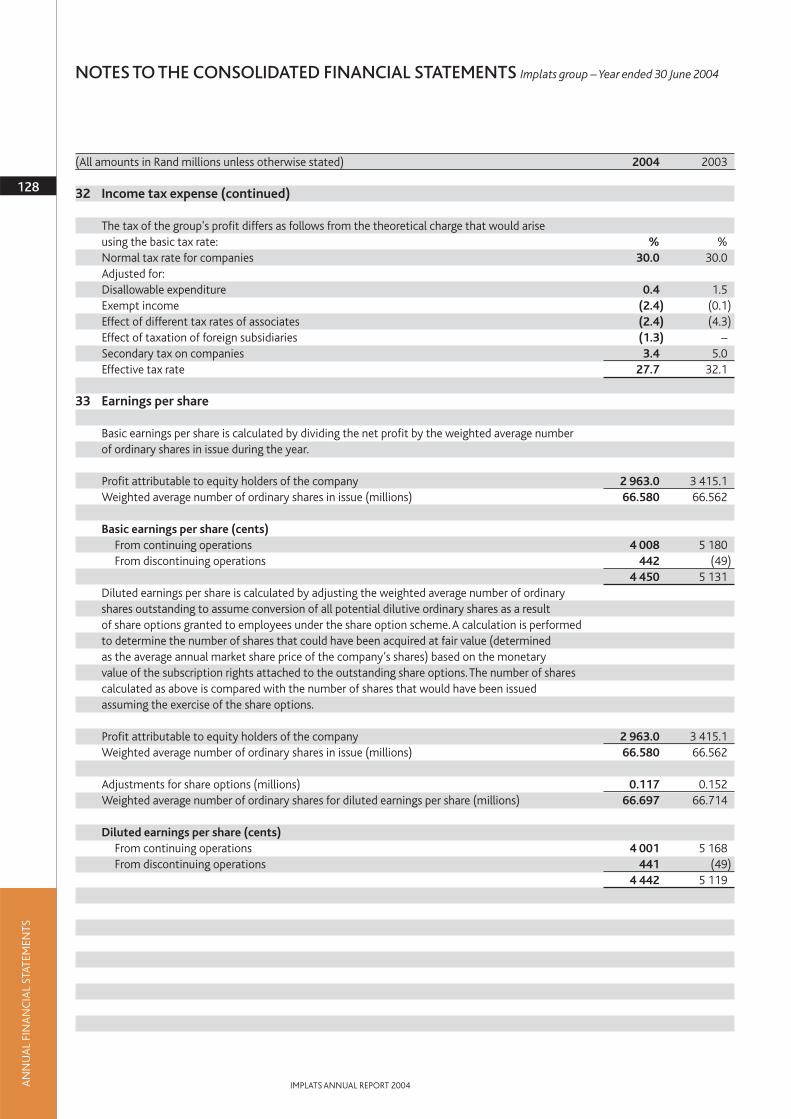
AN
NU
AL
FIN
AN
CIA
L ST
ATEM
ENTS
128
IMPLATS ANNUAL REPORT 2004
NOTES TO THE CONSOLIDATED FINANCIAL STATEMENTS Implats group – Year ended 30 June 2004
32 Income tax expense (continued)
The tax of the group's profit differs as follows from the theoretical charge that would arise using the basic tax rate: % %Normal tax rate for companies 30.0 30.0Adjusted for:Disallowable expenditure 0.4 1.5 Exempt income (2.4) (0.1)Effect of different tax rates of associates (2.4) (4.3)Effect of taxation of foreign subsidiaries (1.3) – Secondary tax on companies 3.4 5.0 Effective tax rate 27.7 32.1
33 Earnings per share
Basic earnings per share is calculated by dividing the net profit by the weighted average number of ordinary shares in issue during the year.
Profit attributable to equity holders of the company 2 963.0 3 415.1 Weighted average number of ordinary shares in issue (millions) 66.580 66.562
Basic earnings per share (cents)From continuing operations 4 008 5 180 From discontinuing operations 442 (49)
4 450 5 131Diluted earnings per share is calculated by adjusting the weighted average number of ordinary shares outstanding to assume conversion of all potential dilutive ordinary shares as a result of share options granted to employees under the share option scheme.A calculation is performed to determine the number of shares that could have been acquired at fair value (determined as the average annual market share price of the company’s shares) based on the monetary value of the subscription rights attached to the outstanding share options.The number of shares calculated as above is compared with the number of shares that would have been issued assuming the exercise of the share options.
Profit attributable to equity holders of the company 2 963.0 3 415.1Weighted average number of ordinary shares in issue (millions) 66.580 66.562
Adjustments for share options (millions) 0.117 0.152Weighted average number of ordinary shares for diluted earnings per share (millions) 66.697 66.714
Diluted earnings per share (cents)From continuing operations 4 001 5 168 From discontinuing operations 441 (49)
4 442 5 119
(All amounts in Rand millions unless otherwise stated) 2004 2003

129
IMPLATS ANNUAL REPORT 2004 AN
NU
AL
FIN
AN
CIA
L ST
ATEM
ENTS
33 Earnings per share (continued)
The calculation for headline earnings per share is based on the basic earnings per share calculation adjusted for the following items:
Profit attributable to equity holders of the company 2 963.0 3 415.1Add: amortisation of goodwill – 6.8 Less: profit on sale of investment in Brandrill Limited – (0.6)Less: profit on sale of Barplats Investments Limited (322.3) –Headline earnings 2 640.7 3 421.3
Headline earnings per share (cents)– basic 3 966 5 140– diluted 3 959 5 128
34 Dividends per share
At the Board Meeting on 27 August 2004, a final dividend in respect of 2004 of 1 600 cents per share amounting to a total dividend of R1 065.9 million was approved. Standard Tax on Companies (STC) on the dividend will amount to R123.1 million.
These financial statements do not reflect this dividend and related STC payable.The dividend will be accounted for in shareholders’ equity as an appropriation of retained earnings in the year ending 30 June 2005.
Dividends paidFinal dividend No. 71 for 2003 of 1 750 (2002: 2 600) cents per share 1 165.4 1 730.4 Interim dividend No. 72 for 2004 of 500 (2003: 900) cents per share 332.6 599.3
1 498.0 2 329.7 Dividend cover relating to dividends paid and proposed in the financial year
Based on net profit 2.1 1.9 Based on headline earnings (Note 33) 1.9 1.9
(All amounts in Rand millions unless otherwise stated) 2004 2003

AN
NU
AL
FIN
AN
CIA
L ST
ATEM
ENTS
130
IMPLATS ANNUAL REPORT 2004
NOTES TO THE CONSOLIDATED FINANCIAL STATEMENTS Implats group – Year ended 30 June 2004
35 Cash generated from operations
Reconciliation of net profit to cash generated from operations:
Profit 2 963.0 3 415.1
Adjustments for:Profit on disposal of subsidiary (Note 30) (322.3) – Minority interest 17.4 (166.9)Income tax expense (Note 32) 1 141.3 1 622.1 Depreciation (Note 31) 7.7 3.5 Amortisation (Note 31) 572.3 452.4 Fair value (profit)/loss on financial instruments (Note 27) (18.1) 8.0 Interest income (Note 27) (107.4) (308.5)Dividend income (Note 27) (11.2) (16.2)Finance cost (Note 28) 67.1 33.3 Amortisation of goodwill (Note 26) – 6.8 Share of results of associates (Note 29, 6) (328.4) (725.0)Non-cash transactions – (293.8)Retirement benefit obligations (Note 17) 3.0 3.3 Payments made for post-retirement benefits (Note 17) (4.2) (6.7)Environmental rehabilitation charge (Note 18, 28) 11.6 28.3 Payments made for rehabilitation (Note 18) (6.8) (15.4)
Changes in working capital (excluding the effects of acquisition and disposal of subsidiaries):Inventories (398.5) 131.2 Trade and other receivables (634.2) (133.5)Payables (473.2) (571.6)Accruals 661.0 868.9
Cash generated from operations 3 140.1 4 335.3
36 Contingent liabilities and guarantees
At year end the group had contingent liabilities in respect of bank and other guarantees and other matters arising in the ordinary course of business from which it is anticipated that no material liabilities will arise.
Related party contingencies Lonplats (comprising Western Platinum Limited and Eastern Platinum Limited) – 81.5 Aquarius Platinum (South Africa) (Proprietary) Limited 175.0 175.0
175.0 256.5Makwiro Platinum Mines (Private) Limited, guaranteed by:
Impala Platinum Holdings Limited 15.4 54.5 Zimbabwe Platinum Mines Limited 36.0 127.1
Collateral security for employee housing 7.3 7.8 Department of Minerals and Energy 103.7 – Registrar of Medical Aids 5.0 – Total contingencies 342.4 445.9
Due to the uncertainties regarding the timing and amounts, potential outflows cannot be quantified.
(All amounts in Rand millions unless otherwise stated) 2004 2003

131
IMPLATS ANNUAL REPORT 2004 AN
NU
AL
FIN
AN
CIA
L ST
ATEM
ENTS
37 Commitments
Commitments at the balance sheet date but not recognised in the financial statements are as follows:
Mining property, plant and equipmentCommitments contracted for 603.2 986.3 Approved expenditure not yet contracted 1 844.4 1 882.7
2 447.6 2 869.0
Not later than 1 year 625.0 1 650.5 Later than 1 year not later than 5 years 1 822.6 1 114.3 Later than 5 years – 104.2
2 447.6 2 869.0
Operating lease rentals for mining accommodationNot later than 1 year 2.3 2.1 Later than 1 year not later than 5 years 10.8 10.1 Later than 5 years 10.2 13.2
23.3 25.4
This expenditure will be funded internally and if necessary, from borrowings.
Metal purchase commitmentsFrom time to time, in order to finance third party refining, Impala Refining Services Limited sells refined metal, held on behalf of third parties, into the market with a commitment to repurchase at a later date.
The forward commitments, recognised in the financial statements, were as follows:
Foreign currency US$ millions 25.7 16.7 Fair value R millions (not later than 1 year) (Note 19) 158.7 125.8
38 Business combinations
i) Zimbabwe Platinum Mines LimitedDuring September 2003 an offer to the minorities of Zimbabwe Platinum Mines Limited was made at R20.40 (A$4.08) per share.The result of this offer was the acquisition of 30.6 million shares for a consideration of R599.4 million (A$125.8 million).A further 1.6 million shares have been acquired by year end for an amount of R32.5 million (A$6.7 million).The result of these transactions was to increase the holding of the group in Zimbabwe Platinum Mines Limited from 50.5% to 83.4%.
The increase in its shareholding in Zimbabwe Platinum Mines Limited, during the previous financial year, resulted in the fair value of net assets acquired being in excess of the purchase consideration. In previous financial years, purchases resulted in a surplus of purchase price over net assets which was offset against the above mentioned excess.
(All amounts in Rand millions unless otherwise stated) 2004 2003

AN
NU
AL
FIN
AN
CIA
L ST
ATEM
ENTS
132
IMPLATS ANNUAL REPORT 2004
NOTES TO THE CONSOLIDATED FINANCIAL STATEMENTS Implats group – Year ended 30 June 2004
38 Business combinations (continued)
Details of net assets acquired and goodwill are as follows:Purchase consideration:
Cash paid 631.9 209.2 Carrying value of investment in associate – 252.8
Total purchase consideration 631.9 462.0 Carrying value of minorities acquired (281.2) – Transfer to other reserves (350.7) – Fair value of net assets acquired – (596.8)Surplus of net assets over purchase consideration – (134.8)
The fair value of net assets approximated to the book value of net assets acquired, and no plant closure provisions or other restructuring provisions were established.
The assets and liabilities arising from the acquisition in the prior year are as follows:
Cash and cash equivalents 129.2Property, plant and equipment (Note 5) 1 190.6Mining interests 235.2Inventories 51.2Receivables 164.8Payables (79.5)Borrowings (319.5)Minority interests (775.2)Fair value of net assets acquired 596.8Surplus of net assets over purchase consideration (134.8)Total purchase consideration 462.0Less:Carrying value of associate investment (252.8)Cash and cash equivalents in subsidiary acquired (129.2)Cash outflow on acquisition – 80.0
ii) Mimosa Investments Limited (formerly ZCE Platinum Limited)
On 1 July 2002 the group acquired a further 15% of the share capital of Mimosa Investments Limited (which owns Mimosa Mining Company (Private) Limited), involved in the mining of PGMs in Zimbabwe.This increased the group's holding to 50% and consequently the company's results were proportionally consolidated as from that date. The acquired business contributed revenues of R246.7 million and operating profit of R108.5 million to the group, before elimination of inter-group transactions, for the period from 31 August 2002 to 30 June 2003, and its proportional assets and liabilities at 30 June 2003 were respectively R504.4 million and R111.4 million.
(All amounts in Rand millions unless otherwise stated) 2004 2003

133
IMPLATS ANNUAL REPORT 2004 AN
NU
AL
FIN
AN
CIA
L ST
ATEM
ENTS
38 Business combinations (continue)
ii) Mimosa Holdings Limited (formerly ZCE Platinum Limited)Details of net assets acquired are as follows:
Purchase consideration:Cash paid 130.3Carrying value of associate investment 270.2
Total purchase consideration 400.5Fair value of net assets acquired 400.5
– –
Other than for mining assets, the fair value of the net assets acquired approximated the book value of the net assets acquired, and no plant closure provisions or other restructuring provisions were established.
The assets and liabilities arising from the acquisition in the prior year are as follows:
Cash and cash equivalents 99.9Property, plant and equipment (Note 5) 356.1Available-for-sale investments 0.1Inventories 7.3Receivables 14.5Payables (6.9)Borrowings (11.1)Rehabilitation provision (9.5)Deferred tax (49.9)Fair value of net assets acquired 400.5Less:Carrying value of associate investment (270.2)Cash and cash equivalents in joint venture acquired (99.9)Cash outflow on acquisition – 30.4
(All amounts in Rand millions unless otherwise stated) 2004 2003

AN
NU
AL
FIN
AN
CIA
L ST
ATEM
ENTS
134
IMPLATS ANNUAL REPORT 2004
NOTES TO THE CONSOLIDATED FINANCIAL STATEMENTS Implats group – Year ended 30 June 2004
39 Related party transactions
The following transactions were carried out with related parties:
Sales of goods and services to associatesSales of services
Refining fees 255.4 129.6 Interest 5.5 0.1
260.9 129.7
Purchases of goods and services from associatesPurchases of mineral concentrates 1 314.6 856.2
Key management compensationKey management compensation has been disclosed in the directors’ report.
Year-end balances arising from sales/purchases of goods/servicesPayables to associates 471.0 285.9
Receivables from associates 246.3 82.0
Loans to related partiesLoans to directors and key management of the company have been disclosed in the directors’ report.
Loans to associates:Beginning of the year 70.0 –
Loans advanced during year 1 129.5 70.0 Loan repayments received (953.7) – Interest charged 4.7 0.1 Interest received (4.7) (0.1)
End of the year 245.8 70.0
ContingenciesGuarantees provided (Note 36) 175.0 256.5
Share options granted to directorsThe aggregate number of share options granted to the directors and key management is disclosed in the directors’ report.
40 Principal subsidiaries
The principal subsidiaries of the group are set out in Annexure A.
(All amounts in Rand millions unless otherwise stated) 2004 2003

135
IMPLATS ANNUAL REPORT 2004 AN
NU
AL
FIN
AN
CIA
L ST
ATEM
ENTS
41 Interest in joint venture
The group has a 50% interest in a joint venture, Mimosa Investments Limited (previously ZCE Platinum Limited), which is involved in the business of mining PGMs.The following amounts represent the group’s 50% share of the assets and liabilities and sales and results of the joint venture and are included in the consolidated balance sheet and income statement:
Property, plant and equipment 364.5 367.7 Current assets 8.4 42.6
372.9 410.3
Provisions for liabilities and charges (43.6) (67.3)Current liabilities (67.8) (21.5)
(111.4) (88.8)Net assets 261.5 321.5
Sales 246.7 159.4 Inter-group sales are eliminated on consolidation.
Profit before tax 108.5 57.9 Income tax expense (16.2) (14.1)Profit after tax 92.3 43.8
There are no contingent liabilities relating to the group’s interest in the joint venture.
42 Events after the balance sheet date
Post balance sheet events are disclosed in the directors’ report.
(All amounts in Rand millions unless otherwise stated) 2004 2003

AN
NU
AL
FIN
AN
CIA
L ST
ATEM
ENTS
136
IMPLATS ANNUAL REPORT 2004
As at 30 June(All amounts in Rand millions unless otherwise stated) Notes 2004 2003
ASSETSNon-current assetsProperty, plant and equipment 1 – – Investments in associates 2 1 046.7 982.0 Investments in subsidiaries and joint venture 2 1 061.0 1 155.3 Deferred income tax assets 3 9.4 – Available-for-sale financial investments 4 186.4 229.7 Other receivables 5 – –
2 303.5 2 367.0 Current assetsTrade and other receivables 6 8.4 42.6 Cash and cash equivalents 7 0.0 0.0
8.4 42.6 Total assets 2 311.9 2 409.6
EQUITYShare capital 8 627.3 617.8 Other reserves 9 152.0 200.6 Retained earnings 1 515.1 1 580.0 Total equity 2 294.4 2 398.4
LIABILITIESCurrent liabilitiesTrade and other payables 10 10.2 3.1 Current tax liabilities 7.3 8.1 Total liabilities 17.5 11.2 Total equity and liabilities 2 311.9 2 409.6
These financial statements have been approved for issue by the board of directors on 27 August 2004.
Balance sheet Impala Platinum Holdings Limited – as at 30 June 2004
Year ended 30 June(All amounts in Rand millions unless otherwise stated) Notes 2004 2003
Other (expenses)/income 11 (43.6) 1 575.7 Other gains – net 12 1 484.2 2 229.3 Profit before tax 13 1 440.6 3 805.0 Income tax expense 14 (7.5) (8.2)Profit for the year attributable to equity holders of the company 1 433.1 3 796.8
The notes on pages 139 to 142 are an integral part of these financial statements.
Income statement Impala Platinum Holdings Limited – Year ended 30 June 2004

137
IMPLATS ANNUAL REPORT 2004 AN
NU
AL
FIN
AN
CIA
L ST
ATEM
ENTS
Share Other Retained(All amounts in Rand millions unless oherwise stated) Notes capital reserves earnings Total
Balance at 30 June 2002 602.9 393.4 112.9 1 109.2
Fair value losses net of tax:Available-for-sale financial assets 9 (192.8) (192.8)
Net expense recognised directly in equity (192.8) (192.8)Profit for the year 3 796.8 3 796.8
(192.8) 3 796.8 3 604.0
Employee share option scheme:Proceeds from shares issued 8 14.9 14.9
Dividend relating to 2002 15 (1 730.4) (1 730.4)Dividend relating to 2003 15 (599.3) (599.3)
14.9 (2 329.7) (2 314.8)
Balance at 30 June 2003 617.8 200.6 1 580.0 2 398.4
Fair value losses net of tax:Available-for-sale financial assets 9 (48.6) (48.6)
Net expense recognised directly in equity (48.6) (48.6)Profit for the year 1 433.1 1 433.1
(48.6) 1 433.1 1 384.5
Employee share option scheme:Proceeds from shares issued 8 9.5 9.5
Dividend relating to 2003 15 (1 165.4) (1 165.4)Dividend relating to 2004 15 (332.6) (332.6)
9.5 (1 498.0) (1 488.5)
Balance at 30 June 2004 627.3 152.0 1 515.1 2 294.4
The notes on pages 139 to 142 are an integral part of these financial statements.
Statement of changes in shareholders’ equity Impala Platinum Holdings Limited – Year ended 30 June 2004

Year ended 30 June(All amounts in Rand millions unless oherwise stated) Notes 2004 2003
Cash flows from operating activitiesCash generated from operations 16 1 452.9 2 154.5 Tax paid (8.3) (6.6)Net cash from operating activities 1 444.6 2 147.9
Cash flows from investing activitiesPurchase of investments in associates 2 (42.0) (11.2)Purchase of investments in subsidiaries (633.7) (481.6)Purchase of unlisted investments 4 (14.7) –Loans repaid by subsidiaries 728.0 613.4 Loans repaid by related parties and other undertakings 5 – 18.5 Interest received 3.5 6.1 Dividends received 12 2.8 21.7 Net cash used in investing activities 43.9 166.9
Cash flows from financing activitiesIssue of ordinary shares 8 9.5 14.9 Dividends paid to shareholders 15 (1 498.0) (2 329.7)Net cash used in financing activities (1 488.5) (2 314.8)
Cash and cash equivalents at end of year – –
The notes on pages 139 to 142 are an integral part of these financial statements.
Cash flow statement Impala Platinum Holdings Limited – Year ended 30 June 2004
AN
NU
AL
FIN
AN
CIA
L ST
ATEM
ENTS
138
IMPLATS ANNUAL REPORT 2004

139
IMPLATS ANNUAL REPORT 2004 AN
NU
AL
FIN
AN
CIA
L ST
ATEM
ENTS
1 Property, plant and equipment
Other assetsCost
Opening net book amount – 0.2 Disposals – (0.2)Closing net book amount – –
2 Investments in subsidiaries, associates and joint ventures
Associates 1 046.7 982.0 Subsidiaries and joint venture (Annexure A) 1 061.0 1 155.3
2 107.7 2 137.3 AssociatesAt costMakwiro Platinum Mines (Private) Limited 247.0 247.0 Two Rivers Platinum (Proprietary) Limited 316.8 274.8 Aquarius Platinum (South Africa) (Proprietary) Limited 482.9 460.2 Total investments in associates 1 046.7 982.0
3 Deferred income tax assets
Deferred income tax assets and liabilities are offset when there is a legally enforceable right to offset current tax assets against current tax liabilities and when the deferred income taxes relate to the same fiscal authority.The offset amounts are as follows:
Deferred tax assets:– Deferred tax asset to be recovered after more than 12 months 9.4 –
Deferred income taxes are calculated at the prevailing tax rates of the different fiscal authorities where the asset or liability originates.
The movement on the deferred income tax account is as follows:At the beginning of the year – – Tax credit to equity (Note 9) 9.4 – At the end of the year 9.4 –
4 Available-for-sale financial investments
Investments in listed sharesComprise shares in the following listed companies
Aquarius Platinum Limited
Beginning of the year 229.7 422.5 Exchange differences (27.7) (41.6)Share price movement (30.3) (151.2)
End of the year 171.7 229.7
Notes to the company financial statements Impala Platinum Holdings Limited – Year ended 30 June 2004
(All amounts in Rand millions unless otherwise stated) 2004 2003

4 Available-for-sale financial investments (continued)
During the period under review, the company maintained its strategic shareholding in Aquarius Platinum Limited, holding 7 141 966 shares (2003: 7 141 966) which amounts to approximately 8.6% (2003: 8.9%) of the issued share capital of that company.The shares are currently listed on the Australian Stock Exchange and the London Stock Exchange.The fair value of these shares as at the close of business on 30 June 2004 by reference to Stock Exchange quoted prices and closing exchange rates was R171.7 million (2003: R229.7 million).
Investment in unlisted sharesShares beneficially owned in the undermentioned concern at fair value:
Silplat (Proprietary) Limited 14.7 – 186.4 229.7
5 Non-current receivables and prepayments
LoansMessina Platinum Mines Limited – 23.5 Less: current portion of loan (Note 6) – (23.5)
– –
The Messina Platinum Mines Limited loan bore interest at JIBAR plus 6%, and was repaid during 2004.
6 Current receivables and prepayments
Other receivables 8.4 19.1 Current portion of loans (Note 5) – 23.5
8.4 42.6
7 Cash and cash equivalents
For the purposes of the cash flow statement, the cash and cash equivalents comprise cash and bank balances.
0.0 0.0
8 Share capital and share premium
Number of Ordinary Shareshares shares premium Total
(millions) R million R million R million
At 30 June 2002 66.554 13.3 589.6 602.9Issued in terms of the share option scheme 0.040 0.0 14.9 14.9
At 30 June 2003 66.594 13.3 604.5 617.8Issued in terms of the share option scheme 0.027 0.0 9.5 9.5
At 30 June 2004 66.621 13.3 614.0 627.3
The total authorised ordinary share capital comprise 100 million (2003: 100 million) shares with a par value of 20 cents each.All issued shares are fully paid.
AN
NU
AL
FIN
AN
CIA
L ST
ATEM
ENTS
140
IMPLATS ANNUAL REPORT 2004
(All amounts in Rand millions unless otherwise stated) 2004 2003
NOTES TO THE FINANCIAL STATEMENTS Impala Platinum Holdings Limited – Year ended 30 June 2004

141
IMPLATS ANNUAL REPORT 2004 AN
NU
AL
FIN
AN
CIA
L ST
ATEM
ENTS
8 Share capital and share premium (continued)
Authorised amount 20.0 20.0 Up to 10% of the unissued shares may be issued by the directors at their discretion until the next annual general meeting.
9 Other reservesAvailable-for-sale
investmentsBalance 1 July 2002 393.4
Revaluation – gross (Note 4) (192.8)Balance 30 June 2003 200.6
Revaluation – gross (Note 4) (58.0)Revaluation – tax (Note 3) 9.4
Balance 30 June 2004 152.0
10 Trade and other payables
Trade payables 10.2 3.1
11 Other (expenses)/income
Exploration expenditure (8.9) (31.9)Recoupment of investment in Brandrill Limited – 0.6 Professional fees (26.0) (5.5)Profit on sale of mineral right to Impala Platinum Limited – 1 620.9Other (8.7) (8.4)
(43.6) 1 575.7
12 Other gains
Other gains consist of the following principal categories:Interest income 26.2 6.1 Dividends received – investments 2.8 21.7 Dividends received – subsidiaries 1 455.2 2 201.5
1 484.2 2 229.3
13 Profit before tax
The following items have been charged in arriving at profit before tax:Auditors' remuneration
Fees for audit services 0.3 0.1 Professional fees 26.0 5.5
(All amounts in Rand millions unless otherwise stated) 2004 2003

AN
NU
AL
FIN
AN
CIA
L ST
ATEM
ENTS
142
IMPLATS ANNUAL REPORT 2004
14 Income tax expense
Current taxCharge for the year 7.5 7.8
7.5 7.8 Capital gains tax – 0.4
7.5 8.2
The tax of the company's profit differs as follows from the theoretical charge that would arise using the basic tax rate:
% % Normal tax rate for companies 30.0 30.0 Adjusted for:Disallowable expenditure 0.8 0.4 Exempt income (30.3) (30.2)Effective tax rate 0.5 0.2
15 Dividends per share
At the board meeting on 27 August 2004, a final dividend in respect of 2004 of 1 600 centsper share amounting to a total dividend of R1 065.9 million was approved. STC on the dividend will amount to R123.1 million.
These financial statements do not reflect this dividend and related STC payable.The dividendwill be accounted for in shareholders’ equity as an appropriation of retained earnings in the year ending 30 June 2005.
Dividends paidFinal dividend No. 71 for 2003 of 1 750 (2002: 2 600) cents per share 1 165.4 1 730.4 Interim dividend No. 72 for 2004 of 500 (2003: 900) cents per share 332.6 599.3
1 498.0 2 329.7
16 Cash generated from operations
Reconciliation of net profit to cash generated from operations:
Profit 1 433.1 3 796.8 Adjustments for:Income tax expense (Note 14) 7.5 8.2 Interest income (Note 12) (26.2) (6.1)Dividend income (2.8) (21.7)Profit on sale of mineral rights to Impala Platinum Limited – (1 620.9)
Changes in working capital:Trade and other receivables 34.2 (2.7)Trade and other payables 7.1 0.9 Cash generated from operations 1 452.9 2 154.5
(All amounts in Rand millions unless otherwise stated) 2004 2003
NOTES TO THE FINANCIAL STATEMENTS Impala Platinum Holdings Limited – Year ended 30 June 2004

143
IMPLATS ANNUAL REPORT 2004 AN
NU
AL
FIN
AN
CIA
L ST
ATEM
ENTS
Investment in subsidiaries and joint ventureIssued Effective Book value in holding companyshare group interest Shares Loans
capital 2004 2003 2004 2003 2004 2003 Company and description % % R Million R Million R Million R Million
Impala Holdings Limited * 100 100 (1 355.1) (1 012.9)Investment holding company
Impala Platinum Limited * 100 100 Mines, refines and markets PGMs
Impala Platinum Investments (Pty) Ltd * 100 100Impala Platinum Properties (Rustenburg) (Pty) Ltd * 100 100 Impala Platinum Properties (Johannesburg) (Pty) Ltd * 100 100
Own propertiesBarplats Holdings (Pty) Ltd * 100 100 68.0 68.0 (359.6) 29.4
Investment holding companyGazelle Platinum Limited * 100 100 324.5 324.5
Investment holding companyImpala Refining Services Limited * 100 100
Provides toll refining servicesImpala Platinum Japan Limited 1 ¥ 10m 100 100 1.5 1.5 (0.2) (0.4)
Marketing representativeImpala Platinum Zimbabwe (Pty) Ltd * 100 100 72.8 72.8 350.7 349.2
Investment holding companyZimbabwe Platinum Mines Limited**2 US$ 9.3m 83 51 631.9
Owns mineral rights and mines PGMsMakwiro Platinum (Pvt) Limited4 US$30.1m 88 65
Owns mineral rights and mines PGMsMimosa Investments Ltd (formerly ZCE Platinum Ltd3) US$48.0m 50 50 376.6 376.6
Investment holding companyMimosa Holdings (Pvt) Ltd (formerly
Zimasco Platinum Holdings (Pvt) Ltd4 ) US$28.8m 50 50 Investment holding company
Mimosa Platinum (Pvt) Ltd4 US$28.8m 50 50 Owns mineral rights and mines PGMs
Marula Platinum (Pty) Ltd * 100 100 885.9 885.9 60.3 60.3Owns mineral rights and mines PGMs
Sundry dormant companies * 100 100 3.7 0.6 0.0 (0.2)Total 2 040.4 1 405.4 (979.4) (250.1)Total investment at cost 1 061.0 1 155.3
* Share capital less than R50 000** Listed on the Australian Stock Exchange1 Incorporated in Japan2 Incorporated in Guernsey3 Incorporated in Mauritius4 Incorporated in Zimbabwe
Annexure A Impala Platinum Holdings Limited – Year ended 30 June 2004

The forty-eighth annual general meeting of members will be held in the Boardroom,3rd Floor,Old Trafford 4, Isle of Houghton,BoundaryRoad, Houghton on Friday, 29 October 2004 at 09:00 for the following purposes:
Annual Financial Statements
1. To receive and consider the financial statements for the year ended 30 June 2004.
Directorate2. To confirm the appointment as directors of the company of:
Messrs RSN Dabengwa LC van VughtDrs FJP Roux K Mokhele, andMs NDB Orleyn
3. To elect directors in place of those retiring in terms of the articles of association. The following directors are eligible and offerthemselves for re-election:Messrs JV Roberts JM McMahon, andMs CE Markus
4. To determine the remuneration of the directors (refer to page 90 of the Directors’ Report)
Control of unissued capital5. To consider, and if deemed fit, to pass with or without modification the undermentioned resolution as an ordinary resolution:
“That the authorised but unissued shares in the capital of the company be placed at the disposal and under the control of thedirectors of the company and the directors are hereby authorised and empowered to allot, issue and otherwise dispose thereof tosuch person or persons and on such terms and conditions at their discretion subject to a maximum of 10% of the issued sharecapital and the provisions of the Companies Act”.
6. To consider, and if deemed fit, to pass with or without modification the following resolution as an ordinary resolution:“Resolved that, subject to compliance with the Listings Requirements of the JSE Securities Exchange South Africa (“JSE”) and theapproval of a 75% (seventy-five percent) majority of the votes cast by the shareholders of the company present in person or byproxy and entitled to vote at the meeting at which this resolution is proposed, the directors of the company are hereby authorisedby way of a general authority to allot and issue the unissued ordinary shares in the capital of the company for cash, withoutrestrictions as to whom the shares will be issued, as and when suitable opportunities arise, subject to the following conditions:
a. that this authority shall lapse on the earlier of the date of the next annual general meeting of the company or the date 15(fifteen) months after the date on which this resolution is passed;
b. a paid press announcement giving full details, including the impact on net asset value and earnings per share,will be publishedat the time of any issue representing, on a cumulative basis within 1 (one) year, 5% (five percent) or more of the number ofshares in issue prior to the issue(s);
c. that the issues in the aggregate in any 1 (one) year shall not exceed 15% (fifteen percent) of the number of shares of theCompany’s issued ordinary share capital;
d. that, in determining the price at which an issue of shares will be made in terms of this authority, the maximum discountpermitted shall be 10% (ten percent) of the average closing price on the JSE of the ordinary shares, adjusted for any dividenddeclared but not yet paid or for any capitalisation award made to shareholders, as determined over the 30 (thirty) businessdays prior to either the date of the paid press announcement or, where no announcement is required and none has beenmade, the date of issue of the shares; and
e. that any issue in terms of this general authority shall be made only to public shareholders as defined in the aforesaid ListingsRequirements.”
Notice to shareholders
AN
NU
AL
FIN
AN
CIA
L ST
ATEM
ENTS
144
IMPLATS ANNUAL REPORT 2004

145
IMPLATS ANNUAL REPORT 2004 AN
NU
AL
FIN
AN
CIA
L ST
ATEM
ENTS
Special business7. To pass with or without modification the following resolution as a special resolution:
Share buy-backsSpecial Resolution Resolved that the Company and/or any of its subsidiaries from time to time are hereby authorised,by way of a general authority, to:
(a) acquire ordinary shares of 20 (twenty) cents each (“Ordinary Shares”) issued by the company in terms of Sections 85 and89 of the Companies Act, No. 61 of 1973, as amended, and in terms of the Listing Requirements from time to time of theJSE Securities Exchange South Africa (“the Listing Requirements”); and/or
(b) to conclude derivative transactions which may result in the purchase of ordinary shares in terms of the Listing Requirements,it being recorded that such Listing Requirements currently require, inter alia, that:
(i) the Company may make a general repurchase of securities only if any such repurchase of ordinary share shall beimplemented on the Main Board of the JSE Securities Exchange South Africa (“JSE”) or any other stock exchange onwhich the shares are listed and on which the Company or any of its subsidiaries may wish to implement any purchasesof ordinary shares with the approval of the JSE and any other such stock exchange, as necessary;
(ii) this general authority shall only be valid until the Company’s next annual general meeting, provided that it shall notextend beyond 15 (fifteen) months from the date of passing of this special resolution;
(iii) the purchase of the ordinary shares may not be made at a price greater than 10% (ten percent) above the weightedaverage of the market value of such ordinary shares for the 5 (five) business days immediately preceding the date ofthe transaction;
(iv) any derivative transactions which may result in the repurchase of ordinary shares must be priced as follows:
(1) the strike price of any put option written by the company may not be at a price greater than stipulated in paragraph(iii) above at the time of entering into the derivative agreement;
(2) the strike price of any call option may be greater than stipulated in paragraph (iii) above at the time of enteringinto the derivative agreement, but the Company may not exercise that call option if it is “out of the money”;
(3) the strike price of any forward agreement may be greater that the price indicated in paragraph (iii) above butlimited to the fair value of a forward agreement based on a spot price not greater than stipulated in paragraph(iii) above;
(v) when the Company and/or any of its subsidiaries has cumulatively purchased 3% (three percent) of the number ofordinary shares in issue on the date of passing of this special resolution (including the delta equivalent of any suchordinary shares underlying derivative transactions which may result in the repurchase by the company of ordinaryshares),and for each 3% (three percent) thereof in aggregate,acquired thereafter,an announcement must be publishedas soon as possible and not later than 08:30 on the business day following the day on which the relevant threshold isreached or exceeded, and the announcement must comply with the Listing Requirements;
(vi) any general purchase by the Company and/or any of its subsidiaries of the Company’s ordinary shares in issue shallnot in aggregate, in any one financial year, exceed 10% (ten percent) of the Company’s issued ordinary share capital.
The reason for the special resolution is to obtain, and the effect thereof is to grant the company a general authority in terms of theCompanies Act, 1973, as amended, for the acquisition by the company and/or any of its subsidiaries of shares in the capital of thecompany,which general authority shall be valid until the next annual general meeting of the company,provided that the general authorityshall not extend beyond fifteen months from the date at which this special resolution is passed.
The board of directors, as at the date of this notice, has stated its intention to examine methods of returning capital to shareholders interms of the general authority granted at the last annual general meeting.The board believes it to be in the best interest of Implats that

shareholders pass a special resolution granting the company and/ or its subsidiaries a further general authority to acquire Implats shares.Such general authority will provide Implats and its subsidiaries with the flexibility, subject to the requirements of the Companies Actand the JSE, to purchase shares should it be in the interest of Implats and/or its subsidiaries at any time while the general authoritysubsists.
The directors have considered the impact which a purchase of up to a maximum of 10% of the Company’s issued ordinary share capitaland a general authority would have on the Company and/or its subsidiaries (together “the group”) and are of the opinion that for aperiod of twelve months from the date of this notice:
– the company and the group will in the ordinary course of business be able to pay its debts;
– the assets of the company and the group will be in excess of the liabilities of the company and the group calculated in accordancewith the accounting policies used in the audited financial statements for the year ended 30 June 2004; and
– the ordinary capital, working capital and reserves of the company and the group will be adequate;
By order of the board
R MahadeveyGroup Secretary
27 August 2004
Registered Office3rd Floor Old Trafford 4Isle of HoughtonBoundary RoadHoughton 2198
Note:A member entitled to attend and vote is entitled to appoint one or more proxies to attend and speak and vote in his stead.A proxyneed not be a member.
AN
NU
AL
FIN
AN
CIA
L ST
ATEM
ENTS
146
IMPLATS ANNUAL REPORT 2004
NOTICE TO SHAREHOLDERS
AN
NU
AL
FIN
AN
CIA
L ST
ATEM
ENTS
147
IMPLATS ANNUAL REPORT 2004
Form of proxy
IMPALA PLATINUM HOLDINGS LIMITED(Incorporated in the Republic of South Africa)(Registration number: 1957/001979/06)(Share code:IMP) (ISIN:ZAE000003554)(“Implats” or “the Company”)
This form of proxy is not for use by members who have already dematerialised their Implats shares. Such members must use theattached voting instruction form (blue)
For use at the annual general meeting of the company to be held on Friday, 29 October 2004 at 09:00 (the annual general meeting)
I/We
ofappoint (See Note 1):
1. or, failing him,
2. or, failing him,
3. the chairman of the annual general meeting.
As my/our proxy to act for me/us at the annual general meeting of the company which will be held in the Boardroom, 3rd Floor,Old Trafford 4, Isle of Houghton, Boundary Road, Houghton, Johannesburg at 09:00 on Friday, 29 October 2004, and at eachadjournment or postponement thereof, and to vote for and/or against the resolutions and/or abstain from voting in respect of theshares in the issued capital of the company registered in my/our name/s (see Note 2).
Resolution Number of ordinary sharesResolutions For Against AbstainAppointment of directors 2
RSN DabengwaK MokheleNDB OrleynFJP RouxLC van Vught
Re-election of directors 3CE MarkusJM McMahonJV Roberts
Directors’ remuneration 4Unissued shares
general 5issue for cash 6
Special resolution – share buy-back 7
Insert in the relevant space above the number of shares held.
Signed at on 2004
Signature
ONLY FOR USE BY REGISTERED MEMBERS

AN
NU
AL
FIN
AN
CIA
L ST
ATEM
ENTS
Notes1. A shareholder may insert the name of a proxy or the names of two alternative proxies of the shareholder’s choice in the space’s
provided, with or without deleting “the chairman of the annual general meeting”. Any such deletion must be initialled by theshareholder. The person present at the meeting whose name appears first on the form of proxy and has not been deleted will beentitled to act as proxy to the exclusion of those whose names follow.
2. A shareholder’s instructions to the proxy must be indicated by the insertion of the relevant number of votes exercisable by thatshareholder in the appropriate space provided. Failure to comply with the above will be deemed to authorise the proxy to vote orto abstain from voting at the annual general meeting as he deems fit in respect of all the shareholder’s votes exercisable thereat.A shareholder or his proxy is not obliged to use all the votes exercisable by the shareholder or by his proxy, but the total of thevotes cast and in respect whereof abstention is recorded may not exceed the total of the votes exercisable by the shareholder orhis proxy.
3. Any alteration or correction to this form must be initialled by the signatory/ies.
4. Documentary evidence establishing the authority of a person signing this form of proxy in a representative capacity must beattached to this form unless previously recorded by the transfer secretaries of the company or waived by the chairman of theannual general meeting.
5. The completion and lodging of this form will not preclude the relevant shareholder from attending the annual general meeting andspeaking and voting in person thereat to the exclusion of any proxy appointed in terms hereof, should such shareholder wish todo so.
6. Forms of proxy must be lodged with or posted to the company’s transfer secretaries to be received not later than 24 hours (excludingSaturdays, Sundays and public holidays) before the time of the meeting.
7. This form of proxy expires after the conclusion of the meeting stated herein except at an adjournment of that meeting or at a polldemanded at such meeting.
Transfer Secretaries London Transfer SecretariesComputershare Investor Services 2004 (Pty) Limited Lloyds TSB Registrars70 Marshall Street Client ServicesJohannesburg The Causeway2001 Worthing(PO Box 61051 West SussexMarshalltown BN99 6DA2107)
148
IMPLATS ANNUAL REPORT 2004
FORM OF PROXY

AN
NU
AL
FIN
AN
CIA
L ST
ATEM
ENTS
149
IMPLATS ANNUAL REPORT 2004
IMPALA PLATINUM HOLDINGS LIMITED(Incorporated in the Republic of South Africa)(Registration number: 1957/001979/06)(Share code:IMP) (ISIN:ZAE000003554)(“Implats” or “the Company”)
For use in respect of the general meeting of the company to be held at 09:00 on Friday,29 October 2004 (the “annual general meeting”)to advise their CSDP or broker of their voting instructions on the proposed resolutions in the spaces provided below. However, shouldsuch members wish to attend the annual general meeting in person, then they will need to request their CSDP or broker to providethem with the necessary authority in terms of the custody agreement entered into between the dematerialised shareholder and theCSDP or broker.
I/We
of
being a member(s) or beneficial shareholder(s) of the company who has/have dematerialised my/our shares in Implats do herebyindicate in the spaces below to my/our CSDP/broker my/our voting instruction on the resolutions to be proposed at the annual generalmeeting of the company which will be in the Boardroom, 3rd Floor, Old Trafford 4, Isle of Houghton, Boundary Road, Houghton,Johannesburg at 09:00 on Friday, 29 October 2004, and each adjournment or postponement thereof.
Resolution Number of ordinary sharesResolutions For Against AbstainAppointment of directors 2
RSN DabengwaK MokheleNDB OrleynFJP RouxLC van Vught
Re-election of directors 3CE MarkusJM McMahonJV Roberts
Directors’ remuneration 4Unissued shares
general 5issue for cash 6
Special resolution – share buy-back 7
Insert in the relevant space above the number of shares held.
Signed at on 2004
Signature
Assisted by (where applicable)
Voting instruction form
ONLY FOR USE BY MEMBERS WHO HAVE DEMATERIALISEDTHEIR IMPLATS SHARES THROUGH STRATE

AN
NU
AL
FIN
AN
CIA
L ST
ATEM
ENTS
150
IMPLATS ANNUAL REPORT 2004
VOTING INSTRUCTION FORM
Notes1. Please indicate in the appropriate spaces overleaf the number of votes to be cast. Each share carries the right to one vote.
2. All the votes need not to be exercised neither need all votes be cast in the same way, but the total of the votes cast and in respectof which abstention is directed may not exceed the total of the votes exercisable.
3. Any alteration or correction made to this voting instruction form must be signed in full by the signatory/ies.
4. When there are joint owners of shares, all joint owners must sign this voting instruction form.
5. Completed voting instruction forms should be forwarded to the CDSP or broker through whom the Implats shares have beendematerialised. Members should contact their CDSP or broker with regard to the cut-off time for lodging of voting instruction forms.
6. This voting instruction form is only for use by members with dematerialised shareholdings via STRATE. Registered members andthose with shares held in CREST should use the form of proxy (white) attached.
THIS FORM IS TO BE LODGED WITH YOUR CDSP/BROKER

151
IMPLATS ANNUAL REPORT 2004 AN
NU
AL
FIN
AN
CIA
L ST
ATEM
ENTS
Shareholders‘ diaryAnnual general meeting Friday, 29 October 2004Final dividend declared August 2004. Paid - 27 September 2004Interim report release February 2005Interim dividend declared February 2005. Paid April 2005Financial year end 30 June 2005Annual report release August 2005
Analysis of shareholdings
Number of Number ofshareholders % shares (000’s) %
1 – 5 000 17 687 96.0 4 089 6.15 001 – 10 000 229 1.2 1 638 2.510 001 – 50 000 345 1.9 7 576 11.450 001 – 100 000 74 0.4 5 265 7.9100 001 – 1 000 000 68 0.4 20 673 31.0Over 1 000 000 13 0.1 27 380 41.1
18 416 100.0 66 621 100.0
Analysis of shareholdings
Number of Number ofshareholders % shares (000’s) %
Other companies 965 5.2 4 972 7.4Trust funds and investment companies 3 493 19.0 6 850 10.3Insurance companies 72 0.4 4 042 6.1Pension funds 949 5.1 19 236 28.9Individuals 12 594 68.4 1 858 2.8Banks 343 1.9 29 663 44.5
18 416 100.0 66 621 100.0
Shareholder information

152
IMPLATS ANNUAL REPORT 2004
Registered office and Secretary3rd Floor, Old Trafford 4Isle of HoughtonBoundary RoadHoughton 2198P.O. Box 61386Marshalltown2107Telephone: +27 (11) 481 3900Telefax: +27 (11) 484 0254email: [email protected]: http://www.implats.co.za
Group SecretaryRamun Mahadevey
London SecretariesProject Consultants Limited Walnut HouseWalnut GardensClaydonBanburyOxon, OX17 1NATelephone: +44 (1295) 69 0180Telefax : +44 (1295) 69 0182email: [email protected]
Public OfficerJohan van Deventer
Transfer SecretariesSouth AfricaComputershare Investor Services 2004 (Pty)Limited70 Marshall StreetJohannesburg 2001PO Box 61051Marshalltown 2107Telephone: +27 (11) 370 5000
United KingdomLloyds TSB RegistrarsClient ServicesThe CausewayWorthingWest SussexBN99 6DA
AuditorsPricewaterhouseCoopers Inc2 Eglin RoadSunninghillJohannesburg2157
Impala and Impala Refining ServicesHead office3rd Floor, Old Trafford 4Isle of HoughtonBoundary RoadHoughton 2198P.O. Box 61386Marshalltown2107Telephone: +27 (11) 481 3900Telefax: +27 (11) 484 0254
Impala Operations – RustenburgP.O. Box 5683Rustenburg 0300Telephone: +27 (14) 569 0000Telefax: +27 (14) 569 6548
Impala RefineriesP.O. Box 222,Springs 1560Telephone: +27 (11) 360 3111Telefax: +27 (11) 360 3680
Marula Platinum3rd Floor, Old Trafford 4, Isle of HoughtonBoundary Road, Houghton 2198PO Box 61386, Marshalltown 2107Telephone: +27 (11) 481 3900Telefax: +27 (11) 484 0254
Zimplats (Makwiro)Block B (Green), Emerald Park30 The Chase (West)Emerald Hill, Harare, Zimbabwe
Mimosa Platinum6th Floor, Pegasus HouseSamora Machel AvenueHarare, Zimbabwe
Representative in JapanImpala Platinum Japan LimitedUchisaiwaicho Daibiru, Room No. 7023-3 Uchisaiwaicho1-Chome, Chiyoda-kuTokyo JapanTelephone: +81 (3) 3504 0712Telefax: +81 (3) 3508 9199
Investors queries may be e-mailed to:[email protected]
Contact details and administration
AN
NU
AL
FIN
AN
CIA
L ST
ATEM
ENTS

153
IMPLATS ANNUAL REPORT 2004
In the interest of improving disclosure and providing a fuller account of the group’s non-financial activities, Implats will publish its Corporate Responsibility Report 2004 in October2004.This report will be available to stakeholders in a printed version, and on the company’swebsite in an interactive HTML format or as a downloadable pdf.
Shareholders and other stakeholders who wish to receive the printed version of this reportmay request this by calling or emailing Alan Snashall on +27 11 481 3900 [email protected] fax the following form to +27 11 484 0254.
Name:
Company:
Designation:
Tel:
Fax:
Email:
Postal address:
Interest in the company:
Corporate Responsibility Report 2004

This annual report covers the period 1 July 2003 to 30 June 2004. Information has beenprovided for comparative purposes for five years (FY2000 to FY2004). Additional statisticsgoing back to FY1997 are provided on the company’s website at www.implats.co.za.Information relating to the market has been provided per calendar year.
The report has been prepared in accordance with South African Statements of GenerallyAccepted Accounting Practice, International Financial Reporting Standards and in themanner required by the South African Companies Act and in line with the regulations of theJSE Securities Exchange South Africa (JSE). It has also taken into account the guidelines ofthe King Report 2002, the JSE Social Responsibility Index and the Global Reporting Initiative(GRI), particularly those applicable to Implats’ direct economic impact, environmental andhuman capital performance.
No significant changes have occurred in terms of the size, structure and operation of thegroup during the year under review,other than the sale of 83.2% stake in Barplats InvestmentsLimited. The transaction for the sale of a significant strategic interest (Implats’ stake inWestern Platinum Limited and Eastern Platinum Limited) is nearing finalisation and isreported on fully in this document.
Reporting of reserves and resources is in accordance with each company’s listingrequirements. Mineral Reserves and Mineral Resources for Implats’ South African operationsare reported in accordance with the principles and guidelines of the South African Code forReporting of Minerals Reserves and Mineral Resources (SAMREC Code). Both Zimplats andMimosa report Ore Reserves and Mineral Resources in accordance with the AustralasianCode for Reporting of Mineral Resources and Ore Reserves (JORC Code).Competent personsdefined by both the SAMREC and JORC codes have prepared, reviewed and signed off theMineral Reserves and Mineral Resources reported in this publication.
This annual report should be read in conjunction with the group’s Corporate ResponsibilityReport 2004. In the interests of good disclosure and to improve communication withshareholders, Implats publishes:
• The 2004 Annual Report in August 2004, coinciding with the release of the results for theyear-ended June 2004. The annual report is also available in interactive HTML anddownloadable pdf versions on the company’s website.
• The Corporate Responsibility Report in October 2004.This report will be posted to thoseshareholders who elect to receive it (response form on page 153 of this report). It willbe available on the company’s website and from the contacts detailed on page 152 ofthis report.
The statutory portions of this report on pages 84 to 143 have been audited by independentauditors PricewaterhouseCoopers. In addition, PricewaterhouseCoopers provided guidancein the development of the non-financial sections of both the Annual and CorporateResponsibility reports, drawing on, inter alia, its proprietary reporting framework,ValueReportingTM, and internationally recognized principles of reporting. Both reports areprepared by the company and are reviewed by the board.
Additional information on the group may be found on the company’s website or obtainedfrom the contact persons listed on page 152 of this report.
Produced by Russell and Associates
Report profile
Dollar, or $, refers to US Dollars unless specified. Numbers given in both SA Rands and Dollars have been
converted at the average exchange rate for the year under review or at year-end rates when relating to closing
balances.

ANNUAL REPORT 2004
IMPALA PLATINUM HOLDINGS LIMITED
W W W . I M P L A T S . C O . Z A
IMPALA PLATINUM
HOLDINGS LIMITED ANNUAL REPORT 2004