Impala Platinum Holdings Limited...
50
Impala Platinum Holdings Limited Annual results 14 September 2017
Transcript of Impala Platinum Holdings Limited...
Impala Platinum Holdings LimitedAnnual results14 September 2017
Certain statements contained in this presentation other than the statements of historical fact contain forward‐looking statements regardingImplats’ operations, economic performance or financial condition, including, without limitation, those concerning the economic outlook forthe platinum industry, expectations regarding metal prices, production, cash costs and other operating results, growth prospects and theoutlook of Implats’ operations, including the completion and commencement of commercial operations of certain of Implats’ exploration andproduction projects, its liquidity and capital resources and expenditure and the outcome and consequences of any pending litigation,regulatory approvals and/or legislative frameworks currently in the process of amendment, or any enforcement proceedings. AlthoughImplats believes that the expectations reflected in such forward‐looking statements are reasonable, no assurance can be given that suchexpectations will prove to be correct. Accordingly, results may differ materially from those set out in the forward‐looking statements as aresult of, among other factors, changes in economic and market conditions, success of business and operating initiatives, changes in theregulatory environment and other government actions, fluctuations in metal prices and exchange rates and business and operational riskmanagement. For a discussion on such factors, refer to the risk management section of the company’s Annual Report. Implats is not obligedto update publicly or release any revisions to these forward‐looking statements to reflect events or circumstances after the dates of theAnnual Report or to reflect the occurrence of unanticipated events. All subsequent written or oral forward‐looking statements attributable toImplats or any person acting on its behalf are qualified by the cautionary statements herein.
2
Forward looking statement
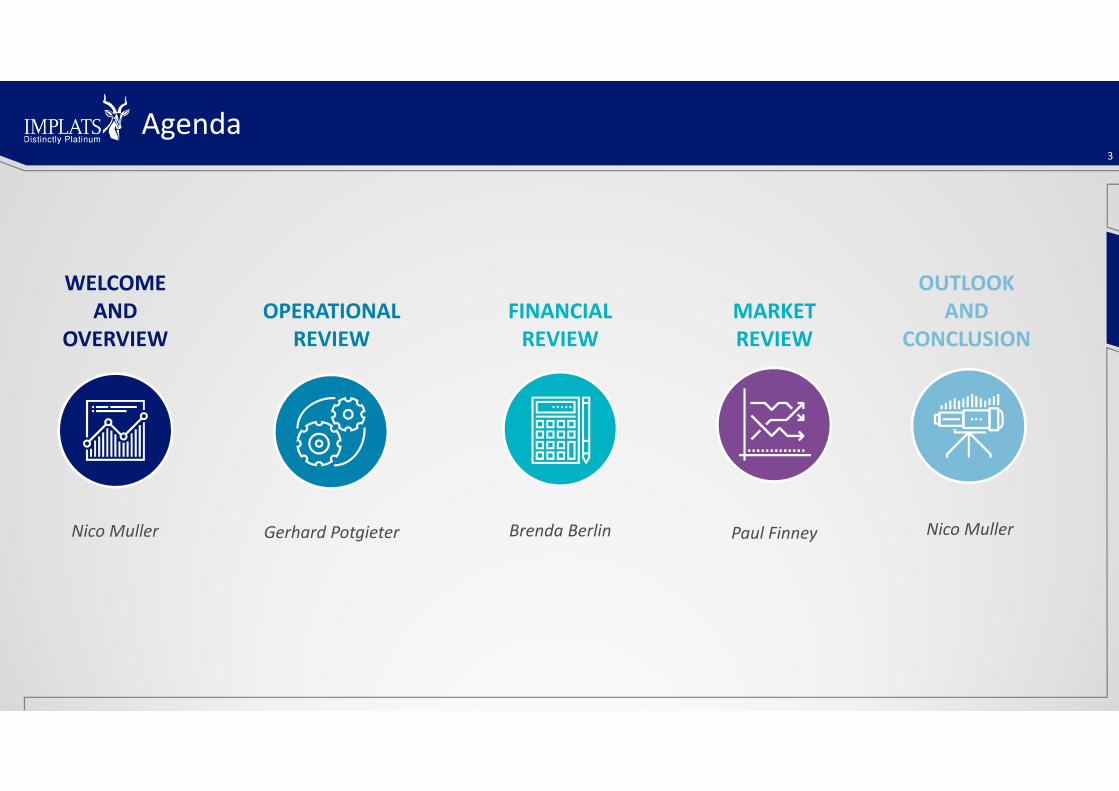
Agenda3
WELCOMEAND
OVERVIEWOPERATIONAL
REVIEWFINANCIAL REVIEW
Nico Muller Gerhard Potgieter Brenda Berlin
MARKET REVIEW
Paul Finney
OUTLOOK AND
CONCLUSION
Nico Muller
OVERVIEWNico Muller, CEO

Operating context5
SOCIO‐POLITICAL FRAMEWORK • Slowing economic growth• Growing unemployment and poverty• Rating downgrades• Increasing political and social tension
REGULATORY UNCERTAINTY• SA: New Mining Charter• Zimbabwe: 15% Export levy and security of tenure in Zimbabwe
• Strengthening DMR collaboration
INDUSTRY LANDSCAPE• Increased focus on mechanisation and
modernisation• Significant changes in ownership• Increasing pressure to suspend
loss‐making production
STAKEHOLDER EXPECTATIONS• Increased community activism• Increasing prioritisation of job security• High demands on wage growth remains• Social licence to operate key to sustainability
SUSTAINED LOW PRICE ENVIRONMENT• Near‐term metal prices remain weak• 65% PGM production operating at a loss• Reduced investment in new production• Long‐term PGM market fundamentals remain attractive OPERATING
ENVIRONMENT

Safety
5.80 6.105.27
6.495.92
2013 2014 2015 2016 2017
(PER
MILLION M
AN HOURS
WORK
ED)
LOST‐TIME INJURY FREQUENCY RATE
• Fatality rate decreased from previous year, but nine employees suffered fatal injuries
• Over the past five years, Implats has invested significantly in safety initiatives to eliminate these causes – continued focus on:• workplace design• effective leadership• responsible behaviour• an improvement in safety culture
• Zimplats achieved 365 days without a lost‐time injury• LTIFR improved 8.8% to 5.92 per million man hours
worked
6
Impala Rustenburg
Marula
Mimosa
LOCATION
7
11
Tramming & mobile
equipment
Fall of ground
Scraping operations
Material handling
CAUSES
1
2
3
3
9
4
7
11
9
2013 2014 2015 2016 2017
NUMBER OF FATALITIES
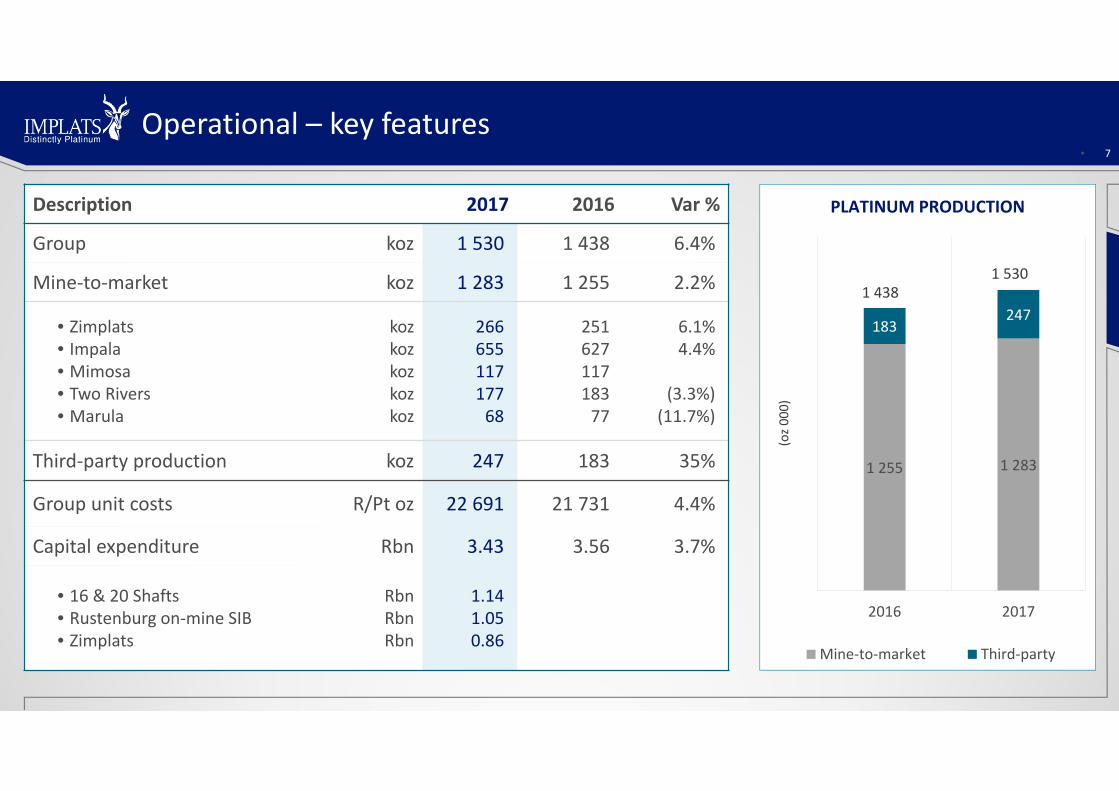
Operational – key features7
Description 2017 2016 Var %
Group koz 1 530 1 438 6.4%
Mine‐to‐market koz 1 283 1 255 2.2%
• Zimplats• Impala• Mimosa• Two Rivers• Marula
kozkozkozkozkoz
26665511717768
25162711718377
6.1%4.4%
(3.3%)(11.7%)
Third‐party production koz 247 183 35%
Group unit costs R/Pt oz 22 691 21 731 4.4%
Capital expenditure Rbn 3.43 3.56 3.7%
• 16 & 20 Shafts• Rustenburg on‐mine SIB• Zimplats
RbnRbnRbn
1.141.050.86
1 255 1 283
183247
2016 2017
Mine‐to‐market Third‐party
PLATINUM PRODUCTION
(oz00
0)
1 4381 530
• 7
Financial – key features
• Revenue increased 2.5% to R36.8 billion
• Cost of sales increased by 4.0% to R37.4 billion
• Decline in gross profit from R4 million to a loss of R529 million
• Weaker future PGM price expectations and lower production informed the impairment of the historical Royal Bafokeng royalty prepayment for equity in the 2007 empowerment transaction (carrying value of R10.2 billion)
• Basic headline loss of 137 cents per share
• No dividend declared
• Balance sheet remains strong• Gross cash of R7.8 billion• Unutilised facilities of R4.0 billion available until 2021• Issue of new convertible bond of R6.5 billion in May 2017
0
5 000
10 000
15 000
20 000
25 000
30 000
35 000
Two Riversin conce
Zimplats inmatte
Mimosa inconc
Impalarefined
Marula inconc
GroupRefined
Cash costs Stay in business capital Replacement capital
Expansion capital 2017 R/Pt oz sold
(R/Pt o
z)
COST OVERVIEW
8
2017 basket revenue R/Pt oz sold
Note: Two Rivers, Zimplats, Mimosa and Marula excludes IRS charges
• 8

OPERATIONAL REVIEWGerhard Potgieter, Group executive: Mining

Impala Merensky mine plan10
Business Plan 2018
ClosedOldMatureRamp‐up
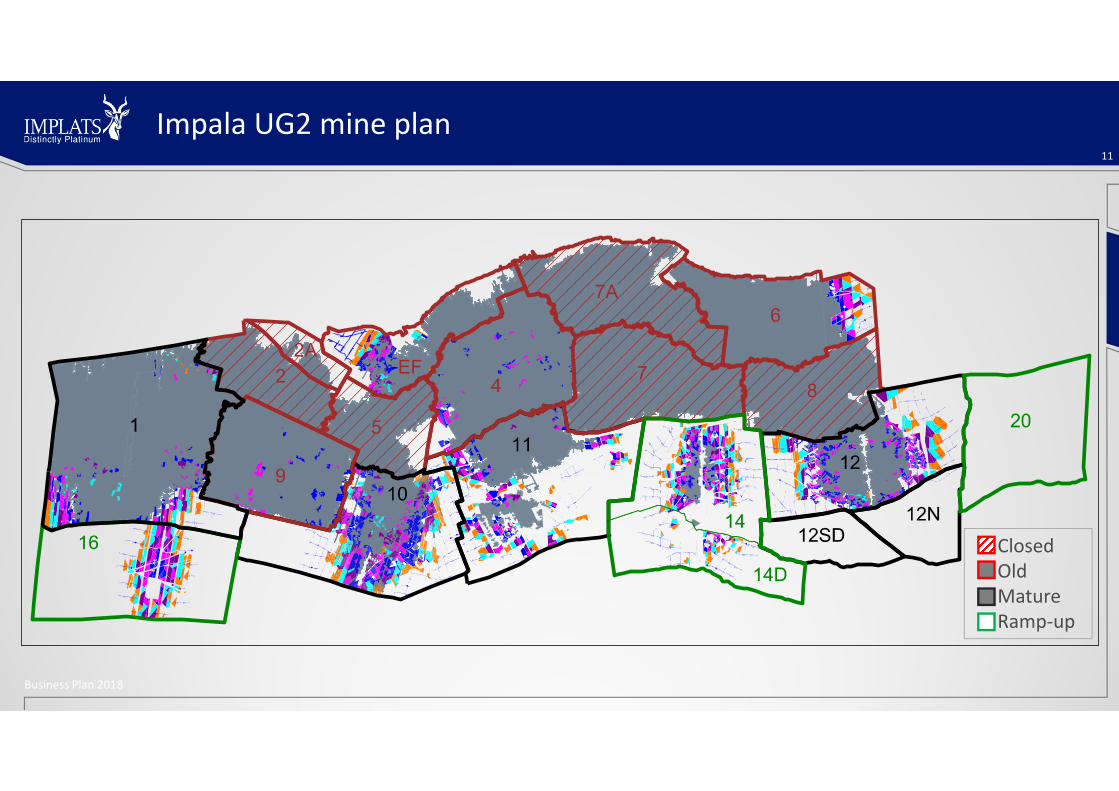
Impala UG2 mine plan11
Business Plan 2018
ClosedOldMatureRamp‐up
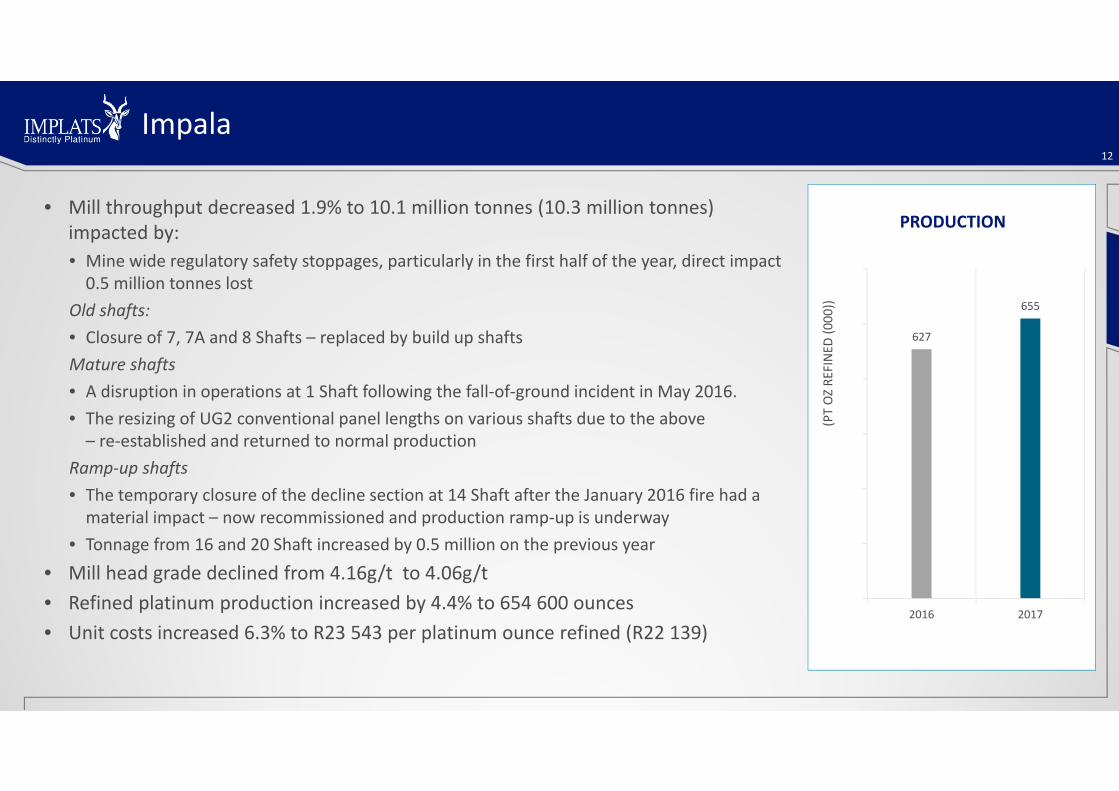
Impala
• Mill throughput decreased 1.9% to 10.1 million tonnes (10.3 million tonnes) impacted by:• Mine wide regulatory safety stoppages, particularly in the first half of the year, direct impact 0.5 million tonnes lost
Old shafts:• Closure of 7, 7A and 8 Shafts – replaced by build up shaftsMature shafts• A disruption in operations at 1 Shaft following the fall‐of‐ground incident in May 2016.• The resizing of UG2 conventional panel lengths on various shafts due to the above – re‐established and returned to normal production
Ramp‐up shafts• The temporary closure of the decline section at 14 Shaft after the January 2016 fire had a material impact – now recommissioned and production ramp‐up is underway
• Tonnage from 16 and 20 Shaft increased by 0.5 million on the previous year
• Mill head grade declined from 4.16g/t to 4.06g/t • Refined platinum production increased by 4.4% to 654 600 ounces• Unit costs increased 6.3% to R23 543 per platinum ounce refined (R22 139)
12
627
655
2016 2017
(PT OZ RE
FINED
(000
))
PRODUCTION

0
100
200
300
400
500
600
Q1 Q2 Q3 Q4 Q1 Q2 Q3 Q4
TONNES PER QUARTER (000)
2017 2018
Bringing 14 Shaft back13
• The fire in January 2016 destroyed 3.6 km of decline infrastructure
• No production was possible while the rehabilitation project (R418m) was carried out
• The 16 month programme completed safely, ahead of time and on budget
• Ramp‐up to return shaft complex to 1.9 mtpa has begunand is currently at 89% of intended production level
• Ramp‐up planned to be at full production by Q2 2018

16 Shaft Project Progress14
PROJECT PROGRESS 2017Planned
2017 Actual
2018planned
Completion pre‐review (%) 100 98 100
Completion post review (%) 86 86 92
PROGRESS TO COMPLETION
ProjectPlanned
Completed to date
Estimate as at 2018
Capital Development (m) 54 056 49 442 51 179
COST TO COMPLETION (Rm) Total
Approved Capital Pre‐review 6 931
Shaft Modifications 85
Contingency Ore‐pass & ore flow de‐congestion 395
Refrigeration 211
Team Build‐up and Indirects 317
Approved Capital Post‐review 7 939
Expenditure to date (6 796)
Remaining Capital to be spent 1 143
Additional tramming loopsaround the shaft
4th ore pass system
Main shaft Vent shaft
Completed infrastructuredevelopment

0
20
40
60
80
100
0
500
1 000
1 500
2 000
2 500
3 000
2014 2015 2016 2017 2018 2019 2020 2021 2022
Percen
tage of R
amp ‐u
p
Annu
al to
nnes
(000
)
Units Planned 2017 Actual 2017 Plan 2018 Plan 2020
Production tonnes hoisted ktpa 886 841 1 380 2 400
Platinum production kozs/a 58 53 75 150
Stoping teams in place at year end teams 56 47 75 140
Immediately mineable face m 1 278 1 451 2 100 3 000
15
16 shaft production build‐up
0
100
200
300
400
Q1 Q2 Q3 Q4 Q1 Q2 Q3 Q4
Prod
uctio
n(000 t)

20 Shaft progress in 201716
PROJECT PROGRESS 2017Planned
2017 Actual
2018planned
Completion pre‐review (%) 96 92 99
Completion post review (%) 88 88 93
Capital Development (m) 43 700 41 263 42 474
COST TO COMPLETION (Rm) Total
Approved Capital Pre‐review 8 086
Ore pass rehabilitation 54
Construction & equipment 151
Additional mining and Indirect costs 84
Approved Capital Post‐review 8 375
Expenditure to date (7 501)
Remaining Capital required 874
Capital development still to be done
Incline development Completed 22 to 18 level
Decline development completed 23 to 25 level
Main shaft Vent shaft

‐
20
40
60
80
100
0
400
800
1 200
1 600
2 000
2011 2012 2013 2014 2015 2016 2017 2018 2019 2020 2021 2022
Percen
t of R
amp up
Annu
al to
nnes
(000
)
17
20 Shaft production build‐up
0
100
200
300
Q1 Q2 Q3 Q4 Q1 Q2 Q3 Q4
Prod
uctio
n (000
t)
Units Planned 2017 Actual 2017 Plan 2018 Plan 2020
Production tonnes hoisted ktpa 1 080 919 1 200 1 600
Platinum production kozs/a 83 63 85 110
Stoping teams in place at year end teams 54 51 60 75
Immediately mineable face m 1 621 1 297 1 850 2 700
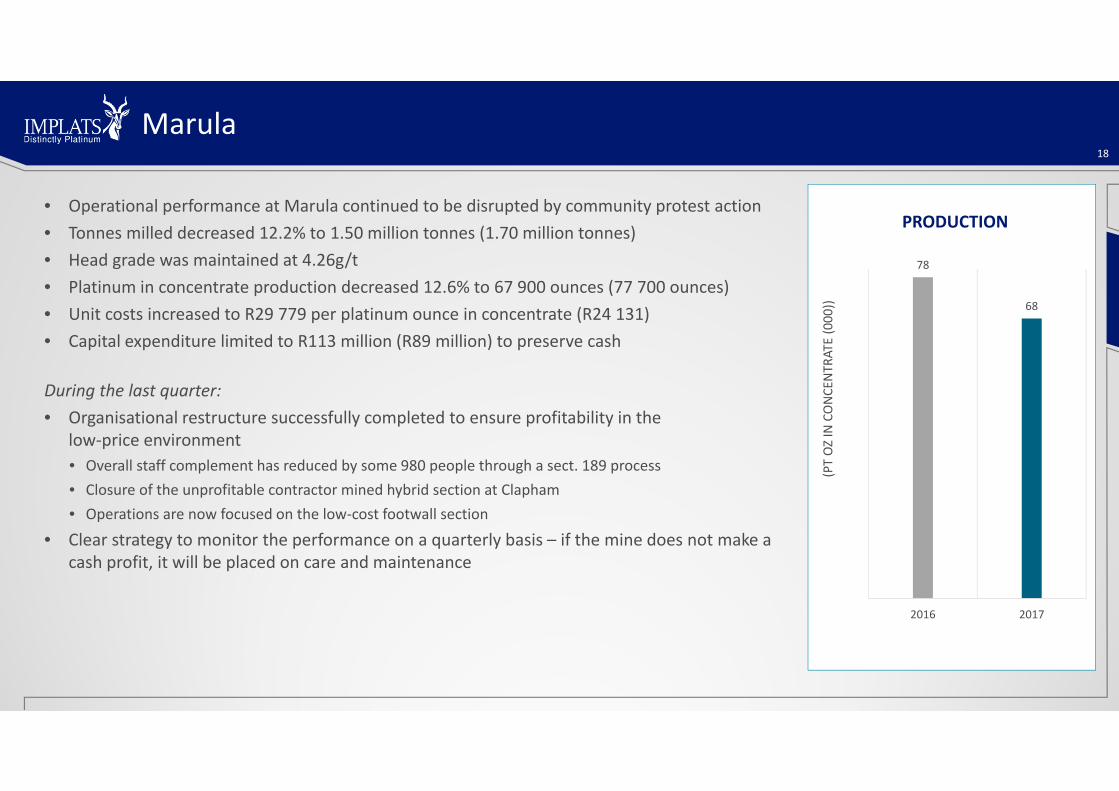
• Operational performance at Marula continued to be disrupted by community protest action• Tonnes milled decreased 12.2% to 1.50 million tonnes (1.70 million tonnes) • Head grade was maintained at 4.26g/t • Platinum in concentrate production decreased 12.6% to 67 900 ounces (77 700 ounces)• Unit costs increased to R29 779 per platinum ounce in concentrate (R24 131)• Capital expenditure limited to R113 million (R89 million) to preserve cash
During the last quarter:• Organisational restructure successfully completed to ensure profitability in the
low‐price environment• Overall staff complement has reduced by some 980 people through a sect. 189 process• Closure of the unprofitable contractor mined hybrid section at Clapham • Operations are now focused on the low‐cost footwall section
• Clear strategy to monitor the performance on a quarterly basis – if the mine does not make a cash profit, it will be placed on care and maintenance
Marula18
78
68
2016 2017
(PT OZ IN CONCE
NTR
ATE (000
))
PRODUCTION
18
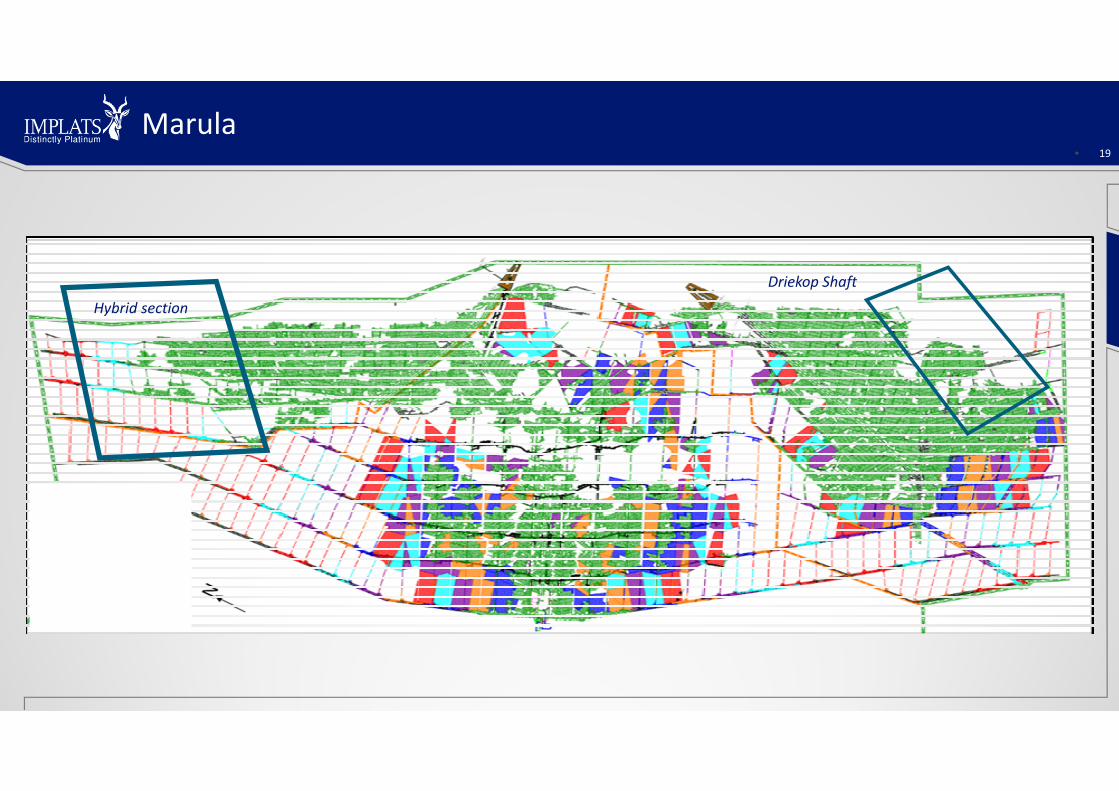
Marula
Hybrid section
Driekop Shaft
• 19
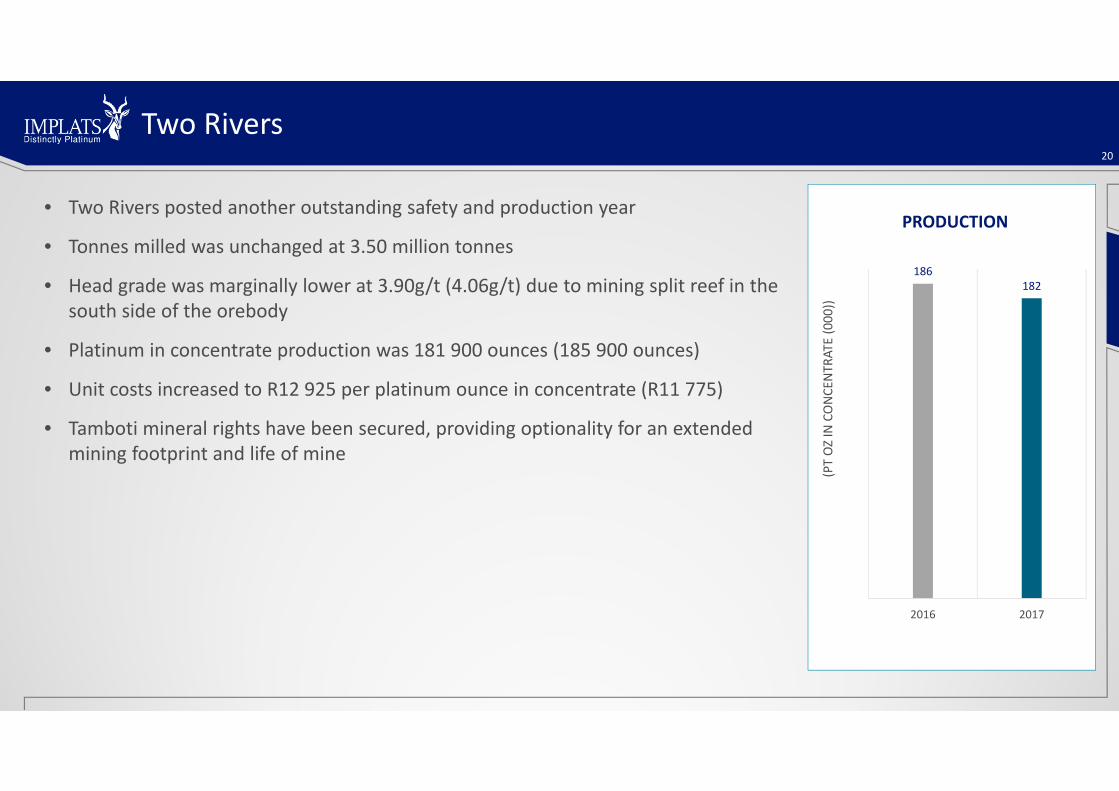
• Two Rivers posted another outstanding safety and production year
• Tonnes milled was unchanged at 3.50 million tonnes
• Head grade was marginally lower at 3.90g/t (4.06g/t) due to mining split reef in the south side of the orebody
• Platinum in concentrate production was 181 900 ounces (185 900 ounces)
• Unit costs increased to R12 925 per platinum ounce in concentrate (R11 775)
• Tamboti mineral rights have been secured, providing optionality for an extended mining footprint and life of mine
Two Rivers20
186182
2016 2017
(PT OZIN CONCE
NTR
ATE (000
))
PRODUCTION

Two Rivers21
Business Plan 2018
Tamboti

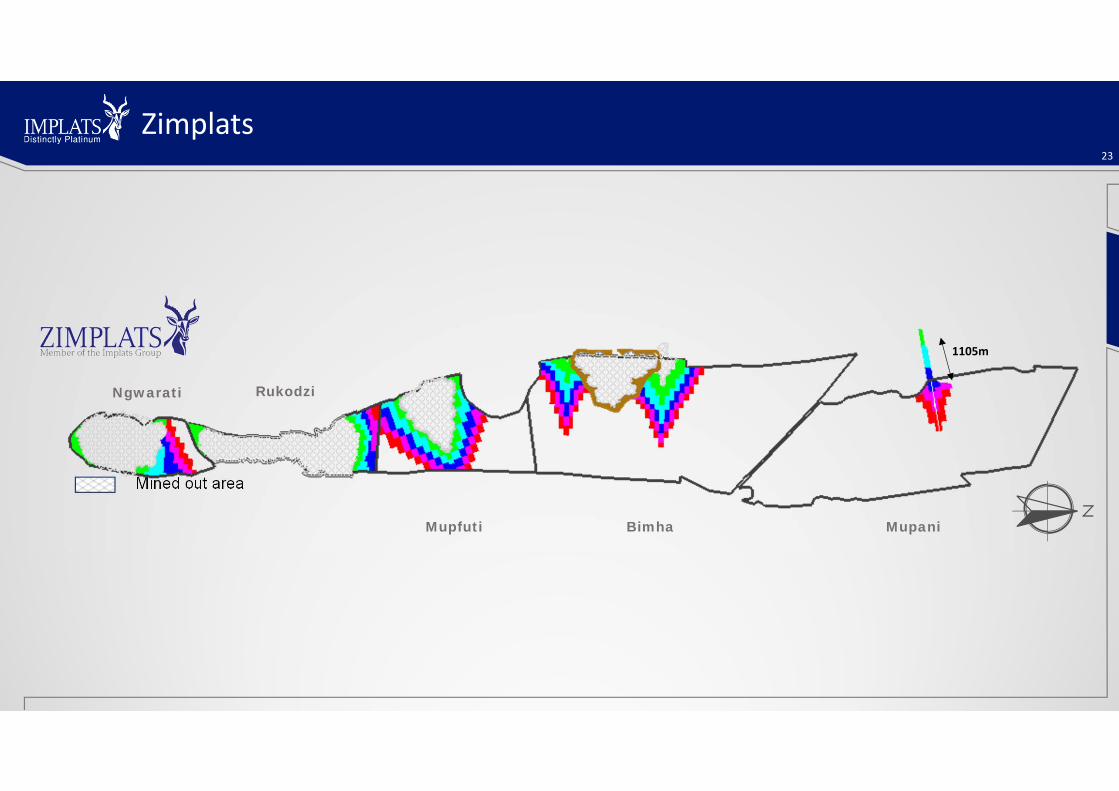
• All mining units sustained outstanding operational performances• Tonnes milled increased by 4.8% to 6.7 million tonnes (6.4 million) • Platinum in matte production (including concentrate sales to IRS) decreased 3.0%to 281 100 ounces (289 800 ounces*)*Stockpiled material was released in the previous year following a furnace outagein May 2015
• Redevelopment of the previously collapsed Bimha Mine is progressing well with full production still expected from April 2018
• Unit costs increased 10.5% to US$1 249 per platinum ounce in matte (US$1 130)
• The development of the replacement 2.2 million tonnes per annum Mupani mine was approved in November 2016• Total capital cost of US$264 million• US$11 million spent this year
• Implemented an employee share ownership trust holding 10% of Zimbabwe Platinum Mines (Private) Limited
• No further portals required until 2026, medium term cash generated towards dividends
Zimplats22
290281
2016 2017
(PT OZ IN M
ATTE (0
00))
PRODUCTION
23
Mined out area
Ngwarati Rukodzi
BimhaMupfuti Mupani
1105m
Zimplats

• Delivered another excellent operational performance
• Tonnes milled improved 3.3% to 2.73 million tonnes (2.64 million)
• Head grade was maintained at 3.83g/t
• Platinum in concentrate production increased to 121 600 ounces (119 700 ounces)
• Unit costs increased in dollar terms to US$1 511 per platinum ounce in concentrate (US$1 463)
• Deferment of the 15% export levy on un‐beneficiated platinum to 1 January 2018
• Mimosa continues to consult with the Government of Zimbabwe in this regard
• Both the proposed smelter and the 15% export levy are unaffordable given current basket prices and could result in mine closure
Mimosa24
120122
2016 2017
(PT OZIN CONCE
NTR
ATE (000
))
PRODUCTION

25
Business Plan 2018
Mimosa

IRS
• IRS remains a strategic competitive advantage for Implats• Efficiently leverages Impala’s infrastructure• Contributes significantly to the bottom line, despite low PGM prices
• IRS contributed R1.3 billion to Group headline earnings• Production increased by 7.8% to 875 200 ounces of
platinum (811 500 ounces)• Platinum production from mine‐to‐market operations was maintained at 628 500 ounces
• Third‐party purchases and toll volumes increased by 35%to 246 700 platinum ounces
26
(Pt oz 000) 2017 2016
Zimplats 266.4 251.0
Marula 68.1 77.1
Mimosa 116.6 117.0
Two Rivers 177.4 183.4
Mine to market operations 628.5 628.6
Third party purchases and toll 246.7 182.9
Total 875.2 811.5

Operational conclusions
• Assessment underway• Old• Mature target cash positive • Ramp‐up
• Rebalance labour complement• Complete 16 & 20 shafts only• Keep 17 shaft on care and maintenance
• No disruptions – sustain operational run rates• Engage communities• Cash positive or close
• Steady state low cost producer• Dividend paying
• Build Mupani• Next portal in 2028• Return cash to shareholders
• Steady state low cost producer• Dividend paying• Affordability of beneficiation
• Cash generative• Leverage refining intellectual capital
27
Impala
Marula
Two Rivers
Zimplats
Mimosa
IRS

FINANCIAL REVIEWBrenda Berlin, CFO

Income statement
• Revenue increased due to higher metal prices
• Cost of sales contained at an increase of 4%
• Business interruption proceeds of R657 million for 14 shaft fire incident
• Impairment – Prepaid royalty R10.2 billion
• Group unit cost up 4% to R22 691 per platinum ounce
R million Jun-2017 Jun-2016 % change
Sales 36 841 35 932 3
Cost of sales (37 370) (35 928) (4)
Gross profit (529) 4 (100)
Gross margin (%) (1.4) - (100)
Loss from operations (224) (63)
Impairment (10 229) (307)
Other (235) (230)
Loss before tax (10 688) (600)
Income tax credit 2 590 557
Loss for the year (8 098) (43)
HEPS (cps) (137) 12
Group unit cost (R/Ptoz) 22 691 21 731 (4)
29
Sales revenue
• Revenue up by R909 million:• Increased levels of production offset by
higher stock levels gave negative volume variance
• Higher dollar metal prices• Stronger exchange rate
35 932 35 303 35 30336 841 36 841
6291 930
3 468
Jun ‐2016 Volume var iance Meta l pr i ces Exchange ra te Jun ‐2017
30
+R1 538 million
(Rm)

Cost of sales movement
• Cost of sales increased by 4%year on year:• Higher volumes and inflation
• Depreciation charge
35 928 35 928
37 747 37 804 37 804 37 554 37 370 37 370
10633 184
1 819
67 383
Jun‐2016 Cash cost Share basedpayments
Chromeoperations
Depreciation Metalspurchased
Change in stock Jun‐2017
31
(Rm)

Headline earnings movement
• Higher operating income: Insurance claim on 14 Shaft
• Exchange gains vs losses in prior year
• Higher tax expense: Zimplats and IRS
• Headline earnings down by R1.07 billionto a loss of R983 million 83
533
1 147
(983)
444
45
703
234
722
Jun‐2016 Gross profit Other operatinginc/exp
Royalties Exchangegains/loss
Share of profitfrom associates
Sundry Taxation Jun‐2017
32
(Rm)
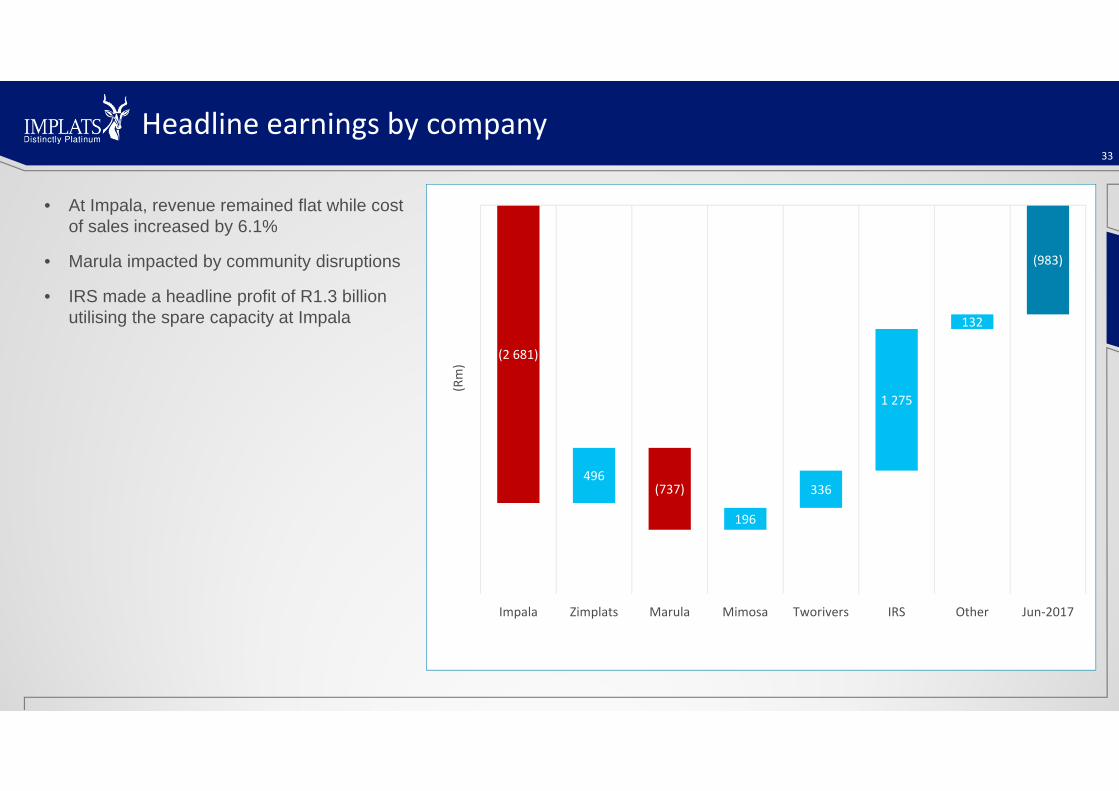
Headline earnings by company
• At Impala, revenue remained flat while cost of sales increased by 6.1%
• Marula impacted by community disruptions
• IRS made a headline profit of R1.3 billion utilising the spare capacity at Impala ‐2185 ‐2185
‐2726‐2390
‐1115 ‐983 (983)
496
196
336
1 275
132
(2 681)
(737)
Impala Zimplats Marula Mimosa Tworivers IRS Other Jun‐2017
33
(Rm)

Movement in gross cash position
• New convertible bond issue R6.5 billion
• Total capital expenditure of R3.4 billion includes:
• 16 and 20 Shafts spend which amounted to R1.1 billion
6 788 6 788
4 369 4 369
6 782
7 839
1 013
2 413
1 057
3 432
Jun‐2016 Net operatingcash
Capital Net bond cash Other cash Jun‐2017
34
(Rm)
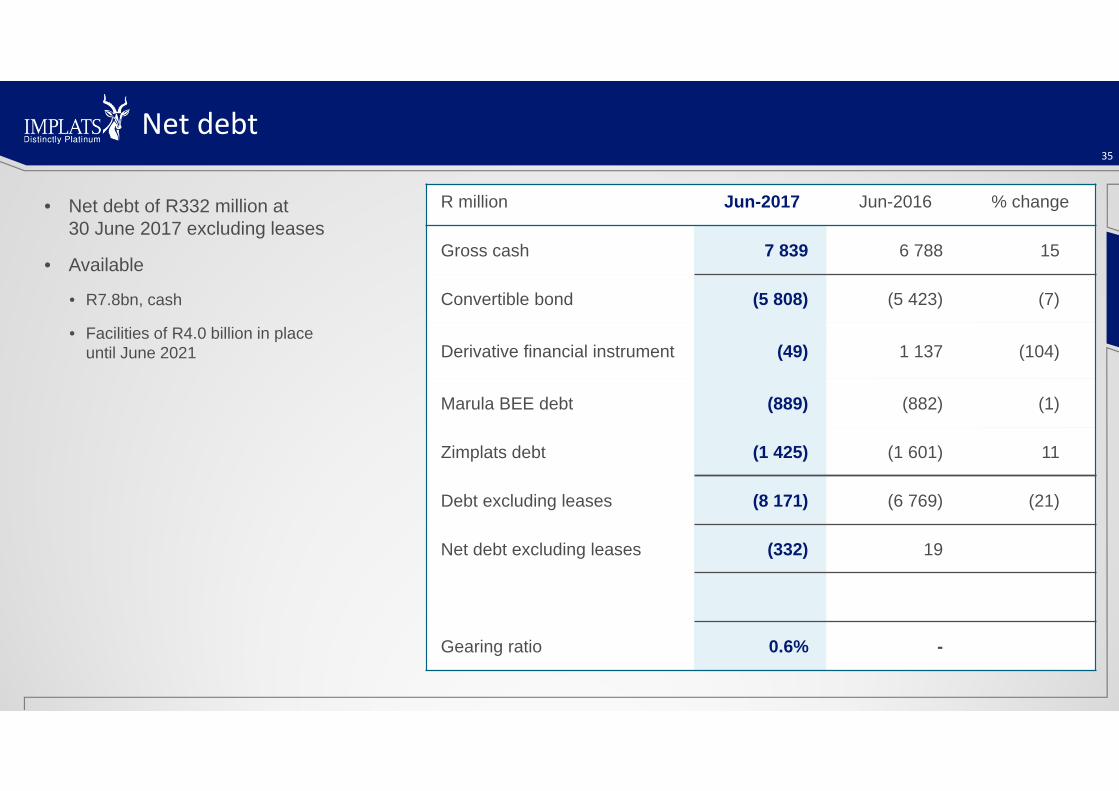
Net debt
• Net debt of R332 million at30 June 2017 excluding leases
• Available
• R7.8bn, cash
• Facilities of R4.0 billion in placeuntil June 2021
R million Jun-2017 Jun-2016 % change
Gross cash 7 839 6 788 15
Convertible bond (5 808) (5 423) (7)
Derivative financial instrument (49) 1 137 (104)
Marula BEE debt (889) (882) (1)
Zimplats debt (1 425) (1 601) 11
Debt excluding leases (8 171) (6 769) (21)
Net debt excluding leases (332) 19
Gearing ratio 0.6% -
35

MARKET REVIEWPaul Finney, Group Executive – Refining and Marketing

Overview
The global macro economic picture is slowly improving:• Resilient Chinese economy• IMF baseline projection of 3.5% global growth in 2017However risks remain:• Brexit• US policyPGM prices (U$)• 2017 average prices, y‐o‐y, were 4% higher for platinum,
27% for palladium and 13% for rhodium• The platinum price was weighed down by both anti‐diesel
sentiment and Chinese jewellery performance• Palladium and rhodium rallied on the back of fundamental
auto demand• The Rand strengthened by 14%, eroding some of the
$ price gains• Rand basket 2017 ended on average higher by 8%
at R22 151
37
Source: IMF, LBMA and Impala Platinum analysis
0.00
2.00
4.00
6.00
8.00
10.00
12.00
14.00
16.00
18.00
450
550
650
750
850
950
1 050
1 150
1 250
Jul‐2015 Jun‐2016 Jun‐2017
R:US$
US $ pe
r oun
cePt LBMA PM Pd LBMA PM Rh NYDM R:US$

2017: First half reflects a mixed performance
• North America declined by 2.3% but with higher sales of larger‐engine vehicles. Inventories a concern
• Western Europe increased by 3,7%
• China overcame increased taxes, up 3,8%
• Japan up 9.2%, particularly hybrids and SUV’s
Our 2017 global light duty sales forecast is further growth of 1%
Light‐duty vehicle sales38
Source: Reuters , CAAM, LMC, Nikkei Sangyo and Implats analysis
World Light‐duty vehicle sales by region – 2017 forecast
2016
(millions)
2017(est.)
(millions)
2017Est. Growth
(%)North America 17.51 17.10 (2.4)
Western Europe 13.95 14.23 2.0
China 24.38 25.60 5.0
Japan 4.97 5.00 0.6
Rest of the World 32.40 32.30 (0.4)
93.20 94.22 1.0

Automotive Markets
Increasing anti‐diesel sentiment has resulted in a further decline in diesel’s share of the Western European market to 45% in 2017
• Despite this, automotive platinum demand recorded near record highs for Q1 2017
• Growth in heavy duty diesel remains strong
Battery electric vehicles (BEV) being promoted by OEM’s to achieve CO2 compliance in 2020
• Governments are supportive of BEV’s for both CO2 and NOxreduction
• Forecasts are still only for 5% BEV market share by 2025
Hybrids are demonstrating faster consumer acceptance than pure batteryHigher PGM‐loaded diesels will remain an important part of the fleet mix for CO2 compliance
39
Source: Reuters , WPIC and Implats analysis
50.1%50.0%
48.9% 48.9%
46.6%45.4%45.1% 45.5%
46.1%45.1%
47.6%48.2%
0%
2%
4%
6%
8%
10%
40%
43%
46%
49%
52%
55%
Q1-16 Q2-16 Q3-16 Q4-16 Q1-17 Q2-17
Mar
ket s
hare
Diesel Gasoline HEVs / mild hybrids (rhs) BEVs (rhs) PHEVs (rhs)
Western European Light Duty Market Share

The threat of battery electric vehicles is overstated, in our view, for the foreseeable future
• Limited market penetration is forecast. (Range, re‐charge, price, re‐sale are all current valid concerns)
• The BEV target segment is both small and mid‐size vehicles – the impact will be primarily on palladium
• Reliant currently on a majority of coal‐fired power generation, not a holistic solution. Renewable energy is some time off
• The vehicle fleet will see more electrification but with a greater uptake of hybrids
• Fuel cell vehicles are the long‐term sustainable solution to both CO2 and NOx. Hydrogen provides the sustainable storage solution between renewable energy generation and consumption
• Groups such as the “Hydrogen Alliance” are adding momentum to the hydrogen economy
• We are committed to developing fuel cell applications
40
Battery electric vehicles

41
2016 global demand declined by 117 000 platinum ounces (‐4%)• China: ‐8.3%
• Challenged by changing consumer tastes• India: +11.4%
• Evara and PDOL successes overcame challenges of strike, floods and demonetisation• Japan: +2%
• Expansion in the non‐bridal category, increased popularity of precious metal long chain necklaces• USA: +5.4%
• Platinum designers and manufacturers are seeing a steady increase in their bridal business
2017 outlook• China : ‐5%
• Opportunities in gem‐set, bridal, branded collections• India : +25%
• Market recovering quickly from demonetisation. PGI programmes recording excellent growth. • Japan: +2%
• Legacy programmes and export market being developed• US : +6%
• Platinum benefitting from low pricing differential to Gold
2017 global retail demand forecast shows marginal (‐1%) reduction in demand
Source: PGI Consumer Retail Data.Chinese New Hero “ Dandelion” collection
Platinum jewellery
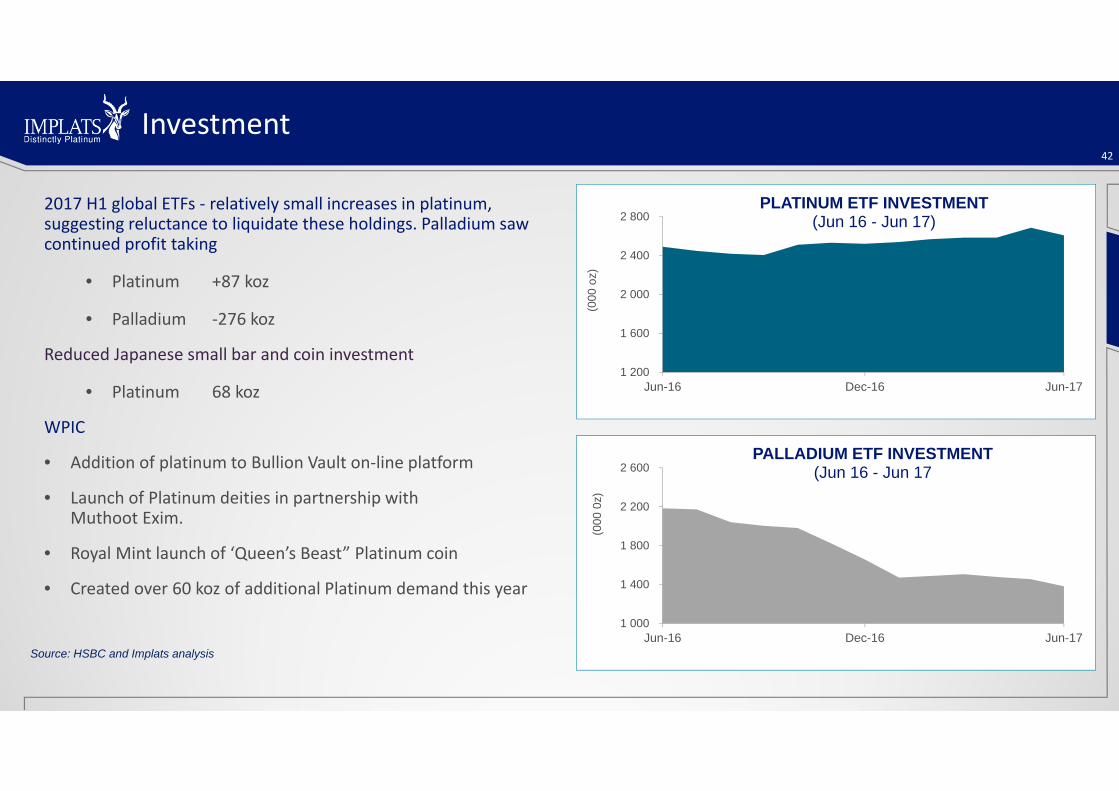
Investment
2017 H1 global ETFs ‐ relatively small increases in platinum, suggesting reluctance to liquidate these holdings. Palladium saw continued profit taking
• Platinum +87 koz
• Palladium ‐276 koz
Reduced Japanese small bar and coin investment
• Platinum 68 koz
WPIC
• Addition of platinum to Bullion Vault on‐line platform
• Launch of Platinum deities in partnership with Muthoot Exim.
• Royal Mint launch of ‘Queen’s Beast” Platinum coin
• Created over 60 koz of additional Platinum demand this year
42
Source: HSBC and Implats analysis
1 200
1 600
2 000
2 400
2 800
Jun-16 Dec-16 Jun-17
(000
oz)
PLATINUM ETF INVESTMENT (Jun 16 - Jun 17)
1 000
1 400
1 800
2 200
2 600
Jun-16 Dec-16 Jun-17
(000
0z)
PALLADIUM ETF INVESTMENT (Jun 16 - Jun 17

43
2017 platinum fundamental deficits show large contraction
Automotive ‐0.2%
Jewellery ‐1.0%
Industrial +3,2%
Relatively flat primary and secondary supply
2017 palladium to remain in fundamental deficit
Automotive +1,6%
Industrial ‐0.6%
Continued autocatalyst preference of Pd over Pt
Primary and secondary supply +6.1%
2017 rhodium to remain in small fundamental surplusIncluding Investment / ETF Movements
‐740
‐480‐4
50
‐400
2016 2017
Pt Pd(oz0
00)
SUPPLY/DEMAND DEFICITS
Supply and demand

• Whilst we see a relatively balanced platinum market over the next year or two, the medium to long term fundamentals for platinum are stronger
• There remains further upside for platinum automotive demand
• Back‐substitution into gasoline systems as palladium deficits continue
• Potential increase in use of lean NOx traps in diesel systems for real driving emissions testing.
• Steady growth in both SUV and heavy duty markets
• Electrification ‐ consumer preference for hybrids rather than BEV’s
• The platinum jewellery market is stabilising, but needs further stimulus to revert to growth.
• Industrial demand will show steady growth in line with global GDP
• Current prices are constraining both primary and secondary supply
• Palladium and rhodium automotive demand will remain healthy, driven by both strong vehicle sales and tightening emissions legislation
44
The PGM market outlook
CONCLUSION and OUTLOOKNico Muller, CEO

Market conditions• Near‐term metal prices remain weak, with increased longer term PGM supply/demand uncertainty (new normal)• Long‐term PGM market fundamentals remain attractive
Business position• Group returned a financial loss in 2017• Rustenburg and Marula remained loss making• Implats is moving up the cost‐curve• Growth projects progressing, but slower than planned
Key business objectives• Shareholder returns is the number one priority• Short‐term focus on profitability
• Value above volume (not driven by output commitments)• No support for loss making production• Operational excellence, increased productivity and reduced costs• Strategic review of Impala Rustenburg• Cross‐boundary opportunities
• Over the longer‐term, develop strategic optionality and re‐balance the portfolio
Key considerations46

Priority Areas
Turnaround Impala
Rustenburg
Decisive MarulaStrategy
Increase Organisational Effectiveness
Develop Strategic Agility
Maintain Social
Licence to Operate
• Right‐size Impala Rustenburg• Optimise the operating model• Strengthen the leadership• Improve organisational effectiveness and performance orientation
• Increase productivity• Reduce costs • Deliver growth projects
• Define clear performance expectations• Reduce operational disruptions• Improve productivity• Meet profitability targets or suspend operations
• Prioritise shareholder returns• Delegate authority and accountability• Improve performance orientation• Focus on performance management• Prioritise the strategic HR role in the organisation
• Act as a responsible corporate citizenship in the best interest of all stakeholders
• Maintain responsible environmental stewardship
• Minimise harm to employees health and safety
• Rebalance portfolio• Focus on shallower orebodies that favour mechanised mining
• Reduce future dependence on high cost deep conventional mining operations
• Improve strategic optionality at Impala Rustenburg
• Prioritise profitability• Eliminate loss making production• Review Impala Rustenburg investment case• Disciplined capital allocation policies• Maintain strong balance sheet
Priority focus areas
Capital Allocation and Cash
Management
47

Outlook – Impala Rustenburg
• Production guidance of between 680 000 and 720 000 ounces of platinum in 2018
• Longer term guidance will be subject to the strategic review currently under way and/or restructuring that may be required to return the operation to profitability
• Old shafts (E/F, 4, 6 and 9 Shafts)• Will reduce to approximately 100 000 platinum ounces in 2018 and sustain
approximately 50 000 ounces thereafter• Key focus – harvest and extend life
• Mature shafts (1, 10, 11 and 12 Shafts)• Will grow to approximately 330 000 platinum ounces in 2018 and sustain
approximately 300 000 platinum ounces into the future • Key focus – improve efficiencies and optimise shaft capacity
• Ramp‐up shafts (14, 16 and 20 Shafts)• Will grow to approximately 270 000 platinum ounces in 2018 and support some
400 000 ounces longer term (310 000 ounces from 16 and 20 shafts at full capacity)• Key focus – grow and sustain low cost future production
• Capital expenditure• Will be contained below R2.6 billion in 2018• The 17 Shaft replacement project deferred ‐ dependent on significantly improved
PGM price environment
48
0
100
200
300
400
FY16 FY17 FY18 FY19 FY20 FY21 FY22
Platinum
koz
Ramp‐up shafts
0
100
200
300
400
FY16 FY17 FY18 FY19 FY20 FY21 FY22
Platinum
koz
Mature shafts
0
100
200
300
400
0 0 0 0 0 0 0
Platinum
koz
Old shafts
0
100
200
300
400
FY16 FY17 FY18 FY19 FY20 FY21 FY22
Platinum
koz
Old shafts
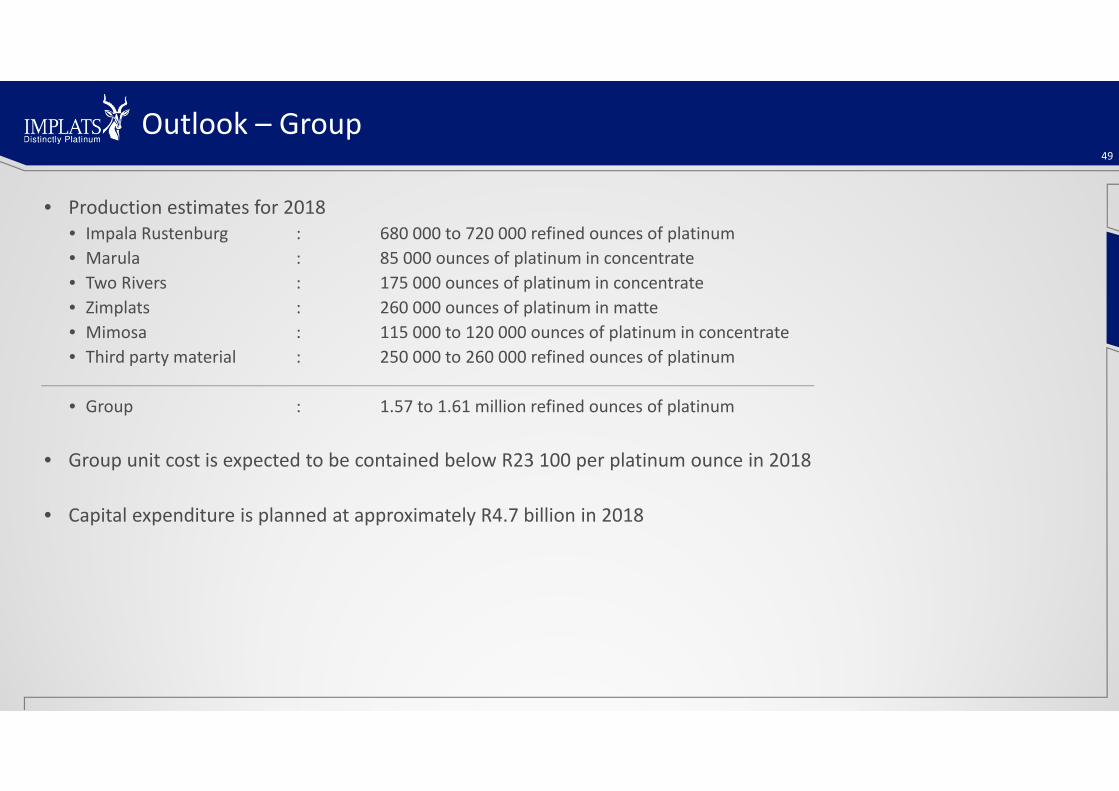
• Production estimates for 2018• Impala Rustenburg : 680 000 to 720 000 refined ounces of platinum • Marula : 85 000 ounces of platinum in concentrate• Two Rivers : 175 000 ounces of platinum in concentrate• Zimplats : 260 000 ounces of platinum in matte• Mimosa : 115 000 to 120 000 ounces of platinum in concentrate• Third party material : 250 000 to 260 000 refined ounces of platinum
• Group : 1.57 to 1.61 million refined ounces of platinum
• Group unit cost is expected to be contained below R23 100 per platinum ounce in 2018
• Capital expenditure is planned at approximately R4.7 billion in 2018
49
Outlook – Group

Impala Platinum Holdings LimitedAnnual results14 September 2017