
ANNUAL REPORT 2001 - Ramirent · ANNUAL REPORT 2001. ... Ramirent is the largest company in Finland...
52
ANNUAL REPORT 2001
-
Upload
nguyendiep -
Category
Documents
-
view
213 -
download
0
Transcript of ANNUAL REPORT 2001 - Ramirent · ANNUAL REPORT 2001. ... Ramirent is the largest company in Finland...

A N N U A L R E P O R T 2 0 0 1

Ramirent Plc has in Finland
a network of over 90 outlets
and in Estonia, Latvia, Lithuania, Poland
and Russia in total 28 outlets.
St. Petersburg
Tallinn
Riga
Vilnius
Szczecin
PoznanWarsaw
WroclawKatowice
Moscow
Cracow
Klaipeda
Kaunas
Ventspils
PärnuKuressaare
Gdynia

- 1 -
MAP
PARENT COMPANY INCOME STATEMENT 21
CONSOLIDATED CASH FLOW STATEMENT 20
CONSOLIDATED BALANCE SHEET 19
CONSOLIDATED INCOME STATEMENT 17
RAMIRENT IN BRIEF 3
CEO’S REVIEW 4
DOMESTIC PRODUCT LINES AND SUBSIDIARIES 7
ORGANIZATION AND OPERATING STRUCTURES 8
DOMESTIC OPERATIONS 9
INTERNATIONAL OPERATIONS 12
BOARD OF DIRECTORS’ REPORT 15
PARENT COMPANY BALANCE SHEET 22
PARENT COMPANY CASH FLOW STATEMENT 24
NOTES 25
KEY FIGURES 39
BOARD OF DIRECTORS’ PROPOSAL 40
AUDITORS’ REPORT 41
CORPORATE GOVERNANCE AND MANAGEMENT 43
SHARE TURNOVER AND PERFORMANCE (MONTHLY) 44
OUTLET NETWORK 45

- 2 -
RENOVATING SITE KALLIO CHURCHIN HELSINKI 1998-2002

- 3 -
Ramirent is the largest company in Finland renting machinery andequipment for construction and industry. Ramirent has the mostextensive rental fleet in the Finnish market. With the exception ofcontracting machinery (earthmoving machines, mobile cranes, etc.)it provides customers with all the machinery and equipment used onconstruction sites, ranging from tower cranes to drills.
The Ramirent Group’s core product lines are Small Machinery,Equipment and Personnel Hoists, Scaffolding and Weather Covers,Formwork and Supporting Equipment, Portable Spacial Units andContainers and Tower Cranes and Hoists. The Group also offers relatedplanning, erection, transportation and advisory services. In addition toits rental operations, Ramirent is also involved in the technical trade,and in this capacity imports and markets key construction machinesand equipment.
The Group’s main customer segments are construction companies,installation companies, industrial plants, shipyards, national and localauthorities, and private persons. The Group has some 20,000customers.
Ramirent has a network of over 90 rental outlets throughout Finland,most of them owned by the company and the remainder being dealeroutlets. Ramirent also owns 65% of Ramirent Europe Oy which,through its subsidiaries, rents out construction machinery andequipment in Russia, Estonia, Latvia, Lithuania and Poland. RamirentEurope currently has a network of 28 rental outlets in these countries.
RAMIRENT IN BRIEF
Key figures
Net sales and other operating income, € millionProfit before extraordinary items, € millionEarnings per share, €Return on investment, %Personnel 31.12.
68.5
11.5
1.89
25.3
629
54.0
11.4
1.96
32.4
524
37.7
7.7
1.44
29.2
317
35.3
7.6
1.52
32.2
322
2001 2000 1999 1998
29.1
5.5
1.17
28.3
291
1997

- 4 -
REVIEW BY THE PRESIDENT AND CEO
Review of 2001
Construction growth slowed considerably inFinland in 2001. New construction evendeclined slightly, although this was offset bygrowth in renovation work which exceeded thatof the previous year. The demand for rental fleetat shipyards and for industrial maintenancecontinued to increase in Finland in the yearunder review.
Construction picked up in Russia and theBaltic countries in 2001, but decreased by 10%in Poland despite expectations to the contrary.
2001 was the second year of operations forthe Ramirent Group. The Group consists of the100%-owned subsidiaries, Rami-Cranes Oy,Teline-Rami Oy, and Uudenmaan TelineykkösetOy, and the 65%-owned Ramirent Europe Oy,which has subsidiaries in Russia, Estonia,Latvia, Lithuania and Poland. In addition, theGroup includes the 100%-owned Hungariansubsidiary, Ramirent Hungary Bérleti Kft.,established at the end of 2001.
The Group’s rental business continued togrow strongly in Finland and abroad during theyear and the net sales targets were met. Themajor part of net sales growth came frominternational operations (Russia, Poland,Estonia, Latvia, Lithuania), which grew by103% compared with the previous year.Operations in Finland grew by 17%.The growth in Finland took place above all inthe scaffolding business, which increased by upto 84%. The portable spacial units andcontainers product line grew by 9% and smallmachinery rental by 4%. On the other hand, theformwork and supporting equipment productline which is dependent on new constructionremained at the previous year’s level, while thetower cranes business decreased by 29%.
The Group’s operating margin increased by15%, operating profit by 7% and profit beforeextraordinary items, appropriations and taxes by1%. Profit improvement was hindered duringthe year under review by the active investmentsmade in international operations. In particular,the investments in Poland, where operationsproper began only at the end of 2000 and thenumber of outlets was expanded to 11, burdenedthe profit of international operations in 2001.
In accordance with the Group’s growthstrategy, new outlets were opened in Finlandand abroad, acquisitions were made in Polandand Latvia, and active investments were madein rental fleet. Altogether, the Group has anetwork of over 90 outlets in Finland and 28outlets in Estonia, Latvia, Lithuania, Poland,Russia and Hungary. The Finnish scaffoldingand weather covers product line was transferredfrom the parent company on January 1, 2001to form Teline-Rami Oy, and thereafter theGroup’s Finnish scaffolding business wasconducted via Teline-Rami Oy and UudenmaanTelineykköset Oy. The scaffolding rentalbusiness also exploited Ramirent’s network ofoutlets.
On March 8, 2001, an extraordinary generalmeeting of A-Rakennusmies Oyj decided torename the company Ramirent Plc, and thisname was entered in the trade register on March30, 2001. A-Rakennusmies East Oy was alsorenamed in line with Group practice to becomeRamirent Europe Oy. Ramirent Europe Oy

- 5 -
acquired the whole stock of Mastrent Sp z o.o,a Polish hoist rental firm in April, 2001.Mastrent’s operations were transferred toRamirent Europe’s other company in Poland,Rema-Rental S.A. Additionally, RamirentEurope Oy acquired 67% of Via Teh SIA,a Latvian formwork rental company,in April, 2001.
Outlook for 2002
The positive development of the Group’sbusinesses is expected to continue in 2002. Therental business is expected to grow andprofitability to improve in Finland andespecially abroad. This outlook is based on thepresented estimates of the prospects for theconstruction and industrial maintenance marketsin Finland and the favorable outlook formachine rental in the Baltic countries, Russiaand Poland. The investments made during 2001in rental fleet, the establishment of new outletsand the acquisitions made abroad will supportpositive development in 2002. The Group willcontinue to pursue its growth and international-ization strategy by making investments in rentalfleet and acquisitions also in the current year.
Ramirent’s internationalizationand growth strategy
The Ramirent Group is seeking rapid growth inthe coming years. The Group’s target is to growat an average 20% per year. At the same timethe goal is to keep the Group’s profitability at agood level. While growth will occur mainlythrough internationalization, a good growthcurve will also continue in Finland.The Group’s main markets, in addition toFinland, are the developing countries of Easternand Central Europe. The Group is investing inrental fleet, new outlets and acquisitions inPoland, Russia, the Baltic countries andHungary, with the intention of building thesame kind of network of rental outlets in thesecountries as in Finland. The potential ofexpanding operations to the Czech Republic andSlovakia is also being investigated.
March 2002
Erkki NorvioPresident and CEO
OPERATING PROFIT1997-2001
12,1
8,48,4
6,7
15
10
5
EUR million
97 98 99 00 01
20
12,9
NET SALES1997-2001
0
10
20
30
40
5053,8
34,1
28
EUR million
97 98 99 00 01
60
PROFIT BEFOREEXTRAORDINARY ITEMS
1997-2001
11,4
7,77,6
15
10
5
EUR million
97 98 99 00 01
20
11,5
5,5
70
80
36,9
68,2

- 6 -
UPRIGHT SELF-PROPELLEDWORK PLATFORM IN TYPICAL USE

- 7 -
Small machinery, equipmentand personnel hoists
The product line covers the renting of smallmachinery, equipment, personnel hoists andtools for construction sites and industrialmaintenance services, and sales of relatedaccessories and equipment. The products rangein size from simple sewer opening springs toelectricity generators weighing more than a tonand large personnel hoists. Small Machinery,Equipment and Personnel Hoists is Ramirent’slargest product line. It includes machinery andequipment for concrete casting, soilcompaction, hoisting, heating, sanding,grinding, welding, drilling and nailing.The product range also includes various cuttingmachines, pneumatic machinery and equipment,electrical and lighting equipment, pumps, andtesting and measuring equipment.
Formwork and supporting equipment
The product line covers the renting and sales ofshuttering forms required for on-site concretecasting, and the related planning, erection andsupervision services. Shuttering forms are usedto cast vertical and horizontal structures such aswalls and vaults. The renting of shutteringforms takes place in accordance with the specialfeatures of each construction project, theconstruction schedule and the resources of thecontractor. The machinery and equipment in theproduct line are well-known European brands.
Teline-Rami Oy andUudenmaan Telineykköset Oy
Teline-Rami Oy and Uudenmaan TelineykkösetOy are wholly owned subsidiaries of RamirentGroup, responsible for renting and sellingscaffolding and weather covers. The companies’comprehensive service also includes planning,erection, transfers, disassembly andtransportation. In addition to the above, Teline-Rami imports and sells various brands ofscaffolding. Uudenmaan Telineykköset focusesmainly on buildings and facades in the Helsinkimetropolitan area, while Teline-Rami deals withthe rest of Finland and also supplies the
PRODUCT LINES AND SUBSIDIARIES IN FINLAND
scaffolding needs of industry. Scaffolding andweather covers are necessary in renovation andnew building projects, in shipyards and inindustrial maintenance.
Portable spacial units and containers
The product line rents and sells portable spacialunits and containers for new building andrenovation sites and for several other purposes.The products include office, changing room,canteen, storage and accommodation units. Inaddition to ready-furnished units, the productline also designs and furnishes tailored solutionsfor construction site buildings, schools, day carecenters and offices.
Rami-Cranes Oy
Rami-Cranes Oy is a wholly owned subsidiaryof Ramirent Plc, responsible for renting andselling tower cranes and hoists and the relatedmaintenance and spare parts services. Rami-Cranes also repairs and provides spare parts forother kinds of construction machinery.
Technical trade
Ramirent Plc imports and markets a variety ofconstruction machines and equipment.The technical trade is conducted by the productlines and subsidiaries, using the network ofrental outlets for their sales activities.The Group sells the same brands as it rents out.The main products in the technical trade arehoists, heaters, tower cranes, containers,scaffolding, formwork, portable spacial units,and various small machines, equipment andaccessories needed on construction sites.

- 8 -
ORGANIZATION AND OPERATING STRUCTURE
Ramirent has a matrix organization in Finland,with operations organized by product line andregion. The product lines are: Small Machinery,Equipment and Personnel Hoists, Formwork andSupporting Equipment, Scaffolding and WeatherCovers (Teline-Rami Oy and Uudenmaan Teline-ykköset Oy), Portable Spacial Units and Con-tainers, and Tower Cranes and Hoists (Rami-Cranes Oy). Operations are geographically divid-ed into 12 regions and over 90 outlets.
The formwork, scaffolding (Teline-Rami Oyand Uudenmaan Telineykköset Oy), portablespacial units and tower crane products (Rami-Cranes Oy) are rented and sold by theirrespective product lines and subsidiaries andthrough the company’s network of outlets.The renting of small machinery, equipment andpersonnel hoists and the sales of accessories andequipment are handled by the outlets.
PRODUCT LINES OPERATING STRUCTURE
Network of outlets and regional salesRamirent
Europe, 65%
Over 90 outlets 28 outlets
Helsinki region
Turku region
West Finland
Central Finland
Pirkanmaa
Päijät-Häme North Finland
Keski-Pohja
East Finland
Savolax
Kotka region
SoutheastFinland
ZAO TechrentMoscow
Rema-Rental S.A.Poland
Small machineryand equipment
Formwork and supportingequipment
Scaffolding andweather coversTelineykkösetTeline-Rami
Portable spacial unitsand containers
Tower cranes and hoistsRami-Cranes
ZAO PeterrentSt. Petersburg
AS RamirentEstonia
A-Ramirent SIALatvia
SIA Via TehLatvia
A-Ramirent UABLithuania

- 9 -
History
The history of Ramirent dates back to 1955 andthe establishment of a partnership calledRakennusmies. At that time new constructionmachinery and equipment were in great demandin Finland with the post-war reconstruction atits height. The import, manufacture, and tradingof construction machinery and equipment weredefined as the company’s line of business.In the 1960s and 1970s the product rangeexpanded, and the company also took on thedevelopment and manufacture of variousprefabricated units. At the time, the companywas called A-Elementti Oy Rakennusmies.
In 1983, Oy Partek Ab acquired the wholestock of the company, and in the following 2–3years Partek largely transferred theprefabricated unit production to its own similargroup. After the company’s own productioncame to an end, its name was changed to A-Rakennusmies Oy. Through this change thecompany returned to its roots and focused onthe import, sales and renting of constructionmachinery and equipment.
In the late 1980s, business grew again, andthe product range expanded. Further growthwas sought mainly through acquisitions. In1989, A-Rakennusmies acquired RakennuslaiteOy, which had been renting constructionmachinery for 15 years. Hytec Oy, a leadingseller and renter of formwork and personnelhoists, was merged with the company in 1991.In 1992, the major part of Monivuokraus Ky’sbusiness and network of rental outlets wasacquired, which significantly increasedA-Rakennusmies’ construction machinery rentaloperations. In 1993, the construction machineryoperations of Starckjohann-Telko Oy werejoined to the company, and in 1994 A-Rakennusmies acquired Tallberg Rakennus-tekniikka Oy’s business. In 1995, the businessof Betox Oy was purchased.
In December 1995, the business operations ofA-Rakennusmies were transferred to a newcompany held by key persons in A-Rakennus-mies Oy through the holding company GasparOy Ab, together with funds managed byCapMan Capital Management Oy and MBFinance Group Oy. Of the previous owners,
FINNISH OPERATIONS
Oy Julius Tallberg Ab, Oy Partek Ab andStarckjohann Oy, retained their holdings in thecompany until November 1997, when the lattertwo sold their shares to the company’s othershareholders. In 1998, A-Rakennusmies waslisted on the main list of the HelsinkiExchanges and the public quotation of its sharesbegan on April 30, 1998. In conjunction withthis, the capital investors, CapMan CapitalManagement and MB Finance Group, sold mostof their holdings.
The company continued its acquisitions.The equipment rental operations of Kehä-Vuokraus and Cranes-Sampo were purchasedin 1998 and two scaffolding rental companies,Uudenmaan Telineykköset Oy and Etelä-Suomen Telinepiste Oy, were purchasedin 2000.
The Tower Crane operations wereincorporated as a subsidiary company calledRami-Cranes Oy at the beginning of March2000 and the scaffolding operations wereincorporated into Teline-Rami Oy at thebeginning of 2001.
It was also decided to change the nameA-Rakennusmies Oyj to Ramirent Plc as ofMarch 2001.
Market development in Finland
According to the estimates of Ramirent,Finland’s rental market for constructionmachinery and equipment grew byapproximately 5–10% in 2001. Nevertheless,the use of rental machinery and equipment forconstruction is still low in Finland byinternational standards. As constructioncompanies and industry focus on improvingprofitability and productivity, a further increaseis expected to some degree in the use of rentalservices in Finland. The growth of the rentalmarket for construction machinery andequipment will however slow down consider-ably in comparison to the exceptionally highlevel of the previous years.

- 10 -
KORIARAILWAY BRIDGE 2001

- 11 -
Operations andmarket situation
The combined net sales of the outlets in theSmall Machinery and Equipment and PersonnelHoists product line were EUR 32.9 million in2001, which was 4% more than in the previousyear. The increase was mainly due to the slightgrowth of the total market. Renting of smallmachinery and personnel hoists is expected tofurther increase mainly because of the trend forincreased use of rental machinery andequipment. In 2002, the network of outlets willbe further expanded.
The formwork and supporting equipmentproduct line’s gross sales were EUR 5.6 millionin 2001, approximately the same as in theprevious year. The unchanged sales level wasdue mainly to lack of growth in the number ofnew construction starts. The year 2002 hasclearly been busier than 2001. However,expectations for the full year are at the previousyear’s level.
The net sales of Scaffolding and WeatherCovers product line, including installations,(Teline-Rami Oy and Uudenmaan TelineykkösetOy) were EUR 17.0 million in 2001, which waseven 84% more than in previous year.The vigorous growth was mainly affected bythe increase in scaffolding usage by industryand shipyards and the appearance of Uuden-maan Telineykköset Oy in the Group’s figuresduring the whole period. The net sales of thescaffolding companies are expected to furtherincrease in 2002, however, with steady growthfor the rest of the year.
The net sales of Portable Spacial Units andContainers amounted to EUR 3.5 million, anincrease of 9% compared with 2001. Thegrowth was largely due to the increase in thenumber of industrial projects and investments innew Rami spacial units. Growth is expected tocontinue also during the year 2002.
The net sales of the Tower Cranes and Hoists(Rami-Cranes Oy) product group totaledEUR 3.0 million in 2001, a decrease of 29%compared to the previous year. The slower tradehas been called by reduced sale of new andused tower cranes. Demand for the year 2002 isexpected to remain at 2001 level.
UUDENMAAN TELINEYKKÖSET OY(100%)
TELINE-RAMI OY (100%)
RAMI-CRANES OY (100%)
ZAO PETERRENT(ST. PETERSBURG, 100%)
ZAO TECHRENT(MOSCOW, 100%)
AS RAMIRENT(ESTONIA, 100%)
MAST-RENT Sp z o.o(POLAND, 100%)
SIA VIA TEH (LATVIA, 67%)
REMA-RENTAL S.A.(POLAND, 70%)
RAMIRENT POLSKA Sp z o.o(POLAND, 100%)
RAMI POLSKA Sp z o.o(POLAND, 100%)
A-RAMIRENT UAB(LITHUANIA, 100%)
A-RAMIRENT SIA(LATVIA, 100%)
RAMIRENT EUROPE 65%
RAMIRENT PLC

- 12 -
General
The group’s international machinery rentaloperations started in Moscow in 1989, whena joint enterprise was founded in the then SovietUnion, with two local partners. In 1993 theMoscow operations were transferred toa wholly-owned subsidiary, ZAO Techrent.In 1994 local subsidiaries were established toextend international operations to St. Petersburgand Tallinn. A-Rakennusmies East Oy beganbusiness in 1997, when the eastern operations ofthe then A-Rakennusmies were incorporated asa separate company, with a 50% holding byAlliance ScanEast Fund L.P. managed byCapMan Capital Management Oy.
The group’s international business is presentlyconducted through Ramirent Europe Oy and itssubsidiaries. Ramirent Europe has subsidiaries infive countries: in Russia, ZAO Techrent in
Moscow and ZAO Peterrent in St Petersburg,AS Ramirent in Estonia, A-Ramirent SIA inLatvia, UAB A-Ramirent in Lithuania, andRema-Rental S.A. in Poland. In addition,Ramirent Oyj has established a Hungariansubsidiary, Ramirent Hungary Bérleti Kft.,which will commence operations in the firsthalf of 2002.
A share issue made in 2000 increasedRamirent Plc’s holding in Ramirent Europe to65%, Alliance ScanEast Fund’s holdingdecreasing correspondingly to 35%. RamirentPlc has also a right of redemption to thisminority holding.
INTERNATIONAL OPERATIONS
CUSTOMER SERVICE AT THECONSTRUCTION MACHINERY RENTAL
OUTLET MOSTLY CONSISTS OF ADVICEAND INSTRUCTIONS ON THE USE
OF EQUIPMENT.

- 13 -
The internationalization of the Group hasproceeded according to strategy. 2001 saw thenet sales of the Ramirent Europe group increaseby 103% over the previous year, though theresult remained negative, mainly due toinvestments in the Polish market.
In 2002, international operations are expectedto continue to grow, with the main emphasis,however, moving to improving profitability.The internationalization and growth strategywill be continued in 2002, by investing in newrental machinery and by acquiring strategicallyappropriate businesses.
Estonia (AS Ramirent)
In Estonia, during 2001 new dealer outlets wereopened in Pärnu and Saaremaa while a projectfacility was opened in Narva. During the period,the company’s net sales achieved the set targets,despite a quiet start to the year. The company’sresult was narrowly profitable.
The result for fiscal 2002 is expected to begood, with plans for further expansion in theEstonian market.
Latvia (A-Ramirent SIA, Via Teh SIA)
In Latvia, during 2001 new outlets were openedin Ventspils, Daugavapils, Valmiera, andLiepaja. Growth in net sales was good and thecompany’s result was excellent.
During the year, Ramirent Europe acquired a67% holding in Latvia’s leading formworkrental company, Via Teh SIA. Via Teh SIA willcontinue as an independent company within theGroup. The result for fiscal 2002 is expected tocontinue to be good and business is expected togrow.
Lithuania (A-Ramirent UAB)
During 2001 construction was slacker thanexpected in Vilna and throughout Lithuania.During the year, an outlet and heavy machinerydepot were opened in Kaunas. The company’snet sales and result did not reach their targets.The result for fiscal 2002 is expected to improveover the previous year, as construction recoversand certain large projects start up in Lithuania.
Poland (Rema-Rental S.A.)
Rental operations in Poland mainly take placethrough Ramirent Europe Oy’s 70%-ownedsubsidiary, Rema-Rental S.A. The number ofoutlets in the network increased eleven. Despitea difficult market situation, net sales grewsatisfactorily, but the rapid growth of the outletnetwork and costs arising from extensiveinvestments kept the result negative.
During 2001 Poland’s leading aerial workplatform rental business, Mastrent Sp z o.o.,was acquired. The company’s operations will bemerged with those of Rema-Rental. In Poland,Ramirent Europe Oy has a second wholly-owned subsidiary, Rami Polska Sp z o.o.,which imports and sells construction machineryand equipment. The operations of RamirentPolska will also be absorbed into those ofRema-Rental S.A.
The market situation in Poland is expected tocontinue to be difficult in 2002, but to improveappreciably thereafter.
Russia, Moscow (ZAO Techrent)
The market situation in Moscow improvedsubstantially over that in 2000. The companyexceeded both its net sales and result targets toachieve an excellent result. In 2002considerable investments will be made in theMoscow operations and it is expected thatbusiness will continue to develope favorably.
Russia, St. Petersburg (ZAO Peterrent)
In St. Petersburg, there was little construction,particularly in the early part of the year. Duringthe second half of the year, the business cyclebegan to recover and Peterrent’s net sales nearlymet their target. The result, however, was stillunsatisfactory.
In 2002 the company’s operations will bereorganized, and with the market recovery beingexpected to continue, it is believed that theresult in St. Petersburg will also improve overlast year’s.

- 14 -
THE OFFICE PROJECT OFSRV VIITOSET OY IN HELSINKI

- 15 -
General
The Group’s rental operations continued togrow strongly in Finland and abroad in the yearunder review and the net sales target wasachieved. As part of its growth strategy,the Group made acquisitions in Poland andLatvia, opened new outlets and activelyinvested in new rental fleet.
A significant part of net sales growth camefrom international operations, which increasedby 103% compared with the previous year.Domestic operations grew by 17%. Profitimprovement was constrained during the yearby the substantial investments made ininternational operations, especially in Poland.Operations proper only got under way in Polandat the end of 2000 and the number of outletswas increased to 11.
Despite the strong growth, the equity ratioand gearing remained good. The Group has anetwork of over 90 outlets in Finland and 28outlets in Estonia, Latvia, Lithuania, Poland andRussia. At the end of 2001 a subsidiary,Ramirent Hungary Kft, was established inHungary. In Finland, the parent company’sscaffolding product line was transferred toTeline-Rami Oy. The Group’s domesticscaffolding business is handled by UudenmaanTelineykköset Oy and Teline-Rami Oy, but alsoutilizes Ramirent’s network of outlets forscaffolding rental.
The new name of the Group’s parentcompany, Ramirent Plc, was entered in the traderegister on March 30, 2001. A-RakennusmiesEast Oy was also renamed Ramirent Europe Oy.
Ramirent Europe Oy acquired the whole stockof Mastrent Sp z o.o, a Polish hoist rentalcompany, in April, 2001. Mastrent’s operationswere transferred to Ramirent Europe’s othercompany in Poland, Rema-Rental S.A.Additionally Ramirent Europe Oy acquired 67%of the stock of Via Teh SIA, a Latvianformwork rental company, in April, 2001.
BOARD OF DIRECTORS’ REPORT
Changes in Group structure
The scaffolding product line was transferred onJanuary 1, 2001 from the parent company toTeline-Rami Oy as a business transfer undersection 52 d of the Business Tax Act.
The Group’s operations expanded in Latviaand Poland with the acquisitions of SIA Via Tehand Mast-Rent Sp z o.o. In Finland, the KBKonevuokraus machine leasing business wasacquired. The combined net sales of theseacquisitions are annually in the range ofEUR 2 million.
Profit developmentduring the 2001 financial year
The Group’s net sales for 2001 were EUR 68.2(53.8) million, which is 26.9% more than in theprevious year. Other operating income wasEUR 0.3 (0.2) million. The operating profitbefore depreciation (operating margin) wasEUR 20.9 (18.2) million, which is 15.3% morethan in the previous year. Due to the growth ininvestments and acquisitions, depreciationincreased to EUR 8.0 (6.1) million and theoperating profit thus totaled EUR 12.9 (12.1)million. The operating profit was 18.9 (22.5)%of net sales.
Net financial costs increased to EUR 1.4 (0.7)million due to an increase in interest-bearingliabilities. Interest-bearing liabilities were usedfor investments in Finland and abroad, inaccordance with the growth strategy.
Profit before extraordinary items and taxeswas EUR 11.5 (11.4) million, which is16.8 (21.2) % of net sales.
Taxes were EUR 3.5 (3.5) million. The netprofit for the year was EUR 7.5 (8.3) millionand earnings per share were EUR 1.89 (1.96).
Investments
The Group’s gross investments totaled EUR19.7 (21.9) million, which is 28.9 (40.7) % ofnet sales. The figure mainly includes variousmachine and equipment investments totalingEUR 18 million.

- 16 -
Financing and balance sheet status
The Group’s interest-bearing net debt increasedto EUR 21.9 (15.5) million, due to the stronggrowth in investments. Correspondingly,gearing was 66.8 (55.9) %. The Group aims tokeep gearing below 50% in the long term, butto allow it to moderately exceed that level inperiods of active investment.
The equity ratio was 47.2 (50.1) %. TheGroup aims to keep the equity ratio above 50%in the long term, but to allow it to moderatelyfall short of that level in periods of activeinvestment.
The Group’s liquidity during the year underreview was good.
On December 31, 2001, the consolidatedbalance sheet total was EUR 69.6 million andthe shareholders’ equity was EUR 28.9 million.
Personnel
The average number of personnel employed bythe Group during the financial year was 600(469), of whom 421 were employed in Finlandand 179 abroad.
The Group has a profit bonus scheme whichapplies to all personnel. The size of the bonusdepends on the achievement of each unit’s keyprofit targets. More than 50 of the Group’sexecutives and key personnel are included inthe option programs.
Outlook for 2002
The Group is expected to continue its favorablebusiness development in 2002. Growth andimproved profitability are expected in rentalactivities in Finland and especially abroad.The outlook is based on the presented estimatesconcerning the development of the constructionand industrial maintenance markets in Finlandand the positive development prospects formachine rental markets in the Baltic countries,Russia and Poland.
Investments in the rental fleet during 2001and the acquisitions abroad will supportfavorable development in 2002.
In accordance with its growth andinternationalization strategy, the Group willcontinue its investments in rental fleet andacquisitions in the current financial year.
Significant eventsafter the year under review
There were no significant events after the yearunder review.
Board of Directors,President & CEO and Auditors
The Annual General Meeting held on April 26,2001 elected Mr. Raimo Taivalkoski (Chairman),Mr. Thomas Tallberg (Vice Chairman),Mr. Erkki Norvio and Ms. Tuire Mannila as themembers of the Board of Directors.
KPMG Wideri Oy Ab, a firm of AuthorizedPublic Accountants, was elected as the Auditor,with the responsible Auditor being Ms. SolveigTörnroos-Huhtamäki, Authorized PublicAccountant.
Mr. Erkki Norvio is the President & CEO.

- 17 -
CONSOLIDATED
Note 1.1.-31.12.2001 1.1.-31.12.2001(EUR 1,000) (EUR 1,000)
NET SALES 2 68,234 53,773Other operating income 3 275 194
Materials and services 4 16,874 11,678Personnel expenses 5 16,070 12,740Depreciation and writedown 6 8,030 6,058Other operating expenses 14,616 11,379
55,590 41,856
OPERATING PROFIT 12,919 12,111
Financial income and expenses 7 -1,449 -728
PROFIT BEFOREEXTRAORDINARY ITEMS 11,470 11,383
Extraordinary items 8 -650 389
PROFIT BEFOREAPPROPRIATIONS AND TAXES 10,820 11,772
Income taxes 10 -3,490 -3,504Minority interests 139 -10
NET PROFIT FOR THE YEAR 7,469 8,259
INCOME STATEMENT

- 18 -
BALANCE SHEET
CONSOLIDATED
Notes 31.12.2001 31.12.2000(EUR 1,000) (EUR 1,000)
ASSETS
NON-CURRENT ASSETSIntangible assets 11 6,295 6,038Tangible assets 11 46,417 37,046Investments
Other investments 13, 15 341 329TOTAL NON-CURRENT ASSETS 53,053 43,413
CURRENT ASSETSInventories 16 3,575 3,107Current receivables
Sales receivables 8,238 6,268Other receivables 280 99Prepayments and accrued income 1,002 836
Cash in hand and at the banks 3,498 1,746TOTAL CURRENT ASSETS 16,593 12,056
TOTAL ASSETS 69,646 55,469

- 19 -
CONSOLIDATED
Notes 31.12.2001 31.12.2000(EUR 1,000) (EUR 1,000)
LIABILITIES
CAPITAL AND RESERVESShare capital 18 3,522 3,522Share premium account 18 4,369 4,369Legal reserve 18 18 6Retained earnings 18 13,478 8,704Net profit for the year 18 7,469 8,259TOTAL CAPITAL AND RESERVES 28,856 24,860
MINORITY INTERESTS 3,951 2,945
CREDITORSDeferred tax 21 2,383 2,047Non-current liabilities
Debenture loans 22 824Loans from financial institutions 23, 26, 27 11,146 3,131Pension loans 23, 27 5,315 3,657
16,461 7,612Current liabilities
Debenture loans 22, 25 824 824Loans from financial institutions 23, 25, 26, 27 7,082 8,195Pension loans 25, 27 1,034 649Advances received 89 104Trade payables 3,575 2,732Other payables 1,330 1,309Accruals and deferred income 25 4,061 4,191
17,995 18,004TOTAL CREDITORS 36,839 27,663
TOTAL LIABILITIES 69,646 55,469

- 20 -
CASH FLOW STATEMENT
CONSOLIDATED
2001 2000(EUR 1,000) (EUR 1,000)
Cash flow from operating activities:Profit before extraordinary items 11,470 11,383Adjustments:Depreciation and writedown 8,030 6,058Other income and expenses, not involving payment 1,322 227Financial income and expenses 1,449 728Other adjustments -789 -44Cash flow before change in net working capital 21,482 18,352
Change in net working capital:Non interest-bearing short-term business receivables
increase (-) / decrease (+) -1,829 -1,663Inventories increase (-) / decrease (+) -295 -620Non interest-bearing short-term debt increase (+) / decrease (-) -102 1,833
Cash before financing activities and taxes 19,256 17,902
Paid interests and payments ofother business financing costs -1,591 -1,089
Interests received from business activities 137 384Direct taxes paid -3,154 -2,809Cash flow from operating activities (A) 14,648 14,388
Cash flow from investing activities:Investments in tangible and intangible assets -17,052 -12,730Proceeds from sale of tangible and intangible assets 139 2,663Other investments -12 -273Purchased shares of subsidiaries -939 -8,091Dividends received from investments 4 1Cash flow from investing activities (B) -17,860 -18,430
Cash flow from financing activities:Paid share issue 883 1,009Raising of short-term loans 2,610 6,058Repayment of short-term loans -5,046 -1,531Raising of long-term loans 12,830 3,465Repayment of long-term loans -2,792 -1,403Dividends paid -3,522 -2,778Cash flow from financing activities (C) 4,963 4,819
Change in liquid assets, increase (+) / decrease (-) (A+B+C) 1,751 777
Liquid assets at the beginning of the financial year 1,746 969Liquid assets at the end of the financial year 3,497 1,746

- 21 -
PARENT COMPANY
Notes 1.1.-31.12.2001 1.1.-31.12.2000(EUR 1,000) (EUR 1,000)
NET SALES 1, 2 40,297 43,629Other operating income 3 322 300
Materials and services 4 -6,663 -9,256Personnel expenses 5 -9,913 -10,064Depreciation and writedown 6 -4,923 -4,766Other operating expenses -10,550 -9,397
-32,049 -33,483
OPERATING PROFIT 8,570 10,446
Financial income and expenses 7 -692 -683
PROFIT BEFORE EXTRAORDINARY ITEMS 7,878 9,763
Extraordinary items 8 2,909 629
PROFIT BEFORE APPROPRIATIONSAND TAXES 10,787 10,393
Appropriations 9 -958 -737Income taxes 10 -2,865 -2,796
NET PROFIT FOR THE YEAR 6,964 6,860
INCOME STATEMENT
- 22 -
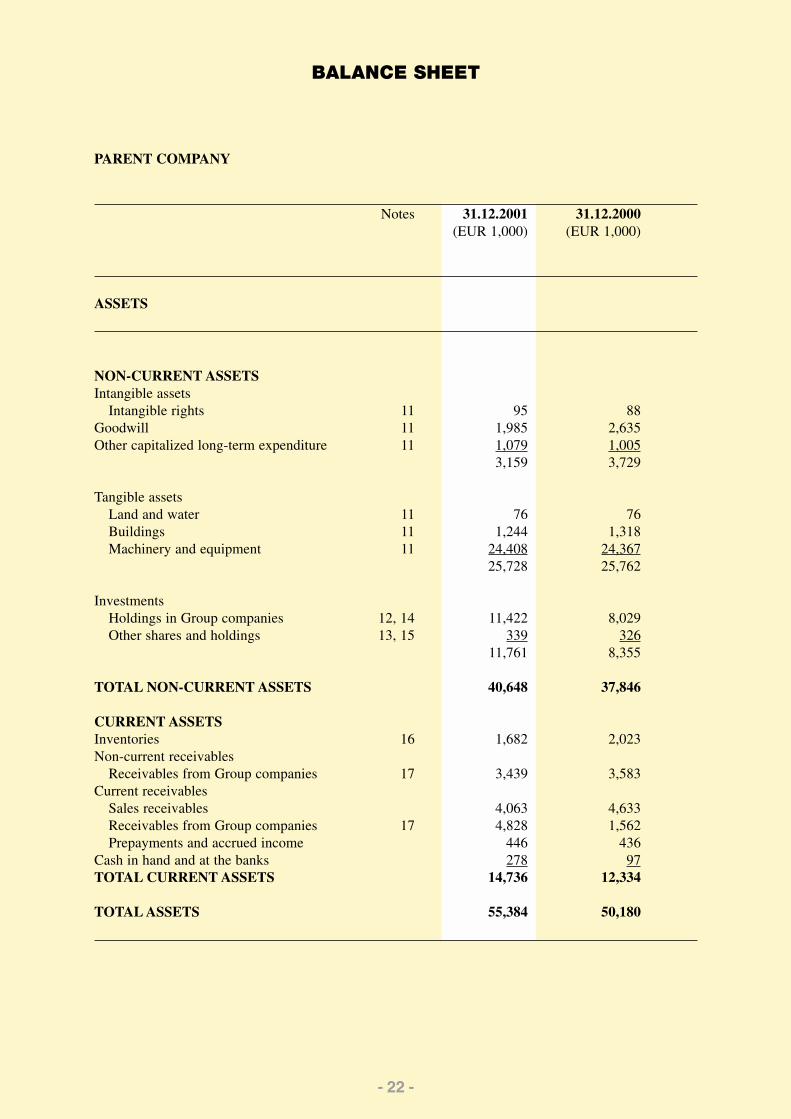
PARENT COMPANY
Notes 31.12.2001 31.12.2000(EUR 1,000) (EUR 1,000)
ASSETS
NON-CURRENT ASSETSIntangible assets
Intangible rights 11 95 88Goodwill 11 1,985 2,635Other capitalized long-term expenditure 11 1,079 1,005
3,159 3,729
Tangible assetsLand and water 11 76 76Buildings 11 1,244 1,318Machinery and equipment 11 24,408 24,367
25,728 25,762
InvestmentsHoldings in Group companies 12, 14 11,422 8,029Other shares and holdings 13, 15 339 326
11,761 8,355
TOTAL NON-CURRENT ASSETS 40,648 37,846
CURRENT ASSETSInventories 16 1,682 2,023Non-current receivables
Receivables from Group companies 17 3,439 3,583Current receivables
Sales receivables 4,063 4,633Receivables from Group companies 17 4,828 1,562Prepayments and accrued income 446 436
Cash in hand and at the banks 278 97TOTAL CURRENT ASSETS 14,736 12,334
TOTAL ASSETS 55,384 50,180
BALANCE SHEET

- 23 -
PARENT COMPANY
Notes 31.12.2001 31.12.2000(EUR 1,000) (EUR 1,000)
LIABILITIES
CAPITAL AND RESERVESShare capital 18 3,522 3,522Share premium account 18 4,369 4,369Retained earnings 18 8,333 4,995Net profit for the year 18 6,964 6,860TOTAL CAPITAL AND RESERVES 23,188 19,746
APPROPRIATIONSDepreciation reserve 20 7,080 7,060
CREDITORSNon-current liabilities
Debenture loans 22 824Loans from financial institutions 23, 26, 27 8,235 2,789Pension loans 23, 27 5,315 3,657
13,550 7,270
Current liabilitiesDebenture loans 22 824 824Loans from financial institutions 25, 26, 27 5,041 7,736Pension loans 25, 27 1,034 649Advances received 89 104Trade payables 1,224 1,837Liabilities to Group companies 24 408 899Other liabilities 982 1,017Accruals and deferred income 1,964 3,038
11,566 16,104
TOTAL CREDITORS 25,115 23,374
TOTAL LIABILITIES 55,384 50,180

- 24 -
CASH FLOW STATEMENT
PARENT COMPANY
2001 2000(EUR 1,000) (EUR 1,000)
Cash flow from operating activitiesProfit before extraordinary items 7,878 9,763Adjustments:Depreciation and writedown 4,923 4,766Other income and expenses, not involving payment 742 227Financial income and expenses 692 683Other adjustments -776 -44Cash flow before change in net working capital 13,459 15,395
Change in net working capital:Non interest-bearing short-term business receivables
increase (-) / decrease (+) 233 -2,631Inventories increase (-) / decrease (+) -168 -267Non interest-bearing short-term debt
increase (+) / decrease (-) -95 1,141Cash flow before financing activities and taxes 13,430 13,638
Paid interests and payments ofother business financing costs -1,331 -792
Interests received from business activities 182 70Direct taxes paid -3,746 -2,522Cash flow from operating activities (A) 8,534 10,394
Cash flow from investing activities:Investments in tangible and intangible assets -8,256 -9,011Proceeds from sale of tangible and intangible assets 125 1,548Other investments -1,665 -5,548Loans granted 0 -3,721Repayments of loans 1,409 0Proceeds from sale of other investments 158 0Dividends received from investments 2 1Cash flow from investing activities (B) -8,227 -16,731
Cash flow from financing activities:Raising of short-term loans 1,548 7,509Repayment of short-term loans -5,619 -1,531Raising of long-term loans 10,259 3,123Repayment of long-term loans -2,792 -860Dividends paid -3,522 -2,778Cash flow from financing activities (C) -126 5,464
Change in liquid assets, increase (+) / decrease (-) (A+B+C) 181 -873
Liquid assets at the beginning of the financial year 97 969Liquid assets at the end of the financial year 278 97

- 25 -
NOTES TO THE FINANCIAL STATEMENTS
General
The financial statements have been prepared inaccordance with the valid provisions of theFinnish Accounting Act and the Companies Act.The financial statements have been prepared ineuros.
Scope and principles of consolidation
All Group companies are included in the con-solidated financial statements of Ramirent Plc.The companies acquired during the 2001financial year have been included as of their dateof acquisition.
All intragroup transactions, receivables,liabilities and profit distribution have beeneliminated. The unrealized margins fromintragroup sales have been eliminated in so far asthey would affect the Group’s profit andshareholders’ equity. Minority interests havebeen separated from the Group’s profit andshareholders’ equity, and are presented separatelyin the income statement and balance sheet.
Intragroup holdings have been eliminated usingthe acquisition cost method. The differencesarising from elimination have been entered eitheras fixed assets or as goodwill. The fixed assetitems will be amortized according to plan andgoodwill over 15 years. The amount entered asfixed assets on December 31, 2001, was EUR639,007 (EUR 710,007).
The financial statements of the Russiansubsidiaries of Ramirent Europe Oy have beentranslated into euros using the monetary– non monetary method. The income statementsof other subsidiaries of the subsidiary Grouphave been translated into euros at the averageexchange rate for the year, and the balance sheetsat the exchange rate on December 31. Thedifferences arising from translation and exchangerates have been entered in “financial income andexpenses” in the income statement, except forexchange rate translation differences inshareholders’ equity, which are presented under“capital and reserves” in the balance sheet.
ACCOUNTING PRINCIPLES
Net sales
Net sales include rental income, sales income fromtechnical trade, the sale of services, and gains fromthe sale of used rental machinery and equipment.
Appropriations
Appropriations are changes in the parentcompany’s depreciation in excess of plan. In theconsolidated balance sheet, the accumulatedappropriations have been divided between capitaland reserves and the deferred tax liability. In theincome statement, the change in appropriations forthe year has correspondingly been divided betweennet profit for the year and change in deferred taxliability.
Taxes
The taxes due on the taxable profit for the 2001financial year have been entered as income taxesin the parent company’s income statement.
The taxes due on the taxable profits of Groupcompanies have been entered as direct taxes in theconsolidated income statement. The taxes havebeen calculated in accordance with eachcompany’s local tax regulations, on the basis ofcomputed taxable income.
Deferred tax liabilities and assets in theconsolidated figures take account of changescaused by timing differences between accountingand taxation periods and by consolidation, and arebased on the following year’s tax rate confirmed atthe time of closing the books. The consolidatedbalance sheet includes the deferred tax liability intotal and the deferred tax asset computed as theestimated probable asset. The difference arisingfrom the change of accounting method is presentedin “extraordinary income” in 2000.
Adjustments to figures forprevious financial year
The balance sheet allocations for the previousfinancial year have been adjusted to correspond tothe allocations used for the year under review.

- 26 -
Foreign currency items
At the end of the financial year, unsettled foreign currency assets and liabilities are valued at theaverage rate of the Bank of Finland on December 31. Exchange rate differences are presented in theincome statement.
The principal foreign exchange rates used were:
Income statement rate Income statement rate Balance sheet rate Balance sheet rate2001 2000 2001 2000
EUR/RUR 26.09035 25.91522 26.87457 26.64932EUR/EEK 15.64666 15.64666 15.64666 15.64666EUR/LVL 0.55894 0.55858 0.55630 0.57640EUR/LTL 3.57169 3.68433 3.52279 3.72290EUR/PLN 3.64851 3.90945 3.49531 3.84979
Financial instruments
The Group companies have no derivativescontracts.
Pension costs
Pension cover is arranged through pensioninsurance companies. Pension insurance costs arebooked as they occur. Pension insurance costs offoreign subsidiaries are presented as required byeach respective country’s local legislation.
Maintenance and repairs
Except for major refurbishment costs, which arecapitalized and depreciated over their period ofimpact, maintenance and repair costs are bookedas expenses during the financial year in whichthey occur.
Fixed assets
Fixed assets are capitalized at their directacquisition cost in the balance sheet, reduced bythe depreciation made according to plan. Theplanned depreciation is calculated on the basis ofthe economic life expectancies of the fixed assetseither as straight-line depreciation or as apercentage (reducing balance method). Thedepreciation periods for the fixed assets are asfollows:
Goodwill 10–15 yearsOther long-term expenditure 3–8 yearsBuildings and structures 20 yearsMachinery and equipmentfor own use 3–10 years
Rental machinery, equipmentand machinery, itemizedLifting and loading equipment 8–15 yearsSmall machines 3–8 yearsPortable spacial units 10 years
Rental machinery and equipment,non-itemizedScaffolding 10%Formwork and supporting equipment 10%Other non-itemized 10–33%
Goodwill arising from restructuring of the Groupis amortized over 10-15 years depending on theperceived importance of the restructuring toGroup strategy.
Inventories
Inventories are shown at the lowest of theweighted average price, the replacement price orthe probable selling price. The direct acquisitioncosts are included in the value of the inventories.
Cash and bank
Cash and bank includes cash and bank accounts.
- 27 -
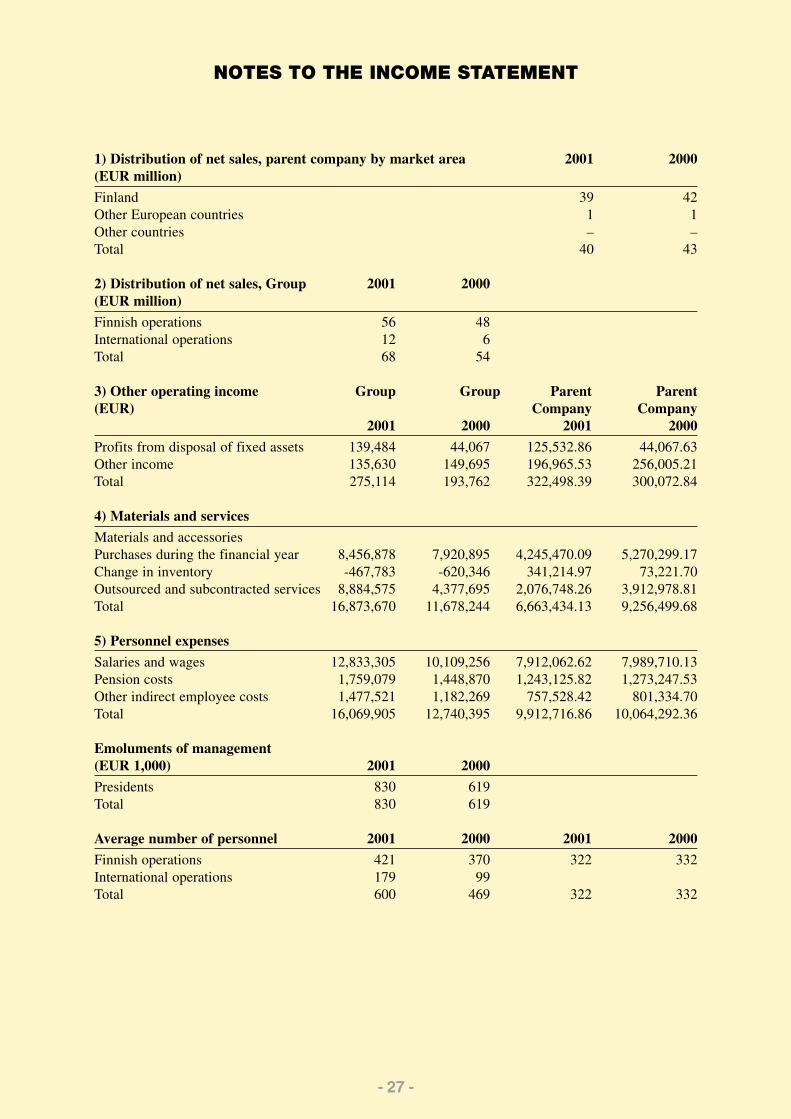
1) Distribution of net sales, parent company by market area 2001 2000(EUR million)
Finland 39 42Other European countries 1 1Other countries – –Total 40 43
2) Distribution of net sales, Group 2001 2000(EUR million)
Finnish operations 56 48International operations 12 6Total 68 54
3) Other operating income Group Group Parent Parent(EUR) Company Company
2001 2000 2001 2000
Profits from disposal of fixed assets 139,484 44,067 125,532.86 44,067.63Other income 135,630 149,695 196,965.53 256,005.21Total 275,114 193,762 322,498.39 300,072.84
4) Materials and services
Materials and accessoriesPurchases during the financial year 8,456,878 7,920,895 4,245,470.09 5,270,299.17Change in inventory -467,783 -620,346 341,214.97 73,221.70Outsourced and subcontracted services 8,884,575 4,377,695 2,076,748.26 3,912,978.81Total 16,873,670 11,678,244 6,663,434.13 9,256,499.68
5) Personnel expenses
Salaries and wages 12,833,305 10,109,256 7,912,062.62 7,989,710.13Pension costs 1,759,079 1,448,870 1,243,125.82 1,273,247.53Other indirect employee costs 1,477,521 1,182,269 757,528.42 801,334.70Total 16,069,905 12,740,395 9,912,716.86 10,064,292.36
Emoluments of management(EUR 1,000) 2001 2000
Presidents 830 619Total 830 619
Average number of personnel 2001 2000 2001 2000
Finnish operations 421 370 322 332International operations 179 99Total 600 469 322 332
NOTES TO THE INCOME STATEMENT

- 28 -
6) Depreciation and write-downs Group Group Parent Parentcompany company
2001 2000 2001 2000
Tangible and intangible assets 7,888,700 6,058,199 4,923,249.58 4,766,190.23
Depreciation is itemized under “non-current assets”.
7) Financial income and expenses
Dividend income from outsiders 4,406 1,051 2,264.00 960.33Dividend income from Group companies – – 222,671.25 –
Interest income from long-term investmentsfrom Group companies – – 188,049.21 6,611.80
Other interest and financial incomefrom Group companies – – 122,048.82 109,115.45from others 103,410 84,173 51,096.69 59,397.22
Exchange rate differences 377,429 284,961 -33.15 133.36Total 480,839 369,134 173,112.30 168,646.02
Interest income from long-term investmentsand other interest and financial income, total 480,839 369,134 361,161.57 175,257.82
Interest expenses and other financial expensesfrom Group companies – – 72,701.82 27,708.12from others 1,591,356 869,743 1,206,732.17 830,312.05
Exchange rate and translation differences 343,027 228,117 -1,536.77 726.14Total 1,934,383 1,097,860 1,277,897.22 858,746.31
Total financial income and expenses 1,449,138 727,675 691,800.40 682,528.15
8) Extraordinary items
Extraordinary incomeDeferred tax assets – 388,932 – –Group contributions – – 3,559,000.00 723,208.08
Extraordinary expensesGroup contributions – – – -93,848.86Company name change expenses -649,890 – 649,889.87 –Total -649,890 388,932 2,909,110.13 629,359.22
9) Appropriations
Difference between depreciation madeaccording to plan and in taxation – – 958,614.00 736,582.56
10) Income taxes
Income taxes on actual operations 3,237,168 3,115,523 2,021,162.38 2,613,368.75Income taxes on extraordinary items -188,468 – 843,642.00 182,514,17Change in deferred tax liability 441,936 388,180 – –Total 3,490,636 3,503,703 2,864,804.38 2,795,882.92

- 29 -
NON-CURRENT ASSETS Group Group Parent Parentcompany company
11) Intangible assets 2001 2000 2001 2000
Intangible rightsAcquisition cost, Jan 1 100,904 99,399 88,238.11 99,399.06Increase 6,691 46,074 6,690.51 33,408.85Transfers between items -10,766 -44,569 – -44,569.80Acquisition cost, Dec 31 96,829 100,904 94,928.62 88,238.11
Accumulated depreciation, Jan 1 -1,900 – – –Depreciation for year – -1,900 – –Accumulated depreciation, Dec 31 -1,900 -1,900 – –
Book value, Dec 31 94,929 99,004 94,928.62 88,238.11
GoodwillAcquisition cost, Jan 1 5,335,148 5,335,148 5,335,148.26 5,335,148.26Increase 77,679 77,678.82Decrease – – -226,430.56 –Acquisition cost, Dec 31 5,412,827 5,335,148 5,186,396.52 5,335,148.26
Accumulated depreciation andwrite-downs, Jan 1 -2,699,948 -2,148,733 -2,699,948.33 -2,148,732.75Depreciation for year -557,689 -551,215 -501,081.14 -551,215.58Accumulated depreciation, Dec 31 -3,257,637 -2,699,948 -3,201,029.47 -2,699,948.33
Book value, Dec 31 2,155,190 2,635,200 1,985,367.05 2,635,199.93
Other long-term expenditureAcquisition cost, Jan 1 2,073,215 1,238,409 1,738,861.61 1,190,612.94Increase 481,110 834,806 366,405.19 548,248.67Decrease -84,784Acquisition cost, Dec 31 2,469,541 2,073,215 2,105,266.80 1,738,861.61
Accumulated depreciation andwrite-downs, Jan 1 -765,508 -548,376 -733,384.94 -548,376.29Depreciation for year -352,740 -217,132 -292,635.66 -185,008.65Accumulated depreciation, Dec 31 -1,118,248 -765,508 -1,026,020.60 -733,384.94
Book value, Dec 31 1,351,293 1,307,707 1,079,246.20 1,005,476.67
Consolidation goodwillAcquisition cost, Jan 1 2,077,341 –Increase 912,400 2,077,341Acquisition cost, Dec 31 2,989,741 2,077,341
Accumulated depreciation andwrite-downs, Jan 1 -81,241 –Depreciation for year -215,080 -81,241Accumulated depreciation, Dec 31 -296,321 -81,241
Book value, Dec 31 2,693,420 1,996,100
Total intangible assets 6,294,832 6,038,010 3,159,541.87 3,728,914.72
NOTES TO THE BALANCE SHEET

- 30 -
Tangible assets Group Group Parent Parentcompany company
2001 2000 2001 2000
Land and waterAcquisition cost, Jan 1 738,630 76,126 76,126.90 76,126.90Increase 2,044 662,504 – –Acquisition cost, Dec 31 740,674 738,630 76,126.90 76,126.90
Book value, Dec 31 740,674 738,630 76,126.90 76,126.90
BuildingsAcquisition cost, Jan 1 2,152,962 894,721 1,474,565.77 894,721.08Increase 19,185 1,258,241 – 535,274.89Transfers between items – – – 44,569.80Acquisition cost, Dec 31 2,172,147 2,152,962 1,474,565.77 1,474,565.77
Accumulated depreciation andwrite-downs, Jan 1 -186,804 -98,536 -156,194.63 -98,536.91Depreciation for year -124,488 -88,268 -74,537.50 -57,657.72Accumulated depreciation, Dec 31 -311,292 -186,804 -230,732.12 -156,194.63
Book value, Dec 31 1,860,855 1,966,158 1,243,833.66 1,318,371.14
Machinery and equipmentAcquisition cost Jan 1 52,203,138 38,112,349 40,855,391.58 35,077,442.31Increase 18,185,981 16,709,341 7,973,600.96 9,101,125.38Decrease -2,411,124 -2,618,552 -4,341,444.56 -3,323,176.11Acquisition cost, Dec 31 67,977,995 52,203,138 44,487,547.98 40,855,391.58
Accumulated depreciation andwrite-downs, Jan 1 -17,862,159 -12,973,733 -16,488,057.54 -12,973,733.58Accumulated depreciation on decreases 480,074 457,984 463,112.54 457,984.33Depreciation for year -6,780,309 -5,346,410 -4,054,995.28 -3,972,308.29Accumulated depreciation, Dec 31 -24,162,394 -17,862,159 -20,079,940.28 -16,488,057.54
Book value, Dec 31 43,815,601 34,340,979 24,407,607.67 24,367,334.04
Total tangible assets 46,417,130 37,045,768 25,727,568.23 25,761,832.07
12) Investments
Holdings in Group companiesAcquisition cost, Jan 1 8,029,024.10 16,818.80Increase 3,393,096.04 6,115,650.97Transfers between items – 1,896,554.33Book value, Dec 31 11,422,120.14 8,029,024.10
Holdings in associated companiesAcquisition cost, Jan 1 – – – 1,896,554.33Transfers between items – – – -1,896,554.33Book value, Dec 31 – – – 0.00
- 31 -
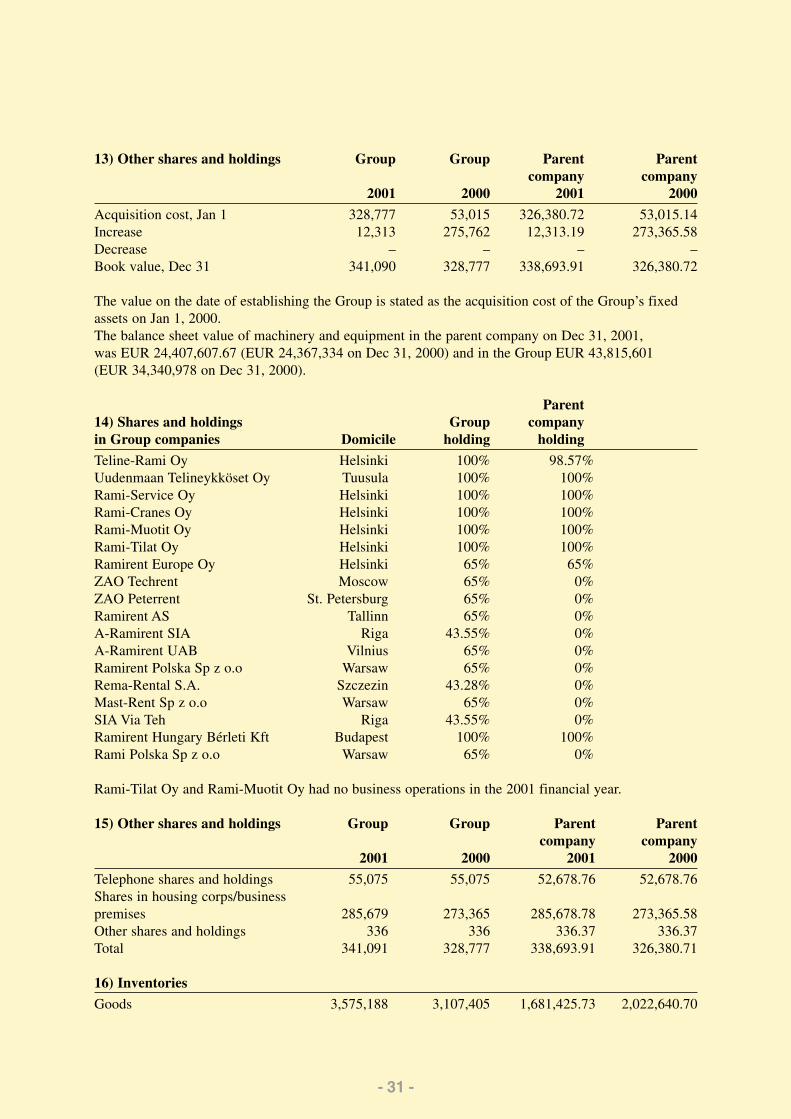
13) Other shares and holdings Group Group Parent Parentcompany company
2001 2000 2001 2000
Acquisition cost, Jan 1 328,777 53,015 326,380.72 53,015.14Increase 12,313 275,762 12,313.19 273,365.58Decrease – – – –Book value, Dec 31 341,090 328,777 338,693.91 326,380.72
The value on the date of establishing the Group is stated as the acquisition cost of the Group’s fixedassets on Jan 1, 2000.The balance sheet value of machinery and equipment in the parent company on Dec 31, 2001,was EUR 24,407,607.67 (EUR 24,367,334 on Dec 31, 2000) and in the Group EUR 43,815,601(EUR 34,340,978 on Dec 31, 2000).
Parent14) Shares and holdings Group companyin Group companies Domicile holding holding
Teline-Rami Oy Helsinki 100% 98.57%Uudenmaan Telineykköset Oy Tuusula 100% 100%Rami-Service Oy Helsinki 100% 100%Rami-Cranes Oy Helsinki 100% 100%Rami-Muotit Oy Helsinki 100% 100%Rami-Tilat Oy Helsinki 100% 100%Ramirent Europe Oy Helsinki 65% 65%ZAO Techrent Moscow 65% 0%ZAO Peterrent St. Petersburg 65% 0%Ramirent AS Tallinn 65% 0%A-Ramirent SIA Riga 43.55% 0%A-Ramirent UAB Vilnius 65% 0%Ramirent Polska Sp z o.o Warsaw 65% 0%Rema-Rental S.A. Szczezin 43.28% 0%Mast-Rent Sp z o.o Warsaw 65% 0%SIA Via Teh Riga 43.55% 0%Ramirent Hungary Bérleti Kft Budapest 100% 100%Rami Polska Sp z o.o Warsaw 65% 0%
Rami-Tilat Oy and Rami-Muotit Oy had no business operations in the 2001 financial year.
15) Other shares and holdings Group Group Parent Parentcompany company
2001 2000 2001 2000
Telephone shares and holdings 55,075 55,075 52,678.76 52,678.76Shares in housing corps/businesspremises 285,679 273,365 285,678.78 273,365.58Other shares and holdings 336 336 336.37 336.37Total 341,091 328,777 338,693.91 326,380.71
16) Inventories
Goods 3,575,188 3,107,405 1,681,425.73 2,022,640.70

- 32 -
17) Receivables from Group companies Parent Parentcompany company
2001 2000
Long-term Loans 3,439,006.61 3,583,311.89Short-term Sales receivables 979,444.10 650,386.16 Loans 0.00 51,112.75 Prepayments and accrued income 290,032.10 137,124.08 Other receivables 3,559,008.73 723,208.08Total 8,267,491.54 5,145,142.93
18) Capital and reserves Group Group Parent Parentcompany company
2001 2000 2001 2000
Share capital, Jan 1 3,521,774 3,521,774.45 3,473,080.68Rights issue – 48,693.77Share capital, Dec 31 3,521,774 3,521,774 3,521,774.45 3,521,774.45
Share premium account, Jan 1 4,369,183 4,369,183.09 3,576,937.23Issue premium – 792,245.86Share premium account, Dec 31 4,369,183 4,369,183 4,369,183.09 4,369,183.09
Legal reserve, Jan 1 5,994Transfer from retained earnings 12,439Legal reserve, Dec 31 18,433 5,994
Retained earnings, Jan 1 16,963,380 11,855,329.02 7,773,745.20Transfer to legal reserve -12,439Change in translation difference 48,423Dividend distribution -3,521,774 -3,521,774.45 -2,778,464.54Retained earnings, Dec 31 13,477,590 8,704,500 8,333,554.56 4,995,280.66
Net profit for the year 7,469,030 8,258,880 6,963,759.86 6,860,048.36
Total shareholders’ equity 28,856,010 24,860,331 23,188,271.96 19,746,286.56
19) Distributable funds
Retained earnings 13,477,590 8,704,500 8,333,554.56 4,995,280.66
Net profit for the year 7,469,030 8,258,880 6,963,759.86 6,860,048.36Capitalized founding costs -145,062 -202,622Part of accumulated depreciation differencetransferred to shareholders’ equity -6,669,890 -5,456,438Total 14,131,668 11,304,320 15,297,314.42 11,855,329.02

- 33 -
20) Accumulated appropriations Parent Parentcompany company
2001 2000
Accumulated depreciation difference, Jan 1 7,059,929.96 6,808,133.71Transfer of business, Rami-Cranes Oy – -484,786.31Transfer of business, Teline-Rami Oy -938,152.25 –Increase in depreciation difference 958,614.00 736,582.56Accumulated depreciation difference, Dec 31 7,080,391.71 7,059,929.96
Group Group21) Deferred tax assets and liabilities 2001 2000
Deferred tax assetsfrom timing differences 322,274 256,773from consolidation 133,548 66,080
Deferred tax liabilitiesfrom appropriations 2,724,321 2,228,686from timing differences 115,082 141,564Total deferred tax liabilities -2,383,581 -2,047,397
The deferred tax liability arising from the parent company’s accumulated depreciation difference isEUR 2,053,314 (EUR 2,047,380 in 2000).
22) Long-term liabilities, debenture loan
The debenture loan of EUR 824,121 is from 1995, and its terms and conditions are as follows:- Loan period, Nov 2, 1995 – Nov 2, 2002- Repayments twice a year starting on May 2, 2001- Fixed interest at 8% during Nov 2, 1995 – Nov 2, 1997, and at 9% during Nov 2, 1997 – Nov 2,2002, but at least the Bank of Finland’s 6-month Helibor rate from Nov 2, 1999.The terms and conditions of the debenture loan have not changed since the previous financialstatements. There are no unbooked expenses in connection with issuing the loan.
23) Liabilities maturing in Group Group Parent Parentmore than five years company company
2001 2000 2001 2000
Pension loans 1,177,318 1,061,009 1,177,317.65 1,061,009.16Loans from financial institutions 2,512,728 2,512,727.72Total 3,690,045 1,061,009 3,690,045.37 1,061,009.16
24) Debts to Group companies Parent Parentcompany company
2001 2000
Accounts payable 235,340,68 48,725.11Other debts 166,135,87 833,875.74Accruals and deferred income 6,634,47 16,191.40Total 408,111,02 898,792.25

- 34 -
25) Short-term debts
Accruals and deferred income on Dec 31, 2001 of EUR 1,963,747.23 in the parent company(EUR 3,038,283.77 in 2000) and EUR 4,061,534 in the Group (EUR 4,190,951 in 2000) comprisedmainly tax liabilities, salaries and other accruals.
Repayments due in the following year: Group Group Parent Parentcompany company
2001 2000 2001 2000
Debenture loan 824,121 824,121 824,120.84 824,120.84Loans from financial institutions 3,770,738 1,599,220 2,122,917.16 1,318,973.85Pension loans 1,033,512 649,109 1,033,511.96 649,109.70Total 5,628,371 3,072,450 3,980,544.96 2,792,204.39
Current account overdraft in use 1,489,718 1,550,602 2,918,393.92 1,550,602.95Total 7,118,089 4,623,052 6,898,938.88 4,342,807.34
26) Debts secured by mortgages or pledgesLoans from financial institutions 18,233,483 10,710,132 13,281,380.95 10,710,132.03
27) Mortgages and pledges
Real estate mortgaged 2,254,058 1,060,057 1,582,057.76 1,060,057.76Companies mortgaged 18,624,429 16,944,429 15,843,302.67 15,843,302.67Shares (book value) 285,679 273,701 285,678.77 273,701.96
Other collateral given on own behalfCompanies mortgaged 2,700,000 2,700,000.00
Other pledges on behalf of Group companiesGuarantees 1,409,503 437,749 759,822.30 437,748.63
Pledges and guarantees given as security for other liabilitiesGroup companies have not given pledges or guarantees as security for liabilities other than their ownor Group company liabilities.
Equity ratio covenantsThe company has loans and guarantees tied to equity ratio covenants (20% and 30%).
Leasing obligations Group Group Parent Parentcompany company
2001 2000 2001 2000
Leasing payments due infollowing financial year 153,271 402,674 153,271.76 402,674.70Leasing payments due later 119,349 48,866 119,349.05 48,866.15Total 272,620 451,540 272,620.81 451,540.85
Other liabilitiesRent and payment guarantees 106,171 88,040 106,171 88,040

- 35 -
28) Credit facilities, exchange rates and interest rate risks
The parent company has a current accountcredit facility of EUR 5 million, of which EUR3.6 million was unused at the time of closingthe accounts, and a loan facility of EUR 10million, of which EUR 2.5 million was unusedat the time of closing the accounts. RamirentEurope Oy has a current account credit facilityof FIM 5 million, which was completely unusedon Dec 31, 2001.
The Group operates partly in countries where,owing to the undeveloped nature of the moneymarkets and the instability of the currency, thehedging of interest rate risks is noteconomically feasible in practice. The localexternal loans of Group companies are alwaystaken, whenever it is economically feasible andpossible, in the local currency. The Group’s
subsidiaries outside Finland are to a large extentfinanced by loans given by Ramirent EuropeOy. Starting in the spring 2000, the subsidiariesbegan to raise especially leasing finance and tosome extent bank loans for the purpose ofinvestments. In the Baltic countries, leasingfinance has typically been EUR-linked. Theloans granted to Ramirent Europe Oy’ssubsidiaries have been converted into EUR forthe financial year.
The Group’s parent company has no foreigncurrency loans. The interest period of the parentcompany’s credits is typically 6–12 months and,concerning pension loans, 2–3 years. Thedebenture loan has fixed interest of 9%. Interestperiods of different lengths are used to reducethe interest rate risk in the Group.
29) Ten principal shareholders according to Shares % of total sharesshare register on Dec 31, 2001 and votes
Gaspar Oy Ab 1,058,780 25.3Oy Julius Tallberg Ab 1,001,650 23.9Optiomi Oy 486,500 11.6Finnish National Fund for Research andDevelopment 202,100 4.8PT Pension Foundation 85,600 2.0Alfred Berg Small Cap Fund 82,600 2.0Sampo Life Insurance Company Limited 82,500 2.0Kemira Chemicals Oy Pension Foundation 65,900 1.6The Association of Finnish Local andRegional Authorities 60,800 1.5Special Investment Fund Wip Small Titans 60,000 1.4Other shareholders 1,001,474 23.9
4,187,904 100.0
On Dec 31, 2001, 30.29% of the shares and votes of Ramirent Plc were owned or controlled, directlyor indirectly, by the President & CEO and the members of the Board, excluding all options. When theoptions are included, the corresponding figure is 28.0%.
30) Shareholder structure on Dec 31, 2001 Shareholders Total shares and votes
Companies Privately-held companies 53 2,757,953Financial and insurance institutions 13 384,900Public organizations 16 432,264Non-profit organizations 15 401,030Households/private persons 407 211,557International shareholders 2 200
The number of nominee-registered shares on Dec 31, 2001 was 65,500, or 1.56% of total shares andvotes.

- 36 -
31) Distribution of shareholdings on Dec 31, 2001No. of shares No. of % of No. of % of
shareholders shareholders shares total shares
1–100 155 30.45 12,119 0.29101–1,000 267 52.46 81,069 1.941,001–10,000 51 10.02 172,484 4.1210,001–100,000 32 6.29 1,173,204 28.01100,001–1,000,000 2 0.39 688,600 16.44Over 1,000,000 2 0.39 2,060,430 49.20
32) Option programs
The company has two valid option programs,the first launched in 1998 and the second in2000.
The 1998 options were allotted to keypersonnel and Board members of the RamirentEurope Group. The 150,000 options weredivided into 75,000 A options and 75,000 Boptions, all of which were subscribed for in the1998 financial year. Those subscribing for theoptions jointly own and control no more than3.9% of the company’s share capital and votes.The share subscription period for those holdingA options began on April 1, 2000 and will endon May 31, 2002. To date, no sharesubscriptions have been made.
The share subscription period for thoseholding B options will begin on April 1, 2002and will end on May 31, 2003. The sharesubscription price will be determined on thebasis of the results of the Ramirent EuropeGroup.
The options issued in 2000 and designated asC options were allotted to key personnel of theRamirent Group, including the CEOs and Boardmembers of companies in the Group.
The 400,000 options were all subscribed forin the 2000 financial year. Those subscribing forthe options jointly own and control no morethan approximately 9.6% of the company’s
share capital and votes.The share subscription period for those
holding the options will begin on May 1, 2002and end on April 30, 2004. The sharesubscription price will be the average trade-weighted price in the Helsinki Exchangesduring the period January 1– March 31, 2000.The subscription price of the share will bereduced after the period for determining thesubscription price and before the actualsubscription by the amount of dividendspayable on the record date of each dividend.However, the subscription price of the sharewill always be at least the par value of theshare.
The two option programs include more than 50key Group personnel, including insiders asdefined in the Companies Act, chapter 1,section 4.
The total holding of these persons in thecompany amounts, at the time of signing thefinancial statements for 2001 and prior to theexercising of the options, to 7.8% of thecompany’s shares and votes. After subscribingfor the options, and if they later exercise all theoptions to subscribe for shares, the amount mayrise to no more than 10.0% of the company’sshares and votes.

- 37 -
33) Board’s valid authorization to acquire and surrender the company’s own shares
The Board of Directors is authorized until April26, 2002 to acquire up to 206,000 of thecompany’s own shares, equal to 4.92% of thetotal number of shares.
The company can acquire its own shares inorder to develop the capital structure of thecompany, and/or to use them as payment in thecase of corporate or business acquisitions.The shares can be acquired by decision of theBoard of Directors either by means of publictrading on the Helsinki Exchanges or by makinga public offer of purchase concerning the sharesto be purchased.
The shares can be acquired at their marketvalue in public trading at the moment ofacquisition.
The authorization has not yet been used.
The Board is authorized until April 26, 2002 todecide on the surrender of the company’s ownacquired shares on the following conditions:
The authorization is valid for no more than206,000 shares.
The Board is authorized to decide to whomand in what order the company’s own shareswill be surrendered. The Board can decide onthe surrender of the company’s own shares inways which depart from the pre-emptive rightsof shareholders to purchase the company’s ownshares.The shares can be used as payment in cases ofcorporate or business acquisitions or when thecompany otherwise acquires business-relatedassets in a way and to the extent decided by theBoard.
The surrender price must be no less than themarket price quoted in the Helsinki Exchangesat the moment of surrender.
The authorization has not yet been used.
34) The Board’s valid authorization to decide on the execution of a private placement
The Board of Directors is authorized until April26, 2002 to decide on the raising of the sharecapital by one or more rights offerings, givingthe right to subscribe to no more than 430,000of the company’s new shares, equal to 10.27%of all the current shares, and in which thecompany’s share capital can be raised by a totalof no more than EUR 361,604.04.
The authorization entitles the Board to departfrom the pre-emptive rights of shareholders tosubscribe for new shares, and to decide on thesubscription prices and terms.
The authorizations departing from the pre-emptive rights of shareholders can be used
provided that there are weighty financialreasons from the company’s perspective, suchas the financing of corporate or businessacquisitions or other arrangements affecting thedevelopment of the company’s businessoperations. They cannot be made for the benefitof those who are counted as insiders of thecompany.
In the case where share capital is raised by arights offering, the Board of Directors isentitled to decide whether the shares can besubscribed for in kind, or otherwise onparticular conditions.
The authorization has not yet been used.

- 38 -
INCOME STATEMENT (EUR 1,000) 2001 2000 1999 1998 1997
Net sales 68,234 53,773 36,933 34,165 28,032Other operating income 275 194 734 1,108 1,035Operating profit before depreciation 20,949 18,169 12,701 12,376 9,999Depreciation 8,030 6,058 4,324 3,948 3,247Operating profit 12,919 12,111 8,377 8,428 6,752
Financial income and expenses -1,449 -728 -635 -864 -1,289Profit before extraordinary items 11,470 11,383 7,742 7,564 5,463Profit before appropriations and taxes 10,820 11,772 7,742 7,108 6,569Net profit for the year 7,469 8,259 5,081 3,543 3,098
BALANCE SHEET (EUR 1,000) 2001 2000 1999 1998 1997
Fixed assets 53,053 43,412 28,870 27,756 23,113Inventories 3,575 3,107 2,096 1,815 1,552Receivables 9,520 7,203 4,254 4,099 3,813Cash and bank receivables 3,498 1,746 969 518 1,052Shareholders’ equity 28,856 24,860 19,726 16,806 8,714Minority interests 3,951 2,945Interest-bearing debt 25,401 17,281 9,873 11,428 16,079 of which capital notes – – – 1,682 3,364Non interest-bearing debt 11,438 10,383 6,591 5,955 4,738Balance sheet total 69,646 55,469 36,190 34,189 29,531
KEY FIGURES FOR PERFORMANCE 2001 2000 1999 1998 1997
Increase in net sales 26.9% 45.6% 8.1% 21.8% 19.8%Operating profit before depreciation,% of net sales 30.7% 33.8% 34.4% 36.2% 35.7%Operating profit, % of net sales 18.9% 22.5% 22.7% 24.7% 24.1%Profit before extraordinary items,% of net sales 16.8% 21.2% 21.0% 22.2% 19.5%Profit before appropriations and taxes,% of net sales 15.9% 21.9% 21.0% 20.8% 23.4%Net profit for the year, % of net sales 10.9% 15.4% 13.8% 10.4% 11.1%Return on investment 25.3% 32.4% 29.2% 32.2% 28.3%Return on equity 25.9% 34.5% 32.5% 49.3% 73.4%Net debt (EUR million) 21.9 15.5 8.9 10.9 15.0Gearing 66.8% 55.9% 45.1% 64.9% 172.0%Equity ratio 47.2% 50.1% 54.6% 49.2% 29.5%Personnel (average) 600 469 329 320 294Personnel (at end of year) 629 524 317 322 291Gross investment in non-current assets(EUR million) 19.7 21.9 7,0 9,5 4,0Gross investment, % of net sales 28.9% 40.7% 19.1% 27.9% 14.3%
KEY FIGURES

- 39 -
KEY FIGURES PER SHARE 2001 2001 2000 1999 1998 1997
Earnings per share, EUR 1.83* 1.89 1.96 1.44 1.52 1.17Shareholders’equity per share, EUR 6.70* 6.89 5.94 4.78 4.07 2.10Dividend per share, EUR 0.84 0.84 0.67 0.67 0.40Payout ratio 44.8% 43.0% 46.8% 44.1% 34.2%Effective dividend yield 5.7% 6.0% 4.5% 5.3%Price/earnings ratio (P/E) 7.8 7.2 10.3 8.4Highest share price, EUR 15.60 15.98 15.98 16.82Lowest share price, EUR 12.00 11.94 10.26 10.60Average share price, EUR 13.89 13.79 12.78 13.96Share price on Dec 31, EUR 14.70 14.97 14.80 12.78Market capitalization on Dec 31,EUR million 61.6 62.4 61.3 52.8No. of shares traded 541,000 581,000 1,100,000 2,200,000No. of shares traded,% of total no. of shares 12.9% 13.9% 25.9% 52.5%
* The figure used for total number of shares on Dec 31, 2001 adjusted for the dillution effect of optionsis 4,297,234. The unadjusted number of shares on Dec 31, 2001 and on Dec 31, 2000 was 4,187,904and in earlier years 4,130,000.
CALCULATION OF KEY FIGURES
Return on equity (ROE),%:(Profit or loss before extraordinary
x 100items – taxes)
Shareholders’ equity + minority interest(average over the year)
Return on investment (ROI),%:(Profit or loss before extraordinary items +interest and other financial expenses)
x 100Balance sheet total – non-interest bearingdebts (average over the year)
Equity ratio:(Shareholders’ equity + minority interest) x 100Balance sheet total – advances received
Earnings per share (EPS):Profit before extraordinary items-taxes +-minority interest
Average number of shares, adjusted for shareissues, during the year
Shareholders’ equity per share:Shareholder’s equity
Number of shares, adjusted for share issues, onbalance sheet date
Payout ratio, %:Dividend per share
x 100Earnings per share
Net debt:Interest-bearing debt – cash and bankreceivables, and financial securities
Gearing:Net debt x 100Shareholders’ equity + minority interest
Dividend per share:Dividend paid
Number of shares
Effective dividend yield:Share-issue-adjusted dividend per share
x 100Share-issue-adjusted final tradingprice at end of financial year
Price/earnings ratio:Share-issue-adjusted final trading price
Earning per share
The key ratios were calculated in accordancewith the general instructions of the FinnishAccounting Standards Board of Dec 17, 1999

- 40 -
Proposal of the board on the distribution of profit
The Group’s distributable funds amount to EUR 14,131,668. The distributableretained earnings of the parent company are EUR 15,297,314.42, of which
the net profit for the year accounts for EUR 6,963,759.86.
The Board of Directors proposes to the Annual General Meeting that adividend of EUR 0.84 per share, of EUR 3,517,839.36 in total, be distributed.
Helsinki, 27 February 2002
Raimo Taivalkoski Thomas TallbergChairman Vice Chairman
Erkki Norvio Tuire MannilaCEO, Member of the Board Member of the Board
BOARD OF DIRECTORS’ PROPOSAL
Auditors’ note
The financial statements have been prepared in accordancewith the Finnish Standards on Accounting.
We have today issued a report on the audit performed by us.
Helsinki, 10 March 2002
KPMG WIDERI OY AB
Solveig Törnroos-HuhtamäkiAuthorized Public Accountant

- 41 -
Helsinki, 10 March 2002
KPMG WIDERI OY AB
Solveig Törnroos-HuhtamäkiAuthorized Public Accountant
AUDITORS’ REPORT
to the shareholders of Ramirent Plc
We have audited the accounting records and the financial statements, as wellas the administration by the Board of Directors and the Managing Director ofRamirent Plc for the year ended 31 December 2001. The financial statements
prepared by the Board of Directors and the Managing Director include the report ofthe Board of Directors, consolidated and parent company income statements,
balance sheets and notes to the financial statements. Based on our audit we expressan opinion on these financial statements and the company’s administration.
We have conducted our audit in accordance with Finnish Generally AcceptedAuditing Standards. Those standards require that we plan and perform the audit in
order to obtain reasonable assurance about whether the financial statements are freeof material misstatement. An audit includes examining, on a test basis, evidencesupporting the amounts and disclosures in the financial statements, assessing theaccounting principles used and significant estimates made by the management,
as well as evaluating the overall financial statement presentation.The purpose of our audit of the administration has been to examine thatthe Board of Directors and the Managing Director have complied with
the rules of the Finnish Companies Act.
In our opinion, the financial statements, showing a profit of EUR 7,469,030 inthe consolidated income statement and a profit of EUR 6,963,759.86 in the parent
company income statement, have been prepared in accordance with the FinnishAccounting Act and other rules and regulations governing the preparation of
financial statements in Finland. The financial statements give a true and fair view,as defined in the Finnish Accounting Act, of both the consolidated and parent
company result of operations, as well as the financial position.The financial statements can be adopted and the members of the Board of Directorsand the Managing Director of the parent company can be discharged from liabilityfor the financial year audited by us. The proposal made by the Board of Directorson how to deal with the result is in compliance with the Finnish Companies Act.
TRANSLATION

- 42 -
MEMBERS OF THE MANAGEMENT GROUP FROM THE LEFT.IN BACK: JORMA NYYSSÖLÄ, KARI AULASMAA, PETRI SÖDERHOLM,
KAUKO HIRVINEN, MIKA RIIKONEN.IN FRONT: REIJO FERNELIUS, ERKKI NORVIO, TUIJA KIRVES.

- 43 -
CORPORATE GOVERNANCE
Election of Board of Directorsand President & CEO
The Annual General Meeting elects the membersof the Board of Directors. The Board of Directorselects one of its members as Chairman. Membersof the Board of Directors are elected until furthernotice. There is no resignation rotation system.The Board of Directors appoints the President & CEO.
Position of President & CEO
The company’s Board of Directors has drawn upa written contract defining the main terms andconditions of employment of the President & CEO.
Management salaries and other benefits
The Board of Directors decides on the salary andother benefits of the President & CEO.The President & CEO decides on Managementsalaries and other benefits.
Board of Directors
Raimo Taivalkoski (born 1940), M.Sc. inEngineering, has served as Chairman of the Boardof the company and its predecessors since 1983.
Thomas Tallberg (born 1934), Doctor ofMedicine, has been a member of the Board ofDirectors since 1995. He is a docent in immunology.He has also served as Chairman of the Board ofJulius Tallberg Ab since 1967, and a member ofthe Board of Oy Fiskars Ab since 1967.
Erkki Norvio (born 1945), M.Sc. in Engineeringand Economics, has been a member of the Boardof the company and its predecessors since 1986.He is the President & CEO of Ramirent Plc. He isalso a member of the Board of the Federation ofFinnish Commerce and Trade, and Chairman of theBoard of the Association of Finnish TechnicalTraders.
Tuire Mannila (born 1956), M.Sc. in Economics,has been a member of the Board of Directors since1997.
Auditors
The company’s shareholders appoint at least oneand at most two auditors each year. At least one of
the auditors must be a firm of public accountantscertified by the Central Chamber of Commerce.The company’s present auditor is the certifiedpublic accounting firm of KPMG Wideri Oy Ab,with Solveig Törnroos-Huhtamäki APA as the mainauditor.
Management Group
Erkki Norvio is the President & CEO of thecompany and Chairman of the Management Group.He was appointed President & CEO in 1986.
Tuija Kirves, CFO and member of theManagement Group, education M.Sc. in Economics,in service since 2000. She is the Chief FinancialOfficer of Ramirent Plc.
Reijo Fernelius, Engineer, born 1942, responsiblefor the company’s regional sales and the followingproduct lines – Formwork & Support, andScaffolding & Weather Covers, in service since1977. Member of the Management Group. Currentshareholder interest through Gaspar Oy Ab.
Jorma Nyyssölä, responsible for Small Machinesand Equipment Rental Operations, member of theManagement Group, born 1946, in service since1991. Current shareholder interest through GasparOy Ab.
Kari Aulasmaa (born 1968), civil engineer, is theManagement’s representative in quality matters. Hehas served the company since 1996.
Petri Söderholm, Engineer, MBA, B.Sc., born1957, member of the Management Group,responsible for the network of outlets in Finland.He joined the company in 2001.
The personnel are represented on theManagement Group by Kauko Hirvinen andMika Riikonen.
Kauko Hirvinen (born 1953), is an area managerand has served the company since 1980.
Mika Riikonen (born 1970), is a sales negotiatorand has served the company since 1996.
Guidelines for insiders
The Board of Directors of Ramirent Plchas approved its own insider rules, which are incompliance with the insider guidelines issued bythe Helsinki Exchanges, the Central Chamber ofCommerce and the Confederation of FinnishIndustry and Employers.

- 44 -
16 €
15 €
14 €
13 €
12 €
11 €
10 €
9 €4 5 6 7 8 9 10 11 12 1 2 3 4 5 6 7 8 9 10 11 12 1 2 3 4 5 6 7 8 9 10 11 12
1999 2000 2001
1 2 3
500 000
400 000
300 000
200 000
100 000
04 5 6 7 8 9 10 11 12 1 2 3 4 5 6 7 8 9 10 11 12 1 2 3 4 5 6 7 8 9 10 11 12
1999 2000 2001
1 2 3
Share performance 1/1999–12/2001 (average monthly share price, euros)
Share turnover, number 1/1999–12/2001
SHARE TURNOVER AND PERFORMANCE (MONTHLY)

- 45 -
OUTLET NETWORK
Ramirent PlcHeadquarters: Helsinki, Viljatie 4 A, FIN-00701 Helsinki
Tel. +358 9 4174 2200Fax +358 9 351 5323, 351 5321E-mail: [email protected] or
[email protected]: www.ramirent.com
Alajärvi *)Juurikaskydöntie 5FIN-62900 AlajärviTel. +358 6 557 3380Fax +358 6 557 3307
EspooNiittyrinne 1FIN-02270 EspooTel. +358 9 804 1058Fax +358 9 804 1059
EspooPiispanmäentie 1FIN-02240 EspooTel. +358 9 2706 6250Fax +358 9 888 6468
Eura *)Feelintie 3FIN-27510 EuraTel./Fax:+358 2 865 3322
Forssa *)Koikkurintie 1FIN-30300 ForssaTel. +358 3 422 0500Fax +358 3 422 0222
HelsinkiSorvaajankatu 8FIN-00810 HelsinkiTel. + 358 9 2706 6280Fax +358 9 781 109
*) Dealer-outlet
HelsinkiRistipellontie 21FIN-00390 HelsinkiTel. +358 9 547 1533Fax +358 9 512 4551
HelsinkiKonemakasiiniMannerheimintie 13 BFIN-00100 HelsinkiTel. +358 9 2706 6272Fax +358 9 454 3776
HelsinkiPengerkatu 13 BFIN-00530 HelsinkiTel. +358 9 2706 6240Fax +358 9 870 3573
HelsinkiTapulikaupungintie 37FIN-00750 HelsinkiTel. +358 9 8503 1550Fax +358 9 2225 590
HelsinkiTehtaankatu 36FIN-00150 HelsinkiTel. +358 9 622 5292Fax +358 9 622 5296
HelsinkiViikkiKoetilantie 21FIN-00710 HelsinkiTel. +358 9 347 6612Fax +358 9 347 6898
HyvinkääRiihimäenkatu 5FIN-05900 HyvinkääTel. +358 19 454 258Fax +358 19 454 237
HämeenlinnaVanajantie 4FIN-13110HämeenlinnaTel. +358 3 616 5322Fax +358 3 616 5334
IisalmiYrittäjänkuja 6FIN-74130 IisalmiTel. +358 17 812 231Fax +358 17 812 232
ImatraLappeentie 55FIN-55100 ImatraTel. +358 5 436 6911Fax +358 5 436 6928
IvaloLintumaa PPA 2FIN-99800 IvaloTel. +358 16 667 881Fax +358 16 667 882
JoensuuNurmeksentie 6FIN-80100 JoensuuTel. +358 13 120 012Fax +358 13 226 072
Joutseno *)Varastokatu 2FIN-54100 JoutsenoTel. +358 5 416 1850
JyväskyläMiilukatu 1–5FIN-40320 JyväskyläTel. +358 14 411 3140Fax +358 14 411 3144
JämsänkoskiMetsurintie 3FIN-42300JämsänkoskiTel. +358 40 835 6424Fax +358 14 411 3144
KajaaniKettukalliontie 27FIN-87100 KajaaniTel. +358 8 625 955Fax +358 8 613 4072
Kannus *)Leppäojantie 7FIN-69100 KannusTel. +358 6 873 811Fax +358 6 873 515
KemiAsentajankatu 11FIN-94600 KemiTel. +358 16 254 761Fax +358 16 250 548

- 46 -
Kemijärvi *)Rinnetie 15FIN-98120 KemijärviTel. +358 16 815 489Fax +358 16 815 486
Kitee *)Hitsaajantie 6FIN-82500 KiteeTel. +358 13 228 550Fax +358 13 228 551
KittiläNikuntie 5FIN-99100 KittiläTel. +358 16 654 128Fax +358 16 654 122
KokkolaPatamäentie 10FIN-67100 KokkolaTel. +358 6 831 1114Fax +358 6 822 4260
KotkaJylpyntie 30FIN-48230 KotkaTel. +358 5 340 0580Fax +358 5 260 1080
KotkaValajantie 14FIN-48230 KotkaTel. +358 5 340 0640Fax +358 5 260 1005
KouvolaKaupinkatu 19FIN-45130 KouvolaTel. +358 5 375 4202Fax +358 5 375 4230
Kuhmo *)Kainuuntie 129FIN-88900 KuhmoTel. +358 8 655 0051Fax +358 8 655 0329
KuopioVolttikatu 5FIN-70700 KuopioTel. +358 17 282 2900Fax +358 17 282 2125
KuopioTulliportinkatu 5FIN-70100 KuopioTel. +358 17 368 0240Fax +358 17 362 0230
KuusamoLuomantie 11FIN-93600 KuusamoTel. +358 8 852 2506Fax +358 8 852 2300
KuusankoskiKiltakuja 2FIN-45740 KuusankoskiTel. +358 5 375 3070Fax +358 5 375 3060
LahtiLaakerikatu 5FIN-15700 LahtiTel. +358 3 526 0216Fax +358 3 787 5049
LahtiVipusenkatu 19FIN-15230 LahtiTel. +358 3 526 0210Fax +358 3 733 0005
LappeenrantaEteläkatu 12FIN-53500LappeenrantaTel. +358 5 635 3360Fax +358 5 635 3370
LappeenrantaSimolantie 12FIN-53600LappeenrantaTel. +358 5 451 2110Fax +358 5 451 2436
Lieksa *)Kerantie 15FIN-81720 LieksaTel. +358 13 522 611Fax +358 13 524 633
Luumäki *)Linnalantie 67FIN-54500 TaavettiTel. +358 5 610 8100Fax +358 5 610 8120
MikkeliYrittäjänkatu 10FIN-50130 MikkeliTel. +358 15 210 299Fax +358 15 213 411
Muonio *)FIN-99300 MuonioTel. +358 16 532 511Fax +358 16 532 530
NurmesTeollisuustie 8FIN-75530 NurmesTel. +358 13 482 560Fax +358 13 482 562
Närpiö *)Vaasantie 23FIN-64200 NärpiöTel. +358 6 224 3467Fax +358 6 224 1800
OittiKeskustie 20FIN-12100 OittiTel. +358 19 782 999Fax +358 19 782 903
Oulu AlppilaKaarnatie 28FIN-90530 OuluTel. +358 8 571 2300Fax +358 8 571 2301
Oulu LimingantulliKrouvintie 7 AFIN-90400 OuluTel. +358 8 331 590,
331 591Fax +358 8 331 592
Outokumpu *)Polvijärventie 19FIN-83500 OutokumpuTel. +358 13 550 917Fax +358 13 554 010
PelloPajatie 6FIN-95700 PelloTel. +358 16 513 381Fax +358 16 513 385
Pieksämäki *)Myllykatu 1FIN-76100 PieksämäkiTel. +358 15 348 881Fax +358 15 348 883
PietarsaariPermonkaarre 121FIN-68600 PietarsaariTel. +358 6 762 2180Fax +358 6 762 2181
PoriTavaratie 4FIN-28130 PoriTel. +358 2 528 3860Fax +358 2 528 3866
PorvooAsentajantie 9FIN-06150 PorvooTel. +358 19 2706 6270Fax +358 19 536 7271
RaahePajakatu 2FIN-92100 RaaheTel. +358 8 223 6406Fax +358 8 223 6407
RaumaHakuninvahe 1FIN-26100 RaumaTel. +358 2 824 0211Fax +358 2 822 4156
RaumaAker Finnyards -projectP.O.Box 302,FIN-26101 RaumaTel./Fax +358 12 836 4688
RovaniemiAittatie 15FIN-96100 RovaniemiTel. +358 16 311 666Fax +358 16 311 760

- 47 -
*) Dealer-outlet
SaloPerämiehenkatu 22FIN-24100 SaloTel. +358 2 733 1433Fax +358 2 733 1453
SavonlinnaMyllypuronkatu 3FIN-57220 SavonlinnaTel. +358 15 259 933Fax +358 15 259 927
SeinäjokiKauppaneliö 10FIN-60120 SeinäjokiTel. +358 6 420 8900Fax +358 6 414 1063
Siilinjärvi *)Oppipojantie 3FIN-71800 SiilinjärviTel. +358 17 462 5890Fax +358 17 462 5082
SköldvikFIN-06850 KullooTel. +358 9 278 8400Fax +358 9 278 8771
Suomussalmi *)Hallitie 1FIN-89600SuomussalmiTel./Fax+358 8 711 200
Suonenjoki *)Lentokentänkatu 2FIN-77600 SuonenjokiTel. +358 17 512 390Fax +358 17 511 844
Taivalkoski *)Haaraniementie 10FIN-93400 TaivalkoskiTel. +358 8 829 6542
TampereVihiojantie 22FIN-33800 TampereTel. +358 3 3141 3800Fax +358 3 3141 3811
TampereEnqvistinkatu 3FIN-33400 TampereTel. +358 3 348 2500Fax +358 3 348 4146
TornioKisällinkatu 10FIN-95420 TornioTel. +358 16 446 331Fax +358 16 446 332
TornioAvesta Polarit -projectFIN-95400 TornioTel. +358 16 454 263Fax +358 16 454 265
Turku CentrumKalevantie 9–11FIN-20520 TurkuTel. +358 2 413 8555Fax +358 2 469 2949
TurkuRydöntie 24FIN-20361 TurkuTel. +358 2 518 3580Fax +358 2 518 3585
TurkuPuutarhakatu 34FIN-20100 TurkuTel. +358 2 230 5600Fax +358 2 230 5602
TurkuTelekatu 12FIN-20360 TurkuTel. +358 2 435 6400Fax +358 2 235 4999
TuusulaMahlamäentie 66FIN-04130 TuusulaTel. +358 9 275 5233Fax +358 9 275 5210
VaasaKairatie 1FIN-65350 VaasaTel. +358 6 315 4300Fax +358 6 315 4727
ValkeakoskiHuhtakatu 13FIN-37600 ValkeakoskiTel. +358 3 585 0351Fax +358 3 585 0354
VantaaTiilitie 5FIN-01720 VantaaTel. +358 9 2706 6230Fax +358 9 853 2782
VantaaPorttisuontie 11FIN-01200 VantaaTel. +358 9 877 0740Fax +358 9 278 8660
VantaaArinatie 8FIN-01510 VantaaTel. +358 9 825 4670Fax +358 9 8254 6733
VarkausKäsityökatu 45 AFIN-78210 VarkausTel. +358 17 556 4621Fax +358 17 556 4622
Viitasaari *)Mustasuontie 22FIN-44500 ViitasaariTel. +358 14 571 805Fax +358 14 571 808
YlivieskaRatakatu 17FIN-84100 YlivieskaTel. +358 8 424 448Fax +358 8 424 408
Äkäslompolo *)FIN-95970 ÄkäslompoloTel. +358 40 572 4354Fax +358 16 569 139
ÄänekoskiTeollisuuskatu 31FIN-44150 ÄänekoskiTel. +358 14 519 3560Fax +358 14 519 3566
DEPOTSANDMAINTENANCECENTERS
HyvinkääMuovikatu 4FIN-05800 HyvinkääTel. +358 19 485 430Fax +358 19 485 436
KempeleMullukantie 7FIN-90440 KempeleTel. +358 8 570 2340Fax +358 8 570 2345
Maintenance andrepairing, HelsinkiTapulikaupungintie 37FIN-00750 HelsinkiTel. +358 42 433 031Fax +358 9 838 60 850
KuopioDepot and repairingVolttikatu 5FIN-70700 KuopioTel. +358 17 2822 086Fax +358 17 2822 421
Leppävirta(Portable spacial units)TeollisuustieFIN-79100 LeppävirtaTel. +358 17 554 0140Fax +358 17 554 0120
Suutarila(Portable spacial units,tower cranes, spare parts)Tapulikaupungintie 37FIN-00750 HelsinkiTel. +358 42 433 031Fax +358 9 8386 0850
Tuusula(Scaffolding, weather covers)Louhostie 5FIN-04300 TuusulaTel. +358 9 275 7051Fax +358 9 275 7052

- 48 -
SUBSIDIARIES
Rami-Cranes OyTapulikaupungintie 37FIN-00750 HelsinkiTel. +358 424 3303 1Fax +358 9 8386 0850E-mail:[email protected]
Teline-Rami OyLouhostie 5FIN-04300 TuusulaTel. +358 9 274 4480Fax +358 9 275 7052E-mail:[email protected]
Uudenmaan Telineykköset OyLouhostie 5FIN-04300 TuusulaTel. +358 9 275 7051Fax +358 9 275 7052E-mail:[email protected]
Sköldvik industrial areaNybyntie 74FIN-06850 KullooTel. +358 19 653 454Fax +358 19 653 452E-mail:[email protected]
Ramirent Europe OyViljatie 4 AFIN-00700 HelsinkiTel. +358 9 417 42 200Fax +358 9 351 5323Internet: www.ramirent.comE-mail:[email protected]
ZAO TechrentUl. Zoi i AleksandraKosmodemjanskih 26/21125130 Moscow, RussiaTel. +7-095-150 9319,
150 9778Fax +7-095-150 9317E-mail:[email protected]
OutletMytischiTel./fax +7-095-586 9270
OutletMarina RoschaTel./fax +7-095 219 2660
ZAO PeterrentPolevaja Sabirovskaja 44197183 St. Petersburg, RussiaTel. +7-812-327 6294Fax +7-812-393 4475E-mail:[email protected]
Ramirent ASLaki 11 d,EE-12915 Tallinn, EstoniaTel. +372-656 2707Fax +372-656 3454E-mail:[email protected]
OutletSuur-SõjamäeSuur-Sõjamäe 4EE-11415 TallinnTel. +372 603 1980Fax +372 603 1984
Project outletEesti ElektrijaamNarvaMr. Urmas HepnerMob.tel. +372 502 8059
Saaremaa *AS Siim EhitusPikk 62EE-93817 Kuressaare, EstoniaTel. +372 453 8771
Pärnu *OÜ DaktEnergia 4EE-80042 Pärnu, EstoniaTel. +372 440 715 0370
A-Ramirent SIABikernieku 121Riga LV 1079, LatviaTel. +371-784 0522Fax +371-784 0521E-mail:[email protected]
OutletMukusalasMukusalas iela 41 bRiga, LV 1004, LatviaTel. +371 762 8264Fax +371 762 8265E-mail:[email protected]
OutletVentspilsKustes dambis 6Ventspils, LV 3602, LatviaTel. +371 366 3099Fax +371 366 3099E-mail:[email protected]
OutletValmieraMurmuizas iela 11Valmiera, LatviaTel. +371 646 54 46Fax +371 428 10 19
OutletDaugavapils1.pasazieru iela 4Daugavapils, LatviaTel. +371 956 31 90E-mail:[email protected]

- 49 -
Outlet LiepajaTel. +371 943 38 74E-mail:[email protected]
SIA VIA TEHKruzes iela 3 ARiga, LV 1046, LatviaTel. +371 761 6032Fax +371 761 4044
A-Ramirent UABTitnago g. 192600 Vilnius, LithuaniaTel. +370-2-322 140Fax +370-2-322 141E-mail:[email protected]
OutletKlaipedaTaikos pr. 615800 Klaipeda, LithuaniaTel. +370 6 346 009Fax +370 6 346 309E-mail:[email protected]
OutletKaunasIX forto plentas 60Kaunas, LithuaniaTel. +370 7 377 642Fax +370 7 377 589E-mail:[email protected]
Rami Polska Sp z o.o.Ul. Rozdzienskiego 214PL 40-201 Katowice, PolandE-mail:[email protected]
Mast-Rent Sp z o.o.Al. Krakowska 10 APL 02-284 Warsaw, PolandTel. +48 22 868 3583Fax +48 22 868 2242
Rema-Rental S.A.Ul. Swierczewska 3PL 71-066 Szczecin, PolandTel. +48 91 432 3410Fax +48 91 432 3411E-mail:[email protected]
OutletSzczecinUl. Gdanska 12/1370-661 Szczecin, PolandTel. +48 91 432 3410Fax +48 91 432 3411E-mail:[email protected]
OutletGdyniaUl. Sw. Mikolaja 59PL 81-062 Gdynia, PolandTel. +48 58 663 7730Fax +48 58 663 1036E-mail:[email protected]
OutletKatowiceUl. Rozdzienskiego 214PL 40-201 Katowice, PolandTel. +48 32 258 6216Fax +48 32 203 9800E-mail:[email protected]
OutletCzeladz-PlatformaUl. Handlowa 9PL 41-250 Czeladz, PolandTel. +48 32 368 1608Fax +48 32 368 1618E-mail:[email protected]
OutletCracowUl. Soltysowska 14 aPL 31-587 Cracow, PolandTel. +48 12 292 4074Fax +48 12 292 4075E-mail:[email protected]
OutletCracowUl. Zakopianska 52APL 30-418 Cracow, PolandTel. +48 12 260 6860Fax +48 12 267 0767E-mail:[email protected]
OutletWarsawAl. Jerozolimskie 204PL 02-486 Warsaw, PolandTel. +48 22 578 8508Fax +48 22 578 8518E-mail:[email protected]
OutletPoznanUl. Janikowska 19PL 61-070 Poznan, PolandTel. +48 61 815 1028Fax +48 61 815 1091E-mail:[email protected]
OutletWroclawUl. Strzegomska 36/40PL 53-611 Wroclaw, PolandTel. +48 71 359 1241Fax +48 71 359 1236E-mail:[email protected]
*) Dealer-outlet

Ramirent PlcHeadquarters: Helsinki, Viljatie 4 A,
FIN-00701 HelsinkiTel. +358 9 4174 2200
Fax +358 9 351 5323, 351 5321E-mail: [email protected] or
[email protected]: www.ramirent.com


