ANNUAL PERFORMANCE REPORT (APR)
26
ANNUAL PERFORMANCE REPORT (APR) Cheryl VanNoy Accountability/Assessment and Technology Services July 27, 2021
Transcript of ANNUAL PERFORMANCE REPORT (APR)

ANNUAL PERFORMANCE REPORT (APR)
Cheryl VanNoyAccountability/Assessment and Technology Services
July 27, 2021

q History of Missouri Assessment Programq Details of the APRq Changes for the 2019 APR and beyond APRq MSIP VIq Summaryq Questions
ANNUAL PERFORMANCE REPORT (APR)

MSIP TIMELINE

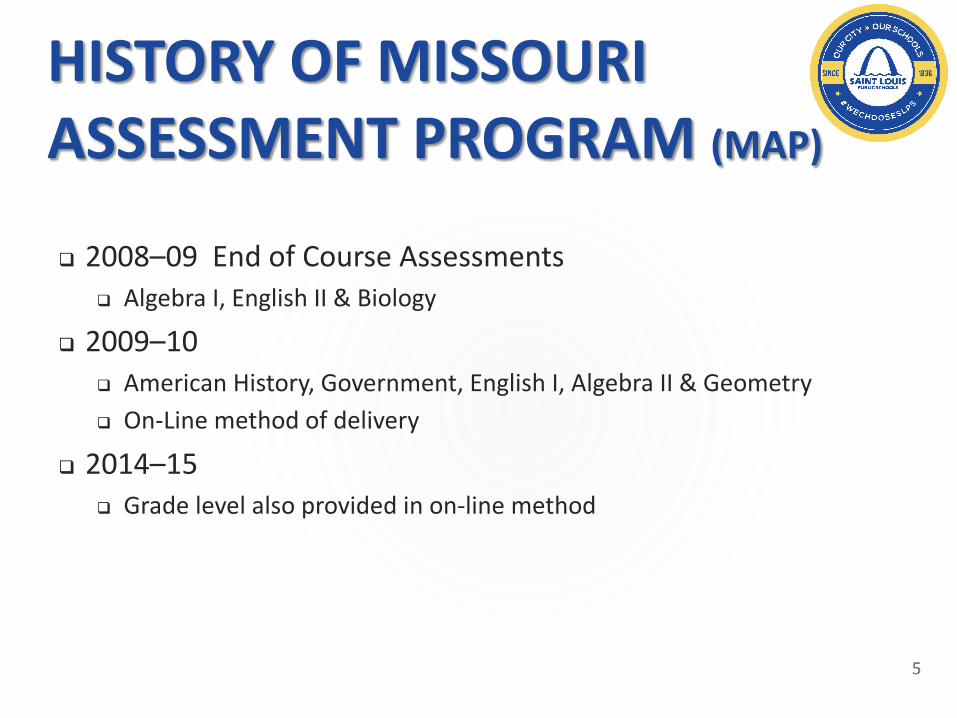
HISTORY OF MISSOURI ASSESSMENT PROGRAM (MAP)
q Created in 1993 – Outstanding Schools Actq Began with grade span assessments
q 3rd, 7th & 11th in Communication Artsq 4th, 8th & 10th in Mathematicsq 3rd, 7th & 10th in Science
q No Child Left Behind – 2001q Required annual assessments in Communication Arts & Math for
3rd through 8th grade and once in High Schoolq Phased in approach with Science
q Assessed in 5th, 8th and once in High School
HISTORY OF MISSOURI ASSESSMENT PROGRAM (MAP)
q 2008–09 End of Course Assessmentsq Algebra I, English II & Biology
q 2009–10 q American History, Government, English I, Algebra II & Geometryq On-Line method of delivery
q 2014–15q Grade level also provided in on-line method

CHANGES IN ASSESSMENTSqMultiple changes in test questions have occurred since 1993
q Grade Level Assessments (GLA)q Show Me Standards
q Grade Level Expectations (GLE)q Course Level Expectations (CLE)
q Missouri Learning Standards (MLS)q Common Core – Race to the Top requirements (Smarter Balance/PARCC)q Data Recognition Corporation (DRC)q Missouri Learning Standards (MLS)q Field Tests
q Inside each of these, there were changes in question types, skillsassessed, scoring modifications along with additions & removalsof specific assessments (due to scoring anomalies)

HISTORY OF THE APRqPrevious versions of MSIP
q Based on standards and/or pointsq Processes were reviewedq Performance was measuredq Metrics were setq Accreditation was determined
q Information was designed to provide feedback to DistrictsqAPRs were available to DistrictqSome years, schools also had an APR

SLPS - HOW WE GOT HERE

MSIP Standard/Indicator2006
Met/Not Met
2007Met/Not
Met
2008Met/Not
Met
2009Met/Not
Met
2010Met/Not
Met
2011Met/Not
Met
2012Met/Not
Met9.1*1 MAP Grades 3-5 Math Met Not Met Not Met Not Met Not Met Not Met Not Met9.1*2 MAP Grades 3-5 CA Met Not Met Met Not Met Not Met Not Met Not Met9.1*3 MAP Grades 6-8 Math Not Met Not Met Not Met Not Met Not Met Not Met Not Met9.1*4 MAP Grades 6-8 CA Not Met Not Met Not Met Not Met Not Met Not Met Not Met9.1*5 MAP Grades 9-11 Math Not Met Not Met Not Met Not Met Not Met Not Met Met9.1*6 MAP Grades 9-11 CA Not Met Not Met Not Met Not Met Not Met Not Met Not MetBonus MAP Achievement Not Met Not Met Met Met Met Met Not MetSubject Area/EOC Bonus Not Met Not Met Not Met Not Met Not Met Not Met Not Met9.3 ACT Not Met Not Met Not Met Not Met Not Met Not Met Not Met9.4*1 Advanced Courses Met Met Met Met Met Met Met9.4*2 Career Education Courses Not Met Not Met Not Met Not Met Met Met Met9.4*3 College Placement Not Met Not Met Not Met Met Met Met Met9.4*4 Career Education Placement
Met Met Met Not Met Met Met Met
9.5 Graduation Rate Not Met Not Met Not Met Not Met Not Met Met Met9.6 Attendance Rate Not Met Not Met Not Met Not Met Not Met Not Met Met9.7 Subgroup Achievement Not Met Not Met Not Met Not Met Not Met Not Met Not MetTotal Standards Met 4 2 4 3 5 6 7
SUMMARY OF APR –MSIP III & MSIP IV St. Louis City
CURRENT SYSTEM
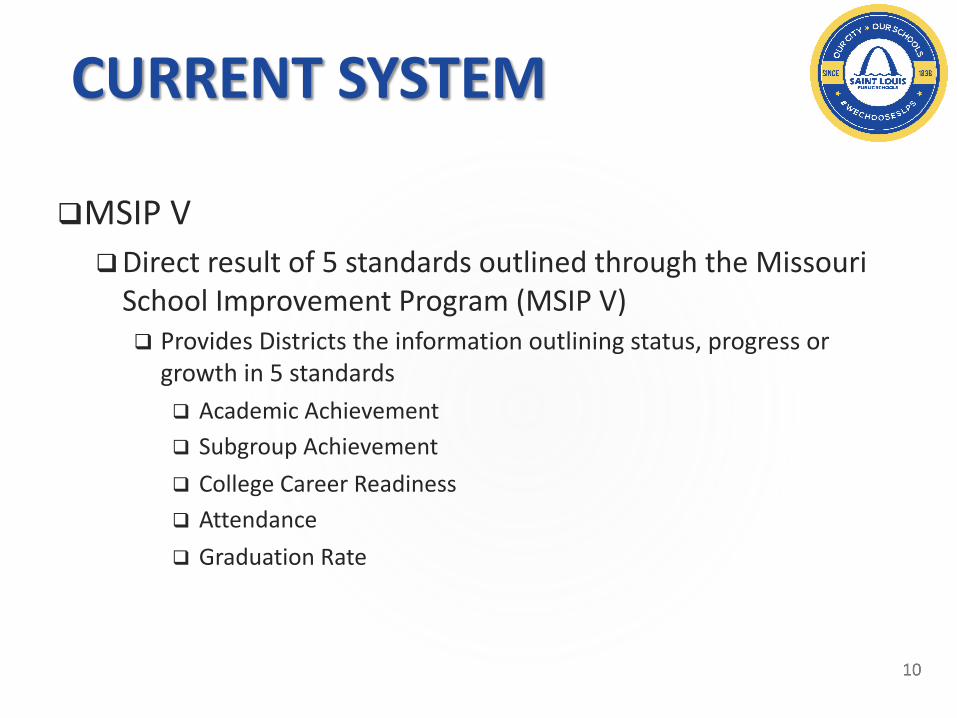
qMSIP VqDirect result of 5 standards outlined through the Missouri
School Improvement Program (MSIP V)q Provides Districts the information outlining status, progress or
growth in 5 standardsq Academic Achievementq Subgroup Achievementq College Career Readinessq Attendanceq Graduation Rate

HISTORICAL APR RESULTSMSIP IV District Name: St. Louis City
Standard 2012-13 2013-14 2014-15 2015-16 2016-17 2017-18Academic Achievement
ELA 0 6 12 12 12 12Math 0 0 12 12 12 12Science 0 6 3 0 0Social Studies 0 0 6 8 6 6
Subgroup AchievementELA 0 0 3 3 3 3Math 0 0 3 3 3 3Science 0 2 2 1 1Social Studies 0 0 1.5 1.5 1.5 1.5
CCR3.1.3 (ACT, SAT, ASVAB) 0 2 8 6 6 63.1.4 (Dual Enrolled, IB, AP) 8 6 8 8 6 9.53.5-6 (180 Followup) 0 6 8 10 10 9.5Attendance 4 10 10 10 7.5 7.5Graduation Rate 4 year x x x x x
5 year x x 30 x x6 year x 22.5 x 30 x 187 year x x x x 30
Total 12 60.5 106.5 104.5 98 88Percentage 8.6% 43.2% 76.1% 74.6% 70.0% 71.0%

PREVIOUS APR REPORTS

APR CHANGES IN 2019q Past APRs provided points in each of the 5 standards outlined previouslyq DESE provided results in 1 of 4 categories for each of the standards
q Floorq Approachingq On Trackq Target
q APRs with points outlined will only be produced for those 5 Districts inthe state who are not fully accredited
q Districts can still use the information to identify:q Reflect on successes and weaknesses in the standardsq Use data to restructure or modify current practices or proceduresq Provide information to their stakeholdersq Set internal goals for each school and district

2019 APR REPORTS

Reporting Changes Standards Applicable: All The MSIP 5 policy goals include the following: Articulate the State’s Expectations Distinguish the Performance of Schools and Districts Empower all Stakeholders Promote Continuous Improvement and Innovation
The 2019 APR summary pages will not include the calculation of points or thepercentage of points earned, but will include data visualizations of the districtsgrowth, progress and status as compared to state level data.Comprehensive
INFORMATION RELEASEDCOMMISSIONER’S MEETINGAugust of 2019

The2019APRsummarypagesdidnotincludethecalculationofpointsorthepercentageofpointsearned,butincludeddatavisualizationsofthedistrictsgrowth,progressandstatusascomparedtostateleveldata.

q ELA – 76.8% of our elementary schools saw significant growthq Math – Almost 70% of our elementary schools saw significant
growthq Math – 50% of our middle schools saw significant growthq High School Follow-Up – 85.7% of our high schools achieved in
the “On Track or Exceeding Level”q High School Graduation Rate – 64.3% of our high schools
achieved in the On Track or Exceeding Level
SUMMARY FROM 2018-2019 APR

2019-2020 AND 2020-20212019-20q No APR was produced due to
waiver from Federal Government for MAP & EOC
2020-21q Assessments were given
q All were in-personq Reduced test questions by 25%q More Flexibility – extended
windowsq 85% participation rate was
expectedq Will allow a window in the Fall
to reach this participation (if needed)
2020-21 (continued)q DESE will share scores
q State, District, School Levelq Through a Report Card format
q Due to COVID-19 impact, no APR will be produced (2nd year)
q Longitudinal comparisons will not be possible
q Districts can use results to assess the need for individual student support
Sources: CCR-21-002CCR-21-005CCR-21-006

GOING FORWARD

MSIP VILeadership (L) – Board & Administrationq School Board Leadershipq Ethicsq Continuous School
Improvementq Operations & Resource
Managementq School Board Policyq Superintendent Roles,
Responsibility & Evaluationq Personnel & Program
Evaluationq Communicationq Personnelq School Safety
Performanceq Effective Teaching &
Learning (TL)q Collaborative Climate and
Culture (CC)q Data-Based Decision Making
(DB)q Alignment of Standards,
Curriculum and Assessment (AS)
q Equity and Access (EA)
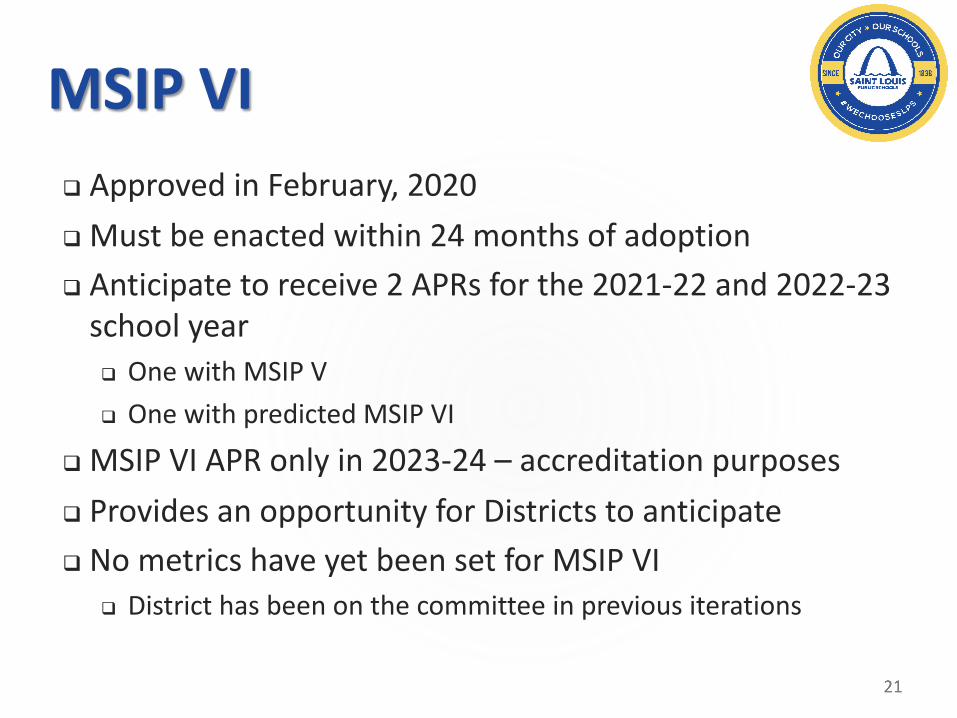
MSIP VIq Approved in February, 2020q Must be enacted within 24 months of adoptionq Anticipate to receive 2 APRs for the 2021-22 and 2022-23
school yearq One with MSIP V q One with predicted MSIP VI
q MSIP VI APR only in 2023-24 – accreditation purposesq Provides an opportunity for Districts to anticipateq No metrics have yet been set for MSIP VI
q District has been on the committee in previous iterations

CHANGES ON HORIZON
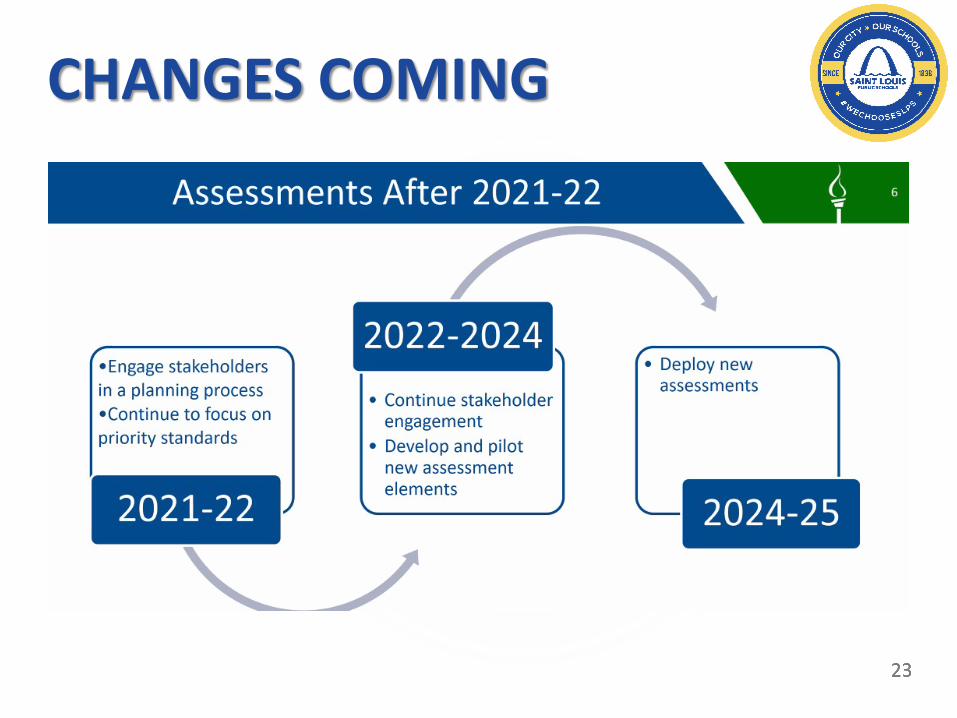
CHANGES COMING

CHANGES COMING

CHANGES COMING

QUESTIONS