Annual Partnership Performance Report 2013 - dfat.gov.au€¦ · IDC Indefinite Delivery Contracts...
90
Australian Aid—managed by GRM International on behalf of the Australian Government FINAL REPORT Annual Partnership Performance Report 2013
Transcript of Annual Partnership Performance Report 2013 - dfat.gov.au€¦ · IDC Indefinite Delivery Contracts...

Australian Aid—managed by GRM International on behalf of the Australian Government
FINAL REPORT
Annual Partnership Performance
Report 2013


ANNUAL PARTNERSHIP PERFORMANCE REPORT 2013 iii
TABLE OF CONTENTS
TABLE OF CONTENTS III
LIST OF TABLES IV
LIST OF FIGURES IV
ABBREVIATIONS AND ACRONYMS V
ACKNOWLEDGEMENTS VIII
EXECUTIVE SUMMARY IX
1 INTRODUCTION 1
2 COMPONENT 1: SCHOOL CONSTRUCTION 7
3 COMPONENT 2: SCHOOL AND DISTRICT MANAGEMENT 17
4 COMPONENT 3: ISLAMIC SCHOOL ACCREDITATION 25
5 COMPONENT 4: ANALYTICAL AND CAPACITY DEVELOPMENT PARTNERSHIP 33
6 BENEFICIARIES 42
7 MANAGEMENT AND GOVERNANCE 46
8 CONCLUSIONS 55
ANNEX I – EP LOGIC ARCHITECTURE 60
ANNEX II – INTERPRETATION OF DAC CRITERIA 61
ANNEX III - APPR RATING SCALE (BASED ON DFAT QRS [QAI AND ICR]) 62
ANNEX IV – LIST OF KEY DOCUMENTS AND SECONDARY SOURCES REVIEWED 63
ANNEX V – EP ANALYTICAL FRAMEWORK 2013 65
ANNEX VI – LIST OF KEY PERSONS CONSULTED 70
ANNEX VII – ECBP M&E STANDARDS STANDARD 3: INITIATIVE PROGRESS REPORTING 72

ANNUAL PARTNERSHIP PERFORMANCE REPORT 2013 iv
LIST OF TABLES
Table 1: Confirmed schools in Cycles 1 and 2 ................................................................................... 11
Table 2: Component 1 scorecard ..................................................................................................... 15
Table 3: Component 1 key findings and recommendations .............................................................. 16
Table 4: Persons trained by C2 (to end of November 2013).............................................................. 19
Table 5: Component 2 scorecard ..................................................................................................... 23
Table 6: Component 2 key findings and recommendations .............................................................. 24
Table 7: C3 Phase 1 and Phase 2 support to Madrasah .................................................................... 26
Table 8: Distribution of findings for C3 POM audits .......................................................................... 28
Table 9: Component 3 scorecard ..................................................................................................... 31
Table 10: Component 3 key findings and recommendations ............................................................ 32
Table 11: Progress against ACDP workplan (as at 30 November 2013) ............................................. 34
Table 12: Component 4 scorecard ................................................................................................... 39
Table 13: Component 4 key findings and recommendations ............................................................ 40
Table 14: Beneficiaries key findings and recommendations ............................................................. 45
Table 15: Governance and management key findings and recommendations .................................. 51
Table 16: Combined scorecard......................................................................................................... 55
LIST OF FIGURES
Figure 1: Schools construction in 2012-13 (Cycle 1 and 2) .................................................................. 9
Figure 2: Proportion of districts nationwide with low/high GER ....................................................... 10

ANNUAL PARTNERSHIP PERFORMANCE REPORT 2013 v
ABBREVIATIONS AND ACRONYMS
English Indonesian
ACDP Analytical and Capacity Development
Partnership
Kemitraan untuk Pengembangan Kapasitas dan
Analisis
ADB Asian Development Bank Bank Pembangunan Asia
AIBEP Australia Indonesia Basic Education
Program Program Pendidikan Dasar Australia - Indonesia
APBN National Budget Anggaran Pendapatan dan Belanja Negara
APPR Annual Partnership Performance Report Laporan Tahunan Kinerja Kemitraan
AUD Australian Dollar Dolar Australia
Balitbang National Office for Research and
Development Badan Penelitian dan Pengembangan
BAN-S/M
Board of National Accreditation –
School/Madrasah Badan Akreditasi Nasional-Sekolah/Madrasah
Bappenas Ministry of National Development
Planning Badan Perencanaan Pembangunan Nasional
BOS School Operational Grants Bantuan Operasional Sekolah
BOS SM Operational Grants for Secondary School Bantuan Operasional Sekolah – Sekolah
Menengah
BPU Common Learning Materials Bahan Pembelajaran Umum
BSM Cash Transfer for Poor Students Bantuan Siswa Miskin
C1 Component 1 of the Education
Partnership: School Construction
Komponen 1 Kemitraan Pendidikan:
Pembangunan Sekolah
C2 Component 2 of the Education
Partnership: Capacity Building
Komponen 2 Kemitraan
Pendidikan:Pembangunan Kapasitas
C3 Component 3 of the Education
Partnership: Madrasah Accreditation
Komponen 3 Kemitraan Pendidikan: Akreditasi
Madrasah
C4 Component 4 of the Education
Partnership: ACDP Komponen 4 Kemitraan Pendidikan: ACDP
CAT Core Advisory Team Tim Penasehat Inti
CMC Construction Management Consultant Konsultan Manajemen Pembangunan Sekolah
CPD Continuous Professional Development Pengembangan Keprofesian Berkelanjutan
Kepala Sekolah / Madrasah
CRS Construction Reporting System Sistem Pelaporan Pembangunan Sekolah
DAC Development Assistance Committee Komite Bantuan Pembangunan
DAK Specific-Purpose Grant Dana Alokasi Khusus
DEO District Education Official Pejabat Dinas Pendidikan Tingkat Kabupaten
DFAT Department of Foreign Affairs and Trade Departemen Luar Negeri dan Perdagangan
Australia
DIPA Budget Implementation Registration Form Daftar Isian Pelaksanaan Anggaran
EBR Evaluation Baseline Report Laporan Baseline Evaluasi
ECBP Evaluation Capacity Building Program Program Peningkatan Kapasitas Evaluasi
EOCO End of Component Outcome Tujuan Akhir Komponen
EOPO End of Partnership Outcome Tujuan Akhir Kemitraan/Program

ANNUAL PARTNERSHIP PERFORMANCE REPORT 2013 vi
English Indonesian
EP Australia’s Education Partnership with
Indonesia Kemitraan Pendidikan Australia-Indonesia
EP-PMS Education Partnership – Performance
Management System
Sistem Manajemen Kinerja Kemitraan
Pendidikan Australia-Indonesia
ESSP Education Sector Support Program Program Dukungan untuk Sektor Pendidikan
FM Field Monitor Petugas Pemantau Lapangan
GA Grant Agreement Kesepakatan Hibah
GER Gross Enrolment Rate Angka Partisipasi Kasar (APK)
GoA Government of Australia Pemerintah Australia
GOG Governance Oversight Group Kelompok Pengawasan Tata Kelola
Pemerintahan
GoI Government of Indonesia Pemerintah RI
HI-ECD Holistic Integrated – Early Childhood
Development
Program Pendekatan Menyeluruh dan Terpadu
untuk Perkembangan Anak Usia Dini
ICR Independent Completion Reporting Laporan Independen Penyelesaian Program/
Kegiatan
IDC Indefinite Delivery Contracts Kontrak Pelaksanaan Tidak Tentu
ITOG Infrastructure Technical Oversight Group Kelompok Pengawasan Teknis Infrastruktur
JSE Junior Secondary Education Pendidikan Sekolah Menengah Pertama
JTU Joint Technical Unit Unit Teknis Gabungan
K2P Knowledge to Policy Dasar Pengetahuan untuk Kebijakan
Kandep District Office of MoRA Kantor Departmen Agama
Kanwil Provincial Office of MoRA Kantor Wilayah Departmen Agama
KKM Madrasah Principal Working Group Kelompok Kerja Kepala Madrasah
KPI Key Performance Indicator Indikator Kinerja Utama
M&E Monitoring and Evaluation Monitoring dan Evaluasi
MDC Madrasah Development Center Pusat Pengembangan Madrasah
MI Islamic Elementary School Madrasah Ibtidaiyah
MoEC Ministry of Education and Culture Kementerian Pendidikan dan Kebudayaan
MoRA Ministry of Religious Affairs Kementerian Agama
MToG Madrasah Technical Oversight Group Kelompok Pengawasan Teknis Madrasah
MTs Islamic Junior Secondary School Madrasah Tsanawiyah
NES National Education Standard Standar Nasional Pendidikan
OECD Organization for Economic Co-operation
and Development
Organisasi untuk Kerja Sama Ekonomi dan
Pembangunan
OMT Operational Management Team Tim Manajemen Operasional
PAF Performance Assurance Framework Kerangka Penjaminan Kinerja
PD Professional Development Pengembangan Profesi
PDSP MOEC Centre for Education Data and
Statistics Pusat Data dan Statistik Pendidikan
Penma MORA Directorate of Madrasah Education Direktorat Pendidikan Madrasah
PISA Program for International Student
Assessment Program Penilaian Siswa tingkat Internasional

ANNUAL PARTNERSHIP PERFORMANCE REPORT 2013 vii
English Indonesian
PKB KS/M Continuing Professional Development for
School/ Madrasah Principals
Pengembangan Keprofesionalan Berkelanjutan
bagi Kepala Sekolah/ Madrasah
PMF Performance Milestone Framework Kerangka Capaian Kinerja
PMU Twelve Years Universal Education Pendidikan Menengah Universal 12 Tahun
POM Performance Oversight and Monitoring Monitoring dan Pengawasan Kinerja Kemitraan
Pendidikan Australia-Indonesia
PPCKS Principal Preparation Program Program Penyiapan Calon Kepala Sekolah
PPKPPD Local Government Educational Capacity
Building Program
Program Pengembangan Kapasitas Pendidikan
Pemerintah Daerah
PPKSPS Supervisor Professional Development Program Pendampingan Kepala Sekolah oleh
Pengawas Sekolah
PPP Principals Preparation Program Program Penyiapan Calon Kepala Sekolah
Pusbangte
ndik
Centre for the Development of Education
Personnel Pusat Pengembangan Tenaga Kependidikan
QAI Quality at Implementation Kualitas pada Pelaksanaan
QRS Quality Reporting System Sistem Pelaporan Berkualitas
Renstra Strategic Planning Rencana Strategis
RPJMN National Medium-Term Development
Plan
Rencana Pembangunan Jangka Menengah
Nasional
SATAP Sekolah Satu Atap One Roof School
SBM School Based Management Manajemen Berbasis Sekolah
SCC School Construction Committee Komite Pembangunan Sekolah
SDTOG Staff Development Technical Oversight
Group
Kelompok Pengawasan Teknis untuk
Pengembangan Staf
SI Social Inclusion Inklusi Sosial
SMP Junior Secondary School Sekolah Menengah Pertama
SNIP Sub-National Implementation Partners Mitra Pelaksana Sub-Nasional
SPD Supervisor Professional Development Program Pendampingan Kepala Sekolah oleh
Pengawas Sekolah
SRP School Reconstruction Program Program Rekonstruksi Sekolah
SSQ School Systems and Quality Program Sistem dan Mutu Sekolah
SSS Senior Secondary School Sekolah Menengah Atas
TOG Technical Oversight Group Kelompok Pengawasan Teknis
UPPAM Madrasah Accreditation Implementation
Unit at Central MoRA
Unit Pelaksana Akreditasi Madrasah di tingkat
Pemerintah Pusat
UPPAMDA Madrasah Accreditation Implementation
Unit at District Level
Unit Pelaksana Akreditasi Madrasah di tingkat
Daerah
UPPAMPR
OV
Madrasah Accreditation Implementation
Unit at Provincial Level
Unit Pelaksana Akreditasi Madrasah di tingkat
Provinsi
USB New School Unit Unit Sekolah Baru
USD United States Dollar Dolar Amerika Serikat

ANNUAL PARTNERSHIP PERFORMANCE REPORT 2013 viii
ACKNOWLEDGEMENTS
This report has been prepared by the Performance Oversight and Monitoring (POM) team of
Australia’s Education Partnership with Indonesia. The POM team gratefully acknowledges all those
who gave their time to provide information and comment for the APPR.
POM is fully accountable for the content of this report: the views contained in this report do not
necessarily represent those of the Education Partnership, the Governments of Australia or Indonesia,
or of the people consulted during the fieldwork.
Amendment history
Version Notes and modifications Created by/modified by
1.0 APPR Draft Report (12 February 2014) Creator: Nick Clinch
2.0 APPR Final Report (30 April 2014) in response to DFAT
comments on accuracy Creator: Nick Clinch
3.0 APPR Final Report (19 May 2014) in response to
general comments on accuracy Creator: Nick Clinch

ANNUAL PARTNERSHIP PERFORMANCE REPORT 2013 ix
EXECUTIVE SUMMARY
What is the Education Partnership?
The AUD 524m investment in the Education Partnership (EP) is Australia’s flagship development
initiative in Indonesia. Australia is supporting the Government of Indonesia (GoI) to achieve its policy
goals in relation to access, quality and governance of basic education.
The EP’s vision is to improve education service delivery in Indonesia. The EP focuses its effort on the
attainment of four End-of-Partnership-Outcomes (EOPOs):
• Enrolment in JSE in participating districts increases (Component 1).
• Management of schools and Madrasah improves in participating districts (Component 2).
• Quality of Madrasah service provision improves (in line with National Education Standards)
in targeted provinces (Component 3).
• Participating policy-makers utilize analytical work to inform education sector policy, planning
and budgeting (Component 4).
These EOPOs describe the highest level of change over which the EP has significant influence. The EP
uses various modalities to deliver its support, e.g. earmarked budget support (Components 1 and 2),
project delivery (Component 3), and technical assistance to Government of Indonesia (GoI) agencies
(Components 1-4). From late 2013, the majority of expenditure in Components 1 and 2 will be made
through government systems.
What is the APPR?
The Annual Partnership Performance Report (APPR) provides an objective assessment of program
achievements, weaknesses, opportunities and challenges. As such, it speaks to the Australian
Government’s aid scrutiny objectives, whilst also seeking to inform program management decisions
and strategic dialogue between the Governments of Australia and of Indonesia about sector
performance and emerging priorities. The APPR is produced by the EP Performance Oversight and
Monitoring (POM) team. POM’s analysis of EP performance draws on the OECD DAC criteria of
relevance, efficiency, effectiveness, impact, and sustainability. As such, it also complies with the
Australian Government’s Quality Reporting System (QRS).
What is POM’s overall assessment of EP performance?
This APPR represents a mid-term assessment of progress against the DAC criteria. At this point in the
life of the EP, it is important to reflect and take stock of progress to date and refocus attention on
the End-of-Partnership Outcomes. Whilst EP interventions remain broadly relevant, more flexible
management and strategic engagement is necessary if the efficiencies that have resulted in strong
output level achievement to date are to be translated into higher-level outcomes.
What did the APPR conclude about Component 1?
• Four hundred and fifty schools were built in 2012-13, in 142 districts across 28 of the
country’s 33 provinces. The geographical spread will be similar in subsequent years of the
program, with estimated numbers of schools to be built set at 316 in 2013-14 (Cycle 2), 310

ANNUAL PARTNERSHIP PERFORMANCE REPORT 2013 x
in 2014-15 (Cycle 3), and 337 in 2015-16 (Cycle 4). The 450 schools constructed in Cycle 1
offer an estimated 19,552 new places for first grade enrolment in 2013/2014.
• The notable achievements must be considered in light of two key observations:
o The extent to which the new schools places will provide a positive and significant
contribution to enrolment is uncertain.
o The impact of Component 1 on enrolment is directly linked to the appropriateness
of site location; and improving site selection is both possible and desirable.
• Overall, Component 1 displays commendable efficiency (score: 5), but its effectiveness
(score: 3) is cause for concern.
What did the APPR conclude about Component 2?
• Component 2 registered several significant achievements in 2013, which will lay the
foundations for GoI-led implementation in 2014 and beyond. Of particular note is the
signature of the Grant Agreement Deed between the Governments of Australia and of
Indonesia relating to the Professional Development for Education Personnel. Necessary
precursors to the signing of the GA included the development of supporting documents, the
piloting of technical modules and the training of trainers.
• The notable achievements must be offset by two key observations:
o Given the signature of the GA some two years into the five year program, the
upcoming Indonesian elections and the uncertain importance placed on PD by key
Indonesian policy-makers (and associated implications for GoI resource
deployment), the full extent of intended program outcomes are only likely to be
realised after 2016.
o The ability and willingness of district, provincial and/or central governments to
finance the PD system after the GA are untested.
• Overall, whilst the component remains highly relevant (score: 5), attention should be paid to
its efficiency (score: 3) and critical questions remain about its likely sustainability (score: 3).
What did the APPR conclude about Component 3?
• A total of 1,106 Madrasah have been supported to date, through 12 Sub-National
Implementation Partners (SNIPs) in 11 provinces and with the help of 198 mentors. As a
result of the block grants and SNIP support, improved Madrasah capacity and readiness to
achieve accreditation has been observed. Analysis of Phase 1 implementation indicates that
all targeted Phase 1 Madrasah have achieved an accreditable standard. Besides observable
progress in targeted Madrasah, there are also some encouraging indications of institutional
buy-in of the EP model of support.
• The notable achievements must be offset by two key observations:
o There remains a lack of clarity about expected changes at systemic level and, in
2013, MoRA continued to lack a clear strategy for Madrasah continuous quality
improvement.
o The impact of the AUD 35m EP investment could be restricted to target Madrasah
(though there exist other effective channels to spread benefits to non-target
Madrasah).

ANNUAL PARTNERSHIP PERFORMANCE REPORT 2013 xi
• Overall, Component 3 displays commendable efficiency (score: 5), but critical questions
remain about the nature of the benefits to be sustained and how this will be achieved
(score: 2).
What did the APPR conclude about Component 4?
• The ACDP has made steady progress to date. As at the end of December 2013 it had
procured 25 activities and had planned to launch an additional seven activities in the first
half of 2014. Together, these 32 activities would constitute over USD 27m of contracted
commitments. The ACDP brought a number of pieces of work to conclusion in 2013; it has
also organized over 100 workshops, meetings and training events to date, attracting more
than 3,000 participants. The ACDP has recorded several significant ‘wins’. For example, the
recommendations made in Early Childhood Development Strategy Study were included in
the Presidential Decree on Holistic Integrated – Early Childhood Development.
• The notable achievements must be offset by two key observations:
o The ACDP remains insufficiently agile and vulnerable to accusations of sub-optimal
responsiveness.
o ACDP processes and events offer DFAT opportunity to engage in more strategic
dialogue with key GoI officials but this potential is under-exploited.
• Overall, whilst Component 4 remains relevant and effectiveness is adequate (score: 4), there
remains significant scope to improve efficiency (score: 3).
What did the APPR conclude about cross-cutting issues, and specifically management, governance
and beneficiaries?
• The blend of modalities used in the EP represents a sound and appropriate response to the
operational environment. It appears to offer good opportunity to pilot and trial initiatives
through project support and to build capacity through systems development, whilst instilling
and supporting GoI ownership. That should, in principle, increase the likelihood of long-term
impacts and sustainability, whilst also guaranteeing tangible output delivery.
• Whilst DFAT’s management of the EP is strong, it tends to be prescriptive and output-
focused. DFAT resources focus on transactional management at the expense of
transformational engagement; if the big gains are to be secured (e.g. at EOPO-level) DFAT
needs to place greater emphasis on strategic engagement with key counterparts.
• From a governance perspective, the Governance and Technical Oversight Groups (GOG,
TOGs) make limited use of performance information in strategic decision-making about the
EP and governance meetings focus on output-level issues. Moreover, the GOG and TOG
meetings are not held in line with the designated scheduling, which suggests a lack of need
or of motivation.
• With regards to beneficiaries, the continued absence of a social inclusion strategy limits the
assessment in the APPR. However, attempts to implement a social inclusion agenda are
noted. In addition, the opportunity for increased targeting of vulnerable groups that may be
excluded from EP interventions and for more outcomes-led targeting to enhance prospects
for higher level achievement are indicated.

ANNUAL PARTNERSHIP PERFORMANCE REPORT 2013 xii
What next steps are proposed?
Based on its findings, the APPR offers a total of 24 recommendations. These are presented over the
page.

ANNUAL PARTNERSHIP PERFORMANCE REPORT 2013 xiii
Key recommendations
Recommendations Level of
urgency Prime Responsibility
Component 1
R1: DFAT and MoEC should reaffirm their commitment to the current EOPO (refer to §2.4.3 and 2.4.4) *** DFAT and MoEC
R2: Critically appraise coordination of school construction with other access-related initiatives within MOEC
with a view to maximising the extent of EOPO achievement (refer to §2.4.3 and 2.4.4) ***
MoEC (with SSQ and POM
support)
R3: Further analysis of site selection outcomes should be undertaken to provide a robust basis to improve
the selection process (refer to §2.4.3) ***
POM (with MoEC and SSQ
support)
R4: DFAT and MoEC should strengthen the site selection process by refining factors of JSE demand and
supply in the selection criteria, and ensuring a strict application of these criteria (refer to §2.4.3) ***
DFAT and MoEC (with SSQ
support)
R5: Lessons learned from EP implementation (e.g. regarding monitoring process) should be synthesised and
disseminated to interested parties (e.g. MoEC and other GoI institutions/agencies involved in
construction processes), should there be merit or demand (refer to §2.4.5)
* MoEC and SSQ
Component 2
R6: DFAT-MoEC should assign sufficient resources to C2 so as to ensure timely delivery of GA results, or
should readjust the EOPO and implementation strategy accordingly (refer to §3.4.3) ***
DFAT and MoEC (with SSQ
support)
R7: MoEC should lobby and advocate for the PD system to be included in strategic documents (e.g. the
RPJMN and the upcoming Renstra), thereby enhancing political commitment to its implementation
(refer to §3.4.1)
***
MoEC (with DFAT support
through ATOG and GOG; and
SSQ support)
R8: Institutional Partners must better understand the financial capacity and willingness of all government
levels to fund PD services, and develop a workable sustainability strategy (refer to §3.4.1 and 3.4.5) ***
MoEC and DFAT (with POM and
SSQ support)

ANNUAL PARTNERSHIP PERFORMANCE REPORT 2013 xiv
Recommendations Level of
urgency Prime Responsibility
Component 3
R9: DFAT and MoRA should define and agree upon the nature and extent of systemic change expected
(refer to §4.4.4) ***
DFAT and MoRA (with SSQ
facilitation as required)
R10: EP support to systemic change should encourage and be based on a clear and resourced MoRA strategy
for supporting Madrasah continuous quality improvement (refer to §4.4.4) ***
MoRA (with DFAT and SSQ
facilitation as required)
R11: There should be an explicit and systematic targeting of beneficiary Madrasah with low initial standards
(TT if possible) (refer to §4.4.2) **
SSQ
R12: EP should continue and increase engagement with sub-national institutions to develop and seek support
for non-targeted Madrasah, including engagement with KKM and Madrasah supervisors (refer to §4.4.4) *
SSQ
R13: EP should develop, support and monitor measures to better involve other key, but currently untargeted
stakeholders (e.g. committee members, yayasan and community members) in Madrasah quality
improvement strategies (refer to §4.4.1)
**
SSQ (with POM support as
required)
Component 4
R14: ACDP should continue to revise and diversify its product offering (activity types) such that it is
responsive and timely, and offers value for money (refer to §5.4.2) **
ACDP (with guidance from the
ATOG)
R15: DFAT should better articulate how, when and why it seeks to gain strategic value from its investment in
the ACDP (refer to §5.4.3) **
DFAT (with ACDP support as
required)
R16: DFAT/ACDP should make a concerted effort to identify cross-component links and to flag relevant
upcoming events such that ACDP becomes a more integral part of the EP and that synergies are
exploited. (refer to §5.4.3)
* DFAT and ACDP Secretariat

ANNUAL PARTNERSHIP PERFORMANCE REPORT 2013 xv
Recommendations Level of
urgency Prime Responsibility
Beneficiaries
R17: Institutional partners should identify categories of beneficiaries whose targeting will increase the
likelihood of EOPO achievement, and devise a targeting strategy for each component (refer to §6.2.3) ***
DFAT and institutional partners
(with POM support as required)
R18: Institutional partners should finalise and implement a social inclusion strategy that outlines objectives,
boundaries, indicators and targets; and describes what the EP aspires to, i.e. what it should be doing,
not just what it is doing (refer to §6.2.1)
***
DFAT and institutional partners
(with POM support as required)
R19: Institutional partners should clarify the extent to which equity is an objective of the EP and, where
appropriate, explore EP targeting objectives and review selection criteria and targeting mechanisms
(refer to §6.2)
**
DFAT and institutional partners
(with POM support as required)
Management and Governance
R20: DFAT’s management of the EP should be more flexible and adaptive, i.e. be more forward looking (at
opportunities) than backward-looking (at the EP design) (refer to §7.2.2) **
DFAT
R21: DFAT should prioritise (varied) strategic engagement with GoI: e.g. strategic discussion on C1 and C3;
advocacy of current EP approach on C2; and broader policy engagement through C4 (refer to §7.2.2) ***
DFAT
R22: The articulation and agreement on the EP logic and the finalisation and socialisation of the Performance
Milestone Framework (PMF) should be prioritised (refer to §7.2.3) ***
DFAT (with POM support)
R23: Existing governance structures need to be more effectively engaged, utilizing performance evidence to
inform strategic, higher-level decisions (refer to §7.2.4) **
DFAT and GoI through GOG and
TOGs
R24: Institutional partners should identify potential for stronger linkages between POM and governance
structures, possibly in a secretariat role (refer to §7.2.4) **
DFAT and GoI (with POM
support)
NB: Red (***) - high urgency; Orange (**) - medium urgency; Green (*) - low urgency

ANNUAL PARTNERSHIP PERFORMANCE REPORT 2013 1
Introduction, Approach and
Methodology

ANNUAL PARTNERSHIP PERFORMANCE REPORT 2013 1
1 Introduction
1.1 The Education Partnership
The Government of Australia (GoA) has been investing in Indonesia’s basic education sector for a
number of years, most notably through the flagship AUD 395 million Australia Indonesia Basic
Education Program (AIBEP) (2006-2011) and now through the Australia-Indonesia Education
Partnership (EP): a five-year, AUD 524 million1 program that operates from mid-2011 to mid-2016.
Australia is supporting the Government of Indonesia (GoI) to achieve its policy goals in relation to
access, quality and governance of basic education (defined as primary and junior secondary
education). The EP’s vision is to improve education service delivery in Indonesia. To achieve this, it
focuses on three goals:
• To increase participation in Junior Secondary Education (JSE) schooling.
• To improve the quality of education in public and private schools, including Madrasah.
• To improve sector governance through increased use of evidence for decision-making.
The EP recognizes that these goals are aspirational and are influenced by a multitude of factors,
many of which are outside the control or even direct influence of the Partnership. As such, the EP
focuses its effort on the attainment of four End-of-Partnership-Outcomes (EOPOs):
• Enrolment in JSE in participating districts increases (Component 1).
• Management of schools and Madrasah improves in participating districts (Component 2).
• Quality of Madrasah service provision improves (in line with National Education Standards)
in targeted provinces (Component 3).
• Participating policy-makers utilize analytical work to inform education sector policy, planning
and budgeting (Component 4).
These EOPOs describe the highest level of change over which the EP has significant influence (see
the current2 EP logic architecture in Annex I). The EP uses various modalities to deliver its support,
e.g. earmarked budget support (Components 1 and 2), project delivery (Component 3), and technical
assistance to GoI agencies (Components 1-4). From late 2013, the majority of expenditure in
Components 1 and 2 will be made through government systems.
1.2 The Annual Partnership Performance Report
1.2.1 Objective
The EP remains Australia’s largest ever bilateral program. It is important that the program generates
significant ‘developmental return’, that implementation is carefully scrutinized, and that results and
lessons are captured, shared and fed into decision-making processes. The EP Performance Oversight
and Monitoring (POM) team is charged with generating timely evidence and actionable
recommendations so that the Australian Department for Foreign Affairs and Trade (DFAT) and its
1 The original budget for the Education Partnership was AUD 500m. A minute was signed by the Director
General of AusAID on 23 April 2013, increasing the value of the EP from AUD 500m to AUD 524m. 2 As at end of November 2013.

ANNUAL PARTNERSHIP PERFORMANCE REPORT 2013 2
partners can safeguard Australia’s investment in the EP; improve EP management and
implementation; strengthen education policy dialogue with the GoI; and guide future Australian
investment in the Indonesian education sector.
The Annual Partnership Performance Report (APPR) provides an objective assessment of program
achievements, weaknesses, opportunities and challenges. As such, it speaks to DFAT’s aid scrutiny
objectives, whilst also seeking to inform program management decisions and strategic dialogue
between the Governments of Australia and of Indonesia about sector performance and emerging
priorities.
The report is written at a time of considerable change within the Australian Aid program. The change
in Government in Australia in late 2013 is having significant ramifications on the delivery of
development assistance. These will likely impact the EP in 2014 and beyond. Similarly, the
consequences of the 2014 elections in Indonesia will need to be monitored closely.
The 2013 APPR – POM’s second, full APPR of the EP – reports and analyses program performance in
2013. It seeks to deliver:
• A clear, concise and evidence-informed picture of achievements over the year.
• A clear and concise commentary about concerns and possible challenges in 2014-16.
• A set of action-oriented recommendations.
1.2.2 Approach
POM’s analysis of EP performance draws on OECD’s DAC criteria of relevance, efficiency,
effectiveness, impact and sustainability. As such, it also speaks to the requirements of GoA’s Quality
Reporting System (QRS) for both Quality at Implementation (QAI) and Independent Completion
Reporting (ICR). Annex II explains the APPR interpretation of the DAC criteria and the Rating Scale
used under the QRS and in this APPR is presented in Annex III.
This year’s APPR contains several structural and presentational changes to the 2012 APPR. Of note:
• Every EOPO section contains a dedicated commentary on each of the aforementioned DAC
criteria.
• The performance of each EOPO is scored, using the same system and guidelines contained
within GoA’s ICR framework.
These changes are regarded as being timely introductions given that the EP has just passed its mid-
point. The scoring will enable improved tracking of performance from year-to-year. It also requires
POM to respond to the need for clarity and justification. Where it is too early to provide a defensible
score, which is frequently the case for impact, the report indicates as much. In other cases, such as
for effectiveness and for sustainability, where several evidence sources may be unavailable until
2014 or 2015, POM has sought to score probability or likelihood, using the evidence available. In all
cases POM has scored the component and not the performance of individual implementing partners
working within the component.
1.2.3 Methodology
The APPR assessment process was conducted in October-December 2013. It contained six key steps:

ANNUAL PARTNERSHIP PERFORMANCE REPORT 2013 3
• Step 1: A desk review and screening of every report related to EP performance that was
submitted or received by POM in 2013 (see Annex IV). All documents were screened through
the lens of the EP analytical framework (see Annex V for further details).
• Step 2: Semi-structured interviews with key informants, with a view to further developing
and testing POM’s understanding of key matters. Lines of enquiry drew on insights gleaned
from the desk review. (See Annex VI for a list of persons consulted).
• Step 3: An internal POM APPR workshop in mid-November during which POM staff
identified and discussed key findings, messages and implications.
• Step 4: A presentation to key EP stakeholders on 29 November 2013 to test and explore
emerging findings and recommendations, and to serve as a ‘lead in’ to report preparation.
• Step 5: Draft report production and submission to DFAT.
• Step 6: Final Report submission to DFAT following factual corrections on basis of comments
from DFAT.
1.2.4 Caveats and limitations
Every effort has been made to present credible, robust and evidence-informed findings and
recommendations. Nevertheless, there are always limitations. Of particular note is the absence of an
operational EP Performance Milestone Framework (PMF). This limits clarity about performance
indicators, and expected targets and annual milestones at output, EOCO, EOPO and Goal-level.
1.3 Report structure
The layout of the APPR seeks to present information in a succinct and logical manner. Guidance on
the contents of the report has been taken from the Monitoring and Evaluation Standards developed
by the DFAT-Jakarta Evaluation Capacity Building Program (ECBP). More specifically, this report
includes, as Annex VII, an assessment of its compliance with the proposed features listed in
‘Standard 3: Initiative Progress Reporting’.
The APPR is divided into three parts:
• Part A “zooms in” on component-by-component performance: it considers the context in
which the component operates; it highlights the achievements of the past year; it analyses
progress and performance in relation to the DAC criteria of efficiency, effectiveness, impact,
relevance and sustainability; and it proposes recommendations for action in light of that
analysis.
• Part B “zooms out” by considering, first, who benefits from the EP and, second, how the EP
is managed and governed.
• Part C describes conclusions and presents a consolidated set of recommendations.
Each recommendation in the APPR is accompanied by a nominated stakeholder who is assigned
prime responsibility for implementation. Recommendations are presented by a color-coded system
that indicates the relative immediacy of the issue.
Footnotes and endnotes are utilized throughout the document: footnotes are employed to provide
clarification on a point; endnotes are employed to reference a source.


ANNUAL PARTNERSHIP PERFORMANCE REPORT 2013 5
Part A: Zooming in
Component performance


ANNUAL PARTNERSHIP PERFORMANCE REPORT 2013 7
2 Component 1: School Construction
2.1 Introduction
2.1.1 The EP investment
The EP seeks to improve access to junior secondary education by supporting GoI to build up to 2,000
new junior secondary schools (USBs) and one-roof junior secondary schools (SATAPs) between 2011
and 20163. In doing so, its objective is to assist Indonesia to deliver on its 2010-14 Renstra targets by
improving access to nine years of basic education for boys and girls, and children with physical
disabilities, in un-served and under-served areas of the countryi.
The GoA seeks to focus its investment on districts with low junior secondary enrolment rates. Once
the schools are built, the EP provides school management teams with training in School-Based
Management (SBM). Upon completion, the participants are expected to demonstrate a statistically
significant increase in knowledge, which should then be applied when conducting their duties.
All the schools are expected to be fully operational within six months of construction, and be
capable of delivering effective formal and non-formal education servicesii. This requires that they be
fully staffed and equipped (e.g. with laboratory equipment and books), and have access to the
necessary GoI operational funds to run and maintain the schoolsiii. The Grant Agreement between
GoA and GoI provides for the SATAPs to receive an initial “start-up” grant upon school completion to
ensure smooth initial operations; the USBs do not have the same entitlement.
The supply of new JSE places is expected to provide (prospective) learners with improved physical
access to JSE in the target districts. The closer proximity of schools to households is also expected to
reduce financial barriers to enrolment and therefore enable continued and improved participation
(e.g. by reducing the impact of high transportation costs)iv. Within participating districts, the
investment is expected to have an impact on enrolment and retention rates, and rates of transition
from primary to junior secondary school. At a higher level, it is expected to reduce disparities
between districts by contributing towards the GoI target of increasing the percentage of districts
with a JSE GER of 90% or greater, to 85% by 2014v.
Component 1 of the EP does not prioritize systemic change4 in government policy, planning and
service delivery per se, though indirect benefits may accrue. Rather, the key result is the
construction of new schools and the additional places they are expected to offer learners, with the
expectation that increased enrolment (the expected outcome) and sustained participation (the
expected goal) will ensue.
2.1.2 The delivery mechanisms and support provided by the EP
Program support is delivered through a combination of technical assistance and earmarked budget
support to MoECvi. Specifically, GoA provides:
• AUD 210m of grants for community-based JSE school construction.
3 The official target remains 2,000 schools but a revised target of around 1,400 was proposed by DFAT in the
second half of 2013 based on an increase in school building unit costs, on the desired standard number of
classrooms in each school type and on GoI requirements. 4 i.e. a change in practice and/or relationships which create better performance, e.g. in terms of the services
received by end users. This may be because JSS expansion is winding down and will not be a priority area for
GoI in the future.

ANNUAL PARTNERSHIP PERFORMANCE REPORT 2013 8
• Technical assistance and training to MoEC, School Construction Committees (SCCs) and
District Education Officials (DEOs) concerning site selection and subsequent monitoring of
school construction.
• Training in SBM for principals, school committees, DEOs and community members through
the New School Induction Program.
• Establishment of complaint handling system by MoEC.
• Financing of supplementary independent audits.
Construction Development Consultants are procured by, funded by and contracted to MoEC to assist
the SCCs with the technical aspects of implementation. MoEC retains overall responsibility for the
construction process.
2.2 Context
The notions of increased access and participation remain important priority areas for GoI. In late
2012, MoEC released plans to extend nine years of compulsory education to a 12 year universal
program (Pendidikan Menengah Universal or PMU). The PMU Grand Design is premised on
Indonesia’s need to drive growth by satisfying labour market requirements and by capitalizing on the
country’s youthful population: the so-called “demographic dividend”. The PMU will adopt a three-
pronged approach:
• Construction of Senior Secondary Schools (SSS) or additional classrooms on existing SSS.
• Establishment of BOS (Bantuan Operasional Sekolah) for SSS: a so-called BOS-SM.
• Implementation of Poor Students Assistance Program (Bantuan Siswa Miskin or BSM)
targeted at students from impoverished families.
Arguably, the PMU provides further evidence of MoEC’s continued pursuit of an access-driven
education agenda until at least 2020. The PMU will not, in itself, undermine the importance of EP
investments, as lessons learned from targeting JSE access may well be applicable to any
improvement efforts in SSE access. Indeed, a focus on SSE is likely to have a positive “pull’ effect on
JSE. However, impact could be felt if MoEC prioritize budget for PMU at the expense of JSE-centric
policies and interventions.
2.3 Achievements
Four hundred and fifty-one5 schools were built in 2012-13 through the first cycle of construction, in
142 districts across 28 of the country’s 33 provinces (see Figure 1). The geographical spread will be
similar in subsequent years of the program, with the estimated number of schools to be built set at
316 in 2013-14 (Cycle 2), 310 in 2014-15 (Cycle 3), and 337 in 2015-16 (Cycle 4)6.
5 450 schools have been completed with one school incomplete – some EP reporting reports 450 schools as the
total number built. 6 This assumes revised target of 1,400 schools proposed by DFAT is accepted.

ANNUAL PARTNERSHIP PERFORMANCE REPORT 2013 9
Figure 1: Schools construction in 2012-13 (Cycle 1 and 2)
The 450 schools constructed in Cycle 1 offer a total of 58,656 new school places with an estimated
19,552 new places for first grade enrolment in 2013/20147.
Concerns were raised by DFAT about site selection during Cycle 1 and Cycle 2, specifically about the
limited number of eligible proposals received from low JSE GER districts8. To address these concerns,
C1 partners (with support from the C2 SSQ team) have invested considerable energy in
implementing access planning training in 88 districts with low GER. The training is designed to
support target districts to accurately determine their enrolment rates, to assess options for tackling
low GER, and then to make informed decisions based on the options available. Anecdotal feedback
has been positive with some of the districts submitting a greater number and improved quality of
proposals to the EP. In addition, improvements have been made to the new school proposal form
and to the analysis of new school proposals. This should benefit the third cycle of construction
planned in 2014-2015 (though it should be noted that whilst the access planning training provided
by the EP helps districts to identify appropriate planning solutions to low GER, the EP, in line with its
original design, can only offer one solution: the construction of new USB or SATAP schools).
SSQ’s Field Monitors (FM) are tasked to support MoEC in the monitoring of the school construction
process. Their role was expanded in 2013 so that they are now involved in site selection verification.
They have also been given authority to recommend remedial action where construction issues have
been identified. It is hoped that the FMs will offer continuous coordination and improved
communication among stakeholders, with upsides for risk identification and management and the
proactive and timely solution of issues on-site. Early indications are positive. SSQ, for example,
reports that FMs have made a significant contribution to the quality of the school construction
program and that their monetary value exceeded their cost to the programvii
.
7 The number of new places available for first grade enrolment is calculated by multiplying the number of 7
th
Grade (JSE 1st
year) classes by the maximum number of students allowed by NES (32 students). Thus, 161 USBs
yield 322 classes plus 289 7th
Grade classes in SATAP, totaling 611 classes. Multiplying this figure by 32 gives
19,552 new places. 8 268 proposals were received from low GER districts (GER <90%) equivalent to 43% of total proposal
submission in 2013 and, from those proposals, only 102 were considered eligible and selected.
ANNUAL PARTNERSHIP PERFORMANCE REPORT 2013 10
At a central level, C1 partners have established a Construction Reporting System (CRS) to collate,
manage, verify and analyse construction data. A Joint Technical Unit (JTU) has also been established,
with the objective of enabling improved information flow between SSQ and MoEC and therefore
more effective and timely resolution of issues.
2.4 Analysis
2.4.1 Relevance
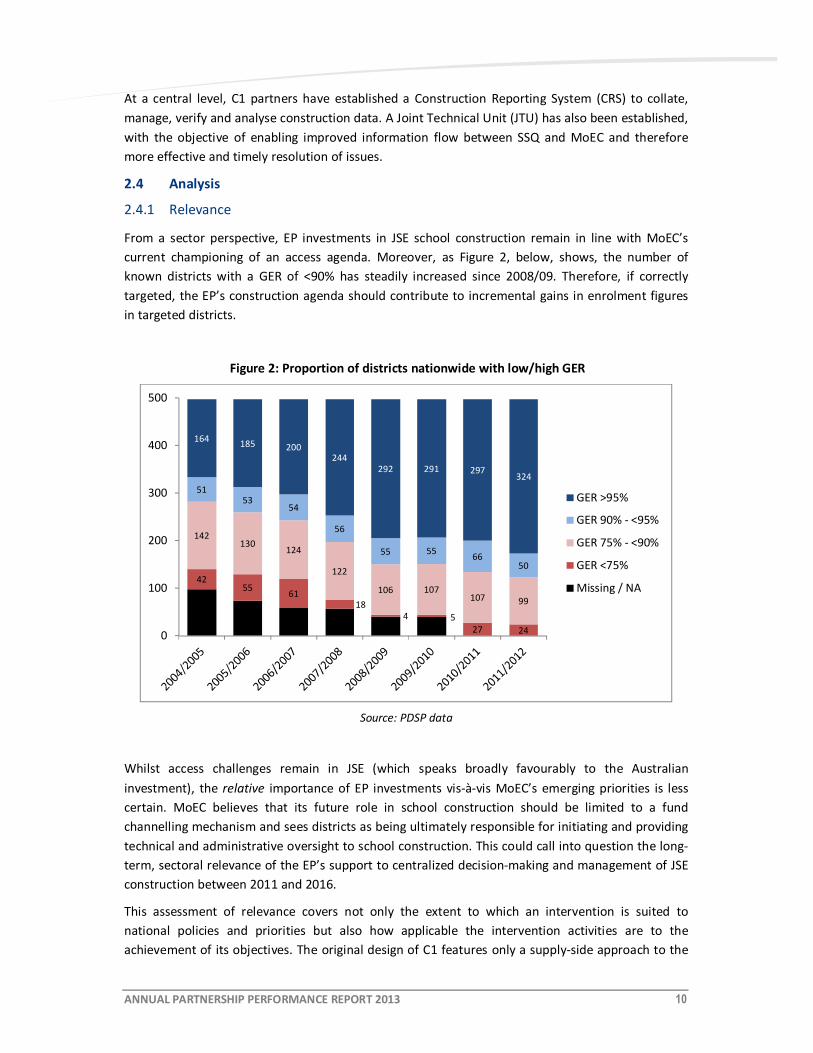
From a sector perspective, EP investments in JSE school construction remain in line with MoEC’s
current championing of an access agenda. Moreover, as Figure 2, below, shows, the number of
known districts with a GER of <90% has steadily increased since 2008/09. Therefore, if correctly
targeted, the EP’s construction agenda should contribute to incremental gains in enrolment figures
in targeted districts.
Figure 2: Proportion of districts nationwide with low/high GER
Source: PDSP data
Whilst access challenges remain in JSE (which speaks broadly favourably to the Australian
investment), the relative importance of EP investments vis-à-vis MoEC’s emerging priorities is less
certain. MoEC believes that its future role in school construction should be limited to a fund
channelling mechanism and sees districts as being ultimately responsible for initiating and providing
technical and administrative oversight to school construction. This could call into question the long-
term, sectoral relevance of the EP’s support to centralized decision-making and management of JSE
construction between 2011 and 2016.
This assessment of relevance covers not only the extent to which an intervention is suited to
national policies and priorities but also how applicable the intervention activities are to the
achievement of its objectives. The original design of C1 features only a supply-side approach to the
4255
6118
4 5
27 24
142130
124
122
106 107107 99
5153
54
56
55 5566
50
164185 200
244
292 291 297324
0
100
200
300
400
500
GER >95%
GER 90% - <95%
GER 75% - <90%
GER <75%
Missing / NA

ANNUAL PARTNERSHIP PERFORMANCE REPORT 2013 11
multidimensional issue of JSE access. Whilst it is understood and accepted that the EP design took
account of the fact that other MOEC interventions cover other aspects of the access challenge, there
are indications that parents’ choice to enrol their children in JSE is shaped predominantly by a range
of demand-led variables9viii
.
Consequently, to maximise increased enrolment in participating districts (EOPO 1), a more
comprehensive investment response is indicated or, at least, there should be an explicit coordination
of school construction with other access-related initiatives within MOEC.
2.4.2 Efficiency
The implementation of C1 is managed by MoEC, with technical support from SSQ. The first cycle of
construction started in September 2012 and was largely finalized by May 2013. The second cycle
started in August 2013 and is ongoing. The third cycle is being planned, with a scheduled start date
of August 2014. As illustrated in Table 1, 767 schools have been or are being constructed.
Table 1: Confirmed schools in Cycles 1 and 2
Cycles
Schools constructed/under
construction
SATAP USB
1 289 162
2 150 166
TOTAL 439 328
Source: SSQ Component 1 management team
In the second half of 2013, SSQ strengthened the monitoring and reporting of the school
construction process by generating and providing detailed information about the construction
process on a bi-weekly basis. The report captures the quality, quantity and nature of progress as well
as compliance with financial procedures. This enables EP partners to gain an accurate understanding
of the pace of progress and accountability for Australian funds, and to tackle issues in a timely
fashion.
An increase in school building unit costs, updated estimates of GoI school requirements, and an
adjustment of the desired standard number of classrooms in each school type all mean that the
number of schools to be built is likely to be revised down to around 1,400 schools. Whilst the
downgrade may reflect an appropriate management response, it may also have a detrimental
impact on the expected cost effectiveness of C1.
Phase 1 of the SCC Financial Compliance Audit undertaken through POM covered 45 construction
sites (i.e. about 10% of the total) and found cases of non-compliance ranging from low risk to high
9 For the EOPO 1 baseline evaluation study, POM team interviewed 956 households about their decision to
send their children to JSE. From 72 of those households that choose to not send their children to JSE, 54% (39
households) indicated a lack of perceived comparative advantage of JSE education vis-à-vis other activities
(e.g. work and marriage).

ANNUAL PARTNERSHIP PERFORMANCE REPORT 2013 12
risk at all sites. However, only a very small number of cases (5 in total) were sufficiently suspicious
for a fraud report to be lodged with DFAT. SSQ and MOEC are also proactive in identifying and
reporting non-compliance issues and suspicion of fraud to DFAT. The prevalence of non-compliance
issues most likely reflects the low capacity of some SCC/CMC to administer funds in line with
detailed procedures manuals rather than systemic fraud. The extensive audit function within the EP
provides recommendations on how non-compliance can be tackled and it is anticipated that
incidence rates will decrease over time.
2.4.3 Effectiveness
The EP expects to deliver an additional 187,000 places10
for JSE students by mid-2016 (EOCO)ix. So
far, the construction of 450 schools in Cycle 1 has generated up to an additional 58,656 places for
JSE students across 142 districts11. Should subsequent cycles be delivered in an equally efficient
manner, it is probable that the EOCO target will be achieved.
The attainment of the EOPO (i.e. an increase in JSE enrolment) is, however, less clear cut and it is not
yet possible to make a definitive judgment12. Whilst it is recognised that considerable improvements
to site selection processes have been made since AIBEP and indeed between Cycles 1 and 2 of the
EP, there remain indications of sub-optimal location of some of the selected sites. Based on a
typology built on proxy measures of JSE demand and supply, a preliminary analysis of the
appropriateness of site locations from the EOPO 1 evaluation baseline sample13
suggests that just
under half of the sampled schools have been constructed in locations of low supply and high
demand and are therefore likely to contribute to increased enrolment. Conversely, the analysis
indicates that around one tenth of schools are located in sites with both low demand and high
supply which would negatively affect expected enrolment figures (and, in time, the sustainability of
the schools themselves). On a positive note, however, the exercise also indicates that improved site
selection is both possible and desirable, and that this can be achieved by refining the factors of
supply and demand in the selection criteria. Given the critical importance of site selection in the
realisation of the EOPO, a more robust and expanded analysis is indicated.
The number of construction sites that are situated in low GER (<90%) districts has reduced
significantly between Cycle 1 and Cycle 2, both in terms of actual numbers (264 to 102) and
percentage (59% to 35%). This speaks to the importance of applying appropriate targeting
mechanisms for site selection. However, it is possible that, as cycles progress, the proportion of low
GER districts decreases, as well as the opportunity of selecting appropriate sites within these
districts, i.e. it is getting harder and harder to select appropriate sites.
10
Based on the revised total number of schools to be built of around 1,400. 11
The number of new places made available is calculated by multiplying the number of classes from all the
three grades (7th
, 8th
, and 9th
) by the maximum number of students allowed by NES (32 students). Thus, 161
USBs yield 966 classes plus 867 classes in SATAP, totaling 1,833 classes. Multiplying this figure by 32 gives
58,656 new places. 12
EP POM undertook a baseline evaluation study in 2013 related to the achievement of EOPO 1. Endline data
will be collected towards the end of the EP at which time a definitive judgement should be possible. 13
The EOPO 1 evaluation baseline analyses a sample of Cycle 1 sites.

ANNUAL PARTNERSHIP PERFORMANCE REPORT 2013 13
2.4.4 Impact
It is estimated that 84,204 students will be enrolled in EP funded schools by June 201614
. It is too
early to assess the progress towards that target. Only schools built under Cycle 1 have opened their
doors and most students have only been enrolled in the first grade of SMP. It is expected to take
three years for a newly built school to reach its capacity of enrolment.
Two risks to the attainment of intended impact targets can be foreseen: (a) the additional places
created (EOCO) do not necessarily lead to the enrolment of “new” children (EOPO) but instead may
be filled partially or exclusively by children who move from existing schools; and (b) the construction
of the new school offers a supply-side response that may need to be coordinated with demand-side
initiatives offered through MOEC. It must be noted that the occurrence of the first risk would not
necessarily be a bad outcome from an education perspective or indeed a developmental
perspective: reduced travel time might perhaps lead to better attendance, reduced fatigue and
better learning quality. From a development perspective, there may be upsides in terms of less
expenditure on transport.
From a systems perspective, however, there is also the risk of a proliferation of small schools leading
to inefficiencies of teachers and management resource allocation (e.g. low student / teacher ratio),
compounded by limited BOS funding for each school. This might impact on the quality of the
education provided. This risk can be mitigated by carefully selecting sites in locations where demand
for additional JSE schools is high. Where proposals that have been submitted are not considered
suitable for school construction, it makes sense for other access initiatives to be considered as a
viable response for the proposal. Whilst this clearly falls outside the current mandate of the EP, the
promotion of access planning through the EP is a positive indicator of the integration of the EP
within the broader GoI access agenda.
2.4.5 Sustainability
The sustainability analysis considers two issues: (a) the sustainability of the constructed schools; and,
(b) the sustainability of the community-based school construction system. The sustainability of the
schools strongly depends on the quality of their construction and their location, i.e. schools need to
be well constructed and be attracting students, not least to generate the BOS funds necessary to
operate and maintain the schools. The consolidation of the SSQ construction monitoring system
provides a solid foundation for ensuring construction quality is up to required standards. However,
as previously discussed, there are some schools that appear to be in locations of low demand or in
locations seemingly displaying high demand and high supply, in which case enrolment numbers and
BOS receipts may be lower than required for optimal performance. Further analysis of existing
demand and supply around construction sites should help to clarify the sustainability of the
constructed schools.
From a construction system perspective, the upcoming focus on senior secondary construction
offers an opportunity for further utilization of the community-based construction model. Lessons
14
The figure of 84,204 students is the enrolment target in the draft Performance Milestone Framework for C1.
The calculation assumes that not all the available places created by the construction of new schools will
translate into increased enrolment. The figure is calculated using an average of 12 students per class for SATAP
and 24 students per class in USB. This figure also take account of the fact that, by June 2016, the Cycle 4
schools will have only just started to operate and will only have 7th
grade students enrolled.

ANNUAL PARTNERSHIP PERFORMANCE REPORT 2013 14
learned in the EP school construction process – including the necessity for robust monitoring - could
and should be disseminated for future school construction efforts.
2.5 What does this mean for the EP? The bottom-line
A summary table of component performance by DAC criteria is presented in Table 2. The ratings
scale used with the DFAT QRS (QAI and ICR) has been adopted. Recommendations for improvement
and, in particular, on increasing the likelihood of achieving EOPO 1 are made in Table 3 below.

ANNUAL PARTNERSHIP PERFORMANCE REPORT 2013 15
Table 2: Component 1 scorecard
DAC Criterion Score Justification Comments
Relevance 4
• School construction is still relevant to MoEC Strategic
Planning access targets.
• Whilst the relevance of the C1 design is constrained by its
supply-only approach, good integration of school
construction with parallel demand-led GoI initiatives should
allow for a holistic approach to access.
• The relevance to GoI is based on current
government policies.
• Incoming government may change/pursue
new priorities.
Efficiency 5
• Almost all targeted schools of Cycle 1 (450 of 451) were
completed and operational by December 2013.
• Monitoring of construction process has been strengthened
and has reportedly led to significant savings.
• The results of improved monitoring activities are being used
jointly by SSQ and MoEC to better respond to reported
issues from the construction processes.
Effectiveness 3
• It is probable that C1 will achieve the EOCO, i.e. an
“increase in availability of places in JSE”.
• The extent (i.e. the prescribed targets) to which the EOPO
will be achieved is uncertain. Optimising site selection and
coordinating school construction with other access related
initiatives is necessary to maximise EOPO achievement
• The information used in this section is
based on POM EOPO 1 Evaluation Study.
• Thus the concluding remarks may only be
applied to Cycle 1 schools.
Impact TE
• Too early to make informed judgement. • The question of impact will be answered
by EOPO 1 Evaluation but only after
endline in 2015.
Sustainability 4
• Sustainability is dependent on site selection, i.e. schools are
dependent on BOS funding and therefore having the
necessary number of enrolled learners for the school to
operate at an acceptable level of quality.
• Lessons learned about the community-
based school construction system should
be captured and shared with other
agencies.

ANNUAL PARTNERSHIP PERFORMANCE REPORT 2013 16
Table 3: Component 1 key findings and recommendations
Findings Recommendations Level of
urgency Prime Responsibility
The extent to which the EOPO is achieved will
depend upon maximising EOCO contribution as
well as encouraging the contribution of other
access-related initiatives (see §2.4.3 and 2.4.4)
R1: DFAT and MoEC should reaffirm their commitment to the
current EOPO. ***
DFAT and MoEC
R2: Critically appraise coordination of school construction with
other access-related initiatives within MOEC with a view to
maximising the extent of EOPO achievement.
***
DFAT and MoEC (with SSQ and POM
support)
There is evidence of sub-optimal location of some
selected sites and improving site selection is both
possible and desirable (see §2.4.3)
R3: Further analysis of site selection outcomes should be
undertaken to provide a robust basis to continue to improve
the selection process.
*** POM (with MoEC and SSQ support)
R4: DFAT and MoEC should strengthen the site selection
process by refining factors of JSE demand and supply in the
selection criteria, and ensuring a strict application of these
criteria.
***
DFAT and MoEC (with SSQ support)
A number of lessons on community-based
construction processes are being learned through
the EP investment (see §2.4.5)
R5: Lessons learned from EP implementation (e.g. regarding
monitoring process) should be synthesised and
disseminated to interested parties (e.g. MoEC and other GoI
institutions/agencies involved in construction processes),
should there be merit or demand.
*
MoEC and SSQ
NB: Red (***) - high urgency; orange (**) - medium urgency; green (*) - low urgency

ANNUAL PARTNERSHIP PERFORMANCE REPORT 2013 17
3 Component 2: School and District Management
3.1 Introduction
3.1.1 The EP investment
Component 2 seeks to improve the management of schools and Madrasah. Specifically, it focuses on
the professional development (PD) of education personnel and, in particular, school principals,
supervisors, and district and provincial education officials. The GoA seeks to support Indonesia’s
efforts to develop its existing PD systems into a nationwide accredited training system.
The EP investment is deemed to be strategically important. Decentralization processes increasingly
allocate greater responsibility for managing education resources to the district and school level. As
such, the prevalence of weak competencies amongst the country’s estimated 293,000 principals,
supervisors and district officials is deemed to be a crucial barrier to improved education qualityx.
The EP PD system (hereafter referred to as “the system” comprises a number of sub-systems:
• A Continuing Professional Development (CPD) system for school principals, which contains a
suite of graduated learning modules appropriate to different skill-sets, experience and job
requirements.
• A Principal Preparation Program (PPP) for aspiring principals, which improves the skills and
competencies of potential future principals, and, in principle, should enable district
authorities to consider test scores when choosing principals of MoEC schools.
• The Supervisor Professional Development (SPD) Program, which seeks to improve the
capability of the education supervisor cadre to support school principals.
• District and Provincial Official training programs, which contain up to three modules: Human
Resource Development and Management, Strategic Planning and Financial Management,
and Access Planning (the latter being targeted at those 88 districts with a JSE GER of < 90%).
• Induction training in School-Based Management (SBM) for principals and school committees
of schools built with EP funding.
• A one-off training in the use of BOS funds for all school principals, relevant DEOs and school
committee members.
By June 2016, the system is expected to be operational and accessible15
in all provinces, with school
and madrasah principals, supervisors and education officials in up to 250 districts – approximately
half of the country – expected to have enrolled and participated in grant-funded PD. At least 15% of
the participants should come from the Islamic Education Sector (except in PPP)xi.
The system is expected to improve the professional competencies of school and madrasah
principals, supervisors and education officials16 xii. When implemented, the system will enable staff
to reach base-level accreditation in school and district management, leaving them better able to
perform professional dutiesxiii
. The management of schools and madrasah is expected to improve as
a “direct consequence”xiv
. This, in turn, is expected to contribute to an improvement in the quality of
the education provided in targeted schools and districts, and to improved education service delivery
15
See Key Performance Indicator (KPI) 2 from the PAF: “The National System of Professional Development is
managed and operationalized effectively.”
16 To be measured by, inter alia, pre- and post-tests conducted by SSQ.

ANNUAL PARTNERSHIP PERFORMANCE REPORT 2013 18
nationwidexv. Ultimately, the EP is expected to make an important contribution to the Renstra target
of improving the quality of basic education (for all children).
3.1.2 The delivery mechanisms and support provided by the EP
Component 2 is delivered through a combination of technical assistance and, from late 2013,
earmarked budget support in line with the Grant Agreement between the Governments of Indonesia
and Australiaxvi
. From late 2013 MoEC, and specifically the Board of Education and Culture – Human
Resources Development and Education Quality Assurance and its Pusbangtendik, will be responsible
for implementing the system. GoA will finance the delivery of the system until 2016 and has
allocated AUD 110m for this purpose.
3.2 Context
The focus on quality improvements in the MoEC and MoRA Renstras remains important and timely
since the sector’s ability to deliver improved learning outcomes has remained stubbornly poor. Of
the 65 countries surveyed in the most recent PISA report (2013), Indonesia ranked 60th in reading,
and 64th in mathematics and 64th
in science.xvii
Neither the scores nor the ranking has progressed
much since 2009.
3.3 Achievements
Component 2 registered several significant achievements in 2013, which will lay the foundations for
GoI-led implementation in 2014 and beyond. These achievements were a culmination of series of
steps identified in the original design document that were necessary to release Australian funds.
These included: a review of existing training systems and institutions; a review of related public
financial management systems; the piloting and testing of the proposed system; the development of
operational and financial guidelines; and the development of the Grant Agreement for the program.
Of particular note, therefore, was the signature on 04 July 2013 of the Grant Agreement Deed
between the Governments of Australia and of Indonesia relating to the Professional Development
for Education Personnel. MoEC, SSQ and DFAT further developed or finalized key supporting
documents, such as the overarching Procedures Manual, a Procurement Manual and a Management
Information System. In addition, the PAF, which is part of the GA, has been developed (draft version)
and has been used to draft the M&E plan of activities of the systemxviii
.
Progress has been made by MoEC in preparing the legal frameworkxix for rolling out the system
(juklak)17. SSQ has facilitated workshops and provided technical assistance in drafting the new
Supervisor Regulation and it was reported that the draft has been tested through a number of
workshops in several provincesxx
. In addition, the MoF regulation18
required to allow MoEC to
implement activities of the system through special account funds was signed on 17 December 2013.
Activities can be funded once the MoEC Daftar Isian Pelaksanaan Anggaran (DIPA) is approvedxxi
.
Besides the GA and supporting measures, technical modules were extensively piloted and trainers
trained, whilst the SSQ C2 team, with the support of colleagues in C1, organized Access Planning and
the New School Induction Program (see Table 4).
17
This includes MoEC Regulation No. 28 / 2010 and Juklak for PPCKS, CPD principal/PKB KS/M, PPKSPS and
PPKPPD. 18
Directorate General for Treasury Regulation No. 49/PB/2013.

ANNUAL PARTNERSHIP PERFORMANCE REPORT 2013 19
Table 4: Persons trained by C2 (to end of November 2013)
Theme Persons trained (to November 2013)
Total Male Female
Principal CPD (a)
672 536 1,208
Supervisor PD (a) 994 308 1,302
DEO Competency Training (a)
905 148 1,053
PEO Competency Training (a)
378 96 474
Principal Preparation Program (b)
3,154 1,999 5,153
Access Planning (b) 283 34 317
New School Induction Program (b) 323 138 461
TOTAL 6,709 3,259 9,968
Source: (a) SSQ online database; (b) Data from C2 per 29 November 2013
3.4 Analysis
3.4.1 Relevance
In general, the introduction of a continuous professional development system for principals and
education officials is relevant: professional development is a Renstra objective and competency-
based PD is well accepted internationally. Other training, such as the district and provincial HRMD,
are deemed positive by participants due to their relevance to their day-to-day workxxii
.
SSQ has successfully piloted a range of PD modules since the start of the EP and there exists broad
agreement that a competency-based, continuous professional development system represents a
high quality approach to improving the capacity of this cadre of education professionals.
Furthermore, EP investments in quality improvement measures remain aligned with stated GoI
policy. Nevertheless, the relative priority of these investments may look doubtful when considered
against those priorities which will account for the lion’s share of ministerial attention in 2013-14 and
beyond, e.g. the roll-out of Curriculum 2013, and ongoing teacher certification ahead of the 2015
deadlinexxiii
.
The future relevance of the PD system will inevitably depend upon the priorities of the next
government and which will be defined in the subsequent Renstra. It seems that, even if CPD remains
relevant in the international education sphere, the approach is struggling to retain priority status in
the face of stiff competition from Curriculum 2013.
3.4.2 Efficiency
Whilst it was hoped that the GA would be signed in early 2013xxiv
, it was finally signed in July 2013
and although funds had been disbursed by the end of the year, no activities were implemented. The
timeframe was longer than anticipated and would suggest that the amount of preparatory work
required prior to GA negotiations was underestimated. This postponed the expected transition of

ANNUAL PARTNERSHIP PERFORMANCE REPORT 2013 20
lead responsibility from SSQ to GoI, and the implementation of associated measures to support
capacity development for Pusbangtendik staff thereafterxxv
. SSQ responded favourably to the
situation by, inter alia, further trialling Units of Learning and technical modalities. Whilst both
institutional partners would have preferred a quicker transition into GA implementation, the
methodical approach in preparing for the Grant Agreement has laid a strong foundation.
Implementation of the 2013 Curriculum began in July 2013xxvi
. This is likely to affect the timely roll-
out of the PD system, primarily because institutions responsible for delivery of the PD system
(known as “eligible entities” in the Grant Agreement) are also required to train teachers on the new
curriculum. For example, SSQ reports that in 2013 the need for Pusbangtendik to support the
implementation of the new curriculum affected their capacity to finalise the UoLs in timexxvii
. In
addition, the capacity for relevant GoI institutions to engage at a senior level on a number of large
nationwide priority programs is limited and so, whilst the GA provides the basis for an integrated
delivery mechanism, concurrent claims on GoI resources will likely have a significant bearing on
delivery in 2014 and 2015. Approximately 1.4 million teachers in 2014 and a further 1.3 million
teachers in 2015 have to be trained for the curriculum change by the institutions that would be
responsible for the delivery of training under the PD system. This clearly raises concerns about the
priorities and capacities of those institutions.
Whilst the GA does not explicitly state the number of school and Madrasah principals, supervisors,
and education officials being targeted by the PD system, the C2 Updated Design Documentxxviii
of
December 2012 states that “successful implementation of Component 2 will achieve the
Comprehensive Aid Policy Framework target that 293,000 school officials19
participate in
professional development over the lifetime of the partnership”. Current estimates in the GA PAF
include:
• 170,000 UoLs to be undertaken by principals;
• 24,000 training modules completed by 12,000 supervisors taking the SPD;
• 1,350 district officials undergoing an individual training course;
• 22,080 training modules completed by 1,840 principal candidates under the PPP; and
• 6,000 officials receiving NSIP training.
Combined with the 69,000 individual modules already completed by SSQ, the number of individual
training modules and UoLs expected to be provided under the EP remains at just under 300,000.
3.4.3 Effectiveness
Only pilot activities have taken place to date. Nevertheless, SSQ reports evidence of participants
applying their learning, which gives reason for confidence concerning the attainment of the EOCO,
i.e. that improved professional competencies of participating principals are applied. There is
anecdotal evidence of principals who participated in the pilot CPD training (on supervision)
subsequently applying their skills, leading to teachers utilizing a wider range of teaching methods
and toolsxxix. In addition, SSQ reports that the training has led to improved planning and
accountability of expenditure, availability of facilities and work with communitiesxxx.
19
The C2 Updated Design Document states that “this target uses the definition for calculation of CAP-F
Headline Result 11, Number of School Officials Trained which takes into account some district officials,
supervisors and principals will complete multiple training modules over the lifetime of the program”.

ANNUAL PARTNERSHIP PERFORMANCE REPORT 2013 21
However, the extent to which the CPD provided for principals, prospective principals, district and
provincial education officials, and supervisors will lead to improved school management (EOPO) and
improved students’ learning outcomes (at Goal level) is as yet unclear. Three challenges should be
noted:
• Whilst SSQ reports that the individual components deliver positive results, a robust
assessment of the effectiveness of the system as a whole will only be possible once the
system, which includes a range of technical modules and multiple service deliverers, has
been in operation in an environment of competing demand on time and resources.
• Any delay to implementation will exert pressure on the attainment of stated outputs and
outcomes and, more likely, on specific annual performance targets.
• Districts’ lack of compliance with MoEC’s Ministerial decrees (i.e. Ministerial Decree No.
12/2007 and Ministerial Decree No. 28/2010)xxxi
has the potential to reduce the
effectiveness of the PD system. The decrees seek to enforce high levels of objectivity over
the selection processes of supervisors and principals which can be subjectively influenced by
bupati or heads of the education officexxxii.
3.4.4 Impact
It is too soon to make an informed judgment on the likelihood and extent of impact. Nevertheless,
the success and likely impact of the current approach will be shaped by, inter alia:
• The adequacy of training provided by the system for career advancement of participants.
• The adequacy of appointment processes, e.g. adherence to relevant ministerial decrees (i.e.
Ministerial Decree No. 12/2007 on Supervisors, and Ministerial Decree No. 28/2010 on
Principals).
• Appropriate GoI institutions assuming responsibility for governing, implementing, using,
financing and quality assuring the system.
3.4.5 Sustainability
The sustainability of the CPD system for school principals – the cornerstone of DFAT’s investment -
remains unclear largely because the future organization and financing of PD at district, provincial
and national level has yet to be clarified. The current PD system receives significant financing from
DFAT; very little contribution has been provided by central, provincial, or district governments (and
neither was it expected in the GA). The main counterpart for implementing C2 activities is
Pusbangtendik and hence it is centrally driven. Should responsibility lay with districts, their ability
and willingness to pay for professional development remains uncertain and is untested. SSQ realizes
the importance of positive demonstration effects in 2014 to secure district (and possibly provincial)
buy-in. Since the GA is signed between DFAT, MoEC, and MoRA, securing the cooperation of district
governments is beyond the scope of the GA. However, should GoI drive towards decentralized
service provision be mirrored in the provision of CPD for principals, sub-national commitment to the
program at both a technical and financial level will be required to ensure future sustainability of the
PD system. In the absence of such commitments, there is a risk that the PD system may be
discontinued or, at least, the ambition that it be nationwide is unfulfilled.

ANNUAL PARTNERSHIP PERFORMANCE REPORT 2013 22
There are uncertainties around the continued involvement of the 15% madrasah participants in the
system. It is distinctly possible that Islamic education participants only secure benefit from the
system because it is fully funded by DFATxxxiii
; there are political-institutional reasons to question the
likelihood of MoEC funding the training of MoRA stakeholders after the EP.
GoI officials would typically agree that the investments made in the PD system are useful to meet
Renstra targets. However, at present, there is a lack of evidence about their political and financial
commitments, as well as technical capacities to fully adopt or adapt certain elements from the DFAT
financed PD systemxxxiv
. The sustainability strategy due in 2014 offers a timely and important
opportunity to resolve unanswered questions about the future roles, responsibility and financing of
the system.
3.5 What does this mean for the EP? The bottom-line
A summary table of component performance by DAC criteria is presented in Table 5. The ratings
scale used with the DFAT QRS (QAI and ICR) has been adopted. Recommendations for improvement
and, in particular, on increasing the likelihood of achieving EOPO 2 are made in Table 6, below.

ANNUAL PARTNERSHIP PERFORMANCE REPORT 2013 23
Table 5: Component 2 scorecard
DAC Criterion Score Justification Comments
Relevance 5
• The broad investment rationale remains sound, i.e. that the
performance of education managers should be enhanced.
• Pilot activities were deemed by participants to be highly relevant.
• Despite the fact that the system is designed to support GoI’s current
Renstra objectives, the degree of political and financial support is
circumspect; indeed, the relative political importance of CPD (vis-à-vis
Curriculum 2013, for e.g.) appears to be on the wane.
• The system needs to receive political
commitment and be included in strategic
documents (e.g. the RPJMN and upcoming
Renstra).
Efficiency 3
• GA implementation through GoI systems has yet to commence;
implementation could be delayed by competing priorities which would
compromise the timely achievement of outputs.
• Progress has yet to mature beyond piloting of technical options by SSQ.
• On a positive note, GA related documentation has been prepared in a
timely fashion.
• SSQ responded appropriately to the GA delay by, inter alia, making
incremental improvements to system components.
• “Eligible entities” will be responsible for
implementing the system from 2014. It is
unclear how the different capacities of the
eligible entities will affect the roll-out of the
program and the extent to which competing
priorities will affect efficiency of delivery.
Effectiveness TE
• SSQ evaluation reports demonstrate positive results from pilot activities
but a delay to outputs is likely to delay the achievement of outcomes.
• It is plausible that the effectiveness of the PD system could be
undermined by districts’ lack of compliance to ministerial decrees on
principals and supervisors.
• Awaiting commencement of implementation of
activities and POM C2 evaluation to enable
accurate scoring.
Impact TE
• The expected results of the system could be undermined by officials’
lack of adherence of district governments to ministerial decrees (e.g.
Ministerial decree No. 12/2007 on Supervisors; Ministerial decree No.
28 / 2010 on Principals).
• The impact of the PD system may be influenced by its contribution to
participants’ career advancement.
• Too early to provide scores for the same
reasons as above.
Sustainability 3 • Uncertain future financial commitments from central, provincial as well
as district governments.
• Sustainability strategy scheduled to emerge in
2014.

ANNUAL PARTNERSHIP PERFORMANCE REPORT 2013 24
Table 6: Component 2 key findings and recommendations
Findings Recommendations Level of
urgency Prime Responsibility
Given delays to the implementation of the GA,
the intended program outcomes may only be
achieved after 2016 (see §3.4.3)
R6: DFAT-MoEC assign sufficient resources to C2 so as to ensure
timely delivery of GA results, or should readjust the EOPO
and implementation strategy accordingly.
***
DFAT and MoEC (with SSQ support)
GoI’s political commitment to the PD system
remains unclear (see §3.4.1)
R7: MoEC should lobby and advocate for the PD system to be
included in strategic documents (e.g. the RPJMN and the
upcoming Renstra), thereby enhancing political
commitment to its implementation.
***
MoEC (with DFAT support through
ATOG and GOG; and SSQ support)
Unknown ability and willingness of central,
provincial and/or district government to finance
the system or pay for services provided by it after
the GA (see §3.4.1 and §3.4.5)
R8: Institutional Partners must better understand the financial
capacity and willingness of district, provincial and central
government levels to fund PD services, and develop a
workable sustainability strategy.
***
MoEC and DFAT (with POM and SSQ
support)
NB: Red (***) - high urgency; orange (**) - medium urgency; green (*) - low urgency

ANNUAL PARTNERSHIP PERFORMANCE REPORT 2013 25
4 Component 3: Islamic School Accreditation
4.1 An introduction
4.1.1 The EP investment
Component 3 seeks to improve the quality of Madrasah service provision in line with National
Education Standards (NES) in targeted provinces. Specifically, it supports the Ministry of Religious
Affairs (MoRA) to achieve one of its Renstra targets: that all Madrasah are accredited against the
NES, with a minimum of 50% at Level ‘B’, by 2014-2015.
The EP investment is deemed to be important for at least three reasons:
• Madrasah educate about 22% of the population and are one of the main providers of
education in poor communities.
• There are substantial disparities in education quality between public schools and private
Madrasah; about 72% of Madrasah are not accreditedxxxv
.
• Accredited Madrasah can guarantee the provision of leaving certificates and student
participation in national exams.
The EP supports the work of the MoRA Directorate General for Islamic Education, the Unit for
Implementing Madrasah Accreditation (UPPAM) and Sub-National Implementation Partners (e.g.
universities, Madrasah Development Centres) to improve Madrasah quality. Up to 1,500 targeted
Madrasah20 in 11 provinces will receive technical support from SNIPs and MoRA, as well as direct
financial support in the form of grants of AUD 10,000. SNIPs deliver their support through a set
program of training and mentoring services for each madrasah, including support to the preparation
and utilisation of madrasah development plans (RKM). The RKM assists the madrasah to concentrate
and align its efforts in achieving accreditation. It is expected that supported Madrasah will gain
improved capacity to perform against NES and that the application of these skills will improve the
quality of education services for existing and prospective learners.
The EP does not provide support to improve the accreditation process of Madrasah. The
independent National Accreditation Agency (Badan Akreditasi Nasional Sekolah or BAN S/M)
provides accreditation to schools and Madrasah based on an assessment of their performance
against the NES. To become accredited, a Madrasah must apply to the BAN S/M for assessment and
demonstrate performance against each NES.
EP stakeholders are aware that indirect systemic change may accrue as a consequence of testing and
promoting a system-wide model for strengthening Madrasah quality. The EP therefore seeks to:
• Demonstrate to MoRA how the MoRA-SNIP-Madrasah model could enable continuous
improvements to Madrasah’s service delivery.
• Support MoRA to trial different approaches to quality improvement, using finance from the
State Budget (Anggaran Pendapatan Belanja Negara).
4.1.2 The delivery mechanisms and support provided by the EP
C3 supports the Accreditation Unit (UPPAM) of the Directorate of Madrasah Education (PENMA) of
MoRA. It is delivered by SSQ in close collaboration with UPPAM, the Bureau of Planning, the Bureau
20
Divided into three phases of support – approximately 500 Madrasah each.
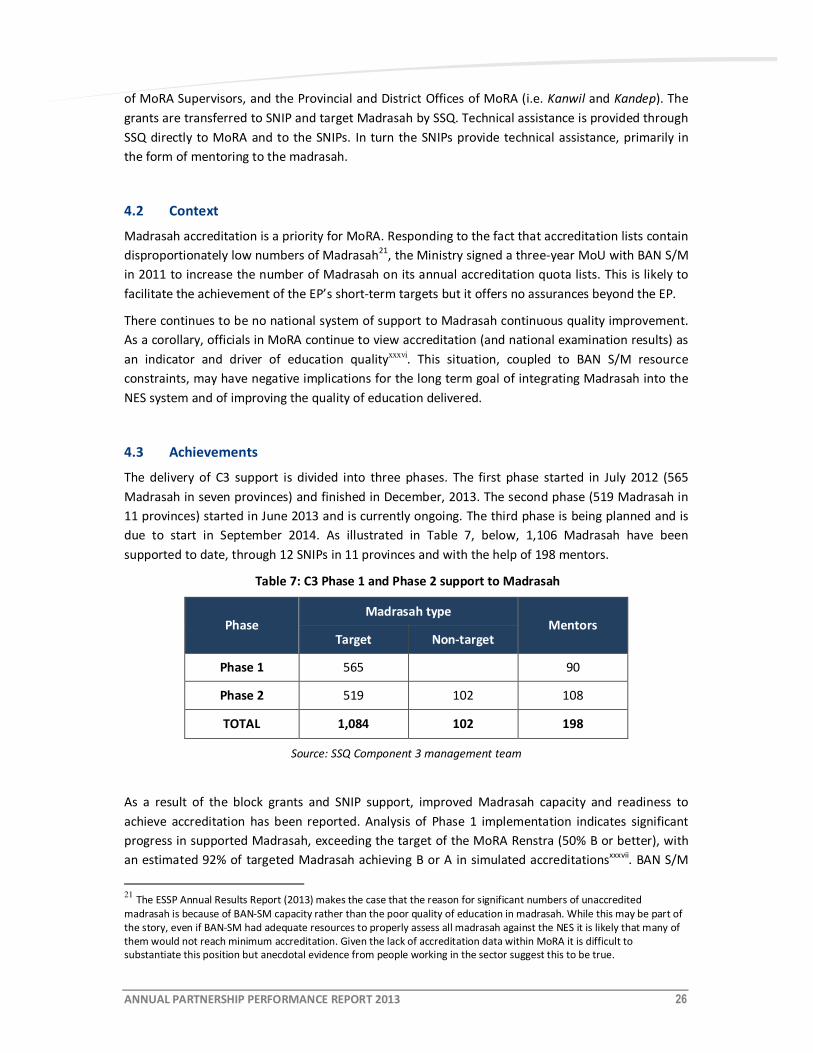
ANNUAL PARTNERSHIP PERFORMANCE REPORT 2013 26
of MoRA Supervisors, and the Provincial and District Offices of MoRA (i.e. Kanwil and Kandep). The
grants are transferred to SNIP and target Madrasah by SSQ. Technical assistance is provided through
SSQ directly to MoRA and to the SNIPs. In turn the SNIPs provide technical assistance, primarily in
the form of mentoring to the madrasah.
4.2 Context
Madrasah accreditation is a priority for MoRA. Responding to the fact that accreditation lists contain
disproportionately low numbers of Madrasah21
, the Ministry signed a three-year MoU with BAN S/M
in 2011 to increase the number of Madrasah on its annual accreditation quota lists. This is likely to
facilitate the achievement of the EP’s short-term targets but it offers no assurances beyond the EP.
There continues to be no national system of support to Madrasah continuous quality improvement.
As a corollary, officials in MoRA continue to view accreditation (and national examination results) as
an indicator and driver of education qualityxxxvi. This situation, coupled to BAN S/M resource
constraints, may have negative implications for the long term goal of integrating Madrasah into the
NES system and of improving the quality of education delivered.
4.3 Achievements
The delivery of C3 support is divided into three phases. The first phase started in July 2012 (565
Madrasah in seven provinces) and finished in December, 2013. The second phase (519 Madrasah in
11 provinces) started in June 2013 and is currently ongoing. The third phase is being planned and is
due to start in September 2014. As illustrated in Table 7, below, 1,106 Madrasah have been
supported to date, through 12 SNIPs in 11 provinces and with the help of 198 mentors.
Table 7: C3 Phase 1 and Phase 2 support to Madrasah
Phase Madrasah type
Mentors Target Non-target
Phase 1 565 90
Phase 2 519 102 108
TOTAL 1,084 102 198
Source: SSQ Component 3 management team
As a result of the block grants and SNIP support, improved Madrasah capacity and readiness to
achieve accreditation has been reported. Analysis of Phase 1 implementation indicates significant
progress in supported Madrasah, exceeding the target of the MoRA Renstra (50% B or better), with
an estimated 92% of targeted Madrasah achieving B or A in simulated accreditationsxxxvii
. BAN S/M
21
The ESSP Annual Results Report (2013) makes the case that the reason for significant numbers of unaccredited
madrasah is because of BAN-SM capacity rather than the poor quality of education in madrasah. While this may be part of
the story, even if BAN-SM had adequate resources to properly assess all madrasah against the NES it is likely that many of
them would not reach minimum accreditation. Given the lack of accreditation data within MoRA it is difficult to
substantiate this position but anecdotal evidence from people working in the sector suggest this to be true.

ANNUAL PARTNERSHIP PERFORMANCE REPORT 2013 27
will formally assess 502 Phase 1 Madrasah in the 2013 round of accreditation visitations, with 10
more scheduled for 2014. This will provide a basis for the comparison of results22
.
Besides observable progress in targeted Madrasah, there are also some encouraging indications of
institutional buy-in of the EP model of support at different levels. For example:
• At provincial level, there are several instances of SNIPs receiving non-EP funds to provide
their services to non-targeted Madrasah. For instancexxxviii
, SNIPs in East Kalimantan and
East Java support Madrasah outside of the block grants program in implementing an UPPAM
block grant on quality improvement. Phase 2 SNIPs, most notably MDC South Sulawesi, have
facilitated the support of new classroom building and classroom rehabilitation grants from
MoRA kanwil to nine Phase 2 Madrasah.
• At central level, despite some uncertain and contradictory comments on the success and
viability of the MDC/SNIP model of supportxxxix
, the new PENMA Director has encouraged
greater program synergy between the EP and all PENMA sub-directorates thereby
strengthening the level of MoRA commitment to the EP model of support. As a direct result,
grants for natural science labs are provided to 81 Phase 2 targeted Madrasah and packages
of multimedia equipment are provided to 75 Phase 2 targeted Madrasah. There are also
plans to use the content of the KTSP training and to scale-up its delivery to non-target
Madrasah.
4.4 Analysis
4.4.1 Relevance
Component 3 remains relevant in a context where MoRA seeks an increase in the number of
accredited Madrasah as well as improvements in the quality of the madrasah and their services. The
EP model of support seems relevant with regards to identified factors influencing Madrasah
performance (presented in Section 4.4.2), though some improvements are both desirable and
practical:
• The EP design directly targets principal performance, though less so other actors of the
Madrasah leadership triumvirate (Yayasan and Komite).
• The EP design directly targets teacher pedagogy, but to a lesser extent teacher commitment
and resource mismatch.
• The EP design does not explicitly target community engagement. The role of community
engagement and the potential for EP to realign its support towards it merits more attention
and analysis than it currently receives.
4.4.2 Efficiency
The implementation of C3 is outsourced to the SSQ Managing Contractor. SSQ priorities in 2013
included supporting Phase 1 and Phase 2 Madrasah; planning Phase 3 of the Madrasah block grants
program; liaising with provincial offices of MoRA; supporting and reviewing the performance of
SNIPs; and, producing monitoring and evaluation dataxl.
22
see SSQ Annual Progress Report 2013, p.23

ANNUAL PARTNERSHIP PERFORMANCE REPORT 2013 28
The implementation of Phase 1 and 2 has been managed well, with sufficient progress against set
activities and without substantial delays. Overall C3 is tracking close to budget with an overspend of
AUD 471,685 or 4.7% of budget over the last financial year (June 2012 to June 2013). The efficiency
of the outsourcing model is likely to be analysed as part of the proposed VFM work.
Both SSQ and POM have undertaken financial and compliance audits on grant recipients (Madrasah
and SNIPs). As illustrated in Table 8, below, the 2013 POM audits have raised a number of
compliance issues and fraud cases that reflect the limited capacity of Madrasah to administer grants
competently.
Table 8: Distribution of findings for C3 POM audits
Category Issues Findings
Procurement 5 84
Financial 15 313
Reporting 5 124
Program 2 13
Total 27 534
Source: POM Compliance Audit Batch B Madrasah Accreditation Project Phase 1
The SSQ evaluation of Phase 1 reported some differences in the efficiency of support provided to
those Madrasah initially assessed as TT, C or Bxli. The cost to improve Madrasah that achieve a level
B in the baseline simulated accreditation is much higher (over four times as high) than the cost of
similar improvements for Madrasah initially assessed as level TT. In addition, Madrasah that had
already achieved a level B in the baseline simulated accreditation only achieve small improvements
against the NES and it could be argued they would have been accredited regardless of support from
the EP. This calls for a more acute targeting of Madrasah with low initial standards (TT if possible).
4.4.3 Effectiveness
While it is too early to from a conclusive judgment on the achievement of EOPO 3, there are some
preliminary suggestionsxlii
that improved education service quality can be identified and attributed
to EP support. These observations tend to suggest the EOPO is likely to be achieved within the
lifetime of the EP.
C3 supports SNIPs to provide training and mentoring services to Madrasah in their respective
provinces. Whilst SNIP capacity to develop Madrasah has reportedly improved in the areas of
networking and provision of trainingxliii, significant future improvements (in SNIP capacity) are
unlikely given the limited support to developing SNIP capacity and the lack of a dedicated strategy.
This might eventually affect the ability of SNIPs to build Madrasah capacity and, in turn, affect the
continuous improvement of Madrasah targeted beyond the life and scope of the EP.
Meanwhile, and as reported in the POM EOPO 3 Evaluation Baseline Report (EBR), SNIP training
services are generally well received and found to be useful. Many of the grant and non-grant
Madrasah that participated in the training have reportedly applied the learning in their Madrasah,
leading to improved capacity in delivery of quality education demonstrated by improved teaching

ANNUAL PARTNERSHIP PERFORMANCE REPORT 2013 29
practicexliv. The success of mentoring services is more nuanced, due to the high variation in the
quality of the mentors themselves, and the intensity and quality of their oversight (by SNIPs).
Direct support to Madrasah, in the form of block grants, appears effective: analysis of the Phase 1
endline data indicates that improvement in supported madrasah has exceeded the target of the
MoRA Renstra (50% B or better) with an estimated 92% of targeted Madrasah achieving B or A and
with greater improvement in MI levels than MTsxlv
. Based on a preliminary analysis of Phase 2
progress, the POM EBR identifies Madrasah preparedness to receive the grant as a critical factor of
success, i.e. the initial planning and budgetary allocations for the grant and the socialisation
strategies employed by Madrasah to raise community awareness and support. While there are some
concerns that EP block grants may inhibit other external funding and community support, there is so
far no indication that it does.
4.4.4 Impact
The expected impacts remain unclear at this stage, though two categories can be distinguished:
individual impact at individual madrasah level (e.g. change in quality of education services and in
madrasah capacity to attract external support) and systemic impact at nationwide/targeted
provinces level (change in capacity to support and assess madrasah continuous improvement
process). Whilst the impact on participating madrasah is likely to be high, the level of systemic
change generated and/or supported by the EP remains uncertain.
Tangible and incremental gains, such as improvements in facilities’ condition and teaching quality,
are already observable in individual Madrasah, mostly in madrasah that receive block grants but also
in non-participating madrasah that still receive SNIP support. As reported in the SSQ evaluation of
Phase 1, changes in the latter category are greater than expected and cover both physical and
management issues. These changes may, in part, be spurred on by the sharing of participating
Madrasahs’ learning and experience in Madrasah Principal Working Groups (KKM) and by the follow-
up support provided by supervisors. It is therefore suggested that significant gains to the quality of
Madrasah may be achievable by supporting KKM and the improvement in the quality of supervisors.
Less observable are general changes in the madrasah capacity to attract financial or technical
support from sources outside the EP. That is unsurprising as this is mainly based on the assumption
that as the quality of the Madrasah is seen to improve, community (and other) support for the
Madrasah will increase, leading to increased financial and in-kind support to the Madrasah.
Therefore any substantial change would not be expected for some time after observable
improvements to Madrasah have occurred. There are no indications of a decrease in funding from
other sources during the period of supportxlvi
.
The current perspective on systemic change is less favourable; as a legacy of the EP design, there
continues to be no clarity about the nature of the EP support to systemic change and the expected
results. This situation, coupled with the absence of a MoRA strategic framework for Madrasah
continuous quality improvement, jeopardises the ability to scale-up benefits of the EP investment:
the impact of the EP achievements risks being restricted to participating Madrasah, or at the very
best to non-participating Madrasah in SNIP supported provinces.
4.4.5 Sustainability
The extent to which EP supported achievements and benefits will be sustained remains uncertain.
There is a lack of clarity on the nature of the benefits to be sustained and on how this will be

ANNUAL PARTNERSHIP PERFORMANCE REPORT 2013 30
achieved. There is a risk that MoRA fails to provide meaningful support to implement or adapt the
quality of the improvement model tested and developed under the EP once the program finishes in
2016xlvii
. In addition, there is uncertainty about BAN S/M resources and their capacity to include
Madrasah in the accreditation process beyond the period of the Memorandum of Understanding.
Against this backdrop and given its current level of resources, it is unrealistic to expect UPPAM to be
able to facilitate a system to support accreditation of Madrasah across Indonesia without significant
change. Additional resources are required and greater consideration of the design of a sustainable
system.
4.5 What does this mean for the EP? The bottom-line
A summary table of component performance by DAC criteria is presented in Table 9, below. The
ratings scale used with the DFAT QRS (QAI and ICR) has been adopted. Recommendations for
improvement and, in particular, on increasing the likelihood of achieving EOPO 3 are made in Table
10 below.

ANNUAL PARTNERSHIP PERFORMANCE REPORT 2013 31
Table 9: Component 3 scorecard
DAC Criterion 2013 Score Justification Comments
Relevance 4
• Most factors of Madrasah performance are covered in the EP design.
• Weak consideration/ focus on community engagement.
• Expected changes at systemic level are not well delineated.
• Factors influencing Madrasah performance have
been defined based on a preliminary analysis of
Phase 2 activities.
• Block grant socialisation is thought to be
instrumental in stimulating community
engagement.
Efficiency 5
• Implementation is contracted to the SSQ managing contractor; there
are no substantial delays and disbursements are on track.
• Efficiency of support could be increased through targeting madrasah
with lower initial standards.
• The efficiency of the outsourcing model could be
examined as part of a VFM assessment.
Effectiveness 4
• Tangible and observable incremental gains are evident at Madrasah
level, including in some non-participating Madrasah.
• In the absence of clear systemic change, the EP benefits may be
restricted to individual Madrasah.
• Results of the BAN S/M accreditation process
might soon highlight the extent of the
effectiveness of Madrasah support.
Impact TE
• It is still too early to confidently assess the impact
of EP activities – the first phase of support has just
been finalised in December 2013.
Sustainability 2
• Lack of clarity about achievements and benefits to be sustained, and
absence of strategy compounded by project modality.
• UPPAM mandate inconsistent with level of GoI resources.
• Uncertainty about BAN-S/M resources and capacity to include
Madrasah in the accreditation process beyond EP life.
• With the start of the second half of the EP period,
considerations about the sustainability of EP
achievements and their benefits become crucial.

ANNUAL PARTNERSHIP PERFORMANCE REPORT 2013 32
Table 10: Component 3 key findings and recommendations
Finding Recommendations Level of
urgency Prime Responsibility
Lack of clarity about expected changes at systemic level
from EP support (see §4.4.4)
R9: DFAT and MoRA should define and agree upon the
nature and extent of systemic change expected. ***
DFAT and MoRA (with SSQ facilitation
as required)
Absence of a clear MoRA strategy for Madrasah
continuous quality improvement (see §4.4.4)
R10: EP support to systemic change should encourage
and be based on a clear and resourced MoRA
strategy for supporting Madrasah continuous
quality improvement.
***
MoRA (with DFAT and SSQ facilitation
as required)
The average cost to achieve an increase in one level for a
Madrasah initially accessed as a level B is over four times
more than that to achieve a one level gain for a
Madrasah initially assessed as a TT (see §4.4.2)
R11: There should be an explicit and systematic targeting
of beneficiary Madrasah with low initial standards
(TT if possible). **
SSQ
Impact of EP may be restricted to target Madrasah, while
there exist other effective channels to spread benefits to
non-target Madrasah (see §4.4.4)
R12: EP should continue and increase engagement with
sub-national institutions to develop and seek
support for non-targeted Madrasah, including
engagement with KKM and Madrasah supervisors.
*
SSQ
EP design does not explicitly target community
engagement, an influential factor of Madrasah
performance (see §4.4.1)
R13: EP should develop, support and monitor measures
to better involve other key, but currently
untargeted stakeholders (e.g. committee members,
yayasan and community members) in Madrasah
quality improvement strategies.
**
SSQ (with POM support as required)
NB: Red (***) - high urgency; orange (**) - medium urgency; green (*) - low urgency

ANNUAL PARTNERSHIP PERFORMANCE REPORT 2013 33
5 Component 4: Analytical and Capacity Development Partnership
5.1 An introduction
5.1.1 The EP investment
Component 4 of the EP seeks to promote the use of evidence in developing and implementing
education sector policies, plans and budgets. It does so through the activities of the Analytical and
Capacity Development Partnership (ACDP). The ACDP organizes, coordinates and responds to
requests from relevant GoI ministries, most notably Bappenas, MoEC and MoRA, for analytical
activities, such as discrete policy research studies. Participating policy-makers are expected to utilize
the analytical work to inform education sector policy, planning and budgeting (EOPO 4). This, in turn,
is expected to make a contribution to improved sector governance (Goal 3)23
.
5.1.2 The delivery mechanisms and support provided by the EP
The Government of Australia and the European Union (EU) provide approximately USD 5024
million
to support implementation of the ACDP. The ACDP technical oversight group (ATOG) is co-chaired by
the Deputy Minister of Human Resources and Culture in Bappenas, the Head of Balitbang (MoEC),
and the Director General of Islamic Education (MoRA). The ATOG is scheduled to meet quarterly and
is responsible for, inter alia, reviewing and approving ACDP’s annual workplan, approving reports,
and organizing technical dialogue between the ADB, DFAT and the EU. ATOG membership includes
senior officials from MoEC, MoRA, Bappenas, MoF, MoHA, DFAT and the EU.
ACDP’s executing agency is MoEC’s National Office for Research and Development (Balitbang), with
its Head acting as Director of the ACDP. The ACDP Program Manager, who is the Head of the Centre
for Research and Policy at the Balitbang, is responsible for day-to-day management of the program,
and this includes preparing the annual workplans and budgets and coordinating dissemination and
publication of ACDP reports.
The Asian Development Bank (ADB) is responsible for managing and administering the ACDP on
behalf of the Balitbang. The ADB has contracted an Operational Management Team (OMT) and a
Core Advisory Team (CAT) to provide technical support to the implementation of the program, with
both teams being based in the ACDP Secretariat at Balitbang (MoEC). The OMT provides
administrative and management support services such that the agreed activities and outputs are
delivered in a timely and professional manner. Its primary responsibilities include procurement and
subsequent oversight of contracted services. The CAT supports the ACDP Program Director and
Program Manager with the preparation and implementation of ACDP activities.
23
The Outcome and Goal statements for Component 4 vary a little between those in the EP logic architecture
and those in ACDP’s M&E Strategy. Respectively, they are as follows: Participating policy-makers utilise
analytical work to inform education sector policy, planning and budgeting vs. Contribute to the government's
efforts to strengthen the education system and sustain organizational performance improvement over the next
15 years by modernizing the system, improving service empowerment, and enabling better regional and
international competitiveness (Outcome); Sector governance improves through increased use of evidence for
decision making vs. Contribute to implementing Indonesia's medium-term development policies and strategies
for poverty reduction, achieving education for all and education-related Millennium Development Goals, and
improving its regional and global economic competitiveness (Goal). 24
Each donor provides funding in their own currency and so the total funds available will depend on exchange
rate variations.

ANNUAL PARTNERSHIP PERFORMANCE REPORT 2013 34
All contract activities are procured through a competitive bidding process either among prequalified
Indefinite Delivery Contacts (IDC) consortia or individually recruited consultants.
5.2 Context
The ACDP started in January 2011 and is expected to close in 2015. From a national perspective, this
year’s commentary about C4 progress is timely for several reasons:
• The ACDP has passed its mid-point and is nearly three years into implementation;
• The ACDP is expected to contribute to the achievement of GoI education objectives and
targets, as outlined in the current MoEC and MoRA Renstras, both of which are due to expire
in 2014,
• The Presidential elections in mid-2014 are likely to usher in changes to political appointees
and key civil servants in target ministries.
With three years of relative stability soon to give way to some uncertainty in the political, policy and
institutional environment within which ACDP operates, it is imperative that the most is made out of
the gains made to date and that ACDP is steered successfully through the changes ahead.
From an international perspective, the ACDP modality offers learning opportunities for those donors
investing in Knowledge-to-Policy (K2P) processes: a theme that is receiving increasing attention
amongst development partners, and which has broader relevance to DFAT in Indonesia, e.g. see the
ongoing Knowledge Sector Initiative. Of utmost important is the implicit assumption that decision-
makers develop policy based on objective, high-quality evidence.
5.3 Achievements
The ACDP has made steady progress to date. As at the end of November 2013 it had procured 25
activities and had planned an additional seven activities to be launched in the first half of 2014.
Together, these 32 activities would constitute over USD 26m of contracted commitments (see Table
11).
Table 11: Progress against ACDP workplan (as at 30 November 2013)
Theme Comment
# of procured activities 25
# of person-months
procured through IDC
consortia
687
of which 140 person months (20%) are for international TA and
547 person months (80%) are for national TA
Value of contracted
commitments (USD)
19,629,052
It is expected that an additional 7,623,505 will be contracted
before the end of May 2014
Source: Prouty pers. comm. to POM, 26 November 2013

ANNUAL PARTNERSHIP PERFORMANCE REPORT 2013 35
The ACDP brought a number of pieces of work to conclusion in 2013, including the School and
Madrasah Principals and Supervisors Competencies Baseline Study (ACDP 007). It has organized over
100 workshops, meetings and training events to date, attracting more than 3000 participants25.
The ACDP has recorded several significant ‘wins’. For example:
• The recommendations made in Early Childhood Development Strategy Study (ACDP 001)
were included in the Presidential Decree on Holistic Integrated – Early Childhood
Development (HI-ECD)xlviii
.
• The content of Madrasah Education Financing Study (ACDP 003) informed discussions
between the Ministers of Religious Affairs and of Home Affairs about Madrasah financing.xlix
.
There is also anecdotal evidence that GoI and development partners responded favourably to the
Background Report on the Education Sector in Indonesia (ACDP 002), with strong ministerial buy-in
in advance of the upcoming OECD reviewl.
5.4 Analysis
5.4.1 Relevance
The investment choice – that of providing policy-relevant evidence and advice to key GoI ministries –
remains relevant, and the upcoming election and planning cycle in 2014-15 offers further scope to
influence decision making. Should that be the case, the return on ACDP investment could be high.
Nevertheless, the extent of ACDP’s relevance may be undermined by any system inefficiencies, i.e.
the relevance of individual outputs inevitably declines should windows of opportunity be missed.
Equally, it is frequently realized that the uptake of evidence is informed by a complex array of
political-institutional factors. How and when ACDP navigates these complexities, and the extent to
which it uses brokers or intermediaries or indeed sees itself as a broker in K2P processes, is unclear
to POM26
.
ACDP’s interest in supporting activities that address sub-national interests and clients (e.g. in Papua)
is noteworthy and reflects a desire for the ACDP to remain relevant and responsive to needs. This is
also well in line with the decentralized nature of the education sector and with the effort of other
DFAT programs to support such realities.
5.4.2 Efficiency
As at 31 December 2013, ACDP had expended USD 10,855,256 (21.7%) of its c. USD 50m allocation.
Contract commitments were valued at USD 19,955,290, with a further USD 7,268,100 expected to be
committed between 01 January and 30 June 2014. Of the total USD 40,211,000 allocated to
Technical Cooperation Services (i.e. output delivery) between 2011 and 2015, USD 14,081,558 was
committed as at 31 December 2013, with a further USD 6,922,000 expected to be committed before
30 June 2014li. As such, USD 19,207,442 or 47.7% of the Technical Cooperation Services budget-line
will likely remain uncommitted going into the last 18 months of ACDP life’s span.
25
Although some people will have attended more than one event so the actual number of individuals will be
far less. 26
ACDP’s Communication Strategy was released in March 2013. Whilst it makes reference to “policy-makers
and other stakeholders” (e.g. p8) it is not immediately apparent if and how it seeks to use intermediaries as a
means to stimulate interest and understanding, to influence decision-making, etc. Moreover, its “target
audience” is “very wide” (p13); arguably too wide.

ANNUAL PARTNERSHIP PERFORMANCE REPORT 2013 36
ACDP is cognizant of the need to be responsive, relevant and timely. It has made a concerted effort
to usher in a greater range of related products, such as policy briefs. Nevertheless, stakeholders
remain concerned about three challenges:
• The ability of the ACDP to respond in a timely manner to the small ‘windows of opportunity’
that arise to provide key decision-makers with critical information, e.g. on options, costings,
and necessary actions27.
• The variable performance of IDC service providers (and the associated impact on the quality
and timeliness of ACDP deliverables)28
.
• Variable reporting standards (and the associated delays to ACDP deliverables).
ACDP itself acknowledges its mixed record of delivery to datelii. More needs to be done to improve
ACDP’s ‘value proposition’29 if it, and its outputs, are to be regarded as being of optimal worth to key
stakeholders: the persistence or re-emergence of a track record of late delivery and of variable
report quality will inevitably affect the cost-efficiency of the current arrangements (and, in turn, the
extent to which it attains its broader objectives).
5.4.3 Effectiveness
The ACDP aspires to inform, inter alia, the development/revision of education policies, regulations,
strategies, systems, and programs. Whilst this is laudable, there is some degree of uncertainty about
what would represent a good return on the AUD 50m investment, in part because the ACDP M&E
Strategy does not provide outcome-level targets30
. Without clarity about expected results, ACDP
renders itself open to criticism about its effectiveness and whether the costs are aligned with
expected (and actual) benefits.
As noted above, ACDP’s output to date has contained a large number of studies that require a
number of months to conceive, procure and then deliver. Whilst there is a role for ‘lengthy’ studies,
it is appropriate to ask whether the weighting put on such studies offers the most effective way for
ACDP to pursue its intended outcome. (It should be noted that ACDP’s CAT reports that it has
successfully argued for smaller sample sizes than proposed by GoI clients).
The day-to-day operations of the ACDP are shaped by the actions of the Secretariat. As such, it
should add value at both a strategic level and at an operational level, e.g. during activity
identification, during quality assurance/enhancement, and in post-activity follow-up. Nevertheless,
there appears to be a lack of consensus about whether ACDP’s role, and that of its sub-contractors,
27
ACDP reports that the typical lifetime of an activity is 4-12 months (see ACDP Six Monthly Progress Report,
End 2012, January 2013). 28
ACDP reports that the poor performance and/or replacement of study team leaders and other key
consultants on several occasions (e.g. ACDP 003, 004, 011, 015) and that key deliverables have been submitted
later than originally expected on a number of occasions (e.g. ACDP 001, 003, 004, 007, 008, 010, 015).
Difficulties between consortia partners have also been described on occasion (e.g. ACDP 011) (see ACDP Six
Monthly Progress Report, Mid 2013, July 2013 and ACDP Six Monthly Progress Report, End 2012, January
2013). 29
i.e. the benefits that an institution offers its clients in the delivery of products or services, especially by being
different to or better than existing products or services in ‘the market place’. 30
The outcome section of ACDP’s M&E Strategy makes reference to four indicators, including “Number of
ACDP outputs disseminated/ discussed at senior policy-making level (echelon 1+)” and “number of ACDP
outputs used to inform the development/revision of policies, regulations etc., organizational reforms,
information and communication system” (ACDP Monitoring and Evaluation Strategy, Revised Version,
December 2012).

ANNUAL PARTNERSHIP PERFORMANCE REPORT 2013 37
is (or should be) to inform or to influence decision-making (see the EOPO31), and what, in turn, that
means for personnel requirements, the content of ACDP deliverables and perhaps the ways in which
the Secretariat and the IDC engage with the client. Equally, there appears to be uncertainty about
the extent to which the Secretariat is the client or a service provider to the ultimate client, and what
that means for internal quality assurance processes.
DFAT, like many donor agencies, reports a desire to engage with its counterpart government in an
informed and strategic manner and, in so doing, to use its investment to leverage greater
development (and other) returns. In principle the ACDP offers DFAT such an opportunity, though it is
important to temper such an ambition with an acknowledgement that development partners have
less scope to influence policy-making in a dynamic, well-resourced middle-income country such as
Indonesia than in many less developed countries where ministries are reliant on the financial and
non-financial support of donor agencies32. Nevertheless, there appeared to be comparatively
minimal engagement between DFAT and ACDP in 2013, and it is apparent that GoA could make more
of ACDP’s frequent engagement with individuals in key ministries33
. The ACDP Secretariat would look
favourably on such measures and POM notes DFAT’s recent appointment of a staff member
dedicated to technical and managerial liaison with the ACDP. Equally, the virtues of the ACDP being
regarded as the fourth component of the Education Partnership are recognized by most EP
stakeholders but there is clear scope for more formal engagement across the component parts of
the EP; where frequent dialogue exists between the ACDP and other parts of the EP it usually stems
from personal relationships and prior engagement34
rather than a concerted effort to synergize the
EP components.
5.4.4 Impact
ACDP seeks to make a contribution to “the implementation of Indonesia’s medium to long term
national development policies, including poverty reduction, social development, and improved
regional and global economic competiveness. This includes national education sector policies and
ACDP indicators at the impact level include key education sector performance indicator targets”liii
.
This is evidently a long-term ambition. Much depends on ACDP’s correct reading of and response to
the political landscape; much may also depend on good fortune. What is certain is that its
contribution to improved sector performance before 2016 will be minimal given lag times between
product conception and delivery, resultant policy change, and its subsequent bearing on sector
performance. Given the plethora of factors that drive sector performance and the uncertain
associated timeframes one cannot state with any confidence the likelihood of ACDP making a
definite and sizeable (however defined) contribution to sector performance. The upcoming
finalization of the PMF coupled with POM’s evaluation studies and routine ACDP monitoring and
reporting, will inevitably assist capture of results in 2014 and 2015.
31
“Participating policy-makers utilise analytical work to inform education sector policy, planning and
budgeting”. 32
DFAT and ACDP recognise that the scope to have meaningful engagement and influence at sub-national level
may be greater, and ACDP’s work in Papua (ACDP 039), for example, offers important learning opportunities
for DFAT and its upcoming delivery strategy and investments. 33
Whilst ACDP’s frequent engagement with GoI officials is known, the quality of the engagement is unknown
to POM. 34
For example, the Team Leader of ACDP 007 now leads SSQ Component 2 of the EP and this has led to
positive dialogue about ACDP’s involvement in better understanding the likely results of the EP investment in
PPP.

ANNUAL PARTNERSHIP PERFORMANCE REPORT 2013 38
5.4.5 Sustainability
ACDP was conceived as a means to an end; the Secretariat will not be sustained after the lifetime of
the donor investment. Nevertheless, ACDP and therefore the GoI will secure sustained benefits if
recommendations made within specific ACDP deliverables are acted upon.
5.5 What does this mean for the EP? The bottom-line
A summary table of component performance by DAC criteria is presented in Table 12, below. The
ratings scale used with the DFAT QRS (QAI and ICR) has been adopted. Recommendations for
improvement and, in particular, on increasing the likelihood of achieving EOPO 4 are made in Table
13, below.

ANNUAL PARTNERSHIP PERFORMANCE REPORT 2013 39
Table 12: Component 4 scorecard
DAC Criterion 2013 Score Justification Comments
Relevance 4
• Investment in policy processes remains highly relevant but ACDP’s
relevance will be undermined if/where ‘windows of opportunity’ are
missed.
Efficiency 3
• Not infrequent replacement of consultants
• Delays to submissions
• Variable quality of reporting
Effectiveness 4
• The long lifecycle of many ACDP activities is seemingly inconsistent
with the political realities of decision-making
• Nevertheless, examples of evidence utilization can be cited, e.g. ACDP
001.
• ACDP should consider options to better bundle
findings, i.e. so evidence is provided by theme and
not just by report-by-report
Impact TE
• Likelihood is unknown and depends on a number of factors. As such, it
is very difficult to provide an accurate, defensible score
• The likelihood of a number of ACDP outputs having impact-level
benefits is very uncertain but should one have a direct, significant and
meaningful effect on a key policy the impact of the ACDP could be
significant.
• ACDP’s six-monthly reports would benefit from
improved tracking/reporting of post-report
measures and results.
• POM’s upcoming evaluation study will support
understanding of policy processes and ACDP’s
impact in that regard.
Sustainability 4
• Sustained benefits will accrue should key report recommendations be
implemented.
• Insufficient routine capture, tracking and reporting of changes to the
policy environment after completion of individual activities limits the
extent to which POM can state with confidence that (specific)
sustained benefits are likely.
• The modality – the ACDP delivery vehicle – will not
be sustained and is not expected to out-live the EP.
The extent to which benefits (e.g. changes to policy
content and subsequent implementation) are likely
to continue after ACDP closure depends, in part, on
the extent to which ACDP and its individual
activities have successfully ushered in improved
understanding of and attitudinal change and
created ‘space’ for meaningful policy-related
discussion about the issues.

ANNUAL PARTNERSHIP PERFORMANCE REPORT 2013 40
Table 13: Component 4 key findings and recommendations
Findings Recommendations Level of
urgency Prime Responsibility
The ACDP remains insufficiently agile and
responsive to the needs of its client (see §5.4.2)
R14: ACDP should continue to revise and diversify its product
offering (activity types) such that it is responsive and
timely, and offers value for money.
** ACDP (with guidance from the ATOG)
ACDP processes and events offer DFAT
opportunity to engage in more strategic dialogue
with key GoI officials but this potential is under-
exploited (see §5.4.3)
R15: DFAT should better articulate how, when and why it seeks
to gain strategic value from its investment in the ACDP. **
DFAT (with ACDP support as required)
EP implementing partners (e.g. SSQ and POM)
have a patchy understanding of upcoming ACDP
events (see §5.4.3)
R16: DFAT/ACDP should make a concerted effort to identify
cross-component links and to flag relevant upcoming
events such that ACDP becomes a more integral part of the
EP and that synergies are exploited.
*
DFAT and ACDP
NB: Red (***) - high urgency; orange (**) - medium urgency; green (*) - low urgency

ANNUAL PARTNERSHIP PERFORMANCE REPORT 2013 41
Part B: Zooming out
Cross-cutting issues

ANNUAL PARTNERSHIP PERFORMANCE REPORT 2013 42
6 Beneficiaries
6.1 Identification of beneficiary groups
Specific beneficiary groups for the EP can be identified as:
• The immediate beneficiaries of EP investment, e.g. the eligible entities in C2, the SNIPs in C3,
the Madrasah receiving block grants in C3, and those decision-makers making requests of
ACDP in C4.
• The intermediate beneficiaries, i.e. those receiving benefit through the immediate
beneficiaries, such as the principals and supervisors securing PD (C2) and the madrasah
receiving support from the SNIPs in C3.
• The ultimate beneficiaries, i.e. the students.
As noted in the 2012 APPR, it is reasonable to expect that the nature and timing of impacts will vary.
For example:
• Immediate and intermediate beneficiaries should secure benefits in the short to medium
term, i.e. within the next three to five years.
• The ultimate beneficiaries – the students – may receive some benefits in the short-term (e.g.
where they are enrolled in a new school) but they may only receive other intended benefits
in the medium to long-term (e.g. 3-10 years), particularly where changes to service provision
and ultimately learning outcomes are dependent on changes to an improved policy
environment, system performance etc.
6.2 Analysis
6.2.1 Social inclusion
Social Inclusion (SI) typically concerns the pursuit of equal opportunity. It requires the identification
of who is prone to exclusion (e.g. because of gender, location, disability, language) and requires that
a program ensures, insofar as possible, that the identified groups receive equal access to
opportunities, resources, information etc. In so doing, a program might promote, for example, equal
investment in training opportunities for men and women.
From a design and delivery perspective, it is praiseworthy that discrete elements of the EP contain
dedicated SI-related investments, e.g. the construction of ramps and accessible toilets for children
with physical disabilities, and the inclusion of SI subject matter in training modules. Moreover,
Implementing Partners have taken steps to address SI. SSQ, for example, has developed a range of SI
Guidelines and associated tools, and these are being used during implementation. ACDP has also
commissioned or completed several relevant reports, including a Review of a Decade of Gender
Mainstreaming in Education.
Nevertheless, these gains are offset by the continued absence of an EP SI strategy or framework (see
the 2012 APPR). As such, the EP lacks, inter alia:
• A definition of social inclusion, and a statement about why the Governments of Australia and
Indonesia deem it to be important.

ANNUAL PARTNERSHIP PERFORMANCE REPORT 2013 43
• An articulation of the EP’s broad approach to social inclusion35.
• An articulation of boundaries and omissions, e.g. because DFAT and/or GoI believe there is
no demand, or insufficient limited funds, or because of an absence of a suitable entry-point,
or because others are doing it, etc.
• An articulation of what the EP believes can be done and what it expects to deliver by 2016.
In the absence of a SI strategy, it remains unclear what the EP feels it should be doing with respect
to SI and what targets, if any, the EP has set itself. DFAT and partners are not obliged to monitor
which groups are capturing benefit from EP investments36
. As such, POM cannot make a judgment
call on progress and sufficiency of achievements.
6.2.2 Social targeting
The notion of social targeting is related to social inclusion but is different. It concerns the pursuit of
equitable outcomes (vis-à-vis the pursuit of equal opportunity). It goes beyond social inclusion by
seeking to ensure that benefits are distributed fairly. The basis for social targeting will vary
depending on the overarching objectives but it would typically entail making investments that
address the specific needs of particular vulnerable groups, ensuring, insofar as possible, that
program resources are directed predominantly to those intended groups. As such, it is consistent
with the notion of ‘leaving no-one behind’, something that appears to be emerging as a core theme
in the new Australian government’s aid framework.
The EP design does not explicitly uses social targeting to focus favourably on specific vulnerable
groups. In the absence of an SI strategy, this omission has not been restored and it constrains the
ability of the EP to target specific vulnerable groups.
6.2.3 Outcomes-led targeting
Echoing the concept of social targeting but differing in its purpose, the notion of outcomes-led
targeting relates to a systematic focus on those stakeholders that will increase the likelihood of the
stated program objectives (in the case of the EP, the EOPOs) being achieved. EP implementation
already employs this notion, though with variable intensity and success across the components.
Given the mid-point stage of the EP and the importance of focusing on higher level achievements, it
is worth considering the value of explicitly targeting categories of beneficiaries to strengthen the
chances of reaching the EOPOs. Whilst care needs to be taken not to trade-off the promotion of
long-lasting systemic change with the achievement of (sometimes narrower) EP objectives,
outcomes-led targeting of EP beneficiaries could certainly be improved across EP components and
could facilitate realisation of the EOPOs.
As an example, the intention of C1 is to improve access to nine years of basic education for boys and
girls in un-served and under-served areas, but the supply-led approach to the challenge of
enrolment does not represent effective targeting. The “one size fits all” approach to eligibility
criteria, technical requirements and infrastructure solutions is inconsistent with the geographical
35
For example, a twin-track approach of system-wide interventions to benefit all, plus targeted interventions
that address the particular needs of specific groups. 36
For example, in terms of which socio-economic groups are securing places at newly constructed schools (and
despite the evidence that the poorest quintiles are most likely to drop out of junior secondary schooling).

ANNUAL PARTNERSHIP PERFORMANCE REPORT 2013 44
realities of Indonesia and institutional partners’ desire to make incremental improvements to GERliv.
Moreover, the criterion upon which beneficiary districts are selected (district GER) represents an
unreliable measure of demand (only) at an aggregated level which fails to represent demand within
a realistic catchment area of selected sites.
As a further example, the baseline capacity of Madrasah benefiting from C3 support has a
demonstrated, significant and inversely proportional effect on the likelihood and the extent of
change achievablelv. The SSQ baseline assessment for Phase 1 demonstrates that only 37% of the
Madrasah supported under Phase 1 were below the designated pass rate to achieve the eight NES
prior to receiving C3 support37
. While this situation is indicative of poor efficiency, it also jeopardizes
the effectiveness of the support provided and, in turn, reduces the likelihood of achieving the EOPO.
6.3 What does this mean for the EP? The bottom-line
A list of recommendations is presented in Table 14.
37
This proportion increases to 76.6% for Phase 2 (see SSQ Annual Progress Report 2013, p.27)

ANNUAL PARTNERSHIP PERFORMANCE REPORT 2013 45
Table 14: Beneficiaries key findings and recommendations
Finding Recommendations Level of
urgency Prime Responsibility
There remains a lack of clarity about the targeting
of specific categories of beneficiary to increase
the likelihood of EOPO achievement (see §6.2.3)
R17: Institutional partners should identify categories of
beneficiaries whose targeting will increase the likelihood
of EOPO achievement, and devise a targeting strategy for
each component.
***
DFAT and institutional partners (with
POM support as required)
There remains a lack of clarity about social
inclusion objectives and targets (see §6.2.1)
R18: Institutional partners should finalise and implement a
social inclusion strategy that outlines objectives,
boundaries, indicators and targets; and describes what the
EP aspires to, i.e. what it should be doing, and not just
what it is doing.
***
DFAT and institutional partners (with
POM support as required)
There is an unclear distinction between equality
and equity in the design and implementation of
the EP (see §6.2)
R19: Institutional partners should clarify the extent to which
equity is an objective of the EP and, where appropriate,
explore EP targeting objectives and review selection
criteria and targeting mechanisms.
**
DFAT and institutional partners (with
POM support as required)
NB: Red (***) - high urgency; orange (**) - medium urgency; green (*) - low urgency

ANNUAL PARTNERSHIP PERFORMANCE REPORT 2013 46
7 Management and Governance
7.1 Governance and management arrangements
The EP is governed under the same structure as that which applies to the ESSP. The ESSP
Governance Oversight Group (GOG) is mandated to meet at least once every six months and is co-
chaired by the Vice-Minister of MoEC and the Secretary General of MoRA. Membership includes
representatives from MoEC, MoRA and Bappenas, the Ministry of Finance, Ministry of Home Affairs,
DFAT and the EU.
The GOG is responsible for, inter alia, program alignment with emerging sectoral priorities;
monitoring performance against the targets set in the ESSP Joint Results Framework (JRF);
facilitating GoI, DFAT and EU involvement and support for ESSP monitoring and evaluation
processes; and, providing high level strategic responses to monitoring reports and so as to guide
program direction.
The MoEC’s Bureau of Planning and International Cooperation is identified as Secretariat and is
nominally charged with responsibility for organisation of an Annual Program Review and the
coordination of information and analysis related to the attainment of JRF targets. The program
review reports form a basis for disbursement of EU funds and, in theory, it should also inform
decisions on DFAT disbursement. In theory, DFAT uses monitoring and evaluation findings and
recommendations to inform policy dialogue with GoI through engagement with the GOG.
In addition to the GOG, four Technical Oversight Groups38 (TOGs) have been established to
coordinate planning and progress under each of the four program components. They are scheduled
to meet every three months. They are co-chaired by designated MoEC and MoRA representatives,
GoA and the EU, and are responsible for approving workplans and procurement plans; the
coordination and approval of major technical reports; and, ongoing management, monitoring and
oversight of the delivery of the ESSP.
At a day-to-day level, the EP is managed by the Basic Education Unit of the Development
Cooperation Section of the Jakarta Office of DFAT. The EP is delivered through a blend of aid
modalities including earmarked budget support (C1, C2), project support (C3), and a financial
contribution as part of multi-donor support (C4).
7.2 Analysis
7.2.1 Modalities and transactional management
The blend of modalities represents a sound and appropriate response to the operational
environment. It appears to offer good opportunity to pilot and trial initiatives through project
support and build capacity through systems development, whilst instilling and supporting GoI
ownership. That should, in principle, increase the likelihood of long-term impacts and sustainability,
whilst also guaranteeing tangible output delivery.
38
Infrastructure Technical Oversight Group (C1); Staff Development Technical Oversight Group (C2); Islamic
School Accreditation Technical Oversight Group (C3); and the Analytical and Capacity Development Technical
Oversight Group (C4).

ANNUAL PARTNERSHIP PERFORMANCE REPORT 2013 47
From an operational perspective, the blend of modalities and the use of managing contractors
provide opportunity for institutional partners (through the GOG) to alter their tactics in response to
emerging risks and opportunities. There is evidence of this occurring. In C1, for example, SSQ’s role
had originally been envisioned as provider of technical support to MoEC, specifically with regards to
monitoring progress and quality. However, SSQ has increasingly been involved in supporting MoEC in
all aspects of program implementation: site selection and verification; school proposal review, data
management, resolution of issues at field level; and providing resource persons and technical
support.
The apparent shift in C1 is praiseworthy insofar as it is critically important for development partners
to deliver outputs and show the tangible results of aid investments: DFAT, MoEC and SSQ took an
appropriate managerial decision to bolster SSQ’s role and resources such that partners were more
likely to offer timely delivery of expected outputs. Nevertheless, measures that improve efficiency
and increase the likelihood of short-term results can have detrimental effects on ownership and
therefore the prospects for sustainability and the probability of long-term results. As such, ongoing
monitoring and capacity building activities will need to be prioritized in 2014 if the impressive
operational gains are to be cemented and sustained post-2016.
7.2.2 Transactional management vs. transformational engagement
DFAT’s Basic Education Unit places a heavy emphasis on transactional management, i.e. undertaking
managerial activities that enable the timely delivery of contracted deliverables. For example, current
EP management decisions appear to be predominantly driven by prescriptive commitments to
output achievements, e.g. numbers of schools built, numbers of madrasah accredited, and numbers
of reports produced. To an extent, that is an understandable and rational response to the current aid
climate, in which importance is placed on the identification and management of risk and the
demonstration of the “tangible results” of aid programing. There is, however, an associated cost: the
merits of and opportunity for transformational engagement is often overlooked.
The timely delivery of program outputs should be regarded as an increased opportunity to secure
higher-level gains, i.e. the EOPO-level targets. The EOPOs, and even more so the aspirational goals to
which the EP contributes, are outside of the direct control of DFAT. Their achievement requires a
different style of management and engagement; it requires DFAT to adopt the philosophy and
practices of ‘transformational engagement’, i.e. strategic and politically attuned engagement that
tackles issues concerning the policy and sector governance environment. The need for such
engagement becomes ever greater as a program exits its inception phase and grows in maturity. At
present, however, the deployment of DFAT’s Basic Education Unit’s resources appears to be
disproportionally skewed towards transactional management at the expense of transformational
engagement. If this is true, it may be that the EP misses the opportunity to really cement its output-
level gains. As such, it runs the risk of delivering sub-optimal returns on Australia’s investment in
Indonesia’s education service.
Critical to guaranteeing effective transformational engagement is strong inter-government liaison
between the institutional champions (and owners) of the EP. The GOG and TOGs offer an
appropriate platform for this dialogue but they need to be effectively harnessed to do so. Practically

ANNUAL PARTNERSHIP PERFORMANCE REPORT 2013 48
speaking, it may end up being less formal engagement that paves the way for the formal meeting
that is crucial.
7.2.3 Results framework
The EP is Australia’s largest ever bilateral aid program and AUD 524m remains a very significant
investment by Australia. It is therefore right that expected development results be articulated and
that decision-makers and implementers be held to account for program performance. Not
everything will go according to plan: aid is an inherently risky business, change is complex and large
programs are complicated. However, without a clear line of sight on expected results at output,
outcome and goal level, it is difficult to track and assess the direction and speed of travel against
expectations.
The 2012 APPR recommended that the EP logic be updated and that a Performance Milestone
Framework be developed that would allow for an objective assessment of progress against targets.
Both remained incomplete as at the end of December 2013. The task of developing and/or reviewing
them has proved to be arduous, not least because there has been some difficulty in clearly
articulating the rationale for Australia’s investment and the outputs and outcomes to be expected.
This has, in turn, hampered the speed with which indicators, baselines, annual milestones and end-
of-program targets have been discussed and agreed by key stakeholders.
So long as these important tools remain absent then:
• It remains difficult for POM and other EP stakeholders to capture the extent of progress to
date, and to assess whether that represents an acceptable level of performance.
• The need for – the merits of – DFAT to participate in transformational engagement with GoI
can be overlooked because there is little explicit requirement for it.
• Processes of vertical and horizontal accountability39
remain somewhat shallow because of
the incomplete evidence base typically required to support such discussions.
There are opportunities for change. Indeed, there is an appetite for change. A recurrent theme
during the APPR production process was the desire amongst implementing partners for stronger
engagement on strategic issues between institutional partners and this will become increasingly
important as systemic and transformational change is targeted.
7.2.4 Governance
The distinction between governance, management and implementation may on occasions become
blurred, and some organisations (DFAT and GoI, for example) have dual roles to play. Regardless of
the potential blurring of responsibilities, there is unequivocal demand, on behalf of implementing
partners, for strategic clarity to be provided by the institutional partners. In particular, this is sought
at outcome level. For example, in Component 3, there remains uncertainty about the extent and
nature of systemic change desired. There is a need for strong leadership at an institutional level and
39
Vertical, e.g. between the GOG and the TOGs, the TOGs and the managers (e.g. DFAT), and the managers
and the implementing partners (e.g. SSQ, ACDP, GoI); Horizontal, i.e. between the Governments of Australia
and Indonesia.

ANNUAL PARTNERSHIP PERFORMANCE REPORT 2013 49
it is not the role of implementing agencies and managing contractors to engage institutional partners
at that level.
An elaborate, well-designed governance structure has been developed for the EP. Whilst the
structure is complex and exists in parallel to GoI and GoA permanent organizational structures, this
is probably inevitable and may be necessary given the range of actors and agencies involved in the
EP. However, the frequency and the quality of collaboration and engagement with and between
these senior levels of program governance are inconsistent and sub-optimal.
During 2013, one GOG meeting was held40
and six TOG meetings were held41
. This represents only
50% and 37.5% respectively of the prescribed number (although it should be noted that three of four
planned ATOG meetings were held). The low demand for meetings could point to either a lack of
need or a lack of motivation, which may in turn point to concerns about their perceived usefulness.
Whilst the GOG is a necessary forum for the authorization of EU funding tranches, the extent to
which performance information is used for strategic decision-making about the EP appears limited. It
also appears that the governance meetings focus on the submission of output-level progress reports,
with limited performance-related discussion at outcome level. This may be that there has been a
dearth of performance-related information available to the forums but, going forward, if the
governance structures are to be effective, they need to focus on higher level discussions with an
action-oriented agenda.
If governance arrangements are not as influential as could be, any detrimental effect will most
obviously be felt at the level of the program’s overall impact and sustainability and, to a lesser
extent, on its relevance (and specifically where risks go unchecked). It is likely that program
efficiency and effectiveness, where the direct management of the EP is operating well, will be less
affected.
7.2.5 Partnership
Whilst the concept of a “partnership” within the EP should manifest itself in clearly defined joint
management arrangements, it more accurately reflects a philosophy, an intention or a commitment
on behalf of the two governments to work together.
DFAT’s desire to work through GoI systems wherever possible is an illustration of a commitment to a
partnership approach, and one that requires a mature, trusting relationship and joint ownership of
successes and failures. That commitment is well received by GoI but the relationship can be tested
when GoA seeks to impose its own management standards, most notably with respect to financial
control, monitoring and reporting.
40
One GOG meeting was held on 7 February 2013. 41
No ITOG meetings were held; two SDTOG meetings were held on 21 March 2013 and 27 September 2013;
one MTOG meeting was held on 5 September 2013; and three ATOG meetings were held on 5 February 2013,
25 March 2013 and 4 December 2013.

ANNUAL PARTNERSHIP PERFORMANCE REPORT 2013 50
7.3 What does this mean for the EP? The bottom-line
A list of recommendations is presented in Table 15.

ANNUAL PARTNERSHIP PERFORMANCE REPORT 2013 51
Table 15: Governance and management key findings and recommendations
Finding Recommendations Level of
urgency Prime Responsibility
DFAT’s management of the EP is strong but
tends to be prescriptive and predominantly
output-focused(see §7.2.2)
R20: DFAT’s management of the EP should be more flexible
and adaptive, i.e. be more forward looking (at
opportunities) than backward-looking (at the EP design).
** DFAT
DFAT resources focus on transactional
management at the expense of transformational
engagement (see §7.2.2)
R21: DFAT should prioritise (varied) strategic engagement with
GoI: e.g. strategic discussion on C1 and C3; advocacy of
current EP approach on C2; and broader policy
engagement through C4.
***
DFAT
The updating of the EP logic architecture and the
development of a PMF has not yet been finalised
(see §7.2.3)
R22: The articulation and agreement on the EP logic and the
finalisation and socialisation of the Performance
Milestone Framework (PMF) should be prioritised.
*** DFAT (with POM support)
GOG and TOGs make limited use of performance
information in strategic decision-making and
governance meetings focus on output-level
issues (see §7.2.4)
R23: Existing governance structures need to be more
effectively engaged, utilizing performance evidence to
inform strategic, higher-level decisions. **
DFAT and GoI through GOG and TOGs
GOG and TOG meetings are not held in line with
the designated scheduling which suggests a lack
of need or a lack of motivation (see §7.2.4)
R24: Institutional partners should identify potential for
stronger linkages between POM and governance
structures, possibly in a secretariat role.
** DFAT and GoI (with POM support)
NB: Red (***) - high urgency; orange (**) - medium urgency; green (*) - low urgency


ANNUAL PARTNERSHIP PERFORMANCE REPORT 2013 53
Part C: Conclusions


ANNUAL PARTNERSHIP PERFORMANCE REPORT 2013 55
8 Conclusions
December 2013 represents the mid-point in the implementation of Australia’s Education Partnership
with Indonesia. As such, it is an appropriate time to take stock of progress and to reflect on
achievements to date. More importantly it is a time to use those reflections to guide the EP in its
second half of implementation.
Table 16, below, provides a summary table of the scores assigned to the individual EP components.
The table presents mean scores for each DAC criterion, and whilst they do not represent a “whole of
EP” assessment, they do provide some guidance for the future.
Table 16: Combined scorecard
DAC Criterion C1 Score C2 Score C3 Score C4 Score Mean EP
Score
Rounded EP
Score
Relevance 4 5 4 4 4.25 4.00
Efficiency 5 3 5 3 4.00 4.00
Effectiveness 3 TE 4 4 3.66 4.00
Impact TE TE TE TE TE TE
Sustainability 4 3 2 4 3.25 3.00
Whilst the broad scope of the component interventions remains relevant with respect to national
policies and priorities, two points are noteworthy. Any decline in the relative political importance of
an EP investment may undermine expected results and should therefore be monitored closely. In
addition, the extent to which program activities and outputs are fully consistent with the attainment
of stated objectives is not always certain.
The EP scores well with respect to efficiency, reflecting pragmatic management choices and the
attention paid to the achievement of tangible outputs. This short-term focus on transactional
management is and will continue to be justified so long as the balance of attention now transfers to
achieving higher order objectives and therefore to effectiveness. To that end, it is opportune at this
mid-point of the EP to take stock of the situation, to re-focus attention on the achievement of the
EOPOs, and to pursue measures that will enhance the probability of benefits being sustained. By
committing to and targeting the achievement of the EOPOs (as well as the EOCOs), it is possible to
build upon progress to date.
Whilst it is too early to make a definitive judgment on the achievement of impact, it is apparent that
the prospects for impact will be enhanced should EP institutional partners place more emphasis
upon systemic change. Again, the challenge for the EP managers is to weigh up the balance between
short- and long-term benefits. The APPR argues that both can be achieved but that proactive

ANNUAL PARTNERSHIP PERFORMANCE REPORT 2013 56
management choices now need to be made in favour of securing longer term benefits. In a similar
vein, the pursuit of sustainability requires greater engagement with subnational entities so as to
ensure viability and ownership of outputs and outcomes.
By assigning scores to each of the components, it is hoped that this performance report provides a
challenge and motivation for institutional partners and implementing agencies to increase the
relevance of the EP interventions; improve the efficiency and effectiveness of their work; and
enhance prospects for impact and sustainability.

ANNUAL PARTNERSHIP PERFORMANCE REPORT 2013 57
i Grant Agreement Deed between the Commonwealth of Australia and the Government of the Republic
of Indonesia relating to the Professional Development for Education Personnel through Australia’s
Education Partnership with Indonesia. A contribution to the Government of Indonesia’s Education
Sector Support Program. AusAID Agreement No. 60472.
ii Schedule 1, Grant Agreement Deed between the Commonwealth of Australia and the Government of
the Republic of Indonesia relating to the Professional Development for Education Personnel through
Australia’s Education Partnership with Indonesia. A contribution to the Government of Indonesia’s
Education Sector Support Program. AusAID Agreement No. 60472.
iii Schedule 1, Grant Agreement Deed between the Commonwealth of Australia and the Government of
the Republic of Indonesia relating to the Professional Development for Education Personnel through
Australia’s Education Partnership with Indonesia. A contribution to the Government of Indonesia’s
Education Sector Support Program. AusAID Agreement No. 60472.
iv AusAID. Draft. The Education Partnership Theory of Change.
v Schedule 1, Grant Agreement Deed between the Commonwealth of Australia and the Government of
the Republic of Indonesia relating to the Professional Development for Education Personnel through
Australia’s Education Partnership with Indonesia. A contribution to the Government of Indonesia’s
Education Sector Support Program. AusAID Agreement No. 60472.
vi Grant Agreement Deed between the Commonwealth of Australia and the Government of the Republic
of Indonesia relating to the Professional Development for Education Personnel through Australia’s
Education Partnership with Indonesia. A contribution to the Government of Indonesia’s Education
Sector Support Program. AusAID Agreement No. 60472.
vii SSQ. 2013. SSQ C1 Evaluation: What value are Field Monitors adding to the quality of construction?
(ME005) viii
POM. Draft. EOPO 1 Evaluation Baseline Report. ix EP. Draft. Performance Milestone Framework
x AusAID. Draft. The Education Partnership Theory of Change.
xi Schedule 1, Grant Agreement Deed between the Commonwealth of Australia and the Government of
the Republic of Indonesia relating to the Professional Development for Education Personnel through
Australia’s Education Partnership with Indonesia. A contribution to the Government of Indonesia’s
Education Sector Support Program. AusAID Agreement No. 64705.
xii Schedule 1, Grant Agreement Deed between the Commonwealth of Australia and the Government of
the Republic of Indonesia relating to the Professional Development for Education Personnel through
Australia’s Education Partnership with Indonesia. A contribution to the Government of Indonesia’s
Education Sector Support Program. AusAID Agreement No. 64705.
xiii AusAID. Draft. The Education Partnership Theory of Change.
xiv AusAID. Draft. The Education Partnership Theory of Change.
xv AusAID. Draft. The Education Partnership Theory of Change.
xvi Grant Agreement Deed between the Commonwealth of Australia and the Government of the Republic
of Indonesia relating to the Professional Development for Education Personnel through Australia’s
Education Partnership with Indonesia. A contribution to the Government of Indonesia’s Education
Sector Support Program. AusAID Agreement No. 60472
xvii OECD, PISA. 2012. Results in Focus, What 15-year-olds know and what they can do with what they
know, December 2013, p. 5.
xviii SSQ Component 2. Weekly update, 18 December 2013, p. 3.

ANNUAL PARTNERSHIP PERFORMANCE REPORT 2013 58
xix
GoI-GoA. Procedures Manual First Edition, Appendix 4 – Draft PAF Version 2, September 2013, p.4.
xx SSQ Component 2. Weekly update, 29 January 2013, p.1.
xxi SSQ Component 2. Weekly Update, 8 January 2014, p. 1.
xxii SSQ. District & Provincial HRMD Training Evaluation, March, 2013.
xxiii POM. Annual Sector Monitoring Report 2013. P. 29.
xxiv SSQ. Annual Plan 2013, November 2012, p. 10.
xxv SSQ. Annual Plan 2013, November 2012.
xxvi The Jakarta Post, “Govt seeks to expand access to education”, retrieved from
http://www.thejakartapost.com/news/2013/08/22/govt-seeks-expand-access-education.html on 5
January 2013.
xxvii SSQ. Annual Progress Report 2013, October 2013, p. 18.
xxviii AusAID. EP Component 2 Updated Design Document, 17 December 2012, p.4.
xxix SSQ. Report Evaluation of CPD Pilot, Stage 2 of Evaluation, June 2013, July 2013 p. 18.
xxx SSQ, Report Evaluation of CPD Pilot, Stage 2 of Evaluation June 2013, July 2013 p. 19.
xxxi POM. Annual Sector Monitoring Report 2013, p. 99.
xxxii ACDP. School and Madrasah Principals and Supervisors Competency Baseline Study, September 2013,
p. 21
xxxiii POM. Annual Sector Monitoring Report 2013, p.104.
xxxiv POM. Annual Sector Monitoring Report 2013 p. 29.
xxxv AusAID. Draft. The Education Partnership Theory of Change.
xxxvi POM. Annual Sector Monitoring Report 2013
xxxvii SSQ Evaluation of Component 3 Phase 1, November 2013
xxxviii SSQ. Annual Progress Report 2013, p.28
xxxix POM. Annual Sector Monitoring Report 2013, p.28
xl SSQ. Annual Plan 2013.
xli SSQ. Component 3 Evaluation Report 2013, p. 36
xlii SSQ. Component 3 Evaluation Report 2013
xliii SSQ. Component 3 Evaluation Report 2013
xliv SSQ. Component 3 Evaluation Report 2013
xlv SSQ. Evaluation of Component 3 Phase 1, November 2013
xlvi SSQ. Component 3 Evaluation Report 2013
xlvii POM. Annual Sector Monitoring Report 2013
xlviii ACDP. Six Monthly Progress Report, Mid 2013, July 2013.
xlix ACDP. Six Monthly Progress Report, Mid 2013, July 2013.
l Wheeler & Leslie, interview with POM, October 2013.
li ACDP. Six Monthly Progress Report, End 2013. Revision. March 2014
lii See, for example, ACDP Six Monthly Progress Report, Mid 2013, July 2013. Also see ACDP Six Monthly
Progress Report, End 2012, January 2013. liii
ACDP. Monitoring and Evaluation Strategy, Revised Version, December 2012. liv
Assessment of District Education Infrastructure Planning Capacity, Final Report, 11 July 2013 (v1.1),
POM. lv SSQ. C3 Phase 1 evaluation, p.23 and beyond

ANNUAL PARTNERSHIP PERFORMANCE REPORT 2013 59
Annexes

ANNUAL PARTNERSHIP PERFORMANCE REPORT 2013 60
Annex I – EP Logic Architecture
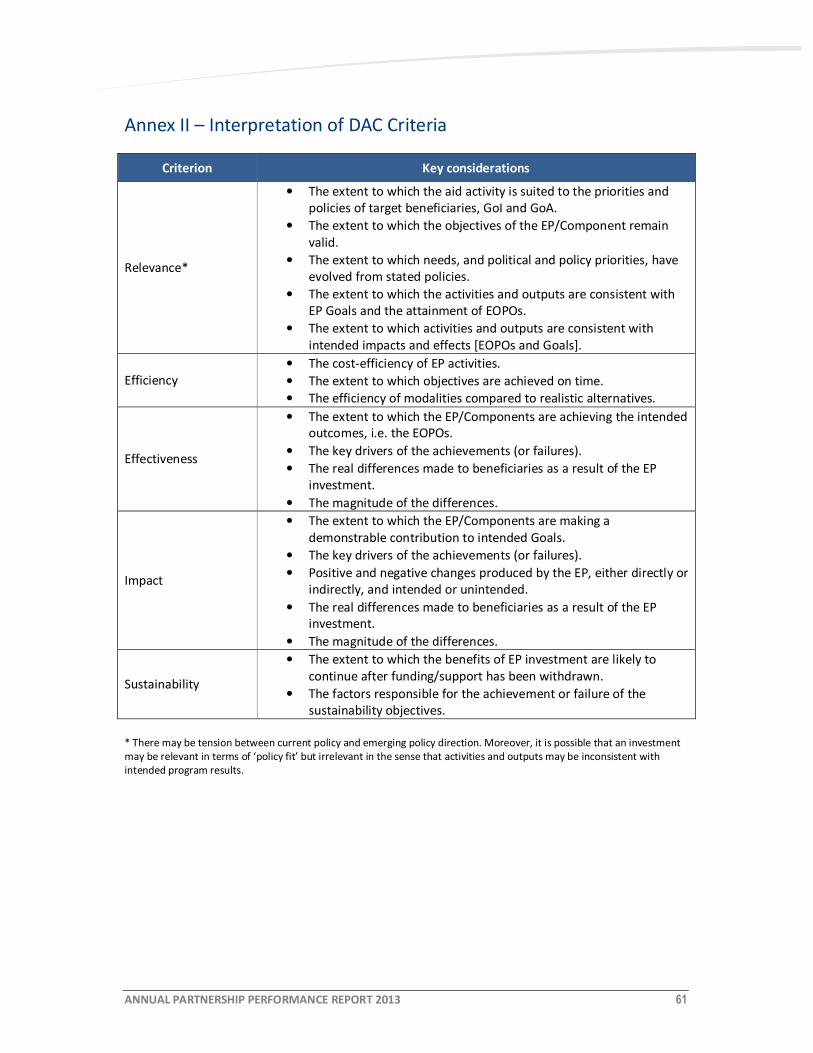
ANNUAL PARTNERSHIP PERFORMANCE REPORT 2013 61
Annex II – Interpretation of DAC Criteria
Criterion Key considerations
Relevance*
• The extent to which the aid activity is suited to the priorities and
policies of target beneficiaries, GoI and GoA.
• The extent to which the objectives of the EP/Component remain
valid.
• The extent to which needs, and political and policy priorities, have
evolved from stated policies.
• The extent to which the activities and outputs are consistent with
EP Goals and the attainment of EOPOs.
• The extent to which activities and outputs are consistent with
intended impacts and effects [EOPOs and Goals].
Efficiency
• The cost-efficiency of EP activities.
• The extent to which objectives are achieved on time.
• The efficiency of modalities compared to realistic alternatives.
Effectiveness
• The extent to which the EP/Components are achieving the intended
outcomes, i.e. the EOPOs.
• The key drivers of the achievements (or failures).
• The real differences made to beneficiaries as a result of the EP
investment.
• The magnitude of the differences.
Impact
• The extent to which the EP/Components are making a
demonstrable contribution to intended Goals.
• The key drivers of the achievements (or failures).
• Positive and negative changes produced by the EP, either directly or
indirectly, and intended or unintended.
• The real differences made to beneficiaries as a result of the EP
investment.
• The magnitude of the differences.
Sustainability
• The extent to which the benefits of EP investment are likely to
continue after funding/support has been withdrawn.
• The factors responsible for the achievement or failure of the
sustainability objectives.
* There may be tension between current policy and emerging policy direction. Moreover, it is possible that an investment
may be relevant in terms of ‘policy fit’ but irrelevant in the sense that activities and outputs may be inconsistent with
intended program results.

ANNUAL PARTNERSHIP PERFORMANCE REPORT 2013 62
Annex III - APPR Rating Scale (based on DFAT QRS [QAI and ICR])
Rating scale
Less than satisfactory Satisfactory
1: Very poor quality; needs major
overhaul 4: Adequate quality; needs some work
2: Poor quality; needs major work to
improve 5: Good quality
3: Less than adequate quality; needs
significant work 6: Very high quality
TE: Too early to rate

ANNUAL PARTNERSHIP PERFORMANCE REPORT 2013 63
Annex IV – List of Key Documents and Secondary Sources Reviewed
Report Date
submitted
GoI: AEPI Junior Secondary School Construction and Expansion Quarterly Initiative
Report No 1: March 2012 - September 2012 October 2012
ACDP Six Monthly Progress Report End 2012
AusAID: First Joint Monitoring Visit of School Construction – Engineering and
Technical Evaluation Mission Back To Office Report #1 – December 7 - 21, 2012 January 2013
POM: Annual Partnership Performance Report 2012 January 2013
SSQ: ME005 What value are Field Monitors adding to the quality of construction? January 2013
POM Six monthly Report – July to December 2012 January 2013
POM: Education Partnership Social Inclusion Options Paper January 2013
AusAID: Field Monitoring Model in EP Component 1: Final Evaluation Report February 2013
GoI: AEPI Junior Secondary School Construction and Expansion Quarterly Initiative
Report No 2: September 2012 – February 2013 March 2013
SSQ: ME006 The relationship between compliance with finance and administration
criteria and construction progress March 2013
SSQ: ME007 District & Provincial HRMD Training Evaluation March 2013
AusAID: Second Joint Monitoring Visit of School Construction – Engineering and
Technical Evaluation Mission Back To Office Report #2 – February 18 - March 3,
2013
March 2013
SSQ mid-year Progress Report May 2013
POM: Education Partnership Health Check #2 May 2013
SSQ: ME008 Evaluation of Learning on CPD Pilot – Stage 1 of Evaluation June 2013
POM: Assessment of District Education Infrastructure Planning Capacity June 2013
SSQ: ME009 Evaluation of CPD Pilot - Stage 2 of Evaluation June 2013
ACDP Six Monthly Progress Report Mid 2013
AusAID: Annual Partnership Performance Report 2012 – Management Response July 2013
AusAID: BOS Training: Its Implementation, Impact and Implications for the
Development of Indonesia’s Education System - An Independent Review July 2013
POM Six monthly Report – January to June 2013 July 2013

ANNUAL PARTNERSHIP PERFORMANCE REPORT 2013 64
SSQ: Most Significant Change at Human Resources Management for District and
Province August 2013
POM: C1 Annual Financial Statements Audit September
2013
POM: Baseline Report for Evaluation of EOPO 3 November
2013
POM: Annual Sector Monitoring Report November
2013
POM: Baseline Report for Evaluation of EOPO 1 November
2013
SSQ: ME010: Construction Quality Desk Top Review November
2013
SSQ: ME011: Evaluation of Support to Madrasah Achievement of Accreditation November
2013
POM: Annual Sector Financial Report November
2013
POM: C1 MoEC Internal Control and Compliance Review Draft
POM: C1: School Construction Committee (SCC) Financial Compliance Audit Draft
SSQ: Most Significant Change at Continuous Professional Development Program
(Makassar, Aceh, Balikpapan, Yogyakarta) Draft
POM: Compliance Review of Madrasah Accreditation Program Draft
ACDP 001: Early Childhood Development Strategy Study Draft
ACDP002: Country Background Report on the Education Sector In Indonesia Draft
ACDP003: Madrasah Education Financing Study Draft
ACDP005: Review of a Decade of Gender Mainstreaming in Education Draft
ACDP007: School and Madrasah Principals and Supervisors Competencies Baseline
Study Draft
ACDP008: Evaluation of the Supplemental Food for School Children Program Draft
ACDP: ESSP Results Framework Report 2013 Draft
POM: Financial Audit of 2011 BOS Training Program To be finalised
POM: Compliance Review of 2011 BOS Training Program To be finalised
AusAID: Australia’s Education Partnership with Indonesia Social Inclusion
Framework To be finalised

ANNUAL PARTNERSHIP PERFORMANCE REPORT 2013 65
Annex V – EP Analytical Framework 2013
Overarching themes Key Questions Sub-Questions/Prompts
Main Sources of
Information
DAC criteria
1 Context
To what extent and how
do EP interventions
remain appropriate to the
Indonesian education
sector?
• When considered from an education sector perspective, do
the objectives of the EP remain valid?
• Is the context in which the EP operates changing and do such
changes open up opportunities or elevate risks for the EP?
• Do the main foci of the EP still resonate with GoI RENSTRA
and GoA development policy?
• In the context of other donor and GoI interventions, are
there more appropriate investments that GoA should be
making in the sector?
2 Modalities
Is (Are) the current
modality(ies) the most
appropriate in delivering
the EP?
• What are the positive and negative features of the
partnership approach?
• Has the “partnership” changed and/or become stronger over
the last year?
• Is there value in working through GoI systems (WiPS) and, if
so, what is that value?
• Are EP component modalities appropriate to
implementation and/or should they change?
3 Delivery mechanisms
To what extent are the EP
delivery mechanisms
effective, efficient and
accountable?
• What are the advantages and disadvantages of the different
delivery mechanisms utilised?
• Are more imaginative or flexible mechanisms considered and
is the EP able to adjust its mechanisms?
• Are Australian funds used for their intended purpose and is
the transfer of funds safe and accountable?
• Are the EP coordination and management arrangements
sufficiently supporting the delivery of the interventions?

ANNUAL PARTNERSHIP PERFORMANCE REPORT 2013 66
Overarching themes Key Questions Sub-Questions/Prompts
Main Sources of
Information
4 Sustainability
To what extent are EP
benefits likely to be
sustained beyond the life
of the EP?
• Has sustainability of EP benefits been adequately considered
in the design of the interventions?
• Have specific constraints to sustainability been identified?
• Do partner institutions demonstrate a level of ownership?
• Has the level of funding to sustain benefits been considered
and is it likely to be forthcoming?
5 Beneficiaries
How have EP
interventions impacted
upon beneficiaries?
• Have the direct and indirect beneficiaries of EP interventions
been identified?
• What are the expected and unexpected impacts on these
beneficiaries?
• Which potential beneficiaries are excluded?
EOPO
6 Enrolment in Junior
Secondary Education
To what extent have EP
interventions contributed
to increase enrolment in
participating district?
• What is the evidence of increased JSE enrolment in
participating districts?
• How do EP interventions contribute to increase in JSE
enrolment in participating districts?
o Are EP interventions influencing motivation and
incentives for student enrolment?
o Have EP interventions improved district capacity to
plan and supply access to JSE?
• Has the EP contribution been sufficient to justify the
investment?

ANNUAL PARTNERSHIP PERFORMANCE REPORT 2013 67
Overarching themes Key Questions Sub-Questions/Prompts
Main Sources of
Information
7
Management of
schools and
Madrasah
To what extent has
management of schools
and Madrasah improved
in participating districts?
• What is the evidence of improved management of schools
and Madrasah in participating districts?
• How do EP interventions contribute to improvement in
schools and Madrasah management?
• What’s the role of improving P and S competencies?
• Has the EP contribution been sufficient to justify the
investment?
8 Quality of Madrasah
service provision
To what extent has the
quality of Madrasah
service provision
improved (in line with
NES) in targeted
provinces?
• What is the evidence of improved quality of Madrasah
service provision in targeted provinces?
• How do EP interventions contribute to improved quality of
Madrasah service provision in targeted provinces?
o How have SNIP and Block grants improved the quality
of Madrasah service provision?
o What are the key factors of changes in community
engagement or perception Madrasah quality?
• Has the EP contribution been sufficient to justify the
investment?
9
Utilisation of
analytical work in
education sector
policy, planning and
budgeting
To what extent have
policy-makers utilised
analytical work to inform
education sector policy,
planning and budgeting?
• What is the evidence of increase utilisation of analytical
work to inform education sector policy, planning and
budgeting?
• How do EP interventions contribute to increase utilisation of
analytical work to inform education sector policy, planning
and budgeting??
• Has the EP contribution been sufficient to justify the
investment?

ANNUAL PARTNERSHIP PERFORMANCE REPORT 2013 68
Social Inclusion
10 Gender
To what extent has the EP
promoted gender equality
in the Indonesian
education sector?
• Is it apparent which gender-related issues the EP is seeking
to tackle?
• Are the targets and targeting measures appropriate?
• What are we learning about the different impacts of EP
interventions on women and men, girls and boys?
• Are EP interventions facilitating increased women’s
empowerment and voice in decision-making and leadership?
11 Disability
To what extent has the EP
promoted disability
inclusive education in
Indonesia?
• Is it apparent which disability-related issues the EP is seeking
to tackle?
• Are GoI and GoA policies related to disability being reflected
in EP workstreams.
• Are the targets and targeting measures appropriate?
• What are we learning about the different impacts of EP
interventions on people/children with disabilities?
12 Poverty To what extent has the EP
targeted poor people?
• Given GoA’s policy focus on poverty reduction:
o How have different components targeted poor people?
o How successful has the EP been in targeting poor
people?
• Who is capturing the benefits?
• Is that in line with expectation?
• Are the targets and targeting measures appropriate?

ANNUAL PARTNERSHIP PERFORMANCE REPORT 2013 69
Value for Money
13 Value for Money
To what extent does the
EP represent Value for
Money?
• What do we mean by “value for money” in the EP?
• Are there intra-component differences?
• How is the EP tracking against agreed metrics?
• What related considerations do we need to be mindful of,
e.g. sustainability, comparability, relativity, risk, and broader
GoA policy objectives?

ANNUAL PARTNERSHIP PERFORMANCE REPORT 2013 70
Annex VI – List of Key Persons Consulted
Name Title
H. Susetyo Widiasmoro Head of Sub-directorate for Infrastructure and Facilities
DG Junior Secondary Education Development
Aziz Purwanto Staff at the DG Junior Secondary Education Development
Dedi Karyana Head of Infrastructure Unit
DG Junior Secondary Education Development, MOEC
Maulani Mega Hapsari Staff at the DG Junior Secondary Education Development
Prof. Dr. Syawal Gultom Head of MOEC’s Agency for Human Resource Development
and Education Quality Assurance
Prof. Dr. Phil. H. Nurkholis
Setiawan Director of Madrasah Education
Jean-Bernard Carrasco Minister-Counsellor, DFAT
Hannah Birdsey Counsellor, Education and Scholarships, DFAT
Jerry Strudwick Lead Education Specialist, DFAT
Joanne Dowling Unit Manager, Development Cooperation, DFAT
Donny Syukri Program Manager, Development Cooperation, DFAT
Niken Wardhani Program Manager, Development Cooperation, DFAT
Jenny Donohoe First Secretary, Development Cooperation, DFAT
Bia Puspita Program Manager, Development Cooperation, DFAT
Sri Novelma Program Manager, Development Cooperation, DFAT
Sarah Leslie Senior Program Manager, Development Cooperation
Julia Wheeler Senior Program Manager, Development Cooperation
Sam Muller Operations Manager, SSQ
Brian Spicer Senior Education Quality Adviser, SSQ
Robert Kingham Islamic Education Specialist, SSQ
Tania Dora Warokka Monitoring & Evaluation Leader, SSQ
Jihad Saad Component 1 Manager, School Construction, SSQ
Graham Dawson Component 2 Manager, Education Quality, SSQ
Roslyn Davis International Education Adviser (Professional Development),
SSQ

ANNUAL PARTNERSHIP PERFORMANCE REPORT 2013 71
Name Title
Yaya Kardiawarman Senior Professional Development Advisor, SSQ
Alison Atwell International Adviser Provincial and District Development,
SSQ
Abdul Munir Component 3 Manager, Madrasah Accreditation, SSQ
Tjipto Prakosa Data Analyst & Training Advisor, SSQ
Mokhamad Iksan Sub-National Institutional Capacity Development Advisor,
SSQ
John Virtue Education Sector Governance & Capacity Development
Advisor, ACDP
Alan Prouty Team Leader (Operational Management Specialist), ACDP
David Harding Senior Education Advisor, ACDP
Basilius Bengoteku Education Sector Research and Capacity Planning Advisor,
ACDP
Abdul Malik Education Sector Research, Information & Accountability
Advisor, ACDP
Bambang Indriyanto Director, Center for Policy Research, MoEC
Karen Taylor Operations Manager, EPOS
Sarah Gray Public Affairs Specialist, EPOS
Joanne Dickinson English Language Learning Specialist, EPOS

ANNUAL PARTNERSHIP PERFORMANCE REPORT 2013 72
Annex VII – ECBP M&E Standards Standard 3: Initiative Progress Reporting
No Feature of Progress Report EP-APPR Compliance
3.1 There is an executive summary that communicates the key information required for QAI reporting See Executive Summary
3.2 The relevant aspects of the context are adequately described Each component section has an individual
section on Context
3.3 There is a reflection on the continuing relevance of the expected end-of-program outcomes Each component section has an individual
section on Relevance
3.4 An assessment of the adequacy of progress toward sustained end-of-program outcomes is described Assessment of progress against DAC criteria
are scored for each component
3.5 The quality, reach and coverage of key outputs or deliverables for the reporting period are described Achievements are listed for each
component
3.6 The adequacy of progress implementing the annual plan is described n/a (implementing partners provide
reporting against annual plans)
3.7 A reflection on the adequacy of planned inputs to meet the expected end-of-program outcomes is
provided
Each component section has an individual
section on Efficiency and Effectiveness
3.8 The adequacy of progress against the budget is assessed Not done
3.9 The efficiency and effectiveness of key management or implementation system is assessed or
demonstrated
Each component section has an individual
section on Efficiency and Effectiveness and
one section is dedicated to Governance and
Management
3.10 The report achieves a fair balance between reporting of positive or negative issues or achievements Quasi-independence of POM lends itself to
this
3.11 The report provides credible evidence of claims made Considerable evidence is presented to
justify claims
3.12 Important lessons are summarised Findings and associated recommendations
are summarised in each section

Australia’s Education Partnership with Indonesia
Education Partnership - Performance Oversight and Monitoring
EP-POM
19th floor Ratu Plaza Building
Jl. Jend. Sudirman No. 9
Jakarta 10270
T: 021 720 6616
F: 021 720 6616 ext.100
Australian Aid – managed by GRM International on behalf of the Australian Government
www.kemitraanpendidikan.or.id