Annual Mortality Report - Deputy Prime Minister · Annual Mortality Report ... External causes of...
77
Department of Health Information and Research 2013 Annual Mortality Report National Mortality Registry
Transcript of Annual Mortality Report - Deputy Prime Minister · Annual Mortality Report ... External causes of...

Department of Health Information and Research
2013
Annual Mortality Report National Mortality Registry

II
Document Information
Document
reference
DHIR/MNMR/2013
Current
version
1.0
Release
date
January 2015
Document
owner
Directorate of Health Information and Research
Document
type
National mortality statistics
Personal
data
No personal data
Website http://tiny.cc/deathsmalta
e-mail [email protected]
Telephone
number
00356 25599000
Compilation Dr. Kathleen England
Comments
The accuracy of this document may be limited by factors beyond the author’s control. Some data in
this document may be subject to interpretation. Data in this document is based on information
obtained from the death certificate, in some cases additional information has been sought.
Users should always acknowledge the source in all works based on information supplied in this
document.
Acknowledgements
The compiler of this document would like to acknowledge the support of colleagues and the Director,
Dr. Neville Calleja at the Directorate of Health Information and Research. Close collaboration with
certifying doctors, pathologists, public health specialists, the Police Statistics Office, the Medical
Records Department at Mater Dei Hospital, the Mortuary Department and the National Statistics
Office were vital to the maintenance of an updated mortality register whose aim is to always
improve accuracy and timeliness.
Special thanks go to Ms Connie Scicluna and Ms Desire D’Amato who work unremittingly on the
National Mortality Registry.

III
Table of Contents
Comments ............................................................................................................................................... II
Acknowledgements ............................................................................................................................. II
Table of Contents ................................................................................................................................... III
List of Tables ............................................................................................................................................ V
List of Figures .......................................................................................................................................... VI
Summary Statistics for Mortality during the year 2013 ....................................................................... VIII
Introduction ....................................................................................................................................... IX
Glossary .............................................................................................................................................. XI
Definitions ......................................................................................................................................... XII
Section 1: Overview ................................................................................................................................. 1
Distribution by gender and age group ................................................................................................ 3
Distribution by type of place of death ................................................................................................ 5
Distribution by month of death .......................................................................................................... 6
Causes of death…..…………………………………………………………………………………………………………………………8
Leading causes of death: number, rate and percent .......................................................................... 9
Leading causes of death in males ..................................................................................................... 10
Leading causes of death in females .................................................................................................. 11
Commonest causes of death by age group ....................................................................................... 12
Potential years of life lost (PYLL) ....................................................................................................... 15
Section 2: Individual diseases ................................................................................................................ 17
Diseases of the circulatory system (ICD 10 codes I00-I99) ............................................................... 17
Neoplasms (ICD-10 codes C00-D48) ................................................................................................. 22
Diseases of the respiratory system (ICD 10 code J00-J98) ................................................................ 27
Smoking attributable mortality ......................................................................................................... 28
Diseases of the digestive system (ICD 10 codes K00-K93) ................................................................ 29
Some infectious and parasitic diseases (ICD 10 codes A00-B99 (excluding A41.9), G00, G03-G04,
N70-N73) ........................................................................................................................................... 30

IV
External causes of morbidity and mortality (ICD 10 codes V01-Y98) ............................................... 31
Section 3: Perinatal and infant mortality .............................................................................................. 35
Section 4: Deaths in non-residents who died in Malta during 2013 ..................................................... 39
Number of deaths in non residents by country of residence ........................................................... 40
Section 5: Statistical tables .................................................................................................................... 41
V
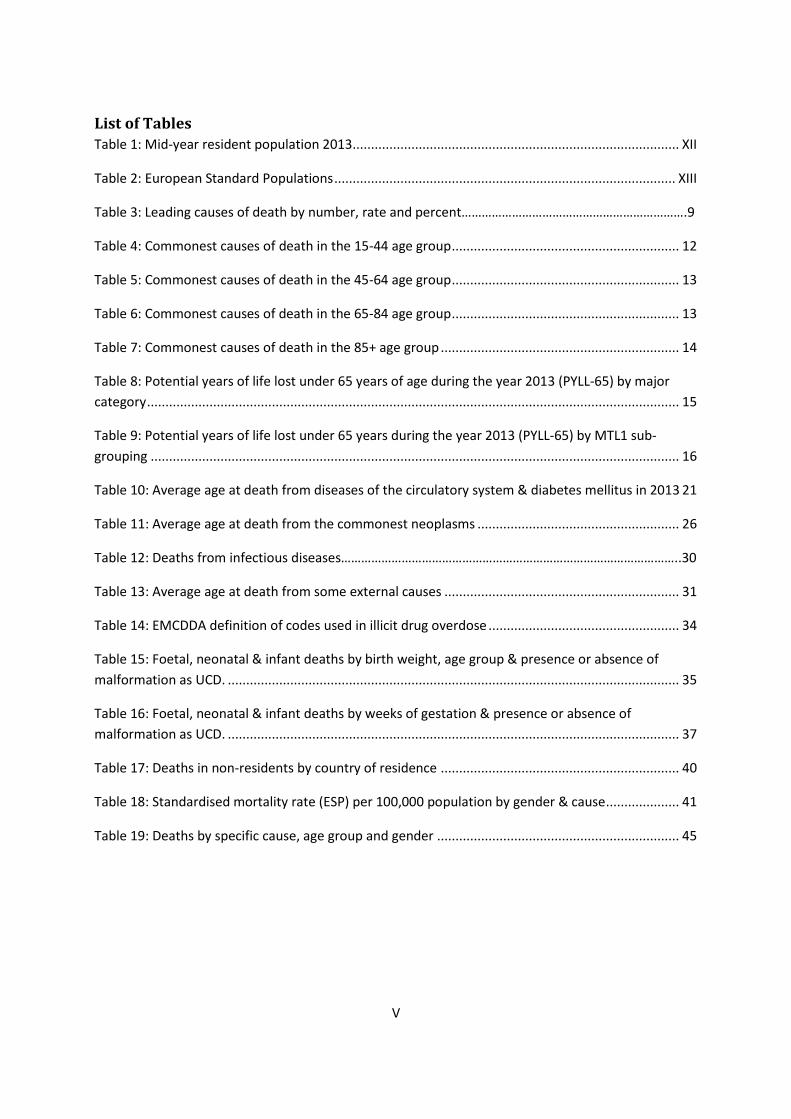
List of Tables
Table 1: Mid-year resident population 2013 ......................................................................................... XII
Table 2: European Standard Populations ............................................................................................. XIII
Table 3: Leading causes of death by number, rate and percent………………………………………………………….9
Table 4: Commonest causes of death in the 15-44 age group .............................................................. 12
Table 5: Commonest causes of death in the 45-64 age group .............................................................. 13
Table 6: Commonest causes of death in the 65-84 age group .............................................................. 13
Table 7: Commonest causes of death in the 85+ age group ................................................................. 14
Table 8: Potential years of life lost under 65 years of age during the year 2013 (PYLL-65) by major
category ................................................................................................................................................. 15
Table 9: Potential years of life lost under 65 years during the year 2013 (PYLL-65) by MTL1 sub-
grouping ................................................................................................................................................ 16
Table 10: Average age at death from diseases of the circulatory system & diabetes mellitus in 2013 21
Table 11: Average age at death from the commonest neoplasms ....................................................... 26
Table 12: Deaths from infectious diseases………………………………………………………………………………………..30
Table 13: Average age at death from some external causes ................................................................ 31
Table 14: EMCDDA definition of codes used in illicit drug overdose .................................................... 34
Table 15: Foetal, neonatal & infant deaths by birth weight, age group & presence or absence of
malformation as UCD. ........................................................................................................................... 35
Table 16: Foetal, neonatal & infant deaths by weeks of gestation & presence or absence of
malformation as UCD. ........................................................................................................................... 37
Table 17: Deaths in non-residents by country of residence ................................................................. 40
Table 18: Standardised mortality rate (ESP) per 100,000 population by gender & cause .................... 41
Table 19: Deaths by specific cause, age group and gender .................................................................. 45
VI
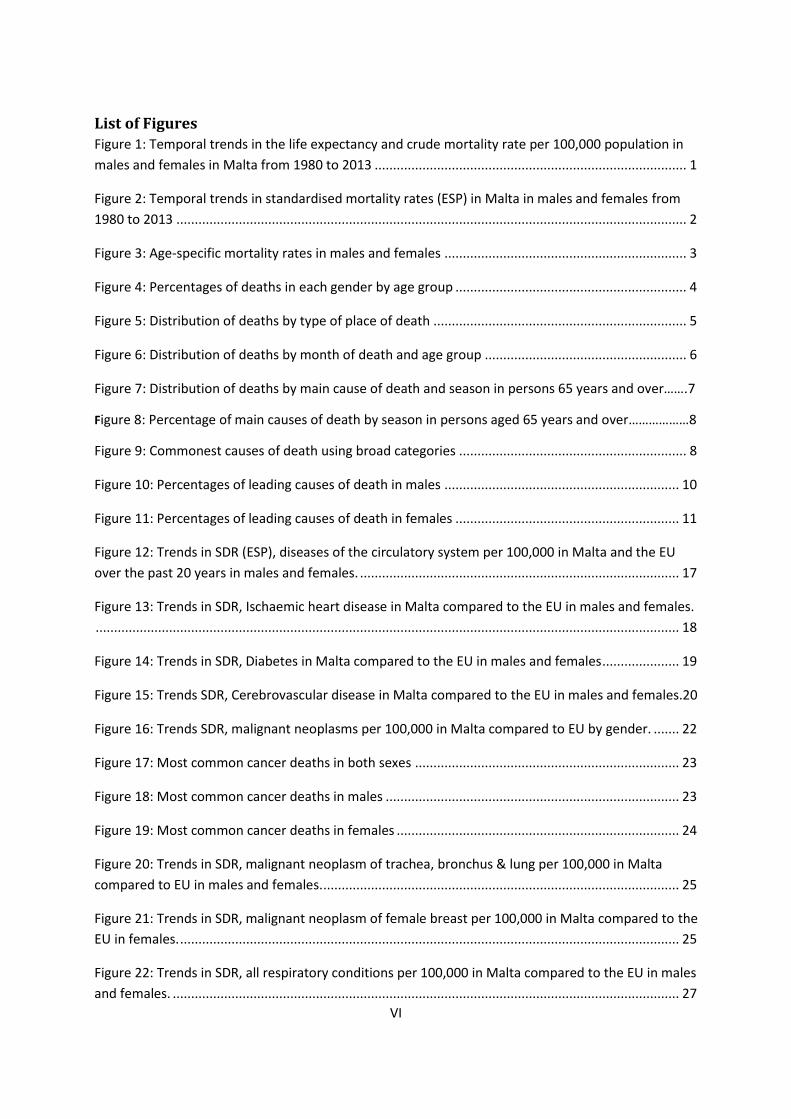
List of Figures
Figure 1: Temporal trends in the life expectancy and crude mortality rate per 100,000 population in
males and females in Malta from 1980 to 2013 ..................................................................................... 1
Figure 2: Temporal trends in standardised mortality rates (ESP) in Malta in males and females from
1980 to 2013 ........................................................................................................................................... 2
Figure 3: Age-specific mortality rates in males and females .................................................................. 3
Figure 4: Percentages of deaths in each gender by age group ............................................................... 4
Figure 5: Distribution of deaths by type of place of death ..................................................................... 5
Figure 6: Distribution of deaths by month of death and age group ....................................................... 6
Figure 7: Distribution of deaths by main cause of death and season in persons 65 years and over…….7
Figure 8: Percentage of main causes of death by season in persons aged 65 years and over………………8
Figure 9: Commonest causes of death using broad categories .............................................................. 8
Figure 10: Percentages of leading causes of death in males ................................................................ 10
Figure 11: Percentages of leading causes of death in females ............................................................. 11
Figure 12: Trends in SDR (ESP), diseases of the circulatory system per 100,000 in Malta and the EU
over the past 20 years in males and females. ....................................................................................... 17
Figure 13: Trends in SDR, Ischaemic heart disease in Malta compared to the EU in males and females.
............................................................................................................................................................... 18
Figure 14: Trends in SDR, Diabetes in Malta compared to the EU in males and females ..................... 19
Figure 15: Trends SDR, Cerebrovascular disease in Malta compared to the EU in males and females.20
Figure 16: Trends SDR, malignant neoplasms per 100,000 in Malta compared to EU by gender. ....... 22
Figure 17: Most common cancer deaths in both sexes ........................................................................ 23
Figure 18: Most common cancer deaths in males ................................................................................ 23
Figure 19: Most common cancer deaths in females ............................................................................. 24
Figure 20: Trends in SDR, malignant neoplasm of trachea, bronchus & lung per 100,000 in Malta
compared to EU in males and females. ................................................................................................. 25
Figure 21: Trends in SDR, malignant neoplasm of female breast per 100,000 in Malta compared to the
EU in females. ........................................................................................................................................ 25
Figure 22: Trends in SDR, all respiratory conditions per 100,000 in Malta compared to the EU in males
and females. .......................................................................................................................................... 27
VII
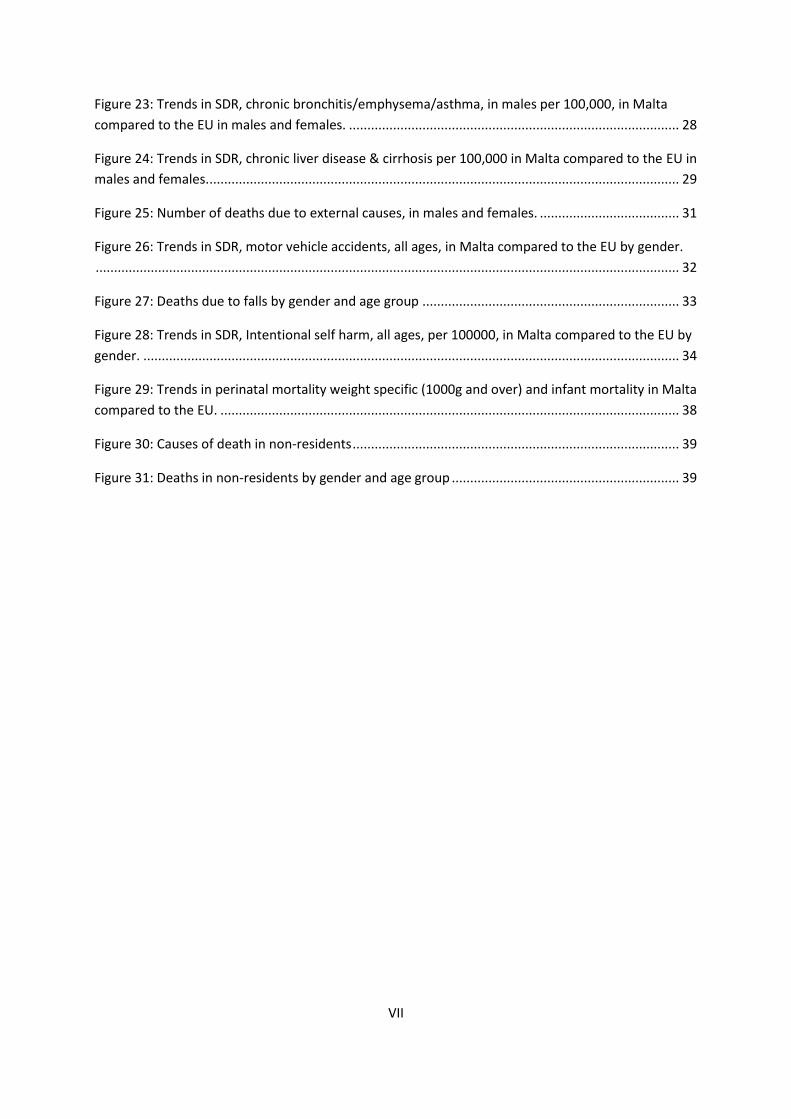
Figure 23: Trends in SDR, chronic bronchitis/emphysema/asthma, in males per 100,000, in Malta
compared to the EU in males and females. .......................................................................................... 28
Figure 24: Trends in SDR, chronic liver disease & cirrhosis per 100,000 in Malta compared to the EU in
males and females. ................................................................................................................................ 29
Figure 25: Number of deaths due to external causes, in males and females. ...................................... 31
Figure 26: Trends in SDR, motor vehicle accidents, all ages, in Malta compared to the EU by gender.
............................................................................................................................................................... 32
Figure 27: Deaths due to falls by gender and age group ...................................................................... 33
Figure 28: Trends in SDR, Intentional self harm, all ages, per 100000, in Malta compared to the EU by
gender. .................................................................................................................................................. 34
Figure 29: Trends in perinatal mortality weight specific (1000g and over) and infant mortality in Malta
compared to the EU. ............................................................................................................................. 38
Figure 30: Causes of death in non-residents ......................................................................................... 39
Figure 31: Deaths in non-residents by gender and age group .............................................................. 39
VIII
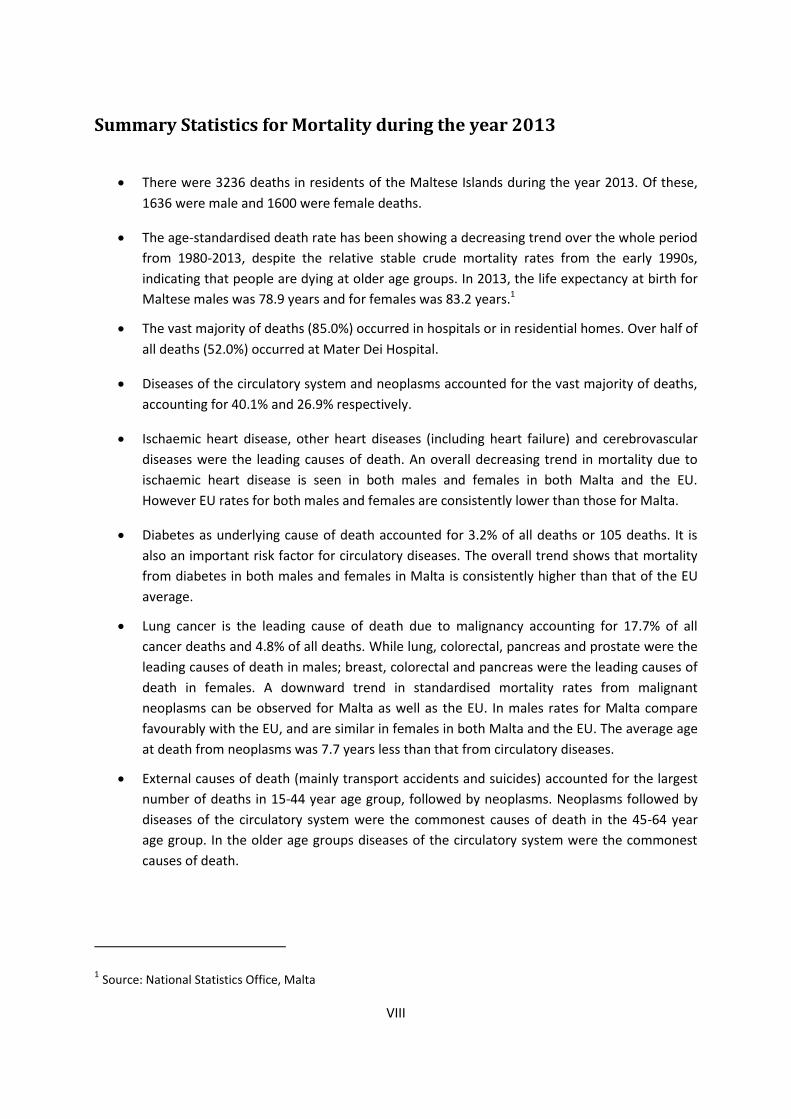
Summary Statistics for Mortality during the year 2013
There were 3236 deaths in residents of the Maltese Islands during the year 2013. Of these,
1636 were male and 1600 were female deaths.
The age-standardised death rate has been showing a decreasing trend over the whole period
from 1980-2013, despite the relative stable crude mortality rates from the early 1990s,
indicating that people are dying at older age groups. In 2013, the life expectancy at birth for
Maltese males was 78.9 years and for females was 83.2 years.1
The vast majority of deaths (85.0%) occurred in hospitals or in residential homes. Over half of
all deaths (52.0%) occurred at Mater Dei Hospital.
Diseases of the circulatory system and neoplasms accounted for the vast majority of deaths,
accounting for 40.1% and 26.9% respectively.
Ischaemic heart disease, other heart diseases (including heart failure) and cerebrovascular
diseases were the leading causes of death. An overall decreasing trend in mortality due to
ischaemic heart disease is seen in both males and females in both Malta and the EU.
However EU rates for both males and females are consistently lower than those for Malta.
Diabetes as underlying cause of death accounted for 3.2% of all deaths or 105 deaths. It is
also an important risk factor for circulatory diseases. The overall trend shows that mortality
from diabetes in both males and females in Malta is consistently higher than that of the EU
average.
Lung cancer is the leading cause of death due to malignancy accounting for 17.7% of all
cancer deaths and 4.8% of all deaths. While lung, colorectal, pancreas and prostate were the
leading causes of death in males; breast, colorectal and pancreas were the leading causes of
death in females. A downward trend in standardised mortality rates from malignant
neoplasms can be observed for Malta as well as the EU. In males rates for Malta compare
favourably with the EU, and are similar in females in both Malta and the EU. The average age
at death from neoplasms was 7.7 years less than that from circulatory diseases.
External causes of death (mainly transport accidents and suicides) accounted for the largest
number of deaths in 15-44 year age group, followed by neoplasms. Neoplasms followed by
diseases of the circulatory system were the commonest causes of death in the 45-64 year
age group. In the older age groups diseases of the circulatory system were the commonest
causes of death.
1 Source: National Statistics Office, Malta
IX
Introduction
The Annual Mortality Report 2013 presents mortality statistics for the year 2013 by cause of death in
residents of the Maltese Islands, and includes residents dying abroad for which we have information.
Data Analysis
The information used is based on details obtained from death certificates. This is supplemented by
reviewing of deceased patients’ records, newspaper cuttings as well as collaboration with
pathologists, public health doctors, police and certifying doctors. Data is also cross-checked with
other registries at the Department of Health Information & Research and databases held by other
entities. These additional sources of information are needed for verification. They add detail and
ensure that mortality data is as reliable and as accurate as possible.
The International Statistical Classification of Diseases and Related Health Problems- ICD 10 is used to
translate diagnoses of diseases from words into alphanumeric codes in order to permit easier
storage, retrieval and analysis of the data. This also allows comparison between different countries
and over different periods of time.
Additional Sources of Data
The National Statistics Office of Malta was the source from which information about mid-year
population 2013 by age group and gender was obtained.
Number of births and live births were obtained from the National Obstetrics Information system
(NOIS).
The European Health for All database - HFA-DB, (WHO Regional Office for Europe, Copenhagen,
Denmark) was used as a source of data for some of the figures in this report.
Quality of Mortality Data
The quality of mortality data depends on a number of entities/persons and processes. The
‘Certificate of Death and Cause thereof” is filled in by the certifying doctor or, in the case of
autopsies, by the pathologist. An underlying cause of death is chosen from the causes of death in the
certificate by the registry manager and the registry leader at the Directorate of Health Information &
Research (DHIR). This is done in collaboration with certifying doctors where the underlying cause of
death is unclear. Deceased patient medical records and information obtained from ISOFT database
are also examined in a number of cases to ascertain the underlying cause of death. Data in the death
certificate is then coded and inputted in a database.
The quality of the information on death certificates varies according to the certifying habits and
knowledge of the certifying doctors. Moreover, data coding depends to a certain degree on the
coding practices of the registry manager and the registry leader. This inevitably affects quality of
data, especially when analysing trends over time. Finally, a degree of human error as regards data
inputting always persists albeit small. Data is double-checked and cross-checked both internally and
with other databases.
A number of validation processes and quality checks are done by the National Mortality Registry in
order to produce data that is as accurate as possible. Validation of data coding is also undertaken to
ensure that coding is done as accurately as possible and the choice of the underlying cause of death

X
is correct. The database is also cross-checked against the Patient Administration System (CPAS) at
Mater Dei Hospital (MDH), NOIS at DHIR and data received from the Midwifery Services at MDH.

XI
Glossary DHIR Directorate Health Information and Research
ECHI European Community Health Indicators
ESP European Standard Population
EU 28 European Union Member States
EU-13 13 EU Member States after May 2004: Poland (PL), Czech Republic (CZ), Cyprus (CY),
Latvia (LV), Lithuania (LT), Slovenia (SI), Estonia (EE), Slovakia (SK), Hungary (HU),
Malta (MT), Bulgaria (BG), Romania (RO), Croatia (HR)
EU-15 15 EU Member States before May 2004: Austria (AT), Belgium (BE), Finland (FI),
Greece (EL), Luxembourg (LU), Denmark (DK), Spain (ES), Netherlands (NL), Germany
(DE), France (FR), Portugal (PT), Ireland (IE), Italy (IT), United Kingdom (UK), Sweden
(SE)
HFA-DB European Health For All Database
ICD-10 International Statistical Classification of Diseases and Related Health Problems: Tenth
Revision
MDH Mater Dei Hospital
NOIS National Obstetrics Information System
NSO National Statistics Office
CPAS Patient Administration System
SDR/SMR Age-standardised death/mortality rate on the European Standard Population (see
more in Chapter: Definitions)
WHO World Health Organisation

XII
Definitions
Crude Death Rate
This is equal to the total number of registered deaths divided by the estimated resident mid-yearly
population of that year multiplied by 1000 (or 100,000). The following mid-year population of 2013,
provided by the National Statistics Office has been used for this annual report.
Table 1: Mid-year resident population 2013
Age group Males Females Total
0-4 10645 10058 20703
5-9 10125 9426 19551
10-14 10679 10339 21018
15-19 13099 12110 25209
20-24 15556 14588 30144
25-29 16019 14622 30641
30-34 16029 15035 31064
35-39 15434 14409 29843
40-44 13348 12775 26123
45-49 12942 12727 25669
50-54 14981 14943 29924
55-59 15061 14907 29968
60-64 14575 14825 29400
65-69 13767 14734 28501
70-74 7171 8437 15608
75-79 6032 7964 13996
80-84 3397 5717 9114
85+ 2322 4633 6955
Total 211182 212249 423431
Births
Total number of births weighing 500g or over at birth during 2013 = 4141
Total number of live births weighing 500g or over at birth during 2013 = 4125
Total number of births weighing 1000g or over at birth = 4124
Total number of live births weighing 1000g or over at birth = 4112

XIII
Total number of births of 22 weeks gestation or more during 2013 = 4146
Total number of live births of 22 weeks gestation or more during 2013 = 4127
Total number of births of 28 weeks gestation or over at birth = 4118
Total number of live births of 28 weeks gestation or over at birth = 4106
Source: National Obstetric Information System
Age-Standardised Death/Mortality Rate
The age-standardised death/mortality rate for a particular condition is that which would have
occurred if the observed age-specific death rates for the condition were applied in a given standard
population. The European Standard Population as reported by WHO has been used in this report. A
new European Standard Population has been developed by Eurostat. In the section on statistical
tables, rates have been reported using both the WHO ESP and the Eurostat ESP.
Table 2: European Standard Populations
Age groups (yrs)
European standard population
(ESP developed by WHO)
New European standard
population (ESP developed by
Eurostat)
0 1600 1000
1-4 6400 4000
5-9 7000 5500
10-14 7000 5500
15-19 7000 5500
20-24 7000 6000
25-29 7000 6000
30-34 7000 6500
35-39 7000 7000
40-44 7000 7000
45-49 7000 7000
50-54 7000 7000
55-59 6000 6500
60-64 5000 6000
65-69 4000 5500
70-74 3000 5000
75-79 2000 4000

XIV
80-84 1000 2500
85+/85-89 1000 1500
90-94 - 800
95+ - 200
Total 100,000 100,000
European Health for All Database
The European Health for All Database provides easy and rapid access to a wide range of basic health
statistics for the 52 Member States of the WHO European Region. It was developed by the WHO
Regional Office for Europe in the mid-1980s to support the monitoring of health trends in the region.
This database has been used to produce a number of charts for the report comparing Malta with
other European regions.
http://www.euro.who.int/HFADB
XV
The definitions described below are those presented in the International Statistical Classification of
Diseases and Related Health Problems ICD-10 volume 2.
Birth Weight
The first weight of the foetus or newborn obtained after birth.
Low birth weight is less than 2500g (up to and including 2499g).
Very low birth weight is less than 1500g (up to and including 1499g).
Extremely low birth weight is less than 1000g (up to and including 999g)
Gestational Age
The duration of gestation is measured from the first day of the last menstrual period. Gestational age
is expressed in complete days or completed weeks.
For the purposes of calculation of gestational age from the date of the first day of the last normal
menstrual period to the date of delivery, it should be borne in mind that the first day is day zero and
not day one; days 0-6 therefore correspond to completed week zero;
Foetal Death
Foetal death is the death prior to the complete expulsion or extraction from its mother of a product
of conception, irrespective of the duration of the pregnancy; the death is indicated by the fact that
after such separation, the foetus does not breathe or show any other evidence of life, such as
beating of the heart, pulsation of the umbilical cord, or definite movement of voluntary muscles.
Foetal Death Rate
The number of foetal deaths in a year expressed as a proportion of the total number of births (live
births plus foetal deaths) in the same year. All foetuses with a gestational age of 22 weeks and over
or a birth weight of 500g and over, are considered. Rates are usually expressed per 1000 total births.
Foetal death rate = no. of foetal deaths in a year weighing 500g or more *1000
Number of live births plus foetal deaths in that year weighing 500g or more
Foetal death rate = no. of foetal deaths in a year weighing 1000g or more *1000
(weight specific) Number of live births plus foetal deaths in that year weighing 1000g or more
Live Birth
Live birth is the complete expulsion or extraction from its mother of a product of conception,
irrespective of the duration of pregnancy, which, after separation, breathes or shows any evidence of
life, such as beating of the heart, pulsation of the umbilical cord, or definite movement of the
voluntary muscles, whether or not the umbilical cord has been cut or the placenta is attached; each
product of such a birth is considered live born.

XVI
Neonatal Period
The neonatal period commences at birth and ends 28 completed days after birth. Neonatal deaths
(deaths among live births during the first 28 completed days of life) may be subdivided into early
neonatal deaths, occurring during the first seven days of life, and late neonatal deaths, occurring
after the seventh day but before 28 completed days of life.
Age at death during the first day of life (day 0) should be recorded in units of completed minutes or
hours of life. For the second (day 1), third (day 2) and through 27 completed days of life, age at death
should be recorded in days.
Neonatal Mortality Rate
The number of deaths during the neonatal period in that year expressed as a proportion of the total
number of live births in the same year. Rates are expressed per 1000 live births.
Neonatal mortality rate = no. of neonatal deaths in a year * 1000
no. of live births in that year
Neonatal mortality rate = no. of neonatal deaths in a year (1000g or over) * 1000
(weight specific) no. of live births in that year (1000g or over)
Perinatal Period
The perinatal period commences at 22 completed weeks (154 days) of gestation and ends at seven
completed days after birth.
Perinatal Mortality Rate
The number of deaths during the perinatal period in a year expressed as a proportion of the total
number of births (live births plus foetal deaths) in the same year.
Perinatal mortality rate = no. of perinatal deaths in a year *1000
no. of live births plus foetal deaths in that year
Perinatal mortality rate = no. of perinatal deaths in a year (weight 1000g or over) *1000
(weight specific) no. of live births plus foetal deaths in that year (weight 1000g or over)
Infant Mortality Rate
The number of deaths in children less than 1 year of age in a year expressed as a proportion of the
total live births in the same year. Rates are usually expressed per 1000 live births.

XVII
Infant mortality rate = no. of infant deaths (under 1 year of age) in a year * 1000
No. of live births in that year
Infant mortality rate = no. of infant deaths (under 1 year of age) in a year (weight 1000g or over) * 1000
(weight specific) No. of live births in that year (weight over 1000g)
Potential Years of Life Lost (PYLL)
A measure of the relative impact of various diseases on society, PYLL highlights the loss to society as
a result of youthful or early deaths. The figure for potential years of life lost due to a particular cause
is the sum of the years of life lost due to that cause for all individuals dying before a particular age
(65 years in the case of PYLL-65).
Smoking Attributable Mortality
Mortality caused by tobacco smoking. Death rates from combined, selected causes of death which
are related to smoking, as per 100,000 of the population. This indicator was obtained from the
European Community Health Indicators Monitoring).
The smoking-attributable mortality (SAM) is to be calculated via the formula given below (Shultz et al., 19912) by using available mortality data and disease-specific relative mortality risks of current and former smokers, each compared to never-smokers (reference group). Relative mortality risks (RRs) are obtained from the Cancer Prevention Study II, which have been published and utilized in Schultz et. al.2. Finally, the rates of current, former and never-smokers are required. The formula provides the tobacco-attributable fraction (TAF) per cause of death, which is multiplied by the number of total deaths (per cause) to yield the tobacco-attributable mortality (TAM) per cause of death. The summed TAMs of all considered causes equal the smoking-attributable mortality (SAM) and shall be expressed as per 100,000 of the population under investigation.
TAF = (P0+(P1*RR1)+(P2*RR2)-1) / (P0+(P1*RR1+(P2*RR2))
TAM = TAF * number of death cases per cause; SAM = sum TAMs (all causes)
P0 = prevalence of never-smokers; P1 = prevalence of current smokers; P2 = prevalence of former smokers; RR1 = relative risk of death for current smokers; RR2= relative risk of death for former smokers.
Prevalence data need decimal expressions to be used for TAF calculation (e.g. P0 = 25% = 0.25; P0+P1+P2 = 1). Disease categories according to ICD-10 definition to be included are: Neoplasms (C00-14, C15-16, C25, C32-34, C53, C64-68), Cardiovascular diseases (I00-09, I10-15 I20-51, I60-78) and Respiratory diseases (J10-18, J40-43, J44-46).
Smoking prevalence data need to be obtained e.g. from EHIS; percentage of current smokers (SK.1[1-2]), percentage of former smokers (SK.1[3]+4[1]), percentage of never-smokers (SK.1[3]+4[2]).
2Schultz et. al. (1991); Quantifying the disease impact of cigarette smoking with SAMMEC II software. Public Health Reports
106; 326-33.

XVIII

Annual Mortality Report 2013
1
Section 1: Overview
During the year 2013, there were 3236 deaths among residents dying in Malta or abroad. There were
1636 male deaths and 1600 female deaths in residents, a decrease of 110 males and 73 females over
the previous year. Deaths in residents included twelve residents who died abroad. In addition, 77
non-residents died in Malta. The remainder of this report concentrates on deaths in residents unless
otherwise specified.
There were also 19 foetal deaths (stillbirths 22+ weeks gestation).
The crude death rate for males was 775 deaths per 100,000 and for females it was 754 deaths per
100,000. The overall crude death rate was 764 per 100,000 population.
The period between 1980 and early 1990s has shown a steady decrease in the crude mortality rate
which has reached a steady level after that (figure 1). Life expectancy shows a steady gradual
increase over the whole period from 1980 to 2013. The age-standardised death rate (SDR) has been
showing a decreasing trend over the whole period from 1980-2013 (figure 2), despite the relative
stable crude mortality rates from the early 1990s, indicating that people are dying at older age
groups.
0
200
400
600
800
1000
1200
0
10
20
30
40
50
60
70
80
90
1980 1983 1986 1989 1992 1995 1998 2001 2004 2007 2010 2013
Cru
de
mo
rtal
ity
rate
/1
00
,00
0
Life
exp
ect
ancy
year
Life expectancy in males Life expectancy in females
CMR/100,000 males CMR/100,000 females
Figure 1: Temporal trends in the life expectancy and crude mortality rate per 100,000 population in males and females in Malta from 1980 to 2013

Annual Mortality Report 2013
2
0
500
1000
1500
2000
2500
1980 1983 1986 1989 1992 1995 1998 2001 2004 2007 2010 2013
Stan
dar
dis
ed
mo
rtal
ity
rate
/10
00
00
year
SMR/ 100,000 males SMR/ 100,000 females
Figure 2: Temporal trends in standardised mortality rates (ESP) in Malta in males and females from 1980 to 2013
In 2013, the life expectancy at birth for Maltese males was 78.9 years and for females was 83.2
years3. The oldest male death was 101 years and the oldest female death was 104 years. The average
age at death was 73.5 years in males (median 76 years) and 79.3 years (median 82 years) in females.
3 Source: National Statistics Office, Malta

Annual Mortality Report 2013
3
Distribution by gender and age group
0
50
100
150
200
250
300
350
400
0 5-9 15-19 25-29 35-39 45-49 55-59 65-69 75-79 85-89 95+
age
sp
eci
fic
rate
/10
00
age group
males females
Figure 3: Age-specific mortality rates in males and females
Age-specific mortality rates shows a small rise in the zero age group (infants), followed by very low
rates up to middle age. It starts to rise again in the 70+ age group with age specific mortality rates
consistently higher for males when compared to females.

Annual Mortality Report 2013
4
0.00
5.00
10.00
15.00
20.00
25.00
0 1-4
5-9
10
-14
15
-19
20
-24
25
-29
30
-34
35
-39
40
-44
45
-49
50
-54
55
-59
60
-64
65
-69
70
-74
75
-79
80
-84
85
-89
90
-94
95
+%
in e
ach
ge
nd
er
age group
males females
Figure 4: Percentages of deaths in each gender by age group
The 80-84 and 85-89 year age groups accounted for the largest number of deaths in both sexes
(35.5% of all deaths). Whereas the 80-84 year age group accounted for the largest number of deaths
in males (17.1% of all male deaths), the 85-89 year age group accounted for the largest number of
deaths in females (21.4% of female deaths).
41.0% of female deaths (in comparison with 23.0% of male deaths) occurred in the 85+ year age
group.
In contrast, 21.7% of male deaths (in comparison to 11.6% of female deaths) occurred in the 0-64
year age group.

Annual Mortality Report 2013
5
Distribution by type of place of death
MDH51%
GGH6%
Other hospitals
12%
Other3%
SVPR11%
Other residential homes
5%Usual
residence12%
Figure 5: Distribution of deaths by type of place of death
There was a slight increase in the percentage of people dying at Mater Dei Hospital and St Vincent de
Paule Residence. Conversely, there was a slight decrease in the percentage of people dying at their
usual residence, other hospitals and other residential homes between 2012 and 2013.

Annual Mortality Report 2013
6
Distribution by month of death
0
50
100
150
200
250
300
350
400
Jan Feb Mar Apr May June July Aug Sept Oct Nov Dec
Nu
mb
er
of
de
ath
s
Month of death
0-64 65+ Grand Total
Figure 6: Distribution of deaths by month of death and age group
Figure 6 shows the seasonal variation in the number of deaths. There were more deaths in the cold
winter months. This variation is more pronounced in deaths of those aged 65 years and over. Low
ambient temperatures, while often not the underlying cause of death, contribute to death in older
people. As seen in figure 7 below, there is an increase in deaths in the major causes of deaths in the
winter months. The percentage increase is similar in all major groupings as seen in figure 8 below
with 30-35% of all deaths in each major grouping occurring between January and March, while
between 20-25% of all deaths in each major grouping occurring similarly in the remaining seasons.

Annual Mortality Report 2013
7
0
50
100
150
200
250
300
350
400
450
Circulatory Respiratory Neoplasms All other
Num
ber o
f dea
ths
Main groups of death
Jan-Mar Apr-Jun Jul-Sep Oct-Dec
Figure 7: Distribution of deaths by main cause of death and season in persons 65 years and over
0
5
10
15
20
25
30
35
40
Jan-Mar Apr-Jun Jul-Sep Oct-Dec
% o
f d
eat
hs
in e
ach
maj
or
gro
up
Season
Circulatory Respiratory Neoplasms All other
Figure 8: Percentage of main causes of death by season in persons aged 65 years and over
Annual Mortality Report 2013
8
Causes of death
The main source of information as to the causes of death is obtained from the death certificate.
Accuracy is increased by collaboration with certifying doctors, pathologists and police as well as
other sources of information. The value of the mortality register depends on its level of accuracy and
completeness.
The cause of death is often clearer in the younger and middle-aged persons than in older persons.
Older persons tend to have a number of contributory causes of death making it difficult for the data
coder to decide on the underlying cause of death.
The International Statistical Classification of Diseases and Related Health Problems: ICD-10 is used to
code the underlying cause of death. This helps to increase comparability between different countries
worldwide.
Neoplasms26.9%
Diabetes3.2%
Mental & behavioural
3.7%Circulatory40.1%
Respiratory10.6%
Digestive3.1%
External3.3%
Remainder9.0%
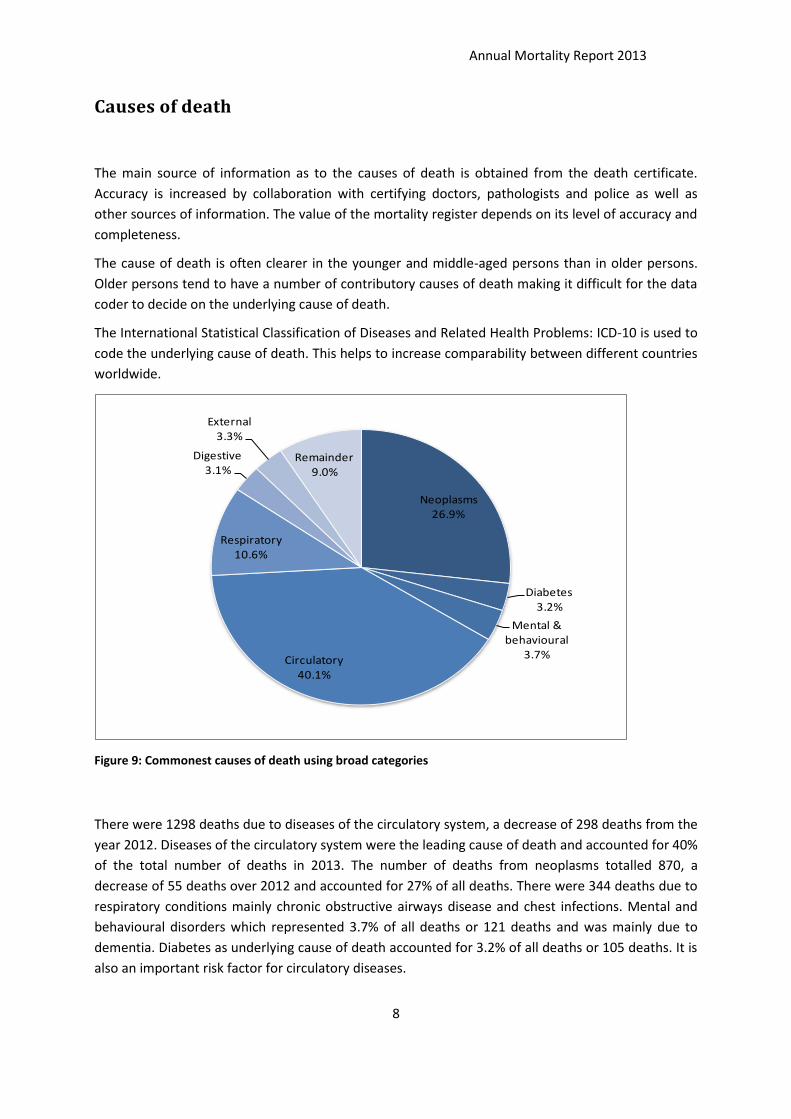
Figure 9: Commonest causes of death using broad categories
There were 1298 deaths due to diseases of the circulatory system, a decrease of 298 deaths from the
year 2012. Diseases of the circulatory system were the leading cause of death and accounted for 40%
of the total number of deaths in 2013. The number of deaths from neoplasms totalled 870, a
decrease of 55 deaths over 2012 and accounted for 27% of all deaths. There were 344 deaths due to
respiratory conditions mainly chronic obstructive airways disease and chest infections. Mental and
behavioural disorders which represented 3.7% of all deaths or 121 deaths and was mainly due to
dementia. Diabetes as underlying cause of death accounted for 3.2% of all deaths or 105 deaths. It is
also an important risk factor for circulatory diseases.
Annual Mortality Report 2013
9
Leading causes of death: number, rate and percent
The Mortality Tabulation List 1 (MTL) of the International Classification of Diseases ICD-10 was used
as the source for grouping diseases in the following tables. Remainder categories were sometimes
excluded, as these tend to group several ‘less common’ conditions together and would give them
undeserved importance. Remainder categories were however used when the number of deaths from
an individual cause constitutes a large part of the respective category or when this was deemed to be
important information. (The full list of the mortality tabulation list is found in Section 5 of this report,
Table 18 and Table 19)
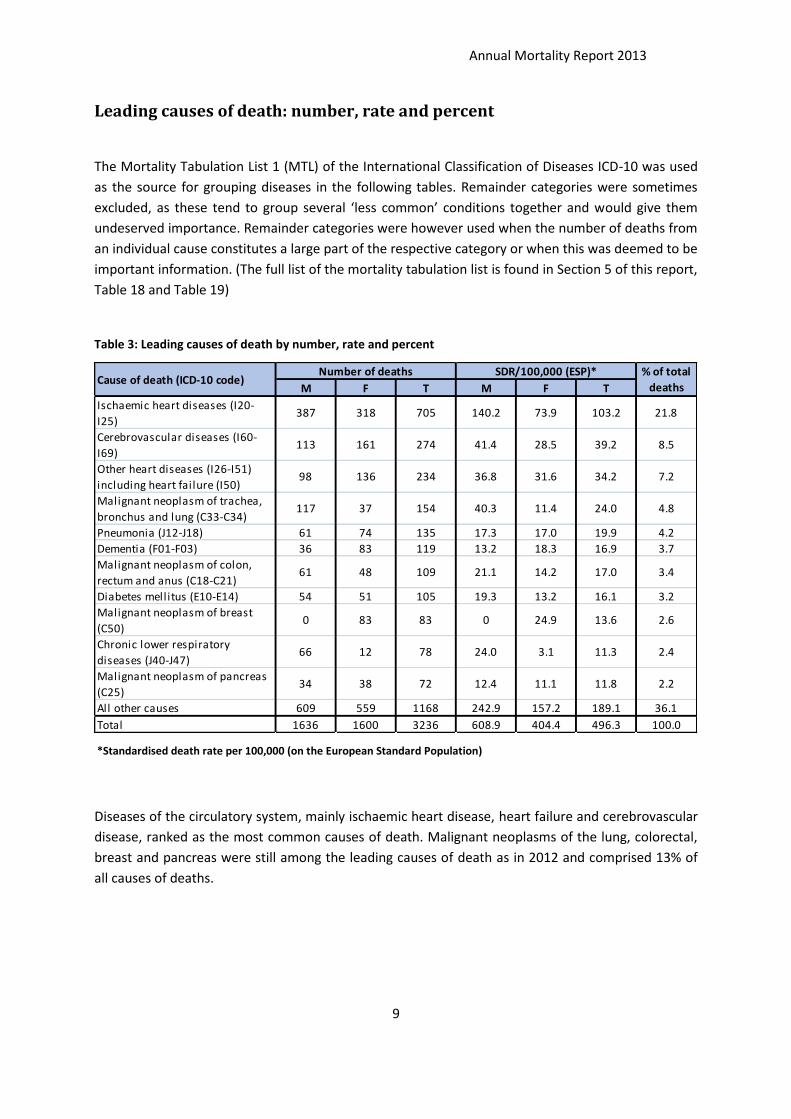
Table 3: Leading causes of death by number, rate and percent
M F T M F T
Ischaemic heart diseases (I20-
I25)387 318 705 140.2 73.9 103.2 21.8
Cerebrovascular diseases (I60-
I69)113 161 274 41.4 28.5 39.2 8.5
Other heart diseases (I26-I51)
including heart failure (I50)98 136 234 36.8 31.6 34.2 7.2
Malignant neoplasm of trachea,
bronchus and lung (C33-C34)117 37 154 40.3 11.4 24.0 4.8
Pneumonia (J12-J18) 61 74 135 17.3 17.0 19.9 4.2
Dementia (F01-F03) 36 83 119 13.2 18.3 16.9 3.7
Malignant neoplasm of colon,
rectum and anus (C18-C21)61 48 109 21.1 14.2 17.0 3.4
Diabetes mellitus (E10-E14) 54 51 105 19.3 13.2 16.1 3.2
Malignant neoplasm of breast
(C50)0 83 83 0 24.9 13.6 2.6
Chronic lower respiratory
diseases (J40-J47)66 12 78 24.0 3.1 11.3 2.4
Malignant neoplasm of pancreas
(C25)34 38 72 12.4 11.1 11.8 2.2
All other causes 609 559 1168 242.9 157.2 189.1 36.1
Total 1636 1600 3236 608.9 404.4 496.3 100.0
Cause of death (ICD-10 code)Number of deaths SDR/100,000 (ESP)* % of total
deaths
*Standardised death rate per 100,000 (on the European Standard Population)
Diseases of the circulatory system, mainly ischaemic heart disease, heart failure and cerebrovascular
disease, ranked as the most common causes of death. Malignant neoplasms of the lung, colorectal,
breast and pancreas were still among the leading causes of death as in 2012 and comprised 13% of
all causes of deaths.

Annual Mortality Report 2013
10
Leading causes of death in males
2.2%
2.3%
3.3%
3.7%
3.7%
4.0%
6.0%
6.9%
7.2%
23.7%
Dementia (F01-F03)
Malignant neoplasm of the prostate (C61)
Diabetes mellitus (E10-E14)
Pneumonia (J12-J18)
Malignant neoplasm of colon, rectum and anus (C18-C21)
Chronic lower respiratory diseases (J40-J47)
Other heart diseases (I26-I51) including heart failure (I50)
Cerebrovascular diseases (I60-I69)
Malignant neoplasm of trachea, bronchus and lung (C33-C34)
Ischaemic heart diseases (I20-I25)
Figure 10: Percentages of leading causes of death in males
The main cause of death in males was ischaemic heart disease which accounted for 23.7% of all male
deaths in 2013, a decrease of 4.6% over 2012. Decreases were also noted in deaths from heart failure
(6.1% vs 8.8% in 2012). Lung cancer is the second most common cause of death in males, decreasing
by 1% over 2012. Other leading cancer deaths in males include colorectal and prostate cancer. In
2013, diabetes and dementia made it to the top ten leading causes of death in males replacing other
causes of death e.g. pancreatic cancer and diseases of the liver. Lung cancer and chronic lower
respiratory diseases continue to feature as a commoner cause of death in males than in females.

Annual Mortality Report 2013
11
Leading causes of death in females
2.4%
2.6%
3.0%
3.2%
4.6%
5.2%
5.2%
8.5%
10.1%
19.9%
Malignant neoplasm of the pancreas (C25)
Other acute lower respiratory infections (J20-J22)
Malignant neoplasm of colon, rectum and anus (C18-C21)
Diabetes mellitus (E10-E14)
Pneumonia (J12-J18)
Malignant neoplasm of breast (C50)
Dementia (F01-F03)
Other heart diseases (I26-I51)
Cerebrovascular diseases (I60-I69)
Ischaemic heart diseases (I20-I25)
Figure 11: Percentages of leading causes of death in females
Diseases of the circulatory system continued to feature as the leading causes of death in females.
Ischaemic heart disease however decreased in proportion by 6.8% in 2013, accounting for 19.9% of
all female deaths.
Malignant neoplasm of the breast is a leading cause of death specific to females. In 2013, it increased
by 0.5% as a proportion of all female deaths compared to 2012.
Dementia, chest infections and diabetes were also an important cause of death, especially in older
females.
Annual Mortality Report 2013
12
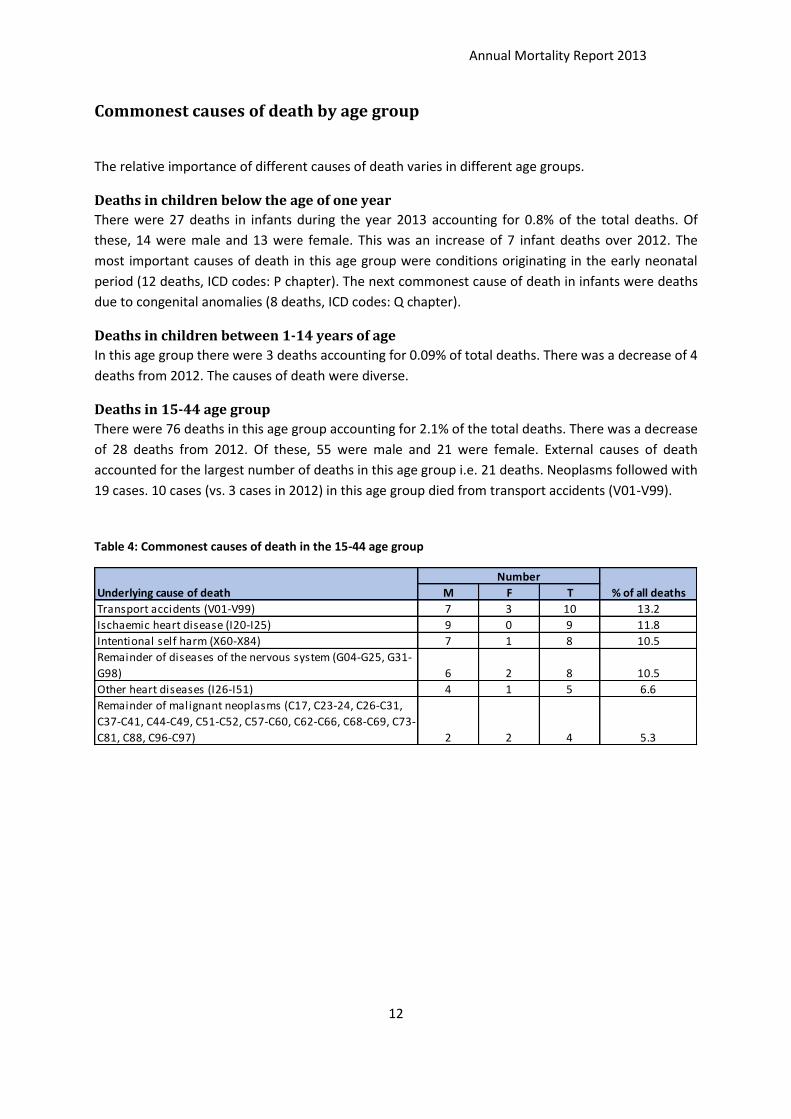
Commonest causes of death by age group
The relative importance of different causes of death varies in different age groups.
Deaths in children below the age of one year
There were 27 deaths in infants during the year 2013 accounting for 0.8% of the total deaths. Of
these, 14 were male and 13 were female. This was an increase of 7 infant deaths over 2012. The
most important causes of death in this age group were conditions originating in the early neonatal
period (12 deaths, ICD codes: P chapter). The next commonest cause of death in infants were deaths
due to congenital anomalies (8 deaths, ICD codes: Q chapter).
Deaths in children between 1-14 years of age
In this age group there were 3 deaths accounting for 0.09% of total deaths. There was a decrease of 4
deaths from 2012. The causes of death were diverse.
Deaths in 15-44 age group
There were 76 deaths in this age group accounting for 2.1% of the total deaths. There was a decrease
of 28 deaths from 2012. Of these, 55 were male and 21 were female. External causes of death
accounted for the largest number of deaths in this age group i.e. 21 deaths. Neoplasms followed with
19 cases. 10 cases (vs. 3 cases in 2012) in this age group died from transport accidents (V01-V99).
Table 4: Commonest causes of death in the 15-44 age group
Underlying cause of death M F T % of all deaths
Transport accidents (V01-V99) 7 3 10 13.2
Ischaemic heart disease (I20-I25) 9 0 9 11.8
Intentional self harm (X60-X84) 7 1 8 10.5
Remainder of diseases of the nervous system (G04-G25, G31-
G98) 6 2 8 10.5
Other heart diseases (I26-I51) 4 1 5 6.6
Remainder of malignant neoplasms (C17, C23-24, C26-C31,
C37-C41, C44-C49, C51-C52, C57-C60, C62-C66, C68-C69, C73-
C81, C88, C96-C97) 2 2 4 5.3
Number

Annual Mortality Report 2013
13
Deaths in the 45-64 age group
There were 434 deaths in this age group representing 13.4% of all deaths. There was a decrease of 66
from 2012. Neoplasms (46.1%) and diseases of the circulatory system (26.3%) dominate this
relatively young age group.
Table 5: Commonest causes of death in the 45-64 age group
Underlying cause of death M F T % of all deaths
Ischaemic heart disease (I20-I25) 65 14 79 18.2
Malignant neoplasms of trachea, bronchus and lung (C33,C34) 22 13 35 8.1
Malignant neoplasm of colon, rectum and anus (C18-C21) 12 12 24 5.5
Malignant neoplasm of the pancreas (C25) 15 8 23 5.3
Malignant neoplasm of the breast (C50) 0 21 21 4.8
Remainder of malignant neoplasms (C17, C23-24, C26-C31, C37-
C41, C44-C49, C51-C52, C57-C60, C62-C66, C68-C69, C73-C81, C88,
C96-C97) 15 5 20 4.6
Diabetes mellitus (E10-E14) 12 5 17 3.9
Cerebrovascular disease (I60-I69) 10 6 16 3.7
Diseases Of the liver (K70-K76) 10 4 14 3.2
Other heart diseases (I26-I51) 9 4 13 3.0
Number
Deaths in the 65-84 age group
There were 1663 1710 deaths in this age group accounting for 51.4% of all deaths. There was a
decrease of 47 deaths from 2012. Diseases of the circulatory system (39.6%) followed by neoplasms
(32.1%) dominate this age group as the commonest causes of death.
Table 6: Commonest causes of death in the 65-84 age group
Underlying cause of death M F T % of all deaths
Ischaemic heart disease (I20-I25) 216 155 371 22.3
Cerebrovascular disease (I60-I69) 67 76 143 8.6
Malignant neoplasms of trachea, bronchus and lung (C33,C34) 88 20 108 6.5
Other heart diseases (I26-I51) 50 54 104 6.3
Remainder of malignant neoplasms (C17, C23-24, C26-C31, C37-
C41, C44-C49, C51-C52, C57-C60, C62-C66, C68-C69, C73-C81, C88,
C96-C97) 42 37 79 4.8
Malignant neoplasm of colon, rectum and anus (C18-C21) 42 26 68 4.1
Diabetes mellitus (E10-E14) 32 31 63 3.8
Pneumonia (J12-J18) 28 27 55 3.3
Remainder of diseases of the genito-urinary system (N17-N98) 24 22 46 2.8
Remainder of mental and behavioural disorders, including
dementia (F01-F09, F20-F99) 20 26 46 2.8
Number

Annual Mortality Report 2013
14
Deaths in the 85+ age group
There were 1033 1075 deaths in this age group accounting for 31.9% of all deaths. There was a
decrease of 42 deaths from 2012.
Table 7: Commonest causes of death in the 85+ age group
Underlying cause of death M F T % of all deaths
Ischaemic heart disease (I20-I25) 97 149 246 23.8
Cerebrovascular disease (I60-I69) 36 78 114 11.0
Other heart diseases (I26-I51) 35 76 111 10.7
Remainder of mental and behavioural disorders, including
dementia (F01-F09, F20-F99) 13 57 70 6.8
Pneumonia (J12-J18) 24 43 67 6.5
Remainder of diseases of the genito-urinary system (N17-N98) 10 31 41 4.0
Other acute lower respiratory infections (J20-J22) 12 26 38 3.7
Remainder of diseases of the respiratory system (J00-J06, J30-J39,
J60-J98) 18 13 31 3.0
Remainder of diseases of the digestive system (K00-K22, K28-K66,
K80-K92) 4 22 26 2.5
Chronic lower respiratory diseases (J40-J47) 21 3 24 2.3
Number
Circulatory diseases again predominate in this age group. However, other conditions including
dementia, respiratory infections, renal failure and urinary tract infections were important causes of
mortality in older persons.
It is important to note that deciding on the underlying cause of death in this age group is challenging,
given that several co-morbidities are often present. Malignancies tend to be a less important cause
of death in this age group.

Annual Mortality Report 2013
15
Potential years of life lost (PYLL)
The index ‘Potential years of life lost’ (PYLL) is an important indicator of premature mortality. From
an economic point of view, premature mortality gives an indication of which diseases are affecting
persons of working age.
PYLL is defined as the sum of years lost for all individuals dying from a particular cause before a
particular age (65 years in the case of PYLL-65).
Table 8 and 9 list those conditions that contribute mostly to the largest number of potential years
lost.
Table 8: Potential years of life lost under 65 years of age during the year 2012 (PYLL-65) by major category
% of
Underlying cause of death by major category M F T pyll
Neoplasms (C00-D48) 1007 957 1964 26.3
Diseases of the circulatory system (I00-I99) 1014 263 1277 17.1
External causes of morbidity and mortality (V01-Y98) 910 230 1140 15.3
Certain conditions originating in the perinatal period (P00-P96) 384 384 768 10.3
Congenital malformations, deformations and chromosomal
abnormalities (Q00-Q99) 274 255 529 7.1
Diseases of the nervous system (G00-G98) 309 129 438 5.9
Endocrine, nutritional and metabolic diseases (E00-E88) 307 122 429 5.7
Diseases of the respiratory system (J00-J98) 165 186 351 4.7
Diseases of the digestive system (K00-K92) 158 60 218 2.9
Remainder 278 82 360 4.8
Total 4806 2668 7474 100
Number of PYLL
Neoplasms were the leading category of potential years of life lost, claiming 26.3% of the total
potential years of life lost. This was followed by diseases of the circulatory system and external
causes of death.
Conditions originating in the perinatal period as well as congenital anomalies are only included in
table 8 and not table 9 as since these conditions usually occur in the first year of life they inflate the
figures disproportionately. However they are included in the total for both tables.
Annual Mortality Report 2013
16
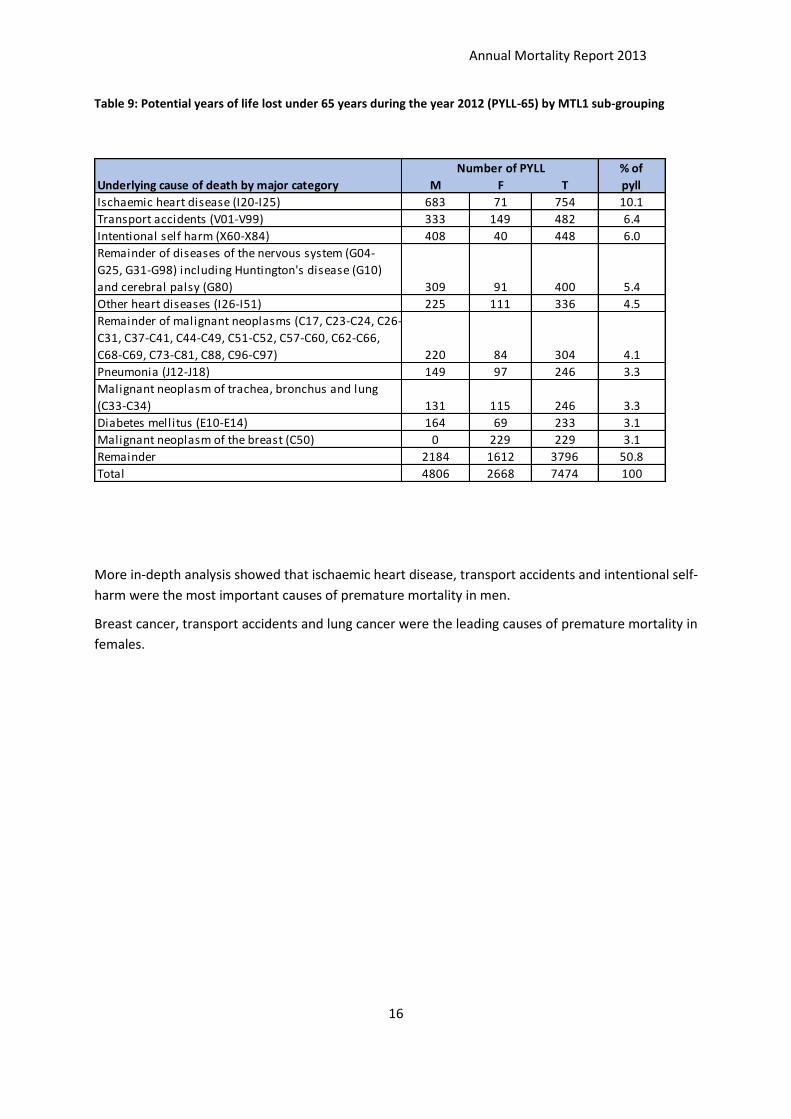
Table 9: Potential years of life lost under 65 years during the year 2012 (PYLL-65) by MTL1 sub-grouping
% of
Underlying cause of death by major category M F T pyll
Ischaemic heart disease (I20-I25) 683 71 754 10.1
Transport accidents (V01-V99) 333 149 482 6.4
Intentional self harm (X60-X84) 408 40 448 6.0
Remainder of diseases of the nervous system (G04-
G25, G31-G98) including Huntington's disease (G10)
and cerebral palsy (G80) 309 91 400 5.4
Other heart diseases (I26-I51) 225 111 336 4.5
Remainder of malignant neoplasms (C17, C23-C24, C26-
C31, C37-C41, C44-C49, C51-C52, C57-C60, C62-C66,
C68-C69, C73-C81, C88, C96-C97) 220 84 304 4.1
Pneumonia (J12-J18) 149 97 246 3.3
Malignant neoplasm of trachea, bronchus and lung
(C33-C34) 131 115 246 3.3
Diabetes mellitus (E10-E14) 164 69 233 3.1
Malignant neoplasm of the breast (C50) 0 229 229 3.1
Remainder 2184 1612 3796 50.8
Total 4806 2668 7474 100
Number of PYLL
More in-depth analysis showed that ischaemic heart disease, transport accidents and intentional self-
harm were the most important causes of premature mortality in men.
Breast cancer, transport accidents and lung cancer were the leading causes of premature mortality in
females.

Annual Mortality Report 2013
17
Section 2: Individual diseases
Diseases of the circulatory system (ICD 10 codes I00-I99)
Diseases of the circulatory system accounted for 40.1% of all deaths. There were 1298 deaths, a
decrease of 298 from 2012. These were mainly ischaemic heart disease, heart failure and
cerebrovascular disease. Diseases of the circulatory system were of particular importance in the 65-
84 year age group and in the 85+ year age group in terms of leading causes of death but also an
important cause of premature mortality as shown in the PYLL-65.
The age-standardised death rate (SDR) from diseases of the circulatory system was 189.04, a
decrease over the previous year of 52.56.
0
50
100
150
200
250
300
350
400
450
500
19
94
19
95
19
96
19
97
19
98
19
99
20
00
20
01
20
02
20
03
20
04
20
05
20
06
20
07
20
08
20
09
20
10
20
11
20
12
20
13
SMR
du
e t
o d
ise
ase
s o
f th
e c
ircu
lato
ry
syst
em
/10
0,0
00
year
Malta-M Malta-F EU-M EU-F
Figure 12: Trends in SDR (ESP), diseases of the circulatory system per 100,000 in Malta and the EU over the past 20 years in males and females.
Source: WHO/Europe-Health for all Database (HFA-DB)
As shown in Figure 12, over the past 20 years an overall decreasing trend can be seen in both males
and females in both Malta and EU 28. Rates for Malta and EU 28 follow an overall similar pattern.

Annual Mortality Report 2013
18
Ischaemic heart disease (I20-I25) and Diabetes Mellitus (E10-E14)
Ischaemic heart disease was the leading cause of death accounting for 21.8% of all deaths. There
were 387 male deaths and 318 female deaths, a decrease of 107 male and 128 female deaths over
the previous year.
0
50
100
150
200
250
300
19
94
19
95
19
96
19
97
19
98
19
99
20
00
20
01
20
02
20
03
20
04
20
05
20
06
20
07
20
08
20
09
20
10
20
11
20
12
20
13
SMR
du
e t
o is
chae
mic
he
art
dis
eas
e/1
00
,00
0
year
Malta-M Malta-F EU-M EU-F
Figure 13: Trends in SDR, Ischaemic heart disease in Malta compared to the EU in males and females.
Source: WHO/Europe-Health for all Database (HFA-DB)
An overall decreasing trend is seen in both males and females in both Malta and the EU. However EU
rates for both males and females are consistently lower than those for Malta.
Annual Mortality Report 2013
19
0
5
10
15
20
25
30
35
1994
1995
1996
1997
1998
1999
2000
2001
2002
2003
2004
2005
2006
2007
2008
2009
2010
2011
2012
2013
SMR
due
to d
iabe
tes
per 1
00,0
00
year
Malta-M Malta-F EU-M EU-F
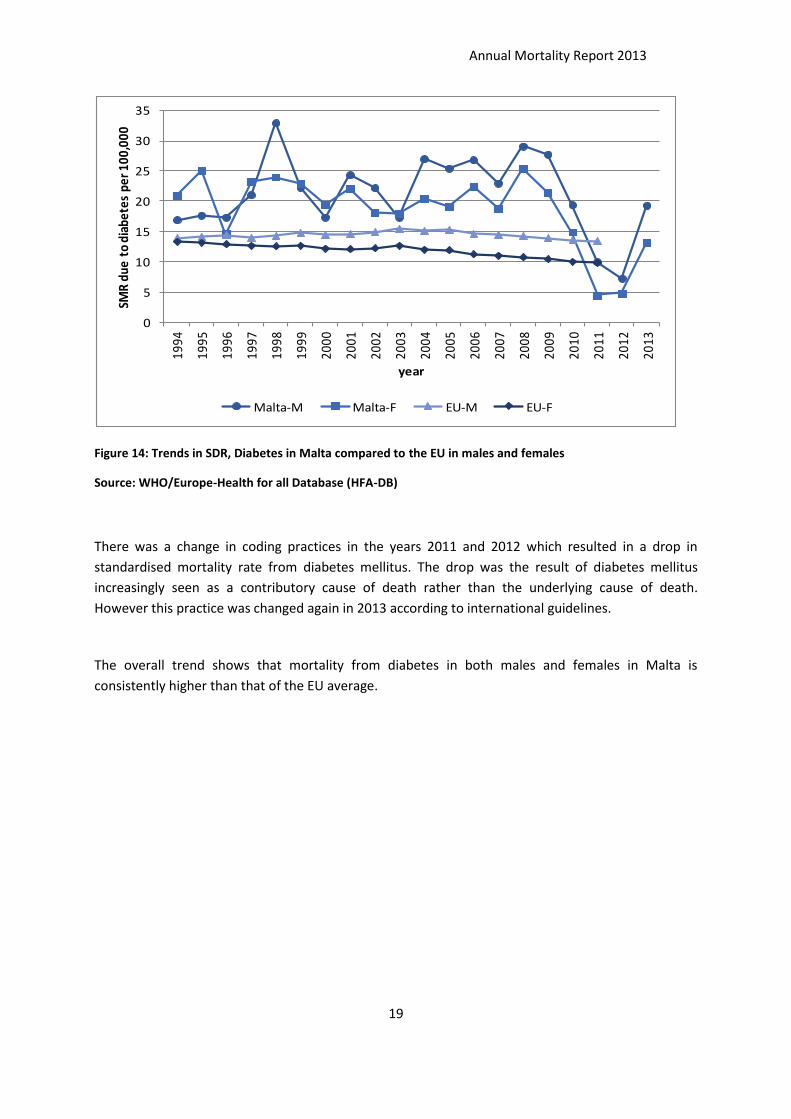
Figure 14: Trends in SDR, Diabetes in Malta compared to the EU in males and females
Source: WHO/Europe-Health for all Database (HFA-DB)
There was a change in coding practices in the years 2011 and 2012 which resulted in a drop in
standardised mortality rate from diabetes mellitus. The drop was the result of diabetes mellitus
increasingly seen as a contributory cause of death rather than the underlying cause of death.
However this practice was changed again in 2013 according to international guidelines.
The overall trend shows that mortality from diabetes in both males and females in Malta is
consistently higher than that of the EU average.

Annual Mortality Report 2013
20
Cerebrovascular diseases (ICD-10 codes I60-I69)
There were 274 deaths from cerebrovascular diseases in 2013, accounting for 8.5% of all deaths. A
decrease of 3 deaths was noted from the previous year. Females out-number males in the number of
deaths due to cerebrovascular disease with 161 females versus 113 males having died of stroke
during 2013.
0
20
40
60
80
100
120
SMR
, C
ere
bro
vasc
ula
r d
ise
ase
/10
0,0
00
year
Malta-M Malta-F EU-M EU-F
Figure 15: Trends SDR, Cerebrovascular disease in Malta compared to the EU in males and females.
Source: WHO/Europe-Health for all Database (HFA-DB)
Figure 15 shows that Malta has followed an overall decreasing trend in SDRs from cerebrovascular
similar to that of EU 28. This decrease in trend in the SDR from cerebrovascular disease is a reflection
both of a decrease in the number of deaths due to cerebrovascular disease and an increase in the
average age of death.

Annual Mortality Report 2013
21
Average age at death from diseases of the circulatory system and diabetes mellitus
Table 10 shows that for nearly all deaths due to circulatory diseases and diabetes, the average age at
death for males is lower than that for females. Average age of death for both males and females
dying from circulatory diseases is more than the average age of death in the general population in
2013, however for persons dying from diabetes it is lower in both genders.
Table 10: Average age at death from diseases of the circulatory system & diabetes mellitus in 2013
Average age at death (yrs)
Underlying cause of death M F T
Cerebrovascular diseases (I60-I69) 78.1 82.9 80.9
Hypertensive diseases (I10-I14) 81.7 80.1 80.9
Ischaemic heart diseases (I20-I25) 75.4 82.5 78.6
Other heart diseases (I26-I51) including heart failure (I50) 77.7 83.5 81.1
Atherosclerosis (I70) 74.1 85.3 81.4
Remainder of diseases of the circulatory system (I71-I99) 77.5 83.1 80.8
All circulatory diseases (I00-I99) 76.4 82.8 79.7
Diabetes mellitus (E10-E14) 72.2 77.9 75.0
* Underlying causes of death with small numbers (n<10) were not included in the table or marked as “n/a”

Annual Mortality Report 2013
22
Neoplasms (ICD-10 codes C00-D48)
There were 870 deaths due to neoplasms accounting for 26.9% of all deaths. There was a decrease of
50 deaths from 2012. Of these, 466 were male and 404 were female. Lung cancer is the leading cause
of death due to malignancy accounting for 17.7% of all cancer deaths and 4.8% of all deaths.
0
50
100
150
200
250
300
SMR
, M
alig
nan
t n
eo
pla
sms/
10
0,0
00
year
Malta-M Malta-F EU-M EU-F
Figure 16: Trends SDR, malignant neoplasms per 100,000 in Malta compared to EU by gender.
Source: WHO/Europe-Health for all Database (HFA-DB)
In Figure 16, a downward trend in SDRs from malignant neoplasms can be observed for Malta as well
as the EU. In males rates for Malta compare favourably with the EU, and are similar in females in
both Malta and the EU.

Annual Mortality Report 2013
23
Most common cancer deaths
Lung (C33-C34)18%
Colorectal (C18-C21)13%
Breast (C50)10%
Pancreas (C25)
8%
Stomach (C16)5%
Prostate (C61)4%
Ovary (C56)3%
Bladder (C67)3%
Remainder of neoplasms
36%
Figure 17: Most common cancer deaths in both sexes
Lung (C33-C34)25%
Colorectal (C18-C21)13%
Prostate (C61)8%Pancreas (C25)
7%
Stomach (C16)7%
Bladder (C67)4%
Brain (C70-C72)4%
Non-Hodgkin's lymphoma (C82-
C85)
3%
Remainder of neoplasms
29%
Figure18: Most common cancer deaths in males

Annual Mortality Report 2013
24
Breast (C50)21%
Colorectal (C18-C21)
12%
Pancreas (C25)
9%Lung
(C33-C34)9%
Ovary (C56)7%
Stomach (C16)4%
Uterus (C54-C55)3%
Remainder of neoplasms
35%
Figure 19: Most common cancer deaths in females

Annual Mortality Report 2013
25
Death due to lung cancer in Malta compared to the EU
While rates in males are much higher than in females, deaths due to lung cancer are showing a
decreasing trend in males, which is not so in females. For both genders rates in Malta are lower than
the EU average.
0
10
20
30
40
50
60
70
80
90
1994
1995
1996
1997
1998
1999
2000
2001
2002
2003
2004
2005
2006
2007
2008
2009
2010
2011
2012
2013
SMR,
Lun
g ca
ncer
/100
,000
year
Malta- M Malta- F EU- M EU- F
Figure 20: Trends in SDR, malignant neoplasm of trachea, bronchus & lung per 100,000 in Malta compared to EU in males and females.
Source: WHO/Europe-Health for all Database (HFA-DB)
Deaths due to breast cancer in Malta compared to the EU in females
0
10
20
30
40
50
60
SMR,
Bre
ast
canc
er/1
00,0
00
year
Malta EU
Figure 21: SDR, malignant neoplasm of female breast per 100,000 in Malta compared to the EU, all ages in females.
Source: WHO/Europe-Health for all Database (HFA-DB)

Annual Mortality Report 2013
26
While rates for Malta are higher than the EU average, there has been a considerable decrease in
standardised mortality rate due to breast cancer over the past 20 years in Malta, with rates now
approaching the EU average.
Average age of death due to neoplasms
As shown in Table 11, the average age at death from neoplasms was 7.7 years less than that from
circulatory diseases. The average at death was 72.0 years for those dying from neoplasms and 79.7
years for those dying from circulatory disease. The average age at death from neoplasms increased
by 0.7 years between 2012 and 2013.
Table 11: Average age at death from the commonest neoplasms
Underlying cause of death Average age at death (yrs)
M F T
Malignant neoplasm of trachea, bronchus and lung (C33-C34) 72.5 69.3 71.7
Malignant neoplasm of colon, rectum and anus (C18-C21) 73.6 73.1 73.4
Malignant neoplasm of breast (C50) - 71.7 71.7
Malignant neoplasm of pancreas (C25) 66.8 70.7 68.9
Malignant neoplasm of stomach (C16) 71.0 77.2 73.0
Malignant neoplasm of prostate (C61) 78.6 - 78.6
Malignant neoplasm of ovary (C56) - 71.1 71.1
Malignant neoplasm of bladder (C67) 75.6 72.6 74.7
All neoplasms (C00-D48) 71.5 72.6 72.0

Annual Mortality Report 2013
27
Diseases of the respiratory system (ICD 10 code J00-J98)
There were 344 deaths due to respiratory conditions during 2013 accounting for 10.6% of all deaths.
There was an increase of 56 deaths from 2012. Of these, 187 were male and 157 were female.
Deaths due to respiratory conditions tend to affect the older age groups.
0
20
40
60
80
100
120
140
19
94
19
95
19
96
19
97
19
98
19
99
20
00
20
01
20
02
20
03
20
04
20
05
20
06
20
07
20
08
20
09
20
10
20
11
20
12
20
13
SMR
, R
esp
irat
ory
dis
eas
es/
10
0,0
00
year
Malta-M Malta-F EU-M EU-F
Figure 22: SDR, all respiratory conditions per 100,000 in Malta compared to the EU in males and females.
Source: WHO/Europe-Health for all Database (HFA-DB)
The overall average age at death due to diseases of the respiratory system was 81.4. The average age
at death in males was 80.2 and that in females was 82.8.

Annual Mortality Report 2013
28
Chronic lower respiratory diseases (ICD 10 codes J40-J47)
There were 66 deaths in males and 12 deaths in females accounting for 2.4% of all deaths. Rates for
females show an overall stable trend and are lower than the EU average. In males rates are less
stable but overall higher than the EU average.
0
10
20
30
40
50
60
SMR
, C
hro
nic
lu
ng
dis
eas
e/1
00
,00
0
year
Malta-M Malta-F EU-M EU-F
Figure 23: Trends in SDR, chronic bronchitis/emphysema/asthma, in males per 100,000, in Malta compared to the EU in males and females.
Source: WHO/Europe-Health for all Database (HFA-DB)
Smoking attributable mortality
The Joint Action on European Community Health Indicator Monitoring (ECHIM) developed a set of
indicators, one of which is the indicator for smoking attributable mortality. This indicator is believed
to be finer than the previous WHO definition for smoking attributable mortality reported in previous
annual mortality reports and may better reflect the number of deaths that are actually attributable
to smoking. The calculation takes into consideration the prevalence of smoker, ex-smokers and non-
smokers in the population. For more detail on the calculation and the references, kindly refer section
on definitions.
According to the ECHI calculation, the smoking attributable mortality for males was 393 (186.1 per
100,000 male population) and 127 for females (59.9 per 100,000 female population). For further
details on trends visit Fact Sheet on Smoking Attributable Mortality on website.

Annual Mortality Report 2013
29
Diseases of the digestive system (ICD 10 codes K00-K93)
There were 101 deaths due to diseases of the digestive system accounting for 3.1% of all deaths.
There was a decrease of 11 deaths over 2012. Of these, 50 were male and 51 were female.
Diseases of the liver (ICD 10 codes K70-K76)
There were 27 deaths from disease of the liver, of which 22 were male and 5 were female. Of these,
13 male and 5 female deaths were attributed to alcoholic liver disease (ICD-10: K70).
0
5
10
15
20
25
30
1994
1995
1996
1997
1998
1999
2000
2001
2002
2003
2004
2005
2006
2007
2008
2009
2010
2011
2012
2013
SMR,
Chr
onic
Liv
er d
isea
se/1
00,0
00
year
Malta-M Malta-F EU-M EU-F
Figure 24: Trends in SDR, chronic liver disease & cirrhosis per 100,000 in Malta compared to the EU in males and females.
Source: WHO/Europe-Health for all Database (HFA-DB)
Mortality due to chronic liver disease is low when compared with the EU in both males and females.
While rates in the EU are showing a downward trend rates for Malta are stable.
However chronic liver disease especially alcoholic liver disease is responsible for a number of
premature deaths. Infact the overall average age at death from chronic liver disease and cirrhosis, in
2013, was 61.7 years. The average age at death in males was 61.6 and in females was 62.2 years.

Annual Mortality Report 2013
30
Some infectious and parasitic diseases (ICD 10 codes A00-B99 (excluding
A41.9), G00, G03-G04, N70-N73) There were 19 deaths due to infectious and parasitic diseases in the above-mentioned categories. Of
these, 11 were male and 8 were female. Though few in the number, infectious diseases often cause
death in the younger age groups.
Table 12: Deaths from infectious diseases
Cause of death ICD-10
code
Gender Age Group Number of deaths
Salmonella infection,
unspecified
A02.9 M 45-64 1
Campylobacter enteritis A04.5 M 75+ 1
Enterocolitis due to
Clostridium difficile
A04.7 F 75+ 1
Diarrhoae and
gastroenteritis of presumed
infectious origin
A09 F 65-74 1
Respiratory tuberculosis
unspecified
A16.9 F 75+ 1
Leptospirosis A27 M 45-64 1
Septicaemia due to other
Gram-negative organisms
A41.5 F 75+ 2
Legionnaires’ disease A48.1 M 65-74 1
Staphylococcal infection,
unspecified
A49.0 F 75+ 1
Creutzfeldt-Jakob disease A81.0 M 45-64 1
Zoster with other
complications
B02.8 M, F 65-74; 75+ 2
Chronic viral hepatitis C B18.2 M 45-64 1
Unspecified viral hepatitis B19 M 45-64 1
HIV disease resulting in
other malignant neoplasms
B21.3 M 15-44 1
Sequelae of respiratory and
unspecified tuberculosis
B90.9 M 75+ 2
Streptococcal meningitis G00.2 F 15-44 1

Annual Mortality Report 2013
31
External causes of morbidity and mortality (ICD 10 codes V01-Y98)
There were 106 deaths due to external causes during the year 2013 accounting for 3.3% of all deaths.
There was a decrease of 6 deaths from 2012. Of these, 78 were male and 28 were female.
0
5
10
15
20
25
30
Falls Intentional self harm
Transport Accidents
Assault All other external causes
Accidental drowning
nu
mb
er
of
de
ath
s
external cause of death
females males
Figure 25: Number of deaths due to external causes, in males and females.
Table 13: Average age at death from some external causes
Average age of death (years)
Underlying cause of death* Male Female Total
Falls (W00-W19) 79.8 84.4 81.6
Intentional self-harm (X60-X84) 46.1 n/a 45.2
Transport accidents (V01-V99) 48.3 41 46.5
Assault (X85-Y09) 49.3 - 49.3
All external causes 60.1 70.0 62.7
* Underlying causes of death with small numbers (n<5) were not included in the table or marked as “n/a”

Annual Mortality Report 2013
32
Transport accidents (V01-V99)
There were 24 deaths due to transport accidents during the year 2013. Of these, 18 were male and 6
were female. There was an increase of 11 deaths over 2012.
The SDR from transport accidents is smaller in Malta compared to the EU, however as seen in the
graph below while rates for the EU are decreasing, no such trends are seen for mortality due to
transport accidents in Malta in recent years. Most deaths occur in males and in those under 65 years
of age.
0
5
10
15
20
25
SMR,
Tra
nspo
rt a
ccid
ents
/100
000
years
Malta-M Malta-F EU-M EU-F
Figure 26: Trends in SDR, motor vehicle accidents, all ages, in Malta compared to the EU by gender.
Source: WHO/Europe-Health for all Database (HFA-DB)
Annual Mortality Report 2013
33
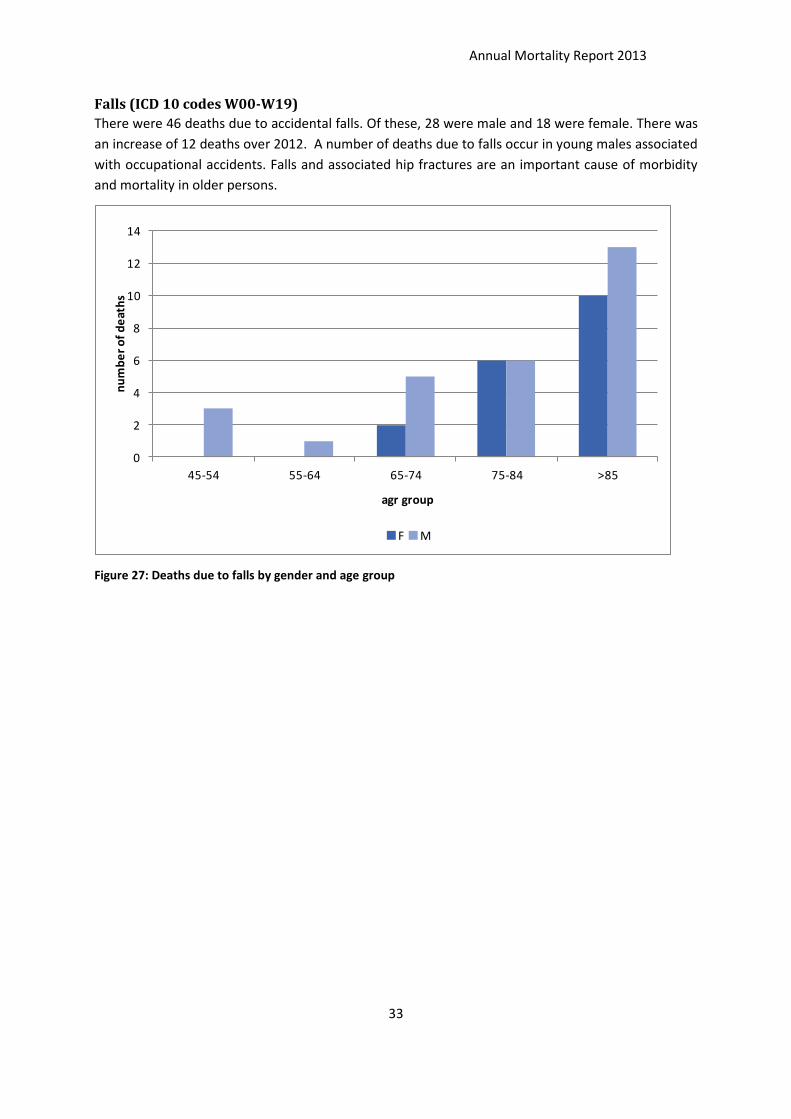
Falls (ICD 10 codes W00-W19)
There were 46 deaths due to accidental falls. Of these, 28 were male and 18 were female. There was
an increase of 12 deaths over 2012. A number of deaths due to falls occur in young males associated
with occupational accidents. Falls and associated hip fractures are an important cause of morbidity
and mortality in older persons.
0
2
4
6
8
10
12
14
45-54 55-64 65-74 75-84 >85
nu
mb
er
of
de
ath
s
agr group
F M
Figure 27: Deaths due to falls by gender and age group

Annual Mortality Report 2013
34
Intentional self harm (ICD 10 codes X60-X84)
It is not always easy to ascertain whether a death was intentional or accidental. Most probably,
suicides tend to be under-reported. They carry a stigma and are rarely written down on the death
certificate.
The National Mortality Registry collaborates very closely with the Police Statistics Office to determine
the circumstantial evidence surrounding a death and to cross-check the cases of suicide between the
two databases. Where the information given is very suggestive of suicide, deaths are coded as such.
However, when this is dubious, deaths are coded under the heading ‘undetermined intent’.
During the year 2013 there were 22 deaths due to suicide. Of these, 21 were male and 1 was female.
There was a decrease of 3 deaths over 2012. Hanging was the commonest method of suicide.
0
5
10
15
20
25
1994
1995
1996
1997
1998
1999
2000
2001
2002
2003
2004
2005
2006
2007
2008
2009
2010
2011
2012
2013SM
R, I
nten
tion
al s
elf
harm
/100
,000
year
Malta-M Malta-F EU-M EU-F
Figure 28: Trends in SDR, Intentional self harm, all ages, per 100000, in Malta compared to the EU by gender. Source: WHO/Europe-Health for all Database (HFA-DB)
Deaths due to illicit drug overdose (EMCDDA definition)
Table 14: EMCDDA definition of codes used in illicit drug overdose
Underlying cause of death Selected ICD-10 code(s)
Disorders F11-F12, F14-F16, & F19
Accidental poisoning X44¹, X42¹, X41¹
Intentional poisoning X62¹, X61¹ , X64¹
Poisoning of undetermined intent Y12¹, Y11¹, Y14¹
¹ In combination with T codes T40.0-9, T43.6
There were 3 deaths due to drug overdose by illicit drugs. There were 2 male deaths and 1 female
death. The average age at death was 31.5 years. Drugs of abuse included heroin, cocaine, methadone
and other narcotics.

Annual Mortality Report 2013
35
Section 3: Perinatal and infant mortality Infant mortality statistics are an important source of information. They give an indication of the
social and economic state of a country as well as the level of health care that is provided to an
especially vulnerable group: infants.
During the year 2013, there were 29 perinatal deaths reported to the National Mortality Registry,
consisting of 16 foetal deaths and 13 early neonatal deaths. There were 25 infant deaths. These
deaths do not include foetuses or infants weighing less than 500g. Foetuses and infants born to
foreigners (tourists) are excluded.
Table 15 gives a more detailed breakdown of foetal, neonatal and infant deaths according to the
presence or otherwise of congenital anomalies classified the underlying cause of death.
Table 15: Foetal, neonatal & infant deaths by birth weight, age group & presence or absence of malformation as UCD.
500-999g or equivalent
>=1000g or equivalent Total
M F U T M F U T M F U T
Foetal deaths 3 1 0 4 6 6 0 12 9 7 0 16
FD with malformations 1 0 0 1 2 1 0 3 3 1 0 4
FD without malformations 2 1 0 3 4 5 0 9 6 6 0 12
Early neonatal deaths (END) 5 1 0 6 4 3 0 7 9 4 0 13
END with malformations 0 0 0 0 3 1 0 4 3 1 0 4
END without malformations 5 1 0 6 1 2 0 3 6 3 0 9
Late neonatal deaths (LND) 0 2 0 2 0 1 0 1 0 3 0 3
LND with malformations 0 0 0 0 0 1 0 1 0 1 0 1
LND without malformations 0 2 0 2 0 0 0 0 0 2 0 2
Post neonatal deaths (PND) 0 0 0 0 4 5 0 9 4 5 0 9
PND with malformations 0 0 0 0 3 4 0 7 3 4 0 7
PND without malformations 0 0 0 0 1 1 0 2 1 1 0 2
Infant deaths (ID) 5 3 0 8 8 9 0 17 13 12 0 25
ID with malformations 0 0 0 0 6 6 0 12 6 6 0 12
ID without malformations 5 3 0 8 2 3 0 5 7 6 0 13
*Malformations include ICD 10 codes: D57.1, E88.9, G71.3, J81., Q00-Q99

Annual Mortality Report 2013
36
Foetuses or infants weighing less than 500g are not included in the rates described below.
Foetal mortality rate: 16/(4125+16)*1000= 3.86 per 1000 total births
Perinatal mortality rate: 29/(4125+16)*1000= 7.00 per 1000 total births
Neonatal mortality rate: 16/4125*1000= 3.88 per 1000 live births
Post neonatal mortality rate: 9/4125*1000= 2.18 per 1000 live births
Infant mortality rate: 25/4125*1000= 6.10 per 1000 live births
International Statistics:
For international comparisons, only deaths with a birth weight of over 1000g are considered.
Foetal death rate, weight specific = 12/ (4112+12)*1000 = 2.91 per 1000 total births
Perinatal mortality rate, weight specific = 19/ (4112+12)*1000 = 4.61 per 1000 total births
Neonatal death rate, weight specific = 8/4112*1000 = 1.95 per 1000 live births
Post neonatal death rate, weight specific = 9/4112*1000 = 2.19 per 1000 live births
Infant mortality rate, weight specific = 17/4112*1000 = 4.13 per 1000 live births

Annual Mortality Report 2013
37
Table 16: Foetal, neonatal & infant deaths by weeks of gestation & presence or absence of malformation as UCD.
22-27 wks or
equivalent
>= 28 weeks or
equivalent
Total
M F U T M F U T M F U T
Foetal deaths 2 5 0 7 7 5 0 12 9 10 0 19
FD with malformations 1 1 0 2 2 1 0 3 3 2 0 5
FD without malformations 1 4 0 5 5 4 0 9 6 8 0 14
Early neonatal deaths (END) 6 2 0 8 4 3 0 7 10 5 0 15
END with malformations 0 0 0 0 3 1 0 4 3 1 0 4
END without malformations 6 2 0 8 1 2 0 3 7 4 0 11
Late neonatal deaths (LND) 0 1 0 1 0 2 0 2 0 3 0 3
LND with malformations 0 0 0 0 0 1 0 1 0 1 0 1
LND without malformations 0 1 0 1 0 1 0 1 0 2 0 2
Post neonatal deaths (PND) 0 0 0 0 4 5 0 9 4 5 0 9
PND with malformations 0 0 0 0 3 4 0 7 3 4 0 7
PND without malformations 0 0 0 0 1 1 0 2 1 1 0 2
Infant deaths (ID) 6 3 0 9 8 10 0 18 14 13 0 27
ID with malformations 0 0 0 0 6 6 0 12 6 6 0 12
ID without malformations 6 3 0 9 2 4 0 6 8 7 0 15
*Malformations include ICD 10 codes: D57.1, E88.9, G71.3, J81., Q00-Q99
Foetuses less than 22 weeks gestation are not included in the rates described below.
Foetal mortality rate: 19/ (4127+19)*1000= 4.58 per 1000 total births
Perinatal mortality rate: 34/ (4127+19)*1000= 8.2 per 1000 total births
Neonatal mortality rate: 18/4127*1000= 4.36 per 1000 live births
Post neonatal mortality rate: 9/4127*1000= 2.18 per 1000 live births

Annual Mortality Report 2013
38
Infant mortality rate: 27/4127*1000= 6.54 per 1000 live births
International Statistics:
For international comparisons, only deaths over 28 weeks of gestation are considered.
Foetal death rate, gestation specific = 12/ (4106+12)*1000 = 2.91 per 1000 total births
Perinatal mortality rate, gestation specific = 19/ (4106+12)*1000 = 4.61 per 1000 total births
Neonatal death rate, gestation specific = 9/ 4106*1000 = 2.19 per 1000 live births
Post neonatal death rate, gestation specific = 9/4106*1000 = 2.19 per 1000 live births
Infant mortality rate, gestation specific = 18/4106*1000 = 4.38 per 1000 live births
As seen in the graph below Malta compares well with the EU for perinatal mortality which is here
presented for perinatal deaths weighing 1000g and over and therefore there is less chance of
underreporting. In the case of infant mortality Malta’s rates are higher than the EU. A degree of
under-reporting in countries contributing to the EU average may be partially responsible for this.
Another reason is that in Malta termination of pregnancy is illegal and therefore infants born with
terminal congenital anomalies may die soon after rather than been aborted during pregnancy and
thereby also raising infant mortality rates.
0
2
4
6
8
10
12
Peri
nata
l (10
00g+
) and
Inf
ant
mor
talit
y ra
te
year
Malta-Infant EU-Infant Malta-Perinatal EU-Perinatal
Figure 29: Trends in perinatal mortality weight specific (1000g and over) and infant mortality in Malta compared to the EU.

Annual Mortality Report 2013
39
Section 4: Deaths in non-residents who died in Malta during 2013
There were 77 deaths in non-residents in Malta. Of these, 60 were male and 17 were female. This
does not include 3 stillbirths of non-residents. This also does not include migrants who die at sea. The
commonest causes of death were diseases of the circulatory system namely ischemic heart disease
and other heart diseases and external causes of mortality, namely drowning and intentional self
harm.
circulatory, 54.5%
digestive system, 10.4%
External causes, 24.7%
neoplasms, 2.6%
respiratory, 7.8%
Figure 30: Causes of death in non-residents
0
2
4
6
8
10
12
14
16
15-24 25-34 35-44 45-54 55-64 65-74 75-84 >85
num
ber o
f de
aths
age group
F M
Figure 31: Deaths in non-residents by gender and age group

Annual Mortality Report 2013
40
Number of deaths in non residents by country of residence
Table 17: Deaths in non-residents by country of residence
Country of residence Number
United Kingdom 34
Libya 9
France 8
Italy 5
Russia 3
Germany 3
Denmark 2
Israel 2
Netherlands 2
Pakistan 1
Switzerland 1
Bulgaria 1
Belgium 1
Tunisia 1
Montenegro 1
Serbia 1
Spain 1
Sweden 1
Total 77

Annual Mortality Report 2013
41
Section 5: Statistical tables Table 18 represents the age standardised death rate (ESP) per 100,000 population by gender and
cause.
The Mortality Tabulation List 1 (MTL1) of the International Classification of Diseases (ICD-10) was
used as the source of grouping of causes of death in this table.
Table 18: Standardised mortality rate (ESP) per 100,000 population by gender & cause
New Age-standardised mortality rate
ICD-10 code MTL1 Cause of death Male Female Total Male Female Total
All causes 608.90 404.37 496.29 1188.80 818.57 972.67
A00-B99 1001
Certain infectious and parasitic
diseases 5.34 2.51 3.96 8.46 6.18 7.58
A09 1003
Diarrhoea and gastroenteritis of
presumed infectious origin 0.00 0.36 0.19 0.00 0.59 0.32
A01-A08 1004
Other intestinal infectious
diseases 0.77 0.22 0.46 1.28 0.47 0.82
A15-A16 1005 Respiratory tuberculosis 0.00 0.17 0.11 0.00 0.44 0.27
A40-A41 1012 Septicaemia 0.72 1.33 1.15 1.27 3.53 2.89
B15-B19 1019 Viral hepatitis 1.08 0.00 0.55 1.08 0.00 0.55
B20-B24 1020
Human immunodeficiency virus
[HIV] disease 0.45 0.00 0.23 0.45 0.00 0.23
A21-A32, A38, A42-A49, A65-
A79, A81, A83-A89, B00-B04,
B06-B09, B25-B49, B58-B64,
B66-B94, B99 1025
Remainder of certain infectious
and parasitic diseases 2.31 0.43 1.28 4.38 1.15 2.49
C00-D48 1026 Neoplasms 166.82 116.39 137.77 294.76 194.86 235.28
C00-C97 Malignant neoplasms 164.79 112.12 134.44 290.97 186.69 228.75
C00-C14 1027
Malignant neoplasm of l ip, oral
cavity and pharynx 3.24 2.32 2.76 5.39 4.12 4.78
C15 1028
Malignant neoplasm of
oesophagus 3.51 0.82 2.04 5.81 1.25 3.08
C16 1029 Malignant neoplasm of stomach 11.41 4.18 7.47 18.65 8.17 13.05
C18-C21 1030
Malignant neoplasm of colon,
rectum and anus 21.10 14.20 16.97 38.87 24.05 30.12
C22 1031
Malignant neoplasm of l iver
and intrahepatic bile ducts 4.84 2.02 3.39 7.10 3.69 5.35
C25 1032
Malignant neoplasm of
pancreas 12.37 11.07 11.80 18.04 17.45 17.93
C32 1033 Malignant neoplasm of larynx 2.28 0.00 1.06 3.59 0.00 1.66
C33-C34 1034
Malignant neoplasm of trachea,
bronchus and lung 40.29 11.37 23.95 71.61 17.06 39.96
Age-standardised mortality rate

Annual Mortality Report 2013
42
New Age-standardised mortality rate
ICD-10 code MTL1 Cause of death Male Female Total Male Female Total
C43 1035 Malignant melanoma of skin 1.54 1.82 1.70 2.86 3.40 3.19
C50 1036 Malignant neoplasm of breast 0.00 24.90 13.61 0.00 40.45 23.23
C53 1037
Malignant neoplasm of cervix
uteri 0.00 1.44 0.76 0.00 1.96 1.07
C54-C55 1038
Malignant neoplasm of other
and unspecified parts of uterus 0.00 2.69 1.54 0.00 5.10 3.00
C56 1039 Malignant neoplasm of ovary 0.00 8.49 4.60 0.00 13.53 7.48
C61 1040 Malignant neoplasm of prostate 13.84 0.00 5.51 30.39 0.00 11.29
C67 1041 Malignant neoplasm of bladder 7.25 2.71 4.54 17.27 4.59 8.89
C70-C72 1042
Malignant neoplasm of
meninges, brain and other parts
of central nervous system 6.49 2.51 4.30 10.57 3.69 6.52
C82-C85 1043 Non-Hodgkin's lymphoma 5.59 2.82 4.18 8.11 4.72 6.39
C90 1044
Multiple myeloma and
malignant plasma cell
neoplasms 2.57 2.36 2.41 4.14 3.11 3.52
C91-C95 1045 Leukaemia 3.53 2.62 3.05 6.04 5.15 5.59
C17, C23-C24, C26-C31, C37-
C41, C44-C49, C51-C52, C57-
C60, C62-C66, C68-C69, C73-
C81, C88, C96-C97 1046
Remainder of malignant
neoplasms 24.94 13.76 18.80 42.53 25.19 32.66
D00-D48 1047 Remainder of neoplasms 2.03 4.28 3.32 3.79 8.17 6.54
D50-D64 1049 Anaemias 0.34 1.23 0.84 0.41 1.71 1.30
D65-D89 1050
Remainder of diseases of the
blood and blood-forming organs
and certain disorders involving
the immune mechanism 0.33 0.00 0.14 0.66 0.00 0.29
E00-E88 1051
Endocrine, nutritional and
metabolic diseases 21.63 14.78 18.15 38.16 28.07 32.65
E10-E14 1052 Diabetes mellitus 19.34 13.22 16.14 36.41 25.71 30.31
E40-E46 1053 Malnutrition 0.00 0.00 0.00 0.00 0.00 0.00
E00-E07, E15-E34, E50-E88 1054
Remainder of endocrine,
nutritional and metabolic
diseases 2.28 1.56 2.01 1.75 2.36 2.33
F01-F99 1055
Mental and behavioural
disorders 14.20 18.25 17.31 30.48 45.85 41.82
Age-standardised mortality rate
1.07 1.71 1.59D50-D89 1048 0.67 1.23 0.99
Diseases of the blood and blood-
forming organs and certain
disorders involving the immune
mechanism

Annual Mortality Report 2013
43
New Age-standardised mortality rate
ICD-10 code MTL1 Cause of death Male Female Total Male Female Total
F10-F19 1056
Mental and behavioural
disorders due to psychoactive
substance use 0.96 0.00 0.46 1.24 0.00 0.59
F01-F09, F20-F99 1057
Remainder of mental and
behavioural disorders 13.24 18.25 16.85 29.24 45.85 41.23
G00-G98 1058 Diseases of the nervous system 16.94 10.99 13.75 28.71 19.57 23.55
G00, G03 1059 Meningitis 0.00 0.47 0.23 0.00 0.43 0.21
G30 1060 Alzheimer's disease 0.43 0.69 0.53 0.87 1.28 1.06
G04-G25, G31-G98 1061
Remainder of diseases of the
nervous system 16.50 9.84 12.99 27.84 17.86 22.28
I00-I99 1064
Diseases of the circulatory
system 231.93 153.68 189.04 481.21 346.28 404.42
I00-I09 1065
Acute rheumatic fever and
chronic rheumatic heart
diseases 0.00 0.00 0.00 0.00 0.00 0.00
I10-I14 1066 Hypertensive diseases 5.04 3.88 4.19 11.40 8.08 9.34
I20-I25 1067 Ischaemic heart diseases 140.17 73.92 103.24 279.40 164.89 213.52
I26-I51 1068 Other heart diseases 36.79 31.63 34.18 84.27 73.55 78.19
I60-I69 1069 Cerebrovascular diseases 41.41 36.76 39.22 88.83 82.54 85.72
I70 1070 Atherosclerosis 2.68 2.86 2.97 5.30 6.65 6.41
I71-I99 1071
Remainder of diseases of the
circulatory system 5.83 4.65 5.25 12.01 10.57 11.23
J00-J98 1072
Diseases of the respiratory
system 70.63 36.49 49.91 168.32 82.61 113.35
J09-J11 1073 Influenza 0.29 0.00 0.14 0.40 0.00 0.19
J12-J18 1074 Pneumonia 23.67 16.96 19.86 58.71 39.92 46.48
J20-J22 1075
Other acute lower respiratory
infections 9.89 8.97 9.42 25.28 22.48 23.60
J40-J47 1076
Chronic lower respiratory
diseases 24.01 3.12 11.30 52.71 5.54 23.00
J00-J06, J30-J39, J60-J98 1077
Remainder of diseases of the
respiratory system 12.77 7.45 9.18 31.22 14.67 20.08
K00-K92 1078 Diseases of the digestive system 18.51 12.73 15.84 31.86 25.42 29.11
K25-K27 1079 Gastric and duodenal ulcer 1.48 1.37 1.39 3.50 2.93 3.08
K70-K76 1080 Diseases of the liver 8.65 1.90 5.14 11.35 2.31 6.55
K00-K22, K28-K66, K80-K92 1081
Remainder of diseases of the
digestive system 8.38 9.46 9.30 17.02 20.18 19.48
L00-L98 1082
Diseases of the skin and
subcutaneous tissue 1.45 3.00 2.45 4.97 8.09 6.87
Age-standardised mortality rate

Annual Mortality Report 2013
44
New Age-standardised mortality rate
ICD-10 code MTL1 Cause of death Male Female Total Male Female Total
M00-M99 1083
Diseases of the musculoskeletal
system and connective tissue 1.57 2.22 2.02 1.73 4.00 3.12
N00-N98 1084
Diseases of the genito-urinary
system 14.10 13.12 13.91 30.19 29.50 30.15
N00-N15 1085
Glomerular and renal tubulo-
interstitial diseases 0.34 0.91 0.68 0.41 1.47 1.03
N17-N98 1086
Remainder of diseases of the
genito-urinary system 13.76 12.21 13.24 29.78 28.03 29.12
P00-P96 1092
Certain conditions originating in
the perinatal period 4.51 4.77 4.64 2.80 3.04 2.91
Q00-Q99 1093
Congenital malformations,
deformations and chromosomal
abnormalities 3.55 3.36 3.47 2.40 2.45 2.49
R00-R99 1094
Symptoms, signs and abnormal
clinical and laboratory findings,
not elsewhere classified 4.39 2.54 3.30 12.86 7.17 8.76
V01-Y89 1095
External causes of morbidity and
mortality 32.67 8.29 19.79 50.80 13.78 29.01
V01-V99 1096 Transport accidents 7.49 2.55 5.00 8.23 2.49 5.27
W00-W19 1097 Falls 11.09 4.07 6.91 27.35 9.28 15.21
W65-W74 1098
Accidental drowning and
submersion 0.00 0.48 0.23 0.00 0.41 0.20
X60-X84 1101 Intentional self-harm 9.51 0.48 5.02 9.68 0.41 5.05
X85-Y09 1102 Assault 2.63 0.00 1.32 2.75 0.00 1.38
W20-W64, W75-W99, X10-
X39, X50-X59, Y10-Y89 1103 All other external causes 1.95 0.71 1.31 2.79 1.19 1.90
Age-standardised mortality rate

Annual Mortality Report 2013
45
Table 3: Deaths by specific cause, age group and gender
Table 19 represents the number of deaths by age group and gender and cause of death.
Cause of death Sex 0-4 5-14 15-24 25-34 35-44 45-54 55-64 65-74 75-84 85+ All ages
All deaths T 29 1 20 17 39 112 322 592 1071 1033 3236
All male deaths M 15 1 13 13 29 72 212 375 529 377 1636
All female deaths F 14 0 7 4 10 40 110 217 542 656 1600
A00-B99 Certain infectious & M 0 0 0 0 1 2 3 3 0 4 13
parasitic diseases F 0 0 0 0 0 0 0 1 2 8 11
A02 Other salmonella M 0 0 0 0 0 0 1 0 0 0 1
A02 infections F 0 0 0 0 0 0 0 0 0 0 0
A04 Other bacterial M 0 0 0 0 0 0 0 0 0 1 1
A04 intestinal infections F 0 0 0 0 0 0 0 0 0 1 1
A09 Diarrhoae & gastroenteritis M 0 0 0 0 0 0 0 0 0 0 0
A09 of presumed infectious origin F 0 0 0 0 0 0 0 1 0 0 1
A16 Respiratory tuberculosis, not confirmed M 0 0 0 0 0 0 0 0 0 0 0
A16 bacteriologically or histologically F 0 0 0 0 0 0 0 0 1 0 1
A27 Leptospirosis M 0 0 0 0 0 0 1 0 0 0 1
A27 F 0 0 0 0 0 0 0 0 0 0 0
A41 Other septicaemia M 0 0 0 0 0 0 0 1 0 1 2
A41 F 0 0 0 0 0 0 0 0 1 5 6
A48 Other bacterial diseases, not elsewhere M 0 0 0 0 0 0 0 1 0 0 1
A48 classified F 0 0 0 0 0 0 0 0 0 0 0
A49 Bacterial infection of unspecified site M 0 0 0 0 0 0 0 0 0 0 0
A49 F 0 0 0 0 0 0 0 0 0 1 1
A81 Slow virus infections of central nervous M 0 0 0 0 0 0 1 0 0 0 1
A81 system F 0 0 0 0 0 0 0 0 0 0 0
B02 Zoster (herpes zoster) M 0 0 0 0 0 0 0 1 0 0 1
B02 F 0 0 0 0 0 0 0 0 0 1 1
B18 Chronic viral hepatitis M 0 0 0 0 0 1 0 0 0 0 1
B18 F 0 0 0 0 0 0 0 0 0 0 0
B19 Unspecified viral hepatitis M 0 0 0 0 0 1 0 0 0 0 1
B19 F 0 0 0 0 0 0 0 0 0 0 0
B21 Human immunodeficiency virus (HIV) M 0 0 0 0 1 0 0 0 0 0 1
B21 disease resulting in malignant neoplasms F 0 0 0 0 0 0 0 0 0 0 0
B90 Sequelae of tuberculosis M 0 0 0 0 0 0 0 0 0 2 2
B90 F 0 0 0 0 0 0 0 0 0 0 0
C00-D48 Neoplasms M 1 0 2 0 7 20 90 142 152 52 466
F 0 0 1 2 7 27 63 101 138 65 404
C00-C97 Malignant neoplasms M 1 0 2 0 6 20 90 141 148 52 460
F 0 0 1 2 6 27 60 100 132 60 388
C00 Malignant neoplasm of l ip M 0 0 0 0 0 0 0 0 1 0 1
C00 F 0 0 0 0 0 0 0 0 0 0 0
Cause in
ICD-10

Annual Mortality Report 2013
46
Cause of death Sex 0-4 5-14 15-24 25-34 35-44 45-54 55-64 65-74 75-84 85+ All ages
C02 Malignant neoplasm of other and unspecified parts M 0 0 0 0 0 0 0 0 1 0 1
C02 of tongue F 0 0 0 0 0 0 0 1 1 0 2
C03 Malignant neoplasm of gum M 0 0 0 0 0 0 0 0 0 0 0
C03 F 0 0 0 0 0 0 0 0 1 1 2
C04 Malignant neoplasm of floor of mouth M 0 0 0 0 0 0 0 0 1 0 1
C04 F 0 0 0 0 0 0 0 0 0 0 0
C05 Malignant neoplasm of palate M 0 0 0 0 0 0 0 1 0 0 1
C05 F 0 0 0 0 0 0 0 0 0 0 0
C07 Malignant neoplasm of parotid gland M 0 0 0 0 0 0 1 0 0 0 1
C07 F 0 0 0 0 0 0 1 0 0 0 1
C10 Malignant neoplasm of oropharynx M 0 0 0 0 0 0 1 0 0 0 1
C10 F 0 0 0 0 0 0 1 0 1 0 2
C11 Malignant neoplasm of nasopharynx M 0 0 0 0 0 0 1 1 0 0 2
C11 F 0 0 0 0 0 0 0 0 1 0 1
C13 Malignant neoplasm of hypopharynx M 0 0 0 0 0 0 0 1 0 0 1
C13 F 0 0 0 0 0 0 0 0 0 0 0
C15 Malignant neoplasm of oesophagus M 0 0 0 0 2 0 2 2 1 2 9
C15 F 0 0 0 0 0 0 1 1 0 1 3
C16 Malignant neoplasm of stomach M 0 0 0 0 0 4 3 12 9 3 31
C16 F 0 0 0 0 0 1 1 4 5 4 15
C17 Malignant neoplasm of small intestine M 0 0 0 0 0 0 0 0 0 0 0
C17 F 0 0 0 0 0 0 0 0 1 0 1
C18 Malignant neoplasm of colon M 0 0 0 0 0 1 9 15 22 4 51
C18 F 0 0 0 0 0 3 8 10 9 9 39
C19 Malignant neoplasm of rectosigmoid junction M 0 0 0 0 0 0 0 2 1 0 3
C19 F 0 0 0 0 0 1 0 1 1 1 4
C20 Malignant neoplasm of rectum M 0 0 0 0 0 0 2 0 2 3 7
C20 F 0 0 0 0 0 0 0 2 2 0 4
C21 Malignant neoplasm of anus and anal canal M 0 0 0 0 0 0 0 0 0 0 0
C21 F 0 0 0 0 0 0 0 1 0 0 1
C22 Malignant neoplasm of l iver and M 0 0 0 0 0 1 5 4 2 1 13
C22 intrahepatic bile ducts F 0 0 0 0 0 0 2 1 4 1 8
C23 Malignant neoplasm of gallbladder M 0 0 0 0 0 0 1 1 0 0 2
C23 F 0 0 0 0 0 0 0 0 0 0 0
C24 Malignant neoplasm of other and unspecified M 0 0 0 0 0 0 0 1 0 0 1
C24 parts of bil iary tract F 0 0 0 0 0 0 0 0 0 1 1
C25 Malignant neoplasm of pancreas M 0 0 0 0 0 5 10 12 6 1 34
C25 F 0 0 0 1 1 1 7 12 12 4 38
C26 Malignant neoplasm of other and il l-defined M 0 0 0 0 0 0 0 0 0 0 0
C26 digestive organs F 0 0 0 0 0 0 0 0 1 0 1
C31 Malignant neoplasm of accessory sinuses M 0 0 0 0 0 0 0 1 0 0 1
C31 F 0 0 0 0 0 0 0 0 0 0 0
Cause in
ICD-10

Annual Mortality Report 2013
47
Cause of death Sex 0-4 5-14 15-24 25-34 35-44 45-54 55-64 65-74 75-84 85+ All ages
C32 Malignant neoplasm of larynx M 0 0 0 0 0 0 1 4 1 0 6
C32 F 0 0 0 0 0 0 0 0 0 0 0
C34 Malignant neoplasm of bronchus and lung M 0 0 0 0 0 3 19 43 45 7 117
C34 F 0 0 0 0 0 5 8 11 9 4 37
C38 Malignant neoplasm of heart, mediastinum M 0 0 0 0 0 0 1 0 0 0 1
C38 and pleura F 0 0 0 0 0 0 0 0 0 0 0
C41 Malignant neoplasm of bone and articular cartilage M 0 0 1 0 0 0 0 1 0 0 2
C41 of other and unspecified sites F 0 0 0 0 0 0 0 0 0 0 0
C43 Malignant melanoma of skin M 0 0 0 0 0 0 0 2 3 0 5
C43 F 0 0 0 0 0 0 1 2 4 0 7
C44 Other malignant neoplasms of skin M 0 0 0 0 0 0 0 2 3 0 5
C44 F 0 0 0 0 0 0 0 0 0 0 0
C45 Mesothelioma M 0 0 0 0 0 0 3 1 7 2 13
C45 F 0 0 0 0 0 0 0 0 1 0 1
C49 Malignant neoplasm of other connective and M 0 0 0 0 0 1 2 1 1 0 5
C49 soft tissue F 0 0 0 1 0 0 1 0 0 0 2
C50 Malignant neoplasm of breast M 0 0 0 0 0 0 0 0 0 0 0
C50 F 0 0 0 0 3 5 16 23 19 17 83
C51 Malignant neoplasm of vulva F 0 0 0 0 0 0 2 2 1 0 5
C53 Malignant neoplasm of cervix uteri F 0 0 0 0 0 2 0 0 2 0 4
C54 Malignant neoplasm of corpus uteri F 0 0 0 0 0 1 0 2 5 1 9
C55 Malignant neoplasm of uterus, part unspecified F 0 0 0 0 0 0 0 0 2 0 2
C56 Malignant neoplasm of ovary F 0 0 0 0 0 4 1 12 11 1 29
C57 Malignant neoplasm of other and unspecified F 0 0 0 0 0 0 0 0 1 0 1
female genital organs
C61 Malignant neoplasm of prostate M 0 0 0 0 0 0 4 11 7 15 37
C64 Malignant neoplasm of kidney, except renal pelvis M 0 0 0 0 1 1 3 5 4 4 18
C64 F 0 0 0 0 0 0 1 1 7 0 9
C66 Malignant neoplasm of ureter M 0 0 0 0 0 0 0 0 0 0 0
C66 F 0 0 0 0 0 0 0 1 1 0 2
C67 Malignant neoplasm of bladder M 0 0 0 0 0 0 6 2 8 4 20
C67 F 0 0 0 0 1 0 2 1 2 3 9
C69 Malignant neoplasm of eye and adnexa M 0 0 0 0 0 0 0 0 0 0 0
C69 F 0 0 0 0 0 0 0 0 1 0 1
C71 Malignant neoplasm of brain M 0 0 0 0 1 2 5 2 5 2 17
C71 F 0 0 0 0 0 2 1 1 3 1 8
C73 Malignant neoplasm of thyroid gland M 0 0 0 0 0 0 0 2 0 0 2
C73 F 0 0 0 0 0 0 0 1 4 2 7
C74 Malignant neoplasm of adrenal gland M 0 0 0 0 0 0 0 0 0 0 0
C74 F 0 0 0 0 1 0 0 0 0 0 1
Cause in
ICD-10
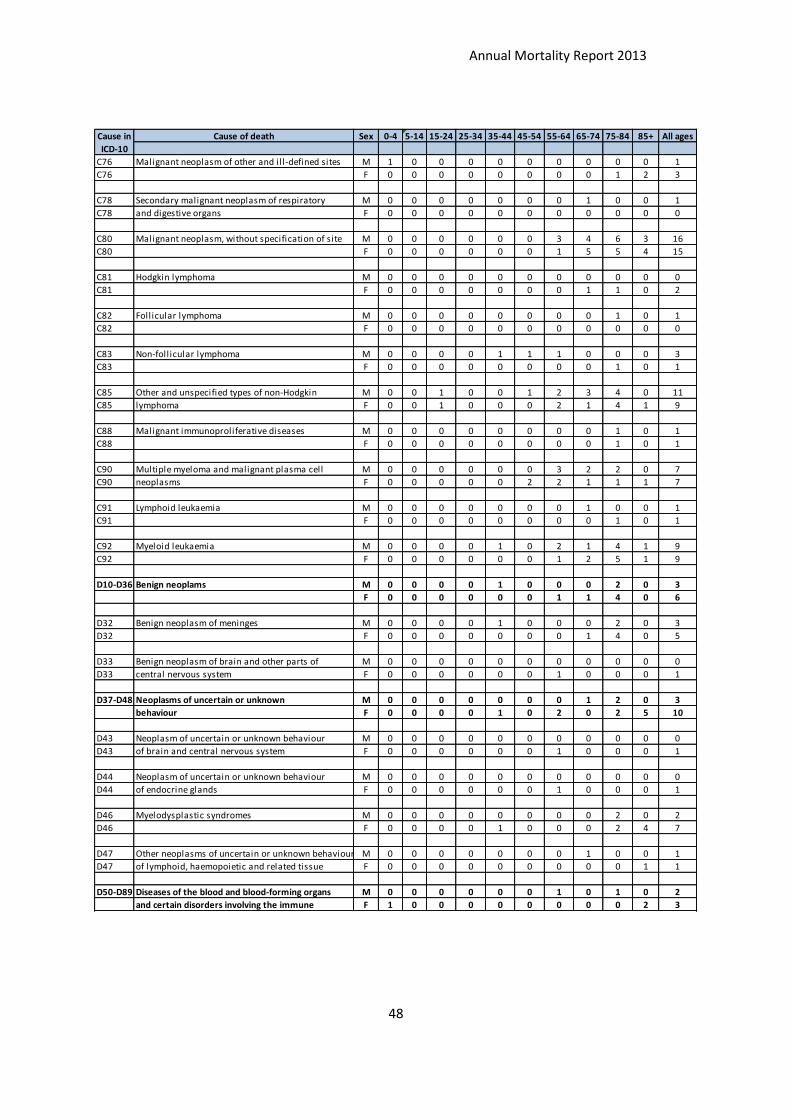
Annual Mortality Report 2013
48
Cause of death Sex 0-4 5-14 15-24 25-34 35-44 45-54 55-64 65-74 75-84 85+ All ages
C76 Malignant neoplasm of other and il l-defined sites M 1 0 0 0 0 0 0 0 0 0 1
C76 F 0 0 0 0 0 0 0 0 1 2 3
C78 Secondary malignant neoplasm of respiratory M 0 0 0 0 0 0 0 1 0 0 1
C78 and digestive organs F 0 0 0 0 0 0 0 0 0 0 0
C80 Malignant neoplasm, without specification of site M 0 0 0 0 0 0 3 4 6 3 16
C80 F 0 0 0 0 0 0 1 5 5 4 15
C81 Hodgkin lymphoma M 0 0 0 0 0 0 0 0 0 0 0
C81 F 0 0 0 0 0 0 0 1 1 0 2
C82 Follicular lymphoma M 0 0 0 0 0 0 0 0 1 0 1
C82 F 0 0 0 0 0 0 0 0 0 0 0
C83 Non-follicular lymphoma M 0 0 0 0 1 1 1 0 0 0 3
C83 F 0 0 0 0 0 0 0 0 1 0 1
C85 Other and unspecified types of non-Hodgkin M 0 0 1 0 0 1 2 3 4 0 11
C85 lymphoma F 0 0 1 0 0 0 2 1 4 1 9
C88 Malignant immunoproliferative diseases M 0 0 0 0 0 0 0 0 1 0 1
C88 F 0 0 0 0 0 0 0 0 1 0 1
C90 Multiple myeloma and malignant plasma cell M 0 0 0 0 0 0 3 2 2 0 7
C90 neoplasms F 0 0 0 0 0 2 2 1 1 1 7
C91 Lymphoid leukaemia M 0 0 0 0 0 0 0 1 0 0 1
C91 F 0 0 0 0 0 0 0 0 1 0 1
C92 Myeloid leukaemia M 0 0 0 0 1 0 2 1 4 1 9
C92 F 0 0 0 0 0 0 1 2 5 1 9
D10-D36 Benign neoplams M 0 0 0 0 1 0 0 0 2 0 3
F 0 0 0 0 0 0 1 1 4 0 6
D32 Benign neoplasm of meninges M 0 0 0 0 1 0 0 0 2 0 3
D32 F 0 0 0 0 0 0 0 1 4 0 5
D33 Benign neoplasm of brain and other parts of M 0 0 0 0 0 0 0 0 0 0 0
D33 central nervous system F 0 0 0 0 0 0 1 0 0 0 1
D37-D48 Neoplasms of uncertain or unknown M 0 0 0 0 0 0 0 1 2 0 3
behaviour F 0 0 0 0 1 0 2 0 2 5 10
D43 Neoplasm of uncertain or unknown behaviour M 0 0 0 0 0 0 0 0 0 0 0
D43 of brain and central nervous system F 0 0 0 0 0 0 1 0 0 0 1
D44 Neoplasm of uncertain or unknown behaviour M 0 0 0 0 0 0 0 0 0 0 0
D44 of endocrine glands F 0 0 0 0 0 0 1 0 0 0 1
D46 Myelodysplastic syndromes M 0 0 0 0 0 0 0 0 2 0 2
D46 F 0 0 0 0 1 0 0 0 2 4 7
D47 Other neoplasms of uncertain or unknown behaviour M 0 0 0 0 0 0 0 1 0 0 1
D47 of lymphoid, haemopoietic and related tissue F 0 0 0 0 0 0 0 0 0 1 1
D50-D89 Diseases of the blood and blood-forming organs M 0 0 0 0 0 0 1 0 1 0 2
and certain disorders involving the immune F 1 0 0 0 0 0 0 0 0 2 3
Cause in
ICD-10
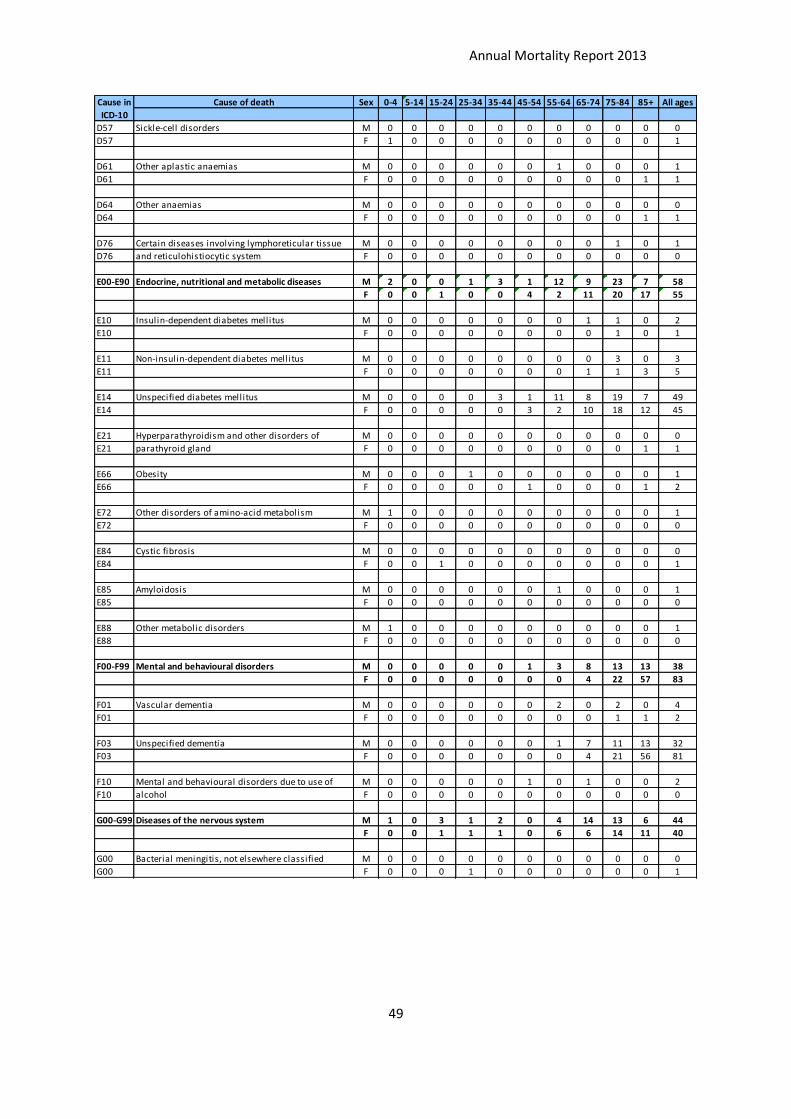
Annual Mortality Report 2013
49
Cause of death Sex 0-4 5-14 15-24 25-34 35-44 45-54 55-64 65-74 75-84 85+ All ages
D57 Sickle-cell disorders M 0 0 0 0 0 0 0 0 0 0 0
D57 F 1 0 0 0 0 0 0 0 0 0 1
D61 Other aplastic anaemias M 0 0 0 0 0 0 1 0 0 0 1
D61 F 0 0 0 0 0 0 0 0 0 1 1
D64 Other anaemias M 0 0 0 0 0 0 0 0 0 0 0
D64 F 0 0 0 0 0 0 0 0 0 1 1
D76 Certain diseases involving lymphoreticular tissue M 0 0 0 0 0 0 0 0 1 0 1
D76 and reticulohistiocytic system F 0 0 0 0 0 0 0 0 0 0 0
E00-E90 Endocrine, nutritional and metabolic diseases M 2 0 0 1 3 1 12 9 23 7 58
F 0 0 1 0 0 4 2 11 20 17 55
E10 Insulin-dependent diabetes mellitus M 0 0 0 0 0 0 0 1 1 0 2
E10 F 0 0 0 0 0 0 0 0 1 0 1
E11 Non-insulin-dependent diabetes mellitus M 0 0 0 0 0 0 0 0 3 0 3
E11 F 0 0 0 0 0 0 0 1 1 3 5
E14 Unspecified diabetes mellitus M 0 0 0 0 3 1 11 8 19 7 49
E14 F 0 0 0 0 0 3 2 10 18 12 45
E21 Hyperparathyroidism and other disorders of M 0 0 0 0 0 0 0 0 0 0 0
E21 parathyroid gland F 0 0 0 0 0 0 0 0 0 1 1
E66 Obesity M 0 0 0 1 0 0 0 0 0 0 1
E66 F 0 0 0 0 0 1 0 0 0 1 2
E72 Other disorders of amino-acid metabolism M 1 0 0 0 0 0 0 0 0 0 1
E72 F 0 0 0 0 0 0 0 0 0 0 0
E84 Cystic fibrosis M 0 0 0 0 0 0 0 0 0 0 0
E84 F 0 0 1 0 0 0 0 0 0 0 1
E85 Amyloidosis M 0 0 0 0 0 0 1 0 0 0 1
E85 F 0 0 0 0 0 0 0 0 0 0 0
E88 Other metabolic disorders M 1 0 0 0 0 0 0 0 0 0 1
E88 F 0 0 0 0 0 0 0 0 0 0 0
F00-F99 Mental and behavioural disorders M 0 0 0 0 0 1 3 8 13 13 38
F 0 0 0 0 0 0 0 4 22 57 83
F01 Vascular dementia M 0 0 0 0 0 0 2 0 2 0 4
F01 F 0 0 0 0 0 0 0 0 1 1 2
F03 Unspecified dementia M 0 0 0 0 0 0 1 7 11 13 32
F03 F 0 0 0 0 0 0 0 4 21 56 81
F10 Mental and behavioural disorders due to use of M 0 0 0 0 0 1 0 1 0 0 2
F10 alcohol F 0 0 0 0 0 0 0 0 0 0 0
G00-G99 Diseases of the nervous system M 1 0 3 1 2 0 4 14 13 6 44
F 0 0 1 1 1 0 6 6 14 11 40
G00 Bacterial meningitis, not elsewhere classified M 0 0 0 0 0 0 0 0 0 0 0
G00 F 0 0 0 1 0 0 0 0 0 0 1
Cause in
ICD-10

Annual Mortality Report 2013
50
Cause of death Sex 0-4 5-14 15-24 25-34 35-44 45-54 55-64 65-74 75-84 85+ All ages
G10 Huntington disease M 0 0 0 1 0 0 0 0 0 0 1
G10 F 0 0 0 0 0 0 3 0 1 0 4
G11 Hereditary ataxia M 0 0 0 0 0 0 1 0 0 0 1
G11 F 0 0 0 0 0 0 0 0 0 0 0
G12 Spinal muscular atrophy and related syndromes M 0 0 0 0 0 0 1 2 0 0 3
G12 F 0 0 0 0 0 0 1 1 2 0 4
G20 Parkinson disease M 0 0 0 0 0 0 0 8 12 5 25
G20 F 0 0 0 0 0 0 0 3 7 10 20
G30 Alzheimer's disease M 0 0 0 0 0 0 0 0 0 1 1
G30 F 0 0 0 0 0 0 1 0 2 0 3
G31 Other degenerative diseases of nervous system, M 0 0 0 0 0 0 0 2 0 0 2
G31 not elsewhere classified F 0 0 1 0 0 0 0 0 0 1 2
G35 Multiple sclerosis M 0 0 0 0 0 0 1 1 0 0 2
G35 F 0 0 0 0 0 0 1 0 0 0 1
G40 Epilepsy M 0 0 0 0 1 0 0 0 0 0 1
G40 F 0 0 0 0 0 0 0 0 1 0 1
G41 Status epilepticus M 0 0 1 0 0 0 0 0 0 0 1
G41 F 0 0 0 0 0 0 0 0 0 0 0
G61 Inflammatory polyneuropathy M 0 0 0 0 0 0 0 0 0 0 0
G61 F 0 0 0 0 0 0 0 1 0 0 1
G70 Myasthenia gravis and other myoneural M 0 0 0 0 0 0 0 1 0 0 1
G70 disorders F 0 0 0 0 0 0 0 0 1 0 1
G71 Primary disorders of muscles M 1 0 1 0 0 0 1 0 1 0 4
G71 F 0 0 0 0 0 0 0 0 0 0 0
G80 Cerebral palsy M 0 0 1 0 1 0 0 0 0 0 2
G80 F 0 0 0 0 1 0 0 0 0 0 1
G81 Hemiplegia M 0 0 0 0 0 0 0 0 0 0 0
G81 F 0 0 0 0 0 0 0 1 0 0 1
I00-I99 Diseases of the circulatory system M 0 0 1 5 7 18 70 128 222 182 633
F 1 0 0 0 2 3 23 71 237 328 665
I10 Essential (primary) hypertension M 0 0 0 0 0 0 0 0 0 1 1
I10 F 0 0 0 0 0 0 0 0 1 0 1
I11 Hypertensive heart disease M 0 0 0 0 0 0 0 2 5 2 9
I11 F 0 0 0 0 0 0 1 4 2 6 13
I12 Hypertensive renal disease M 0 0 0 0 0 0 0 0 0 1 1
I12 F 0 0 0 0 0 0 1 0 0 0 1
I13 Hypertensive heart and renal disease M 0 0 0 0 0 0 0 0 0 2 2
I13 F 0 0 0 0 0 0 0 0 0 0 0
I20 Angina pectoris M 0 0 0 0 0 0 1 1 1 1 4
I20 F 0 0 0 0 0 0 1 0 0 1 2
Cause in
ICD-10

Annual Mortality Report 2013
51
Cause of death Sex 0-4 5-14 15-24 25-34 35-44 45-54 55-64 65-74 75-84 85+ All ages
I21 Acute myocardial infarction M 0 0 0 1 5 5 28 51 67 51 208
I21 F 0 0 0 0 0 1 9 25 68 70 173
I24 Other acute ischaemic heart diseases M 0 0 0 0 0 0 0 0 0 0 0
I24 F 0 0 0 0 0 0 0 0 0 1 1
I25 Chronic ischaemic heart disease M 0 0 0 1 2 6 25 30 66 45 175
I25 F 0 0 0 0 0 1 2 17 45 77 142
I26 Pulmonary embolism M 0 0 0 1 0 0 1 3 2 2 9
I26 F 0 0 0 0 0 0 0 1 4 2 7
I31 Other diseases of pericardium M 0 0 0 0 0 0 0 1 0 0 1
I31 F 0 0 0 0 1 0 1 0 1 1 4
I33 Acute and subacute endocarditis M 0 0 0 0 0 1 0 0 0 0 1
I33 F 0 0 0 0 0 0 0 0 0 0 0
I34 Nonrheumatic mitral valve disorders M 0 0 0 0 0 0 1 0 0 0 1
I34 F 0 0 0 0 0 0 0 0 2 1 3
I35 Nonrheumatic aortic valve disorders M 0 0 0 0 0 0 0 2 3 1 6
I35 F 0 0 0 0 0 0 1 1 1 2 5
I42 Cardiomyopathy M 0 0 0 0 0 1 4 2 0 0 7
I42 F 1 0 0 0 0 0 1 0 2 0 4
I45 Other conduction disorders M 0 0 0 0 0 0 0 0 0 0 0
I45 F 0 0 0 0 0 0 0 0 1 0 1
I46 Cardiac arrest M 0 0 0 0 0 0 0 1 3 1 5
I46 F 0 0 0 0 0 0 0 1 3 6 10
I47 Paroxysmal tachycardia M 0 0 0 0 0 0 0 0 1 0 1
I47 F 0 0 0 0 0 0 0 0 0 0 0
I48 Atrial fibril lation and flutter M 0 0 0 0 0 0 0 0 4 4 8
I48 F 0 0 0 0 0 0 0 0 1 5 6
I50 Heart failure M 0 0 0 1 0 0 0 5 22 27 55
I50 F 0 0 0 0 0 0 1 8 28 58 95
I51 Complications and il l-defined descriptions of heart M 0 0 1 1 0 1 0 0 1 0 4
I51 disease F 0 0 0 0 0 0 0 0 0 1 1
I60 Subarachnoid haemorrhage M 0 0 0 0 0 1 0 0 0 1 2
I60 F 0 0 0 0 0 0 3 0 1 1 5
I61 Intracerebral haemorrhage M 0 0 0 0 0 0 2 5 3 3 13
I61 F 0 0 0 0 0 0 0 3 7 9 19
I62 Other nontraumatic intracranial haemorrhage M 0 0 0 0 0 1 0 1 2 3 7
I62 F 0 0 0 0 1 0 1 0 1 0 3
I63 Cerebral infarction M 0 0 0 0 0 1 1 2 2 3 9
I63 F 0 0 0 0 0 0 0 0 2 2 4
I64 Stroke, not specified as haemorrhage or infarction M 0 0 0 0 0 1 3 16 34 23 77
I64 F 0 0 0 0 0 1 1 8 49 58 117
I67 Other cerebrovascular diseases M 0 0 0 0 0 0 0 1 1 3 5
I67 F 0 0 0 0 0 0 0 0 4 5 9
I69 Sequelae of cerebrovascular disease M 0 0 0 0 0 0 0 0 0 0 0
I69 F 0 0 0 0 0 0 0 0 1 3 4
Cause in
ICD-10
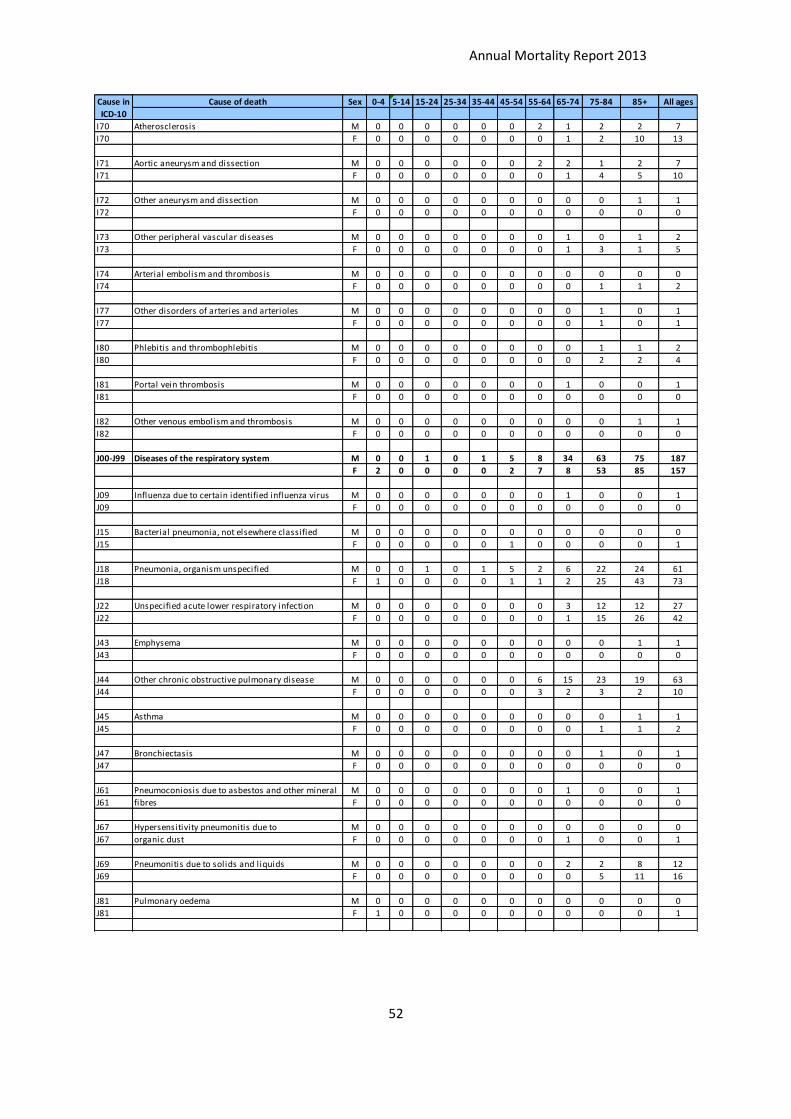
Annual Mortality Report 2013
52
Cause of death Sex 0-4 5-14 15-24 25-34 35-44 45-54 55-64 65-74 75-84 85+ All ages
I70 Atherosclerosis M 0 0 0 0 0 0 2 1 2 2 7
I70 F 0 0 0 0 0 0 0 1 2 10 13
I71 Aortic aneurysm and dissection M 0 0 0 0 0 0 2 2 1 2 7
I71 F 0 0 0 0 0 0 0 1 4 5 10
I72 Other aneurysm and dissection M 0 0 0 0 0 0 0 0 0 1 1
I72 F 0 0 0 0 0 0 0 0 0 0 0
I73 Other peripheral vascular diseases M 0 0 0 0 0 0 0 1 0 1 2
I73 F 0 0 0 0 0 0 0 1 3 1 5
I74 Arterial embolism and thrombosis M 0 0 0 0 0 0 0 0 0 0 0
I74 F 0 0 0 0 0 0 0 0 1 1 2
I77 Other disorders of arteries and arterioles M 0 0 0 0 0 0 0 0 1 0 1
I77 F 0 0 0 0 0 0 0 0 1 0 1
I80 Phlebitis and thrombophlebitis M 0 0 0 0 0 0 0 0 1 1 2
I80 F 0 0 0 0 0 0 0 0 2 2 4
I81 Portal vein thrombosis M 0 0 0 0 0 0 0 1 0 0 1
I81 F 0 0 0 0 0 0 0 0 0 0 0
I82 Other venous embolism and thrombosis M 0 0 0 0 0 0 0 0 0 1 1
I82 F 0 0 0 0 0 0 0 0 0 0 0
J00-J99 Diseases of the respiratory system M 0 0 1 0 1 5 8 34 63 75 187
F 2 0 0 0 0 2 7 8 53 85 157
J09 Influenza due to certain identified influenza virus M 0 0 0 0 0 0 0 1 0 0 1
J09 F 0 0 0 0 0 0 0 0 0 0 0
J15 Bacterial pneumonia, not elsewhere classified M 0 0 0 0 0 0 0 0 0 0 0
J15 F 0 0 0 0 0 1 0 0 0 0 1
J18 Pneumonia, organism unspecified M 0 0 1 0 1 5 2 6 22 24 61
J18 F 1 0 0 0 0 1 1 2 25 43 73
J22 Unspecified acute lower respiratory infection M 0 0 0 0 0 0 0 3 12 12 27
J22 F 0 0 0 0 0 0 0 1 15 26 42
J43 Emphysema M 0 0 0 0 0 0 0 0 0 1 1
J43 F 0 0 0 0 0 0 0 0 0 0 0
J44 Other chronic obstructive pulmonary disease M 0 0 0 0 0 0 6 15 23 19 63
J44 F 0 0 0 0 0 0 3 2 3 2 10
J45 Asthma M 0 0 0 0 0 0 0 0 0 1 1
J45 F 0 0 0 0 0 0 0 0 1 1 2
J47 Bronchiectasis M 0 0 0 0 0 0 0 0 1 0 1
J47 F 0 0 0 0 0 0 0 0 0 0 0
J61 Pneumoconiosis due to asbestos and other mineral M 0 0 0 0 0 0 0 1 0 0 1
J61 fibres F 0 0 0 0 0 0 0 0 0 0 0
J67 Hypersensitivity pneumonitis due to M 0 0 0 0 0 0 0 0 0 0 0
J67 organic dust F 0 0 0 0 0 0 0 1 0 0 1
J69 Pneumonitis due to solids and liquids M 0 0 0 0 0 0 0 2 2 8 12
J69 F 0 0 0 0 0 0 0 0 5 11 16
J81 Pulmonary oedema M 0 0 0 0 0 0 0 0 0 0 0
J81 F 1 0 0 0 0 0 0 0 0 0 1
Cause in
ICD-10
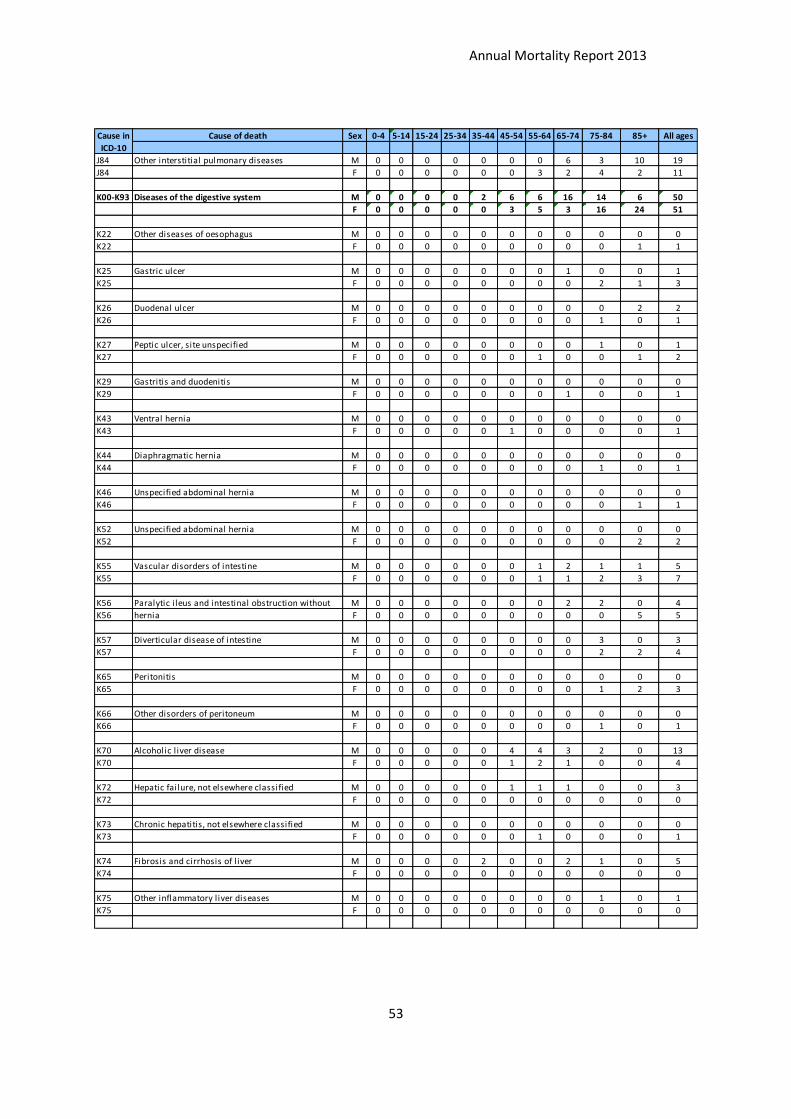
Annual Mortality Report 2013
53
Cause of death Sex 0-4 5-14 15-24 25-34 35-44 45-54 55-64 65-74 75-84 85+ All ages
J84 Other interstitial pulmonary diseases M 0 0 0 0 0 0 0 6 3 10 19
J84 F 0 0 0 0 0 0 3 2 4 2 11
K00-K93 Diseases of the digestive system M 0 0 0 0 2 6 6 16 14 6 50
F 0 0 0 0 0 3 5 3 16 24 51
K22 Other diseases of oesophagus M 0 0 0 0 0 0 0 0 0 0 0
K22 F 0 0 0 0 0 0 0 0 0 1 1
K25 Gastric ulcer M 0 0 0 0 0 0 0 1 0 0 1
K25 F 0 0 0 0 0 0 0 0 2 1 3
K26 Duodenal ulcer M 0 0 0 0 0 0 0 0 0 2 2
K26 F 0 0 0 0 0 0 0 0 1 0 1
K27 Peptic ulcer, site unspecified M 0 0 0 0 0 0 0 0 1 0 1
K27 F 0 0 0 0 0 0 1 0 0 1 2
K29 Gastritis and duodenitis M 0 0 0 0 0 0 0 0 0 0 0
K29 F 0 0 0 0 0 0 0 1 0 0 1
K43 Ventral hernia M 0 0 0 0 0 0 0 0 0 0 0
K43 F 0 0 0 0 0 1 0 0 0 0 1
K44 Diaphragmatic hernia M 0 0 0 0 0 0 0 0 0 0 0
K44 F 0 0 0 0 0 0 0 0 1 0 1
K46 Unspecified abdominal hernia M 0 0 0 0 0 0 0 0 0 0 0
K46 F 0 0 0 0 0 0 0 0 0 1 1
K52 Unspecified abdominal hernia M 0 0 0 0 0 0 0 0 0 0 0
K52 F 0 0 0 0 0 0 0 0 0 2 2
K55 Vascular disorders of intestine M 0 0 0 0 0 0 1 2 1 1 5
K55 F 0 0 0 0 0 0 1 1 2 3 7
K56 Paralytic i leus and intestinal obstruction without M 0 0 0 0 0 0 0 2 2 0 4
K56 hernia F 0 0 0 0 0 0 0 0 0 5 5
K57 Diverticular disease of intestine M 0 0 0 0 0 0 0 0 3 0 3
K57 F 0 0 0 0 0 0 0 0 2 2 4
K65 Peritonitis M 0 0 0 0 0 0 0 0 0 0 0
K65 F 0 0 0 0 0 0 0 0 1 2 3
K66 Other disorders of peritoneum M 0 0 0 0 0 0 0 0 0 0 0
K66 F 0 0 0 0 0 0 0 0 1 0 1
K70 Alcoholic l iver disease M 0 0 0 0 0 4 4 3 2 0 13
K70 F 0 0 0 0 0 1 2 1 0 0 4
K72 Hepatic failure, not elsewhere classified M 0 0 0 0 0 1 1 1 0 0 3
K72 F 0 0 0 0 0 0 0 0 0 0 0
K73 Chronic hepatitis, not elsewhere classified M 0 0 0 0 0 0 0 0 0 0 0
K73 F 0 0 0 0 0 0 1 0 0 0 1
K74 Fibrosis and cirrhosis of l iver M 0 0 0 0 2 0 0 2 1 0 5
K74 F 0 0 0 0 0 0 0 0 0 0 0
K75 Other inflammatory l iver diseases M 0 0 0 0 0 0 0 0 1 0 1
K75 F 0 0 0 0 0 0 0 0 0 0 0
Cause in
ICD-10

Annual Mortality Report 2013
54
Cause of death Sex 0-4 5-14 15-24 25-34 35-44 45-54 55-64 65-74 75-84 85+ All ages
K80 Cholelithiasis M 0 0 0 0 0 0 0 1 1 0 2
K80 F 0 0 0 0 0 0 0 0 2 0 2
K81 Cholecystitis M 0 0 0 0 0 0 0 1 1 0 2
K81 F 0 0 0 0 0 0 0 0 0 1 1
K83 Other diseases of bil iary tract M 0 0 0 0 0 0 0 0 1 1 2
K83 F 0 0 0 0 0 1 0 0 1 0 2
K85 Acute pancreatitis M 0 0 0 0 0 1 0 1 0 1 3
K85 F 0 0 0 0 0 0 0 0 0 2 2
K92 Other diseases of digestive system M 0 0 0 0 0 0 0 2 0 1 3
K92 F 0 0 0 0 0 0 0 0 3 3 6
L00-L99 Diseases of the skin and subcutaneous M 0 0 0 0 0 0 0 1 1 2 4
tissue F 0 0 0 0 0 0 0 0 6 8 14
L03 Cellulitis M 0 0 0 0 0 0 0 0 0 0 0
L03 F 0 0 0 0 0 0 0 0 0 1 1
L10 Pemphigus M 0 0 0 0 0 0 0 0 0 0 0
L10 F 0 0 0 0 0 0 0 0 1 0 1
L89 Decubitus ulcer and pressure area M 0 0 0 0 0 0 0 1 1 2 4
L89 F 0 0 0 0 0 0 0 0 5 7 12
M00-M99 Diseases of the musculoskeletal system and M 0 0 1 0 0 1 0 2 0 0 4
connective tissue F 0 0 0 0 0 0 1 2 5 0 8
M06 Other rheumatoid arthritis M 0 0 0 0 0 0 0 0 0 0 0
M06 F 0 0 0 0 0 0 0 2 1 0 3
M31 Other necrotizing vasculopathies M 0 0 0 0 0 0 0 1 0 0 1
M31 F 0 0 0 0 0 0 0 0 0 0 0
M32 Systemic lupus erythematosus M 0 0 0 0 0 0 0 0 0 0 0
M32 F 0 0 0 0 0 0 1 0 0 0 1
M34 Systemic sclerosis M 0 0 0 0 0 0 0 0 0 0 0
M34 F 0 0 0 0 0 0 0 0 1 0 1
M60 Myositis M 0 0 0 0 0 0 0 0 0 0 0
M60 F 0 0 0 0 0 0 0 0 1 0 1
M62 Other disorders of muscle M 0 0 0 0 0 0 0 0 0 0 0
M62 F 0 0 0 0 0 0 0 0 1 0 1
M72 Fibroblastic disorders M 0 0 1 0 0 1 0 0 0 0 2
M72 F 0 0 0 0 0 0 0 0 1 0 1
M80 Osteoporosis with pathological fracture M 0 0 0 0 0 0 0 1 0 0 1
M80 F 0 0 0 0 0 0 0 0 0 0 0
N00-N99 Diseases of the genitourinary system M 0 0 0 0 1 0 3 9 15 10 38
F 0 0 0 0 0 0 3 4 19 32 58
N04 Nephrotic syndrome M 0 0 0 0 0 0 0 0 0 0 0
N04 F 0 0 0 0 0 0 0 1 0 1 2
N13 Obstructive and reflux uropathy M 0 0 0 0 0 0 1 0 0 0 1
N13 F 0 0 0 0 0 0 1 0 0 0 1
Cause in
ICD-10

Annual Mortality Report 2013
55
Cause of death Sex 0-4 5-14 15-24 25-34 35-44 45-54 55-64 65-74 75-84 85+ All ages
N17 Acute renal failure M 0 0 0 0 0 0 0 0 2 1 3
N17 F 0 0 0 0 0 0 0 1 3 4 8
N18 Chronic kidney disease M 0 0 0 0 1 0 1 2 4 4 12
N18 F 0 0 0 0 0 0 1 0 5 4 10
N19 Unspecified kidney failure M 0 0 0 0 0 0 0 0 1 1 2
N19 F 0 0 0 0 0 0 0 1 3 7 11
N20 Calculus of kidney and ureter M 0 0 0 0 0 0 0 1 0 0 1
N20 F 0 0 0 0 0 0 0 0 0 0 0
N39 Other disorders of urinary system M 0 0 0 0 0 0 1 5 7 4 17
N39 F 0 0 0 0 0 0 1 0 8 16 25
N40 Hyperplasia of prostate M 0 0 0 0 0 0 0 1 1 0 2
N71 Inflammatory disease of uterus, except cervix M 0 0 0 0 0 0 0 0 0 0 0
N71 F 0 0 0 0 0 0 0 1 0 0 1
P00-P96 Certain conditions originating in the M 6 0 0 0 0 0 0 0 0 0 6
perinatal period F 6 0 0 0 0 0 0 0 0 0 6
P01 Fetus and newborn affected by maternal M 0 0 0 0 0 0 0 0 0 0 0
P01 complications of pregnancy F 1 0 0 0 0 0 0 0 0 0 1
P07 Disorders related to short gestation and low M 2 0 0 0 0 0 0 0 0 0 2
P07 birth weight, not elsewhere classified F 0 0 0 0 0 0 0 0 0 0 0
P22 Respiratory distress of newborn M 2 0 0 0 0 0 0 0 0 0 2
P22 F 0 0 0 0 0 0 0 0 0 0 0
P26 Pulmonary haemorrhage originating in the M 1 0 0 0 0 0 0 0 0 0 1
P26 perinatal period F 0 0 0 0 0 0 0 0 0 0 0
P28 Other respiratory conditions originating in M 1 0 0 0 0 0 0 0 0 0 1
P28 the perinatal period F 2 0 0 0 0 0 0 0 0 0 2
P52 Intracranial nontraumatic haemorrhage of M 0 0 0 0 0 0 0 0 0 0 0
P52 fetus and newborn F 2 0 0 0 0 0 0 0 0 0 2
P77 Necrotizing enterocolitis of fetus and M 0 0 0 0 0 0 0 0 0 0 0
P77 newborn F 1 0 0 0 0 0 0 0 0 0 1
Q00-Q99 Congenital malformations, deformations and M 4 0 0 0 0 1 0 0 0 0 5
and chromosomal abnormalities F 4 0 0 0 0 0 0 0 1 0 5
Q21 Congenital malformations of cardiac septa M 1 0 0 0 0 0 0 0 0 0 1
Q21 F 0 0 0 0 0 0 0 0 0 0 0
Q24 Other congenital malformations of heart M 0 0 0 0 0 0 0 0 0 0 0
Q24 F 1 0 0 0 0 0 0 0 0 0 1
Q25 Congenital malformations of great arteries M 0 0 0 0 0 1 0 0 0 0 1
Q25 F 0 0 0 0 0 0 0 0 0 0 0
Q34 Other congenital malformations of M 1 0 0 0 0 0 0 0 0 0 1
Q34 respiratory system F 0 0 0 0 0 0 0 0 0 0 0
Q61 Cystic kidney disease M 0 0 0 0 0 0 0 0 0 0 0
Q61 F 0 0 0 0 0 0 0 0 1 0 1
Cause in
ICD-10
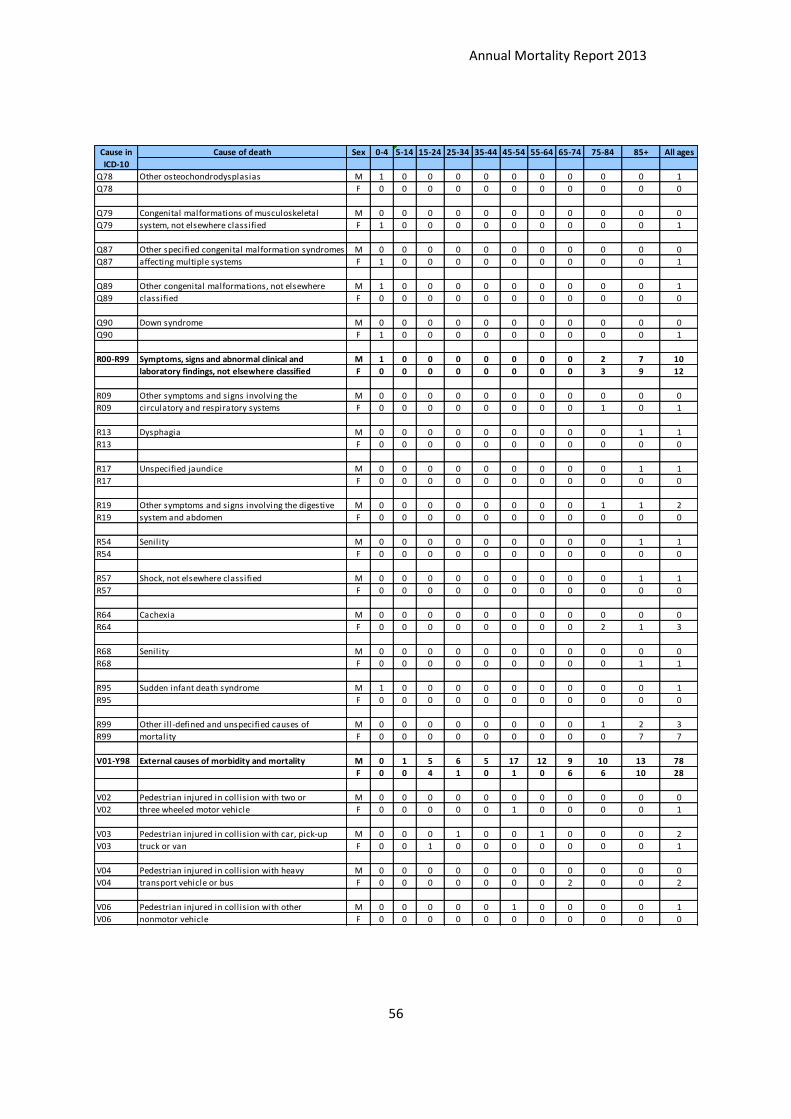
Annual Mortality Report 2013
56
Cause of death Sex 0-4 5-14 15-24 25-34 35-44 45-54 55-64 65-74 75-84 85+ All ages
Q78 Other osteochondrodysplasias M 1 0 0 0 0 0 0 0 0 0 1
Q78 F 0 0 0 0 0 0 0 0 0 0 0
Q79 Congenital malformations of musculoskeletal M 0 0 0 0 0 0 0 0 0 0 0
Q79 system, not elsewhere classified F 1 0 0 0 0 0 0 0 0 0 1
Q87 Other specified congenital malformation syndromes M 0 0 0 0 0 0 0 0 0 0 0
Q87 affecting multiple systems F 1 0 0 0 0 0 0 0 0 0 1
Q89 Other congenital malformations, not elsewhere M 1 0 0 0 0 0 0 0 0 0 1
Q89 classified F 0 0 0 0 0 0 0 0 0 0 0
Q90 Down syndrome M 0 0 0 0 0 0 0 0 0 0 0
Q90 F 1 0 0 0 0 0 0 0 0 0 1
R00-R99 Symptoms, signs and abnormal clinical and M 1 0 0 0 0 0 0 0 2 7 10
laboratory findings, not elsewhere classified F 0 0 0 0 0 0 0 0 3 9 12
R09 Other symptoms and signs involving the M 0 0 0 0 0 0 0 0 0 0 0
R09 circulatory and respiratory systems F 0 0 0 0 0 0 0 0 1 0 1
R13 Dysphagia M 0 0 0 0 0 0 0 0 0 1 1
R13 F 0 0 0 0 0 0 0 0 0 0 0
R17 Unspecified jaundice M 0 0 0 0 0 0 0 0 0 1 1
R17 F 0 0 0 0 0 0 0 0 0 0 0
R19 Other symptoms and signs involving the digestive M 0 0 0 0 0 0 0 0 1 1 2
R19 system and abdomen F 0 0 0 0 0 0 0 0 0 0 0
R54 Senility M 0 0 0 0 0 0 0 0 0 1 1
R54 F 0 0 0 0 0 0 0 0 0 0 0
R57 Shock, not elsewhere classified M 0 0 0 0 0 0 0 0 0 1 1
R57 F 0 0 0 0 0 0 0 0 0 0 0
R64 Cachexia M 0 0 0 0 0 0 0 0 0 0 0
R64 F 0 0 0 0 0 0 0 0 2 1 3
R68 Senility M 0 0 0 0 0 0 0 0 0 0 0
R68 F 0 0 0 0 0 0 0 0 0 1 1
R95 Sudden infant death syndrome M 1 0 0 0 0 0 0 0 0 0 1
R95 F 0 0 0 0 0 0 0 0 0 0 0
R99 Other i l l-defined and unspecified causes of M 0 0 0 0 0 0 0 0 1 2 3
R99 mortality F 0 0 0 0 0 0 0 0 0 7 7
V01-Y98 External causes of morbidity and mortality M 0 1 5 6 5 17 12 9 10 13 78
F 0 0 4 1 0 1 0 6 6 10 28
V02 Pedestrian injured in collision with two or M 0 0 0 0 0 0 0 0 0 0 0
V02 three wheeled motor vehicle F 0 0 0 0 0 1 0 0 0 0 1
V03 Pedestrian injured in collision with car, pick-up M 0 0 0 1 0 0 1 0 0 0 2
V03 truck or van F 0 0 1 0 0 0 0 0 0 0 1
V04 Pedestrian injured in collision with heavy M 0 0 0 0 0 0 0 0 0 0 0
V04 transport vehicle or bus F 0 0 0 0 0 0 0 2 0 0 2
V06 Pedestrian injured in collision with other M 0 0 0 0 0 1 0 0 0 0 1
V06 nonmotor vehicle F 0 0 0 0 0 0 0 0 0 0 0
Cause in
ICD-10
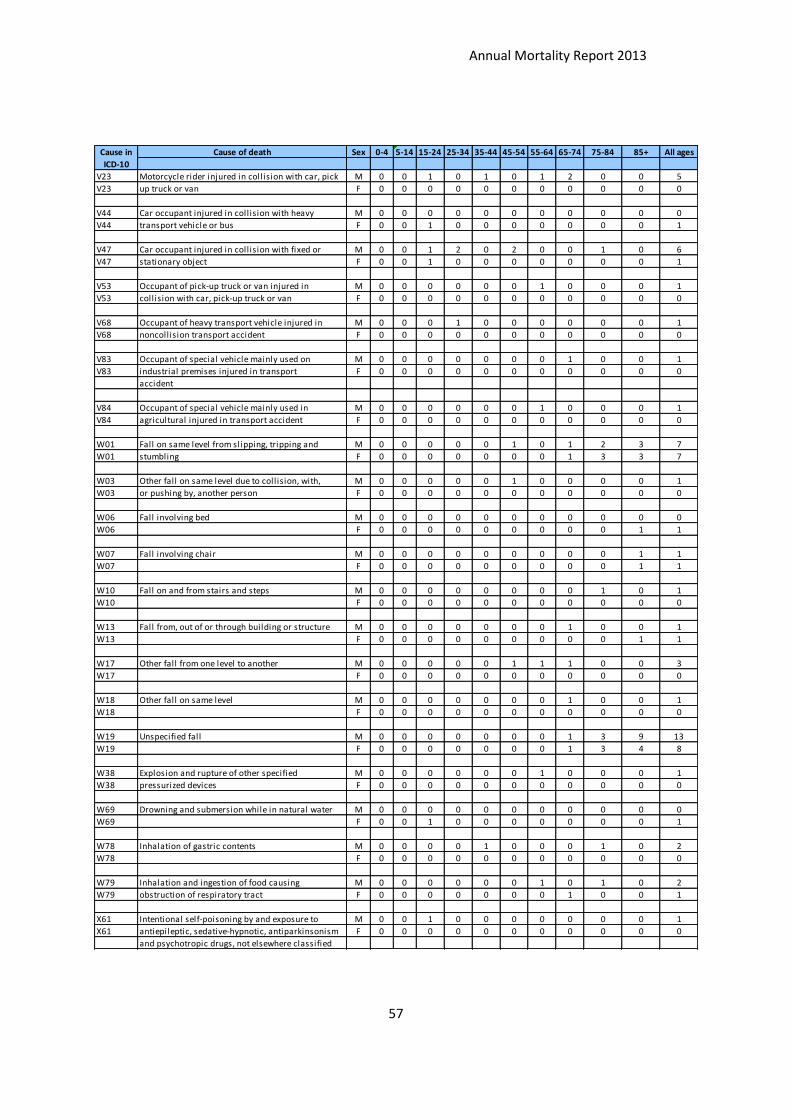
Annual Mortality Report 2013
57
Cause of death Sex 0-4 5-14 15-24 25-34 35-44 45-54 55-64 65-74 75-84 85+ All ages
V23 Motorcycle rider injured in collision with car, pick M 0 0 1 0 1 0 1 2 0 0 5
V23 up truck or van F 0 0 0 0 0 0 0 0 0 0 0
V44 Car occupant injured in collision with heavy M 0 0 0 0 0 0 0 0 0 0 0
V44 transport vehicle or bus F 0 0 1 0 0 0 0 0 0 0 1
V47 Car occupant injured in collision with fixed or M 0 0 1 2 0 2 0 0 1 0 6
V47 stationary object F 0 0 1 0 0 0 0 0 0 0 1
V53 Occupant of pick-up truck or van injured in M 0 0 0 0 0 0 1 0 0 0 1
V53 collision with car, pick-up truck or van F 0 0 0 0 0 0 0 0 0 0 0
V68 Occupant of heavy transport vehicle injured in M 0 0 0 1 0 0 0 0 0 0 1
V68 noncollision transport accident F 0 0 0 0 0 0 0 0 0 0 0
V83 Occupant of special vehicle mainly used on M 0 0 0 0 0 0 0 1 0 0 1
V83 industrial premises injured in transport F 0 0 0 0 0 0 0 0 0 0 0
accident
V84 Occupant of special vehicle mainly used in M 0 0 0 0 0 0 1 0 0 0 1
V84 agricultural injured in transport accident F 0 0 0 0 0 0 0 0 0 0 0
W01 Fall on same level from slipping, tripping and M 0 0 0 0 0 1 0 1 2 3 7
W01 stumbling F 0 0 0 0 0 0 0 1 3 3 7
W03 Other fall on same level due to collision, with, M 0 0 0 0 0 1 0 0 0 0 1
W03 or pushing by, another person F 0 0 0 0 0 0 0 0 0 0 0
W06 Fall involving bed M 0 0 0 0 0 0 0 0 0 0 0
W06 F 0 0 0 0 0 0 0 0 0 1 1
W07 Fall involving chair M 0 0 0 0 0 0 0 0 0 1 1
W07 F 0 0 0 0 0 0 0 0 0 1 1
W10 Fall on and from stairs and steps M 0 0 0 0 0 0 0 0 1 0 1
W10 F 0 0 0 0 0 0 0 0 0 0 0
W13 Fall from, out of or through building or structure M 0 0 0 0 0 0 0 1 0 0 1
W13 F 0 0 0 0 0 0 0 0 0 1 1
W17 Other fall from one level to another M 0 0 0 0 0 1 1 1 0 0 3
W17 F 0 0 0 0 0 0 0 0 0 0 0
W18 Other fall on same level M 0 0 0 0 0 0 0 1 0 0 1
W18 F 0 0 0 0 0 0 0 0 0 0 0
W19 Unspecified fall M 0 0 0 0 0 0 0 1 3 9 13
W19 F 0 0 0 0 0 0 0 1 3 4 8
W38 Explosion and rupture of other specified M 0 0 0 0 0 0 1 0 0 0 1
W38 pressurized devices F 0 0 0 0 0 0 0 0 0 0 0
W69 Drowning and submersion while in natural water M 0 0 0 0 0 0 0 0 0 0 0
W69 F 0 0 1 0 0 0 0 0 0 0 1
W78 Inhalation of gastric contents M 0 0 0 0 1 0 0 0 1 0 2
W78 F 0 0 0 0 0 0 0 0 0 0 0
W79 Inhalation and ingestion of food causing M 0 0 0 0 0 0 1 0 1 0 2
W79 obstruction of respiratory tract F 0 0 0 0 0 0 0 1 0 0 1
X61 Intentional self-poisoning by and exposure to M 0 0 1 0 0 0 0 0 0 0 1
X61 antiepileptic, sedative-hypnotic, antiparkinsonism F 0 0 0 0 0 0 0 0 0 0 0
and psychotropic drugs, not elsewhere classified
Cause in
ICD-10

Annual Mortality Report 2013
58
Cause of death Sex 0-4 5-14 15-24 25-34 35-44 45-54 55-64 65-74 75-84 85+ All ages
X62 Intentional self-poisoning by and exposure to M 0 0 0 1 0 1 0 0 0 0 2
X62 narcotics and psychodysleptics (hallucinogens) F 0 0 0 1 0 0 0 0 0 0 1
not elsewhere classified
X70 Intentional self-harm by hanging, strangulation and M 0 1 0 1 1 4 2 0 1 0 10
X70 suffocation F 0 0 0 0 0 0 0 0 0 0 0
X73 Intentional self-harm by rifle, shotgun and M 0 0 0 0 0 1 0 0 0 0 1
X73 larger firearm discharge F 0 0 0 0 0 0 0 0 0 0 0
X74 Intentional self-harm by other and unspecified M 0 0 0 0 1 0 0 0 0 0 1
X74 firearm discharge F 0 0 0 0 0 0 0 0 0 0 0
X79 Intentional self-harm by blunt object M 0 0 0 0 0 1 0 0 0 0 1
X79 F 0 0 0 0 0 0 0 0 0 0 0
X80 Intentional self-harm by jumping from a high place M 0 0 1 0 1 1 2 0 0 0 5
X80 F 0 0 0 0 0 0 0 0 0 0 0
X93 Assault by handgun discharge M 0 0 0 0 0 1 0 1 0 0 2
X93 F 0 0 0 0 0 0 0 0 0 0 0
X94 Assault by rifle, shotgun and larger firearm M 0 0 0 0 0 0 1 0 0 0 1
X94 discharge F 0 0 0 0 0 0 0 0 0 0 0
X99 Assault by sharp object M 0 0 1 0 0 1 0 0 0 0 2
X99 F 0 0 0 0 0 0 0 0 0 0 0
Y02 Assault by pushing or placing victim before M 0 0 0 0 0 1 0 0 0 0 1
Y02 moving object F 0 0 0 0 0 0 0 0 0 0 0
Y17 Poisoning by and exposure to other gases M 0 0 0 0 0 0 0 0 0 0 0
Y17 and vapours, undetermined intent F 0 0 0 0 0 0 0 1 0 0 1
Cause in
ICD-10

Annual Mortality Report 2013
59