Annual Investment Plan - OPERSOhio Public Employees Retirement System 277 East Town Street,...
54
Ohio Public Employees Retirement System 277 East Town Street, Columbus, Ohio 43215 1.800.222.7377 | www.opers.org 2018 ANNUAL INVESTMENT PLAN Defined Benefit Fund Health Care 115 Trust Fund Ohio Public Employees Retirement System
Transcript of Annual Investment Plan - OPERSOhio Public Employees Retirement System 277 East Town Street,...

Ohio Public Employees Retirement System277 East Town Street, Columbus, Ohio 43215 1.800.222.7377 | www.opers.org
2018ANNUAL INVESTMENT PLAN
Defined Benefit Fund Health Care 115 Trust Fund
Ohio Public Employees Retirement System


TABLE OF CONTENTS
Contents
CHIEF INVESTMENT OFFICER’S LETTER _____________________________________ 1
EXECUTIVE SUMMARY ____________________________________________________ 4
FUND STRATEGIES _______________________________________________________ 7
TACTICAL OUTLOOK _____________________________________________________ 17
ASSET CLASS STRATEGIES _______________________________________________ 24
POLICIES, COMMITTEES, AND RESOURCES _________________________________ 33
INVESTMENT ORGANIZATION STRUCTURE __________________________________ 42
STAFF DIRECTORY ______________________________________________________ 43


CHIEF INVESTMENT OFFICER’S LETTER
OPERS 2018 INVESTMENT PLAN Page 1
CHIEF INVESTMENT OFFICER’S LETTER On behalf of the Investments Division, I am pleased to report a very successful investment year for OPERS Funds in 2017. Most would define our success as achieving returns that were twice our 7.5% actuarial target return, at over 16%. This letter takes a closer look at the definition of success in pension plan investing.
I begin by examining and celebrating accomplishments, while highlighting why they are important. The second part of my letter puts the year’s results in broader perspective.
Major Highlights from 2017
Market returns in 2017 were 16.8% and 15.2% for OPERS Defined Benefit and Health Care Plans, respectively. For the 10-years ended in 2017, returns are 5.8% and 5.4% for Defined Benefit and Health Care Funds, respectively, indicating that both Funds are still recovering from the Global Financial Crisis a decade ago.
Staff produced returns in 2017 that were above benchmarks after subtracting all manager costs. These returns above the benchmark are referred to as “excess” or “active” returns and they were 1.6%and 0.9% in the Defined Benefit and Health Care Funds, respectively. These equate to $1.1 billion in excess returns for Defined Benefit Fund and $0.1 billion for Health Care Fund in 2017.
Active returns in 2017 were the best since OPERS began keeping these records in 2002.
Active return results in 2017 validate Staff’s ability to continue to produce returns above a simple passive implementation of the allocation over time on a cost-effective basis.
Active returns have contributed $2.8 billion toward member benefits since 2002. This means that 3.2% of existing Plan assets have come from the value added by Staff in implementing the Board’s investment allocation.
$29 $53 $59
$698
$(121)
$153
$(54)
$(545)
$415
$805
$(479)
$82
$775
$124
$(277)
$1,092
$(800)
$(600)
$(400)
$(200)
$-
$200
$400
$600
$800
$1,000
$1,200
2002 2003 2004 2005 2006 2007 2008 2009 2010 2011 2012 2013 2014 2015 2016 2017
Yearly Excess Returns in millions
Excess Returns in millions

CHIEF INVESTMENT OFFICER’S LETTER
OPERS 2018 INVESTMENT PLAN Page 2
Additional Highlights
Both total returns and the active returns in the Defined Benefit Plan would have been far less without the contribution from our investments in illiquid (private) assets, principally private equity and private real estate. As an example, the 10-year returns for private equity and real estate are 9.9% and 7%, respectively, versus the 10-year total return for the Plan at just 5.8%.
Good markets “raised all boats” In 2017. However, comparing ourselves to peers as of 12/31/2017 shows OPERS Defined Benefit Fund was ranked in the top quarter of the comparison universe (23rd percentile) for the year, as well as for the last three years (21st percentile). Staff’s excess returns achievement is reflected in these results versus our peers.
The total value of investments under management for all OPERS Funds (Defined Benefit, Health Care and Defined Contribution) reached $100 billion for the first time.
Hedge funds returned 7.2%, twice the return of the Bloomberg Barclays U.S. Aggregate Index which is the performance benchmark for the other major stabilization asset in the allocation (core bonds for the 5-year period ended in 2017).
Excess returns were produced very broadly across all investment teams and in all but three asset classes or strategies, as seen in the chart below:
Perspective on Returns
While the Investments Staff did an outstanding job last year measured by excess returns, and the markets themselves rewarded investors very well, OPERS reminds audiences that it must remain a long-term investor focused on multi-decade results. We use a 7.5% actuarial return target in Defined Benefit planning. Good years like 2017 help to balance out the bad years like 2016 that had very low returns or years like 2008 that had very negative returns.
7.02%
4.47%
2.13% 1.87% 1.76% 1.56% 1.48%0.89% 0.63%
0.21% 0.19% 0.09% 0.05% 0.02%
-0.12% -0.14%-0.53%-1.00%
0.00%
1.00%
2.00%
3.00%
4.00%
5.00%
6.00%
7.00%
8.00% Asset Classes/Strategies Excess Returns: 2017

CHIEF INVESTMENT OFFICER’S LETTER
OPERS 2018 INVESTMENT PLAN Page 3
OPERS began the year with a $34 billion shortfall from its long-term investment return expectations.
Defined Benefit Expected Return Shortfall (2007-2016)
Beginning asset balance on 12/31/2007 $70 Billion
Expected ending value if 8% earned each year $112 Billion
Ending value using actual 4.7% annual return $78 Billion
Investment return shortfall $34 Billion
So what is the significance of superior market returns for a single year? The well-above average market returns in 2017 amortize a portion of the existing shortfall in the defined benefit plan. Yet more than $25 billion of shortfall remains.
A robust and secure pension requires many inputs over time: your own contributions, your employer’s contributions, an investments team that keeps expenses as low as possible, very capable executive management and oversight, and many, many individual years of market returns on contributions – just to name a few. Contributions rates do not change frequently. But market returns are different every year. When we earn 16% in a particular year, it balances lower returns in other years. Therefore, many years of “good” market returns are needed if we expect to average 8% (or 7.5% currently).
OPERS is a mature pension plan with over eighty years of existence. All mature pension plans pay out more in benefits than they receive in contributions, and this means that the timing of market returns on its existing portfolio impacts OPERS. Paying out more in benefits than it receives in contributions in years when markets fall, means there is less money at work when markets are recovering. In the extreme, this condition could even require plan design changes.
To make sure OPERS has the most money at work in the markets in years of market recovery like 2017, it is important to build the allocation with an eye focused on stability of returns as well as size of returns. The Trustees have done this.
In summary, success in pension plan investing requires meeting actuarial investment return assumptions while mitigating the large swings in returns. Staff must implement the allocation successfully, and OPERS returns must be competitive with pension peers who pursued different allocation approaches to pursue the same goals. Finally, success requires that we beat indexed portfolios over time, in order to add to assets and to demonstrate the high quality of the investment implementation, as the Investments Staff did in 2017 and has done successfully since at least 2002.
Respectfully,
Richard D. Shafer, CFA
Chief Investment Officer
January 17, 2018

EXECUTIVE SUMMARY
OPERS 2018 INVESTMENT PLAN Page 4
EXECUTIVE SUMMARY
The following Summary outlines the strategies, asset allocation, and asset class strategies for OPERS Defined Benefit and Health Care 115 (“HC 115”) Trust Funds. This Summary also discusses initiatives and resources as well as performance and risk expectations.
FUND STRATEGIES
The Defined Benefit and Health Care Funds will initiate transitioning toward their dynamic asset allocations approved by the OPERS Retirement Board in January 2018. Staff plans to complete these transitions by the first quarter of 2018, depending on the market environment. Within asset classes, adjustments will be made where portfolio liquidity can be improved for little give-up in return expectation and where internal management of assets provides a better expected net return.
The following table outlines the projected base case returns with ranges for the Defined Benefit and Health Care 115 Trust Funds. The base case return expectations are lower than in 2017 for both the Defined Benefit and Health Care 115 Trust Funds largely due to lower expected returns for all asset classes. The active return for both Funds are unchanged from 2017.
Base Case Return Active Tracking Information
Return* Range Return Error Ratio
2018 6.91 -6.69 to 20.51 0.42 1.05 0.40
2017 7.18 -6.72 to 21.08 0.42 1.05 0.40
2018 6.26 -6.14 to 18.66 0.31 0.78 0.40
2017 6.41 -6.09 to 18.91 0.31 0.78 0.40
Defined Benefit Fund - - - - - - % - - - - - - - - - - - % - - - - - -
HC 115 Trust Fund
*Base Case Return incudes the active return
The active returns shown above incorporate an information ratio of 0.40. This ratio measures the active return per unit of tracking error (active risk).
Additional details regarding the Defined Benefit and Health Care 115 Trust Funds strategies are included later in this Annual Investment Plan.

EXECUTIVE SUMMARY
OPERS 2018 INVESTMENT PLAN Page 5
ASSET ALLOCATION AND ASSET CLASS STRATEGIES
The Public Equity benchmark allocation in the Defined Benefit and Health Care 115 Trust Funds is changed from the global weighting of U.S. Equity and Non-U.S. Equity based on the MSCI All Country World Index-Investable Market Index (“MSCI ACWI-IMI”) to fixed target weights for both Funds. Below is the summary of the Public Equity benchmark asset allocation recommendation, which reflects the positive bias on the Non-U.S. Asset Class.
Defined Benefit Fund Current Asset Allocation New Asset Allocation Net Change
U.S. Equity 20.3% 19.0% -1.3%
Non-U.S. Equity 18.7% 20.0% 1.3%
Total Equity 39.0% 39.0% 0.0%
Health Care 115 Trust Fund Current Asset Allocation New Asset Allocation Net Change
U.S. Equity 22.4% 21.0% -1.4%
Non-U.S. Equity 20.6% 22.0% 1.4%
Total Equity 43.0% 43.0% 0.0%
Within the Fixed Income asset class, several changes in the sub asset allocation will be implemented for both Funds. After building out an internal high yield team and strategy during 2017, the internal Fixed Income team plans to integrate the current internal high yield portfolio of assets into a newly created Core Plus portfolio with a target allocation of 1%. Below is the summary of dynamic asset allocation recommendation.
Defined Benefit Fund Current Asset Allocation New Asset Allocation Net Change
Core Fixed 8.3% 10.3% 2.0%
High Yield 2.7% 1.7% -1.0%
Emerging Markets Debt 7.0% 6.0% -1.0%
Health Care 115 Trust Fund Current Asset Allocation New Asset Allocation Net Change
Core Fixed 15.3% 17.3% 2.0%
High Yield 2.7% 1.7% -1.0%
Emerging Markets Debt 7.0% 6.0% -1.0% Other initiatives within the traditional asset classes are being considered in order to manage a greater proportion of assets internally. These will be discussed as they are developed and will be part of a multi-year effort to continue to control risks and remain cost-effective. But they are implementation initiatives, not changes in allocation. Within the Alternatives, Risk Parity, and GTAA Asset Classes, no strategic allocation changes are expected.
The Fund Management Committee will continue to monitor overall fund asset allocation and exposures, rebalancing as appropriate in observance of Board Policies.

EXECUTIVE SUMMARY
OPERS 2018 INVESTMENT PLAN Page 6
Resources
The Investments Division Staff is comprised of 67 budgeted positions as of January 2018. Staff biographies are provided in the Appendix.
The Investments Division submitted an estimated compensation and operating budget of $27.5 million for 2018. The budget includes the Finance Division’s estimate of the 2018 incentive compensation payout, based on the prior year’s budget. The budget includes the Investments Division’s internal investment management expenses.
Staff estimates the total cost to manage the OPERS asset base at 66.8 basis points or $664.5 million. The cost assumes a long-term growth trend in the fund’s asset base, whereas an unanticipated bear market would reduce the cost. While asset allocation (e.g. alternatives vs. traditional investments) and investment structure (internal management of portfolio vs. external management) are main drivers of investment expenses, success also raises fees (e.g. some managers get a slice of profits, and appreciation of asset values raises the total amount of assets on which fees are charged). The cost estimate also includes tens of millions of dollars in fees to private equity and private real estate managers that are repaid to OPERS along with its other capital contributions when investments are sold. To this extent, fee estimates can be overstated by material amounts. All returns reported in this AIP are net of all fees. Fees are discussed in greater details in later pages.

FUND STRATEGIES
OPERS 2018 INVESTMENT PLAN Page 7
FUND STRATEGIES
DEFINED BENEFIT FUND
Expected Asset Growth – Defined Benefit Fund
The table below summarizes Staff’s estimate (base case) of market values and ranges for the Defined Benefit Fund at December 31, 2018. Pessimistic and optimistic cases are also provided for reference.
Defined Benefit Fund
2018 Expected Asset Growth
Pessimistic Base Optimistic
Case Case Case
12/31/17 Market Value ($ billions) $86.00 $86.00 $86.00
Expected Total Return -6.69% 6.91% 20.51%
Expected Investment Gain ($ billions) -$5.76 $5.94 $17.64
Expected Cash Flow ($ billions) -$3.60 -$3.60 -$3.60
12/31/18 Market Value ($ billions) $76.64 $88.34 $100.04
Estimated Market Values, Returns and Cash Flows
The anticipated beginning market value of $86 billion for December 31, 2017 is derived by a smoothing projection from the actual market value as of November 30, 2017.

FUND STRATEGIES
OPERS 2018 INVESTMENT PLAN Page 8
Asset Allocation – Defined Benefit Fund
The 2018 target asset allocation and ranges for the Defined Benefit Fund reflect an estimate by Staff of the expected progress to be made toward dynamic asset allocation targets recommended by NEPC at the January 2018 Board meeting. Also included are Board approved policy asset allocation target, which was initially approved by the Board in June 2016 as part of the asset-liability study, and dynamic asset allocation targets approved by the Board in January 2017. The asset allocations for a peer group of large pension plans as of June 2017 is listed in the last column for reference.
12/31/2017 12/31/2018 Board Policy Peer
Estimated Target Target Range Group*
Public Equity 40.90% 40.90% 39.00% 31% to 47% 49.96%
U.S. Equity 22.00% 20.90% 20.10% Mkt. Wgt. ± 5% 28.16%
Non-U.S. Equity 18.90% 20.00% 18.90% Mkt. Wgt. ± 5% 21.80%
Fixed Income 23.00% 23.00% 23.00% 16% to 30% 22.85%
Core Fixed 8.90% 10.30% 8.30% 7% to 13% 17.25%
Core Plus 0.00% 1.00% 1.00% 0% to 2% 0.00%
Emerging Markets Debt 7.00% 6.00% 7.00% 3% to 9% 1.59%
Floating Rate Debt 0.10% 0.00% 0.00% 0% to 2% 0.01%
Securitized Debt 1.00% 1.00% 1.00% 0% to 2% 0.09%
High Yield 3.00% 1.70% 2.70% 0% to 5% 2.33%
TIPS 2.00% 2.00% 2.00% 1% to 3% 1.50%
U.S. Treasury 1.00% 1.00% 1.00% 0% to 2% 0.08%
Alternatives 29.10% 29.10% 31.00% 22% to 40% 23.88%
Private Equity 10.00% 10.00% 10.00% 5% to 15% 9.54%
Real Estate 10.00% 10.00% 10.00% 5% to 15% 9.42%
Hedge Funds 8.00% 8.00% 8.00% 4% to 12% 3.37%
Opportunistic 0.10% 0.10% 2.00% 0% to 4% 0.01%
Commodities 1.00% 1.00% 1.00% 0% to 2% 1.54%
Risk Parity 5.00% 5.00% 5.00% 2% to 8% 0.45%
GTAA 2.00% 2.00% 2.00% 0% to 4% 0.50%
Other 2.36%
Total Defined Benefit Fund 100.00% 100.00% 100.00% 100.00%
Asset Class
*The asset allocations are derived from the organizations in the Peer Group Comparison section on page 41.

FUND STRATEGIES
OPERS 2018 INVESTMENT PLAN Page 9
Active Return Active Return Target Tracking
Average Performance Performance Tracking Error Target
Allocation Objectives Contribution Error Range Information
(%) (bps) (bps) (bps) (bps) Ratio
U.S. Equity 20.9% 20 4 50 0-100 0.40
Non-U.S. Equity 20.0% 60 12 150 0-300 0.40
Fixed Income 23.0% 20 5 50 0-200 0.40
Alternatives 29.1% 63 18 500 250-750 0.13
Risk Parity 5.0% 0 0 100 0-200 NA
GTAA 2.0% 160 3 400 0-800 0.40
Defined Benefit Fund 100.0% NA 42 105 0-300 0.40
Schedule of Expected Performance and Volatility
The above table shows a projected active management contribution of 42 basis points to the Defined Benefit Fund’s return. The estimated tracking error of 105 basis points indicates a 68% probability that the active return will be in a range of -63 basis points to +147 basis points. This interval is calculated by subtracting the tracking error from, and adding the tracking error to, the expected active return. The projected active management contribution to the Defined Benefit Fund performance is unchanged from 2017.

FUND STRATEGIES
OPERS 2018 INVESTMENT PLAN Page 10
Return and Risk – Defined Benefit Fund
The performance objectives for the Defined Benefit Fund are to: (1) exceed the return of the Policy benchmark within an appropriately risk-constrained framework, net of investment fees and expenses: and (2) exceed the actuarial interest rate over a reasonably longer time horizon. The Policy benchmark combines designated market indices for asset classes, weighted by asset allocation targets. Asset class targets and benchmarks are set by the OPERS Retirement Board.
The return estimates in the following table were derived from the asset class return expectations developed by the OPERS Retirement Board’s retained Investment Advisor, NEPC. The single-point estimate return of 6.91% is comprised of an expected return of 6.49% from the policy mix and an additional contribution of 0.42% from active management, net of fees.
In the following table, Staff divides return and risk into two components.
Policy: The return and risk derived from the policy asset allocation and the intermediate term return and risk forecast of the underlying asset classes
Active: The return and risk associated with deviations from benchmark allocations at either the asset class level or portfolio level. It reflects the potential impact to relative performance from deviating from the asset class policy allocation targets, and from individual portfolio active risk
The Policy Return and Active Return are calculated as weighted averages of expected returns and expected alphas of each sub-asset class.

FUND STRATEGIES
OPERS 2018 INVESTMENT PLAN Page 11
Asset Classes Pessimistic Base Optimistic
Public Equity -11.54% 7.15% 25.84%
U.S. Equity -12.80% 5.50% 23.80%
Non-U.S. Equity -13.36% 8.34% 30.04%
Fixed Income -3.19% 3.71% 10.61%
Core Fixed -3.24% 2.75% 8.74%
Core Plus -3.73% 3.23% 10.19%
Emerging Markets Debt -7.88% 5.22% 18.32%
Securitized Debt -9.25% 3.75% 16.75%
High Yield -9.25% 3.75% 16.75%
TIPS -3.25% 3.25% 9.75%
U.S. Treasury -3.25% 2.25% 7.75%
Alternatives -6.71% 6.99% 20.69%
Private Equity -15.00% 8.00% 31.00%
Real Estate -7.51% 6.49% 20.49%
Hedge Funds -2.99% 5.71% 14.41%
Opportunistic -12.25% 5.25% 22.75%
Commodities -14.25% 4.75% 23.75%
Risk Parity -11.35% 6.75% 24.85%
GTAA -8.39% 6.51% 21.41%
Policy Return -6.41% 6.49% 19.39%
Sources of Return Pessimistic Base Optimistic
Policy -6.41% 6.49% 19.39%
Active -0.63% 0.42% 1.47%
Total Return -6.69% 6.91% 20.51%
Sources of Variability Information Sharpe
Risk Risk Ratio Ratio*
Policy 12.90% 0.35
Active 1.05% 0.40
Total Risk 13.60% 0.36
*In Sharpe Ratio, 2% (5-7 year Cash Return) is used as risk free rate.
2018 Policy Return Assumptions
2018 Total Return Assumptions
2018 Total Risk and Active Risk Assumptions

FUND STRATEGIES
OPERS 2018 INVESTMENT PLAN Page 12
HEALTH CARE 115 TRUST FUND
Expected Asset Growth – Health Care 115 Trust Fund
The table below summarizes Staff’s estimate (base case) of market values and ranges for the Health Care 115 Trust Fund at December 31, 2018. Pessimistic and optimistic cases are also provided for reference.
Health Care 115 Trust Fund
2018 Expected Asset Growth
Pessimistic Base Optimistic
Case Case Case
12/31/17 Market Value ($ millions) $12.80 $12.80 $12.80
Expected Total Return -6.14% 6.26% 18.66%
Expected Investment Gain ($ millions) -$0.79 $0.80 $2.39
Expected Cash Flow ($ millions) -$1.32 -$1.32 -$1.32
12/31/18 Market Value ($ millions) $10.69 $12.28 $13.87
Estimated Market Values, Returns and Cash Flows
The anticipated beginning market value of $12.80 billion for December 31, 2017 is derived by a
smoothing projection from the actual market value as of November 30, 2017.

FUND STRATEGIES
OPERS 2018 INVESTMENT PLAN Page 13
Asset Allocation – Health Care 115 Trust Fund
The 2018 target asset allocation and ranges for the Health Care 115 Trust Fund reflect an estimate by Staff of the expected progress to be made toward dynamic asset allocation targets recommended by NEPC at January 2018 Board meeting. Also included are Board approved policy asset allocation target, which was initially approved by the Board in December 2016 as part of the asset-liability study, and dynamic asset allocation targets approved by the Board in January 2017. There is no peer universe of public pension plans with separate health care funds to compare to.
12/31/2017 12/31/2018 Board Policy
Estimated Target Target Range
Public Equity 44.90% 44.90% 43.00% 34% to 52%
U.S. Equity 24.10% 22.90% 22.20% Mkt. Wgt. ± 5%
Non-U.S. Equity 20.80% 22.00% 20.80% Mkt. Wgt. ± 5%
Fixed Income 34.00% 34.00% 34.00% 24% to 44%
Core Fixed 15.90% 17.30% 15.30% 12% to 23%
Core Plus 0.00% 1.00% 1.00% 0% to 2%
Emerging Markets Debt 7.00% 6.00% 7.00% 3% to 11%
Floating Rate Debt 0.10% 0.00% 0.00% 0% to 2%
Securitized Debt 1.00% 1.00% 1.00% 0% to 2%
High Yield 3.00% 1.70% 2.70% 0% to 4%
TIPS 6.00% 6.00% 6.00% 3% to 9%
U.S. Treasury 1.00% 1.00% 1.00% 0% to 2%
Alternatives 14.10% 14.10% 16.00% 11% to 21%
REITs 6.00% 6.00% 6.00% 3% to 9%
Hedge Funds 6.00% 6.00% 6.00% 3% to 9%
Opportunistic 0.10% 0.10% 2.00% 0% to 4%
Commodities 2.00% 2.00% 2.00% 0% to 4%
Risk Parity 5.00% 5.00% 5.00% 2% to 8%
GTAA 2.00% 2.00% 2.00% 0% to 4%
HC 115 Trust Fund 100.00% 100.00% 100.00%
Asset Class

FUND STRATEGIES
OPERS 2018 INVESTMENT PLAN Page 14
Average Performance Performance Tracking Error Target
Allocation Objectives Contribution Error Range Information
(%) (bps) (bps) (bps) (bps) Ratio
U.S. Equity 22.9% 20 5 50 0-100 0.40
Non-U.S. Equity 22.0% 60 13 150 0-300 0.40
Fixed Income 34.0% 20 7 50 0-200 0.40
Alternatives 14.1% 24 3 300 200-400 0.08
Risk Parity 5.0% 0 0 100 0-200 NA
GTAA 2.0% 160 3 400 0-800 0.40
HC 115 Trust Fund 100.0% NA 31 78 0-300 0.40
The above table shows an anticipated active management contribution of 31 basis points to the Health Care 115 Trust Fund’s return. The estimated tracking error of 78 basis points indicates a 68% probability that the active return will be in a range of -47 basis points to +109 basis points. This interval is calculated by subtracting the tracking error from, and adding the tracking error to, the expected active return. The expected active management contribution to the Health Care 115 Trust Fund performance for 2017 was 31 basis points.

FUND STRATEGIES
OPERS 2018 INVESTMENT PLAN Page 15
Return and Risk – Health Care 115 Trust Fund
The performance objective for the Health Care 115 Trust Fund is to exceed the return of the Policy benchmark within an appropriately risk-constrained framework, net of investment fees and expenses. The Policy benchmark combines designated market indices for asset classes, weighted by asset allocation targets. Asset class targets and benchmarks are set by the OPERS Retirement Board.
The return estimates in the table below were derived from the asset class return expectations developed by the OPERS Retirement Board’s retained Investment Advisor, NEPC. The single-point estimate return of 6.26% is comprised of an expected return of 5.95% from the policy mix and an additional contribution of 0.31% from active management, net of fees.
In the following table, Staff divides return and risk into two components.
Policy: The return and risk derived from the policy asset allocation and the intermediate term return and risk forecast of the underlying asset classes
Active: The return and risk associated with deviations from benchmark allocations at either the asset class level or portfolio level. It reflects the potential impact to relative performance from deviating from the asset class policy allocation targets, and from individual portfolio active risk
The Policy Return and Active Return are calculated as weighted averages of expected returns or expected alphas of each sub-asset class.

FUND STRATEGIES
OPERS 2018 INVESTMENT PLAN Page 16
Asset Classes Pessimistic Base Optimistic
Public Equity -11.54% 7.15% 25.84%
U.S. Equity -12.80% 5.50% 23.80%
Non-U.S. Equity -13.36% 8.34% 30.04%
Fixed Income -2.63% 3.46% 9.55%
Core Fixed -3.24% 2.75% 8.74%
Core Plus -3.73% 3.23% 10.19%
Emerging Markets Debt -7.88% 5.22% 18.32%
Securitized Debt -9.25% 3.75% 16.75%
High Yield -9.25% 3.75% 16.75%
TIPS -3.25% 3.25% 9.75%
U.S. Treasury -3.25% 2.25% 7.75%
Alternatives -6.66% 6.24% 19.14%
REITs -14.50% 6.50% 27.50%
Hedge Funds -2.99% 5.71% 14.41%
Opportunistic -12.25% 5.25% 22.75%
Commodities -14.25% 4.75% 23.75%
Risk Parity -11.35% 6.75% 24.85%
GTAA -8.39% 6.51% 21.41%
Policy Return -6.13% 5.95% 18.03%
Sources of Return Pessimistic Base Optimistic
Policy -6.13% 5.95% 18.03%
Active -0.47% 0.31% 1.09%
Total Return -6.14% 6.26% 18.66%
Sources of Variability Information Sharpe
Risk Risk Ratio Ratio*
Policy 12.08% 0.33
Active 0.78% 0.40
Total Risk 12.40% 0.34
*In Sharpe Ratio, 2% (5-7 year Cash Return) is used as risk free rate.
2018 Policy Return Assumptions
2018 Total Return Assumptions
2018 Total Risk and Risk Attribution Assumptions

TACTICAL OUTLOOK
OPERS 2018 INVESTMENT PLAN Page 17
TACTICAL OUTLOOK
The following tactical outlooks provide a background and context for the asset class strategies for the Defined Benefit and Health Care 115 Trust Funds. There are two components of the tactical outlook: the capital markets observations and the asset class outlook. The Investment Advisors (NEPC and Aon Hewitt Investment Consulting), retained by OPERS Retirement Board, provided these outlooks for 2018.
Capital Markets Observations
Key Market Themes are relatively constant going into 2018. Extended U.S. Economic Cycle Federal Reserve Gradualism China Transitions Globalization Backlash
Market stability has been persistent; A strong positive for risk assets. Stability is seen both in the volatility of asset classes but also the minimal variation
in growth and inflation rates.
Economic conditions remain supportive of equities but likely provide less of a tailwind. We continue to encourage an overweight tilt to non-US equities. However, potential catalyst of US tax reform and repatriation of foreign cash can
spur further US equity gains with benefits also flowing to non-US equities. While we view equities positively in a pro-risk environment, we will look for
opportunities to manage portfolio volatility should market stability breakdown.
Prioritize additional actions that aid in reducing total portfolio volatility or provide exposures that mitigate market drawdowns.
Look to rebalance “safe haven” fixed income exposure back to targets. Other actions include adding systematic global macro or long volatility exposures.
U.S. Equity Outlook
Valuations remain elevated; however pockets of opportunities exist as bond proxies have been bid up to risky levels while more economically sensitive segments look more attractive.
U.S. corporate profitability is near an all-time high which does pose some risk.
Other risks remain high market valuations (for all financial assets) and extreme low volatility; anything causing these to revert to mean would be a detriment to portfolios.
Non-U.S. Equity Outlook
Relative valuations for developed market stocks are attractive.
Maintain overweight exposure to non-U.S. developed market equities as multi-year earnings recovery offers the potential for elevated return.

TACTICAL OUTLOOK
OPERS 2018 INVESTMENT PLAN Page 18
Improving economic conditions within Europe and shareholder friendly actions in Japan
Non-US small cap strategies offer the best opportunity to exploit inefficiencies in the market and complement global implementation.
Continue to favor emerging markets equity given a positive China controlled deleveraging story and broad-based improving fundamentals for EM economies and businesses.
Possibility of a sustained multi-year earnings growth offer great return potential for emerging markets equity; valuations still look attractive.
Within emerging markets equity, we continue to like small cap for more idiosyncratic opportunities and more diversified, pure local market drivers.
Fixed Income Outlook
Both Investment Grade and High Yield credit spreads remain tight. While spreads may remain range bound for the near term, we do not feel investors
are being compensated for the credit risk they are taking in corporate credit (HY and IG).
High Yield Corporate returns have been strong year-to-date, however a majority of this has been from coupon income. Should spreads widen in the future, much of this return year-to-date return will be washed away.
We continue to favor Senior Floating Rate Bank Loans believing investors can benefit from the floating rate coupon in a rising rate environment, seniority in the capital structure, and higher recoveries should we encounter another default cycle. We remain cautious on the increased issuance of covenant-lite loans.
Credit Cycle We believe that we are in the later stages of the current cycle, however there is no
definitive end in sight. Domestic market investor sentiment is positive. Many believe the current cycle will
progress into 2018 with positive fundamental data supporting current sentiment. Global markets have continued to overlook events which were previous thought to
be catalysts of volatility, as seen in the recent European votes, however we anticipate continued global monitoring of the geopolitical environment in Europe (ex: Catalonia).
Looking ahead, we see signs that defaults in high yield may have peaked in the previous year, and may continue to trend down gradually, though defaults in bank loans are still low versus historical averages.
Relative to last year, we continue to expect a dampening return outlook, heightened volatility, and an increase in treasury yields.
In the U.S. – a potential shift toward fiscal spending could result in upward pressure on inflation – TIPS could be a defensive portfolio hedge.
Spreads are priced close to perfection; markets not leaving much ability to absorb shocks.
Abroad – key upcoming European events might introduce further political tail risks similar to Brexit and the U.S. election.
New issuance in 2018 is expected to come in line with, or higher than total 2017 issuance.

TACTICAL OUTLOOK
OPERS 2018 INVESTMENT PLAN Page 19
Globally, not much has changed in developed sovereign credits where a large part remains in negative yield territories. The Rates hike cycle completely diverged in a lot of places between emerging markets and developed markets, emerging market inflation in check.
Emerging markets debt continue its rally, spreads on the sovereign hard currency and corporates are getting tight, opportunities remain in local where real rates differentials are high and emerging market currencies remain cheap.
Positive emerging markets equity outlook also provide flows support for emerging markets currencies.
Real Assets Outlook
Commodity markets continue to make progress towards equilibrium. Most commodities have been trading below the marginal cost of production for an
extended period, resulting in capex cuts and reduced output. The coordinated OPEC cuts should bode well for the price of oil. Improvements in the Chinese economy may generate an increase in broad
commodity consumption. Long-only commodities remain unattractive given negative roll yield.
o Some commodity curves have begun to shift, with backwardation in the outer years, but contango persists in near-term.
Within U.S. REITs favorable supply demand imbalances should continue to lead to strong cash flow and dividend growth.
REIT returns are normalizing; valuations are high and volatility is expected in the near term.
Midstream/MLPs have underperformed despite company balance sheets generally improving.
This may make for an attractive entry- or rebalancing-point.
Natural Resource Equities have continued to perform well. Valuations remain attractive; outperformance may continue if commodity prices
stabilize.
Listed infrastructure offers low yields while adding volatility. Significant exposure from broader equity benchmarks limits diversification benefits. Select areas (such as midstream/MLPs) are better accessed directly.
Private Equity Update & Outlook
2018’s private equity (PE) exit activity is expected to fall from the peak levels experienced in 2016 and 2017. New investment activity is expected to be difficult due to signs of overheating in several areas of the industry:
Purchase price multiples for new investments are at all-time highs and are expected to continue fueled by easy credit and an abundance of dry powder (capital committed but not yet drawn down).

TACTICAL OUTLOOK
OPERS 2018 INVESTMENT PLAN Page 20
Older deals completed before the Global Financial Crisis have largely been exited and the remaining deals are not yet mature; new investments are now held longer as high purchase price multiples require greater operational changes to drive value.
Total fundraising in 2018 is expected to fall from the peak levels of 2016 and 2017; dry powder has reached a new peak of $1.3 trillion, 78% of which is less than three years old.
While allocations to PE have generally been increasing amongst institutional investors, the combination of a slowdown in exit activity and new investments is causing many investors to reach their target allocation to PE in the coming year
The number of new deals has been declining since 2015, and the aggregate value of those deals began to fall in 2017. “Add on” deals are likely to continue increasing as a proportion of total deals, as managers work to reduce overall purchase price multiples and seek ways to drive value.
Managers with strong track records will continue to raise larger funds, often with only one close. Appetite for the best-performing funds is high, potentially pushing those managers to raise too much capital.
Capital markets are robust with high valuations and high availability of debt. Purchase prices continue to run at peak levels of 10.3x and 10.1x EBITDA, for
Large-cap and Mid-cap deals, respectively. Debt continues to be broadly available at very borrower friendly terms hovering near
peak leverage levels. There are no indications this trend will slow. If rates increase we could see a slowdown, but do not expect an increase in defaults as many financing packages were done with little to no covenants.
Growth in the U.S. has been slow but steady with two recent stronger quarters and projected to grow at a moderate 2.83% in 2018. Europe overall is at a slower rate with little to point to as a catalyst for near-term increased growth. Asia is mixed depending on the region but overall expected to show stronger growth of ~5.5%.
Venture capital is seeing increasing interest as evidenced by funds raised, deals done and dry powder. We expect 2018 to experience similar interest.
Strong recent venture returns have lured investors back to this riskier sub-asset class as they seek higher returns.
Investment activity remains at high levels, although below the 2015 – 2016 peaks. Non- traditional investors like hedge funds and mutual funds are now also competing for investments in this space - especially in late stage financing rounds.
Recent vintage funds have seen strong returns, and valuations are high for almost all deal stages.
Consistent with last year, technology and healthcare companies are flush with cash and continue to seek growth through acquisition.
2018 is not a year to “double down” on private equity but rather stay the course and selectively invest in promising managers / strategies. Even in downturns, top-performing managers generate solid returns. There are pockets of attractive investment strategies within all sectors of private equity.

TACTICAL OUTLOOK
OPERS 2018 INVESTMENT PLAN Page 21
We favor investment in all sectors over multiple vintage years in order to avoid overexposure to any one strategy or economic cycle as one cannot time the market and good funds to be raised in any vintage year. It may be prudent to temper allocations to secondary investments, mezzanine strategies, mega cap buyout funds and venture, especially late stage venture investing.
As always, manager selection will be the key to generating the best returns with a current focus on choosing managers with strong operational capabilities and high levels of valuation discipline on new deals.
Real Estate Update & Outlook
The U.S. economy is expected to maintain measured growth over the near term, continuing to support the commercial U.S. real estate sector in 2018. That said, the current real estate cycle is mature, and thus more susceptible to downside volatility. Returns for the asset class are past their peak for this cycle, and have since moderated back in line with the sector’s long-run average. Continued moderation is to be expected for the asset class, with returns likely to dip below the sector’s long-run average (approximately 7%) over the next year.
Fundamentals for the U.S. commercial real estate sector are generally healthy, albeit moderating, and can be expected to remain on solid footing moving into 2018:
Vacancy rates across the four main property types have reached, or even fallen below, their pre-global financial crisis lows driven by new supply largely failing to meet demand, which has helped to support NOI growth. However, this trend has started to turn. The expectation is that over the next two years, new supply will outstrip the pace of demand, driving vacancy rates up slightly and slowing rent growth.
Transaction volume, while still elevated historically, has been declining for most property types for some time now. This is being driven by a growing disconnect between buyers’ and sellers’ return expectations. Liquidating high-quality stabilized assets into the marketplace is holding up best.
On a relative basis across multiple asset classes, real estate remains attractive. Persistently low interest rates have made for a healthy spread between real estate cap rates and the 10-year U.S. Treasury, offering a buffer as interest rates rise
Several broader market risk factors remain active:
Heightened economic and political uncertainty o Elevated uncertainty creates the potential for higher volatility and increases
risks to real estate investors due to potential changes in interest rates, trade agreements, demand patterns, and the like.
o New capital deployed in 2018 will likely need to ride out a cyclical downturn in the asset class, especially if deployed in closed-end fund structures.
TACTICAL OUTLOOK
OPERS 2018 INVESTMENT PLAN Page 22
We are recommending that institutional investors consider the following actions given that the current market environment represents more downside risk than upside potential:
Consider portfolio structure and other long-term, risk-mitigating measures to manage liquidity and interest rate sensitivities over the medium-term period
Incorporate risk-mitigating tools into portfolios given the current mature point in the real estate cycle
o Prepare portfolio for downward pressure on rent growth, and eventually on pricing
o Real estate debt, secondary market offerings, and preferred equity can help to mitigate cyclical risks over the medium-term period
Hedge Fund Update & Outlook
Our expectations for 2017 were that shifts in the capital markets and world economies would lead to improved hedge fund returns on both a relative and absolute basis. During the past year, hedge fund performance has improved with the trailing one-year return for the HFR Fund Weighted Composite at 7.2% through September versus 5.0% for the previous twelve months. An increase in cross-sectional security return dispersion was likely the biggest driver of increased opportunity for hedge funds.
Hedge fund flows for the year have been a net positive $2.9 billion whereas in 2016 they were a net negative of -$70 billion. While these net flow numbers are both small relative to the more than $3 trillion in total allocated to the space, it is encouraging to see positive net investment in this space again.
At the strategy level, returns were generally strong in 2017, with the notable exception of macro strategies. Discretionary macro strategies generally suffered in 2017 with a variety of widely unanticipated events such as the impact of the Trump election. Systematic macro strategies have also suffered as persistent trends have been scarce and reversals common. Through September, CTAs are down around -5.0% and the HRF Discretionary Macro Index is up only about 2.8%, trailing most other hedge fund categories.
Event-driven strategies were one of the better-performing areas for the past twelve months with returns reaching into the low double digits for some sub-strategies, such as distressed and special situations. Distressed strategy returns, in particular, have been quite idiosyncratic and dependent on where the manager was invested. Equity long-short funds also performed well although they continue to lag the long-only stock market.
We have seen an increasing number of opportunistic drawdown funds launched by hedge fund managers in 2017, particularly to take advantage of developments in Europe. European banks are being required to divest of non-core assets at prices that hedge funds find attractive. The banks have also taken a step back from many lending markets they used to serve, creating a void that hedge funds have begun to fill. We find these opportunistic funds attractive because: 1) we find the investment thesis compelling and 2) we believe that the fund structure is well matched to the liquidity of the underlying assets.
TACTICAL OUTLOOK
OPERS 2018 INVESTMENT PLAN Page 23
In addition to opportunistic drawdown funds, Alternative Risk Premia (ARP) strategies have started to gain traction among investors. We believe these funds can serve an attractive role as either an initial allocation to alternatives or as a complement to other hedge fund strategies. ARP strategies attempt to exploit well-documented investor behaviors such as a preference for dividend paying securities or common measures of relative value. These behaviors, or alternative risk premia, are accessed through a quantitative implementation, both long and short, across a range of asset classes. They are just now becoming available in well sorted out, low fee and liquid vehicles.
We also believe that event-driven strategies should continue to enjoy a fertile environment in 2018, although the opportunity set will likely evolve from mergers to more distressed-oriented opportunities. The timing of this transition will depend on the stock market taking a pause and the bond market becoming less willing to finance any issuer with a pulse.
The thought of stock markets taking a pause at the same time that credit spreads widen would represent more of a material change than many investors may realize. Conventional wisdom has bonds providing the “anchor” in a portfolio -- the risk offset to more growth-oriented assets, such as stocks. Recently that pairing has worked exceptionally well. Not only has a 60/40 stock/bond portfolio produced exceptional returns but since January, 2000 bonds have had on average a slightly negative correlation to stocks. Stocks and bonds have not, however, always behaved in this manner. From January, 1976 through December 1999 the rolling correlation averaged a positive 0.4. If we return to that sort of environment it will be much more difficult to diversify risks across portfolios using only conventional asset classes. Investments in hedge funds and other alternative strategies may prove much more valuable when we are not enjoying such strong diversification benefits from bonds in addition to a strong run in stocks.
Financial markets are notoriously difficult to predict and many aspects of the current market have little historic precedence, making the task even harder. That said, the current economic expansion has been going for quite some time and there are signs that we may be further along in the cycle than markets are discounting. We are starting to see labor market tightness, industrial commodities have ticked up in price and Europe and Japan are starting to respond to their vigorous Quantitative Easing programs. Recent market performance has obfuscated the benefits of diversification – simple US stock and bond portfolios have handily outperformed more complex portfolios. The benefits of hedge funds and other alternative strategies may become more apparent as the cycle progresses and longer term market dynamics return. History doesn’t repeat itself but it often rhymes.

ASSET CLASS STRATEGIES
OPERS 2018 INVESTMENT PLAN Page 24
ASSET CLASS STRATEGIES
PUBLIC EQUITY
The Defined Benefit and Health Care 115 Trust Fund’s Public Equity allocation is unchanged from 2017. However, the Public Equity benchmark allocation in the Defined Benefit and Health Care 115 Trust Funds is changed from the global weighting of U.S. Equity and Non-U.S. Equity based on the MSCI All Country World Index-Investable Market Index (“MSCI ACWI-IMI”) to fixed target weights for both Funds. Below is the summary of the Public Equity benchmark asset allocation recommendation, which reflects the positive bias on the Non-U.S. Asset Class.
Defined Benefit Fund Current Asset Allocation New Asset Allocation Net Change
U.S. Equity 20.3% 19.0% -1.3%
Non-U.S. Equity 18.7% 20.0% 1.3%
Total Equity 39.0% 39.0% 0.0%
Health Care 115 Trust Fund Current Asset Allocation New Asset Allocation Net Change
U.S. Equity 22.4% 21.0% -1.4%
Non-U.S. Equity 20.6% 22.0% 1.4%
Total Equity 43.0% 43.0% 0.0%
Sub-asset class allocations within the Non-U.S. Equity asset class are currently in alignment with the custom strategic benchmark (“custom benchmark”) approved by the Board in July 2011. The custom benchmark includes an allocation to the Emerging Markets small cap segment (4%) and an explicit allocation to Developed Markets small cap securities (10%). The custom benchmark is composed of 55% MSCI World Index (ex U.S.) Standard Index; 10% MSCI World Index (ex U.S.) Small Cap Index; 31% MSCI Emerging Markets Standard Index; and 4% MSCI Emerging Markets Small Cap Index. This structure reflects a strategic overweight to Emerging Markets compared to the Emerging Markets allocation of MSCI All Country World Index ex U.S. Investable Markets Index (“MSCI ACWI ex U.S. IMI”). The Investments Division has established a significant base of internally managed Non-U.S. Equity portfolios.
The following table shows the benchmarks and performance objectives for the Public Equity asset class.

ASSET CLASS STRATEGIES
OPERS 2018 INVESTMENT PLAN Page 25
Alpha Target
Target Tracking Target
(net of fees) Error Information
Benchmark (bps)* (bps) Ratio
U.S. Equity Russell 3000 20 50 0.40
Non-U.S. Equity Custom Benchmark 60 150 0.40
Public Equity Asset CalssAlpha Target and Target Tracking Error
*bps = basis points
In addition to traditional actively managed and index-oriented portfolios, OPERS internally manages four smart beta portfolios in the Public Equity asset class. Smart beta strategies employ weighting schemes that differ from traditional capitalization-weighted indices and seek to position the portfolio with exposure to attractive styles or factors which are expected to outperform. These strategies are systematic, rules-based approaches constructed using quantitative modeling techniques. The internal quantitative management group manages these strategies. Staff is performing additional research and dedicating resources to further develop the capabilities to internally develop models for creating additional smart beta strategies. The objective is to implement a new smart beta strategy in the Public Equity asset class in 2018. Staff also Investigates return enhancement opportunities in the funding swap or beta areas for possible inclusion in equity portfolios, cash portfolios or in the Opportunistic allocation.
FIXED INCOME
After building out an internal high yield team and strategy during 2017, the internal Fixed Income team plans to integrate the current internal high yield portfolio of assets into a newly created Core Plus portfolio. The internal high yield allocation will remain of a higher credit quality bias, with the remaining Core Plus portfolio assets reallocated from a portion of the existing internal Core Fixed portfolio.
Within the Fixed Income asset class, several changes in the sub asset allocation will be implemented for both Funds. Below is the summary of dynamic asset allocation recommendation.
Defined Benefit Fund Current Asset Allocation New Asset Allocation Net Change
Core Fixed 8.3% 10.3% 2.0%
High Yield 2.7% 1.7% -1.0%
Emerging Markets Debt 7.0% 6.0% -1.0%
Health Care 115 Trust Fund Current Asset Allocation New Asset Allocation Net Change
Core Fixed 15.3% 17.3% 2.0%
High Yield 2.7% 1.7% -1.0%
Emerging Markets Debt 7.0% 6.0% -1.0%

ASSET CLASS STRATEGIES
OPERS 2018 INVESTMENT PLAN Page 26
The Floating Rate Debt portfolio will continue to be phased out in an orderly fashion. U.S. Treasury sub-asset class was created as a part of 2016 NEPC dynamic asset allocation recommendation, which was approved by the OPERS Retirement Board in its January 2016 meeting. The move from Floating Rate Debt to U.S. Treasury allocation would result in the improvement in liquidity of the Funds. Additional liquidity from U.S. Treasury portfolio will be valuable if the corporate credit markets continue to be strained in 2018, as is observed by the Investment advisor, NEPC. Treasury account should be the “last resort source” to be tapped for benefit payments during extremely distressed and correlated market events.
The following table shows the benchmarks and performance objectives for the Fixed Income asset class.
Alpha Target
Target Tracking Target
(net of fees) Error Information
Benchmark (bps)* (bps) Ratio
Core Fixed Bloomberg Barclays Aggregate 30 75 0.40
Core Plus Custom Benchmark** 30 75 0.40
Emerging Markets Debt EMD Custom Benchmark*** 92 230 0.40
Securitized Debt Securitized Debt Custom Benchmark**** 80 200 0.40
High Yield Bloomberg Barclays U.S. High Yield 34 170 0.20
TIPS Bloomberg Barclays TIPS 0 15 NA
U.S Treasury Bloomberg Barclays U.S. Treasury 0 30 NA
Alpha Target and Target Tracking Error
Fixed Income Asset Class
*bps = basis points
** 65/35 mix of the Bloomberg Barclays U.S. Aggregate Index & Bloomberg Barclays VLI BB Index
*** 50/50 mix of the JP Morgan EM Bond Index Global & the JP Morgan Government Bond Index- Emerging Markets Global Diversified **** 50/50 mix of the Bloomberg Barclays Non-Agency Investment Grade CMBS: Bbb Total Return Index Unhedged USD & Bloomberg Barclays Non-Agency CMBS Agg Eligible Total Return Index Value Unhedged USD

ASSET CLASS STRATEGIES
OPERS 2018 INVESTMENT PLAN Page 27
Securities Lending
In the securities lending program, Staff utilizes multiple lending agents to maximize lending revenue. Staff strives to hire agents who provide competitive fee splits, while providing risk controls and expertise in the asset class being loaned. We are biased toward lending assets in an auction environment so borrowers are providing maximum revenue in a competitive environment on a regular basis. In 2018, Staff will continue lending the Treasury and Agency assets in-house. This effort has increased revenues from Treasury lending. The collateral from the securities lending program is managed internally. The combination of lending revenue and investment income comprise the total securities lending performance. We continue to explore lending of other asset classes, as well as other opportunities that may increase revenue generated from securities lending and cash management.
Cash Management
The cash portfolios are managed with a low-to-moderate risk profile that results in principal preservation while exceeding the performance of the respective benchmarks. The benchmark for the OPERS Short Term Investment Funds (“STIF”) is the Merrill Lynch 3-month Treasury Bill Index. The benchmark for the Securities Lending STIF and the Key/MBS STIF is the Overnight Bank Funding Rate published on a daily basis by the Federal Reserve Bank of NY.
.

ASSET CLASS STRATEGIES
OPERS 2018 INVESTMENT PLAN Page 28
ALTERNATIVES
The Alternatives Asset Class is composed of Private Equity, Real Estate, Hedge Funds, Opportunistic, REITs, and Commodities investment strategies. The Defined Benefit and Health Care 115 Trust Funds invest in different sub-asset classes and weightings in the Alternatives Asset Class to meet their unique investment objectives.
The following table summarizes the benchmark, performance objectives and tracking error for the various alternative investment strategies utilized within the Fund.
Alpha Target
Target Tracking Target
(net of fees) Error Information
Benchmark (bps) (bps) Ratio
Private Equity State Street Private Equity Index 100 700 0.14
Real Estate Net NFI-ODCE + 0.85% 40 700 0.06
Hedge Funds Custom Benchmark* 50 400 0.13
Opportunistic Custom Benchmark** 16 40 0.40
REITs DJ U.S. Select RESI 0 10 NA
Commodities S&P GSCITR Index 36 90 0.40
Alternatives Asset ClassAlpha Target and Target Tracking Error
* Weighted average of underlying strategies in page 30
** Market cap weighted average of underlying investments benchmark returns
Private Equity
The Private Equity Program (“Program”) is approximately 1.1% above its 10% target allocation in the Defined Benefit Fund (“Fund”). The allocation percentage was fairly steady at 11% +/-10 basis points throughout 2017, even though the Program’s market value increased. Staff expects the Private Equity allocation to be 50 to 100 basis points above its target allocation for several years, assuming the value of the overall Defined Benefit Fund stays flat. If the value of the overall Defined Benefit Fund increases, as it did last year, then the allocation will likely approach its 10% target by early 2020.
Staff expects Private Equity to near its target allocation through a combination of factors: the cash flow profile of secondary funds, the harvesting of primary funds committed to in 2010-2013, the ongoing robust environment for selling companies, and the reduced amount of commitments made and expected to be made during 2014-2019 compared to 2010 and 2011.
Staff anticipates committing $1 billion to a number of existing managers who are expected to raise new funds during 2018. Over the next several years Staff will focus on re-ups with existing managers. However, if Staff decides to allocate capital to new managers in the near-term, it will likely be in the following strategies: U.S. small to middle market buyout, energy, and emerging

ASSET CLASS STRATEGIES
OPERS 2018 INVESTMENT PLAN Page 29
markets. Co-investment is an important component of the Program with a 12.4% allocation, near the 15% target. Staff will continue to focus on growing the co-investment program to reach its target allocation of 15%. Improved terms for OPERS will continue to be a priority for Staff with the expectation of continuing our successful results of reducing the costs of the Program.
Real Estate
Private market real estate has a target allocation to the Defined Benefit (“DB”) Fund of 10.0%. The portfolio began 2017 with an estimated market value of $8.02 billion or 10.4% of the DB Fund and at the end of November had a market value of $7.57 billion or 8.8% of the DB Fund. The Health Care 115 Trust (“HC 115”) has a target real estate allocation of 6.0%, and this exposure is obtained through investments in publicly traded real estate securities known as Real Estate Investment Trusts or REITs. The value of the REIT portfolio was $717.32 million or 6.1% of the HC 115 at the beginning of 2017 and had a market value of $773.25 million or 6.0% of the HC Fund at the end of November.
Total returns for domestic private market commercial real estate continued to moderate in 2017. The NFI-ODCE produced a trailing one-year gross return of 7.66% as of 3Q 2017, after producing double digit gross returns in six of the prior seven calendar years.
Staff expects current income will drive domestic commercial real estate returns in 2018. Staff believes cap rates have plateaued and future appreciation will come from increases in net operating income. Staff expects property fundamentals will remain healthy due to growth in GDP, the low unemployment rate and modest levels of new construction.
Staff’s goal for 2018 is to discover and exploit niches that have strong demand drivers but currently attract less institutional capital, which should lead to portfolio outperformance. Staff intends to investigate investment themes that are driven by (1) demographic trends, (2) consumer behavior and (3) capital markets conditions.
Changes in housing preferences by ageing Baby Boomers and maturing Millennials are two demographic trends Staff intends to investigate. Staff believes there will be opportunities to develop apartments that cater to seniors who no longer want the responsibilities of home ownership. Staff also sees a niche to develop or redevelop apartments located in good public school districts that target young families who are in search of more space. Staff also believes the increased demand for health care services from an aging population will create an opportunity to develop health care facilities.
The growth of on-line retail and the changes in supply chain management is driving the demand for state-of-the-art warehouse buildings. Staff intends to continue the current strategy of the selective

ASSET CLASS STRATEGIES
OPERS 2018 INVESTMENT PLAN Page 30
development of modern industrial buildings. Staff sees consumer demand for properties that provide a “walkable live-work-play” environment. Staff will continue to seek development and redevelopment opportunities of mixed-use assets that contain residential, office and retail assets.
Staff realizes the domestic commercial real estate market is late in the recovery cycle. Staff intends to sell assets where capital is plentiful and invest where capital is scarce. Staff anticipates it will to continue to sell Core assets when buyers are aggressively pricing these properties and the future return expectations are modest. Staff plans to continue to reduce the exposure to first-loss positons and deploy capital into first mortgage debt, subordinate debt and preferred equity positions. The focus will continue to be on assets that do not have stabilized cash flows and the supply of debt is limited, as is the case for development or redevelopment projects. Staff will also focus on real estate secondaries where OPERS can earn a return premium by providing liquidity. Staff anticipates the Non-Core percentage of the portfolio will increase in 2018 as OPERS sells stabilized properties and invests in properties that do not yet have stabilized cash flows. Finally, Staff intends to use leverage in moderation on the portfolio.
Hedge Funds
The Hedge Funds sub-asset class is near its target allocations of 8% in the Defined Benefit Fund, and 6% in the Health Care Fund. In 2018, Staff will focus on: 1) increasing exposure to funds with low correlation to equity and bond markets, and 2) continuing to improve the fee structure through negotiations with existing managers and adding lower cost strategies.
Hedge Funds Strategy Allocation Target and Range for 2018
Strategy Target Range
Equity Hedge 20% 0-35%
Event Driven 30% 0-40%
Relative Value 25% 0-35%
Macro/Tactical 25% 0-35%
Opportunistic
The Opportunistic sub-asset class is intended to permit investments in assets or strategies not presently contemplated in the respective Defined Benefit or Health Care 115 Trust Funds. The maximum size for any single benchmarked strategy is 0.5% of the total fund. The Opportunistic allocation currently contains an Interest Rate and Volatility portfolio which provides exposure to the U.S. interest rate and volatility markets using a combination of Treasuries, futures and options. The benchmark is the Barclays U.S. Treasury Index with a duration of approximately five years.

ASSET CLASS STRATEGIES
OPERS 2018 INVESTMENT PLAN Page 31
Uncommitted portions of the Opportunistic asset class will be allocated into the U.S. and non-U.S. equity exposure within the Public Equity asset class.
Commodities
The Commodity sub-asset class provides exposure to both the Defined Benefit and Health Care 115 Trust Funds as shown in the Fund Strategies sections. The allocation includes a risk-controlled mix of index and enhanced index commodity strategies.
.

ASSET CLASS STRATEGIES
OPERS 2018 INVESTMENT PLAN Page 32
RISK PARITY
Risk parity is an alternative approach to asset allocation which focuses on allocation of risk rather than allocation of capital. When asset allocations are adjusted to the same risk level, the portfolio can achieve a higher risk adjusted return and can be more resistant to equity market downturns than a traditionally equity-centric portfolio.
OPERS has applied 5% of both Defined Benefit and Health Care assets to the Risk Parity concept. For operational reasons it is treated as an asset class. The performance benchmark for the Risk Parity asset class is the HFR Risk Parity Vol 15 Institutional Index, effective January 1, 2018. Knowing that risk parity managers are trying to construct diversified balanced portfolios and not trying to outperform a benchmark, the Risk Parity asset class has an expected alpha target of zero.
GLOBAL TACTICAL ASSET ALLOCATION
Global Tactical Asset Allocation, or GTAA, is a “top-down” investment strategy that attempts to exploit short-term mis-pricings among a global set of asset classes. This strategy focuses on general movements in markets rather than on performance of “bottom-up” security selection. Target allocations of 2% for the Defined Benefit and Health Care 115 Trust Funds were completed in the first quarter of 2013. The performance benchmark for the GTAA asset class is the weighted average of underlying managers’ performance benchmarks. GTAA has an alpha target of 160 basis points with a target tracking error of 400 basis points.

POLICIES, COMMITTEES, AND RESOURCES
OPERS 2018 INVESTMENT PLAN Page 33
POLICIES, COMMITTEES, AND RESOURCES
OPERS RETIREMENT BOARD POLICIES GOVERNING INVESTMENT ACTIVITIES
The following exhibit illustrates the structure and relationship of the Policies within the total System and its three investment Funds. All Policies are available at www.opers.org.
STAFF COMMITTEE STRUCTURE
Broker - Dealer Policy
Corporate Governance
Leverage Policy
Derivatives Policy
External Investment Managers’ Insurance Policy
Iran and Sudan Divestment Policy
Material Nonpublic Information Policy
DC Fund Policy
Ohio-Qualified & Minority-Owned Manager Policy
Personal Trading Policy
Proxy Voting Guidelines
Responsible Contractor Policy
Securities Lending Policy
Soft Dollar Policy
OFAC Policy
Liquidity Policy
INVESTMENT-WIDE POLICIES
Cash Policy
Commodity Policy
Hedge Funds Policy
Opportunistic Fund Policy
GTAA Policy
Public Equity Policy
Fixed Income Policy
Private Equity Policy
Real Estate Policy
Risk Parity Policy
ASSET/SUB-ASSET CLASS POLICIES
OPERS FUNDS
FUND POLICIES
DEFINED BENEFIT
FUND
Investment
Objectives and Asset
Allocation Policy
HEALTH CARE
115 TRUST FUND
Investment
Objectives and Asset
Allocation Policy

POLICIES, COMMITTEES, AND RESOURCES
OPERS 2018 INVESTMENT PLAN Page 34
The Chief Investment Officer (“CIO”) utilizes a variety of committees, working groups and meeting structures to govern the Investments Division’s activities. Committees enhance collective inputs, retain institutional knowledge, document due diligence and other processes, promote transparency and accountability, and formalize decision-making. Committees are designed to combine structure and flexibility to efficiently share information and bring appropriate decision makers together on a timely basis, while minimizing operational risk. The committees and working groups vary in both the frequency of meetings and the degree of structure and formality. Here is an outline of the Investment related committees and meetings.
Committee Structure
Board
Rick ShaferCIO
Iran Sudan Divestiure
Portfolio Progress
Meeting
Risk Related
Leadership Team
Corporate Governance
OPERS Investment Risk
Operational
Counterparty
Management Related
Internal Equity Index/tilt
Fund Management
Broker Review
DC Funds Staff Investments Committee
Board Investment Committee
Private Equity
Active Equity
Global Bonds
Real Estate
Global Equity
Global Fixed IncomePublic Market Alternatives
Investment Related

POLICIES, COMMITTEES, AND RESOURCES
OPERS 2018 INVESTMENT PLAN Page 35
Committee/Meeting Purpose and Description
Investment Committees Approvals and Decisions
Broker Review* Monitor/Approve and Evaluate Brokers, Complete ORSC Reports
Counterparty* Set Counterparty Limits and Monitor Counterparty Exposures
DC Funds Staff Investments Committee*Review/Monitor Defined Contribution Fund's Allocation and
Rebalancing Activities
Fund Management*
Implement Asset Allocation and Investment Strategies, Cash
Forecasting, Fund and Portfolio Exposure Metrics, and Set
Quarterly Fund Target Benchmark Allocations Transitions,
Liquidity Management
Operational Risk* Identify and Monitor Operational Risks
Investment Risk* Assess and Prioritize Risk Matters
Investment Meetings External Portfolio Management
Private Equity* Review PE Opportunities for CIO Approval
Real Estate* Review RE Opportunities for CIO Approval
Public Markets Alternatives*Review Hedge Funds, Risk Parity, GTAA, Commodities, and
Opportunistic strategies
Investment Meetings Internal Portfolio Management
Active EquityReview Sector Outlooks, Portfolio Composition, and Risk
Management
Global BondsReview Sector Outlooks, Portfolio Composition, and Risk
Management
Quantitative Equity Index/Tilt/Derivatives Review Strategies, Derivatives, Index, and Tilt Portfolios
Portfolio Progress Meeting Plan and Implement New Portfolio
Transition Management Transition Assets between Managers and Conduct Rebalancing
Investment Meetings Internal and External Portfolio Management
Global Equity* Review All Internal and External Global Equity Investment
Global Fixed Income* Review All Internal and External Global Fixed Income Investment
Non-Investment Division Committees Committees with Investment Staff Involvement
Iran/Sudan Divestiture* Leadership Team*
Corporate Governance*
* Committee has charter

POLICIES, COMMITTEES, AND RESOURCES
OPERS 2018 INVESTMENT PLAN Page 36
STAFFING
Recruiting and retaining the best and most talented Staff is a critical priority for the Investments Division. The following table shows the anticipated staffing for 2018.
Fixed Active
Office Income Equity Index Total
of the Internal Internal Quant Fund Cash/ External Invest.
CIO Mgmt. Mgmt. Trading Management Sec Lending Funds Division
8 14 9 10 6 3 17 67
Target Staffing for Year End 2018
2018 Investment Plan
Projected Staffing
Staffing Costs
Assuming full staffing levels for 2018, the chart below details the estimated $17.81 million of compensation for the Investments Division. This represents approximately 2 basis points of cost, an increase of only 0.18 basis points from the 2017 projection despite two Staff additions.
Office 2018 2017
of the Internal External Projected Projected
CIO Mgmt. Mgmt. Total Total
Salaries 1.49$ 6.16$ 2.03$ 9.68$ 9.65$
Benefits 0.73$ 3.11$ 1.02$ 4.86$ 4.83$
Incentive Compensation 0.37$ 2.21$ 0.69$ 3.27$ 3.20$
Total Compensation 2.58$ 11.48$ 3.74$ 17.81$ 17.68$
Average Assets ($ billions) 99.40$ 37.77$ 61.63$ 99.40$ 89.50$
Compensation (Basis Points) 0.26 3.04 0.61 1.79 1.98
Estimated 2018 Total Compensation Costs
($ millions)
POLICIES, COMMITTEES, AND RESOURCES
OPERS 2018 INVESTMENT PLAN Page 37
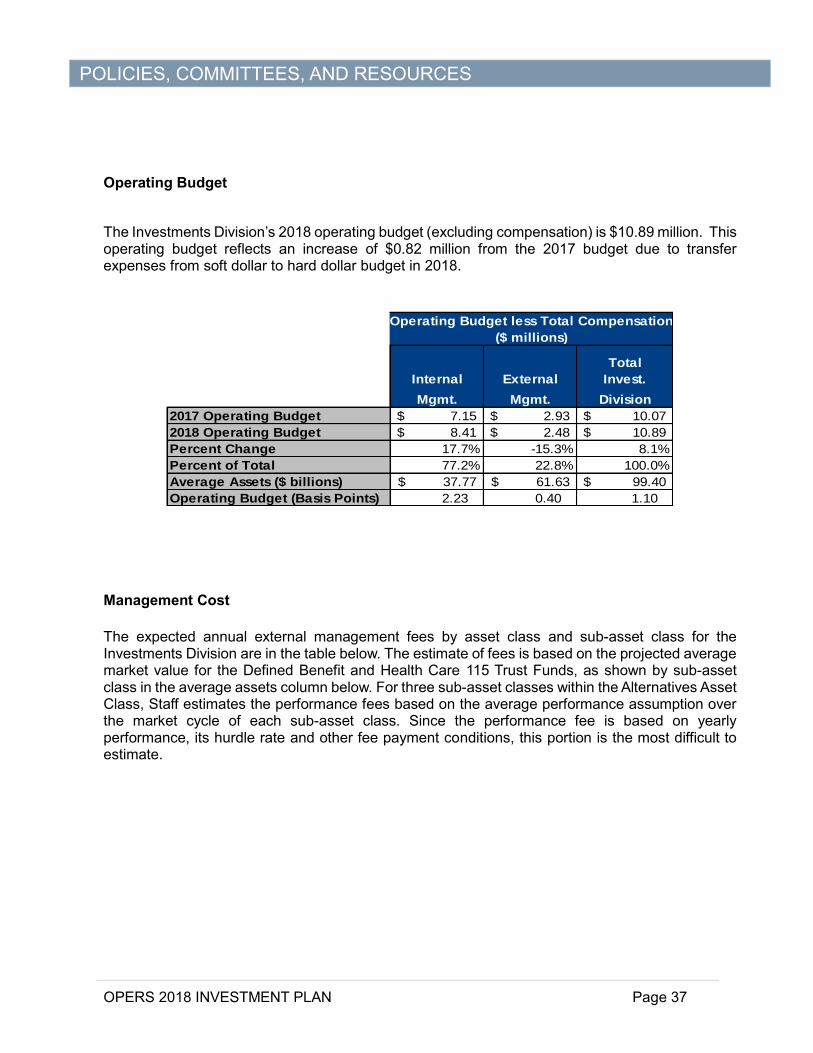
Operating Budget
The Investments Division’s 2018 operating budget (excluding compensation) is $10.89 million. This operating budget reflects an increase of $0.82 million from the 2017 budget due to transfer expenses from soft dollar to hard dollar budget in 2018.
Total
Internal External Invest.
Mgmt. Mgmt. Division
2017 Operating Budget 7.15$ 2.93$ 10.07$
2018 Operating Budget 8.41$ 2.48$ 10.89$
Percent Change 17.7% -15.3% 8.1%
Percent of Total 77.2% 22.8% 100.0%
Average Assets ($ billions) 37.77$ 61.63$ 99.40$
Operating Budget (Basis Points) 2.23 0.40 1.10
Operating Budget less Total Compensation
($ millions)
Management Cost
The expected annual external management fees by asset class and sub-asset class for the Investments Division are in the table below. The estimate of fees is based on the projected average market value for the Defined Benefit and Health Care 115 Trust Funds, as shown by sub-asset class in the average assets column below. For three sub-asset classes within the Alternatives Asset Class, Staff estimates the performance fees based on the average performance assumption over the market cycle of each sub-asset class. Since the performance fee is based on yearly performance, its hurdle rate and other fee payment conditions, this portion is the most difficult to estimate.

POLICIES, COMMITTEES, AND RESOURCES
OPERS 2018 INVESTMENT PLAN Page 38
Total for 2018
Average Annual Annual Average Annual Annual
Assets Cost Cost Assets Cost Cost
($ millions) ($ millions) (bps) ($ millions) ($ millions) (bps)
Public Equity 21,790 2.7 1.2 19,366 74.8 38.6
U.S. Equity 17,271 2.0 1.1 3,755 15.4 41.1
Non-U.S. Equity 4,520 0.7 1.5 15,611 59.3 38.0
Public Fixed Income 16,425 1.5 0.9 7,817 27.4 35.0
Core Fixed 10,953 1.0 0.9 143 0.6 42.0
Emerging Markets Debt 0 0.0 0.0 5,964 20.9 35.0
Floating Rate Debt 0 0.0 0.0 20 0.1 45.0
U.S. Treasury 994 0.1 0.5 0 0.0 0.0
Securitized Debt 994 0.2 2.0 0 0.0 0.0
High Yield 0 0.0 0.0 1,690 5.8 34.4
Core Plus 994 0.2 0.0 0 0.0 34.0
TIPS 2,490 0.1 1.4 0 0.0 0.0
Alternatives 852 0.1 0.9 26,191 255.6 97.6
Private Equity 0 0.0 0.0 8,685 117.3 135.1
Real Estate 0 0.0 0.0 8,685 50.6 58.3
REITs 753 0.0 0.4 0 0.0 0.0
Hedge Funds 0 0.0 0.0 7,701 87.7 113.9
Opportunistic 99 0.1 5.0 0 0.0 0.0
Commodities 0 0.0 0.0 1,120 1.5 13.0
Risk Parity 0 0.0 0.0 4,970 23.4 47.0
GTAA 0 0.0 0.0 1,988 17.5 88.0
Total 39,068 4.3 1.1 60,332 398.6 66.1
Custody 5.0 2.5
Total Fund 39,068 9.3 2.4 60,332 401.1 66.5
Performance Fee
Private Equity 0 0.0 0.0 8,685 77.0 88.7
Real Estate 0 0.0 0.0 8,685 63.6 73.2
Hedge Funds 0 0.0 0.0 7,701 89.1 115.7
Total Performance Fee 0 0.0 0.0 25,071 229.7 91.6
Total Fund with Perf. Fee 39,068 9.3 2.4 60,332 630.9 104.6
Estimate of External and Internal Management Costs
Internal Management External Management
There is a significant cost advantage for passive and systematic forms of asset management and further savings are achieved for internally-managed assets. Sources of internal cost savings arise from lower rent, less travel, no marketing costs, no stand-alone business expenses and no profit margin. But there are also many appropriate business and risk management reasons why OPERS uses external management for some asset classes and portfolios.

POLICIES, COMMITTEES, AND RESOURCES
OPERS 2018 INVESTMENT PLAN Page 39
Total Costs
All investment performance returns are reported after fees. Using the same “CEM – compatible*” fee calculation used in prior years, the total costs of the investment program in 2018 are projected to be $587.5 million, or 59.1 basis points of assets under management. However, the CEM method excludes the estimated “carry costs” from Private Equity, Including these latter costs raises the total fees, estimated for 2018 to 66.8 basis points, or $664.5 million.
Total
Internal External Invest. % of
Mgmt. Mgmt. Division Total
Total Compensation 14.1 3.7 17.8 2.7%
Operating Budget less Compensation 8.4 2.5 10.9 1.6%
Manager Fees 628.3 628.3 94.6%
Custody 5.0 2.5 7.5 1.1%
Total Costs 27.5 637.0 664.5 100.0%
Percent of Total 0.0 1.0
Average 2017 Asset Size ($ billions) 37.8 61.6 99.4
Costs in Basis Points 7.3 103.4 NA
Costs in Basis Points to Total Fund NA NA 66.8
Estimated 2018 Total Costs
($ millions)
*CEM Benchmarking, Inc. is an independent firm that provides an assessment of pension plans and it evaluates
OPERS investment program relative to a peer group of comparably sized public plans.

POLICIES, COMMITTEES, AND RESOURCES
OPERS 2018 INVESTMENT PLAN Page 40
Peer Group Comparison
The following chart compares OPERS asset size and Investment Staff to its peer group as of June 30, 2017. While differences in the percentage and types of assets managed internally exist, OPERS compares very favorably. Data are from Pension Fund Data Exchange.
$0
$50
$100
$150
$200
$250
$300
$350
0 50 100 150 200 250
Asse
t S
ize
($
bill
ions)
Investment Staff
Public Plan Peer GroupAsset Size and Investment Staff
6/30/2017

POLICIES, COMMITTEES, AND RESOURCES
OPERS 2018 INVESTMENT PLAN Page 41
The following table lists the public pension peer group referenced in the chart.
Asset Size
($ millions)
California Public Employees' Retirement System $323,500 207 $1,563
California State Teachers' Retirement System $208,700 128 $1,630
State Board of Administration of Florida $153,600 61 $2,518
New York State Teachers' Retirement System $114,700 47 $2,440
State of Wisconsin Investment Board $110,100 78 $1,412
North Carolina Retirement System $94,100 23 $4,091
Ohio Public Employees Retirement System $93,400 52 $1,796
Washington State Investment Board $91,600 42 $2,181
Employees Retirement System of Georgia $87,100 29 $3,003
New Jersey Division of Investment $76,000 31 $2,452
Ohio State Teachers Retirement System $73,600 93 $791
Average $129,673 72 $2,171
Peers
Investment
Staff
Public Plan Peer Group (as of 6/30/2017)
Asset Size per
Investment Staff


APPENDIX

INVESTMENT ORGANIZATION STRUCTURE
OPERS 2018 INVESTMENT PLAN Page 42
INVESTMENT ORGANIZATION STRUCTURE
Po
siti
on
s as
of
Jan
uar
y 1,
201
8
In
ve
stm
ents - O
rg
aniza
tio
nal S
tru
ctu
re
Cu
rre
nt
Po
siti
on
Vac
ant
Po
siti
on
No
um
ou
ke B
ere
teA
sso
ciat
e In
vest
men
t A
nal
yst
Pu
bli
c A
lte
rna
tive
s
Erik
Cag
nin
a
Port
folio
Man
ager
Fi
xed
Inc
om
e
Sang
Woo
Par
kP
ort
folio
Man
ager
Fi
xed
Inc
om
e
JoA
nn Y
ocum
Inve
stm
en
t A
ssis
tan
t Fi
xed
Inc
ome
Ric
k Sh
afer
CIO
Pau
l Gre
ffD
eput
y C
IO
Bra
d St
urm
Po
rtfo
lio M
anag
er (
Lea
d)
Rea
l Est
ate
Stev
e St
uck
wis
ch
Port
folio
Man
ager
Rea
l Est
ate
AJ
Saye
rsSe
nio
r In
vest
men
t A
nal
yst
Rea
l Est
ate
De
An
ne
Ma
nn
ion
Po
rtfo
lio M
anag
er (
Lea
d)
Exte
rnal
Man
agem
ent
John
Blu
eP
ort
folio
Man
ager
(Le
ad
)P
ub
lic
Alt
ern
ati
ves
Vac
ant
Inve
stm
ent
An
alys
tEx
tern
al M
anag
emen
t
Lew
is T
racy
Po
rtfo
lio M
anag
erP
riva
te E
qu
ity
Gre
g C
otte
rman
Inve
stm
ent
An
alys
t P
riva
te E
qu
ity
Vaca
ntP
ort
folio
Man
ager
Priv
ate
Equi
ty
Ani
sha
Bro
wn
Po
rtfo
lio A
ssis
tan
t
Dav
e D
ury
Ass
ocia
te In
vest
men
t A
naly
st
Fixe
d I
nco
me
Mar
k Eh
resm
anSe
nio
r P
ort
folio
Man
ager
Fixe
d I
ncom
e
Ch
ris
Rie
dd
le
Port
folio
Man
ager
Fi
xed
Inc
om
e
Todd
Soo
tsP
ort
folio
Man
ager
Fi
xed
Inc
ome
Nic
k K
ots
on
is
Sen
ior
Inve
stm
ent
Ana
lyst
Fixe
d I
nco
me
Zach
Zer
man
Ass
oci
ate
Inve
stm
ent
An
alys
t Fi
xed
Inc
om
e
Ton
y En
der
le
Trad
ing
Man
ager
Fixe
d I
nco
me
Jerr
y M
ayP
ort
folio
Man
ager
C
ash/
Secu
riti
es L
endi
ng
Tere
sa B
lack
Sen
ior
Inve
stm
ent
Ana
lyst
C
ash
/Sec
uri
ties
Len
din
g
Dan
Ger
man
Inve
stm
ent
Ris
k O
ffic
er
Ris
k M
anag
emen
t
Jack
Lak
eSe
nio
r R
isk
An
alys
t
Ris
k M
anag
emen
t
JG L
ee
Qua
ntit
ativ
e M
anag
er
Fun
d M
anag
emen
t
Aro
n L
au
Ris
k A
nal
yst
Ris
k M
anag
emen
t
Edw
ard
Pain
vin
Sen
ior
Po
rtfo
lio M
anag
erA
ctiv
e Eq
uity
Ste
ve B
ark
er
Sen
ior
Inve
stm
ent
Ana
lyst
A
ctiv
e Eq
uit
y
Rya
n K
ho
ury
Sen
ior
Inve
stm
ent
An
alys
t A
ctiv
e E
qu
ity
Jeff
Gol
den
Ass
t. P
ort
folio
Man
ager
A
ctiv
e E
qu
ity
Tim
Sw
ing
le
Sen
ior
Inve
stm
ent
An
alys
t A
ctiv
e Eq
uit
y
Vac
ant
Ass
t. P
ort
folio
Man
ager
A
ctiv
e E
qu
ity
Zach
Mar
tin
Inve
stm
ent
An
alys
tA
ctiv
e E
qu
ity
Mac
Pri
ceSe
nio
r In
vest
men
t A
nal
yst
Act
ive
Equi
ty
Lin
coln
Car
nam
Sr O
p R
isk
Ana
lyst
R
isk
Man
agem
ent
Vac
ant
Ass
t. P
ort
folio
Ma
na
ge
r Q
uan
tita
tive
Eq
uit
y
Xin
yan
g G
u
Qu
an
tita
tive
An
aly
stQ
ua
nti
tati
ve E
qu
ity
Eric
k W
eis
Sen
ior
Po
rtfo
lio
Ma
na
ge
r Q
uant
itat
ive
Equi
ty
Kurt
Gro
veIn
vest
men
t A
nal
yst
Act
ive
Eq
uit
y
Gre
g C
orco
ran
Ass
oci
ate
Inve
stm
ent
An
alys
t C
ash/
Secu
riti
es L
endi
ng
Joan
Sta
ckH
ead
Tra
der
Trad
ing
Mat
t Sh
erm
an
Sen
ior
Trad
er
Trad
ing
Ch
rist
y R
uo
ff
Trad
er I
I Tr
adin
g
Lori
Dav
ie
Trad
er I
Tr
adin
g
Rya
n C
aseb
olt
Sen
ior
Inve
stm
ent
An
alys
t Ex
tern
al M
anag
emen
t
Pra
bu
Ku
ma
ran
Fun
d M
anag
er
Fund
Man
agem
ent
Ro
ger
Ton
g
Qua
ntit
ativ
e A
naly
st
Qu
anti
tati
ve E
qu
ity
An
tho
ny
Bad
er
Ass
oci
ate
Inve
stm
ent
An
alys
t Fu
nd
Ma
na
ge
me
nt
Mic
hel
le L
ewis
Ris
k A
naly
st
Ris
k M
anag
emen
t
Va
can
tP
ort
folio
Man
ager
(Le
ad
) Pr
ivat
e Eq
uity
Vaca
ntIn
de
x P
ort
foli
o M
an
ag
er
Qua
ntit
ativ
e Eq
uity
Vaca
ntIn
vest
men
t A
nal
yst
Pri
vate
Eq
uit
y
Jam
es
Ric
ha
rdso
n
Ass
oci
ate
Inve
stm
ent
An
alys
t Fu
nd
Man
agem
ent
Bri
an W
righ
tP
ort
foli
o M
an
ag
er
Pu
bli
c A
lte
rna
tive
sJoyc
e W
illia
ms
Exe
cuti
ve A
ssis
tan
t
Vac
ant
Port
folio
Man
ager
Hig
hY
ield
RJ C
ruz
Sen
ior
Inve
stm
ent
An
alys
tH
igh
Yiel
d
Dav
id X
iaSe
nio
r In
vest
men
t A
nal
yst
Hig
h Yi
eld
PR
IVA
TE E
QU
ITY
REA
L E
STA
TE
PU
BLI
C A
LTER
NA
TIV
ESFU
ND
MA
NA
GEM
ENT
RIS
K M
AN
AG
EMEN
T
Cra
ig C
arro
ll
Ass
ocia
te In
vest
men
t A
naly
st
Fun
d M
anag
emen
t
Dav
id B
uchh
olz
Sen
ior
Inve
stm
ent
An
alys
tH
igh
Yie
ld
Ch
ad H
am
ber
g
Qu
an
tita
tive
An
aly
stQ
ua
nti
tati
ve E
qu
ity
Che
ri W
ools
eySe
nio
r P
ort
folio
Man
ager
A
lter
nati
ves
Vac
ant
Inve
stm
en
t A
na
lyst
P
riva
teA
lter
nat
ives
Vaca
ntIn
vest
men
t R
esid
ent
Fun
d M
anag
emen
t
TRA
DIN
GP
RIV
ATE
ALT
ERN
ATI
VES
FIX
ED IN
CO
ME
AC
TIV
E EQ
UIT
YQ
UA
NT
EQU
ITY
EXTE
RN
AL
MA
NA
GEM
ENT
CA
SH /
SEC
LEN
DIN
G

STAFF DIRECTORY
OPERS 2018 INVESTMENT PLAN Page 43
STAFF DIRECTORY
Department/Title Department/Title
Name
Education/Designation/
License OPERS Total Name
Education/Designation/
License OPERS Total
Investment
Experience
Investment
Experience
Anthony Bader Steven Barker
Teresa Black John Blue
Noumouke Berete Anisha Brown
David Buchholz Erik Cagnina
Lincoln Carnam Craig Carroll
Fixed Income
Senior Investment Analyst
BS, Wright State University
CFA Charterholder
5 18
18 22
2 4
Cash/Securities Lending
Senior Investment Analyst
BS, The Ohio State University
Passed Level I of the CFA Program
Public Alternatives
Associate Investment Analyst
MFE, Ohio University
BS, Franklin University
CIPM,FRM
CAIA Charterholder
2018 Level III Candidate in the CFA
Program
Risk Management
Senior Operational Risk Analyst
MBA, William & Mary Mason School
of Business
BA, Muhlenberg College
CFA Charterholder
Investment Adviser Certified
Compliance Professional
Designation
2
Public Alternatives
Lead Portfolio Manager
MBA, The Ohio State University
BS, The Ohio State University
CFA Charterholder
CAIA Charterholder
Fixed Income
Portfolio Manager
MBA, Case Western Reserve
BS, Miami (OH) University
CFA Charterholder
Fund Management
Associate Investment Analyst
BS, The Ohio State University
CFA Charterholder
1 5
12 23
11
Private Equity
Portfolio Assistant
BA, The Ohio State University 2
9
2
12
Active Equity
Senior Investment Analyst
MBA, The Ohio State University
BS, The Ohio State University
18 18
Fund Management
Associate Investment Analyst
BA, Eastern Michigan University
BA, Michigan State University
2018 Level III Candidate in the CFA
Program
24 26

STAFF DIRECTORY
OPERS 2018 INVESTMENT PLAN Page 44
Department/Title Department/Title
Name
Education/Designation/
License OPERS Total Name
Education/Designation/
License OPERS Total
Investment
Experience
Investment
Experience
Ryan Casebolt Greg Corcoran
Greg Cotterman RJ Cruz
Lorie Davie David Dury
Mark Ehresman Tony Enderle
Dan German Jeff Golden
Risk Management
Investment Risk Officer
MBA, University of Pittsburgh
BS, Allegheny College
CFA Charterholder
Fixed Income
Senior Portfolio Manager
MBA, Case Western Reserve
BS, Miami (OH) University
CFA Charterholder
19
Active Equity
Assistant Portfolio Manager
BS, Princeton University
CFA Charterholder
3 18
Trading
Trader I
BA, Ashford University
MAOM, Ashford University
CP (Certified Paralegal)
Series 63
Private Alternatives
Investment Analyst
BS, Franklin University
BMus, Capital University
Series 63
10
16 16
9
Fixed Income
Associate Investment Analyst
BS, Xavier University
CFA Charterholder
Cash/Securities Lending
Associate Investment Analyst
BS, St. Michaels College
External Public Markets
Senior Investment Analyst
BS, The Ohio State University
CFA Charterholder
CAIA Charterholder
4 15
8 16
4 9
Fixed Income
Trading Manager
BS, Bowling Green State University
CFA Charterholder
16 16
Fixed Income
Senior Investment Analyst
MBA, Golden Gate University
MSBA, University of Southern California
CFA Charterholder
1 32
620 20

STAFF DIRECTORY
OPERS 2018 INVESTMENT PLAN Page 45
Department/Title Department/Title
Name
Education/Designation/
License OPERS Total Name
Education/Designation/
License OPERS Total
Investment
Experience
Investment
Experience
Paul Greff Kurt Grove
Xinyang Gu Chad Hamberg
Ryan Khoury Nick Kotsonis
Prabu Kumaran Jack Lake
Aron Lau J.G. Lee
9 28
Fixed Income
Senior Investment Analyst/Economist
BS, Miami (OH) University
CFA Charterholder
10 13
Fund Management
Fund Manager
MBA, Asian Institute of Management
B Eng (Mech), Anna University
CFA Charterholder
3
Quantitative Management
Quantitative Analyst
MS, The Ohio State University
BS, Southeast University, China
Quantitative Management
Investment Analyst
MBA, Wright State University
BS, Wright State University
2018 Level II Candidate in the CFA
Program
Active Equity
Senior Investment Analyst
BS, University of Minnesota,
Twin Cities
CFA Charterholder
Public Markets
Deputy CIO
MBA, University of Detroit
BA, Kalamazoo College
CFA Charterholder
Risk Management
Risk Analyst
BS, The Ohio State University
CFA Charterholder
Risk Management
Senior Risk Analyst
MBA, Case Western Reserve
BS, Marist College
CFA Charterholder
3 7
4
Active Equity
Associate Investment Analyst
BS, The Ohio State University
CFA Charterholder
9 20
16
6 15
19
Fund Management
Quant Manager
PhD, The Ohio State University
CFA Charterholder
FRM Charterholder
PRM Charterholder
21
2410
8
17 17

STAFF DIRECTORY
OPERS 2018 INVESTMENT PLAN Page 46
Department/Title Department/Title
Name
Education/Designation/
License OPERS Total Name
Education/Designation/
License OPERS Total
Investment
Experience
Investment
Experience
Michelle Lewis DeAnne Mannion
Zachary Martin Jerry May
Edward Painvin SangWoo Park
Mac Price James Richardson
Chris Rieddle Christy Ruoff
35
6
Fixed Income
Portfolio Manager
MBA, Indiana University
BS, Indiana University
CFA Charterholder
11 28
Active Equity
Senior Investment Analyst
MBA, Boston University
JD, University of Chicago
BA, James Madison University
CFA Charterholder
11
Trading
Trader II
BS, Franklin University
Series 63
2
Fund Management
Associate Investment Analyst
BBA, Eastern Kentucky University
2018 Level III Candidate in the CFA
Program
6
35
Active Equity
Senior Portfolio Manager
MBA, Wake Forest University
BA, Flagler College
CFA Charterholder
CMT Charterholder
Active Equity
Investment Analyst
BBA, University of Kentucky
CFA Charterholder
Fixed Income
Portfolio Manager
MBA, Ashland University
BA, Abilene Christian University
CTP
7 17
Risk Management
Risk Analyst
MBA, University of Phoenix
BA, Wright State University
2018 Level II Candidate in the CFA
Program
External Public Markets
Lead Portfolio Manager
MBA, The Ohio State University
BA, The Ohio State University
BA, Mt. Holyoke College
Passed Level I of the CFA Program
7 24
Fixed Income
Portfolio Manager
MBA, University of Chicago
BA, Northwestern University
CFA Charterholder
FRM Charterholder
1 114 20
6 8 14 26

STAFF DIRECTORY
OPERS 2018 INVESTMENT PLAN Page 47
Department/Title Department/Title
Name
Education/Designation/
License OPERS Total Name
Education/Designation/
License OPERS Total
Investment
Experience
Investment
Experience
A.J. Sayers Rick Shafer
Matthew Sherman Todd Soots
Joan Stack Stephen Stuckwisch
Bradley Sturm Timothy J. Swingle
Roger Tong Lewis Tracy
17
19
Real Estate
Lead Portfolio Manager
MBA, The Ohio State University
MA, University of Cincinnati
MAIR, University of Cincinnati
BA, University of Cincinnati
CAIA Charterholder
Real Estate
Investment Analyst
BA, The Ohio State University
CFA Charterholder
CAIA Charterholder
5 5
2215
24
Real Estate
Portfolio Manager
MBA, The Ohio State University
BA, Hanover College
CFA Charterholder
CAIA Charterholder
Active Equity
Senior Investment Analyst
BSBA, The Ohio State University
CFA Charterholder
CMT Charterholder
CPA (Inactive)
CMA
Private Alternatives
Portfolio Manager
PhD, The Ohio State University
MBA, The Ohio State University
BA, University of California at Berkeley
CAIA Charterholder
17
Quantitative Management
Quantitative Analyst
MBA, The College of Insurance
MS, New Jersey Institute of
Technology
Passed Level I of the CFA Program
24
14 23
19
Trading
Head Trader Equities
MBA, Fordham University
BA, Mt. Holyoke College
9
CIO
BA, Dartmouth College
CFA Charterholder
Fixed Income
Portfolio Manager
MBA, The Ohio State University
BS, The Ohio State University
CFA Charterholder
23 16
42 32
18
44
Trading
Senior Equity Trader
MBA, Otterbein University
BA, The Ohio State University
Series 63
12

STAFF DIRECTORY
OPERS 2018 INVESTMENT PLAN Page 48
Department/Title Department/Title
Name
Education/Designation/
License OPERS Total Name
Education/Designation/
License OPERS Total
Investment
Experience
Investment
Experience
Erick Weis Joyce Williams
Cheri Woolsey Brian Wright
David Xia JoAnn Yocum
Zachary Zerman
11
Fixed Income
Senior Investment Analyst
MBA, University of Chicago
MS, John Hopkins University
BS, University of Maryland
1 5
11
8
Fixed Income
Investment Assistant
AS, Bliss Business College
32
26
Private Alternatives
Senior Portfolio Manager
MBA, Baylor University
BA, Baylor University
CFA Charterholder
Fixed Income
Associate Investment Analyst
BS, Miami (OH) University
CFA Charterholder
3
23 24
Quantitative Management
Senior Portfolio Manager
MBA, The Ohio State University
BBA, University of Toledo
CFA Charterholder
8
18
Public Alternatives
Portfolio Manager
MS, Indiana University
BSBA, Auburn University
CFA Charterholder
CPA (Inactive)
7
Executive Assistant
BS, Franklin University
Awarded the Claritas® Investment
Certificate (2014)
10