Annual CCTV Report - Cumbria Constabulary · PDF fileAnnual CCTV Report 01 August 2015 –...
15
Page 1 of 15 Information Management Section (IMS) August 2016 Annual CCTV Report 01 August 2015 – 31 July 2016 Conviction Rates It was anticipated that conviction rates from CCTV tagged incidents would be reported on in this report; however technical developments are still in progress to enable retrieval of this data following the introduction of PoliceWorks Case and Custody system. These figures will be provided as soon as practicable. CCTV Performance Figures The following categories have been recorded throughout the year, broken down by BCU: Cumbria Totals North South West Total Number of Incidents tagged for CCTV 927 902 588 2,417 "Missing Person" CCTV incidents 78 67 27 172 CCTV incidents where an arrest was made 153 133 98 384 Intelligence reports submitted by DMU Operators 51 49 1 101 Number of incidents saved to evidential locker 152 176 124 454
Transcript of Annual CCTV Report - Cumbria Constabulary · PDF fileAnnual CCTV Report 01 August 2015 –...

Page 1 of 15 Information Management Section (IMS) August 2016
Annual CCTV Report 01 August 2015 – 31 July 2016
Conviction Rates It was anticipated that conviction rates from CCTV tagged incidents would be reported on in this report; however technical developments are still in progress to enable retrieval of this data following the introduction of PoliceWorks Case and Custody system. These figures will be provided as soon as practicable.
CCTV Performance Figures The following categories have been recorded throughout the year, broken down by BCU:
Cumbria Totals
North South West Total Number of Incidents tagged for CCTV 927 902 588 2,417
"Missing Person" CCTV incidents 78 67 27 172
CCTV incidents where an arrest was made 153 133 98 384 Intelligence reports submitted by DMU Operators 51 49 1 101
Number of incidents saved to evidential locker 152 176 124 454
Page 2 of 15 Information Management Section (IMS) August 2016
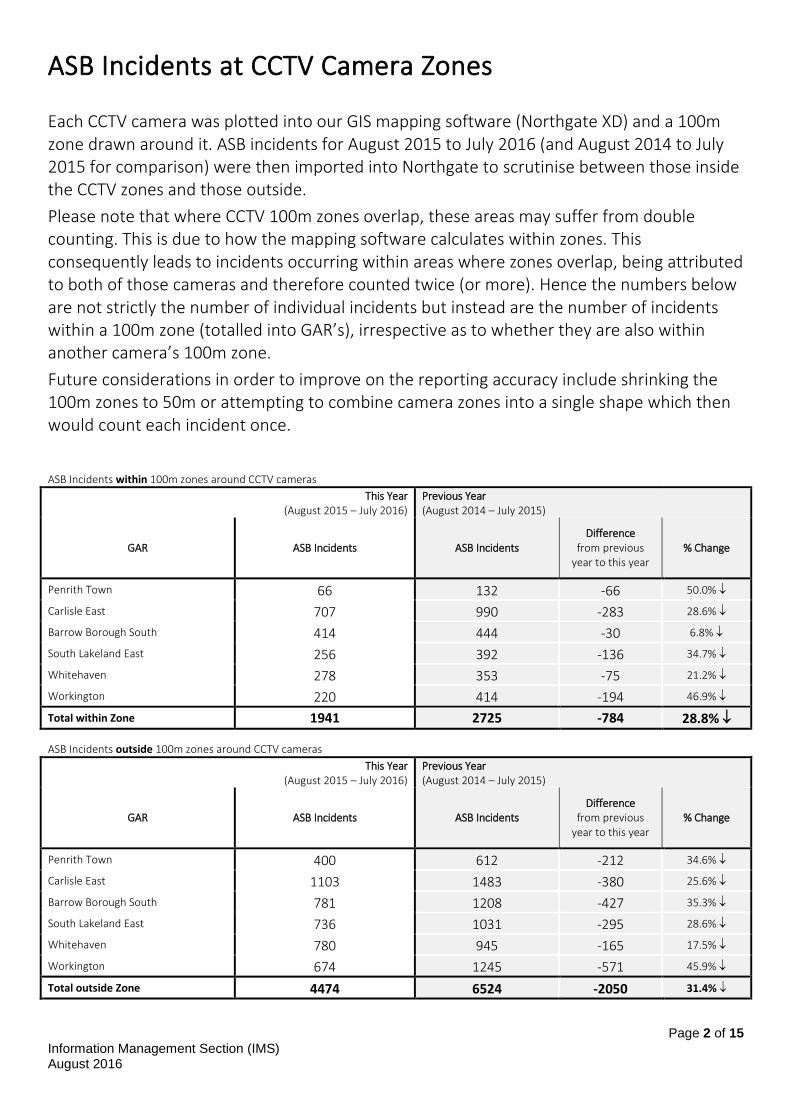
ASB Incidents at CCTV Camera Zones
Each CCTV camera was plotted into our GIS mapping software (Northgate XD) and a 100m zone drawn around it. ASB incidents for August 2015 to July 2016 (and August 2014 to July 2015 for comparison) were then imported into Northgate to scrutinise between those inside the CCTV zones and those outside.
Please note that where CCTV 100m zones overlap, these areas may suffer from double counting. This is due to how the mapping software calculates within zones. This consequently leads to incidents occurring within areas where zones overlap, being attributed to both of those cameras and therefore counted twice (or more). Hence the numbers below are not strictly the number of individual incidents but instead are the number of incidents within a 100m zone (totalled into GAR’s), irrespective as to whether they are also within another camera’s 100m zone.
Future considerations in order to improve on the reporting accuracy include shrinking the 100m zones to 50m or attempting to combine camera zones into a single shape which then would count each incident once.
ASB Incidents within 100m zones around CCTV cameras This Year
(August 2015 – July 2016) Previous Year (August 2014 – July 2015)
GAR ASB Incidents ASB Incidents Difference
from previous year to this year
% Change
Penrith Town 66 132 -66 50.0%
Carlisle East 707 990 -283 28.6%
Barrow Borough South 414 444 -30 6.8%
South Lakeland East 256 392 -136 34.7%
Whitehaven 278 353 -75 21.2%
Workington 220 414 -194 46.9%
Total within Zone 1941 2725 -784 28.8%
ASB Incidents outside 100m zones around CCTV cameras
This Year (August 2015 – July 2016)
Previous Year (August 2014 – July 2015)
GAR ASB Incidents ASB Incidents Difference
from previous year to this year
% Change
Penrith Town 400 612 -212 34.6%
Carlisle East 1103 1483 -380 25.6%
Barrow Borough South 781 1208 -427 35.3%
South Lakeland East 736 1031 -295 28.6%
Whitehaven 780 945 -165 17.5%
Workington 674 1245 -571 45.9%
Total outside Zone 4474 6524 -2050 31.4%

Page 3 of 15 Information Management Section (IMS) August 2016
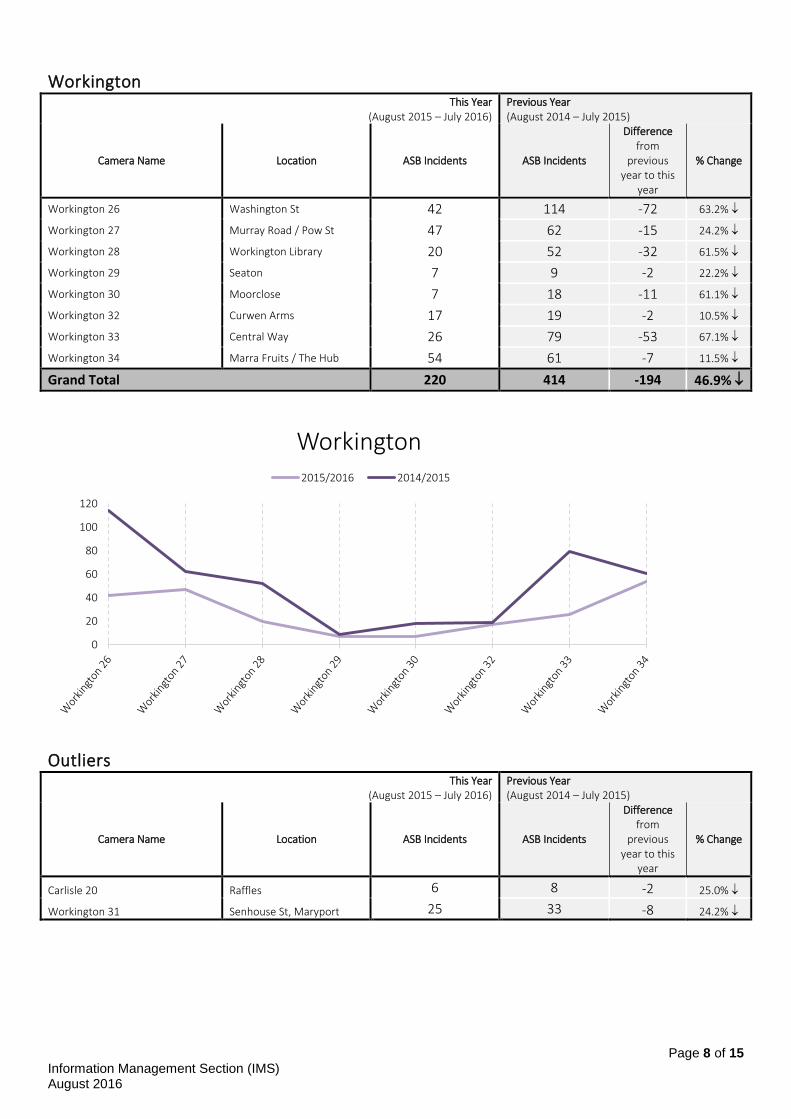
Outlier Cameras Two of the 53 CCTV cameras in operation were not included in the above figures. This is due to their locations being outside of the GAR’s listed in the table. Camera ‘Carlisle 20’ (Raffles) is situated in Carlisle West; all other CCTV cameras in Carlisle are located within the Carlisle
132
990
444 392
353 414
66
707
414
256 278 220
Penrith Town Carlisle East BarrowBorough South
SouthLakeland East
Whitehaven Workington
ASB Incidents within 100 zones around CCTV cameras
2014/2015 2015-2016
612
1483
1208
1031 945
1245
400
1103
781 736 780 674
Penrith Town Carlisle East BarrowBorough South
SouthLakeland East
Whitehaven Workington
ASB Incidents outside 100 zones around CCTV cameras
2014/2015 2015-2016

Page 4 of 15 Information Management Section (IMS) August 2016
East GAR. Camera ‘Workington 31’ (Senhouse, Maryport) is situated in Maryport; all other CCTV cameras in Workington are located within the Workington GAR. These two cameras are reported on separately in the ASB Incident CCTV Camera breakdown below. ASB Incident CCTV Camera breakdown Penrith Town
This Year (August 2015 – July 2016)
Previous Year (August 2014 – July 2015)
Camera Name Location ASB Incidents ASB Incidents
Difference from previous
year to this year
% Change
Penrith 8 Natwest, Devonshire St 15 30 -15 50.0%
Penrith 9 Middlegate 13 44 -31 70.5%
Penrith 10 Sandgate 38 58 -20 34.5%
Grand Total 66 132 -66 50%
Carlisle East
This Year (August 2015 – July 2016)
Previous Year (August 2014 – July 2015)
Camera Name Location ASB Incidents ASB Incidents
Difference from
previous year to this
year
% Change
Carlisle 11 The Crown, Botchergate 42 52 -10 19.2%
Carlisle 12 Botchergate / The Crescent 190 235 -45 19.1%
Carlisle 13 Londale St 36 75 -39 52.0%
Carlisle 14 The Border Rambler 106 155 -49 31.6%
Carlisle 15 BHS, Scotch Street 61 75 -14 18.7%
Carlisle 16 Warwick Rd / The Crescent 79 133 -54 40.6%
0
10
20
30
40
50
60
70
Penrith Town 2015/2016 2014/2015

Page 5 of 15 Information Management Section (IMS) August 2016
This Year (August 2015 – July 2016)
Previous Year (August 2014 – July 2015)
Camera Name Location ASB Incidents ASB Incidents
Difference from
previous year to this
year
% Change
Carlisle 17 Civic Centre 18 20 -2 10.0%
Carlisle 18 English St / Devonshire St 51 88 -37 42.0%
Carlisle 19 Upper Viaduct 2 4 -2 50.0%
Carlisle 21 Borland Ave 13 11 2 18.2%
Carlisle 22 West Tower Street 58 39 19 48.7%
Carlisle 23 Bank Street 16 40 -24 60.0%
Carlisle 24 Millennium Bridge 16 9 7 77.8%
Carlisle 25 Portland Place 19 54 -35 64.8%
Grand Total 707 990 -283 28.6%
Barrow Borough South
This Year (August 2015 – July 2016)
Previous Year (August 2014 – July 2015)
Camera Name Location ASB Incidents ASB Incidents
Difference from
previous year to this
year
% Change
Barrow 42 Duke St Surgery 38 48 -10 20.8%
Barrow 43 Cornwallis St 14 26 -12 46.2%
Barrow 44 Buccleuch St / Duke St 22 30 -8 26.7%
Barrow 45 Lloyds Bank, Crellin St 63 63 0 0.0%
Barrow 46 Cavendish St 74 71 3 4.2%
Barrow 47 Abbey Road / Dalton Rd 19 16 3 18.8%
Barrow 48 Debenhams, Portland Walk 65 45 20 44.4%
Barrow 49 Dalkeith Street 29 28 1 3.6%
Barrow 50 Rawlinson St / Abby Rd 22 29 -7 24.1%
Barrow 51 Hindpool Retail Park 26 45 -19 42.2%
0
50
100
150
200
250
Carlisle East 2015/2016 2014/2015

Page 6 of 15 Information Management Section (IMS) August 2016
This Year (August 2015 – July 2016)
Previous Year (August 2014 – July 2015)
Camera Name Location ASB Incidents ASB Incidents
Difference from
previous year to this
year
% Change
Barrow 52 Craven House, Michaelson Rd
22 27 -5 18.5%
Barrow 53 Hollywood Retail Park 20 16 4 25.0%
Grand Total 414 444 -30 6.8%
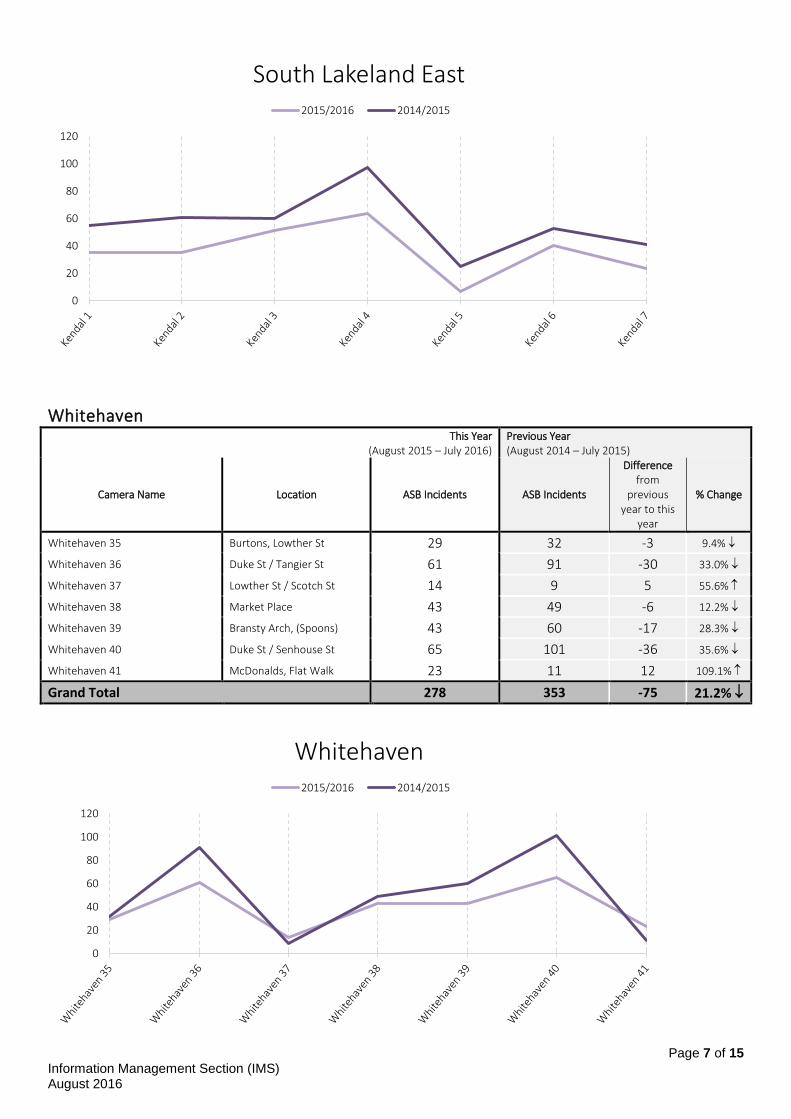
South Lakeland East
This Year (August 2015 – July 2016)
Previous Year (August 2014 – July 2015)
Camera Name Location ASB Incidents ASB Incidents
Difference from
previous year to this
year
% Change
Kendal 1 McDonalds, Stricklandgate 35 55 -20 36.4%
Kendal 2 New Road / Miller Bridge 35 61 -26 42.6%
Kendal 3 Oxfam Highgate 51 60 -9 15.0%
Kendal 4 Goldsmiths, Sticklandgate 64 97 -33 34.0%
Kendal 5 Sandes Avenue 7 25 -18 72.0%
Kendal 6 Relish Deli, Market Place 40 53 -13 24.5%
Kendal 7 Stramongate 24 41 -17 41.5%
Grand Total 256 392 -136 34.7%
0
10
20
30
40
50
60
70
80
Barrow Borough South 2015/2016 2014/2015
Page 7 of 15 Information Management Section (IMS) August 2016
Whitehaven
This Year (August 2015 – July 2016)
Previous Year (August 2014 – July 2015)
Camera Name Location ASB Incidents ASB Incidents
Difference from
previous year to this
year
% Change
Whitehaven 35 Burtons, Lowther St 29 32 -3 9.4%
Whitehaven 36 Duke St / Tangier St 61 91 -30 33.0%
Whitehaven 37 Lowther St / Scotch St 14 9 5 55.6%
Whitehaven 38 Market Place 43 49 -6 12.2%
Whitehaven 39 Bransty Arch, (Spoons) 43 60 -17 28.3%
Whitehaven 40 Duke St / Senhouse St 65 101 -36 35.6%
Whitehaven 41 McDonalds, Flat Walk 23 11 12 109.1%
Grand Total 278 353 -75 21.2%
0
20
40
60
80
100
120
South Lakeland East 2015/2016 2014/2015
0
20
40
60
80
100
120
Whitehaven 2015/2016 2014/2015
Page 8 of 15 Information Management Section (IMS) August 2016
Workington
This Year (August 2015 – July 2016)
Previous Year (August 2014 – July 2015)
Camera Name Location ASB Incidents ASB Incidents
Difference from
previous year to this
year
% Change
Workington 26 Washington St 42 114 -72 63.2%
Workington 27 Murray Road / Pow St 47 62 -15 24.2%
Workington 28 Workington Library 20 52 -32 61.5%
Workington 29 Seaton 7 9 -2 22.2%
Workington 30 Moorclose 7 18 -11 61.1%
Workington 32 Curwen Arms 17 19 -2 10.5%
Workington 33 Central Way 26 79 -53 67.1%
Workington 34 Marra Fruits / The Hub 54 61 -7 11.5%
Grand Total 220 414 -194 46.9%
Outliers
This Year (August 2015 – July 2016)
Previous Year (August 2014 – July 2015)
Camera Name Location ASB Incidents ASB Incidents
Difference from
previous year to this
year
% Change
Carlisle 20 Raffles 6 8 -2 25.0%
Workington 31 Senhouse St, Maryport 25 33 -8 24.2%
0
20
40
60
80
100
120
Workington 2015/2016 2014/2015

Page 9 of 15 Information Management Section (IMS) August 2016
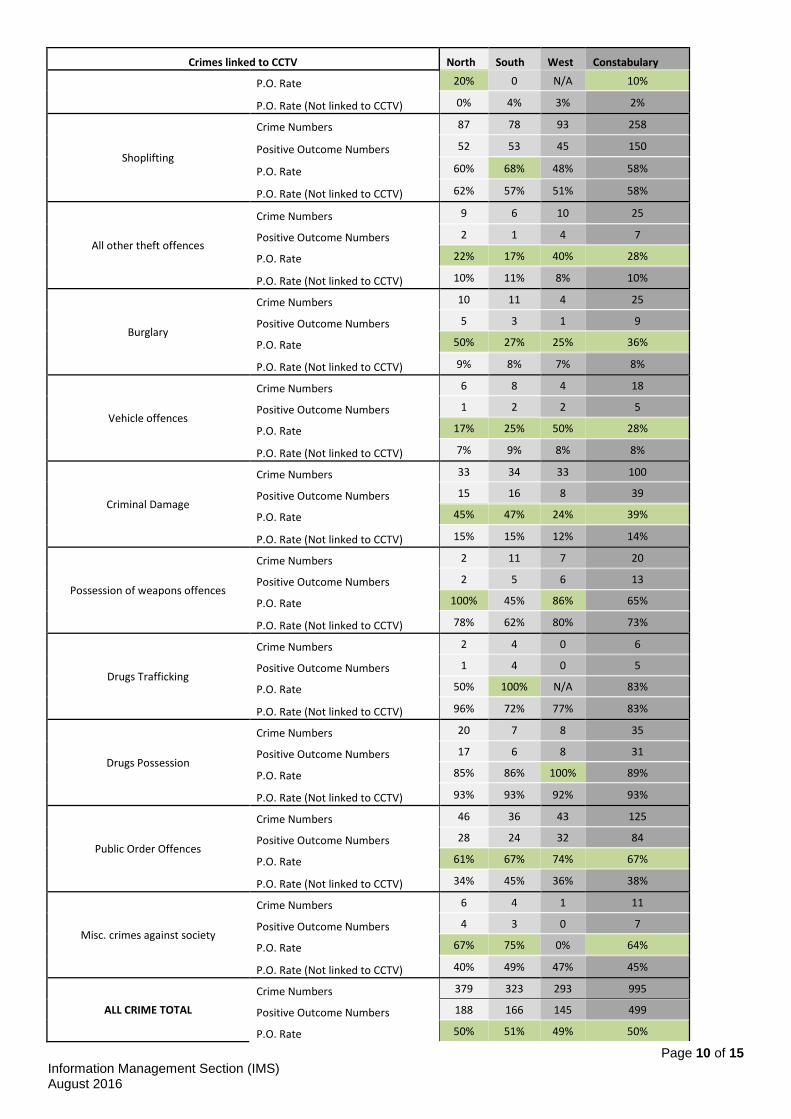
Crimes Linked to CCTV Positive Outcome Rates The table below shows the number of crimes recorded between 01 August 2015 and 31 July 2016 and their outcome status as at 17 August 2016, with a comparison with crimes not linked to tagged incidents recorded in the same period. The number of positive outcomes can take weeks or months to be finalised therefore previously reported numbers are revised upwards upon a refreshing of the data. Positive outcomes include cautions, charged/summonsed, cannabis warning, PNDs, TICs and Community Resolutions. Crimes linked to tagged incidents are highlighted in green were better than for crimes not linked to tagged incidents.
Crimes linked to CCTV North South West Constabulary
Violence with Injury
Crime Numbers 71 59 53 183
Positive Outcome Numbers 29 21 23 73
P.O. Rate 41% 36% 43% 40%
P.O. Rate (Not linked to CCTV) 28% 29% 33% 30%
Violence without Injury
Crime Numbers 67 46 27 140
Positive Outcome Numbers 24 26 11 61
P.O. Rate 36% 57% 41% 44%
P.O. Rate (Not linked to CCTV) 27% 32% 29% 29%
Rape
Crime Numbers 1 5 0 6
Positive Outcome Numbers 1 0 0 1
P.O. Rate 100% 0% N/A 17%
P.O. Rate (Not linked to CCTV) 11% 3% 14% 8%
Other Sexual Offences
Crime Numbers 4 2 1 7
Positive Outcome Numbers 1 1 1 3
P.O. Rate 25% 50% 100% 43%
P.O. Rate (Not linked to CCTV) 17% 11% 22% 16%
Robbery of business property
Crime Numbers 3 0 3 6
Positive Outcome Numbers 3 0 1 4
P.O. Rate 100% N/A 33% 67%
P.O. Rate (Not linked to CCTV) 50% 67% 100% 67%
Robbery of personal property
Crime Numbers 3 4 6 13
Positive Outcome Numbers 2 1 3 6
P.O. Rate 67% 25% 50% 46%
P.O. Rate (Not linked to CCTV) 29% 30% 14% 26%
Theft from the person
Crime Numbers 4 3 0 7
Positive Outcome Numbers 0 0 0 0
P.O. Rate 0% 0% N/A 0%
P.O. Rate (Not linked to CCTV) 3% 10% 10% 7%
Bicycle theft Crime Numbers 5 5 0 10
Positive Outcome Numbers 1 0 0 1
Page 10 of 15 Information Management Section (IMS) August 2016
Crimes linked to CCTV North South West Constabulary
P.O. Rate 20% 0 N/A 10%
P.O. Rate (Not linked to CCTV) 0% 4% 3% 2%
Shoplifting
Crime Numbers 87 78 93 258
Positive Outcome Numbers 52 53 45 150
P.O. Rate 60% 68% 48% 58%
P.O. Rate (Not linked to CCTV) 62% 57% 51% 58%
All other theft offences
Crime Numbers 9 6 10 25
Positive Outcome Numbers 2 1 4 7
P.O. Rate 22% 17% 40% 28%
P.O. Rate (Not linked to CCTV) 10% 11% 8% 10%
Burglary
Crime Numbers 10 11 4 25
Positive Outcome Numbers 5 3 1 9
P.O. Rate 50% 27% 25% 36%
P.O. Rate (Not linked to CCTV) 9% 8% 7% 8%
Vehicle offences
Crime Numbers 6 8 4 18
Positive Outcome Numbers 1 2 2 5
P.O. Rate 17% 25% 50% 28%
P.O. Rate (Not linked to CCTV) 7% 9% 8% 8%
Criminal Damage
Crime Numbers 33 34 33 100
Positive Outcome Numbers 15 16 8 39
P.O. Rate 45% 47% 24% 39%
P.O. Rate (Not linked to CCTV) 15% 15% 12% 14%
Possession of weapons offences
Crime Numbers 2 11 7 20
Positive Outcome Numbers 2 5 6 13
P.O. Rate 100% 45% 86% 65%
P.O. Rate (Not linked to CCTV) 78% 62% 80% 73%
Drugs Trafficking
Crime Numbers 2 4 0 6
Positive Outcome Numbers 1 4 0 5
P.O. Rate 50% 100% N/A 83%
P.O. Rate (Not linked to CCTV) 96% 72% 77% 83%
Drugs Possession
Crime Numbers 20 7 8 35
Positive Outcome Numbers 17 6 8 31
P.O. Rate 85% 86% 100% 89%
P.O. Rate (Not linked to CCTV) 93% 93% 92% 93%
Public Order Offences
Crime Numbers 46 36 43 125
Positive Outcome Numbers 28 24 32 84
P.O. Rate 61% 67% 74% 67%
P.O. Rate (Not linked to CCTV) 34% 45% 36% 38%
Misc. crimes against society
Crime Numbers 6 4 1 11
Positive Outcome Numbers 4 3 0 7
P.O. Rate 67% 75% 0% 64%
P.O. Rate (Not linked to CCTV) 40% 49% 47% 45%
ALL CRIME TOTAL
Crime Numbers 379 323 293 995
Positive Outcome Numbers 188 166 145 499
P.O. Rate 50% 51% 49% 50%

Page 11 of 15 Information Management Section (IMS) August 2016
Crimes linked to CCTV North South West Constabulary
P.O. Rate (Not linked to CCTV) 28% 27% 25% 27%
28%
27%
11%
17%
50%
29%
3%
0%
62%
10%
9%
7%
15%
78%
96%
93%
34%
40%
41%
36%
100%
25%
100%
67%
0%
20%
60%
22%
50%
17%
45%
100%
50%
85%
61%
67%
0% 20% 40% 60% 80% 100% 120%
Violence with Injury
Violence without Injury
Rape
Other Sexual Offences
Robbery of business property
Robbery of personal property
Theft from the person
Bicycle theft
Shoplifting
All other theft offences
Burglary
Vehicle offences
Criminal Damage
Possession of weapons offences
Drugs Trafficking
Drugs Possession
Public Order Offences
Misc. crimes against society
North Positive Outcome Rate by Offence Type Crimes linked to CCTV and Crimes not linked to CCTV
Positive Outcome Rate (CCTV) Positive Outcome Rate (Not linked to CCTV)
Page 12 of 15 Information Management Section (IMS) August 2016
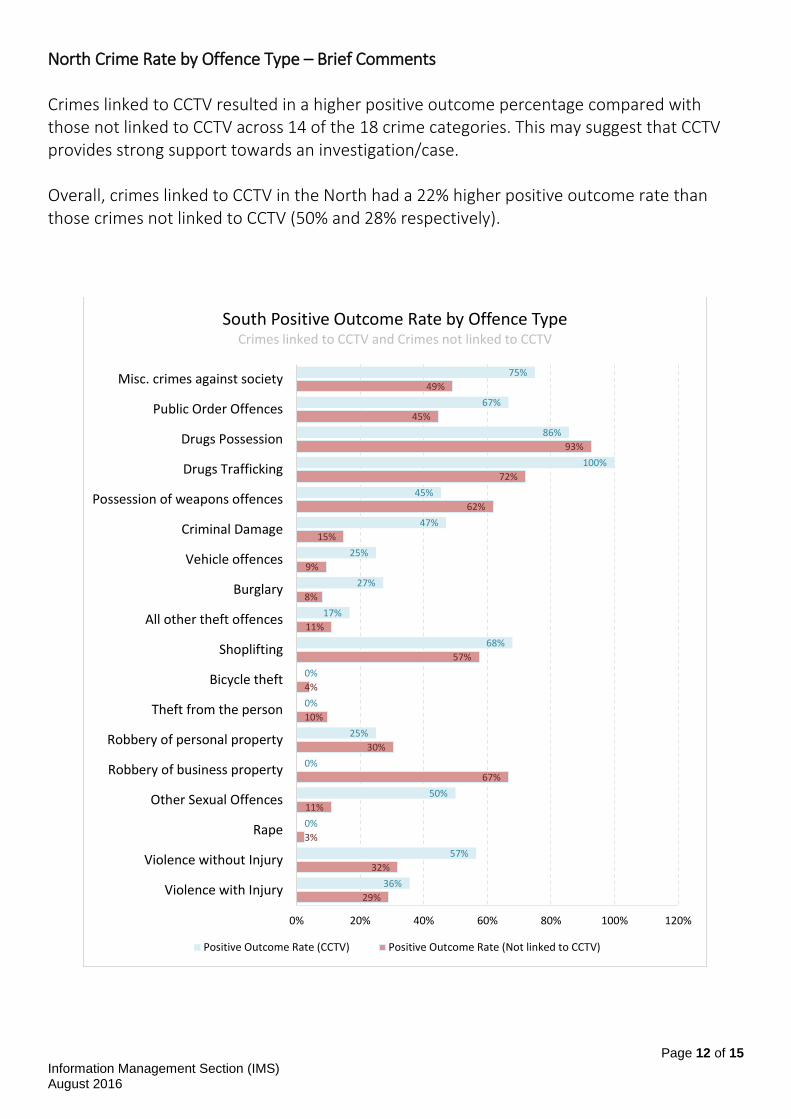
North Crime Rate by Offence Type – Brief Comments Crimes linked to CCTV resulted in a higher positive outcome percentage compared with those not linked to CCTV across 14 of the 18 crime categories. This may suggest that CCTV provides strong support towards an investigation/case. Overall, crimes linked to CCTV in the North had a 22% higher positive outcome rate than those crimes not linked to CCTV (50% and 28% respectively).
29%
32%
3%
11%
67%
30%
10%
4%
57%
11%
8%
9%
15%
62%
72%
93%
45%
49%
36%
57%
0%
50%
0%
25%
0%
0%
68%
17%
27%
25%
47%
45%
100%
86%
67%
75%
0% 20% 40% 60% 80% 100% 120%
Violence with Injury
Violence without Injury
Rape
Other Sexual Offences
Robbery of business property
Robbery of personal property
Theft from the person
Bicycle theft
Shoplifting
All other theft offences
Burglary
Vehicle offences
Criminal Damage
Possession of weapons offences
Drugs Trafficking
Drugs Possession
Public Order Offences
Misc. crimes against society
South Positive Outcome Rate by Offence Type Crimes linked to CCTV and Crimes not linked to CCTV
Positive Outcome Rate (CCTV) Positive Outcome Rate (Not linked to CCTV)
Page 13 of 15 Information Management Section (IMS) August 2016
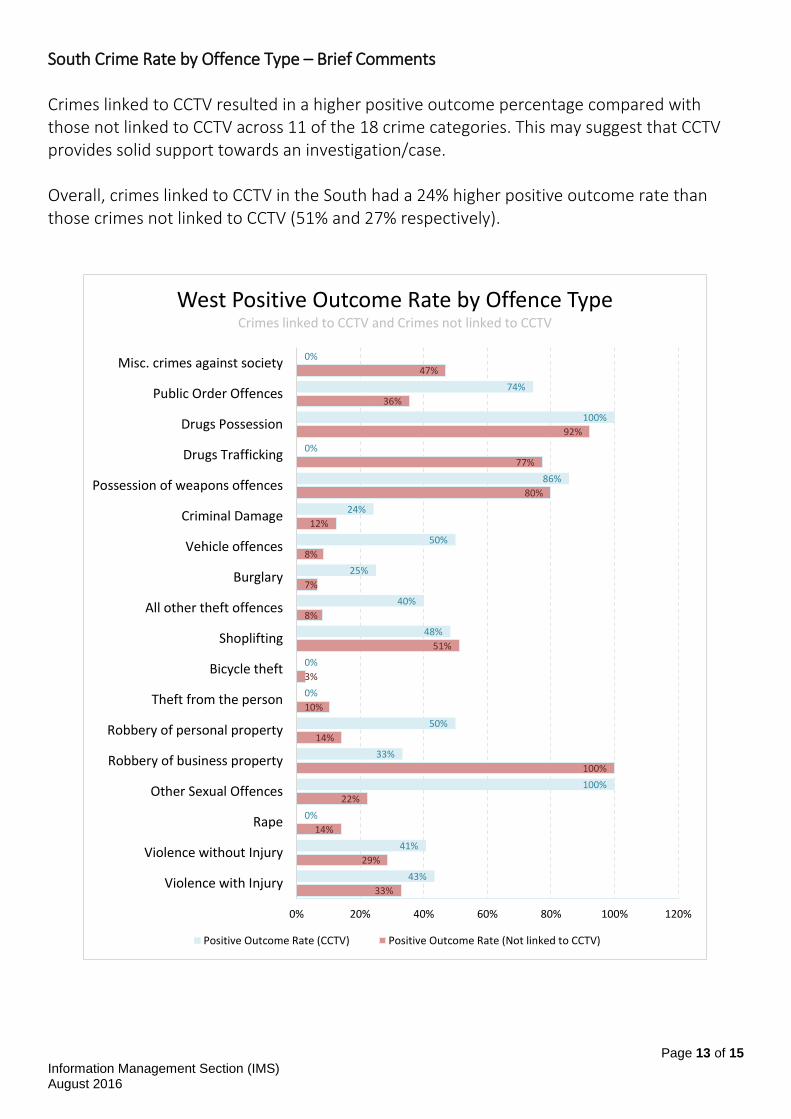
South Crime Rate by Offence Type – Brief Comments Crimes linked to CCTV resulted in a higher positive outcome percentage compared with those not linked to CCTV across 11 of the 18 crime categories. This may suggest that CCTV provides solid support towards an investigation/case. Overall, crimes linked to CCTV in the South had a 24% higher positive outcome rate than those crimes not linked to CCTV (51% and 27% respectively).
33%
29%
14%
22%
100%
14%
10%
3%
51%
8%
7%
8%
12%
80%
77%
92%
36%
47%
43%
41%
0%
100%
33%
50%
0%
0%
48%
40%
25%
50%
24%
86%
0%
100%
74%
0%
0% 20% 40% 60% 80% 100% 120%
Violence with Injury
Violence without Injury
Rape
Other Sexual Offences
Robbery of business property
Robbery of personal property
Theft from the person
Bicycle theft
Shoplifting
All other theft offences
Burglary
Vehicle offences
Criminal Damage
Possession of weapons offences
Drugs Trafficking
Drugs Possession
Public Order Offences
Misc. crimes against society
West Positive Outcome Rate by Offence Type Crimes linked to CCTV and Crimes not linked to CCTV
Positive Outcome Rate (CCTV) Positive Outcome Rate (Not linked to CCTV)

Page 14 of 15 Information Management Section (IMS) August 2016
West Positive Outcome Rate by Offence Type – Brief Comments Crimes linked to CCTV resulted in a higher positive outcome percentage compared with those not linked to CCTV across 10 of the 18 crime categories. This may suggest that CCTV provides some support towards an investigation/case. Overall, crimes linked to CCTV in the West had a 24% higher positive outcome rate than those crimes not linked to CCTV (49% and 25% respectively).
30%
29%
8%
16%
67%
26%
7%
2%
58%
10%
8%
8%
14%
73%
83%
93%
38%
45%
40%
44%
17%
43%
67%
46%
0%
10%
58%
28%
36%
28%
39%
65%
83%
89%
67%
64%
0% 20% 40% 60% 80% 100% 120%
Violence with Injury
Violence without Injury
Rape
Other Sexual Offences
Robbery of business property
Robbery of personal property
Theft from the person
Bicycle theft
Shoplifting
All other theft offences
Burglary
Vehicle offences
Criminal Damage
Possession of weapons offences
Drugs Trafficking
Drugs Possession
Public Order Offences
Misc. crimes against society
The Constabulary Positive Outcome Rate by Offence Type
Crimes linked to CCTV and Crimes not linked to CCTV
Positive Outcome Rate (CCTV) Positive Outcome Rate (Not linked to CCTV)
Page 15 of 15 Information Management Section (IMS) August 2016
The Constabulary Crime Rate by Offence Type – Brief Comments Crimes linked to CCTV resulted in a higher positive outcome percentage compared with those not linked to CCTV across 12 of the 18 crime categories. This may suggest that CCTV can provide robust support towards an investigation/case.