ANNEX 8 MAPPING OF FISH AND SHELLFISH …ANNEX 8 MAPPING OF FISH AND SHELLFISH DISEASES IN ICES...
17
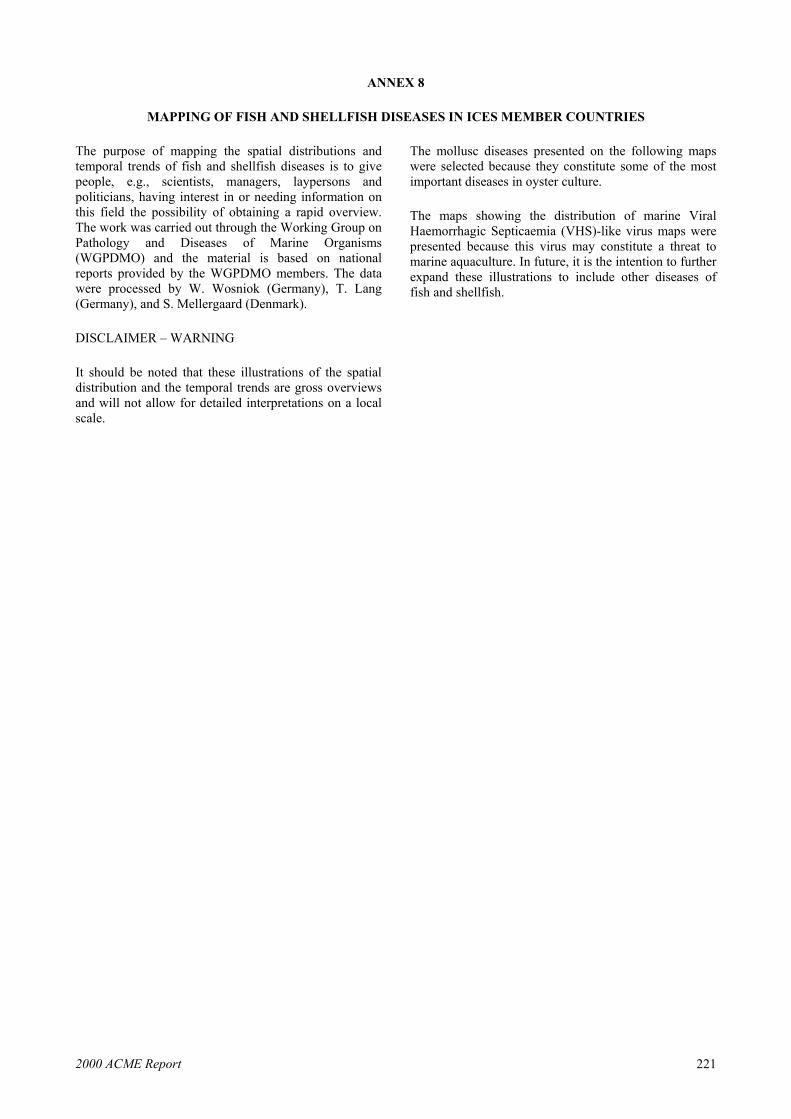
ANNEX 8 MAPPING OF FISH AND SHELLFISH DISEASES IN ICES MEMBER COUNTRIES The purpose of mapping the spatial distributions and temporal trends of fish and shellfish diseases is to give people, e.g., scientists, managers, laypersons and politicians, having interest in or needing information on this field the possibility of obtaining a rapid overview. The work was carried out through the Working Group on Pathology and Diseases of Marine Organisms (WGPDMO) and the material is based on national reports provided by the WGPDMO members. The data were processed by W. Wosniok (Germany), T. Lang (Germany), and S. Mellergaard (Denmark). DISCLAIMER – WARNING It should be noted that these illustrations of the spatial distribution and the temporal trends are gross overviews and will not allow for detailed interpretations on a local scale. The mollusc diseases presented on the following maps were selected because they constitute some of the most important diseases in oyster culture. The maps showing the distribution of marine Viral Haemorrhagic Septicaemia (VHS)-like virus maps were presented because this virus may constitute a threat to marine aquaculture. In future, it is the intention to further expand these illustrations to include other diseases of fish and shellfish. 2000 ACME Report 221
Transcript of ANNEX 8 MAPPING OF FISH AND SHELLFISH …ANNEX 8 MAPPING OF FISH AND SHELLFISH DISEASES IN ICES...
ANNEX 8
MAPPING OF FISH AND SHELLFISH DISEASES IN ICES MEMBER COUNTRIES
The purpose of mapping the spatial distributions and temporal trends of fish and shellfish diseases is to give people, e.g., scientists, managers, laypersons and politicians, having interest in or needing information on this field the possibility of obtaining a rapid overview. The work was carried out through the Working Group on Pathology and Diseases of Marine Organisms (WGPDMO) and the material is based on national reports provided by the WGPDMO members. The data were processed by W. Wosniok (Germany), T. Lang (Germany), and S. Mellergaard (Denmark).
DISCLAIMER – WARNING
It should be noted that these illustrations of the spatial distribution and the temporal trends are gross overviews and will not allow for detailed interpretations on a local scale.
The mollusc diseases presented on the following maps were selected because they constitute some of the most important diseases in oyster culture.
The maps showing the distribution of marine Viral Haemorrhagic Septicaemia (VHS)-like virus maps were presented because this virus may constitute a threat to marine aquaculture. In future, it is the intention to further expand these illustrations to include other diseases of fish and shellfish.
2000 ACME Report 221
222 2000 ACME Report
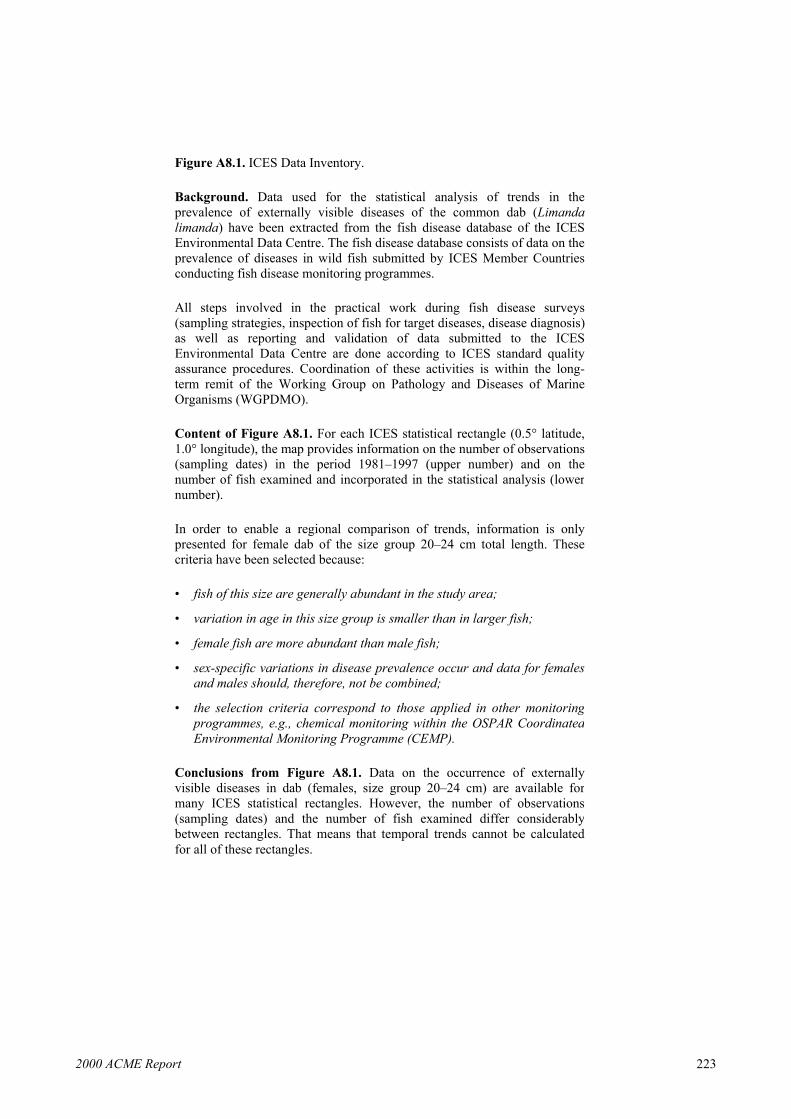
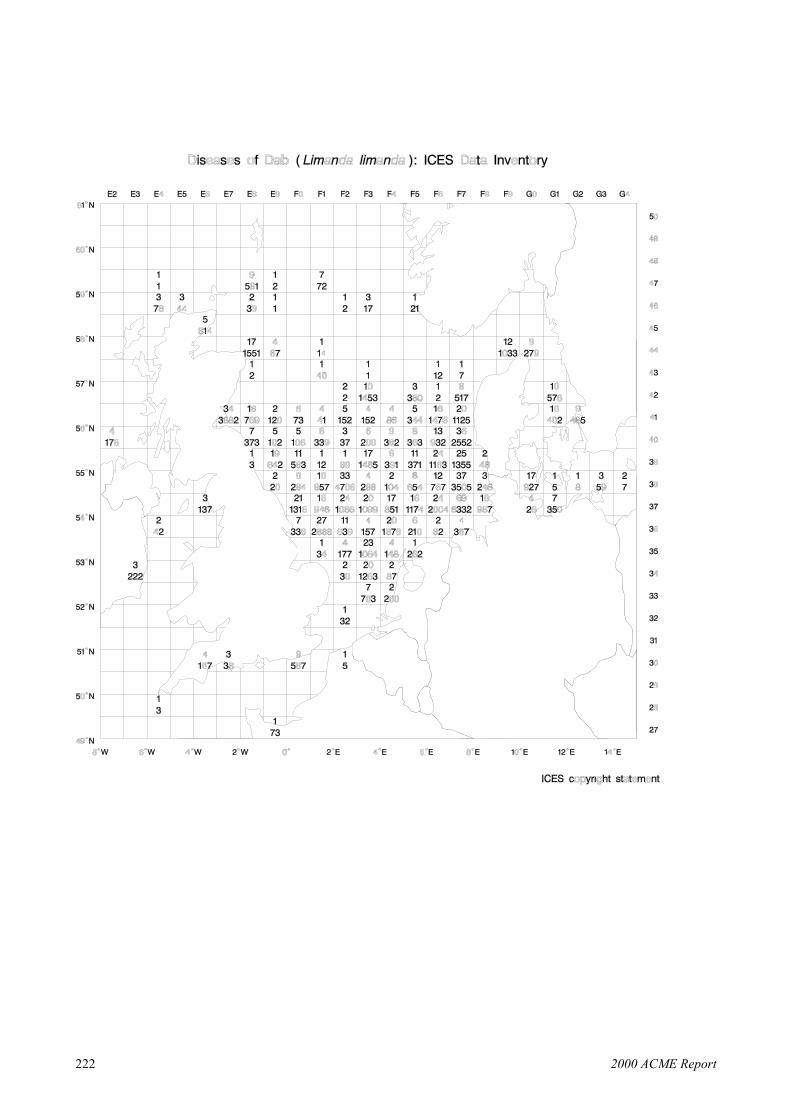
Figure A8.1. ICES Data Inventory.
Background. Data used for the statistical analysis of trends in theprevalence of externally visible diseases of the common dab (Limandalimanda) have been extracted from the fish disease database of the ICESEnvironmental Data Centre. The fish disease database consists of data on theprevalence of diseases in wild fish submitted by ICES Member Countriesconducting fish disease monitoring programmes.
All steps involved in the practical work during fish disease surveys(sampling strategies, inspection of fish for target diseases, disease diagnosis)as well as reporting and validation of data submitted to the ICESEnvironmental Data Centre are done according to ICES standard qualityassurance procedures. Coordination of these activities is within the long-term remit of the Working Group on Pathology and Diseases of MarineOrganisms (WGPDMO).
Content of Figure A8.1. For each ICES statistical rectangle (0.5° latitude,1.0° longitude), the map provides information on the number of observations(sampling dates) in the period 1981–1997 (upper number) and on thenumber of fish examined and incorporated in the statistical analysis (lowernumber).
In order to enable a regional comparison of trends, information is onlypresented for female dab of the size group 20–24 cm total length. Thesecriteria have been selected because:
• fish of this size are generally abundant in the study area;
• variation in age in this size group is smaller than in larger fish;
• female fish are more abundant than male fish;
• sex-specific variations in disease prevalence occur and data for femalesand males should, therefore, not be combined;
• the selection criteria correspond to those applied in other monitoringprogrammes, e.g., chemical monitoring within the OSPAR CoordinatedEnvironmental Monitoring Programme (CEMP).
Conclusions from Figure A8.1. Data on the occurrence of externallyvisible diseases in dab (females, size group 20–24 cm) are available formany ICES statistical rectangles. However, the number of observations(sampling dates) and the number of fish examined differ considerablybetween rectangles. That means that temporal trends cannot be calculatedfor all of these rectangles.
2000 ACME Report 223

224 2000 ACME Report

Figure A8.2. Temporal trends in the prevalence of lymphocystis in common dab (Limanda limanda) in the period 1993–1997. Background. Since the intention of the ICES Environmental Status Reportis to provide current information on the quality of the marine environment,Figure A8.2 shows trends in the prevalence of lymphocystis in dab for theperiod 1993–1997, calculated from the most recent data available in theICES Environmental Data Centre.
Trends have been identified using statistical procedures based on logisticregression analysis. More details on the method are provided elsewhere.
Content of Figure A8.2. Current temporal trends for the estimatedprevalence of lymphocystis in female dab, size group 20–24 cm (see FigureA8.1 for sampling information), are presented as upward or downwardarrows or as rectangles, representing respectively significantly increasing,decreasing, or “stable” prevalences in the period 1993–1997.
Since seasonal effects on the prevalence have been observed and bias due tocombining data from different seasons should be avoided, data are shownfor two seasons:
Season 1: April–September, filled symbols;
Season 2: October–March, empty symbols.
Trends are shown only for those rectangles for which the data available meetthe following criteria:
• prevalence data must be available for a minimum of four out of the fiveyears considered;
• these data must originate either from Season 1 or Season 2 or from both.
Conclusions from Figure A8.2. Only for nine rectangles were sufficientdata available for trend calculation for both seasons. With the exception ofonly two rectangles (30E6, 38F2), prevalences of lymphocystis were eitherdecreasing or did not show a trend in the period 1993–1997.
2000 ACME Report 225

226 2000 ACME Report
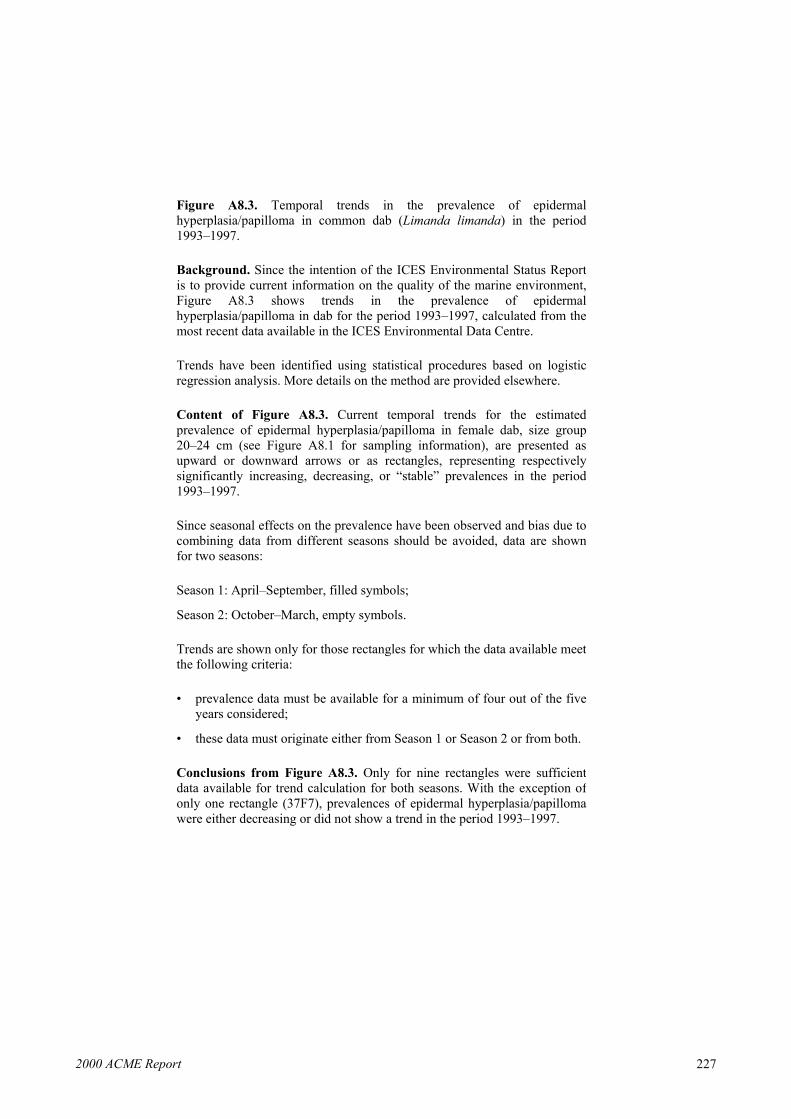
Figure A8.3. Temporal trends in the prevalence of epidermalhyperplasia/papilloma in common dab (Limanda limanda) in the period1993–1997.
Background. Since the intention of the ICES Environmental Status Reportis to provide current information on the quality of the marine environment,Figure A8.3 shows trends in the prevalence of epidermalhyperplasia/papilloma in dab for the period 1993–1997, calculated from themost recent data available in the ICES Environmental Data Centre.
Trends have been identified using statistical procedures based on logisticregression analysis. More details on the method are provided elsewhere.
Content of Figure A8.3. Current temporal trends for the estimatedprevalence of epidermal hyperplasia/papilloma in female dab, size group20–24 cm (see Figure A8.1 for sampling information), are presented asupward or downward arrows or as rectangles, representing respectivelysignificantly increasing, decreasing, or “stable” prevalences in the period1993–1997.
Since seasonal effects on the prevalence have been observed and bias due tocombining data from different seasons should be avoided, data are shownfor two seasons:
Season 1: April–September, filled symbols;
Season 2: October–March, empty symbols.
Trends are shown only for those rectangles for which the data available meetthe following criteria:
• prevalence data must be available for a minimum of four out of the fiveyears considered;
• these data must originate either from Season 1 or Season 2 or from both.
Conclusions from Figure A8.3. Only for nine rectangles were sufficientdata available for trend calculation for both seasons. With the exception ofonly one rectangle (37F7), prevalences of epidermal hyperplasia/papillomawere either decreasing or did not show a trend in the period 1993–1997.
2000 ACME Report 227

228 2000 ACME Report
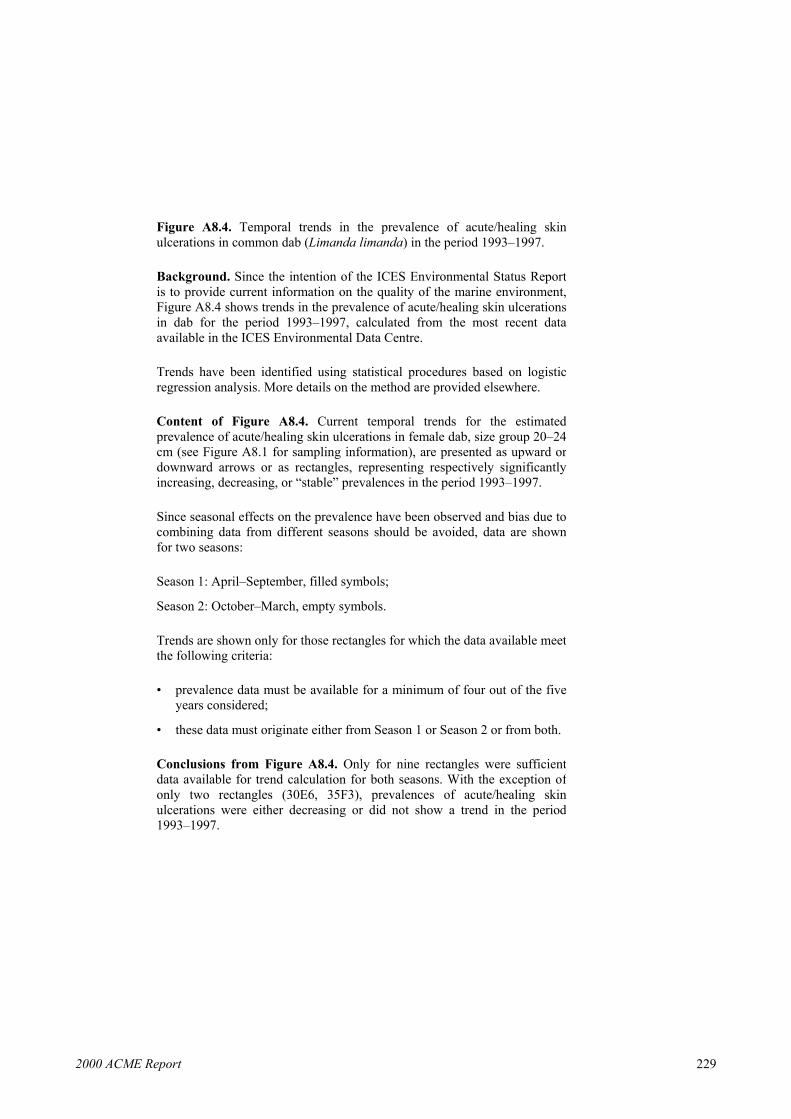
Figure A8.4. Temporal trends in the prevalence of acute/healing skinulcerations in common dab (Limanda limanda) in the period 1993–1997.
Background. Since the intention of the ICES Environmental Status Reportis to provide current information on the quality of the marine environment,Figure A8.4 shows trends in the prevalence of acute/healing skin ulcerationsin dab for the period 1993–1997, calculated from the most recent dataavailable in the ICES Environmental Data Centre.
Trends have been identified using statistical procedures based on logisticregression analysis. More details on the method are provided elsewhere.
Content of Figure A8.4. Current temporal trends for the estimatedprevalence of acute/healing skin ulcerations in female dab, size group 20–24cm (see Figure A8.1 for sampling information), are presented as upward ordownward arrows or as rectangles, representing respectively significantlyincreasing, decreasing, or “stable” prevalences in the period 1993–1997.
Since seasonal effects on the prevalence have been observed and bias due tocombining data from different seasons should be avoided, data are shownfor two seasons:
Season 1: April–September, filled symbols;
Season 2: October–March, empty symbols.
Trends are shown only for those rectangles for which the data available meetthe following criteria:
• prevalence data must be available for a minimum of four out of the fiveyears considered;
• these data must originate either from Season 1 or Season 2 or from both.
Conclusions from Figure A8.4. Only for nine rectangles were sufficientdata available for trend calculation for both seasons. With the exception ofonly two rectangles (30E6, 35F3), prevalences of acute/healing skinulcerations were either decreasing or did not show a trend in the period1993–1997.
2000 ACME Report 229
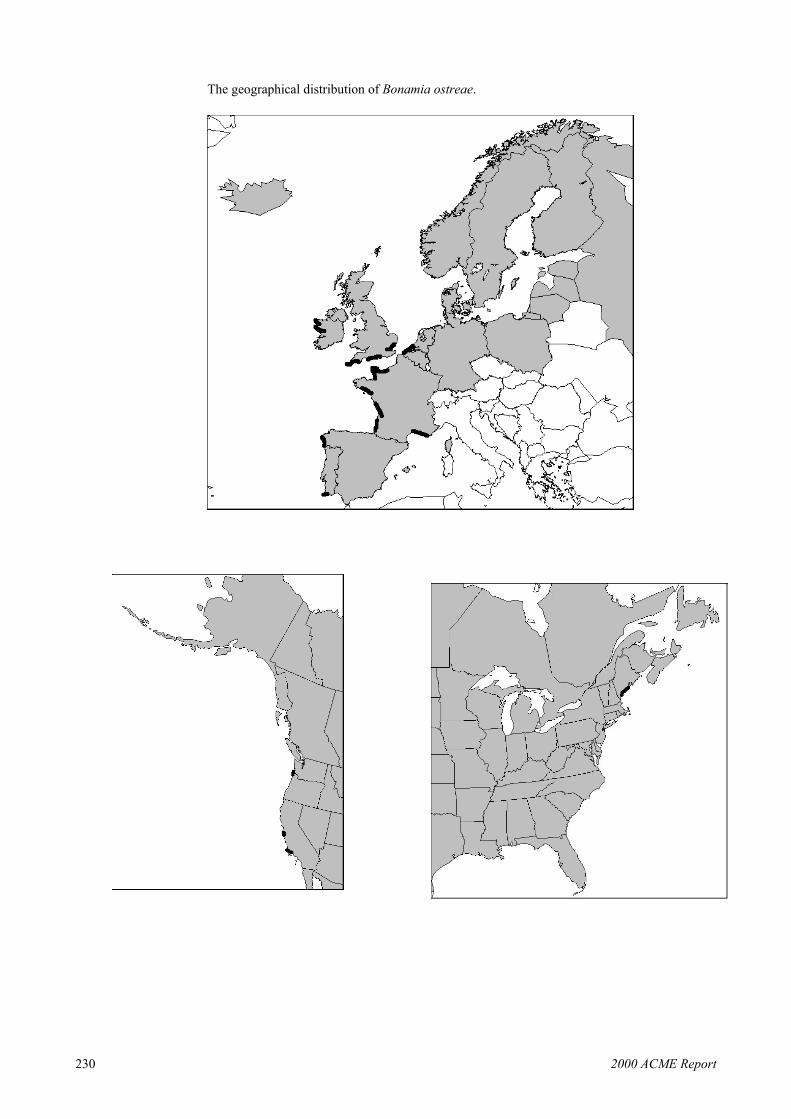
The geographical distribution of Bonamia ostreae.
230 2000 ACME Report

Figure A8.5. The geographical distribution of Bonamia ostreae.
Introduction. Bonamia ostreae is an intracellular parasite (2–4 µm)affecting the haemocytes of the flat oyster, Ostrea edulis. Theparasite was observed for the first time in Normandy, France in 1979and has since spread to other European countries associated withtransfers of oysters. In affected areas, it is not economically feasibleto produce flat oysters due to high mortalities (40–60 %). In the USA,the Bonamia situation seems to be at an endemic level withoutcausing significant mortality.
Although many infected oysters appear normal, others may haveyellow discolouration and/or extensive lesions (i.e., perforated ulcers)on the gills and mantle. Actual pathology appears correlated tohaemocyte destruction and haemocytic infiltration of the connectivetissue due to proliferation of B. ostreae. Lesions occur in theconnective tissues of the gills, mantle, and digestive gland. Althoughsome flat oysters die with light infections, others succumb to muchheavier infections. Heavily infected oysters tend to be in poorercondition than uninfected oysters.
Content of the map. The map illustrates the geographicaldistribution of Bonamia ostreae (heavy black line).
Source of the data. WGPDMO members.
2000 ACME Report 231
The geographical distribution of Marteilia refringens.
232 2000 ACME Report
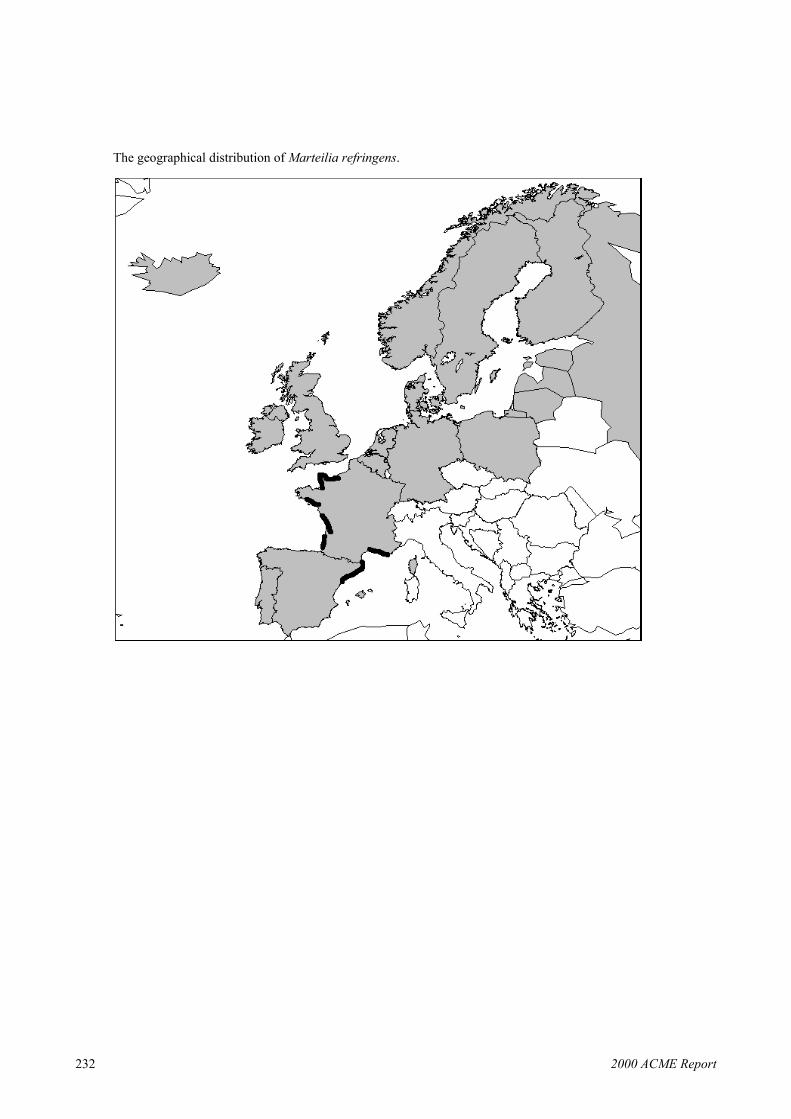
Figure A8.6. The geographical distribution of Marteilia refringens.
Introduction. Marteilia refringens is a haplosporidium affecting thedigestive system of the flat oyster, Ostrea edulis. The parasite wasobserved for the first time in Normandy, France in the beginning ofthe 1970s and has since spread associated with transfers of oysters.
Affected oysters usually exhibit poor condition index withemaciation, discolouration of the digestive gland, cessation of growth,tissue necrosis, and mortalities. However, Marteilia can occur insome oysters without causing disease. The factors triggering apathogenic host response are not clearly established, but may berelated to environmental stresses or stock differences in diseaseresistance. Mortality appears to be related to the sporulation of theparasite, which occurs in the epithelial cells of the digestive tubules.Earlier stages occur in the epithelia of the digestive ducts andpossibly the gills.
Content of the map. The map illustrates the geographicaldistribution of Marteilia refringens (heavy black line).
Source of the data. WGPDMO members.
2000 ACME Report 233

The geographical distribution of Perkinsus marinus.
234 2000 ACME Report

Figure A8.7. The geographical distribution of Perkinsus marinus.
Introduction. Perkinsus marinus is an intracellular parasite (2–4 µm)infecting the haemocytes of eastern oyster Crassostrea virginica andis one of the primary factors that adversely affects the abundance andproductivity of this species.
Proliferation of the parasite causes systemic disruption of connectivetissue and epithelial cells and is correlated with warm summer watertemperatures (higher than 20 °C), when pathogenicity and associatedmortalities are highest. Some oysters may survive summerproliferation, but are unable to revive following over-winteringdormancy. Mortalities of up to 95 % have occurred in eastern oystersduring the second summer following transfer to disease enzooticareas.
Content of the map. The map illustrates the geographicaldistribution of Perkinsus marinus (heavy black line).
Source of the data. WGPDMO members.
2000 ACME Report 235
The geographical distribution of marine VHS-like virus.
236 2000 ACME Report

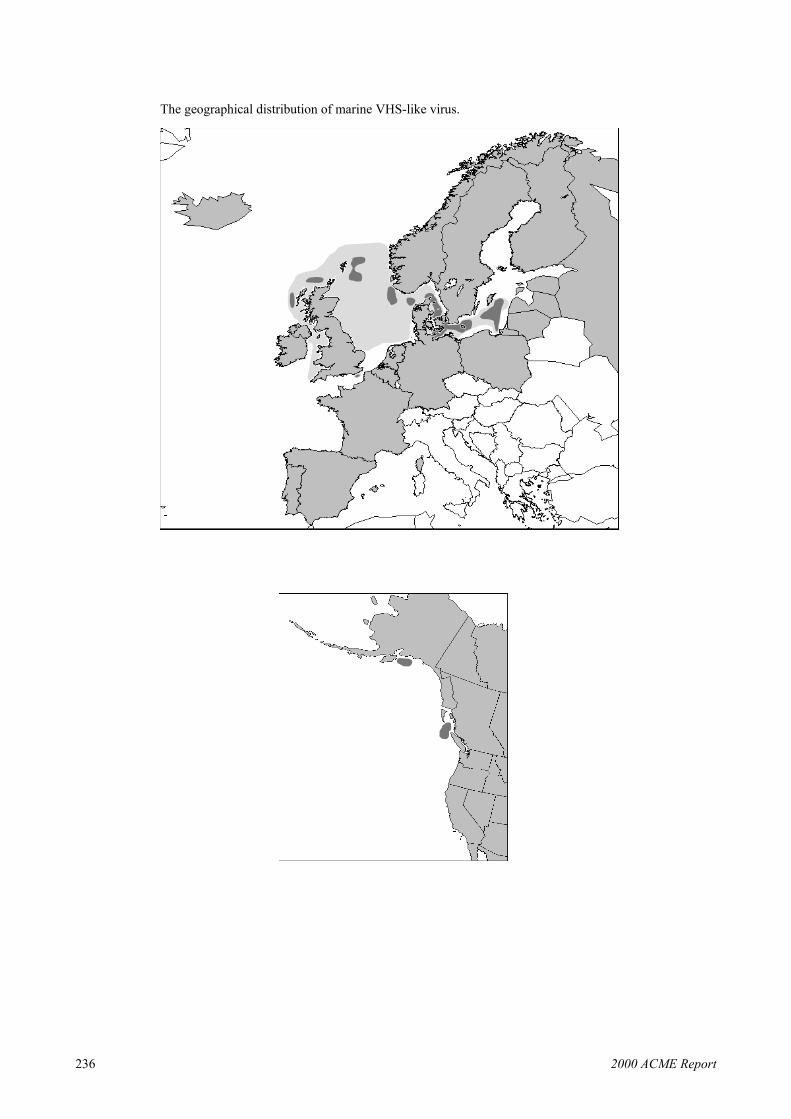
Figure A8.8. The geographical distribution of marine VHS-like virus.
Introduction. Marine Viral Haemorrhagic Septicaemia (VHS) is adisease closely related to VHS known from freshwater rainbow troutfarming, in which it causes severe disease outbreaks with highmortality.
In 1988, the VHS virus was isolated for the first time from ascendingPacific salmon species. In contrast to the freshwater VHS, the marineisolates appeared to be apathogenic to rainbow trout. Furtherclassification has revealed that the marine VHS is geneticallydifferent from the freshwater type.
The marine VHS has so far been isolated from eight different fishspecies in the USA and Canadian Pacific waters and in fourteenspecies in the North Sea and adjacent waters.
Reports from the USA suggest that marine VHS virus may beinvolved in epizootics in Pacific herring. The European investigationshave shown relatively high prevalences of the virus in herring andsprat in the Baltic Sea. Outbreaks of marine VHS have been observedin turbot produced in aquaculture facilities in Europe and thewidespread spatial distribution of the virus in the marine environmentmay constitute a potential threat to the aquaculture industry.
Content of the map. The map illustrates the areas investigated since1988 for the presence of the marine VHS-like virus (light greyshading) and the areas where VHS-like virus has been isolated (darkgrey).
Source of the data. Published literature and EU reports.
2000 ACME Report 237