Annex 10 1 Recent trends in children’s viewing patterns and advertising activity ·...
26
Annex 10 1 Recent trends in children’s viewing patterns and advertising activity Background In order to understand the role of television advertising on children’s food consumption in the context of the overall range of influences Ofcom conducted an extensive research study in 2004. The research was published in July 2004 1 and included the following elements: • two reviews of academic literature • background data on national lifestyle changes • re-analysis of market data on family food purchase and consumption • analysis of audience viewing data • analysis of advertising expenditure and exposure data • content analysis of food advertising on ITV1 • bespoke qualitative and quantitative research commissioned by Ofcom to identify influences on children’s food preferences, purchase behaviour and consumption and the role of TV advertising in this context. Through the analysis of viewing data, advertising activity and creative techniques used to target children we were able to build a picture of children’s viewing experience and understand exactly what television advertising and promotional materials they are exposed to, and when. In particular we examined the following: • How much time do children spend watching television? • When are they watching and which channels do they tune into? • How much television advertising are they exposed to, both during dedicated children’s airtime and during all other times of the day? • How do advertisers adapt their creative techniques when targeting children? In this report we detail an updated look at the trends in viewing and advertising activity until the end of 2005. ‘Core Category’ foods When analysing advertising activity across the food market, we have used the following categories as defined by Nielsen Media 2 : • Food – including all sub-sectors • Soft Drinks – including all sub-sectors • Chain Restaurants 1 Ofcom (July 2004) Childhood Obesity- Food Advertising in Context 2 Nielsen Media provides data on advertising expenditure & advertising exposure across a range of media.
Transcript of Annex 10 1 Recent trends in children’s viewing patterns and advertising activity ·...

Annex 10
1 Recent trends in children’s viewing patterns and advertising activity Background
In order to understand the role of television advertising on children’s food consumption in the context of the overall range of influences Ofcom conducted an extensive research study in 2004. The research was published in July 2004 1 and included the following elements:
• two reviews of academic literature
• background data on national lifestyle changes
• re-analysis of market data on family food purchase and consumption
• analysis of audience viewing data
• analysis of advertising expenditure and exposure data
• content analysis of food advertising on ITV1
• bespoke qualitative and quantitative research commissioned by Ofcom to identify influences on children’s food preferences, purchase behaviour and consumption and the role of TV advertising in this context.
Through the analysis of viewing data, advertising activity and creative techniques used to target children we were able to build a picture of children’s viewing experience and understand exactly what television advertising and promotional materials they are exposed to, and when. In particular we examined the following:
• How much time do children spend watching television?
• When are they watching and which channels do they tune into?
• How much television advertising are they exposed to, both during dedicated children’s airtime and during all other times of the day?
• How do advertisers adapt their creative techniques when targeting children?
In this report we detail an updated look at the trends in viewing and advertising activity until the end of 2005.
‘Core Category’ foods
When analysing advertising activity across the food market, we have used the following categories as defined by Nielsen Media 2:
• Food – including all sub-sectors
• Soft Drinks – including all sub-sectors
• Chain Restaurants
1 Ofcom (July 2004) Childhood Obesity- Food Advertising in Context 2 Nielsen Media provides data on advertising expenditure & advertising exposure across a range of media.

Food Advertising to Children – Annex 10: Recent Trends
These have been grouped together to create what is referred to throughout the analysis as ‘Core Category’ foods3.
Key Facts, 20054
TV Viewing by children and amount of Core Category advertising seen
On average, children watch 15.8 hours of television per week. The amount of time children watch TV has been in decline, down from 17.4 hours in 2001
Of the 15.8 hours, 11.3 hours (71.6%) are spent in commercial airtime (excludes Disney channels), where an average of 288m television impacts 5 for Core Category products are delivered per week.
Of the 11.3 hours spent in commercial airtime (excludes Disney channels):
o 2.7 hours (16.9% of total viewing time) are spent in children’s commercial airtime, with 98m impacts (34%) delivered per week
o Of which 0.5 hours (3.3% of total viewing time) are spent in commercial terrestrial children’s airtime, with 25m impacts (8.6%) delivered per week
o and 2.1 hours (13.6% of total viewing time) are spent in non-terrestrial children’s airtime, with 73m impacts (25.5%) delivered per week.
o 10.9 hours (68.9%) are spent in adult airtime and ‘other’ airtime, with 190m impacts (66%) delivered per week
o Of which 4.1 hours (25.8%) are spent in terrestrial adult airtime, with 120m impacts (41.8%) delivered per week
o and 4.0 hours (25.3%) are spent in non-terrestrial adult airtime, with 70m impacts (24.2%) delivered per week.
0.6 hours (3.6%) are spent watching Disney channels
4.5 hours (28.4%) are spent in BBC airtime
Of the 4.5 hours spent in BBC airtime: 3 It should be noted that our definition therefore covers more sub-sectors than the ‘Big 5’ (Confectionery, Savoury Snacks, Soft Drinks, Fast Food and Pre-sugared Cereals) highlighted by the FSA. This is primarily related to issues around the classification system used by Nielsen Media. For example, Kraft Dairylea Dunkers is classified under the Dairy Products & Substitutes/Cheese sub-sector rather than under the Prepared & Convenience Foods/Dipper Snacks category. And instead of finding home-cook chips in the Prepared & Convenience category, these brands are classified under the Frozen Vegetables sub-sector of the Fruit, Vegetables, Pasta category. Our decision was therefore to adopt an inclusive approach. ‘Core Category’ foods cover all food and drink, including the Prepared & Convenience Foods category which our 2004 research study identified as important (e.g. convenience desserts, canned ready-to-eat, pizza, and frozen ready-to-eat meals). The ‘Big 5’ classification also excludes products such as Cakes and Biscuits. 4 Source: BARB, Nielsen Media – based on 2005 viewing and impacts data. 5 ‘Advertising seen’ is measured by looking at ‘impacts’. Impacts provide a measure of advertising exposure. One impact is equivalent to one member of the target audience viewing one commercial spot.

Food Advertising to Children – Annex 10: Recent Trends
o 1.7 hours (10.6%) are spent in children’s airtime
o Of which 0.8 hour (5.0%) is spent in terrestrial children’s airtime,
o and 0.9 hours (5.6%) are spent in non-terrestrial children’s airtime
o 3.3 hours (17.8%) are spent in adult airtime
o Of which 2.7 hours (17%) are spent in terrestrial adult airtime
o and 0.1 hours (0.8%) are spent in non-terrestrial adult airtime
Using industry standard viewing data supplied by BARB (Broadcasters Audience Research Board) we can assess children’s viewing in commercial airtime and in dedicated children’s airtime. The findings of the 2004 study were based on viewing activity during 2003. This analysis has been updated with 2004 and 2005 data. Figure 1 summarises the recent trends in 2004 and 2005.
Figure 1
Trends - 2004 Trends- 2005 The average child watched around 16.8 hours of television per week.
Children’s total television viewing fell to 15.8 hours per week in 2005. There are signs of a trended reduction in the number of hours of TV viewed per week over time.
In recent years there had been an increase in viewing during children’s airtime, driven by the dedicated BBC channels, which accounted for a growing proportion of viewing during children’s airtime.
The proportion of total viewing time spent in children’s airtime continued to increase year-on-year, driven by the dedicated children’s channels (both BBC and commercial channels).
During 2004 children spent 69.2% of their viewing time (11.6 hours per week) outside of children’s airtime.
Children spent 68.9% of their viewing time (10.9 hours per week) outside of children’s airtime.
Of the remaining 5.2 hours (30.8%), 2.9 hours (17.3% of total viewing time) were spent in commercial children’s airtime (excluding Disney) - equivalent to around 25 minutes each day in commercial children’s airtime.
Of the remaining 4.9 hours (31.1%), 2.6 hours (16.5% of total viewing time) were spent in commercial children’s airtime (excluding Disney) - equivalent to around 22 minutes each day in commercial children’s airtime.
Children aged 4–9 spent 23.1% (3.8 hours per week) of their viewing in dedicated commercial children’s airtime; while children aged 10–15 spent around 12.0% (2.0 hours per week).
Children aged 4–9 spent 23.6% (3.7 hours per week) of their viewing in dedicated commercial children’s airtime; while children aged 10–15 spent around 10.8% (1.7 hours per week).
Overall viewing trends, 2005
Children’s total television viewing fell to 15.8 hours per week in 2005 (down from 17.4 hours per week in 2001). There are signs of a trended reduction the number of hours of TV viewed per week over time.
Around 11 hours per week of viewing takes place in commercial airtime. This represents 71.6% of all viewing (an increase from 64.8% in 2001). This rise in viewing during

Food Advertising to Children – Annex 10: Recent Trends
commercial airtime has been driven by viewing to non-terrestrial commercial channels (Figure 2) with the proportion of viewing to these channels rising from 31.5% in 2001 to 42.6% in 2005.
©Ofcom 2
71.6% of viewing (in 2005) is in commercial airtime
Split in Total Viewing (Weekly), Children
33.4%
1.8% 2.8% 4.1%5.3% 6.4%
33.3% 32.2% 30.8%30.4% 29.0%
31.5% 32.7% 34.7% 39.4% 42.6%
22.0%25.0%30.3%32.3%
2001 2002 2003 2004 2005
Pro
porti
on o
f Vie
win
g
Commercial Non-Terrestrial (e.g.Sky One, Jetix,Disney)
CommercialTerrestrial (ITV1,C4, Five)
BBC Non-Terrestrial (e.gBBC3, Cbeebies)
BBC Terrestrial(BBC1 & BBC2)
Source: BARB*Commercial airtime includes Disney
Total Hours 17.4 16.7 17.2 16.8 15.8
Figure 2
The majority of children’s viewing continues to take place outside of children’s airtime (10.9 hours per week), representing 68.9% of viewing in 2005. However, the proportion of time spent viewing during children’s airtime has been increasing over time from 27.1% in 2001 to 31.1% in 2005 – and now represents just under 5 hours of viewing per week (Figure 3).
©Ofcom 3
Split in Total Viewing (Weekly), Children
27.1% 26.8% 28.8% 30.8% 31.1%
72.9% 73.2% 71.2% 69.2% 68.9%
2001 2002 2003 2004 2005
Prop
ortio
n of
Vie
win
g
Total 'Other'
Total Children'sAirtime (Terr.Slots+Children'sChannels)
Source: BARB
Split in Total Viewing (Weekly), Children
27.0% 26.8% 28.7% 30.8% 31.1%
28.6% 25.8% 24.4% 23.7% 23.7%
38.5% 39.5% 39.1% 37.8% 37.8%
5.8% 7.8% 7.8% 7.7% 7.3%
2001 2002 2003 2004 2005
Prop
ortio
n of
Vie
win
g
'Other' Late-night(10.30pm-Close)
'Other' Peaktime(6pm-10.30pm)
'Other' Daytime(6am-6pm)
Total Children'sAirtime (Terr.Slots+Children'sChannels)
Total Hours 17.4 16.7 17.2 16.8 15.8
Almost 70% of viewing is in ‘adult’ airtime, however viewing during children’s airtime is showing signs of increase over time
4.7 hours
4.5 hours
5.0 hours
12.7 hours
12.2 hours
12.3 hours
5.2 hours
11.6 hours
Total Hours 17.4 16.7 17.2 16.8 15.8
10.9 hours
4.9 hours
Figure 3
Food Advertising to Children – Annex 10: Recent Trends
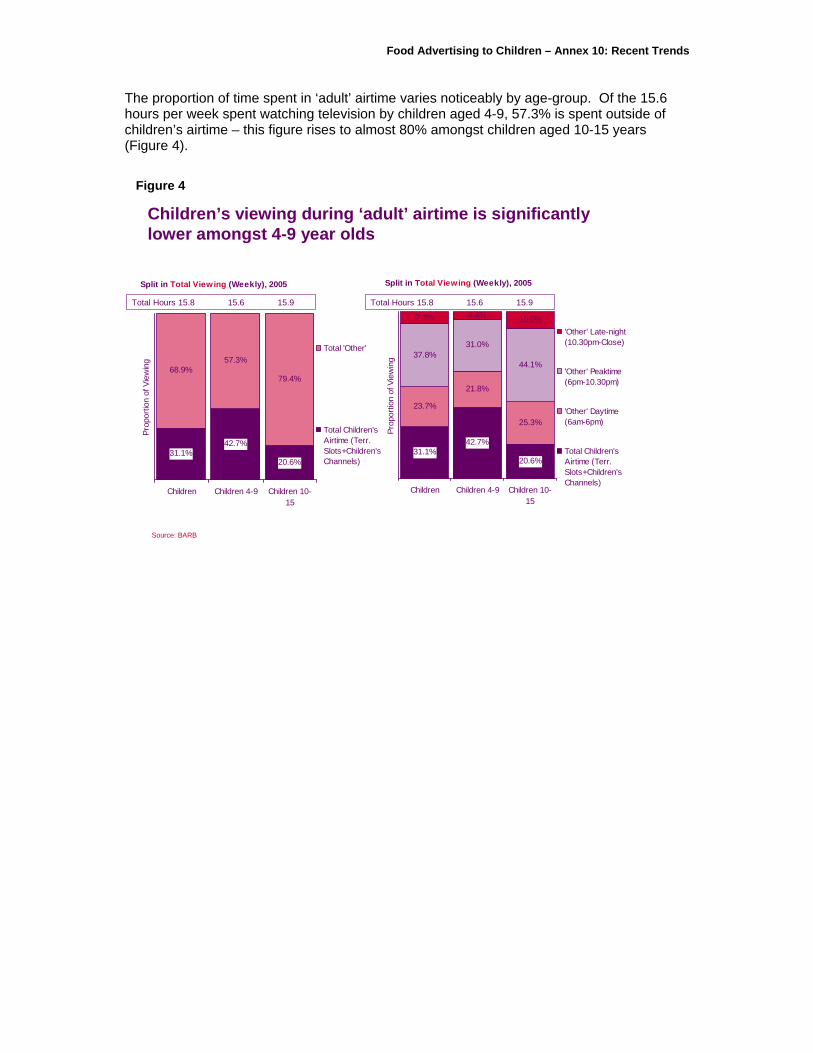
The proportion of time spent in ‘adult’ airtime varies noticeably by age-group. Of the 15.6 hours per week spent watching television by children aged 4-9, 57.3% is spent outside of children’s airtime – this figure rises to almost 80% amongst children aged 10-15 years (Figure 4).
©Ofcom 4
Split in Total Viewing (Weekly), 2005
31.1%42.7%
20.6%
68.9%57.3%
79.4%
Children Children 4-9 Children 10-15
Prop
ortio
n of
Vie
win
g
Total 'Other'
Total Children'sAirtime (Terr.Slots+Children'sChannels)
Source: BARB
Split in Total Viewing (Weekly), 2005
31.1%42.7%
20.6%
23.7%
21.8%
25.3%
37.8%31.0%
44.1%
7.3% 4.4% 10.0%
Children Children 4-9 Children 10-15
Prop
ortio
n of
Vie
win
g
'Other' Late-night(10.30pm-Close)
'Other' Peaktime(6pm-10.30pm)
'Other' Daytime(6am-6pm)
Total Children'sAirtime (Terr.Slots+Children'sChannels)
Total Hours 15.8 15.6 15.9
Children’s viewing during ‘adult’ airtime is significantly lower amongst 4-9 year olds
Total Hours 15.8 15.6 15.9
Figure 4

Food Advertising to Children – Annex 10: Recent Trends
Viewing in commercial children’s airtime
Of the 4.9 hours spent by children in children’s airtime in 2005, 2.7 hours are spent in commercial children’s airtime (2005). This represents 54.2% of all viewing during children’s airtime. Increased viewing to the non-terrestrial dedicated children’s channels is responsible for the increase in this figure rising from 37.5% in 2003 to 43.7% in 2005 (Figure 5).
The proportion of viewing accounted for by the dedicated BBC channels, CBBC and CBeebies, increased from 12.8% in 2003 to 18% in 2005 – although the overall share represented by BBC (dedicated children’s channels plus children’s slots on BBC1 and BBC2) dropped from 38.6% in 2003 to 34.2% in 2005 as viewing to the terrestrial channels declined.
©Ofcom 5
Commercial non-terrestrial channels continue to dominate viewing during children’s airtime and their share of viewing is increasing over time
Split in Viewing of Children's Airtime (Weekly), Children
31.0% 28.1% 25.8%19.2% 16.2%
8.7% 12.8%18.0%
21.9% 16.8% 15.5%12.5%
39.0% 37.9% 37.5%43.7%
8.1%
15.4%
10.5%
43.7%
11.6%9.2%8.6%8.7%
2001 2002 2003 2004 2005
Pro
porti
on o
f Vie
win
g
Disney Channels
Commercial Non-Terrestrial (e.g. Jetix,Nick Jr)
Commercial Terrestrial(ITV1, C4, Five)
BBC Non-Terrestrial(Cbeebies & CBBC)
BBC Terrestrial (BBC1& BBC2)
Source: BARB
Total Hours 4.7 4.5 5.0 5.2 4.9
1.8 hours 1.7 hours 1.9 hours
1.0 hours 0.7 hours 0.8 hours
2.3 hours
0.6 hours
2.1 hours
0.5 hours
Figure 5
54.2%56.2%53%
38.6% 34.6% 34.2%
Food Advertising to Children – Annex 10: Recent Trends
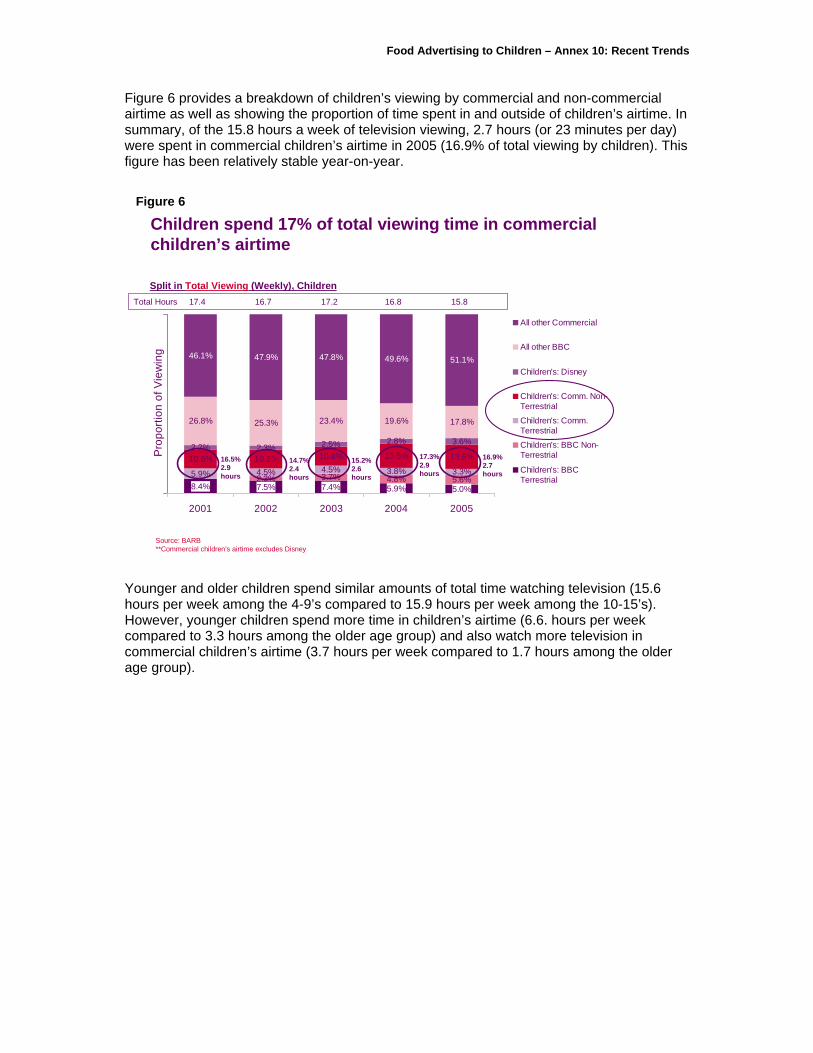
Figure 6 provides a breakdown of children’s viewing by commercial and non-commercial airtime as well as showing the proportion of time spent in and outside of children’s airtime. In summary, of the 15.8 hours a week of television viewing, 2.7 hours (or 23 minutes per day) were spent in commercial children’s airtime in 2005 (16.9% of total viewing by children). This figure has been relatively stable year-on-year.
©Ofcom 6
Children spend 17% of total viewing time in commercial children’s airtime
Split in Total Viewing (Weekly), Children
Source: BARB**Commercial children’s airtime excludes Disney
8.4% 7.5% 7.4% 5.9% 5.0%2.3% 3.7% 4.8% 5.6%
5.9% 4.5% 4.5% 3.8% 3.3%10.6% 10.2% 10.8% 13.5% 13.6%2.2% 2.3% 2.5% 2.8% 3.6%
26.8% 25.3% 23.4% 19.6% 17.8%
46.1% 47.9% 47.8% 49.6% 51.1%
2001 2002 2003 2004 2005
Pro
porti
on o
f Vie
win
g
All other Commercial
All other BBC
Children's: Disney
Children's: Comm. Non-Terrestrial
Children's: Comm.Terrestrial
Children's: BBC Non-Terrestrial
Children's: BBCTerrestrial
16.5%2.9 hours
14.7%2.4 hours
15.2%2.6 hours
17.3%2.9 hours
Total Hours 17.4 16.7 17.2 16.8 15.8
16.9%2.7 hours
Figure 6
Younger and older children spend similar amounts of total time watching television (15.6 hours per week among the 4-9’s compared to 15.9 hours per week among the 10-15’s). However, younger children spend more time in children’s airtime (6.6. hours per week compared to 3.3 hours among the older age group) and also watch more television in commercial children’s airtime (3.7 hours per week compared to 1.7 hours among the older age group).
Food Advertising to Children – Annex 10: Recent Trends
©Ofcom 7
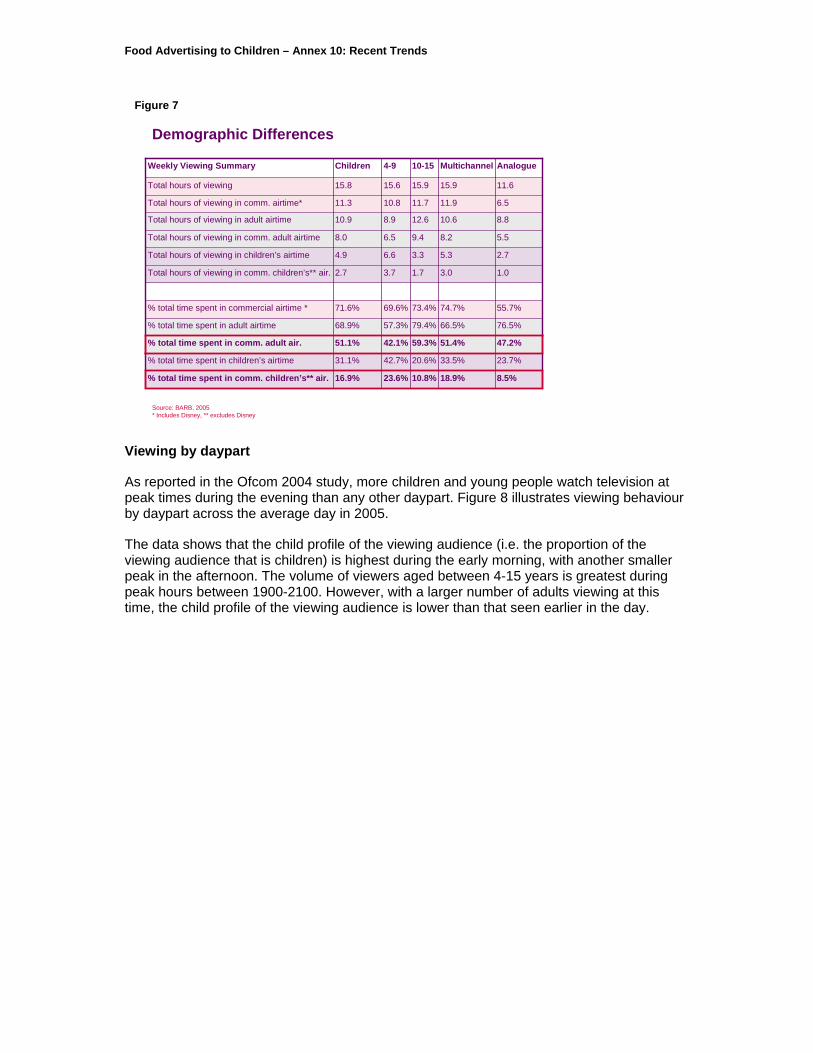
Demographic Differences
Source: BARB, 2005* Includes Disney, ** excludes Disney
8.5%18.9%10.8%23.6%16.9%% total time spent in comm. children’s** air.
23.7%33.5%20.6%42.7%31.1%% total time spent in children’s airtime
47.2%51.4%59.3%42.1%51.1%% total time spent in comm. adult air.
76.5%66.5%79.4%57.3%68.9%% total time spent in adult airtime
55.7%74.7%73.4%69.6%71.6%% total time spent in commercial airtime *
1.03.01.73.72.7Total hours of viewing in comm. children’s** air.
2.75.33.36.64.9Total hours of viewing in children’s airtime
5.58.29.46.58.0Total hours of viewing in comm. adult airtime
8.810.612.68.910.9Total hours of viewing in adult airtime
6.511.911.710.811.3Total hours of viewing in comm. airtime*
11.615.915.915.615.8Total hours of viewing
AnalogueMultichannel10-154-9ChildrenWeekly Viewing Summary
Figure 7
Viewing by daypart
As reported in the Ofcom 2004 study, more children and young people watch television at peak times during the evening than any other daypart. Figure 8 illustrates viewing behaviour by daypart across the average day in 2005.
The data shows that the child profile of the viewing audience (i.e. the proportion of the viewing audience that is children) is highest during the early morning, with another smaller peak in the afternoon. The volume of viewers aged between 4-15 years is greatest during peak hours between 1900-2100. However, with a larger number of adults viewing at this time, the child profile of the viewing audience is lower than that seen earlier in the day.

Food Advertising to Children – Annex 10: Recent Trends
©Ofcom 8
The proportion of children in the viewing audience peaks during the early morning and afternoon
0
5
10
15
20
25
06:0
0 - 0
7:00
07:0
0 - 0
8:00
08:0
0 - 0
9:00
09:0
0 - 1
0:00
10:0
0 - 1
1:00
11:0
0 - 1
2:00
12:0
0 - 1
3:00
13:0
0 - 1
4:00
14:0
0 - 1
5:00
15:0
0 - 1
6:00
16:0
0 - 1
7:00
17:0
0 - 1
8:00
18:0
0 - 1
9:00
19:0
0 - 2
0:00
20:0
0 - 2
1:00
21:0
0 - 2
2:00
22:0
0 - 2
3:00
23:0
0 - 2
4:00
% o
f vie
win
g au
dien
ce
0
500
1000
1500
2000
2500
Ave
rage
Aud
ienc
e, 0
00s
AverageAudience
Profile
Daypart profile by hour vs. Average Audience (Monday-Sunday), Children 4-15
Source: BARB, 2005. TOTAL TV VIEWING. Profile data calculated on a base of All Individuals
Figure 8a
©Ofcom 9
0
5
10
15
20
25
06:0
0 - 0
7:00
07:0
0 - 0
8:00
08:0
0 - 0
9:00
09:0
0 - 1
0:00
10:0
0 - 1
1:00
11:0
0 - 1
2:00
12:0
0 - 1
3:00
13:0
0 - 1
4:00
14:0
0 - 1
5:00
15:0
0 - 1
6:00
16:0
0 - 1
7:00
17:0
0 - 1
8:00
18:0
0 - 1
9:00
19:0
0 - 2
0:00
20:0
0 - 2
1:00
21:0
0 - 2
2:00
22:0
0 - 2
3:00
23:0
0 - 2
4:00
24:0
0 - 2
5:00
% o
f vie
win
g au
dien
ce
0
500
1000
1500
2000
2500
Ave
rage
Aud
ienc
e, 0
00s
AverageAudience
Profile
Daypart profile by hour vs. Average Audience (Monday-Sunday), Children 4-9
Source: BARB, 2005. TOTAL TV VIEWING. Profile data calculated on a base of All Individuals
Figure 8b
Viewing among children aged 4-9’s

Food Advertising to Children – Annex 10: Recent Trends
The child profile of the viewing audience can be further broken down to look at sub- groups of children aged 4-9 and 10-15 years. Figure 9 shows the early morning peak in the child profile is driven by younger age group. Children aged 4-9 years represent a declining share of the total viewing audience from 20:00 onwards.
©Ofcom 9
The profile of children in the viewing audience peaks during the early morning and afternoon
0
5
10
15
20
25
06:0
0 - 0
7:00
07:0
0 - 0
8:00
08:0
0 - 0
9:00
09:0
0 - 1
0:00
10:0
0 - 1
1:00
11:0
0 - 1
2:00
12:0
0 - 1
3:00
13:0
0 - 1
4:00
14:0
0 - 1
5:00
15:0
0 - 1
6:00
16:0
0 - 1
7:00
17:0
0 - 1
8:00
18:0
0 - 1
9:00
19:0
0 - 2
0:00
20:0
0 - 2
1:00
21:0
0 - 2
2:00
22:0
0 - 2
3:00
23:0
0 - 2
4:00
% o
f vie
win
g au
dien
ce
Children
Children 4-9
Children 10-15
Daypart profile by hour (Base: All Individuals), Monday-Sunday
Source: BARB, 2005. TOTAL TV VIEWING.
Figure 9

Food Advertising to Children – Annex 10: Recent Trends
Profile of dedicated children’s channels
A number of dedicated children’s channels are available across the multichannel platforms – commercial children’s channels now account for 13.3% (2.1 hours per week) of total children’s viewing.
The profile of these channels varies significantly by age group (Figure 10). Trouble targets older children with 10-15 year olds representing 81.9% of its total child audience – at the other end of the spectrum, CBeebies appeals to younger children with 4-9 year olds accounting for 91.5% of its child audience. It should be noted that BARB only reports on children aged 4 and over so children aged 0-3 are not represented within this chart.
©Ofcom 10
The profile of dedicated children’s channels varies significantly by age split
18.1 21.643.3 45.4 48.7 49.4 53.9 55.9 57.0 61.6 63.3 64.0
73.2 73.7 79.1 83.1 84.2 84.9 90.3 90.6 91.5
81.9 78.4
56.8 54.6 46.1 44.1 43.0 38.4 36.8 36.0 26.8 26.3 20.9 16.9 15.9 15.2 9.7 9.4 8.6
50.651.3
Trou
ble
Trou
ble
Rel
oad
Nic
kelo
deon
Dis
ney
Cha
nnel
Dis
ney
Cha
nnel
+1
Nic
kelo
deon
Rep
lay
Toon
Dis
ney
CBB
C
Toon
ami
Car
toon
Net
wor
k Pl
us
Nic
ktoo
ns
Car
toon
Net
wor
k
Jetix
+1
Jetix
Dis
cove
ry K
ids
Play
hous
e D
isne
y
POP
Boom
eran
g
Nic
k JR
Tiny
Pop
Cbe
ebie
s
Prop
ortio
n of
Chi
ld V
iew
ers,
%
Children 4-9 Children 10-15
Source: BARB, 2005Profile data calculated on a base of Children
Figure 10

Food Advertising to Children – Annex 10: Recent Trends
Summary of trends in advertising activity
The advertising activity analysis reported in the 2004 Ofcom report was based on analysis of 2003 advertising data and the following conclusions were drawn:
Figure 11
Trends - 2004 2005 Between 1999 and 2003 total Core Category ad spend showed signs of a trended downward trend, falling from £856 million to £738 million. In 2004 there was an uplift to £778m.
Spend levels have increased in the last two years. Total Core Category advertising spend increased in volume terms from £778m in 2004 to £862m in 2005 – representing a 11% increase on the previous year.
Core Category television advertising spend also showing signs of a trended decline over the same period, falling from £669million in 1999 to £533 million in 2003. Again, there was an uplift in 2004 to £547 million.
Core Category television advertising spend also increased in volume terms by 7% between 2004 and 2005 from £547 million to £585 million.
TV spend as a share of Total Core Category has shown a long-term downward trend with the proportion of spend allocated to television decreasing from 78.2% in 1999 to 72.3% in 2003 and 70.3% in 2004.
TV spend as a share of Total Core Category continued to decline and decreased from 70.3% in 2004 to 67.9% in 2005.
96 billion impacts were delivered in 2004.
95 billion impacts were delivered in 2005.
Most of the television advertising seen by children was outside of children’s airtime (70.8% equivalent to 68 bn impacts).
70.5% of all television advertising seen by children was outside of children’s airtime (67bn impacts).
Around one in six of all of the TV ads seen by children was for a Core Category product (16.7% equivalent to 16 bn impacts) in 2004.
Core Category television advertising accounted for 16.8% of all advertising seen by children in 2005.
Television advertising for Core Category products in children’s airtime represented 6.7% of all television advertising seen by children (equivalent to 6.5 bn impacts) in 2004.
Core Category television advertising during children’s airtime represented 5.6% of all television advertising seen by children in 2005– down from 6.7% in 2004 and 8.3% in 2003.
22.7% of all of the advertising seen during children’s airtime was for a Core Category product in 2004.
17.2% of all advertising seen during children’s airtime was for a Core Category product in 2005.

Food Advertising to Children – Annex 10: Recent Trends
Trends in Core Category spend, 2005
Analysis of Core Category above-the-line advertising spend in 2005 shows television remains the key advertising medium for these products, accounting for 67.9% of total media spend.
In volume terms, total Core Category ad spend showed signs of a trended downward trend falling from £856 million in 1999 to £738 million in 2003. However spend levels in the last two years have increased and spend in 2005 was £862 million, representing an 11% year increase compared to £778 million in 2004.
The volume of television spend also showed signs of a trended decline over the same period, falling from £669million in 1999 to £533 million in 2003. However TV spend increased in volume terms by 7% between 2004 and 2005 from £547 million to £585 million (see figure 12).
TV spend as a share of Total Core Category has shown a long-term downward trend with the proportion of spend allocated to television decreasing from 78.2% in 1999 to 67.9% in 2005. Nonetheless, television remains the preferred medium for Core Category advertising and it continues to account £585m of total advertising expenditure on Core Category products.
©Ofcom 12
Total Core Category ad spend and television spend increased in 2005, however TV spend as a share of Total Core Category is still in decline
Source: Nielsen Media Research. Total spend excludes Direct Mail & Internet spend as continuous data is unavailableCore Category* = Food + Chain Restaurants + Soft Drinks
Core Category Advertising Activity
67.9%70.3%72.3%73.5%72.2%
76.9%78.2%
1999 2000 2001 2002 2003 2004 2005
Ad
Spe
nd, £
TV S
hare
of C
ore
Cat
egor
y A
d S
pend
, %
Total UK media spend TV advertising spend TV share£856m£820m
£763m £757m £738m
£862m
£669m£631m
£551m £556m £533m
£585m
£778m
£547m
Figure 12
Over the same period, there has been a corresponding increase in Press & Radio expenditure. Press has increased from 11.3% in 1999 to 16.6% in 2005. Radio spend has increased from 2.8% in 1999 to 4.2% in 2005 (figure 13).

Food Advertising to Children – Annex 10: Recent Trends
©Ofcom 13
Press and radio spend account for 16.6% and 4.2% of Core Category* ad spend respectively. The proportion of advertising spend to these media have been growing over time
Source: Nielsen Media Research. Total spend excludes Direct Mail & Internet spend as continuous data is unavailableCore Category* = Food + Chain Restaurants + Soft Drinks
Media Split - Core Category Ad Market
1999 2000 2001 2002 2003 2004 2005
Ad
Spe
nd
TV Radio Press Outdoor Cinema
£856m£820m
£763m £757m £738m
% Media Split - Core Category Ad Market
78.2% 76.9% 72.2% 73.5% 72.3% 70.3% 67.9%
2.8% 3.5%3.0% 3.3% 3.0% 3.9% 4.2%
11.3% 11.5%12.6% 12.1% 12.8% 14.0% 16.6%
5.8% 6.2% 9.4% 9.1% 10.3% 10.1% 9.4%1.9% 1.9% 2.8% 2.0% 1.7% 1.7% 2.0%
1999 2000 2001 2002 2003 2004 2005
Shar
e of
Ad
Spen
d
TV Radio Press Outdoor Cinema
£862m£778m
Figure 13
Between 1999 and 2004 Core Category total media spend declined as a proportion of total UK media spend from 11.2% to 8.9%. However there has been an uplift in 2005 to 10%. In 1999, Core Category television spend accounted for 18.6% of total television advertising spend across all advertisers – again, this figure declined steadily over the years to 13.8% in 2004, increasing slightly to 14.4% in 2005.
©Ofcom 15
Core Categories* has represented a declining share of the total UK television advertising market, although there is an uplift between 2004 and 2005
Source: Nielsen Media Research. Total spend excludes Direct Mail & Internet spend as continuous data is unavailableCore Category* = Food + Chain Restaurants + Soft Drinks
Core Category activity: Total Media vs. Television
11.2%10.0% 9.6% 9.3% 8.8% 8.9%
10.0%
18.6%
16.4% 15.9% 15.3%14.1% 13.8% 14.4%
1999 2000 2001 2002 2003 2004 2005
% of total UK MEDIAspend represented byCore Categories
% of total UK TELEVISIONad spend represented byCore Categories
-23%
-11%
Figure 14

Food Advertising to Children – Annex 10: Recent Trends
Television advertising seen by children
‘Advertising seen’ is measured by looking at ‘impacts’. Impacts provide a measure of advertising exposure. One impact is equivalent to one member of the target audience viewing one commercial spot.
96 billion child impacts were delivered in 2004 – this decreased slightly to 95 billion impacts in 2005 (Figure 15). As may be expected given viewing patterns described in the previous section, most television advertising seen by children is outside of children’s airtime (70.5% or 67 billion child impacts compared with 30.5% or 29 billion child impacts during children’s airtime in 2005).
©Ofcom 15
Core Category Activity (Base: Total TV)
Source: Nielsen Media Research
2004, Child Impacts 2005, Child Impacts
Total TV: 96bn impacts Total TV: 95bn impacts
‘Adult’ airtime68bn impacts (70.3%)
‘Adult’ airtime67bn impacts (70.5%)
Children’s airtime29bn impacts (29.7%)
Children’s airtime29bn impacts (30.5%)
Core Category, 6.5bn impacts (6.7%) Core Category, 5.0 impacts (5.2%)
Core Category, 9.6bn impacts (10.0%) Core Category, 10.0bn impacts (10.5%)
Figure 15
15.7% (15 billion impacts) of all television adverts seen by children in 2005 were Core Category commercials. There appears to be a trended decline taking place in the number of Core category commercials seen by children over time as this figure compares with 18 billion Core Category impacts delivered in 2003 and 16 billion in 2004, representing a 3 billion decrease over 3 years.
This decline is being driven by a reduction in Core Category impacts delivered during children’s airtime. (7.7 billion impacts in 2003 compared to 6.5 billion in 2004 compared with 5.0 billion in 2005, representing a 2.7 billion reduction over 3 years).
Year-on-year changes in impact activity between 2004 and 2005 is shown in figure 16.

Food Advertising to Children – Annex 10: Recent Trends
©Ofcom 16
Core Category* impacts fell 6.25% year-on-year with a 25% reduction in children’s airtime
Source: Nielsen Media ResearchCore Category* = Food + Chain Restaurants + Soft Drinks
-1.5%67bn68bnOther Airtime
- 0.1 points16.8%16.7%Core Category advertising exposure as a proportion of total TV ad exposure
- 0.2 points29.5%29.7%Advertising exposure in children’s airtime as a proportion of total TV ad exposure
- 5.5 points17.2%22.7%Core Category advertising exposure in children’s airtime as a proportion of total children’s airtime TV ad exposure
- 7.6 points32.0%40.4%Core Category advertising exposure in children’s airtime as a proportion of total Core Category TV ad exposure
+4.2%10.0bn9.6bnOther Airtime-25%5.0bn6.5bnChildren’s Airtime
Core Category* Television Activity
Total UK Television Activity
- 1.1 points5.6%6.7%Core Category advertising exposure in children’s airtime as a proportion of total TV ad exposure
-6.25%15bn16bnAll Airtime
-29bn29bnChildren’s Airtime
-1%95bn96bnAll Airtime
% change20052004Impacts (billions), Children aged 4-15
Figure 16
Figure 17 shows the breakdown of television impacts delivered across all categories compared with Core Categories for 2004 and 2005 by airtime. The figures suggest that an increasing proportion of Core Category child impacts were delivered during ‘adult’ airtime on the terrestrial and non-terrestrial channels. Adult airtime accounted for 59.6% of Core Category impacts in 2004 and increased to 66.5% in 2005.
©Ofcom 17
Terrestrial adult airtime accounts for a greater proportion of Core Category* child impacts delivered in 2005
7.4% 6.4% 10.8% 8.1%
22.3% 23.7%29.6%
25.5%
44.9% 42.2%39.8%
42.3%
25.5% 27.8%19.8% 24.2%
Total TV -2004
Total TV -2005
CoreCategory -
2004
CoreCategory
2005
Pro
porti
on o
f Im
pact
s
Adult: Non-Terrestrial
Adult: Terrestrial
Children's: Non-Terrestrial
Children's: Terrestrial
Split in Child Impacts: Total TV vs Core Category
Source: Nielsen Media ResearchCore Category* = Food + Chain Restaurants + Soft Drinks
Figure 17
59.6% 66.5%
Examination of Core Category activity by sub-category highlights some key trends in year-on-year activity (Figure 18). For example, Savoury Snacks impacts declined by 50% between 2004 - 2005 in children’s airtime. However Cereals (33.3%) and Confectionery (26.7%) increased over the same time period.

Food Advertising to Children – Annex 10: Recent Trends
Figure 18 Core Category activity by sub-category – Total TV (2004 vs 2005)
Impacts (Billions) Total TV, 2004 Total TV, 2005 % Change All Child ‘Adult' All Child ‘Adult' All Child ‘Adult' ren's ren's ren's Children CORE CATEGORY 16 6.5 9.6 14.9 5 10 -6.90% -23% 4.20%Chain Restaurants 2.4 1.1 1.3 2 1 1.1 -16.70% -9.10% -15.40%Soft Drinks 1.3 0.5 0.9 1.3 0.4 0.9 0% -20% 0% Confectionery 3.2 1.5 1.7 2.6 1.1 1.7 -18.80% -26.70% 0% Cereals 2.8 1.8 1 2.2 1.2 1 -21.40% -33.30% 0% Savoury snacks 0.7 0.2 0.5 0.5 0.1 0.5 -28.60% -50% 0% All other prepared & convenience 1 0.1 0.8 1 0.2 0.8 0% 100% 0% All other Food 4.6 1.2 3.4 5.2 1.3 3.9 13% 8.30% 14.70%
Figure 19 illustrates that total impacts delivered during children’s airtime remained relatively stable (0.3% change) between 2004 and 2005, and the reduction in Core Category impacts (-23%) was off-set by an increase in Non Core category impacts (+6.7%), largely in the non terrestrial environment (+5.1%). Product categories that have increased exposure include entertainment Leisure equipment and Cosmetics and Toiletries. The Food category registered the biggest overall reduction (-24.4%), with larger decreases in the terrestrial environment (-38.5%) than the non terrestrial (-21.6%).
©Ofcom 19
Child Impacts (Billions) Total TV Terrestrial Non-Terrestrial2004 2005 % Change 2004 2005 % Change 2004 2005 % Change
Total 28.5 28.6 + 0.3% 7.1 6.1 -14.1% 21.4 22.5 +5.1%Nielsen Media Categories
Leisure Equipment 12.2 13.4 +9.8% 3.0 3.0 9.2 10.3 +12%
Food 4.9 3.7 -24.4% 1.3 0.8 -38.5% 3.7 2.9 -21.6%
Entertainment & The Media 2.4 2.5 +0.4% 0.5 0.4 -20% 1.9 2.1 +10.5%
Finance 1.8 1.8 0.1 0.1 1.7 1.7
Retail 1.6 1.4 -12.5% 0.5 0.5 1.1 0.9 -18.2%
Household Stores 1.1 1.1 0.4 0.3 -25% 0.7 0.8 +14.3%
Cosmetics & Toiletries 0.9 1.0 +11.1% 0.4 0.3 -25% 0.5 0.7 +40%
Computers 0.9 0.9 0.1 0.1 0.8 0.8
Govt & Social 0.4 0.5 +25% 0.1 0.1 0.3 0.5 +66.7%
Travel & Transport 0.2 0.4 +100% 0.1 0.1 0.2 0.4 +100%
Non-Core Category 22.1 23.6 +6.7% 5.4 4.9 -9.3% 16.7 18.8 +12.6%Core Category 6.5 5.0 -23% 1.7 1.2 -29.4% 4.7 3.8 -19.1%
Activity during Children’s Airtime by Category (Top 10 Categories based on Total TV Impacts in 2005)
Source: Nielsen Media Research (ranked on 2005 Impacts)Leisure Equipment includes Toys & Games/Entertainment & Media includes Film Releases and Magazines/Computers includes Consoles and Software
Slight growth in impacts during Children’s Airtime driven by non-terrestrial channels. However there is a significant reduction in Core Category impacts
Figure 19

Food Advertising to Children – Annex 10: Recent Trends
Figure 20 shows the year-on-year change in advertising activity using two measures; duration (the total hours of commercial activity) and spots (the total number of commercial spots transmitted). The results suggest the decline in Core Category advertising exposure has been driven more by a reduction in the length of advertisements than the number of ads. Although the number of ads has reduced, the reduction is not as much as the reduction in the length of time.
©Ofcom 20
The decline in exposure is driven by a reduction in activity during children’s airtime
Source: Nielsen Media ResearchCore Category* = Food + Chain Restaurants + Soft Drinks
-12.5%454k spots
519k spots
-19%3.0k hours
3.7k hours
Children’s Airtime
+21.5%
+13.4%
+17.5%
+15.3%
% change
18.1k hours
21.1k hours
18.1k hours
173k hours
2005
Duration (hours)
14.9k hours
18.6k hours
15.4k hours
150k hours
2004
Spots(number)
On-screen activity
Core Category Television Activity
Total UK Television Activity
+19.0%2.5m spots
2.1m spots
Other Airtime
+15.4%3.0m spots
2.6m spots
All Airtime
+21.7%2.8m spots
2.3m spots
Children’s Airtime
+16.8%22.9m spots
19.6m spots
All Airtime
% change20052004
Figure 20

Food Advertising to Children – Annex 10: Recent Trends
Impact delivery by age-group
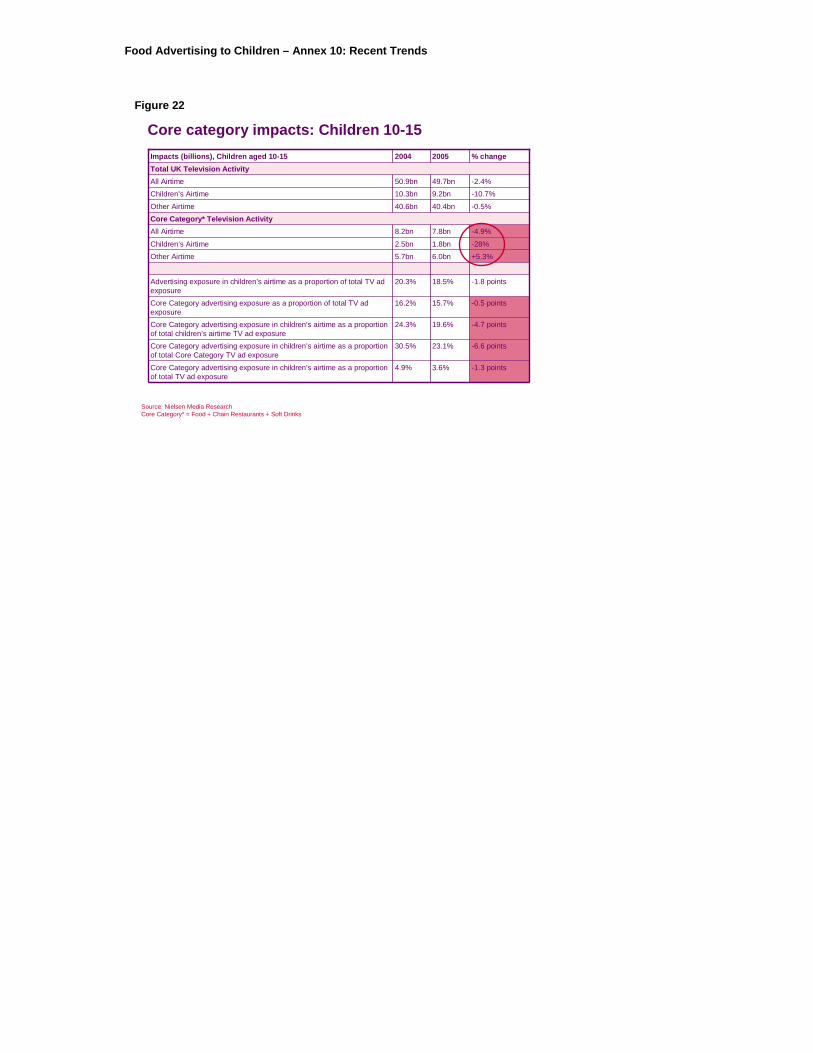
Figures 21 and 22 show impact delivery by age-group. The charts show that the decline in Core Category impacts is almost entirely driven by a reduction in impacts delivered to children aged 10 -15 in children’ airtime, (with no corresponding impact reduction among 4-9’s in children’ airtime). This is because viewing in children’s airtime among children aged 4-9 has been increasing over time (with the growth of dedicated children’s channels in the multichannel environment). This growth in viewing has counter-balanced, (or neutralised), the reduction in impacts among this age group resulting in zero net change. However viewing patterns in children’s airtime among 10 -15’s has been in decline which has resulted in an enhanced net reduction effect when coupled with falling impacts.
©Ofcom 21
Core category impacts: Children 4-9
Source: Nielsen Media ResearchCore Category* = Food + Chain Restaurants + Soft Drinks
-3%26.327.1bnOther Airtime
-1.4 points15.8%17.2%Core Category advertising exposure as a proportion of total TV ad exposure
+2.4 points42.5%40.1%Advertising exposure in children’s airtime as a proportion of total TV ad exposure
-1.2 points20.6%21.8%Core Category advertising exposure in children’s airtime as a proportion of total children’s airtime TV ad exposure
+4.7 points55.6%50.9%Core Category advertising exposure in children’s airtime as a proportion of total Core Category TV ad exposure
-15.8%3.2bn3.8bnOther Airtime-4.0bn4.0bnChildren’s Airtime
Core Category* Television Activity
Total UK Television Activity
-8.8%8.8%Core Category advertising exposure in children’s airtime as a proportion of total TV ad exposure
-7.7%7.2bn7.8bnAll Airtime
+6.6%19.418.2bnChildren’s Airtime+1%45.745.3bnAll Airtime
% change20052004Impacts (billions), Children aged 4-9
Core Category* impacts – Children 4-9Figure 21
Food Advertising to Children – Annex 10: Recent Trends
©Ofcom 22
Source: Nielsen Media ResearchCore Category* = Food + Chain Restaurants + Soft Drinks
-0.5%40.4bn40.6bnOther Airtime
-0.5 points15.7%16.2%Core Category advertising exposure as a proportion of total TV ad exposure
-1.8 points18.5%20.3%Advertising exposure in children’s airtime as a proportion of total TV ad exposure
-4.7 points19.6%24.3%Core Category advertising exposure in children’s airtime as a proportion of total children’s airtime TV ad exposure
-6.6 points23.1%30.5%Core Category advertising exposure in children’s airtime as a proportion of total Core Category TV ad exposure
+5.3%6.0bn5.7bnOther Airtime-28%1.8bn2.5bnChildren’s Airtime
Core Category* Television Activity
Total UK Television Activity
-1.3 points3.6%4.9%Core Category advertising exposure in children’s airtime as a proportion of total TV ad exposure
-4.9%7.8bn8.2bnAll Airtime
-10.7%9.2bn10.3bnChildren’s Airtime-2.4%49.7bn50.9bnAll Airtime
% change20052004Impacts (billions), Children aged 10-15
Core Category* impacts – Children 10-15Figure 22
Core category impacts: Children 10-15

Food Advertising to Children – Annex 10: Recent Trends
Radio listening & advertising activity
As seen earlier in this section, there was an above-average increase in Core Category advertising spend on radio. (Radio spend as a proportion of total Core Category ad spend increased from 2.8% in 1999 to 4.2% in 2005). This section looks further at recent trends in advertising activity on radio.
Listening behaviour
Analysis of listening trends is based on industry standard data supplied by RAJAR (Radio Joint Audience Research Ltd) 6. Nine in ten children (89%) listen to the radio each week. The average time children spend listening to the radio is 11.7 hours per week (based on those who listen). In comparison, adults spend 21.5 hours listening to the radio each week. Radio listening is skewed towards older children with 10-14 year old radio listeners tuning in for 12.8 hours per week, compared with 4-9 year old radio listeners who listen for around 9.8 hours each week.
Whereas adult listening is biased towards BBC stations (representing 55.0% of all listening), children’s listening is dominated by commercial radio stations (accounting for 74.5% of all listening). This difference may be related to market choice and the target audience of BBC stations compared with commercial stations. Unlike television there are few dedicated children’s radio stations or programming slots – this therefore leads to children listening to stations and programming aimed primarily at young adults or the adult population in general. Commercial radio stations represent 77.6% of listening by 4-9 year olds and 74.6% of listening by 10-14 year old children (Figure 23).
©Ofcom 23
Radio listening amongst children is skewed towards commercial stations
18.4 18.4 18.5
43.92.2 2.2 2.3
11.1
19.2 20.4 18.7
10.1
56.3 57.2 55.9
32.7
2.9 1.8 3.3 2.1
Children Children 4-9 Children 10-14 Adults 15+
% li
sten
ing
hour
s
Other stations
Commercial - Regional
Commercial - National
BBC - Regional
BBC - National
Split in listening hours
Source: RAJAR, Q4 2005
74.5% 77.6% 74.6%
42.8%
Figure 23
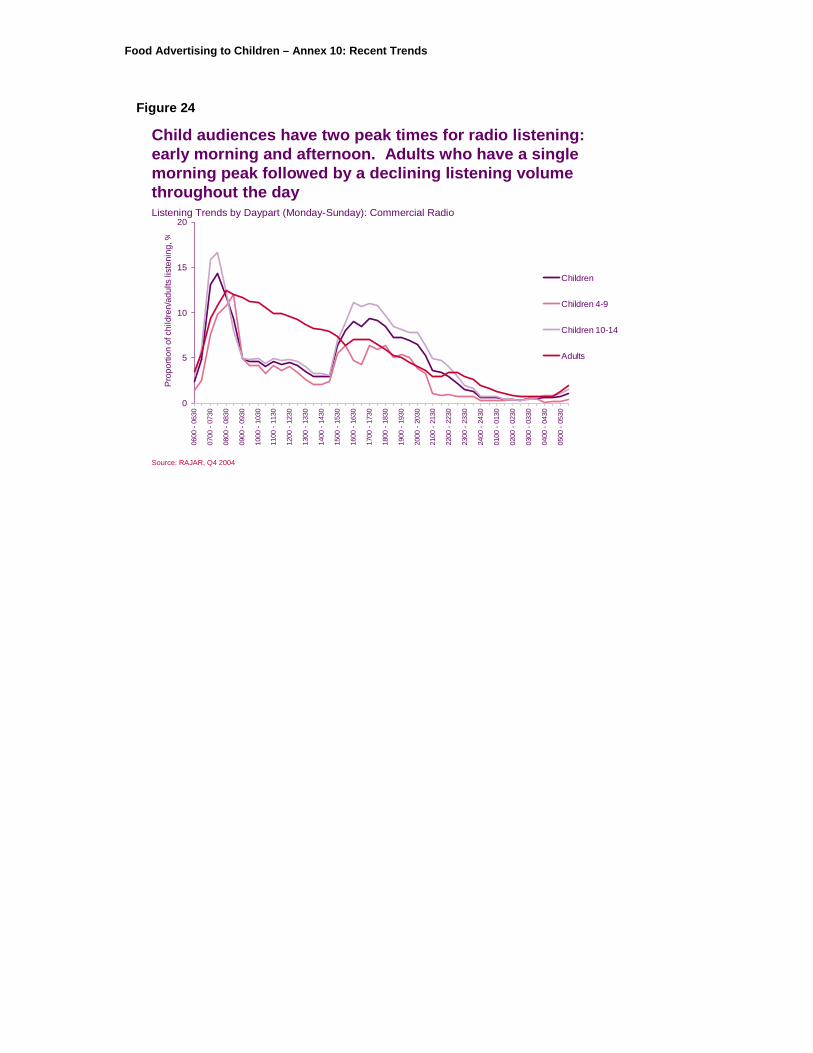
As shown in Figure 24, the time of day children listen to the radio differs significantly from adult listening times. Whereas children demonstrate two peaks in their listening during the early morning/breakfast and later in the day after 16:00, adult listening peaks in the morning, remains higher than children during daytime hours and steadily declines over the course of the day. 6 Data is based on Quarter 4 2004 RAJAR data.
Food Advertising to Children – Annex 10: Recent Trends
©Ofcom 24
Child audiences have two peak times for radio listening: early morning and afternoon. Adults who have a single morning peak followed by a declining listening volume throughout the day
0
5
10
15
20
0600
- 06
30
0700
- 07
30
0800
- 08
30
0900
- 09
30
1000
- 10
30
1100
- 11
30
1200
- 12
30
1300
- 13
30
1400
- 14
30
1500
- 15
30
1600
- 16
30
1700
- 17
30
1800
- 18
30
1900
- 19
30
2000
- 20
30
2100
- 21
30
2200
- 22
30
2300
- 23
30
2400
- 24
30
0100
- 01
30
0200
- 02
30
0300
- 03
30
0400
- 04
30
0500
- 05
30
Pro
porti
on o
f chi
ldre
n/ad
ults
list
enin
g, %
Children
Children 4-9
Children 10-14
Adults
Listening Trends by Daypart (Monday-Sunday): Commercial Radio
Source: RAJAR, Q4 2004
Figure 24

Food Advertising to Children – Annex 10: Recent Trends
Advertising activity
In volume terms, Core Category radio spend increased by £30.6m in 2004 to £36.6m in 2005. In 2005, Core Category radio spend accounted for 6.2% of total radio advertising spend – up from 5.3% in 2004 (Figure 25)
©Ofcom 25
Core Categories* represents an increasing share of the UK radio advertising market
Source: Nielsen Media Research. Total spend excludes Direct Mail & Internet spend as continuous data is unavailableCore Category* = Food + Chain Restaurants + Soft Drinks
Core Category activity: Total Media vs. Radio
9.3%8.8% 8.9%
10.0%
4.6%3.8%
5.3%6.2%
2002 2003 2004 2005
% of total UK MEDIAspend represented byCore Categories
% of total UK RADIO adspend represented byCore Categories
Figure 25
Figure 26 shows Core Category radio spend by sub-category. The ‘Big 5’ 7 categories represented 44% of total Core Category radio advertising spend in 2004 and 48% in 2005. The biggest sub category increases have taken place among Confectionery (8.9% to 13.3%) and Savoury Snacks (2.1% to 6.7%). Cereals have seen a decline (10.9% to 5.0%).
7 ‘Big 5’ – definition used by the FSA which includes confectionery, soft drinks, savoury snacks, fast food, pre-sugared cereals.

Food Advertising to Children – Annex 10: Recent Trends
©Ofcom 26
‘Big 5’ categories represent 48% of Core Category radio spend, up from 44% in 2004
Source: Nielsen Media Research Core Category* = Food + Chain Restaurants + Soft Drinks
Breakdown of Core Category Spend on Radio
15.3% 14.7%
6.5% 8.3%
8.9%13.3%
10.9% 5.0%2.0% 6.7%
20.0% 15.8%
36.4% 36.2%
0%
10%
20%
30%
40%
50%
60%
70%
80%
90%
100%
2004 2005
Prop
ortio
n of
Cor
e C
ateg
ory
Rad
io S
pend
, % All other Food
All other prepared &convenienceSavoury snacks
Cereals
Confectionery
Soft Drinks
Chain Restaurants
£30.6m £36.6m
Breakdown of Core Category TV Spend, 2005
Chain restaurants 9.8%
Soft Drinks 9.6%
Confectionery 15.4%
Cereals 12.1%
Savoury Snacks 4.3%
‘Big 5’ = 51.2%
All other prepared & conv. 8.9%
All other food 40.0%48%44%
Figure 26
Differences in radio and television spend activity can be seen when comparing activity during children’s television airtime. 23.9% of Core Category television spend during children’s television airtime is represented by Cereals advertisers – compared with 5.0% on radio. Similarly, Confectionery advertising accounts for 20.3% of Core Category spend during children’s television compared with 13.3% of radio spend (Figure 27). Therefore the type of activity on radio is notably different from that seen on television, particularly during children’s airtime.
©Ofcom 28
There are some differences between the breakdown of spend on radio & television – particularly during dedicated Children’s television airtime
Source: Nielsen Media ResearchCore Category* = Food + Chain Restaurants + Soft Drinks
Breakdown of Core Category spend: Comparison of Radio & TV spend
14.7
%
8.3%
13.3
%
5.0% 6.
7%
15.8
%
36.2
%
13.6
%
9.1%
17.6
%
14.9
%
3.3%
6.6%
35.0
%
18.0
%
8.2%
20.3
% 23.9
%
0.9% 3.
1%
25.7
%
11.4
%
9.5%
16.3
%
10.4
%
4.5%
8.4%
39.7
%
ChainRestaurants
Confectionery Savourysnacks
All other Food
Radio Total TV Airtime Children's Television Airtime Other Television Airtime
Figure 27

Food Advertising to Children – Annex 10: Recent Trends
Figure 28 compares the breakdown of Core Category child 8 impacts in 2005 across radio and television. In 2005, the ‘Big 5’ categories accounted for 55% of Core Category impacts on radio compared to 58.5% on television (figure 28). Comparison of radio and television activity highlights some key differences. Chain restaurants accounts for 17.2% of Core Category radio impacts compared with 13.6% of television impacts. Whereas Cereals account for 6.1% of radio impacts compared to 14.9% television impacts.
©Ofcom 28
Breakdown of Core Category impacts by sub-category: Radio vs. Television: Children 4-15
Source: Nielsen Media Research. Core Category* = Food + Chain Restaurants + Soft Drinks
Breakdown of Core Category Impacts by Sub-category: Children, 2005
17.2% 13.6%
9.8%9.1%
15.7% 17.6%
6.1% 14.9%6.2%
3.3%17.0% 6.6%
28.1%34.9%
0%
10%
20%
30%
40%
50%
60%
70%
80%
90%
100%
Radio Television
Prop
ortio
n of
Cor
e C
ateg
ory
Chi
ld Im
pact
s, % All other Food
All other prepared &convenienceSavoury snacks
Cereals
Confectionery
Soft Drinks
Chain Restaurants
58.5%55%
‘Big 5’‘Big 5’
Figure 28
8 Note: The definition of ‘children’ with regards to radio impacts is individuals aged 4-14 and for television impacts is individuals aged 4-15.
Food Advertising to Children – Annex 10: Recent Trends
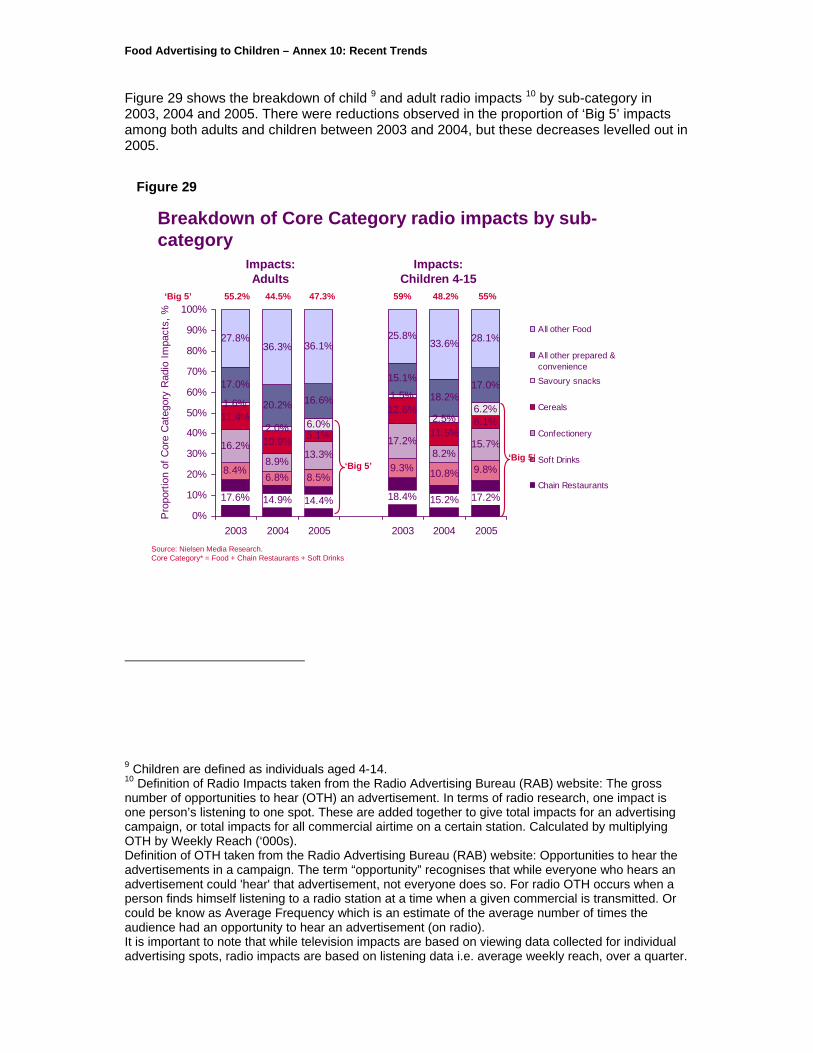
Figure 29 shows the breakdown of child 9 and adult radio impacts 10 by sub-category in 2003, 2004 and 2005. There were reductions observed in the proportion of ‘Big 5’ impacts among both adults and children between 2003 and 2004, but these decreases levelled out in 2005.
©Ofcom 29
17.6% 14.9% 14.4% 18.4% 15.2% 17.2%
8.4%6.8% 8.5%
9.3% 10.8% 9.8%
16.2%8.9%
13.3%17.2%
8.2%15.7%
11.4%
10.9% 5.1%
12.6%
11.5%6.1%
1.6%
2.0% 6.0%
1.5%
2.5%6.2%
17.0%
20.2% 16.6%
15.1%
18.2%17.0%
27.8%36.3% 36.1%
25.8%33.6% 28.1%
0%
10%
20%
30%
40%
50%
60%
70%
80%
90%
100%
2003 2004 2005 2003 2004 2005
Pro
porti
on o
f Cor
e C
ateg
ory
Rad
io Im
pact
s, %
All other Food
All other prepared &convenienceSavoury snacks
Cereals
Confectionery
Soft Drinks
Chain Restaurants
Breakdown of Core Category radio impacts by sub-category
Source: Nielsen Media Research. Core Category* = Food + Chain Restaurants + Soft Drinks
Impacts: Adults
Impacts: Children 4-15
‘Big 5’‘Big 5’
‘Big 5’ 55.2% 44.5% 47.3% 59% 48.2% 55%
Figure 29
9 Children are defined as individuals aged 4-14. 10 Definition of Radio Impacts taken from the Radio Advertising Bureau (RAB) website: The gross number of opportunities to hear (OTH) an advertisement. In terms of radio research, one impact is one person’s listening to one spot. These are added together to give total impacts for an advertising campaign, or total impacts for all commercial airtime on a certain station. Calculated by multiplying OTH by Weekly Reach (‘000s). Definition of OTH taken from the Radio Advertising Bureau (RAB) website: Opportunities to hear the advertisements in a campaign. The term “opportunity” recognises that while everyone who hears an advertisement could 'hear' that advertisement, not everyone does so. For radio OTH occurs when a person finds himself listening to a radio station at a time when a given commercial is transmitted. Or could be know as Average Frequency which is an estimate of the average number of times the audience had an opportunity to hear an advertisement (on radio). It is important to note that while television impacts are based on viewing data collected for individual advertising spots, radio impacts are based on listening data i.e. average weekly reach, over a quarter.