Annals of Warsaw University of Life Sciences – · PDF fileDepartment of Machine...
116
Annals of Warsaw University of Life Sciences – SGGW Agriculture (Agricultural and Forest Engineering No 52) Warsaw 2008
Transcript of Annals of Warsaw University of Life Sciences – · PDF fileDepartment of Machine...

Annalsof WarsawUniversity
of Life Sciences
– SGGWAgriculture
(Agricultural and Forest Engineering No 52)
Warsaw 2008

EDITORIAL BOARD
Czes aw Waszkiewicz – Editor-in-ChiefAleksander Lisowski – Deputy EditorMarek Gaworski – Managing Editor
EDITORIAL ADVISORY COUNCIL
Zbigniew Majewski (Poland) – PresidentRadomir Adamovsky (Czech Republic)Jean Marie Bouvier (France)Andrzej Chochowski (Poland)Aleksander Tsyganow (Belarussia)Nabil Rifai (Canada)Aleksander Szeptycki (Poland)Ediz Ulusoy (Turkey)
EDITORIAL STAFFJadwiga RydzewskaKrystyna Piotrowska
ISSN 1898-6730
PRINT: Agencja Reklamowo-Wydawnicza A. Grzegorczyk, www.grzeg.com.pl
WARSAW UNIVERSITY OF LIFE SCIENCESe-mail: [email protected]

Contents
VISELGA G. Investigations on soil conser-vation and precision of tillage with tractor and gantry units 5
VISELGA G., KAMI!SKI J.R. Precision and energy parameters of the positioned gan-try module 13
LISOWSKI A., "WI#TEK K., KOSTYRA K., CHLEBOWSKI J. Methods for evalua-tion of breaking up of maize chaff separated on the sieve separator 23
JÁNSKÝ J., ŽIV$LOVÁ I. Economic ef-Þ ciency of growing and technological pro-cesses for cereals 31
WASZKIEWICZ CZ., SYPU%A M. Effect of storage conditions on biological value of wheat and barley grain 39
SOJAK M., G%OWACKI SZ. Investigations on drying of new pumpkin varieties 45
MAJKOWSKA M., KUPCZYK A. Analysis of optimal values of air stream supplied in the clusters 51
KLIMKIEWICZ M. Optimization of selec-tion of reconditioned parts in repair of injec-tion pump 59
WINICZENKO R. Properties and structure of spheroidal chilled cast iron welded by friction 67
ELMASRY G., WANG N., VIGNEAULT C. Hyperspectral imaging for chilling injury de-tection in Red Delicious applesPart 1: Establishment of a hyperspectral imaging system 73
ELMASRY G., WANG N., VIGNEAULT C. Hyperspectral imaging for chilling injury de-tection in Red Delicious applesPart 2: Selection of optimal wavelengths for chilling injury detection 81
POLÁK M., NEUBERGER P., SOU&EK J. Experimental verifying of mathematic model for biomass combustion 89
KÁRA J., PASTOREK Z., ADAMOVSKÝ
R. Results of veriÞ cation of the slaughter waste anaerobic fermentation process 95
TSED E., BASILENKO Z., KOROLEVA L., LEBEDOK E., IVANOVA I. New fermenta-tion source in the technology of fermented non-alcoholic beverages 103
WA"CI!SKI T., MICHALCZYK A. Ag-ricultural business extension aided by the Case-Based Reasoning method 107


Annals of Warsaw University of Life Sciences – SGGWAgriculture No 52 (Agricultural and Forest Engineering) 2008: 5–12(Ann. Warsaw Univ. of Life Sci. – SGGW, Agricult. 52, 2008)
Abstract: Investigations on soil conservation
and precision of tillage with tractor and gantry
units. The compressed soils can be loosened more intensively with the use of the rotary cultivators. It is suggested to separate stones and clods in the stony soils and the bigger stones should be removed from the growing zone of potatoes. The horizontal cultivators are more universal, they can be used to loosen and to mulch the soil. It is purposeful to use the technology of the harrowing and the multiple hilling. Thus, the space between rows is compacted by the wheels of the tractors. The number of passes is minimized during the potato growing. The new generation of the tractors with front and rear linking systems makes more perfect combined aggregates, when some of them are mounted on the front of the tractor and others on the rear of the tractor. Gantry agriculture has great inß uence on the soil structure. It enables to investigate theoretically possibilities of minimization of the interaction between the chassis and the soil compacting by different types of circular and shuttle gantry modules. It is possible to investigate the inß uence of the uneven Þ elds on curvature of chassis paths and to select the chassis types.
Key words: soil compacting, aggregates, gantry modules, chassis, precision, technology, mulch.
INTRODUCTION
The trends of higher operational speed and labour productivity are related with an increase in the used capacities and enlargement of aggregates, therefore, they contradict the principles of soil
conservation [Bareisis, Šniauka 2000, Powa ka 2007, Skrebelis 2007].
The problem of soil degradation has resulted from the impact of agricultural machinery chassis and application of chemicals. Slowing down a further deterioration of soil is a difÞ cult, long-term problem, as the soil has to be not only conserved but also improved in order to meet the needs of future generations. A soil conservation issue is especially urgent due to high energy costs in potato growing [Viselga, Kami'ski 2006].
A fertile soil is formed as a result of thorough work and substantial energy costs. It is important not to underestimate this result, i.e. not to damage the soil, its humus, microclimate and energy reserves accumulated in the soil.
The gantry agriculture has great inß uence to the soil conservation. If the cultivation of the deeper soil surface, combined aggregates and other tested means decrease the negative results on the interaction between the chassis and the soil, the gantry agriculture repeals the reasons to brake the soil structure by the chassis.
The use of gantry systems is the shortest way to increase the yield, to minimize energy consumption and pollution of the surroundings, and to improve the working conditions of the staff [Viselga 2006].
Investigations on soil conservation and precision of tillage with tractor and gantry units
GINTAS VISELGA Department of Machine Building, Vilnius Gediminas Technical UniversityVilnius, Lithuania

6 G. Viselga
EXPERIMENTAL OBJECTIVE
The experimental objective is to group, analyse and generalise the key trends and needs of Þ eld crop and potato production modernisation, and to determine the relationship between them.
To investigate the processes of soil deep loosening, furrow loosening by rotary implements separating and crushing the clods, and mulching when growing potatoes with permanent tramlines and on enlarged furrows, as well as to determine possibilities for the reduction of soil packing energy costs per unit of production and for potato lifting improvement.
To evaluate the possibilities of the simplest circular energetic modulus (Fig. 1) of the gantry agriculture, the conditions for the operation of the main working parts in the circular trajectory and to use the best results to make the perspective simpliÞ cation trends of the technological schemes of the power modulus of the reciprocal movement type.
EXPERIMENTAL METHODS
The following composite parts of combined aggregates testing stands were formed: rotary cultivator – mulching equipment, tramlining equipment with deep loosening chisel shares, clod and stone separator, special spur-type roller. These implements can be aggregated with 14 kN class MTZ-82 tractors autonomously or Þ tted in combined aggregates.
Tramlining equipment is designed to form tramlines and to loosen the soil between them while planting potatoes, as well as for localisation of soil rich in humus or green manure while preparing the soil for potatoes. It consists of an universal frame, two tramline hillers, two support depth control wheels, and three chisel shares. Tramline hillers are placed in front of tractor wheels.
For the determination of soil hardness we used an electronic self-writing penetrometer CP20 (England) with a standard 12.5 mm diameter cone-shaped tip. Soil resistance to this tip pressing
Aα2
l2
Rp1
Rp2
l1= 0; α1= 0.
A
FIGURE 1. The scheme of the power modulus of the circular gantry system

Inveatigations on soil conservation and precision... 7
is recorded in the memory of this apparatus every 15 mm from the surface to the set depth. For measuring of soil hardness distribution in the width of the whole interrow and for the measuring of furrow proÞ le, besides hardness metering equipment, we used 1.5 m long horizontal plank with legs stuck in the soil, in which 1,4 m length on both sides every 10 mm (with 5 mm sliding) holes of 15 mm diameter were drilled.
We investigated the circular (Fig. 1) and shuttle gantry aggregates. The circular carriage driven by the electric motor rotates the cantilever beam around the support centre. The implement mounting cart moves across the beam. Different working implements can be mounted on this cart and they would acquire the spiral movement or that of concentric circles. The shuttle units were investigated by laser measurement implements.
EXPERIMENTAL RESULTS
Major engineering soil conservation means in Þ eld crop and potato production, besides tillage of soil with adequate moisture regime at optimum terms, education of agricultural producers, control of environmental aspects, can be grouped into three main parts: means related to machinery improvement, advancement of technologies and reduction of chemical pollution.
Firstly, an important and considerable part is devoted to the reduction of chassis pressure on the soil. One can Þ nd traditionally used means among them such as: doubling of wheels, special low-pressure tyres, caterpillar and semi-
caterpillar chassis. Regardless high energy costs, on stony soils it is necessary to remove small stones over 3 cm in size. Our long-term experiments suggest that from energy and soil conservation point of view it is most efÞ cient to remove stones in one time from the whole arable layer, while preparing the soil for potatoes by combined complex aggregates. Arable layer is sifted, stones are separated into fractions: small stones up to 6–8 cm are crushed and spread in the soil, bigger stones are removed from the Þ eld in a hopper. Up to 40 of fuel is economised, potato yield is increased about 10 and anti-erosive effect is created.
An important role is played by advancement of machinery design – evenly operating ploughs, mouldboard less implements and ploughs ploughing with mounted rotary soil loosening or clod crushing implements. Optimum operation regime is of special importance for actively operating working parts.
When preparing the soil by conventional cultivators with passive working parts the soil and interrows are passed several times during the spring soil preparation. Soil hardness increases with every pass (Fig. 2).
Mulching of green manure crops oil radish and white mustard in the surface 10 cm soil layer reduces soil hardness (Fig. 3), weed incidence on the Þ elds (Fig. 4), increases productivity, nutrient content and the amount of earth-worms in the soil as much as 10 times. It is an undoubtedly valuable soil improvement means. No increase in the amount of earth-worms was found after spraying potatoes with pesticides.

8 G. Viselga
FIGURE 2. The relationship between soil hardness in the middle of an interrow and the number of passes of tractor’s MTZ-82 earthing-up and planting aggregates
FIGURE 3. Effect of mulching on soil hardness in potato furrows before potato lifting
FIGURE 4. Effect of soil loosening (a), mulching and cultivation methods (b) on weed incidence

Inveatigations on soil conservation and precision... 9
When loosening by a combined aggregate and planting separately, the amount of clods over 30 mm in diameter collected during potato lifting was 28.5% lower and on average 18.4% lower in all the experimental treatments than in the control.
While setting modernisation trends of Þ eld crop production a special attention should be drawn to the reduction of energy costs. It is equal to the reduction of production costs and enhancement of proÞ tability. It goes without saying that on cultivated, not compacted soils energy costs are always lower. Therefore, all the three mentioned trends are interrelated.
Replacement of organic fertilisers by mulching of green manure crops and growing of ecological production are also ways to save energy costs, as these means
result in lower energy consumption, lower soil compaction and better suppression of weeds. Technologies of precision and gantry agriculture are completely new. Experimental results of circle and shuttle gantry systems [Viselga 1998] have shown that wheel skidding is as low as 1%, and soil loosening energy costs can be reduced as much as 20%. Installed power according to the results of our tests makes up only 3–5 kW, and for ploughing and cultivation only about 240 kWh/ha is used. In gantry agriculture the amount of production per area unit
is increased, as it is possible to narrow interrows and protection zones of some crops and not to pack the soil. It is a technology of the future.
The operation width of the gantry system implements when perpendicular mounted on the beam depends on their distance up to the revolution centre Rp and the beam l. The smallest divergence of the operation width from the design one that is equal to 0.18 m (Fig. 5) will be when the implements are under the beam, i.e. l = 0. But in some cases it is difÞ cult to do l = 0 in practice, then the implements should be turned by
the radius angle απ
= −2
arctgR
l
p
depending on the turn. At that time the operation width of the plough will can be calculated according to equation:
where: an – the length of the ploughshare blade, bp – the design width of the plough.
When the turn radius of gantry implements is (3–6) m, one side of the proÞ le of the potato furrow, closer to the rotation centre, has the smaller area than the other side of the proÞ le (Fig. 6). When the implements move away from the centre, on the contrary, the area of the peripheral side of the furrow proÞ le is smaller than the area of the other side of the furrow proÞ le: when the turn radius is (9–12) m, the furrow asymmetry is 13%, and when it is (15–18) m, the
bb a
R lb a
R lb
a b
p np
p np
p
n p
=+
+ + ++
+( )−
3
42
3
4arctg
22 22 2
2 22 2
2 2sin
+
− + 2 2R lp ++−a bn p
2 2
4

10 G. Viselga
furrow asymmetry is 1%. The furrow asymmetry is insigniÞ cant, when the hiller is at (6–12) m distance from the rotation centre.
Experimental tests showed that the operation speed has the greatest inß uence to the work quality of the hilling bodies, if compared with all the other tested implements. The operation speed should be not smaller than 0.55 m per second because only at this speed the symmetrical row proÞ les may be formed (Fig. 6).
From the shuttle modules the simplest are the positional beam with two chassis
and longitudinally mounted mowing implements. The Þ eld area is unlimited, the motor power is 3–4 kW.
The wheels of positional shuttle modules precisely copy unevenness of Þ eld and the beam has more deviations of straight movement (Fig. 7). Walking chassis with length support decreases this deviations and quantity of positional corrections. The gantry modules and especially positional shuttle modules in comparison of the tractors decrease motor power and deviations from straight movement and width of rows.
FIGURE 5. The relationship of the operating width of the plough body on its distance to the beam and the turn radius, when the implements are perpendicular to the beam
0
5
10
15
20
0 15 30 45 60
262,2 cm2 284,4 cm2
(3-6)m; (0,16-
0
5
10
15
20
0 15 30 45 60
(9-12)m; (0,47-
299,6 cm2266,1 cm2
0
5
10
15
20
0 15 30 45 60
(15-18)m; (0,79-
260,8 cm2 258,9 cm2
ñm
ñm
FIGURE 6. The row proÞ les and their cross-section areas in dependence of turn radius

Inveatigations on soil conservation and precision... 11
CONCLUSIONS
Tractors with a front suspension rod and a front power shaft, evenly ploughing ploughs with mounted loosening implements, mouldboard less aggregates, mulching imple-ments, gantry systems, complex and combined implements are the means of Þ eld crop production modernisation which should be used as widely as possible.By one pass of a combined soil tillage aggregate and experimental potato growing technology involving narrow-wheeled tractors it is feasible to reduce soil hardness in the zone of tracks 1.5 times and to increase the depth of friable soil to 22 cm.Rotary cultivators loosen the soil more intensively than mouldboard ploughs or passive shares of cultivators. The soil loosened by these implements as well as mulched soil is packed less before potato planting, the clod content is lower in them, the weed
•
•
•
incidence is 2.5 times lower and the tubers are 18–28 cleaner.Soil friability, reduction of harmful effect of soil compaction by wheels and mulching of green manure crops increased potato yield 40.3% and reduced dirt content. Very important is the indicator of incorporation fullness of green manure crops, as mineralisation of green manure in the soil surface is low.The angle of the deviation of the plough body and other implements from the design position if directly proportional to the body distance from the bar the gantry circular module and width is smaller than the design one not more than 10%. The ploughing depth at the centre is smaller by 32 mm than in the peripheral part.To avoid the furrow asymmetry at the centre, the hillers should be as close as possible to the circular module bar and their operation speed should be increased, at least, up to 0.55 m/s.
•
•
•
•
FIGURE 7. The inß uence of shuttle module chassis type to quantity of positional correction

12 G. Viselga
REFERENCES
BAREIŠIS R., ŠNIAUKA P. 2000: Tiltini( žemdirbyst)s sistem( tyrimai. LŽ* Universiteto mokslo darbai 5 (1).
POWA%KA M. 2007: Changes in soil physical properties in arable layer under pressure of tractor outÞ t wheels. Annals of Warsaw University of Life Sciences – SGGW, Agriculture No 51: 13–17.
SKREBELIS S. 2007: Peculiarities of plowless tillage technology when growing crops. Annals of Warsaw University of Life Sciences – SGGW, Agriculture No 51: 29–34.
VISELGA G. 1998: Tiltines zemdirbystes principu taikymo mazuose plotuose tyrimai. Daktaro disertacija. Raudondvaris.
VISELGA G. 2006: Research of Accuracy Parameters of the Gantry Course. Solid State Phenomena. Vol. 113 “Mechatronic Systems and Materials”, p. 50–54.
VISELGA G., KAMI!SKI J.R. 2006: Analy-sis of soil compaction at potato cultiva-tion. PAN. Zeszyty Problemowe Postepów Nauk Rolniczych, 508: 203–208.
Streszczenie: Badania konserwuj cej uprawy
gleby z wykorzystaniem ci gnika oraz urz dze-
nia bramowego. W porównaniu z narz+dziami biernymi, ugniecion, gleb+ znacznie intensyw-niej spulchniaj, brony aktywne. Brony wirniko-
we mog, by- stosowane zarówno w tradycyjnej uprawie przedsiewnej, jak równie. podczas siewu nasion w mulcz. W uprawie ziemniaków zalecane s, bronowanie i wielokrotne obsypywanie. Zaleca si+ usuni+cie kamieni, szczególnie z pól przezna-czonych pod upraw+ ziemniaków. Wielokrotne przejazdy powoduj, nadmierne ugniecenie gleby w mi+dzyrz+dziach ko ami ci,gników i maszyn rolniczych. D,.,c do ograniczenia liczby prze-jazdów maszyn po polu wyposa.a si+ ci,gniki w przedni i tylny TUZ. Umo.liwia to stosowa-nie z o.onych, wieloczynno/ciowych agregatów uprawowych zawieszanych z przodu i z ty u ci,-gnika. To pozwala zmniejszy- liczb+ przejazdów do niezb+dnego minimum. Natomiast ca kowite ograniczenie ugniatania gleby mo.na uzyska- poprzez zastosowanie systemu tzw. rolnictwa bramowego. W tym wypadku zabiegi agrotech-niczne wykonywane s, narz+dziami montowany-mi na wózku przetaczaj,cym si+ po specjalnych szynach. Stwierdzono korzystny wp yw takiego systemu uprawy na struktur+ i Þ zyczne w a/ciwo-/ci gleby.
MS. received June 2008
Author’s address:Gintas ViselgaVilnius Gediminas Technical University, Department of Machine Building, LT-03224 Vilnius, J. Basanaviciaus St. 28, Lithuaniae-mail: [email protected]

Annals of Warsaw University of Life Sciences – SGGWAgriculture No 52 (Agricultural and Forest Engineering) 2008: 13–21(Ann. Warsaw Univ. of Life Sci. – SGGW, Agricult. 52, 2008)
Abstract: Precision and energy parameters
of the positioned gantry module. The course of the positioned gantry module is maintained by a laser instrument. A laser beam generator emitting a vertical beam is placed at the end of the experimental Þ eld. A laser beam catcher with photo diodes is mounted on a positioned gantry module replaceable support. Course deviations were assessed in two cases: when laser, straight-course maintaining mechanism was mounted at the same end of the spar as positioning trundle; and when it was mounted at the middle of the spar. Furthermore, we estimated how course deviations vary when changing inter-axial distance of laser catcher photodiodes. Electromechanical transmitter was used in the tests. Gantry module is positioned by a special positioning trundle. It is run by a 12 V electric motor through a worm self- -braking reduction gear.
Key words: gantry unit, shuttle movement, accuracy parameters, positioning, straight-line course movement.
INTRODUCTION
Gantry unit allows to dispense with differential global positioning system (DGPS), since a straight-line course can be maintained by special permanent tramlines using cheaper means such as gyroscopic system or according to laser beam. Some researchers conÞ rm that gantry units can be more precise than DGPS [Holt, Tillet 1989, Quick 1987], and due to the simpler automatic
control system, gantry units can be more economical [Viselga 2006, Viselga, Kami'ski 2006, Viselga, Bareisis 2003]. There are two types of shuttle movement gantry units:
the ones whose chassis together with the working parts inertly Þ tted on gantry spar move along the object and at headlands they are re-arranged at working width to the adjacent strip of land;with working parts moving across the Þ eld during operation with the beam periodically positioned along the object according to the working width of the working parts.The second type has one major
advantage – the discrepancy between energy needs for the positioning of spar and for working parts motion declines the installed power. In order to integrate the chief potentials in the shuttle movement gantry module one has to study the methods for precision increasing using automatically controlled more straight forward means that do not require direct involvement of man. In the future this would allow to refuse internal combustion engines in the gantry units as well as unreeling electric cables and to change over to the use of other energy sources [Viselga 1989].
•
•
Precision and energy parameters of the positioned gantry module 1GINTAS VISELGA, 2JAN R. KAMI!SKI1Vilnius Gediminas Technical University, Department of Machine Building, Vilnius, Lithuania2Department of Agricultural and Forest Machinery, Warsaw University of Life Sciences – SGGW, Warsaw, Poland
14 G. Viselga, J.R. Kami!ski
EXPERIMENTAL OBJECTIVE
To identify possibilities to reduce deviations of straight-line course movement and positioning in relation to the effect of micro and macro unevenness of the Þ eld, by choosing chassis type, control methods and parameters, and to estimate technological and energetic efÞ ciency of the model.
EXPERIMENTAL METHODS
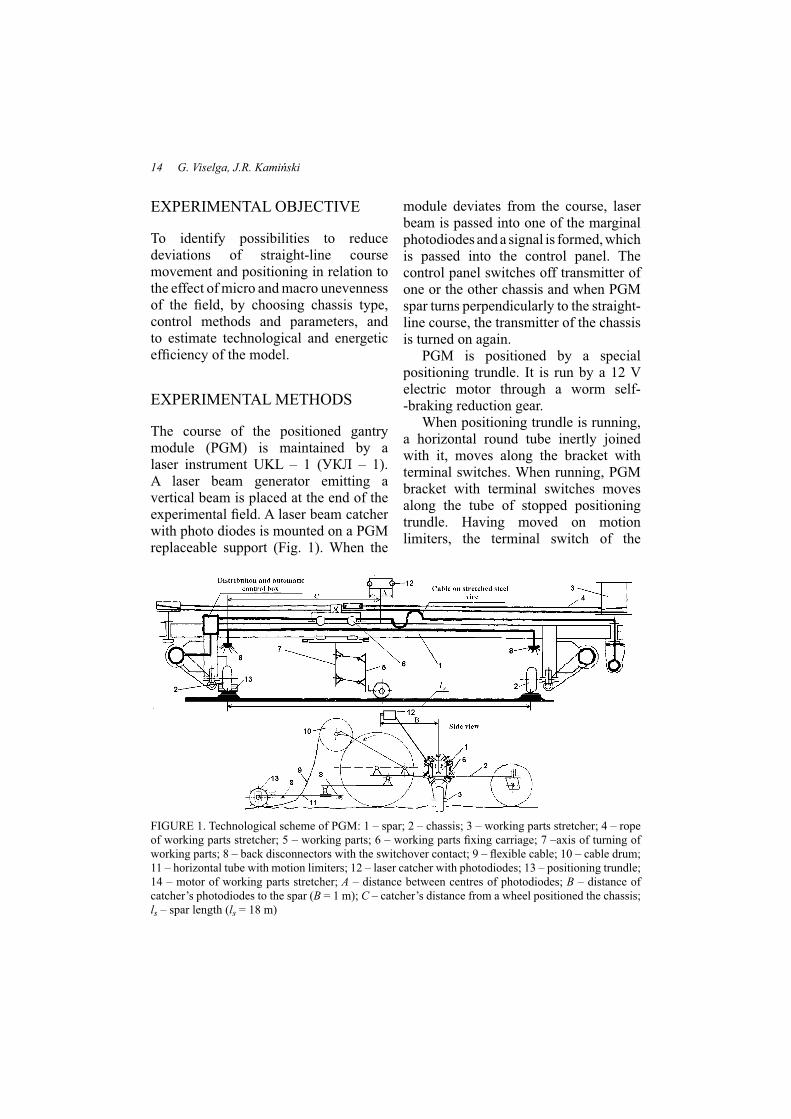
The course of the positioned gantry module (PGM) is maintained by a laser instrument UKL – 1 (012 – 1). A laser beam generator emitting a vertical beam is placed at the end of the experimental Þ eld. A laser beam catcher with photo diodes is mounted on a PGM replaceable support (Fig. 1). When the
module deviates from the course, laser beam is passed into one of the marginal photodiodes and a signal is formed, which is passed into the control panel. The control panel switches off transmitter of one or the other chassis and when PGM spar turns perpendicularly to the straight-line course, the transmitter of the chassis is turned on again.
PGM is positioned by a special positioning trundle. It is run by a 12 V electric motor through a worm self--braking reduction gear.
When positioning trundle is running, a horizontal round tube inertly joined with it, moves along the bracket with terminal switches. When running, PGM bracket with terminal switches moves along the tube of stopped positioning trundle. Having moved on motion limiters, the terminal switch of the
FIGURE 1. Technological scheme of PGM: 1 – spar; 2 – chassis; 3 – working parts stretcher; 4 – rope of working parts stretcher; 5 – working parts; 6 – working parts Þ xing carriage; 7 –axis of turning of working parts; 8 – back disconnectors with the switchover contact; 9 – ß exible cable; 10 – cable drum; 11 – horizontal tube with motion limiters; 12 – laser catcher with photodiodes; 13 – positioning trundle; 14 – motor of working parts stretcher; A – distance between centres of photodiodes; B – distance of catcher’s photodiodes to the spar (B = 1 m); C – catcher’s distance from a wheel positioned the chassis; ls – spar length (ls = 18 m)

Precision and energy parameters of the positioned gantry module 15
electric motor switches off transmitter of the chassis and switches on motors of working parts carriage stretcher and of positioning trundle transmitter. When positioning trundle has run the set positioning distance, motion limiters on the tube press the terminal off switch and the trundle stops. The distance that PGM runs between stops, is set by shifting motion limiters on the tube of positioning trundle. When the working parts carriage has moved to the end of its motion, the terminal switch is pressed, the motor of working parts carriage stretcher’s transmitter is switched off and motors of chassis transmitters are switched on. The above-described cycles revolve.
Precision of PGM stops in set positions was measured in series of three replications. Command to stop by a signal of an electric control scheme was given by a mechanism of positioning trundle.
Precision of PTM stops in a set position was assessed in the following way:
on stopping, special marks were made on the soil surface according to special supports in tramlines;afterwards a line was stretched within the length of the experimental plot, parallel to tramlines at marks in order to maintain measuring straightness in the course direction;the distance between the marks was measured by a tape-measure stretched at the line ties.PGM straight – line course deviations
were measured along the whole length of the experimental plot by stretching the line and tape-measure, leaving the same distance from the middle of the tramline at the ends. The imprint of the middle of
•
•
•
chassis support wheels protector in the soil of tramlines was considered as the middle of tramline. The distance from the line to the middle of the tramline was measured by a ruler every 0.5 m. PGM course deviations were assessed in three replications in two cases: when laser, straight-course maintaining mechanism was mounted at the same end of the spar as positioning trundle (C = 0); and when it was mounted at the middle of the spar (C = ls/2 = 6 m). Furthermore, we estimated how course deviations vary when changing inter-axial distance of laser catcher photodiodes.
Electromechanical transmitter was used in the tests.
Average soil moisture content in the tramlines was: 6.1–12.6% at the 50 mm depth, 8.7–13.2% at the 50–100 mm depth.
EXPERIMENTAL RESULTS
The right and the left chassis of PGM move on the surfaces with different evenness.
According to the experimental data of tramlines unevenness measuring and computer chassis simulation programme developed in the Matlab environment, we obtained positioning deviation results of PGM individual chassis run between po-sitions distances or number of positions to permissible set position (Fig. 2). They enable to compare the effects of wheel chassis tramlines levelling on the correc-tions of the set straight-line course.
In the case of wheel chassis the wheels are in contact with the broken line of tramlines.

16 G. Viselga, J.R. Kami!ski
When moving along natural non-levelled tramlines both tracks need levelling, because levelling of one tramline even increases the number of positions to corrections and increases the inter-difference of the distance done by the chassis in the direction of the course during correction. This results from the fact that when both chassis move along non-levelled tramlines their unevenness compensate one another.
When positioning trundle and photodiodes of laser catcher with A = 30 mm inter-axial distance were mounted on the same chassis (C = 0), mean course deviation of this chassis amounted to 67.6 mm, and mean square deviation !15.0 mm (Fig. 3). Straight-line course deviations of the other chassis were determined by the unevenness of its tramline and other already-mentioned factors, therefore its mean straight-line course deviation was higher (102.2 mm), and mean square deviation was considerably higher !33.9 mm.
When photodiodes are mounted in the middle of the spar (C = 6 m) and the left
chassis is positioned by the trundle, mean deviation from the straight-line course of the right chassis signiÞ cantly declines, compared with the Þ rst case (75.6 mm) (Fig. 4). Its average straight-line course deviation are smaller (25.5 mm). Mean square deviations of straight-line course deviations were 4.1 mm bigger for the right chassis.
Precision of positioning depends on the speed of PGM. When increasing the speed from 0.08 m/s to 0.24 m/s, the distance between the left, positioned by a trundle, chassis stops in the positions increased by on average 31 mm, and that of the right chassis by 20 mm. When the speed is increased from 0.08 m/s to 0.39 m/s, this distance increases by 61 mm and 55 mm, respectively. Average positioning square deviation of the chassis positioned by a trundle is lower and at a speed of 0.08 m/s it reached on average !32 mm. An increase in the chassis speed results in an increases in mean square deviation. At a speed of 0.38 m/s it was !50 mm.
Average square deviations of the distance between positions of the right
0
10
20
30
40
50
60
70
80
1 2 3 4Succession of corrections
Num
ber
of p
ositi
ons
to c
orre
ctio
ns both tramlines of chassis not levelled
one tramline levelled
FIGURE 2. The effects of tramline on the frequency of course correction

Precision and energy parameters of the positioned gantry module 17
0
20
40
60
80
100
120
140
160 . 33,5
4
4,5
5
5,5
6
6,5
7
7,5
8
8,5
9
9,5
1010,5
1111,51212,513
13,514
14,5
15
15,5
16
16,5
17
17,5
18
18,5
19
19,5
20
20,521
21,5 22Left chassis
Right chassis
Distance coveredby the chassis, m
Cou
rse
devi
atio
n
of c
hass
is, m
m
FIGURE 3. Course deviation, when positioning trundle and photodiodes of laser catcher were mounted on the left chassis
0
20
40
60
80
100
120 .3
3,5
4
4,5
5
5,5
6
6,5
7
7,5
8
8,5
99,5
1010,51111,512
12,5
13
13,5
14
14,5
15
15,5
16
16,5
17
17,5
1818,5
19Left chassis
Right chassis
Distance coveredby the chassis, m
Cou
rse
devi
atio
n
of c
hass
is, m
m
FIGURE 4. Course deviation, when photodiodes are mounted in the middle of the spar and the left chassis is positioned by the trundle

18 G. Viselga, J.R. Kami!ski
chassis positioned according to the bend of the spar were by on average 1.6––2.1 times higher due to differences in tramline unevenness.
The distance between photodiodes, when A = 20–30 mm did not have any signiÞ cant effect on the positioning precision of the right chassis positioned by a trundle. Mean deviations ranged between 62–64 mm, and mean square deviations amounted to 19–26 mm, mean deviations of the other chassis ranged within wider limits of 29–63 mm, and mean square deviation when increasing the distance between photodiodes from 50 to 67 mm, increased by 1.3 times, from 81 to 104 mm.
On the basis of the above-mentioned data we can Þ nd that positioning speed is a decisive factor for positioning precision. With increasing speed, inertia forces increase when stopping or starting during positioning, which increases positioning deviations.
Variation of asynchronous motors power of electromechanical transmitter is rather typical (Fig. 5a). During positioning, the power depended on the speed of chassis. During automatic actuation of chassis motors the power slightly exceeded the mean value. At 0.083 m/s speed of chassis the power inappreciably ß uctuated and amounted to on average 0.08 kW. During the course corrections when motors temporarily switched off, the power declined to zero. Duration of corrections was about 0.8––1.0 s. The power of individual motors of chassis slightly differed, most likely due to the different distances covered during skid.
Motor power of electromechanical transmitter of rope stretcher of implement
carriage at actuation moments was at its peak, up to 4.8 kW, and during stabilisation of implement traction resistance, declined to 0.74 kW. The length of peak was 0.8–1.2 s. Due to these power peaks, the working width of the implements was limited.
An increase in positioning speed of PGM with an electromechanical transmitter to over 0.1 m/s was complicated due to the impacts during transitional processes.
Comparison of power utilisation graphs presented in Figure 5 suggests that chassis speeds in the case of electromechanical transmitter were 4.7 times lower, and the power of chassis differed by 3.7 times, i.e. with increasing speed the power increases less. Implement speeds in the case of hydromechanical transmitter were by 1.76 times higher, and the power 3 times higher compared with implement carriage pulling using electromechanical transmitter. This increase in power occurred due to the ß ow in throttle transmitter. When throttling is reduced, i.e. when revolution frequency is reduced by a mechanical transmitter, the power does not increase signiÞ cantly.
Low power requirement of chas-sis enables to position chassis even by a muscle power of man. The power of implement carriage stretcher is higher and increases with increasing the work-ing width of implements. The total re-quired power can be fully generated by solar energy photoconverters, having mounted over the spar and chassis. The area of PGM cover Þ tted up from the photoconverters ls × 2b would be 80–100 m2 for 20 m long spar and would protect PGM mechanism from precipitation. In

Precision and energy parameters of the positioned gantry module 19
the long run, it is more viable to use the energy of chemical fuel converters for PGM or to combine it with the use of so-lar energy.
For the calculation of energy input, it is necessary to estimate the capacities and power of implements Wimpl. and chassis Wchas :
Wimpl. = 0.36 lsBp/tp, =
= 0.36 Bpvimpl., ha/h (1)
Wchas. = 0,36q/t =
= 0,36 lpvchas., ha/h (2)
where: lp – positioning distance, m.
Since we cannot add these capacities or calculate their average, to Þ nd total PGM capacity we have to calculate working time input per ha of implements and positioning and to add it. Total PGM labour efÞ ciency is calculated as an inverse value of total working time input.
0,0
0,5
1,0
1,5
2,0
2,5
3,0
3,5
4,0
0 10 20 30 40 50t, s
N, kW
of implement (P pv)
of left chassis (P k)
of right chassis (P d)
total (P)
positioning
N=Nk+Nd
Work of implement carriage
N=Npad
Nmax=4,77kW
correction
positioning
N=Nk+Nd
correction
a)
implement carriage N pad)
left chassis (Nk)
right chassis (Nd)
total power (N)
0,0
1,0
2,0
3,0
4,0
5,0
6,0
7,0
130 135 140 145 150 155 160t, s
N, kWpositioning
correction
work of implement carriagepositioning
work of implement carriage
correction
b)
a – in electromechanical transmitter (mean parameters: vchas. = 0,083 m/s Nvaž = 0,89 kW, vpad = 0,57 m/s, Npad = 0,74 kW) b – in hydromechanical transmitter (vchas. = 0,390 m/s, Nchas. = 3,29 kW, vimpl. = 1,00 m/s, Nimpl. = 2,21 kW,intensity of corrections –3)FIGURE 5. Power variation fragment of asynchronous motors

20 G. Viselga, J.R. Kami!ski
E.g. in this way we calculate, that a 40 m-long spar will provide a possibility for PGM to operate at 0.42 ha/h net labour efÞ ciency.
Summing up energy input of PGM positioning and implements in working positions we can determine total energy input.
Having adopted the earlier-mentioned perspective PGM parameters and net working efÞ ciency: for implements 0.45 ha/h and chassis 7 ha/h, we determined that energy input of implements work equals 8.0 kWh/ha, and that of chassis positioning 0.6 kWh/ha. Therefore, total energy input can make up only 8.6 kWh/ha.
CONCLUSIONS
When automatically controlling positioned gantry module there has to be a straight-line course maintenance system, e.g. according to the laser beam. Accuracy of positioning increases at reduction of speed of movement chassis and with that of the connected forces of inertia of the gantry unit. Straight-line course deviations of the right chassis are reduced by distanc-ing photodiodes from the straight-line course positioned left chassis C > 0 and reduction of their inter-axial dis-tance A. Mean square deviation when increasing the distance between pho-todiodes from 50 to 67 mm, increased by 1.3 times, from 81 to 104 mm.Energy input for a single-time soil loosening at 10 cm of the perspective PGM amounts to 8.0 kWh/ha, for chassis positioning 0.6 kWh/ha, the
•
•
•
•
total energy input can amount only to about 8.6 kWh/ha.
REFERENCES
HOLT J.B., TILLETT N.D. 1989: The deve-lopment of a nine metre span gantry for the mechanized production and harvest-ing of cauliß owers and other Þ eld vegeta-bles. Journal of agricultural engineering research. Vol. 43, p. 125–135.
QUICK R.G. 1987: Engineering an agricul-tural future. Agricultural engineering. Australia. Vol. 16, p. 8–11.
VISELGA G. 2006: Research of Accuracy Parameters of the Gantry Course. Solid State Phenomena, Vol. 113 „Mechatronic Systems and Materials“, p. 50–54.
VISELGA G., BAREISIS R., SNIAUKA P. 2003: Investigation of positioning accuracy of shuttle gantry tillage modules. Bioagrotechnical systems engineering. Research papers. Warsaw University of technology. Poland. No 2–3 (11–12), p. 127–134. (In Russian).
VISELGA G. 1998: Investigation of the utilization of the principles of gantry agriculture in small Þ elds. Doctoral thesis. Raudondvaris. (In Lithuanian).
VISELGA G., KAMI!SKI J.R. 2006: Analy-sis of soil compaction at potato cultiva-tion. Zeszyty Problemowe Post+pów Nauk Rolniczych, 508: 203–208.
Streszczenie: Precyzja i parametry energetyczne
pozycjonowanego modu"u bramowego. Sterowa-nie pozycjonowaniem urz,dzenia bramowego (wózka narz+dziowego) odbywa si+ za pomo-c, urz,dzenia laserowego. Generator laserowej wi,zki promieniowania emituj,cy pionow, wi,z-k+ promieni, umieszczony jest na ko'cu uprawia-nego pola. Odbiornik laserowej wi,zki promieni z fotodiodami zamontowany jest na module na-stawczym urz,dzenia bramowego. Dok adno/- pozycjonowania zosta a zbadana dla dwóch przy-padków, gdy urz,dzenie laserowe zosta o zamon-towane na ko'cu wraz z tocz,cymi si+ rolkami, oraz gdy by o zamontowane centralnie. Oszaco-

Precision and energy parameters of the positioned gantry module 21
wano wielko/- odchyle' przebiegu procesu w za-le.no/ci od zmian wzajemnego po o.enia emitera laserowego i fotodiod. W te/cie u.yto nadajnika elektromagnetycznego. Modu steruj,cy zamoco-wany by na specjalnych rolkach prowadz,cych. Do nap+du wykorzystano silnik elektryczny zasi-lany pr,dem o napi+ciu 12 V z zabezpieczeniem termicznym.
MS. received June 2008
Authors’ address:Gintas ViselgaVilnius Gediminas Technical University, Department of Machine Building, LT-03224 Vilnius, J. Basanaviciaus St. 28, Lithuaniae-mail: [email protected]
Jan R. Kami'skiWydzia In.ynierii Produkcji SGGWKatedra Maszyn Rolniczych i Le/nych02-787 Warszawa, ul. Nowoursynowska 164Polande-mail: [email protected]


Annals of Warsaw University of Life Sciences – SGGWAgriculture No 52 (Agricultural and Forest Engineering) 2008: 23–30(Ann. Warsaw Univ. of Life Sci. – SGGW, Agricult. 52, 2008)
Abstract: Methods for evaluation of breaking up
of maize chaff separated on the sieve separator.
The work aimed at determination of breaking up degree of maize chaff and grain with the use of the sieve separator, fabricated according to ANSI/ASAE S424.1 Standard, and at comparison of the methods for evaluation of chaff particle length distribution. As the quality indices of evaluation of maize breaking up degree there were taken: geometric mean of chaff length, standard deviation of length and index of maize grain breaking up. These indices were determined on the basis of mass distribution. The three varieties of maize plants were investigated: SAN, LG2244 and REDUTA of moisture content 62.8, 59.4 and 63.2%, respectively, harvested with two self-propelled forage harvesters. It was found that the chaff length ranged from 7.82 to 12.92 mm, depending on forage harvester used and maize variety. The ANSI/ASAE S424.1 method for determination of geometric mean of chaff length was veriÞ ed with the use of Rosin-Rammler model, by calculating hypothetical dimension of sieve mesh, which passed through a half of material being sifted. The obtained results proved usability of both the methods for determination of the chaff length distribution.
Key words: breaking up, sieve separator, chaff distribution, method.
INTRODUCTION
Maize silage is a basic feed used in non-grazing feeding of cattle. To achieve the best feeding results, the maize must be properly broken up prior to ensilaging
(Michalski 1997). As it is evident from many research Þ ndings, in order to ensure better absorption of particular nutrients one should try to get short chaff and highest degree of maize grain breaking up. The forage harvesters equipped with the drum chopping unit combine the optimal breaking up of maize plants and grain during harvesting. The sieve separator (analyzer) can be used in evaluation of chaff particle length and uniformity as well as maize grain breaking up degree.
The work aimed at determination of breaking up degree of maize chaff and grain with the use of sieve separator fabricated according to own technical documentation and ANSI/ASAE S424.1 Standard, and also at comparison of the methods for evaluation chaff length distribution.
As the quality indices of evaluation of maize breaking up degree there were taken: geometric mean of chaff length, standard deviation of length and index of maize grain breaking up. These indices were determined on the basis of mass distribution.
MATERIAL AND METHODS
Analysis of breaking up was executed for three maize varieties: SAN, LG2244 and REDUTA of moisture content
Methods for evaluation of breaking up of maize chaff separated on the sieve separator
ALEKSANDR LISOWSKI, KRZYSZTOF "WI#TEK, KRZYSZTOF KOSTYRA, JAROS%AW CHLEBOWSKI Department of Agricultural and Forest Engineering, Warsaw University of Life Sciences – SGGW, Warsaw, Poland

24 A. Lisowski et al.
62.8, 59.4 and 63.2%, respectively. The varieties SAN and LG2244 were harvested with forage harvester Class Jaguar 690 SL equipped with row-independent attachment Champion 3000; the mass productivity amounted to 71 t/h. The plants of REDUTA variety were harvested with forage harvester Class Jaguar 682 S equipped with 4-row attachment; mass productivity amounted to 62 t/h. Both harvesters were equipped with the drum chopping unit.
In order to determine the percentage mass ratio of particular parts of a maize plant, 10 plants of each variety were randomly chosen, divided into
homogeneous components and weighed on an electronic scale. Mean values are given in Table 1.
The investigated chaff samples were taken immediately after harvest from 5 different places of the trailer (according to a single envelope method). Mean samples of each variety of volume amounted to 10 liters were measured. The samples were put into the separator’s charging hopper (Fig. 1) to separate them into fractions according to length. The separator was equipped with the shoe with rectangular sieves of square shape mesh (Sar 2007) and dimensions 406 × 565 mm. The shoe was driven by
TABLE 1. Averaged parameters of plant material
Parameter Maize varietyMaize variety SAN LG2244 REDUTAMass of whole plant[g] 730.06 559.65 549.20
Mass of leaves at stem [g] 112.63 82.09 72.27
Mass of stem [g] 271.46 237.12 184.49
Mass of panicle [g] 2.72 1.59 3.96
Mass of cob with leaves [g] 341.25 229.21 276.46
Mass of leaves at cob [g] 32.53 14.06 15.84
Mass of cob with grain [g] 281.94 212.42 246.53
Mass of grain [g] 214.01 161.58 200.22
Mass of torus [g] 64.93 40.32 46.04
Length of plant [mm] 2401.00 2383.10 2741.00
Number of grains on cob [pcs] 481.90 438.90 501.70
Length of panicle [mm] 321.00 375.10 414.10
Height of cob Þ xing [mm] 530.00 699.60 871.00
Length of cob [mm] 209.00 198.90 165.50
Diameter of cob [mm] 48.80 42.76 52.15
Diameter of torus [mm] 18.00 14.69 14.26
Diameter of stem at height
cutting 26.20 22.65 22.63
250 [mm] 24.45 21.19 21.60
500 [mm] 22.20 20.26 20.38
750 [mm] 19.45 18.54 18.85
1000 [mm] 16.75 15.53 16.69
1250 [mm] 15.20 13.09 14.08
1500 [mm] 12.05 10.02 12.00

Methods for evaluation of breaking up of maize chaff separated... 25
eccentric mechanism, which allowed for horizontal movement of sieves (imitating hand sifting), consisted of complex motion: rotary and to-and-fromotion.
The separation time of each sample amounted to 120 s, starting from the moment of stabilization of separator’s electric motor speed. Material particles were separated on sieves depending on their length; the sieve parameters and lengths of particles remaining on particular sieves are given in Table 2. The shoe movement frequency was equal to
2.4 Hz (144 cycles per minute). Rotational speed of electric motor was controlled with inverter and monitored on electronic gauge. Upon completion of separation, the mass of mixture on each sieve and the bottom (Fig. 2) was weighed on an electronic scale with accuracy 0.05 g. Besides, the whole grains remaining on sieves were picked up and weighed.
The measurements for each variety were repeated 30 times and the results were averaged. If material on the Þ rst sieve weighed less than 1% of entire
FIGURE 1. Sieve separator: 1 – base, 2 – gear box, 3 – electric motor, 4 – inverter, 5 – rubber shock absorber, 6 – frame of ground wheels, 7 – guide of circular section, 8 – housing with linear bearing, 9 – sieve, 10 – sieve shoe, 11 – eccentric mechanism

26 A. Lisowski et al.
sample, it was not considered in analysis of the chaff length; if mass of material exceeded 1%, the length of particular particles was measured with a slide caliper.
The effect of maize grain breaking up was evaluated on the basis of breaking up index (Niew+g owski 2006):
km u m
m uz
p z ci
p z
=−
⋅Σ
100
(1)
where: kz – breaking up index of maize grain, %,mp – mass of chaff sample, g,uz – mass ratio of grains in the whole maize plant,mci – mass of unbroken maize grains on i-sieve, g.
Mass ratio of grains in the whole maize plant was determined basing on hand hulling of grains of 10 plants. In combination with unbroken grain mass,
TABLE 2. Parameters of sieves
No of sieve
Dimension of square opening[mm]
Mesh diagonal, Xi
[mm]Mean length of particle
[mm]
1 19 26.9 48
2 12.7 18.0 22
3 6.3 8.98 12.7
4 3.96 5.61 7.1
5 1.17 1.65 3.04
Bottom – – 0.82
X i
FIGURE 2. Effect of maize plant mixture separation (on sieves there are given mesh dimensions in mm)

Methods for evaluation of breaking up of maize chaff separated... 27
it enabled to determine effectiveness of maize grain breaking up by forage harvester.
Geometric mean of chaff particle length Xgm and standard deviation Sgm were calculated according to ANSI/ASAE S424.1 Standard with equations:
Xm X
mgm
i i
i
= −log( log )1 ΣΣ
(2)
Sm X X
mgm
i i gm
i
=−
−log(log log )
12
1
2Σ
Σ
(3)where: mi – mass of chaff on i-sieve, g,X i – mean length of particle on i-sieve, mm.
Length of particles on the Þ rst sieve (Xl) measured with a slide caliper averaged to 48 mm for all varieties. The mean length of particle on the bottom (X6) amounted to 0.82 mm (half of sieve diagonal of smallest dimension). Geometric means of lengths for the remaining sieves were calculated with equations:
X X Xi i i= ⋅ −[ ]( )1
1
2
(4)
where:Xi – mesh diagonal of i-sieve (i = 2"5), m,X(i-1) – mesh diagonal of sieve above i-sieve, mm.
In order to verify the geometric mean of chaff length calculated with ANSI/ASAE S424.1 method there was determined the particle mean value with
the use of modiÞ ed dependence of Rosin-Rammler method. Thus, the hypothetical value of sieve mesh X50 (mesh diagonal) was evaluated, which passed through a half of material being sifted:
Qw
X
X
b
= −−
1 2 50
(5)
where: Qw – cumulated frequency of under-sieve mass,X – mesh diagonal, mm,b – regression coefÞ cient.
By Þ nding the double logarithm for equation (5) there was obtained the following linear equation of regression coefÞ cients b and C:
loglog
log .
log log
log
1
0 5
50
−( )
=
= ⋅ − ⋅ =
= ⋅ +
Q
b X b X
b X C
w
(6)
Knowing b coefÞ cient and free term C in the equation (6) one could calculate X50. Regression coefÞ cients were determined with statistical methods with the use of Statgraphics Plus v.4.1 program.
RESULTS OF MEASUREMENTS AND CALCULATIONS
The obtained breaking up indexes kz were close to 1. In samples of SAN and LG2244 varieties of plants harvested with forage harvester Class Jaguar 690 SL with row-independent attachment, the single grains were found (one piece

28 A. Lisowski et al.
in three and two repetitions, respectively, in 30 samples), while in 14 samples (out of 30) of REDUTA variety, harvested with forage harvester Class Jaguar 682 S with 4-row attachment, there were found in total 23 unbroken grains (average below 1 piece per sample).
The mean chaff mass on sieves and their percentage ratio are presented in Table 3.
In the case of LG2244 variety the chaff mass on the Þ rst sieve amounted to less than 1% of the whole sample; therefore, it was assumed as 0.
Substituting values of Tables 2 and 3 to Equations (2) and (3) there was obtained:
Using Rosin-Rammler model (5) the following equations were obtained:
SAN: Qw
X
= −−
1 2 11 12
1 779
.
.
because: X50 = 11.12 mm b = 1.79
because: X50 = 7.82 mm b = 2.297
REDUTA: Qw
X
= −−
1 2 12 92
2 122
.
.
because: X50 = 12.92 mm b = 2.122
Figure 3 presents graphical represen-tation of cumulated frequency of under-sieve mass Qw calculated with depen-dence (5). The smallest mesh dimension (7.82 mm) needed to sift 50% of sample mass for particular maize varieties was found for LG2244 variety, proving its best breaking up.
TABLE 3. Chaff mass on sieves for particular varieties
No of sieve
SAN LG 2244 REDUTA
Mass
[g]
Sieve residue
[%]
Qw
[–]
Mass
[g]
Sieve residue
[%]
Qw
[–]
Mass
[g]
Sieve residue
[%]
Qw
[–]
1 52.28 2.47 0.975 0 0.00 1.000 65.48 3.96 0.960
2 251.4 11.85 0.857 139.94 6.71 0.933 229.01 13.87 0.822
3 1169.96 55.17 0.305 1157.48 55.51 0.378 941.68 57.02 0.251
4 322.88 15.22 0.153 406.98 19.52 0.183 267.01 16.17 0.090
5 264.95 12.49 0.028 306.87 14.72 0.035 131.85 7.98 0.010
Bottom 59.27 2.80 – 73.75 3.54 – 16.56 1.00 –
Total 2120.74 100 – 2085.02 100 – 1651.59 100 –
SAN: Xgm = 9.93 mm Sgm = 2.08 mmLG2244: Xgm = 8.65 mm Sgm = 2.04 mmREDUTA: Xgm = 11.41 mm Sgm = 1.87 mm
LG2244: Qw
X
= −−
1 2 7 82
2 297
.
.

Methods for evaluation of breaking up of maize chaff separated... 29
SUMMARY
The obtained results enable to Þ nd that both forage harvesters were characterized by good breaking up efÞ ciency. Almost 100% of grains were broken, while optimal length of cut amounted to about 10 mm with relatively small scatter. Mean geometric lengths of particles differed from those calculated with Rosin-Rammler equation. For varieties SAN and REDUTA, Xgm values were lower than X50 by 12 and 13.2%, respectively, while for LG2244 variety Xgm was bigger than X50 by 9.6%. However, these differences were not very big, since they were contained in the range of scatter determined by standard deviation. It proved the usability of both the methods in determination of chaff length distribution.
REFERENCES
MICHALSKI T. 1997: Warto/- pastewna plonów kukurydzy w zale.no/ci od spo-sobów i terminów zbioru. Zeszyty Prob-lemowe Post+pów Nauk Rolniczych, 450: 133–162.
ANSI/ASAE S424.1 MAR98: Method of de-termining and expressing participle size of chopped forage materials by screen-ing.
NIEW3G%OWSKI K. 2006: Wp yw czyn-ników technicznych i eksploatacyjnych na wska4niki jako/ciowe rozdrabniania ro/lin kukurydzy zbieranych sieczkarni, polow,. Praca doktorska, maszynopis. Warszawa SGGW.
SAR %. 2007: Projekt konstrukcyjny sepa-ratora sitowego. Praca in.ynierska, maszynopis. Warszawa SGGW.
Streszczenie: Celem pracy by o okre/lenie stop-nia rozdrobnienia sieczki oraz ziarna kukurydzy za pomoc, separatora sitowego wykonanego
FIGURE 3. Cumulated frequencies of under-sieve mass for various maize varieties based on Rosin--Rammler model
0
0,1
0,2
0,3
0,4
0,5
0,6
0,7
0,8
0,9
1
0 2 4 6 8 10 12 14 16 18 20 22 24 26
Mesh diagonal, Xi [mm]
Fre
qu
en
cie
s o
f u
nd
er-
sie
ve m
as
s,
Qw
Reduta
LG 2244
San

30 A. Lisowski et al.
wed ug normy ANSI/ASAE S424.1 oraz porów-nanie metod oceny rozk adu d ugo!ci cz"stek sieczki. Za wska#niki jako!ciowe oceny stopnia rozdrobnienia kukurydzy przyj$to !redni" geome-tryczn" d ugo!ci sieczki, odchylenie standardowe d ugo!ci oraz wska#nik rozdrobnienia ziaren ku-kurydzy. Wska#niki te okre!lono na podstawie rozk adu masowego. Zbadano rozdrobnienie ro-!lin kukurydzy odmian SAN, LG2244 i REDU-TA, o wilgotno!ci odpowiednio 62,8, 59,4 i 63,2% zbieranych dwiema sieczkarniami samojezdnymi. Stwierdzono, %e d ugo!& sieczki zawiera si$ w zakresie 7,82-12,92 mm i zale%y od zastosowa-nej sieczkarni oraz odmiany kukurydzy. Metod$ wyznaczenia !redniej geometrycznej d ugo!ci sieczki wed ug ANSI/ASAE S424.1 zweryÞ ko-
wano pos uguj"c si$ modelem Rosina-Rammlera, obliczaj"c hipotetyczny wymiar oczka sita, przez który przechodzi po owa masy przesiewanego materia u. Uzyskane wyniki !wiadcz" o przydat-no!ci obydwu metod do opisywania rozk adu d u-go!ci sieczki.
MS. received May 2008
Authors’ address:Szko a G ówna Gospodarstwa WiejskiegoKatedra Maszyn Rolniczych i Le!nych02-787 Warszawa, ul. Nowoursynowska 166,tel. +22 5934527, e-mail: [email protected]

Annals of Warsaw University of Life Sciences – SGGWAgriculture No 52 (Agricultural and Forest Engineering) 2008: 31–37(Ann. Warsaw Univ. of Life Sci. – SGGW, Agricult. 52, 2008)
Abstract: Economic efÞ ciency of growing and
technological processes for cereals. The paper deals with the draft of silviculture/technological processes for selected crops in organic system of farming. The impact of recommended silviculture technologies on economics of selected Þ eld crops growing was carried out in order to increase the competitiveness as well as the comparison to economic results in conventional system of farming, which can contribute to increasing share of cereals grown on arable land thereby meeting increasing demand for bio-products of organic origin in the Czech Republic.
Key words: organic farming, cereals, silviculture/technological processes, economic efÞ ciency.
INTRODUCTION
Growth of crops is complex and includes a range of forms. Field crops are the most important among them. These secure the main part of human nutrition. Nevertheless, Þ eld crops it is possible to consider as „ecosystems in which is man not only important force, but for this kind of ecosystem also the necessary condition for its existence. Man uses Þ eld crops so, that signiÞ cant share of its energy, which the crops gain from the photosynthesis process, gets out during the harvesting from the place of rise and regulates the stream of energy into the places of need (Jánský 2005).
The agriculture in the European con-ditions should be multifunctional, sus-
tainable and competitive. Approximation or achieving the sustainable agriculture demands: decrease of inputs, increasing the efÞ ciency of all used sources and greater use of natural processes as bio-logical nitrogen Þ xation, circulation of nutrients, prevention in plant protection and so on. These general principles must be realized in individual growing tech-nologies.
The system of organic farming, in adequate extent and in selected conditions together with observance of environment friendly or equilibrium rules in agro-systems is one of the ways, which could play very important role for sustainability of agriculture but with lower yields.
GOAL AND METHODOLOGY
The result of this paper is formulation of recommended silviculture/technological processes of selected cereals in organic system of farming. Evaluation of the impact of recommended silviculture technologies on selected cereals growing and comparison with economic results in conventional systems of farming was carried out for increasing the competitiveness. It is assumed that the achieved results contribute to increase the share of crops grown on arable land
Economic efÞ ciency of growing and technological processes for cereals
JAROSLAV JÁNSKÝ, IVA ŽIV'LOVÁDepartment of Business and Economics, Mendel University of Agriculture and Forestry, Brno, Czech Republic

32 J. Jánský, I. Živ lová
where the supply of organic production in the Czech Republic does not meet the demand and the possibilities of sale.
The methodology was realized in three partial steps according to evaluate economic efÞ ciency of technological processes of cereals growing in organic farming systems (Jánský Živ(lová 2005):
The setting of recommended silvi-culture/technological processes and its economic evaluation for selected cereals.The evaluation of economic effective-ness of designed silviculture processes on data from particular companies. The comparison of economic efÞ -ciency of selected crops grown in or-ganic as well as conventional farming systems.The paper is partial output of Research
plan of FBE MUAF Brno, MSM 6215648904 “Czech economy in the process of integration and globalization, and the development of agrarian sector and the service sector in the new conditions of integrated marked” as a part of thematic direction 05 “Social-economic context of sustainable development of multifunctional agriculture, and actions of agrarian and regional policy”.
RESULTS AND DISCUSSION
Recommended growth and
technologies processes for growth
of cereals
Cereals are one of the most spread and economically the most important Þ eld crops. Individual types of cereals have differently rich root system, which is decisive for their water demand and supply of soil nutrients.
–
–
–
Winter cereals have the biggest demand for nitrogen in spring till vaulting. In this time is the soil very little biologically active and with insufÞ cient mineralisation. Harrowing supports nitrogen loosening by mineralisation process. For fertilization during the growth season it is most suitable to use sewage or stale. Recommended total amount of slurry is 20–30 m3 per hectare in one or two batches. If the manure (better compost) is used, it should be applied at the end of winter to dry soil as soon possible. Manure should be mature (it limits the transfer of diseases from the rests of straw and secures sufÞ cient amount of nutrients).
Cereals should not exceed 50% in crop rotation, especially due to the possibility of diseases and weeds. Pause between the same types should be minimum one year, for rye two years and three years for oats (because of winegar worm). In specialized cereal crop rotations, the share of cereals can be 67% with the use of corn and share of wheat up to 50%.
In the system of organic farming is the prevention against pests done mainly through keeping general principles of crop rotation. Species with higher foliage and with long stalk are more resistant against weeds. In order to reduce the spread of weeds linked to crop rotation, the general rule of skipping the growing should be applied. It is possible to carry out the direct mechanical regulation of weeds in several stages. Before the seeding, according to weed germination, the soil harrowing should be done (in the case of high amounts of weeds it should be done repeatedly). Further harrowing is done in the 3rd stage of leaf. In further

Economic efÞ ciency of growing and technological processes for cereals 33
growing stages it is possible to harrow in necessary cases and with lower effect.
Inter-row distance is important for weed regulation. Line weed control needs minimal inter-row distance of 16 cm and more. Inter-row distance of 8––12 cm could be use together with weed regulation done by harrowing. Vegetation grown in narrower rows inhibits better the weeds. The use of narrow rows is less labor intensive. Line weeding is possible to choose while greater occurrence of weeds.
Recommended growing and
technological processes for cereals
growing and its evaluation for winter
wheat
Wheat is the most important food cereal and as food is used in corn and beat growing regions. Wheat ß ower is used in food industry for bread baking and for other wide range of bakery and pasta. The grain is processed into grout and semolina, together with milling waste is grain valuable feed. The grain is in smaller amounts used as industry material for starch production, alcohol and beer production. Wheat straw is used as bedding.
It is the most demanding for soil fertility and water accessibility out of all crops. The use of nutrients per one hectare is clear from Table 1. It uses very good deep and heavier soils with large water capacity. Very light or shallow and peaty soils are not suitable for it.
Winter form of wheat reacts the most sensibly from all crops to the crop grown in prior season. Very good prior-crops for winter wheat in this means are crops with wide leafs or crops fertilized with manure. For example it can be perennial fodder crops (besides the drier areas, where it can worsen the water regime for consequent crop). Other very good crops are leguminous crops, pulse-cereals mixed green crops, early and semi-early potatoes and corn for silage. These kinds of crops are important for the quality of winter wheat, especially concerning the amount of aleurone. The highest amounts of aleurone are after clover and pulse crops.
Winter wheat is grown by number of farmers in the organic system of farming. The efÞ ciency of farming is determined above all by costs and revenues. The overview of average costs per one hectare of harvested area while following above mentioned technological processes in system of organic farming is clear from Table 2.
TABLE 1. Nutrients consumption (kg/ha)
N P2O5 K2O
Organic farming 60 29 58
Conventional farming 119 57 114
TABLE 2. Structure of average costs and revenues for winter wheat in system of organic farming
IndicatorCosts per 1ha of harvested area (CZK)
Seeds 1 765Fertilizers 1 113
Other direct material costs 210
Direct material costs in total 3 088
Costs of growing technology 4 619
Indirect costs 2 735
Costs in total 10 442
Marginal contribution 619
Costs of major product (CZK/t) 3 829
Per hectare yield (t/ha) 2.40
Average farmers’ price (CZK/t) 3 469

34 J. Jánský, I. Živ lová
It is clear from the structure of costs that the highest share of costs is Þ lled up with costs of growing technology, which represents 44% out of total costs (more in Tab. 2)
Recommended technological process is clear from the data in Table 3, including the time schedule and time demand of recommended activities. Out of total costs of growing technology in the amount of 8699 CZK per hectare falls 21% on harvest and transport of grain, 17% for collection and transport of straw, 14% for seed ploughing and 12% for staling. The remaining operations represent only smaller portion of the costs.
While following the recommended growing technology it is possible to assume average per hectare yield of organic winter wheat 2.4 tons per hectare. The average farmers’ price of organic winter wheat is 3469 CZK per one ton of grain. In this case is this crop proÞ table and marginal contribution is positive in amount of 619 CZK per hectare.
While comparing costs and revenues of winter wheat grown according to proposed technological process together with costs and revenues of sample Þ le of organic farmers using recommended growing technology (shown in Tab. 4) it is clear that individual companies attain very different values.
Total costs per one hectare are almost similar in average value with the costs used for recommended growing technology, i.e. around 10 400 CZK. The average of the sample Þ le is inß uenced with high variability of values listed by individual companies because the lowest value is 7407 CZK and the highest is 24 203 CZK per one hectare.
Big differences are noticeable also at costs of growing technology, which are in average in this sample Þ le higher by 1024 CZK. Better than average is median that is not inß uenced by external values, shown by some companies. Median in this sample Þ le is 4343 CZK of growing technology costs per one hectare, which
TABLE 3. Recommended growing technology for winter wheat in organic system of farming Prior-crop: clover, pulse crops, LOS, (potatoes++)
Months/decadeGrowing measures
indication hours/ha
VIII/3 Repeated stubble ploughing 0.3
VIII/3 Seeding ploughing with adjustment 1.0
IX/3 Preparation prior to seeding ploughing 0.4
X/1 Seeding 0.35
X/2 Harrowing 0.3
III/3 Rolling 0.4
IV/1,2 Harrowing in the growing season 2× 0.6
IV/1 Staling 1.0
VIII/1 Harvesting and grain transportation 0.6
VIII/2 Collecting and transportation of pressed straw 0.98
VIII/2 Stubble ploughing 0.3

Economic efÞ ciency of growing and technological processes for cereals 35
is by 276 CZK less than it is set in recommended technological process.
Marginal contribution presented by median is in the sample Þ le higher than the average shown in Table 2, i.e. by 1062 CZK per one hectare. It is caused by higher per hectare yield and lower variable costs.
Even when the comparison of the sample Þ le of organic farmers with the set recommended value is for the sample Þ le favorable, in comparison to conventional farmers is organically grown winter wheat by far less efÞ cient, which is possible to deduce from data in Table 5.
Total per hectare costs shown by organic farmers have by 3972 CZK lower average value than companies in conventional system of farming. In the means of median it is less by 1489 CZK. The main reason for lower costs is the absence in use of chemical protective means by organic farmers as well as man-made fertilizers, which is clear from indexes in Table 6.
Different per hectare yield is exposed into costs per one ton of grain. Per hectare yield is in this sample Þ le of organic farmers in the range of 1.14 till 4.15 tons per hectare, while in the system of conventional farming it is in average 4.74 tons. Different is average farmers’ price as well, in the sample Þ le of organic
TABLE 4. Characteristics of costs and revenues for winter wheat in the sample Þ le of organic farmers
Indicator Average Minimal value Maximal value Median
Seeds 1 787.60 750.00 2 440.00 1 600.00
Fertilizers 1 307.10 875.00 5985.00 1 859.00
Other direct material costs 35.00 0.00 520.00 24.00
Direct material costs in total 3 129.71 1 625.00 8 945.00 3 483.00
Costs of growing technology 5 643.39 948.00 21 518.00 4 343.00
Indirect costs 1 618.16 x x 5 048.00
Costs in total 10 391.26 7 407.00 24 203.00 12 874.00
Marginal contribution –443.46 x x 5 043.70
Costs of major product (CZK/t) 6 178.08 2 332.64 8 048.37 4 315.59
Per hectare yield (t/ha) 2.03 1.14 4.15 3.10
Average farmers’ price (CZK/t) 4 110.33 3 199.99 5 000.04 4 151.52
TABLE 5. Structure of average costs and revenues of winter wheat in conventional system of farming
IndicatorCosts per 1 ha of harvested area (CZK
Seeds 1 078
Fertilizers 2 509
Other direct material costs 2 659
Direct material costs in total 6 246
Costs of growing technology 5 824
Indirect costs 2 293
Costs in total 14 363
Marginal contribution 3 155
Costs of major product (CZK/t) 2 667
Per hectare yield (t/ha) 4.74
Average farmers’ price (CZK/t) 3 212

36 J. Jánský, I. Živ lová
farmers it is 3200 till 5000 CZK per one tone of grain – the average is only 4110 CZK. From the median in the level of 4152 CZK it is possible to conclude that organic farmers are partially selling the organic winter wheat as organic product. Nevertheless, the winter wheat seems to be unproÞ table crop in the system of organic farming.
CONCLUSION
Important aspect that inß uences the de-cision-making of farmers about trans-formation into organic farming is eco-nomic results. For better awareness in this area it is necessary to compare the economic results of individual sectors in conventional as well as organic systems of farming and thus to get objective data for consequent decision-making about how to contribute to the development of organic farming especially on the arable land, which represents in the conditions of the Czech Republic 7.5% out of total area of organically farmed land.
The result of this paper is formulation of recommended silvicultural/technologi-cal processes of selected cereals in organic system of farming. Similar analysis as it was carried out for winter wheat was also solved in the research project for other ce-reals as spring wheat, spelt, winter barley, oats, rye, triticale and some other plants grown on arable land.
Evaluation of the impact of recom-mended silvicultural technologies on selected Þ eld crops growing and com-parison with economic results in con-ventional systems of farming was car-ried out for increasing the competitive-ness, which can contribute to increase the share of crops grown on arable land thereby meeting increasing demand for bio-products of organic origin in the Czech Republic.
REFERENCES
JÁNSKÝ J.: Analysis of the current situation in sales of selected organic products in the Czech Republic. Zem(d(lská ekonomika ). 7, 51, Praha 2005, p. 309–313.
Jánský J., Živ(lová I: Analýza vztahu cen a náklad* na vybrané rostlinné bioproduk-ty. Sborník p+ísp(vk* z mezinárodního v(deckého seminá+e „Manažment a eko-nomika ekologickej polnohospodárskej výroby“, SPU Nitra, 2005, p. 39–42. (zborník anotácií).
Streszczenie: Ekonomiczna efektywno!" techno-logii uprawy zbó#. W pracy przedstawiono pro-jekt przebiegu technologii uprawy zbó% w syste-mie rolnictwa organicznego w aspekcie ekono-micznym. Otrzymane wyniki porównano z efek-tami ekonomicznymi dla rolnictwa tradycyjnego w Republice Czeskiej i stwierdzono, %e technolo-gie rolnictwa organicznego mog" by& konkuren-cyjne przy rosn"cym popycie na biomas$ pocho-dz"c" z upraw ro!lin zbo%owych.
TABLE 6. Comparison of average costs and revenues of winter wheat for companies farming in organic and conventional conditions
Indicator Index
Seeds 1.64
Fertilizers 0.44
Other direct material costs 0.08
Direct material costs in total 0.49
Costs of growing technology 0.79
Indirect costs 1.19
Costs in total 0.73
Marginal contribution x
Costs of major product (CZK/t) 1.44
Per hectare yield (t/ha) 0.51
Average farmers’ price (CZK/t) 1.08

Economic efÞ ciency of growing and technological processes for cereals 37
MS. received June 2008
Authors’ addresses:Jaroslav JánskýDepartment of Business and EconomicsFaculty of EconomicMendel University of Agriculture and ForestryBrnoZem(d(lská 1, 613 00 Czech Republice-mail: [email protected]
Iva Živ(lováDepartment of Business and EconomicsFaculty of EconomicMendel University of Agriculture and ForestryBrnoZem(d(lská 1, 613 00 Czech Republice-mail: [email protected]


Annals of Warsaw University of Life Sciences – SGGWAgriculture No 52 (Agricultural and Forest Engineering) 2008: 39–44(Ann. Warsaw Univ. of Life Sci. – SGGW, Agricult. 52, 2008)
Abstract: Effect of storage conditions on biological value of wheat and barley grain. There was compared the rate of mould attacking of wheat and barley grain during storage at temperatures 20, 25 and 30°C and relative air humidity 94 and 99%. The samples were put in a climatic chamber and constant storage conditions were maintained. Using linear regression method there were determined equations describing the rate of grain attacking, as a function of storage time for particular storage conditions. Basing on carried out analysis of investigation results it was proved that the wheat grain was earlier attacked by mould and it lost its germination capacity earlier, when compared to barley grain.
Key words: grain, wheat, barley, germination capacity, mould.
INTRODUCTION
Grain is a live organism, with continuous transformations going inside it. The purpose of proper storage is to inhibit biological processes to the highest possible extent and to eliminate unfavourable environmental factors, which limit duration of the safe storage. The biochemical processes occurring in grain are directly inß uenced by moisture content, air temperature, contact with air and condition of grain (degree of damage) (Janowicz 2005; Ryniecki 1998; Waszkiewicz 1986).
The best-known criteria for safe storage are: degree of mould development,
degree of deterioration of germination ability and amount of carbon dioxide emission and the connected loss in grain dry mass (Ryniecki 1998).
A general equation for calculation of permissible duration of wheat storage depending on storage conditions and degree of mechanical damage of grain was developed by Al-Yahya (1999), who assumed the amount of cargo dioxide emission as an evaluation criterion. The time of loosing 1% of grain mass was taken in this equation as the index for determination of admissible time of wheat storage there.
Wilcke et al. (2000) determined permissible duration of maize grain storage with the use of Thompson equation; they calculated the loss of grain dry mass as a function of time and amount of carbon dioxide emission, and assumed the time of loosing 0.5% of grain dry mass as permissible time of storage.
In references one can Þ nd a general mathematical model for prediction the vitality of grain of high content of starch, protein and oil depending on storage conditions; the equilibrium relative moisture content was used in model description instead the grain moisture content (Chen and Jayas 2000).
The most severe criterion for grain is development of mould, leading to
Effect of storage conditions on biological value of wheat and barley grain
CZES,AW WASZKIEWICZ, MICHA, SYPU,A Department of Agricultural and Forest Engineering, Warsaw University of Life Sciences – SGGW, Warsaw, Poland

40 Cz. Waszkiewicz, M. Sypu$a
spoilage of grain by deterioration of its sowing, feeding and technological value.
Therefore, this work aimed at determination of the effect of storage conditions for wheat and barley grain on mould development and changes in germination energy and capacity during storage. The temperature, air humidity and time of storage were taken as parameters for determination of storage conditions.
MATERIAL AND METHODS
The investigations were carried out on winter wheat grain of Flair variety and spring barley grain of Justyna variety harvested in 2006. Grain was put into climatic chamber KPK200 of Feutron make and was stored in galvanized containers at Þ xed temperature and air moisture content. Investigations were executed at the following air parameters in the chamber:
3 temperature levels (20°C, 25°C and 30°C),2 levels of relative humidity (94% and 99%).Relative air humidity set up in the
chamber to 94% and 99% enabled to steady the equilibrium moisture content of grain at given temperature during storage. The equilibrium moisture content ranged from 20.2 to 23.6% for wheat grain and from 19.8 to 24.8% for barley grain, depending on storage parameters.
Temperature and air humidity in the chamber were measured with the use of hytherograph LB-701 of LAB-EL make, with maximal error of temperature
–
–
measurements 0.4°C and maximal error of moisture content measurements 1.5%.
Then, at speciÞ ed time intervals 3 grain samples were taken out of the chamber, each of 100 pieces, and there was determined the number of mould attacked grains and germination capacity.
The mould attacked grain was evaluated visually with the use of magnifying glass, searching for characteristic symptoms of mould (white, then green, green and yellow, and brown or black). After counting of mould-attacked seeds, there was calculated their percentage ratio in entire amount of seeds taken from the samples. The germination capacity and energy for wheat and barley grain were investigated according to PN-79/R-95950 with the use of Jacobsen’s germination apparatus. The germination energy was determined after 3 days (barley) and 4 days (wheat) of keeping grain in the apparatus, while the measurements on germination capacity were executed after 7 and 8 days, respectively.
RESULTS OF INVESTIGATIONS AND DISCUSSION
The multifactor analysis of variance proved that all three considered independent variables (temperature, relative air humidity, time of storage) inß uenced signiÞ cantly the mould development and germination capacity.
The results presented in Figure 1 point out that temperature 30°C and humidity 99% are the most favourable conditions for mould development, since after two days 10% of wheat grain was attacked,

Effect of storage conditions on biological value of wheat and barley grain 41
and after 12 days this Þ gure increased to above 50%. For barley grain this process was even quicker; at the same parameters 30% of grain was attacked by mould. At the remaining temperature (20°C and 25°C) the mould creation process was slower than at 30°C, while the Þ rst symptoms of mould were found after 3 days on mechanically damaged grain. After 12 days of storage mould was found on 42% of seeds at temperature 25°C and 26% at temperature 20°C, and after three weeks all the grain was attacked. It was also found that the mould process was slower in the initial period, and later on it was quicker. This is because the mouldy grain is a good focus of infection for the adjacent grain. The rate of mould development in barley was
lower under the same storage conditions; at temperature 20°C after three weeks only 40% of grain was affected.
Figure 2 presents comparison between rate of mould development on considered grain at temperature 20°C and 25°C at constant relative air humidity 94%. After 16 days of storage at temperature 25°C the percentage of attacked wheat grain amounted to 70%, while for the barley grain to 30%. The rate of mould development in the same time at lower temperature (20°C) was slower and amounted to 17 and 12% for wheat and barley, respectively.
The rate of mould development as a function of storage time was described by empirical formulae and presented in Table 1.
a) b)
0
10
20
30
40
50
60
70
0 5 10 15
storage time [days]
rate
of m
ou
ld d
eve
lop
men
t
[%]
wheat
barley0
10
20
30
40
50
0 5 10 15 20
storage time [days]
rate
of m
ou
ld
de
velo
pm
ent
[%] wheat
barley
c)
0
20
40
60
80
100
0 10 20 30
storage time [days]
rate
of m
ou
ld d
eve
lop
men
t[%
]
barley
wheat
FIGURE 1. Changes in mould development as a function of storage time at air humidity 99% and tem-perature: a) 30°C, b) 25°C, c) 20°C

42 Cz. Waszkiewicz, M. Sypu$a
The obtained high correlation coefÞ cients for regression equations allow for their application for practical purposes.
The results of germination energy and capacity enabled to evaluate the usability of wheat and barley grain as sowing material during storage at humidity 99% and temperature 30°C. Considering diagrams on Figure 3 and the obtained equations (Tab. 2) one can Þ nd that germination energy and capacity decrease with time of storage
in the climatic chamber. This is proved by nature of equations and negative value of correlation coefÞ cient. After 47 days of barley grain storage the germination energy decreased to 67%, while germination capacity to 79%. The same Þ gures for wheat grain amounted to 12% and 16%, respectively. The obtained results were strongly inß uenced by mould development, enhanced by prevailing storage conditions, at which the grain were loosing its sowing value. In the investigated period the difference
a) b)
0
10
20
30
40
50
60
70
80
0 4 8 12 16 20
storage time [days]
no
te o
f m
ou
ld
develo
pm
en
t [
%]
wheat
barley
0
10
20
30
40
50
60
70
80
0 5 10 15 20 25 30 35 40 45 50 55
storage time [days]
rate
of
mo
uld
develo
pm
en
t [%
]
wheat
barley
FIGURE 2. Changes in mould development as a function of storage time at air humidity 94% and temperature: a) 25°C, b 20°C
TABLE 1. Empirical dependencies for rate of mould development during grain storage
Cereals Regression equationCorrelation
coefÞ cient R
Application range
air humiditystorage
temperaturestorage time
wheat y = 4.1863ts + 1.9104 0.988 99% 30°C 2 – 12 days
barley y = 3.0661 ts – 12.3 0.989 99% 30°C 5 – 14 days
wheat y = 4.7229 ts – 9.5714 0.983 99% 25°C 3 – 12 days
barley y = 2.1111 ts – 5.1111 0.985 99% 25°C 3 – 16 days
wheat y = 5.2615 ts – 25.344 0.947 99% 20°C 3 – 20 days
barley y = 2.1656 ts – 10.163 0.978 99% 20°C 3 – 24 days
wheat y = 5.1521 ts – 19.727 0.970 94% 25°C 3 – 17 days
barley y = 2.167 ts – 5.7895 0.981 94% 25°C 3 – 16 days
wheat y = 2.5737 ts – 21.263 0.980 94% 20°C 6 – 36 days
barley y = 1.3187 ts – 10.802 0.973 94% 20°C 6 – 54 days
where: y – ratio of mould attacked grain in the sample [%], ts – storage time [days]
rate
of
mo
uld
develo
pm
en
t [%
]

Effect of storage conditions on biological value of wheat and barley grain 43
between germination energy and germination capacity did not exceed 5% for wheat and 10% for barley.
Dependencies of germination capac-ity and germination energy during stor-age on storage time are described by re-gression equations presented in Table 2.
CONCLUSIONS
The considered storage conditions (temperature, air humidity and time of storage) signiÞ cantly inß uence degree of mould infection of wheat and barley grain. Under the same storage conditions, the rate of mould development on wheat grain is bigger than on barley grain.
•
The germination capacity and energy deteriorate with storage time; in entire investigated period the germination energy was lower on the average by 10% for barley and by 4% for wheat than their germination capacity.The obtained empirical equations allow for fairly accurate description of the mould development rate and changes in grain germination capacity depending on storage time.
REFERENCES
AL-YAHYA S.A. 1999: Deterioration rates of wheat as measured by CO2 production.
Can.Agricult.Eng. Vol. 41 (3), 161–166.CHEN C., JAYAS D.S. 2000: Relating
equilibrium relative humidity and
•
•
a) b)
0
20
40
60
80
100
0 5 10 15 20 25 30 35 40 45 50
storage time [days]
Ek
, Z
k [%
]
Zk
Ek
0
10
20
30
40
50
60
70
80
90
100
0 5 10 15 20 25 30 35 40 45 50
storage time [days]
Ek
, Z
k
[%]
Zk
Ek
FIGURE 3. Changes in germination capacity and germination energy during storage: a) – wheat, b) – barley
TABLE 2. Regression dependencies of germination energy and capacity on storage time at temperature 30°C and relative humidity 99%
Cereal Parameter EquationCorrelation
coefÞ cient RStorage time
Pszenica Germination energy Ek = –1.794 ts + 89.59 –0.933 0–47 days
Germination capacity Zk = –1.84 ts + 94.03 –0.936 0–47 days
J$czmie- Germination energy Ek = –0.40 ts + 86.15 –0.912 0–48 days
Germination capacity Zk = –0.387 ts + 95.68 –0.910 0–48 days

44 Cz. Waszkiewicz, M. Sypu$a
temperature to seed longevity. Agricult.Eng. J. Vol. 9 (3-4), 129–138.
JANOWICZ L. 2006: Wp yw zmian mi-krobiologicznych na jako!& ziarna zbó% w czasie przechowywania. Przegl"d zbo-%owo-m ynarski, 4 s. 33.
RYNIECKI A., 1998: Warunki bezpiecznego przechowywania ziarna Przegl"d zbo%o-wo-m ynarski, 10 s. 31–32.
WASZKIEWICZ Cz., 1986: Analiza i dobór technologii konserwowania ziarna zbó% dla potrzeb gospodarstwa rolnego. Roz-prawy naukowe i monograÞ e. Wydaw-nictwo SGGW-AR, Warszawa.
WILCKE W.F., GUPTA P., MERONUCK R.A., MOREY R.V. 2000: Effect of changing temperature on deterioration of shelled corn. Trans. ASAE, Vol. 43 (5), 1195–1201.
Streszczenie: Wp$yw warunków przechowywania na warto!" biologiczn% ziarna pszenicy i j&czmie-nia. Dokonano porównania tempa pora%enia ple-
!ni" ziarniaków pszenicy i j$czmienia podczas ich przechowywania w temperaturach 20, 25 i 30°C oraz przy wilgotno!ci wzgl$dnej powietrza 94 i 99%. Sta e warunki przechowywania by y utrzymywane przez umieszczenie próbek ziarna w komorze klimatycznej. Metod" regresji liniowej wyznaczono równania opisuj"ce tempo pora%enia ziarniaków w funkcji czasu przechowywania dla poszczególnych warunków przechowywania. Na podstawie przeprowadzonej analizy wyników bada- wykazano, %e warunki przechowywania (temperatura i wilgotno!& powietrza oraz czas przechowywania) istotnie wp ywaj" na stopie- pora%enia ple!ni" ziarna pszenicy i j$czmienia. Przy tych samych warunkach przechowywania tempo rozwoju ple!ni na ziarniakach pszenicy jest wi$ksze w porównaniu do j$czmienia.
MS. received June 2008
Authors’ address:Katedra Maszyn Rolniczych i Le!nychSzko a G ówna Gospodarstwa Wiejskiego02-787 Warszawa, ul. Nowoursynowska 164

Annals of Warsaw University of Life Sciences – SGGWAgriculture No 52 (Agricultural and Forest Engineering) 2008: 45–50(Ann. Warsaw Univ. of Life Sci. – SGGW, Agricult. 52, 2008)
Abstract: Investigations on drying of new pumpkin varieties. The paper presents preliminary investigations and veriÞ cation of models for drying of new pumpkin varieties in the Þ rst drying period, with consideration to shrinkage in volume, and in the second drying period. In calculations there were used results of measurements on kinetics of drying (in forced convection) of pumpkin particles (cross-cut perpendicularly to Þ bres) in the shape of a plate of thickness 5 and 10 mm, at drying medium temperature 80 C, drying medium speed 1.2 m·s–1. The results of measurements on changes in pumpkin particle volume were also used in calculations. The drying process was executed in a tunnel dryer.
Key words: pumpkin, convectional drying, forced convection, model, shrinkage.
NotationK – drying coefÞ cient in the second period, min–1,N – coefÞ cient, dimensionless,a – coefÞ cient, dimensionless,b – maximum value of shrinkage coefÞ cient, dimensionless,k0 – constant drying rate, min–1,Ms – dry mass of solid particle, %,u – moisture content of solid particle, kg·kg–1,ue – equilibrium moisture content of solid particle, kg·kg–1,u0 – initial moisture content of dried particle, kg·kg–1,ucr – critical water content, kg·kg–1,' – relative error, %,( – error, dimensionless,
) – time of drying, min,)cr – time of drying while water content, u = ucr, min.
INTRODUCTION
In recent years one can Þ nd a constantly increasing interest in the products made of pumpkin fruits, expressed by feed, pharmaceutical and food industries. To meet new requirements of consumers, in Department of Plant Genetics, Breeding and Biotechnology of WULS there were created new pumpkin varieties of improved quality in terms of: taste, nutritional and technical value (soft external cover, improved colour of ß esh and cover, reduced volume of seed pocket. Investigations were carried out on drying of two edible pumpkin varieties (Justynka and Amazonka) and one feeding variety (Ambar). In hitherto references, apart from the Authors’ investigations, there is lack of data on pumpkin drying, particularly on drying of new varieties. More detailed learning and scientiÞ c explanation of the process is important with respect to both the cognitive and utilization aspects. The drying process coefÞ cients determined in this work can be used in optimization of convectional drying process and also in improvement of dryers’ design.
Investigations on drying of new pumpkin varieties
MARIUSZ SOJAK, SZYMON G,OWACKI Department of Fundamental Engineering, Warsaw University of Life Sciences – SGGW, Warsaw, Poland

46 M. Sojak, Sz. G$owacki
MODELLING OF VEGETABLE CHIPS DRYING
Process of convectional drying of very moist solid bodies occurs in two signiÞ cantly different drying periods. In the Þ rst period the process is inß uenced by conditions of water particle transport from the surface of body subjected to drying through the boundary layer of gas; in conventional second period of drying, the process is inß uenced by the conditions of internal diffusion of these particles to body surface. In fact, transition from the Þ rst to second period proceeds constantly. This period is called a transitory period and it is not well learned theoretically, while only parts of its mathematical models are known (Jaros and Pabis 2006). The kinetic model considering the effect of drying shrinkage was checked in this work in the range (u0, ucr) (Pabis 1999):
u ub
b
Nuk
b
b
N
( )τ τ=
−
0
00
1
11
1
1−−
−−
(1)
This model was proved with maximal local error not bigger than 11% in the range of water content from 7.5 to about 2 kg·kg–1 and for coefÞ cient b = 0.056, determined in drying process of another pumpkin variety (Sojak 2000).
The exponent N value in equation (1) can be determined eg.: by trial-and error method or it can be calculated (Pabis and Jaros 2002) basing on results of measurements on changes in shape parameters (Sojak and Jaros 1999).
The second model to be veriÞ ed for the range (u0, ucr) is:
u u u u ex Ke cr e( ) ( ) )τ τ= + p(− − (2)
Equation (2) was proved with maximal local error not bigger than 15% in the range of water content from about 2 to about 0.02–0.16 kg·kg–1.
In respect to maintaining of process continuity in point u = ucr , drying speeds in the Þ rst and second periods must be equal, thus, (du/d) )I = (du/d) )II (Sojak 2000).
Then, coefÞ cient of drying speed can be calculated (Jaros and Pabis, 2006) from equation:
Kk
u u
b
Nuk
cr ecr
N
=−( )
−−
−0
00
1
11
τ
(3)
VERIFICATION OF MODELS FOR THE FIRST AND SECOND DRYING PERIODS
Figure 1 presents results of three repetitions of measurements on changes in water content in pumpkin slices of thickness 5 and 10 mm at drying medium temperature 80°C and drying medium speed 1.2 m·s–1. Changes in water content were described with the mean functions in the form of cubic polynomials selected so, that relative error was lower then 1%; their graphical interpretation is presented in Figure 1.
CoefÞ cient N in model (1) was determined by subsequent approximations so, that model relative error of water content was possibly lowest according to method given by Jaros and Pabis (2006). The value of k0 coefÞ cient of initial drying speed was determined by linear regression method, basing on water content initial measurements.

Investigations on drying of new pumpkin varieties 47
The course of drying speed was determined basing on measurements on water content. Figure 2a presents drying speed of pumpkin chips of Justynka variety in slices of thickness 10 mm depending on drying duration, while in Figure 2b the drying speed is dependent on instant water content calculated from measurements.
Analysis of drying speed of investigated samples points out (especially on diagrams of b type) that at water content of 2 kg·kg–1 the mechanism of mass exchange is changed and also the drying speed decreases rapidly. Therefore, it was assumed that the critical content is equal to or is close to 2 kg·kg–1.
0
1
2
3
4
5
6
7
8
0 100 200 300 400
τ [min]
u [
kg
. kg
-1]
J, 5 mm
J, 10 mm
Z, 5 mm
Z, 10 mm
B, 5 mm
B, 10 mm
FIGURE 1. Graphical representation of formulae approximating results of water content measurements (u) in time ()) for pumpkin chips o varieties Justyna (J), Amazonka (Z) and Ambar (B) of slice thickness 5 and 10 mm, dried at temperature 80°C and drying medium speed 1.2 m·s–1
0,00
0,01
0,02
0,03
0,04
0,05
0,06
0,07
0 100 200 300 400
τ [min]
k, K
[m
in-1]
0,00
0,01
0,02
0,03
0,04
0,05
0,06
0,07
0 1 2 3 4 5 6 7 8 9
u [ kg.kg-1]
k, K
[m
in-1]
a) b)
FIGURE 2. Diagrams of drying speed in I and II drying periods (thin line, k and thick line, K, respec-tively) for pumpkin chips of Justynka variety of thickness 10 mm, dried at temperature 80°C and drying medium speed 1.2 m·s–1

48 M. Sojak, Sz. G$owacki
Figure 3 presents diagrams of local relative and absolute errors determining accuracy of calculations on water content of models (1) and (2) compared to values calculated from measurements.
The value of relative error was taken as 0.3 kg·kg–1, assuming that this value determines the range of water content, where models (1) and (2) can be regarded as veriÞ ed; this value should not be exceeded.
The time )cr after which the dried samples achieve water content 2 kg·kg–1 was determined basing on formulae approximating results of measurements.
It was found that changes in drying speed can be described with a linear equation of large value of correlation coefÞ cient. It results in the value of N coefÞ cient in model (1) equal to 2. The values of this coefÞ cient, for which the model of I drying period is regarded as veriÞ ed are presented in Table 1.
The models of changes in water content (1) and (2) are highly dependent on coefÞ cient N. If its value is taken as 3, the accuracy of drying process modeling
is not acceptable, which is pointed out by absolute and relative error values calculated in relation to measurement results. Error values of both models increase along with an increase in
coefÞ cient N values (Fig. 4).The carried out logical analysis of
models (I) and (II) with consideration to equation (3) showed the sufÞ cient accuracy of modeling the drying process for values of drying shrinkage values b included in interval [0,0; 0,1];it is proved by relative and absolute error values for both models, calculated in relation to measurement results. However, this accuracy calculated for b values included in interval (0,1; 1,0] can not be accepted, basing on the relative and absolute error values (Fig. 5).
In Table 1 there are presented values of particular drying parameters and model coefÞ cients of drying periods I and II, for which these models were considered as veriÞ ed. Additionally, the percent content of dried matter was included for particular varieties of pumpkin fruits.
0
10
20
30
40
50
60
0 100 200 300 400
τ [min]
δ [%
]
0
2
4
6
8
-0,3 0,0 0,3
∆ [−]
u [
kg
. kg
-1]
FIGURE 3. Diagrams of local relative ( ) and absolute (!) errors for water content calculations of mod-el I (thin line) and II (thick line) of drying period for pumpkin chips of Justynka variety for slice thick-ness 5 mm, temperature 80°C, drying medium speed 1.2 m·s–1 and coefÞ cients: N = 1.6, b = 0.056

Investigations on drying of new pumpkin varieties 49
0
10
20
30
40
50
60
0 100 200 300 400
τ [min]
δ [
%]
N=1,6
N=3,0
N=5,0
0
2
4
6
8
-0,6 -0,3 0,0 0,3 0,6
∆ [-]
u [
kg
. kg
-1]
N=1,6
N=3,0
N=5,0
FIGURE 4. Diagrams of local relative ( ) and absolute (!) errors for water content calculations of model I (thin line) and II (thick line) of drying period for pumpkin chips of Justynka variety for slice thickness 5 mm, temperature 80°C, drying medium speed 1.2 m·s–1 and coefÞ cients: N = 1.6, 3.0, 5.0; b = 0.056
TABLE 1. Values of parameters of pumpkin chips drying for which models (1) and (2) were veriÞ ed
Parameters
Variety
Justynka Amazonka Ambar
Thickness [mm]
5 10 5 10 5 10
u0 [kg kg–1] 7.63 7.63 7.32 7.32 5.01 5.01
"cr [min] 113 177 125 207 75 147
ucr [kg kg–1] 1.8 2.1 2.0 1.8 2.0 2.0
N 1.60 2.40 1.40 2.80 2.60 1.10
k [min–1] 0.063 0.043 0.049 0.038 0.052 0.021
b 0.056 0.056 0.056 0.056 0.056 0.056
ue [kg kg–1] 0.020 0.040 0.110 0.040 0.060 0.160
K [min–1] 0.0222 0.0107 0.0192 0.0098 0.0161 0.0110
Ms [%] 11.59 11.59 12.02 12.02 16.65 16.65
0
10
20
30
40
50
60
0 100 200 300 400
τ [min]
δ [
%]
b=0,056
b=0,1
b=0,3
0
2
4
6
8
-0,6 -0,3 0,0 0,3 0,6
∆ [-]
u [
kg
. kg
-1]
b=0,056
b=0,1
b=0,3
FIGURE 5. Diagrams of local relative ( ) and absolute (!) errors for water content calculations of model I (thin line) and II (thick line) of drying period for pumpkin chips of Justynka variety for slice thickness 5 mm, temperature 80°C, drying medium speed 1.2 m·s–1 and coefÞ cients: N = 1.6, b = 0.056, 0.1, 0.3

50 M. Sojak, Sz. G owacki
SUMMARY
Kinetic models of convectional drying of solid bodies considering the drying shrinkage were proved empirically with results of measurements on drying of pumpkin chips of varieties Amazonka, Ambar and Justyna in the tunnel dryer. As the logical analysis points out and carried out investigations prove, the models are sensitive to changes in coefÞ cients N and b values. For investigated varieties there were obtained signiÞ cantly different values of coefÞ cient N, while the same maximal shrinkage value b (determined in previous investigations for Aura variety) was taken. The coefÞ cient b values can differ in various varieties, characterized by different content of dry matter. Therefore, it is advisable to carry out further investigations in order to determine the above coefÞ cients for each variety and to re-verify the models (1) and (2), as well as to determine other parameters describing the drying process (eg. coefÞ cient of water diffusion).
REFERENCES
SOJAK M., JAROS M. 1999: The veriÞ cation of the model of the Þ rst drying period of pumpkin. International Conference of PhD Students. University of Miszkolc, Section proceeding agriculture. Hungary. pp. 155–161. ISBN: 963-661-375-3
SOJAK M. 2000: Matematyczny model kon-wekcyjnego suszenia dyni spo#ywczej. Rozprawa doktorska. SGGW Warszawa.
PABIS S. 1999: Koncepcja teorii konwek-cyjnego suszenia warzyw. Konwekcyjne Suszenie Warzyw – Teoria i Praktyka, pod red. Stanis$awa Pabisa. PTIR Kraków 1999, s. 9–31. ISBN: 83-905219-2-X
PABIS S.; JAROS M. 2002: The Þ rst period of convection drying of vegetables and the effect of shape-dependent shrinkage. Biosystems Engineering. 81(2), pp. 201––211. www.idealibrary.com. ISSN: 1537––5110.
JAROS M., PABIS S. 2006: Theoretical models for ß uid bed drying of cut vegetables. Biosystems Engineering. 93(1), pp. 45–55. www.sciencedirect.com. ISSN: 1537–5110.
Streszczenie: Badania suszenia nowych odmian dyni. W pracy przedstawiono wst%pne wyniki bada& oraz weryÞ kacj% modeli pierwszego okresu suszenia z uwzgl%dnieniem skurczu obj%to'ciowego oraz drugiego okresu suszenia nowych odmian dyni. Do oblicze& wykorzystano wyniki pomiarów kinetyki suszenia, w konwekcji wymuszonej, cz(stek dyni (krojonych prostopadle do w$ókien) w kszta$cie p$yty o grubo'ci 5 oraz 10 mm, w temperaturze czynnika susz(cego 80°C, dla pr%dko'ci czynnika susz(cego 1,2 m·s–1, oraz pomiarów zmian obj%to'ci cz(stek dyni. Proces suszenia przeprowadzony zosta$ w suszarce tunelowej.
MS. received June 2008
Authors’ address:Mariusz Sojak, Szymon G$owackiWydzia$ In#ynierii Produkcji SGGW, Zak$ad Podstaw Nauk Technicznych,ul. Nowoursynowska 164, 02-787 Warszawa, Poland.e-mail: [email protected]

Annals of Warsaw University of Life Sciences – SGGWAgriculture No 52 (Agricultural and Forest Engineering) 2008: 51–57(Ann. Warsaw Univ. of Life Sci. – SGGW, Agricult. 52, 2008)
Abstract: Analysis of optimal values of air stream supplied in the clusters. A mathematical model for vacuum drop in the form of Bernoulli equation with the assumed constant velocity of ascent of a free bubble was used in determination of optimal air streams to get the minimal vacuum drops. Analysis of these values allowed for determination of supplied air stream corresponding to a given milking speed, depending on tube diameter and the height of liquid rise.
Key words: mechanical milking machine, air stream, pressure changes, optimization.
INTRODUCTION
It was found in hitherto investigations (Majkowska 2007b) that the minimal vacuum drops (min !p) in a long milk tube are realized at properly adjusted values of supplied air stream Qp(min!p). This result conÞ rms the previous Nordergen hypothesis (1980). The cluster operating in a given cow-shed serves the cows of different milking capacity Qm. Even if the animals are grouped according to milking capacity, it differs between the cows within a given group.
The problem arises, how to select the supplied air stream to achieve the least drops, and what is the connection between the stream Qp(min!p) allowing for minimal drops and design parameters of milking machine.
AIM OF WORK
The work aims at determination of supplied air stream to get the least vacuum drops, and at analysis of the effect of long milk tube diameter and the height of liquid rise on optimal air stream value Qp(min!p).
MATERIAL AND METHODS
The model presented by Kupczyk (1999) for vacuum drops in the cluster, described with Bernoulli equation for the lost height, is of the form:
∆p gH
l
D
u
u
kol pdpm m
pdpm mdpm M
pdpm mM
= − +
+ − +
+ −
( )
( )
( )
1
12
1
2
α ρ
α λρ
α ξρ22
2
where: !pdpm – volumetric coefÞ cient of air in long milk tube,!mdpm – volumetric coefÞ cient of milk in long milk tube,ldpm – length of milk tube [m],D – diameter of long milk tube [m]," – coefÞ cient of local losses,#$– coefÞ cient of local loss dependent on relative tube roughness and Re number,
Analysis of optimal values of air stream supplied in the clusters
MARIA MAJKOWSKA1, ADAM KUPCZYK2 1Department of Applied Mathematics, Warsaw University of Life Sciences – SGGW, Warsaw, Poland2Department of Production Management and Engineering, Warsaw University of Life Sciences – SGGW, Warsaw, Poland

52 M. Majkowska, A. Kupczyk
H – height of rise [m],%m, %p – density of milk and air [kg.m–3],g – acceleration of gravity [m.s–2],uM – reduced velocity of mixture [m.s–1].
This equation was simpliÞ ed by substitution of free rise velocity with a constant one (Majkowska, 2007a). The vacuum drop !pkol occurs in factors:
u u uQ
A
Q
A
p
pM m p
m
dpm
p
dpm
N= + = +
α pdpmp
M
u
u v=
+ ∞1 2,
with p p
pr
kol= +∆
2
[kPa]
where: Qm, Qp – stream of milk [kg.min–1] and air [m3.h–1],up, um – reduced velocities of air and milk [m.s–1],pN =100 [kPa].
The Bernoulli equation was reduced to a fourth degree polynomial in relation to !pkol. The following task was formulated:(let !pkol = x, J – optimization task)
J xQp
= min , where x is connected by
identity:
w Q x w Q x
w Q x w Q x
w Q
x p x p
x p x p
w p
44
33
22
1
0
( ) ( )
( ) ( )
( )
+ +
+ + +
+ =
The solution for this task is minimal vacuum drop and the corresponding air stream (Majkowska 2007b).
EFFECT OF LIQUID RISE HEIGHT ON MINIMAL DROP VALUES AND CORRESPONDING SUPPLIED AIR STREAM
The height of liquid rise is one of important factors inß uencing the vacuum drops, also the minimal drops as well as the supplied air stream value Qp(min!p). Dependence of the air stream minimizing the vacuum drop on milking rate Qpmin
!p(min!p(Qm)). For a given height of liquid rise H, independently of the milk tube diameter D, this dependence is nonlinear and convex, with extremum in the neighbourhood of a point characteristic for height H (Fig. 1). In the can milking machine H = 0.4 m, the maximal air stream minimizing the drops Q*pmin !p for each diameter corresponds to vacuum drop about 2 kPa. In milking machine with highly arranged milking tube, the maximal values Q*pmin !p correspond to vacuum drop about 10 kPa (Fig. 1). This result conÞ rms observations of Kupczyk (1999).
Considering hypothetical heights of liquid rise H in the range from 0.4 m to 1.9 m one can Þ nd that the vacuum drops corresponding to Q*pmin !p(Hi) values are set almost along a straight line of constant inclination angle coefÞ cient independent of diameter D (Fig. 2). Change in diameter does not inß uence the linearity of rise of minimal drops, corresponding to maximal air streams for a given diameter, with an increase in height.

Analysis of optimal values of air stream supplied in the clusters 53
0 5 10 15 20 25 300
0.1
0.2
0.3
0.4
0.5
0.6
0.7
0.8
0.9
1
minimum delta P [kPa]
Qp
min
delta P
[m
3h
–1]
D=0.013
D=0.02
D=0.013
D=0.02
FIGURE 1. Supplied air stream minimizing vacuum drops as a function of minimal drops for various milking rates (ranging from 0.5 to 12 kg min–1); Qpmin !p(min!p(Qm)), while H = 0.4 m, H = 1.9 m
0.4 0.6 0.8 1 1.2 1.4 1.6 1.8 21000
2000
3000
4000
5000
6000
7000
8000
9000
10000
11000
H [m]
min
imum
delta P
[kP
a]
FIGURE 2. Minimal vacuum drops for Q*pmin !p(Hi) presented for diameter D ranging from 0.013 m to 0.016 m

54 M. Majkowska, A. Kupczyk
EFFECT OF DIAMETER ON MINIMAL DROPS VALUES AND CORRESPONDING VALUES OF SUPPLIED AIR STREAM
The range of changes in minimal drops at deÞ ned height H depending on diameter Ddpm was analyzed. The bigger diameter, the lower scatter of minimal vacuum drops. Therefore, at bigger diameter, independent of milking rate, one can
determine the expected minimal vacuum drop more precisely. Similarly, with an increase in diameter the range of supplied air, realizing the minimal drops (scatter !Qp = Q*pmin !p – Qpmin !p), decreases (Fig. 3).
The range of supplied air stream minimizing the drops can be determined for each diameter and height of liquid rise at investigated milking rates (from 0.5 to 12 kg min–1). Assuming a constant
5 10 15 20 25 300
0.02
0.04
0.06
0.08
0.1
0.12
0.14
0.16
0.18
0.2
minimum delta P [kPa]
D=0.012
D=0.02
Q* p
min
P –
Qp m
in P
[m
3h
–1]
1 2 3 4 5 6 7 80
0.05
0.1
0.15
0.2
0.25
0.3
0.35
minimum delta P [kPa]
D=0.02
D=0.012
Q* p
min
P –
Qp m
in P
[m
3h
–1]
FIGURE 3. Difference between maximal supplied air stream among the drop minimizing streams and the air stream minimizing vacuum drop for subsequent milking rates and diameters from 0.012 to 0.02 m: (Q*pmin !p(min!p(Qm)) – Qpmin !p(min!p(Qm)) [m3·h–1], for H = 1.9 m (Fig. 3a) and H = 0.4 m (Fig. 3b)
a
b

Analysis of optimal values of air stream supplied in the clusters 55
air stream for each milking rate at the levels of three selected values of the range of streams optimizing drops, one can Þ nd that the vacuum drops differ inconsiderably. The calculated vacuum drops for the selected diameters at H = = 1.9 m are presented in Figure 4a, b.
A signiÞ cant effect of the height of liquid rise on maximal air stream minimizing the vacuum drops can be found. This dependence is ascending,
nonlinear and convex for each diameter of long milk tube (Fig. 5).
CONCLUSIONS
The vacuum drop corresponding to a given maximal air stream, supplied from the air streams minimizing drops, is constant for deÞ ned height
•
0 2 4 6 8 10 125
10
15
20
25
30
35
Qm
deltaP
Qp=0.09Qp=0.19Qp=0.26D=0.012
0 2 4 6 8 10 126
8
10
12
14
16
18
Qm
deltaP
Qp=0.43Qp=0.47Qp=0.53D=0.016
FIGURE 4. Vacuum drops obtained by three selected values of supplied air stream as a function of milking rate

56 M. Majkowska, A. Kupczyk
of liquid rise and independent of diameter of long milk tube.It changes linearly as a function of the height of liquid rise for each diameter, with constant angle coefÞ cient.One can point out the range of supplied air stream to obtain the minimal air streams, if milking machine parameters H, D are determined. Within this range of supplied air stream the vacuum drops differ inconsiderably.An increase in diameter of long milk tube causes a decrease in scatter of minimal vacuum drops and a decrease in the range of supplied air stream realizing the minimal drops.An increase in the height of liquid rise causes an increase in minimal vacuum drops (almost linear) and an increase in supplied sir stream realizing the minimal drops, while an increase in maximal stream values is nonlinear.
•
•
•
•
REFERENCES
KUPCZYK A. 1999: Doskonalenie wa-runków doju mechanicznego ze szcze-gólnym uwzgl%dnieniem podci'nienia w aparacie udojowym. Rozprawa habili-tacyjna, SGGW Warszawa.
MAJKOWSKA M. 2007a: Spadki podci'-nienia w d$ugim przewodzie mlecznym aparatu udojowego obliczane na podsta-wie uproszczonego równania Bernoullie-go. Problemy In#ynierii Rolniczej 2(56).
MAJKOWSKA M. 2007b: Minimaliza-cja spadków podci'nienia w kolektorze aparatu udojowego w oparciu o model matematyczny, Vol. 6/1 ARAE, OÞ cyna Wydawnicza Dabor
NORDERGEN S.A. 1980: Cyclic Vacuum Fluctuations In Milking Machines. Dissertation. Hohenheim.
Streszczenie: Analiza optymalnych warto"ci
strumienia powietrza dopuszczanego w apara-
tach udojowych. Minimalne spadki podci'nienia w d$ugim przewodzie mlecznym wyznaczone na podstawie równania Bernoulliego na wysoko') stracon(, w którym przyj%to pr%dko') wznoszenia
0.4 0.6 0.8 1 1.2 1.4 1.6 1.8 20.2
0.25
0.3
0.35
0.4
0.45
0.5
0.55
H
Qpm
inP
D=0.013
D=0.014
D=0.015
D=0.016
FIGURE 5. Air stream minimizing vacuum drops Q*pmin !p(Hi) for various diameters of long milk tube

Analysis of optimal values of air stream supplied in the clusters 57
p%cherza jako sta$(, okre'laj( wielko') strumienia powietrza dopuszczanego. Dla ró#nych pr%dko'ci doju przeanalizowane zosta$y wielko'ci strumie-nia powietrza w funkcji wysoko'ci podnoszenia cieczy, 'rednicy d$ugiego przewodu mlecznego. Spadki podci'nienia ró#ni( si% nieznacznie, gdy strumie& powietrza jest z zakresu warto'ci mini-malizuj(cych spadki.
MS. received June 2008
Authors’ addresses:Maria MajkowskaKatedra Zastosowa& Matematyki SGGWul. Nowoursynowska 16602-787 WarszawaAdam KupczykKatedra Organizacji i In#ynierii Produkcji SGGW w Warszawieul. Nowoursynowska 16602-787 Warszawa


Annals of Warsaw University of Life Sciences – SGGWAgriculture No 52 (Agricultural and Forest Engineering) 2008: 59–65(Ann. Warsaw Univ. of Life Sci. – SGGW, Agricult. 52, 2008)
Abstract: Optimization of selection of
reconditioned parts in repair of injection pump.
The paper presents possibility of application of dynamic programming in optimization of selection of the new and reconditioned machine parts. The minimization of spare part costs was carried out at assumed reliability of equipment. The method was presented on the example of injection pump repair.
Key words: reconditioning, optimization, injection pumps.
INTRODUCTION
It is proved by many practical examples and also by numerous research works, that application of reconditioned parts in equipment subjected to repair is proÞ table. However, an appropriate quality of repair must be ensured. The reconditioned parts
are used with respect to their lower price and protection of environment in the point recycling by reconditioning (Boche&ski and Klimkiewicz 2001a). Processes of spare part reconditioning occur in strict connection with the processes of repair and disposal of capital assets, as presented in Figure 1 (Bu)ko and Gu') 1988). ConÞ rmation of advisability of reconditioning development can be also found in highly developed countries. It can be assumed that reconditioning is proÞ table and technically justiÞ ed as far as the following is concerned:
parts of older vehicles and out of production,large and expensive elements, e.g.: bodies, heads, fuel systems,parts of special vehicles (short production series),
–
–
–
Optimization of selection of reconditioned parts in repair of injection pump
MAREK KLIMKIEWICZ Department of Production Management and Engineering, Warsaw University of Life Sciences – SGGW, Warsaw, Poland
New spare parts
Reconditioning
spare parts
Repair
Scrap material Reconditioning
Running down of
capital assets
FIGURE 1. Place of reconditioning in circulation of spare parts (Bu)ko and Gu') 1988)

60 M. Klimkiewicz
units and parts of low reconditioning costs – starters, generators, valves etc.Reconditioning requires lower energy
and material inputs than production and they can be estimated as several percent in relation to a new product. The reconditioning costs are inß uenced by technology, size of production, continuity of supply, and other factors. It is assumed that total costs of reconditioning should not exceed about 60% of the costs of a new part fabrication. The equipment being repaired, as a system, must fulÞ ll the reliability requirements, which depend on system structure and reliability of basic components. The reliability indices can be obtained in exploitation or laboratory investigations. With respect to short series of the parts being reconditioned and heterogeneity of population, the reliability indices can often be evaluated on the basis of reconditioning technology used. Many reconditioning methods enable to give the parts such properties, that their durability can be higher than that of the original parts.
OPTIMIZATION OF PART SELECTION BY DYNAMIC PROGRAMING METHOD
Knowing the reliability indices values one can select parts of various quality to equipment being repaired with the use of optimization methods, e.g. the dynamic programming method, using the Bellman’s principle (1957). In dynamic programming method a general purpose algorithm for solution is not used. A detailed proceeding method should be
– developed for each problem. In optimal selection of new and reconditioned parts for the equipment being repaired one can adapt an algorithm applied in allocation of new parts reliability, presented by Kapur and Lamberson (1980).
Algorithm of optimization
It was assumed that the needed value of reliability index (probability of proper operation) of the equipment is #, and that:
0 < # < 1
The least values of reliability indices for particular elements were designated as xi, and:
0 < xi < 1
Further designations:yi – variable level of reliability index value for i-element, and:
xi $ yi < 1
Gi(xi,yi) – costs connected to application of parts of reliability index value xi or yi,yi* – optimal level of reliability index value for i-element at minimal costs.
The optimization aims at determination of value z as a minimal cost function:
z G x y
i
n
i i i==∑min ( , )
1
with limitations:
y yi
i
n
=∏ ≥
1
ɶ
and 0 < xi yi 1, i = 1, ..., n.
The algorithm of dynamic program-ming can be presented in the form of graphical model (Fig. 2).
Each i-element represents simultane-ously the stage k of task solving, there-fore, it was assumed that i = k. Sk is a set

Optimization of selection of reconditioned parts in repair of injection pump 61
of possible reliability indices sk at stage k, and:
1 = sn ! sn–1 ! , ..., sk !, ..., s1 ! s0 =
The sk value determines reliability index to be taken for a given element at k-stage of solution to ensure the required level of system reliability.
A set Dk of such possible decisions dk at stage k is determined to achieve:
xk ! yk < 1 k = 1, ..., n
Transformation function Tk represents the following conversion of Þ nal state at stage k into initial state:
Tk(sk,dk) = skyk = sk–1
k = 1, ..., n (2)
while the proÞ t function Rk (function determining the effect depending on initial state at stage k and decision undertaken at this stage) will be expressed with the following dependence:
Rk(sk,dk) = [Gk(sk,yk) + fk–1(sk–1)],
k =1, ..., n (3)
where fk(sk) – transition function determining optimal effect obtained from the initial stage to k-stage.
The basic functional dependence in this case has the form of the following recurring function:
f s G s y f sk ky
k k k k kk
( ) min[ ( , ) ( )]= + − −1 1 ,
k n,=1 ..., (4)
while:
yy
S yk
k k
≥⋅ −
ɶ
1
(5)
where:
f0(s0) = 0, sn = 1 sk–1 = sk · yk
VeriÞ cation calculations
The injection pump of distributor DPA type is a precise device consisted of over 100 elements. This pump, as majority of mechanical systems, is characterized by in-line reliability structure, which can be schematically presented by the in-line connected blocks:
The function of reliability structure of such system can be expressed as follows:
S x x xn i
i
n
( , ..., )1
1
=
=∏
(6)
Sn = 1
Final stage Initial stage
k=1, ...n S0 =
Dk
Sk yk = Sk-1 Sk-1
xk ! yk ! 1
k
Gk(xk, yk)
FIGURE 2. Graphical model for solution of dynamic programming task (source: own elaboration based on Kapur and Lamberson 1980)
1 2 n

62 M. Klimkiewicz
where: S(xl,…, xn) – function of reliability structure of system,xi – realization of vector coordinate of reliability state of logic value 0 or 1.
Probability of proper operation of the system Rs(t) under deÞ ned exploitation conditions can be calculated by expanding determination of the vector coordinates of reliability state of logic values 0 or 1 into values of the range <0,1>, with the following dependence:
R (t)= R ts
i
n
i ( )
=∏
1
(7)
where: Ri(t) – probability of proper operation of element during time t under these conditions.
Intensity of pump damage is equal to the sum of intensity of damage of particular elements. Serious failures of the pump leading to substantial Þ nancial inputs result usually from damage of hydraulic head, body or cam ring; therefore, with consideration to purpose of calculations one can assume that the index of dependence (7) will undertake the form:
R t R t R t R ts ( ) = ( ) ⋅ ( ) ⋅ ( )1 2 3
(8)
where: R1(t), R2(t), R3(t) – probability of proper operation of hydraulic head, cam ring and body of the pump in time t, respectively.
Probability of proper operation of the pump elements will be evaluated for the half-year period, which means the guarantee period given by majority of workshops repairing the fuel systems. Evaluation of indices for proper operation of elements was based on exploitation investigations carried out in service workshops for fuel equipment (Boche"ski and Klimkiewicz 2001b c).To simplify designations and to ensure their conformity with dynamic programming algorithm, these indices will be called below as reliability and designated with symbol yi. Reliability in selection of parts was evaluated with consideration to damage occurred during assembling and adjustments in service workshops as well as during exploitation. The current market prices of spare parts were taken as the costs of elements. The reliability indices and prices of parts are presented in Table 1.
The maximal values of reliability for the three mentioned elements of pump (new parts) were evaluated as follows: hydraulic head R(t) = 0.99, cam ring R(t) = 0.999, body R(t) = 0.999. Therefore,
TABLE 1. Values of reliability ndices and costs of New and reconditioned parts
Hydraulic head Cam ring Body
y1(reliability – R1(t))
G1(Sk,y1)cost [PLN]
y2(reliability
– R2(t))
G2(Sk,y2)cost [PLN]
y3(reliability
– R3(t))
G3(Sk,y3)cost [PLN]
0.975 100 0.980 20 0.991 30
0.980 130 0.999 100* 0.999 100*
0.988 150
0.990 350*
* – New elements.

Optimization of selection of reconditioned parts in repair of injection pump 63
the hydraulic head is a weak element and it determines the reliability of entire equipment. As it is evident from the product low of reliability (equation 7), reliability of the entire system can not be higher than reliability of the most deceptive element, therefore, it can not exceed the value R(t) = 0.99. It was assumed in the model that reliability of the complete injection pump must be higher than R(t) = 0.96.
Tables 2–4 present the values of all possible reliability indices for various elements, which ensure reliability of the system.
In Tables 5–7 the conversion functions were determined. It is evident from Table 7 that conversion function:
f s G s y f sy
3 3 3 3 3 2 23
( ) min[ ( , ) ( )]= +
is equal to 260.
This value is obtained for reliability y3* = R3(t) = 0.991; therefore, the reconditioned body of cost 30 PLN is selected (yi* – optimal level of reliability index for i-element at minimal costs). Then, from Table 6 there is selected the element of reliability y2* = R2(t) = 0.999 for function f2(s2) = 230. This is the cam ring of cost equal to 100 PLN. Finally, from Table 5 for the function f1(s1) = 130 there is selected the element of reliability y1* = R1(t) = 0.98. This is the hydraulic head of cost 130 PLN. The total cost of the parts will amount to 260 PLN.
Assuming various values of reliability for the complete injection pump and performing the simulation with the use of Excel program, there were obtained the total costs of elements ensuring the required probability of proper operation of the pump (Tab. 8).
TABLE 2. Transformation at stage 3: there is determined system reliability, which can be taken at stage 2: s3 = 1, s2 = s3 · y3
y3
s30.991 0.999
1.000 0.991 0.999
TABLE 3. Transformation at stage 2: s1 = s2 · y2
y2
s20.980 0.999
0.991 0.9712 0.9900.999 0.9790 0.998
TABLE 4. Transformation at stage 1: s0 = s1 · y1
y1s1
0.975 0.980 0.988 0.990
0.9712 – – – 0.96150.9790 – – 0.9673 0.96920.9900 – 0.9702 0.9781 0.98010.9980 0.9731 0.9780 0.9860 0.9880

64 M. Klimkiewicz
SUMMARY
Application of dynamic programming method allowed for objective selection of the new and reconditioned parts to ensure proper reliability of the injection pump. The model based on this method can be successfully used in selection of spare parts for other equipment. An ad-vantage of dynamic programming is re-duction of labour inputs of the solutions, when compared to other methods. The dynamic programming releases from combinatorial investigating of all solu-tions, which must be applied in other optimization methods, since every stage
is considered separately and an optimal solution is selected at every stage.
Simulation of total costs of assembled parts for different values of required reliability enables to select the desirable variant of spare parts’ set depending on customer expectations.
REFERENCES
BELLMAN R. 1957: Dynamic Program-ming. Princeton University Press. 400.
BOCHE#SKI C., KLIMKIEWICZ M. 2001a: Regeneracja cz$%ci maszyn jako jeden ze sposobów recyklingu Materia&y Konferencyjne – I Mi$dz. Konf. Nauk-
TABLE 5. Matrix of costs at stage 1: G1(s1,y1) and vector f1(s1)
y1
s10.9750 0.980 0.988 0.990 f1(s1)
0.9712 – – 350 350
0.9790 – – 150 350 150
0.9900 – 130 150 350 130
0.9980 100 130 150 350 100
TABLE 6. Matrix of costs at stage 2: G2(s2,y2) and vector f2(s2) = G2(s2,y2) + f1(s1)
y2
s20.9800 0.9990 f2(s2)
0.9910 20+350 100 + 130 230
0.9990 20+150 100 +100 170
TABLE 7. Matrix of costs at stage 3: G3(s3,y3) and vector f3(s3) = G3(s3,y3) + f2(s2)
y3
s30.991 0.999 f3(s3)
1 30 +230 100 + 170 260
TABLE 8. Results of simulation on total costs of assembled elements for different values of required
system reliability
Required system reliability 0.988 0.985 0.98 0.975 0.97 0.96 0.95 < 0.95
Calculated reliability 0.988 0.986 0.986 0.978 0.970 0.970 0.951 0.9469
Total cost of elements 550 350 350 280 260 260 180 150

Optimization of selection of reconditioned parts in repair of injection pump 65
-Tech. „Problemy Recyklingu. Rogów. p. 55–63.
BOCHE#SKI C., (Kier. projektu bad.) KLIMKIEWICZ M. 2001b: Badania wp&ywu w&a%ciwo%ci Þ zykochemicznych paliwa do silników wysokopr$'nych na charakterystyk$ wtrysku i trwa&o%ci ele-mentów uk&adu paliwowego konwen-cjonalnego i Common Rail. Projekt bad. KBN nr 9T12D00716. Maszynopis cz. II, WIP, Warszawa. p. 128.
BOCHE#SKI C., KLIMKIEWICZ M. 2001c: Problemy smarowania i zu'ycia pomp wtryskowych w aspekcie stoso-wanych paliw. Motoryzacja i Energetyka Rolnictwa. II Mi$dz. Konf. Nauk. Tech. „MOTROL 2001”. Tom 4. p. 13–19.
BU(KO J., GU)( A. 1988: Rachunek eko-nomicznej efektywno%ci regeneracji cz$%ci wymiennych. Krajowa Konf. n.t.: Regeneracja Cz$%ci Maszyn. *ód+ 1988.s. 1–14.
KAPUR K., LAMBERSON L. 1980: Nade'nost i projektirowanie sistem. Mir, Moskwa. ss. 604
Streszczenie: Optymalizacja doboru regenero-
wanych cz"#ci do naprawy pompy wtryskowej.
Modelowanie doboru regenerowanych cz$%ci do
naprawianej pompy wtryskowej przeprowadzo-
no, stosuj,c programowanie dynamiczne. Za po-
moc, tej metody mo'na w obiektywny sposób do-
bra- cz$%ci nowe i regenerowane, aby zapewni- odpowiedni, niezawodno%- pompy wtryskowej.
Metod$ zaprezentowano na przyk&adzie naprawy
pompy wtryskowej.
MS. received June 2008
Author’s address:Katedra Organizacji i In'ynierii Produkcji SGGW 02-787 Warszawa, ul. Nowoursynowska 166


Annals of Warsaw University of Life Sciences – SGGWAgriculture No 52 (Agricultural and Forest Engineering) 2008: 67–71(Ann. Warsaw Univ. of Life Sci. – SGGW, Agricult. 52, 2008)
Abstract: Properties and structure of spheroidal
chilled cast iron welded by friction. Investigations
were carried out on friction welding of spheroidal
cast iron “modiÞ ed” from the front. The
investigations aimed at “decreasing” of free state
carbon content in welding zone. The samples
were welded by friction and subjected to strength
test, hardness test and structural test with the
use of scanning electron microscope (SEM). An
increase in friction time improved the strength of
connections, however, the temperature achieved
in a central part of connection was insufÞ cient to
break up the cementite into equivalent phases.
Key words: spheroidal cast iron, friction welding,
strength of connection.
INTRODUCTION
Friction welding is a method of welding, which has been recently used to connect grey cast iron with both the ß ake graphite and the spheroidal graphite (Dette and Hirsch 1990; Shinoda, Endo and Kato 1999). The hitherto trials aimed from one side at simpliÞ cation of construction of casts and the resulting decrease in quantity of scrap, from the other side at obtaining a high mechanical strength during exploitation of a given element. The classical examples of such applications are joints of articulated telescopic shafts transferring power from tractor to agricultural machines, suction and exhaust valves of internal combustion engines, hydraulic cylinders, piston
rods, parts of gears, driving shafts and turbine shafts (Brochure Manufacturing Technology, INC (MTI), 1999).
Many authors have used the spacers made of low-carbon steel in order to connect the spheroidal cast iron with the use of friction heat (Kaczorowski and Winiczenko 1999; Winiczenko 2003). Regardless of type of material, these technologies complicate the welding process, increase its time and make technology more expensive. Therefore, author of this work proposes another method, so called “chilling” of cast iron, in order to “decrease” free state carbon content in welding zone.
MATERIAL AND METHODS
There was investigated the spheroidal cast iron of 400 – 15 type of the following chemical composition: C – 3.78%, Si – 2.60%, Mn – 0.15%, P – 0.05 %, S – 0.01%, Cr – 0.03%, Ni – 0.02%, Si – 2.60%, Cu – 0.05%, Mg – 0.036%. The iron castings were fabricated in Founding Department of Mechanical Plant PZL-Wola by the following method: the inductive crucible furnace of capacity 3 t, special low-manganese crude iron 30% + process scrap 15% and the rest – steel scrap, spheroidizing at temperature 1530°C, spheroidizer type
Properties and structure of spheroidal chilled cast iron welded by friction
RADOS*AW WINICZENKO Department of Fundamental Engineering, Warsaw University of Life Sciences – SGGW, Warsaw, Poland

68 R. Winiczenko
611A of granulation 1 10, modiÞ cation at temperature 1450°C with the use of modiÞ er ZL80ZN(0.4/2) of PECHINEY make, put to the bottom of ladle with the use of a sinking device. Then, the samples of properly shaped fronts was welded in a friction welder ZT-14 at University of Technology and Life Sciences in Bydgoszcz.
RESULTS AND THEIR ANALYSIS
To simplify the friction welding process there was attempted a direct welding, in which surfaces of samples being connected were chilled in order to remove the free state carbon, namely in the form of graphite. This operation is relatively simple technologically, since it consists in placing the chill leading to a local solidiÞ cation of cast iron in a metastable system.
As a result, a series of spheroidal cast iron samples were obtained, chilled at distance from 3 to 4 mm. It
was expected that lack of releasing of free state carbon will remove a basic obstacle, namely the graphite layer being deposited on the connection surface. It was also considered that depending on temperature and time of its maintaining on the interface, the cementite could break up into austenite and carbon “in statu nascendi”, which could be released in the form of ultra-dispersive emissions of incandescence carbon during long periods of temperature maintained after completion of welding.
Strength test results
The initial trials did not yield the expected results, since welding time was too short. Warming up of very hard chilled layer to appropriate temperature turned out to be impossible with application of parameters giving good results during welding with the use of a spacer. With respect to limited parameters of the welder, an increase in duration of friction process was the only way for obtaining proper temperature in the plane of connection. This improved
0
50
100
150
200
250
0 20 40 60 80 100 120 140
Time of friction welding t [s]
Ten
sile
str
ength
Rm
[ M
Pa]
FIGURE 1. Results of tensile strength of cast iron chilled samples (I stage of welding)

Properties and structure of spheroidal chilled cast iron welded by friction 69
the strength of connections, presented in Figure 2, although the strength of connection was not fully satisfactory.
Micro hardness test
Considering the course of chilled sample welding one should referred to the results of hardness tests (Fig. 3). It is evident that hardness in the zone of interface, measured in asis of sample is considerably
higher than that measured at distance of 2.5 mm from the surface of cylindrical sample. This suggests that temperature
achieved in central axis of connection was insufÞ cient to cause breaking up of cementite ledeburite into equivalent phases (Fig. 4b). This process occurred in zones situated at bigger distance from the sample axis, but was not completely
0
50
100
150
200
250
0 20 40 60 80 100 120 140
Time of friction welding t [s]
Ten
sile
str
ength
Rm
[ M
Pa]
FIGURE 2. Results of tensile strength of cast iron chilled samples (II stage of welding)
0
50
100
150
200
250
300
350
400
450
500
0 1 2 3 4 5 6 7 8 9
Distance from interface [mm]
Mic
ro h
ard
ness
HV
1
FIGURE 3. Results of micro hardness of spheroidal cast iron (chilled) welded by friction
2,5 mm from edgeof specimen on axis of specimen

70 R. Winiczenko
sufÞ cient (Fig. 3), since the hard central part of sample made impossible such swelling of the sample, that a permanent connection between external fragments the sample could be created. It should be noted that the welding time can not be too long, since it could result in excessive process of breaking up of cementite into austenite and carbon “in statu nascendi” already during friction. If it occurred, the created carbon would be deposited on surface of interface and annihilate the previous action, aimed at its removal during welding.
It should be noted that in that case the hardness of cast iron in the axis of sample and close to plane of connection is distinctly higher than hardness at distance 2.5 mm. It could be caused by the fact that in the axis of sample the temperature was too low for breaking up the cementite Fe3C in the chilled layer into more stabile phases. However, higher peripheral speed in zones situated at distance 2.5 mm from the surface of sample enabled to release the friction
heat, sufÞ cient to create in relatively short time in the chilled layer the processes analogical to those occurring during production of pearlitic malleable cast iron.
Observations and microstructure
studies
Observations on connections welded by friction and chilled from the front point out at cleavable nature of fractures, where initiation of cracks occur on the boundaries of former austenite grains (Fig. 4a). As it was evident from stereoscope tests, in this case the break of sample occurred along the grains of cementite Fe3C, which did not break up entirely and occurred on the welding line.
The advantageous trend observed in Fig. 2 points out the direction of further investigations, although attempts towards connecting of decarburized cast iron seem more perspective, at least theoretically. In this way, it would be possible to create a speciÞ c ferritic
b
Fe3C
a
FIGURE 4. Secondary cracks in envelope structure zone of chilled cast iron: a – magniÞ cation × 2000,
b – microstructure of chilled cast iron welded by friction, with visible Fe3C of various morphology,
magniÞ cation × 250

Properties and structure of spheroidal chilled cast iron welded by friction 71
spacer, perfectly connected with native material; this spaces should ensure better conditions, or at least the same as during friction welding with the use of Armco iron or low-carbon constructional steel.
CONCLUSIONS
Basing on carried out investigations there were formulated the following conclusions:
The spheroidal cast iron can be directly welded by friction, without application of special heat treatments prior to welding.The strength of connection increases with an increase in welding time.The investigations on direct connect-ing of ferritic cast iron “chilled” from the front. The possibility of optimiza-tion of welding parameters (rotation-al speed n or friction force Pt) should bring the rational advantages.“Decarburize” spheroidal cast iron in the welding zone. One can expect, that the produced surface layer will be ferritic, which means that carbon content in this zone will be equal to almost zero, while the hardness of this layer will be small.
REFERENCES
“Friction welding”. 1999. Brochure-Manu-facturing Technology.INC(MTI).
•
•
•
•
DETTE M., HIRSCH J. 1990. Reibschwei-ssen von Konstruieren aus Kugelgraphit-guss mit Stahlteilen. Schweissen und Schneiden, 42, Vol. 11.
KACZOROWSKI M., WINICZENKO R. 1999. Procesy towarzysz ce zgrzewaniu tarciowemu !eliwa sferoidalnego ze sta-l 1H18N9T, II Mi"dzynarodowa Konf. nt.: Nauka dla Przemys#u Odlewniczego, Kraków.
SHINODA T., ENDO S., KATO Y. 1999. Friction welding of cast iron and stainless steels. Welding International, Vol. 13, No 2, p. 89–95.
WINICZENKO R. 2003. $ czenie !eliwa sferoidalnego za pomoc zgrzewania tarciowego. In!ynieria Rolnicza 11(53), 237–243.
Streszczenie: W a!ciwo!ci i struktura zabielonego "eliwa sferoidalnego zgrzanego tarciowo. W pracy przeprowadzono badania nad zgrzewaniem tarcio-wym !eliwa sferoidalnego „modyÞ kowanego” od czo#a. Celem bada% by#o „zmniejszenie” zawarto-&ci w"gla w stanie wolnym w streÞ e zgrzewania. Próbki zosta#y zgrzane tarciowo, a nast"pnie pod-dane badaniom wytrzyma#o&ciowym, twardo&ci i strukturalnym z wykorzystaniem skaningowego mikroskopu elektronowego (SEM). Zwi"kszenie czasu tarcia korzystnie wp#yn"#o na wytrzyma-#o&' po# cze%, aczkolwiek temperatura osi gni"ta w centralnej cz"&ci z# cza by#a niewystarczaj ca do rozpadu cementytu na fazy równowagowe.
MS. received August 2008
Author’s address:Rados#aw WiniczenkoKatedra Podstaw In!ynierii, Wydzia# In!ynierii Produkcji, SGGW , ul. Nowoursynowska 166, 02-787 Warszawaemail: [email protected]


Annals of Warsaw University of Life Sciences – SGGWAgriculture No 52 (Agricultural and Forest Engineering) 2008: 73–79(Ann. Warsaw Univ. of Life Sci. – SGGW, Agricult. 52, 2008)
Abstract: Hyperspectral imaging for chilling injury detection in Red Delicious apples. Part 1: Establishment of a hyperspectral imaging system. A hyperspectral imaging system was established to acquire and preprocess apple images, as well as to extract apple spectral properties. The fruit color was measured for both the external peel and the internal ß esh. The difference between the ß esh responses of both classes was clear from their spectral responses, especially in the visible range, owing to the browning effect of chilling injury development. However, there was no signiÞ cant difference between normal and injured fruits in terms of all color parameters (R, G, B, L*, a*, and b*).
Key words: Hyperspectral imaging, artiÞ cial neural network (ANN), apple, optimal wavelength, Þ rmness, chilling injury.
INTRODUCTION
Apple susceptibility to defects is affected by the nature of the apple variety, the growing conditions, the cultural methods, and the harvesting, postharvest, handling and storage conditions. External defects are usually easy to detect visually, especially when they present some contrast with normal tissues. Chilling injury is a physiological damage to fruit cell membranes that may occur at any time owing to harmful environmental conditions during
the growing season, transportation, distribution or storage, at the retail store, or even in a home refrigerator. The membrane damage is often followed by a cascade of secondary effects, such as an increase in ethylene production, an increase in respiration, a decrease in photosynthesis, and an alteration of cellular structure causing the fruits to be more susceptible to diseases. Early detection and diagnosis of chilling injury is rather difÞ cult, as the injured produce often looks sound as long as it remains in low temperatures. Symptoms become evident when the produce is placed in warmer temperatures. Symptoms may appear almost immediately, or they may take several days to develop (Skog 1998).
Increased demands for objectivity, consistency and efÞ ciency in defect detection techniques have necessitated the introduction of computer-based techniques that can be reasonable substitutes for human inspection. The ideal method for detecting injured fruits should be rapid, precise, reliable and non-destructive. The hyperspectral imaging technique integrates spectroscopy and digital imaging techniques to provide spectral and spatial information
Hyperspectral imaging for chilling injury detection in Red Delicious applesPart 1: Establishment of a hyperspectral imaging system
GAMAL ELMASRY1, NING WANG2 , CLEMENT VIGNEAULT31Agricultural Engineering Department, Faculty of Agriculture, Suez Canal University, Ismailia, Egypt2Department of Biosystems and Agricultural Engineering, Stillwater, Oklahoma, USA3Horticulture Research and Development Centre, Agriculture and Agri-Food Canada, Quebec, Canada

74 G. Elmasry, N. Wang, C. Vigneault
simultaneously for the surface of interest on a target object. A hyperspectral image consists of a series of sub-images, each one representing the intensity distribution at a certain spectral band. This technique has been implemented in several applications, such as the inspection of poultry carcasses (Chao et al. 2001; Park et al. 2004), defect detection and quality determination in fruits and vegetables (Li et al. 2002; Cheng et al. 2004; Liu et al. 2006), and the estimation of physical, chemical and mechanical properties in various commodities (Park et al. 2003; Lu 2004; Nagata et al. 2005).
The ultimate objective of this research was to establish sufÞ ciently robust models for the detection of chilling injury in apple using the tools of hyperspectral imaging and ANN. The speciÞ c objectives for this paper were to: a) establish a hyperspectral imaging platform for apple chilling injury; (b) to develop strategies on image acquisition and preprocessing; (c) to explore spectral signatures for normal and chilling-injured apples; and (d) to evaluate color of apple samples.
MATERIALS AND METHODS
Apple samples
Apple fruits of the Red Delicious variety were purchased from local retail stores. A total of 64 fruits free from any abnormal features such as defects, bruises, diseases and contamination were selected. Chilling injury was stimulated in 32 fruits by keeping them in a cold storage at –1°C for 24 hours. The injured fruits were removed from the cold storage and kept at room temperature (20 ±1°C)
for another 24 hours to allow injury development. The other 32 fruits were stored at room temperature (20 ±1°C) and used as control (normal) samples. The external surface of the injured fruits looked normal visually in terms of color and texture.
Hyperspectral imaging system
Hyperspectral images of the apples (normal and injured) were acquired using a lab-scale hyperspectral imaging system (Fig. 1) that consisted of a charge-coupled device (CCD) camera (PCO-1600, PCO Imaging, Germany) connected to a spectrograph (ImSpector V10E, Optikon Co., Canada) coupled with a standard C-mount zoom lens. The sensitivity of this optic assembly was within the spectral range of 400 to 1000 nm. The camera faced downward at a distance of 400 mm from the target. The sample was illuminated through a cubic tent made of white nylon fabric to provide uniform lighting conditions. The light source consisted of two 50 W halogen lamps mounted at a 45° angle from the horizontal line, Þ xed at 500 mm above
FIGURE 1. The hyperspectral imaging system: a) a CCD camera, b) a spectrograph with a stan-dard C-mount zoom lens, c) an illumination unit, d) a light tent and e) a PC supported with the ima-ge acquisition software

Hyperspectral imaging for chilling injury detection... 75
the sample and spaced 900 mm apart on two opposite sides of the sample. The sample position corresponded with the center of the Þ eld of view of the camera.
The spectral images were collected in a dark room where only the halogen light source was used. The exposure time was adjusted to 200 ms throughout the test. Each spectral image collected was stored as a three-dimensional image (x, y, (). The spatial components (x, y) included 400 × 400 pixels, and the spectral component (() included 826 bands within 400 to 1000 nm. The hyperspectral imaging system was controlled by a laptop Pentium M computer (processor speed: 2.0 GHz; RAM: 2.0 GB) preloaded and conÞ gured with the Hypervisual Image Analyzer® software program (ProVision Technologies, Stennis Space Center, Mo., USA). All the spectral images acquired were processed and analyzed using the Environment for Visualizing Images software program (ENVI 4.2, Research Systems Inc., Boulder, Co., USA).
The hyperspectral images were calibrated with a white reference and a dark reference. The dark reference was used to remove the dark current effect of the CCD detectors, which are thermally sensitive. The calibrated image (R) was then deÞ ned using Equation (1):
RR D
W D
o=−−
×100
(1)
where Ro is the acquired hyperspectral image, D is the dark image (with 0% reß ectance) collected by turning off the light source by means of completely closing the lens of the camera, and W is the white reference image taken from a standard white reference board (Teß on
white board with 99% reß ectance). The calibrated images were used to extract information about the spectral properties of normal and injured fruits with a view to optimizing the identiÞ cation of chilling injury, the selection of effective wavelengths, the prediction of Þ rmness, and classiÞ cation.
Extraction of fruit spectral properties
The spectral characteristics of an apple describe its response to incident radiation. When an apple is subjected to visible and infrared radiation, 80% of the radiation is reß ected from the external surface of the fruit, and 20% penetrates inside the apple; of that, 1% is re-emitted. The reß ected and re-emitted radiation can be measured and recorded as an absorption/reß ectance spectrum (Bochereau et al. 1992). This spectrum is relevant to the chemical composition of the apple, and spectra collected from apples at different quality levels can therefore be quite different.
The Þ rst step in detecting chilling injury is to extract the spectral signatures representing chilling-injured fruits and those representing normal fruits. The detailed steps in extracting the spectral signature are illustrated in Figure 2. The image at 550 nm with the best contrast between the apple and background was selected from the spectral space and segmented to act as a mask to exclude background pixels. The white pixels in the mask were used as an area of interest (AOI) to extract the spectral data from the calibrated hyperspectral image. The mean reß ectance spectrum from the AOI of each hyperspectral image was calculated by averaging the spectral value of all pixels in the AOI. In total,

76 G. Elmasry, N. Wang, C. Vigneault
64 average spectra (400–1000 nm) representing the 64 tested fruits were calculated and stored for selection of the wavelength and development of the ANN model.
Fruit color measurement
To demonstrate the visual changes that occurred during the chilling injury development process, fruit color was measured for both the external peel and the internal ß esh. The color image was constructed for each fruit by combining the red (650 nm), green (500 nm) and blue (450 nm) band images from the calibrated hyperspectral data space to form an RGB (red-green-blue) image. All the RGB images were transformed into the L*a*b* format, where L* stands for color lightness (0 indicates black and 100 indicates white), a* deÞ nes the position between green and red (0 indicates green and 255 indicates red), and b* indicates the position between blue and yellow (0 indicates blue and 255 indicates yellow). The RGB values were transformed into a* and b* color components in order to
produce a better identiÞ cation of color changes according to Vízhányó and Felföldi (2000). The color conversion process was conducted by means of a program written using MATLAB 7 (Release 14, The MathWorks Inc., Mass., USA).
RESULTS AND DISCUSSIONS
Spectral characteristics
Figure 3a shows the average spectral signature of both normal and injured fruits obtained from the apple surfaces. There were no signiÞ cant differences between the normal and the injured fruits in the visible range (400–700 nm), indicating that it was impossible to detect injured fruits using the traditional machine vision systems that utilize gray-scale or color cameras. However, the distinction between normal and injured fruits was obvious in the near-infrared region (700–1000 nm) owing to chemical changes that occur during chilling injury development. The internal spectral responses of the fruit ß esh
FIGURE 2. Extraction of the fruit spectral signature: a) selecting 550 nm image, b) binarization (deÞ n-ing the AOI), c) applying the mask, d) calculating the fruit spectral signature using only those at the white pixels in the mask

Hyperspectral imaging for chilling injury detection... 77
that were obtained after removal of the peel are also illustrated (Fig. 3b). The difference between the ß esh responses of both classes was clear, especially in the visible range, owing to the browning effect of chilling injury development.
Color differences
The color differences between normal and injured fruits for the external surface as well as for the internal ß esh are shown in Table 1. The external surface (fruit peel) exhibited the same appearance for
both normal and injured fruits, because there were no signiÞ cant differences between the two classes for all color parameters (R, G, B, L*, a*, and b*). The results presented in Table 1 are in agreement with the spectral signatures
of the fruits in the visible range shown in Figure 6a. However, there was a signiÞ cant difference between the ß esh of the normal fruits and the ß esh of the injured fruits in all color parameters. If parameter a* is considered to be an
0
20
40
60
80
100
400 500 600 700 800 900 1000
Wavelength, nm
Rela
tive reflecta
nce, % Normal
Injured
0
20
40
60
80
100
400 500 600 700 800 900 1000
Wavelength, nm
Rela
tive reflecta
nce, % Normal
Injured
FIGURE 3. Spectral characteristics of normal and injured apples for a) the external surface and b) the internal ß esh
a b
TABLE 1. Means and standard deviations (SD) of color characteristics and of normal and chilling--injured fruits for surface and ß esh
External surface Internal ß esh
NormalMean ± SD
InjuredMean ± SD
NormalMean ± SD
InjuredMean ± SD
R1 0.626 ± 0.045a 0.616 ± 0.037a 0.814 ± 0.021a 0.735 ± 0.050b
G1 0.187 ± 0.024a 0.198 ± 0.019a 0.557 ± 0.023a 0.395 ± 0.065b
B1 0.187 ± 0.022a 0.186 ± 0.020a 0.218 ± 0.026a 0.118 ± 0.035b
L* 51.740 ± 8.57a 52.460 ± 8.09a 164.88 ± 4.50a 132.75 ± 14.61b
A* 156.86 ± 6.61a 155.93 ± 5.54a 148.13 ± 2.98a 159.76 ± 5.19b
B* 144.64 ± 4.82a 144.77 ± 4.40a 182.21 ± 1.43a 180.13 ± 3.12b
Values with same superscript letters within each row are not signiÞ cantly different, ) = 0.05.
rR
R G Bg
G
R G Bb
B
R G B=
+ +=
+ +=
+ +; ;

78 G. Elmasry, N. Wang, C. Vigneault
indicator of browning (0 indicates green while 255 indicates red), the effect of the chilling injury in terms of ß esh browning can be evaluated. The a* value of normal ß esh was 148.13 ± 2.98, a value that signiÞ cantly differed from that of the injured ß esh (159.76 ± 5.19). The higher a* value of injured fruits indicates browning of the ß esh compared with the ß esh of the normal fruits. Based on the spectral and color characteristics of normal and injured fruits, it could be inferred that distinguishing injured fruits from sound ones by means of visual methods is rather difÞ cult.
CONCLUSIONS
A hyperspectral imaging system with a spectral range of 400–1000 nm was established for the detection of chilling injury in Red Delicious apple. The apple images were preprocessed, and the spectral data was extracted. The difference between the ß esh responses of both classes was clear, especially in the visible range, owing to the browning effect of chilling injury development. There was no signiÞ cant difference between normal and injured fruits in terms of all color parameters (R, G, B, L*, a*, and b*).
REFERENCES
BOCHEREAU L., BOURGINE P., PALAGOS B. 1992: A method for prediction by combining data analysis and neural networks: Application to prediction of apple quality using near infra-red spectra. Agricultural Engineering Research. 51(2), 207–216.
CHAO K., CHEN Y.R., HRUSCHKA W.R., PARK B. 2001: Chicken heart disease characterization by multi-spectral imaging. Transactions of ASAE. 17(1), 99–106.
CHENG X., CHEN Y.R., TAO Y., WANG C.Y., KIM M.S., LEFCOURT A.M. 2004: A novel integrated PCA and FLD method on hyperspectral image feature extraction for cucumber chilling damage inspection. Transactions of ASAE. 47(4), 1313*1320.
LI Q., WANG M., GU W. 2002: Computer vision based system for apple surface defect detection. Computers and Electronics in Agriculture. 36(2002), 215–223.
LIU Y., CHEN Y.R., WANG C.Y., CHAN D.E., KIM M.S. 2006: Development of hyperspectral imaging technique for the detection of chilling injury in cucumbers; spectral and image analysis. Applied Engineering in Agriculture. 22(1), 101–111.
LU R. 2004: Multispectral imaging for predicting Þ rmness and soluble solids content of apple fruit. Postharvest Biology and Technology. 31(1), 147–157.
NAGATA M., TALLADA J.G., KOBAYASHI T., TOYODA H. 2005: NIR hyperspectral imaging for measurement of internal quality in strawberries. ASAE Paper No. 053131, ASAE Meeting, Tampa, Fla., USA.
PARK B., ABBOTT J.A., LEE K.J., CHOI C.H., CHOI K.H. 2003: Near-infrared diffuse reß ectance for quantitative and qualitative measurement of soluble solids and Þ rmness of Delicious and Gala apples. Transactions of ASAE. 46(6), 1721–1731.
PARK B., WINDham W.R., Lawrence K.C., Smith D.P. 2004: Hyperspectral image classiÞ cation for fecal and ingesta identiÞ cation by spectral angle mapper. ASAE Paper No. 043032, ASAE/CSAE Meeting, Ottawa, Ont., Canada.
SKOG L.J. 1998: Chilling Injury of Horticultural Crops. Ministry of

Hyperspectral imaging for chilling injury detection... 79
Agriculture, Food and Rural Affairs, Report No. 98-021, Ontario, Canada.
VÍZHÁNYÓ T., FELFÖLDI J. 2000: Enhancing colour differences in images of diseased mushrooms. Computers and Electronics in Agriculture. 26(2), 187–198.
Streszczenie: Nadwidmowy system obrazu dla wykrywania uszkodze# podczas wych adzania w jab kach red delicious. Cz$!% 1: Za o"enia nadwidmowego systemu obrazu. Opracowano nadwidmowy system obrazu w celu uzyskania i wst"pnej obróbki obrazów jab#ek oraz okre&le-nia ich w#a&ciwo&ci widmowych. Kolor owoców mierzono w skórce zewn"trznej, jak i w we-wn"trznym mi !szu. Ró!nice pomi"dzy reakcj mi !szu obydwu klas okre&lono na podstawie ich reakcji widmowych, szczególnie w zakresie wi-dzialnym, dzi"ki efektowi br zowienia w wyniku uszkodze% podczas sch#adzania. Nie stwierdzo-no jednak istotnych ró!nic pomi"dzy zdrowymi i uszkodzonymi owocami w zakresie parametrów barwy (R, G, B, L*, a* i b*).
MS. received June 2008
Authors’ addresses:Gamal ElMasryAgricultural Engineering DepartmentFaculty of AgricultureSuez Canal University,P.O. Box. 41522, Ismailia, Egypte-mail: [email protected]
Ning WangDepartment of Bioresource EngineeringMcGill University21,111 Lakeshore RoadSainte-Anne-deBellevueQuebec H9X 3V9, CanadaDepartment of Biosystems and Agricultural EngineeringStillwater, Oklahoma, 74078 USAe-mail: [email protected]
Clément VigneaultHorticulture Research and Development CentreAgriculture and AgriFood Canada430 Gouin BoulevardSaint-Jean-sur-RichelieuQuebec J3B 3E6, Canadae-mail: [email protected]

Annals of Warsaw University of Life Sciences – SGGWAgriculture No 52 (Agricultural and Forest Engineering) 2008: 81–88(Ann. Warsaw Univ. of Life Sci. – SGGW, Agricult. 52, 2008)
Abstract: Hyperspectral imaging for chilling injury detection in Red Delicious apples. Part 2: Selection of optimal wavelengths for chilling injury detection. Hyperspectral imaging (400––1000 nm) and artiÞ cial neural network techniques were investigated for the detection of chilling injury in Red Delicious apples. Feed-forward back-propagation ANN models were developed to select the optimal wavelength(s), classify the apples and detect Þ rmness changes due to chilling injury. The Þ ve optimal wavelengths selected by ANN were 717, 751, 875, 960 and 980 nm. With the spectral and spatial responses at the selected Þ ve optimal wavelengths, an average classiÞ cation accuracy of 98.44% was achieved for distinguishing between normal and injured fruits. The correlation coefÞ cients between measured and predicted Þ rmness values were 0.93, 0.91 and 0.92 for the training, testing and validation sets, respectively.
Key words: hyperspectral imaging, artiÞ cial neural network (ANN), apple, optimal wavelength, Þ rmness, chilling injury.
INTRODUCTION
Chilling injury is a physiological damage to fruit cell membranes that may occur at any time owing to harmful environmental conditions during the growing season, transportation, distribution or storage, at the retail store, or even in a home refrigerator. However,
early detection and diagnosis of chilling injury is rather difÞ cult, as the injured produce often looks sound as long as it remains in low temperatures. Increased demands for objectivity, consistency and efÞ ciency in defect detection techniques have necessitated the introduction of computer-based techniques that can be reasonable substitutes for human inspection. The hyperspectral imaging technique integrates spectroscopy and digital imaging techniques to provide spectral and spatial information simultaneously for the surface of interest on a target object. This technique has been implemented in defect detection and quality determination in fruits and vegetables (Kim et al. 2002; Polder et al. 2002), and the estimation of physical, chemical and mechanical properties in various commodities (Lu 2004). ArtiÞ cial neural network (ANN) models are developed to simulate the organizational principles of the human brain and nervous system. An ANN consists of a large number of computing elements (called nodes) that are linked together. The overall performance of an ANN is determined by the structure and the strength of the connections (Brons et al. 1993). ANNs have an advantage
Hyperspectral imaging for chilling injury detection in Red Delicious applesPart 2: Selection of optimal wavelengths for chilling injury detection
GAMAL ELMASRY1, NING WANG2 , CLEMENT VIGNEAULT31Agricultural Engineering Department, Faculty of Agriculture, Suez Canal University, Ismailia, Egypt2Department of Biosystems and Agricultural Engineering, Stillwater, Oklahoma, USA3Horticulture Research and Development Centre, Agriculture and Agri-Food Canada, Quebec, Canada

82 G. Elmasry, N. Wang, C. Vigneault
in solving problems in which some inputs and corresponding output values are known but the relationship between the inputs and outputs is not well understood or is difÞ cult to translate into a mathematical function. Despite mathematical differences, ANNs have proven to be stronger than statistical classiÞ ers in the identiÞ cation and classiÞ cation of agricultural produce (Jayas 2000), where non-coherence or non-linearity often exists. Kavdýr and Guyer (2004) developed a back-propagation neural network (BPNN) with the texture features extracted from spatial distribution of color/gray levels to detect defects (leaf roller, bitter pit, russet, puncture and bruises) in Empire and Golden Delicious apples.
The ultimate objective of this study was to establish sufÞ ciently robust models for the detection of chilling injury in apple using the tools of hyperspectral imaging and ANN. The speciÞ c objectives were: a) to establish an ANN model for the selection of the optimal wavelength(s) for identifying normal apples against injured apples; c) to develop ANNs for monitoring Þ rmness changes in apples based on spectral images at the selected optimal wavelength(s); and d) to develop ANNs for fruit classiÞ cation according to Þ rmness levels.
MATERIALS AND METHODS
Apple images
Apple images were collected through the procedures described in ElMasry, et al. 2007a. Images from all 64 fruits (normal and injured) were used to train and test an ANN for the selection of the
optimal wavelength(s). To increase the robustness of the ANN models, another 20 Red Delicious apples were purchased in order to validate the ANN models and algorithms that were developed. In 10 of those apples, chilling injuries were stimulated using the previously described procedures. The other 10 fruits were kept at room temperature and used as normal fruits.
Firmness measurement
After spectral image acquisition, the Þ rmness of each fruit was measured with an Instron Universal Testing Machine (Model 4502, Series IX Automated Ma-terials Testing System, Instron Corpora-tion, Mass., USA) using an 11 mm di-ameter plunger according to the standard method (ASAE, 1994). After removal of the fruit peel, the plunger was pressed into the fruit ß esh to a depth of 9 mm at a speed of 50 mm/min. The maximum force extracted from the force-deforma-tion curve was used to indicate the fruit Þ rmness. The Þ rmness test was conduct-ed at two opposite positions on the equa-tor of the fruit surface and subsequently averaged. The average maximum force was used as the Þ rmness index of the fruit.
Data volume reduction and optimal
wavelength selection
The major disadvantage of the hyperspectral imaging technique is that handling the huge amount of data extracted from hyperspectral images requires extra time and resources. It is imperative that efÞ cient manipulation procedures be used to reduce data dimensionality to its lowest level without losing functionality. In this study, instead of the entire image

Hyperspectral imaging for chilling injury detection... 83
volume (400 × 400 × 826) being used, a reduced data cube with dimensions of 400 × 400 × n, where n is the number of selected optimal wavelengths, was formed. The success of a classiÞ cation algorithm based on the reduced data cube depends on the quality of the selection of the optimal wavelengths at which the spectral signatures can best describe each class. Although several wavelength selection techniques have been derived by researchers (e.g. Liu et al. 2003; Mehl et al. 2004; Chong and Jun 2005), the choice of a particular method depends on the nature of the problem, the size of the data set, ease of implementation and economic feasibility. In this study, an ANN was used for data volume reduction and wavelength selection on the basis of the fact that the network can change and adjust its knowledge by adjusting its weights according to the presented samples of data.
ANN Model 1 for selection
of wavelength(s)
A multilayer BPNN, ANN Model 1, was developed to differentiate injured apples from normal ones. Back-propagation is the canonical feed-forward network in which an error signal is fed back through the network, altering weights as it goes; back-propagation is therefore a numerically intensive technique.
Weights between the simple processing units of nodes were adjusted by iterating input patterns throughout the network until the error between the network output and the targeted output was minimized. ANN Model 1 consisted of three layers: an input layer, an output layer and a hidden layer. The input layer had 826 nodes representing the spectral
responses of a fruit at each of the 826 wavelengths. Owing to the large volume of data, only one hidden layer with Þ ve nodes was used. The number of nodes on the output layer was determined predominantly by the number of classes under investigation. Thus, two nodes were used: normal fruits (coded as 1) and injured fruits (coded as 0). A sigmoid function was used as a transfer function between the input and hidden layers, and a linear transfer function was used between the hidden and output layers. The network was trained for at least 20.000 epochs or until the error measurement approached 0.01%. Among the 64 tested fruits, 42 fruits (both normal and injured) were randomly chosen as a training set to train the ANN model. The other 22 fruits (both normal and injured) were used as a testing set to test the model. This procedure was run three times on the same 64 fruits; each time, 42 different fruits were randomly selected for training, and the rest were used for testing. The outcomes of the three replications were averaged to calculate the importance of each variable.
The importance of each variable (wavelength) for the ANN model was evaluated using an index calculated by Equation (1):
M
Ip
Ip j k
Oj
Ip
Ipi j k
jk
np
j
nH
i j
=
==
∑∑ /,
/, ,,
11
kk
np
j
nH
i
np
Oj
===∑∑∑
111
(1)
where M is the importance measure for the input variable, np is the number of

84 G. Elmasry, N. Wang, C. Vigneault
input variables (826), nH is the number of hidden layer nodes (5 nodes), 219 I pj is the absolute value of the hidden layer weight corresponding to the pth input variable and the jth hidden layer, and O is the absolute value of the output layer weight corresponding to the jth hidden layer.
Each input variable had Þ ve weight values corresponding to the Þ ve nodes in the hidden layer of the ANN. The index M value was calculated for each input node and then normalized in the 0 to 1 range. The higher the M value, the more important the node (variable/wavelength) for the classiÞ cation of injured and normal fruits.
ANN Model 2 for Þ rmness prediction
Based on the number of wavelengths selected by ANN Model 1, a new feed-forward BPNN, ANN Model 2, was established to predict the Þ rmness of the fruits. The input layer consisted of the reß ectance features at the selected optimal wavelengths. The hidden layer contained three nodes. The output layer contained only one node to represent the fruit Þ rmness value. Sigmoid and linear functions were used as transfer functions, and over-Þ tting was avoided by using Bayesian regularization training algorithm. The model was trained using 42 randomly selected fruits and tested with the remaining 22 fruits. The maximum number of iterations in training was set to 5.000.
ANN Model 3 for classiÞ cation of
apples
ANN Model 3 was a revised version of ANN Model 2. The spectral responses at the Þ ve optimal wavelengths were used
as input nodes. The output layer was modiÞ ed to have two nodes: normal and injured classes. The network was trained using 42 randomly selected fruits and tested with the remaining 22 fruits, with each group containing both normal and injured fruits. The maximum number of iterations in training was set to 5.000.
The detailed procedures for detecting chilling injury and Þ rmness changes in apple fruits are illustrated in Figure 1.
Test for robustness of the ANN
models
The capability of the three ANN models for optimal wavelength selection, Þ rmness prediction and classiÞ cation was validated with a group of 20 fruits purchased at a later stage in the experiment and called the validation set. Chilling injury was stimulated in 10 fruits using the same method described previously. The same procedures were used for hyperspectral image acquisition, image preprocessing and Þ rmness measurement. Model robustness was evaluated by comparing the correlation coefÞ cients between the predicted and the actual Þ rmness and among the classiÞ cation accuracies obtained from the training, testing and validation sets.
RESULTS AND DISCUSSIONS
Optimal wavelength selection
ANN Model 1 used the entire spectral range (826 wavelengths) in the range of 400 to 1000 nm to generate great performance for detecting chilling injury effect, with 100% classiÞ cation success for both the training and the testing samples. Figure 2 presents the results

Hyperspectral imaging for chilling injury detection... 85
obtained, along with the highest M values. The wavelengths corresponding to the highest M values, 717, 751, 875, 960 and 980 nm, were chosen as the optimal wavelengths.
Firmness prediction
Figure 3a shows the performance of ANN Model 2 in Þ rmness prediction for the training (42 fruits) and the testing (22 fruits) sets. The correlation coefÞ cient
FIGURE 1. Flowchart of the key steps involved in chilling injury detection algorithm
FIGURE 2. The importance measure (M) values used to select the optimal wavelengths

86 G. Elmasry, N. Wang, C. Vigneault
between measured and predicted Þ rmness values was 0.93 and 0.91 for the training and testing sets, respectively. The root mean square error (RMSE) was 8.26 and 9.4 N for the training and testing sets, respectively. Because of the high correlation coefÞ cient of ANN Model 2 for Þ rmness prediction, this model can be applied to the detection of Þ rmness change due to chilling injury effect. Table 2 shows the confusion matrix for the classiÞ cation of the 64 fruits (training + testing) into normal and injured classes. A high classiÞ cation accuracy of 98.44% was obtained with ANN Model 3.
Model robustness
Figure 3b shows the fruit Þ rmness predicted by ANN Model 2 for the validation set. The correlation coefÞ cient between the actual and predicted Þ rmness for the validation set was 0.92 with an RMSE value of 10.09 N. For classiÞ cation, ANN Model 3 achieved 100% success for categorization of the validation set into the two classes (normal and injured). Both results are therefore in agreement with the training and testing sets, indicating the robustness of the models for classiÞ cation and Þ rmness
prediction of normal and injured Red Delicious apple fruits.
CONCLUSIONS
A hyperspectral imaging system with a spectral range of 400–1000 nm was established for the detection of chilling injury in Red Delicious apple. The apple images were preprocessed, and the spectral data was extracted. There was no signiÞ cant difference between normal and injured fruits in terms of all color parameters (R, G, B, L*, a*, and b*). ArtiÞ cial neural network (ANN) models were developed for optimal wavelength selection, fruit classiÞ cation and Þ rmness prediction. Five optimal wavelengths (717, 751, 875, 960 and 980 nm) were selected based on the maximum weight assigned to the input nodes in ANN Model 1. The ANN models were trained, tested and validated with different fruit sets to evaluate the robustness of the models. With the selected optimal wavelengths instead of the whole spectral range (826 wavelengths), the correlation coefÞ cients between the actual and predicted Þ rmness obtained using ANN Model 2 were 0.93,
FIGURE 3. Apple Þ rmness prediction by neural network for: a) the training and testing sets and b) the validation set
a b

Hyperspectral imaging for chilling injury detection... 87
0.91 and 0.92 for the training, testing and validation sets, respectively. ANN Model 3 achieved an accuracy of 98.44% and 100% in distinguishing normal from injured fruits for the training + testing set and the validation set, respectively.
In summary, the experimental results demonstrate that the spectral imaging system associated with ANN can successfully distinguish between chilling-injured fruits and normal fruits, as well as detect Þ rmness changes. Considering the importance of the data volume reduction obtained, spectral imaging systems using the selected wavelengths open a new avenue for more optimistic applications in commercial implementations for detecting various quality disorders in different types of produce.
REFERENCES
ASAE, 1994: Compression test of food materials of convex shape. ASAE Standards. ASAE, St. Joseph, Mich., USA. ASAE S368.2. p. 472–475.
BRONS A., RABATEL G., ROS F., SÉVILA F., TOUZET C. 1993: Plant grading by vision using neural networks and statistics. Computers and Electronics in Agriculture. 9(1), 25–39.
CHONG L.G., JUN C.H. 2005: Performance of some variable selection methods when multicollinearity is present. Chemometrics and Intelligent Laboratory Systems. 78(1), 103–112.
HAHN F., LOPEZ I., HERNANDEZ G. 2004: Spectral detection and neural
network discrimination of Rhizopus stolonifer spores on red tomatoes. Biosystems Engineering. 89(1), 93–99.
JAYAS D.S., PALIWAL J., VISEN N.S. 2000: Multi-layer neural networks for image analysis of agricultural products. Agricultural Engineering Research. 77(2), 119–128.
KAVDÝR Ý., GUYER D.E., 2004: Comparison of artiÞ cial neural networks and statistical classiÞ ers in apple sorting using textural features. Biosystems Engineering. 89(3), 331–344.
KIM J., MOWAT A., POOLE P., KASABOV N. 2000: Linear and non-linear pattern recognition models for classiÞ cation of fruit from visible–near infrared spectra. Chemometrics and Intelligent Laboratory Systems. 51, 201–216.
LIU Y., WINDHAM W.R., LAWRENCE K.C., PARK B. 2003: Simple algorithms for the classiÞ cation of visible/near-infrared and hyperspectral imaging spectra of chicken skins, feces, and fecal contaminated skins. Applied Spectroscopy. 57(12), 1609–1612.
LU R. 2004: Multispectral imaging for predicting Þ rmness and soluble solids content of apple fruit. Postharvest Biology and Technology. 31(1), 147–157.
MEHL P.M., CHEN Y.R., KIM M.S., CHAN D.E. 2004: Development of hyperspectral imaging technique for the detection of apple surface defects and contaminations. Journal of Food Engineering. 61(1), 67–81.
NAGATA M., TALLADA J.G., KOBA-YASHI T., TOYODA H. 2005: NIR hy-perspectral imaging for measurement of internal quality in strawberries. ASAE Pa-
TABLE 2. Confusion matrix for fruit classiÞ cation using ANN Model 3
From/to Normal Injured Total % correct
Normal 32 0 32 100
Injured 1 31 32 96.88
Total 33 31 64 98.44

88 G. Elmasry, N. Wang, C. Vigneault
per No. 053131, ASAE Meeting, Tampa, Fla., USA.
POLDER G., VAN DER HEIJDEN G.W.A.M. YOUNG, I.T. 2002: Spectral image analysis for measuring ripeness of tomatoes. Transactions of ASAE. 45(4), 1155–1161.
Streszczenie: Nadwidmowy system obrazu dla wykrywania uszkodze# podczas wych adzania w jab kach Red Delicious. Cz$!% 2: Wybór opty-malnych d ugo!ci fal dla wykrywania uszkodze# podczas wych adzania. Przeprowadzono badania nadwidmowych obrazów (400–1000 nm) i tech-nik sztucznej sieci neuronowej przy wykrywaniu uszkodze% jab#ek odmiany Red Delicious w wy-niku wych#adzania. Opracowano modele ANN ze sprz"!eniem do przodu i wsteczn propagacj w celu wybrania optymalnej d#ugo&ci fali (fal), klasyÞ kacji jab#ek i okre&lenia zmian j"drno&ci w wyniku uszkodze% podczas wych#adzania. Za pomoc modeli ANN wybrano 5 optymalnych d#ugo&ci fal: 717, 751, 875, 960 i 980 nm. Na pod-stawie widmowych i przestrzennych reakcji przy wybranych pi"ciu optymalnych d#ugo&ciach fal, podczas odró!niania zdrowych i uszkodzonych owoców uzyskano &redni dok#adno&' klasyÞ ka-cji wynosz c 98,44%. Warto&ci wspó#czynników korelacji pomi"dzy zmierzon i prognozowan
j"drno&ci dla poszczególnych zestawów: ucze-nia, testowania i atestacji wynosi#y odpowiednio: 0,93; 0,91; i 0,92.
MS. received June 2008
Authors’ addresses:Gamal ElMasryAgricultural Engineering DepartmentFaculty of AgricultureSuez Canal University,P.O. Box. 41522, Ismailia, Egypte-mail: [email protected]
Ning WangDepartment of Bioresource EngineeringMcGill University21,111 Lakeshore RoadSainte-Anne-deBellevueQuebec H9X 3V9, CanadaDepartment of Biosystems and Agricultural EngineeringStillwater, Oklahoma, 74078 USAe-mail: [email protected]
Clément VigneaultHorticulture Research and Development CentreAgriculture and AgriFood Canada430 Gouin BoulevardSaint-Jean-sur-RichelieuQuebec J3B 3E6, Canadae-mail: [email protected]

Annals of Warsaw University of Life Sciences – SGGWAgriculture No 52 (Agricultural and Forest Engineering) 2008: 89–93(Ann. Warsaw Univ. of Life Sci. – SGGW, Agricult. 52, 2008)
Abstract: Experimental verifying of mathematic model for biomass combustion. Among all alternative energy sources Czech Republic has the biggest potential in biomass. If we want use it effectively it is need to fulÞ l all requirements of this fuel. Created model describes combustion process from the point of view of imperfect burning and it is based on elementary analyse of fuel. This model was compared with results from experimental combustion. Difference between model and reality is in the maximum 5%, while this is valid for samples with worse burning stability. On the opposite, samples with good stability show smaller deviation, ranging 1–2 %.
Key words: biomass, combustion, emission, calculation model.
INTRODUCTION
SigniÞ cant marker for evaluation and optimisation of biomass combustion is an amount and composition of ß ue gases. It depends partly on burner construction and partly on fuel composition. Burning process calculation models stemming from fuel elementary analysis are important for solving many problems in burner designing and controlling combustion process. It is possible to create calculation model by two ways:
with help of stechiometric equa-tions and dates from elementary analysis,
1)
with help of approximate equations based on fuel heat value.
In case of heterogenous fuels combustion only the Þ rst mentioned possibility could be taken into account. Outcomes of this model are total air amount, generated ß ue gases amount and its composition for 1 kg of burned fuel. Model takes into account perfect and imperfect burning.
Calculation model
An essence of the model is to describe combustion process of any solid fuel based on its elementary analysis considering perfect and imperfect burning. It is possible to compare dates from model with dates from experiment to see how the model reß ects the reality. Some substantial equations are in following.
Flue gas composition for perfect burning is:
V C Vvv mCO2= ⋅ + ⋅ ⋅
22 27
12 010 003
.
.. min λ
[m3·kg–1] (1)
V SSO2
21 89
32 06= ⋅
.
.
[m3·kg–1] (2)
2)
Experimental verifying of mathematic model for biomass combustion
MARTIN POLÁK1), PAVEL NEUBERGER1), JI+Í SOU,EK2)1Department of Mechanics and Engineering, Technical Faculty, Czech University of Life Science in Prague, Czech Republic2Research Institute of Agricultural Engineering, Prague, Czech Republic

90 M. Polák, P. Neuberger, J. Sou&ek
V H W
Vvs m
H O2= ⋅ + ⋅ +
+ −( ) ⋅ ⋅
44 81
4 03
22 41
18 02
1 04 1
.
.
.
.
. min λ
[m3·kg–1] (3)
[m3·kg–1] (4)
V mO O2 2= ⋅min λ
[m3·kg–1] (5)
where Vv min is minimal volume of air, m is coefÞ cient of excess of air.
In the case of imperfect burning part of carbon burns to CO and part remains unburned. The part, which is burnt to CO:
aV
C=⋅
⋅ ⋅CO
1 10
12 01
22 376
.
.
[–]
(6)
where VCO is CO concentration in ß ue gases [mg·m–3].
The part, which is unburnt:
bV
Cav= ⋅ −
∆ min
.8 81 2
[–] (7)
Then, the real concentrations of particular emission are:
CO [%]CO
22 100sksk
sv sk
V
V= ⋅
(8)
N [%]N
22 100sksk
sv sk
V
V= ⋅
SO [%]SO
22 100sksk
sv sk
V
V= ⋅
O [%]O
22 100sksk
sv sk
V
V= ⋅
H O [%]2H O2
sksk
sv sk
V
V= ⋅100
MATERIAL AND METHODS
Measuring of burning characteristics of given samples were done during the experiment. Concentration of each fuel gases component was monitored by gas analyzer TESTO 350XL (Fig. 1) with ranges: CO (0–400 000) ppm; NOx (0–3000) ppm; NO2 (0–500) ppm; O2 (0–25)%;CO2 (0 – 50)% (direct measurement)
Obtained values are deÞ ned as median from measured data during continual measurement of stabile state burner.
V N Vvs mN2
22 40
28 010 7805= ⋅ + ⋅ ⋅
.
.. min λ
FIGURE 1. Analyzer TESTO 350XL

Experimental verifying of mathematic model for biomass combustion 91
Experimental combustion
An experimental combustion was done with boiler VERNER A25 (Fig. 2). VERNER A25 is heat water boiler for pellets which are supplied with screw conveyer through back side of combustion chamber. Plate bottom of chamber is equipped with saw-like grate bar which removes ash in deÞ ned cycles. Side and upper walls are covered with ceramic slabs. Air is forced by fan under the grate as a primary and through side walls as secondary.
Tested fuel
Pellets and chopped straw from mixture of permanent grass hay and other fuels were used as trial fuel. List of fuel samples and its basic characteristics is enclosed in Table 1.
DISCUSSION AND CONCLUSION
The results of calculation model were compared to data obtained during
experiment. Concentration of CO2 in ß ue gasses was used as a comparison value. This component is in majority of emission measurement being calculated afterwards and thus its real amount usually stays a secret. Analyzer TESTO 350XL that we used is equipped with sensor for direct measuring of CO2 and therefore this value could be used in the comparison.
Comparison of separate values, e.g. of model and reality is apparent from Figure 3.
Obtained and calculated values differ in the maximum by 5%, while this is valid for samples with worse burning stability. On the opposite, samples with good stability show smaller deviation, ranging 1–2%. Calculation model with such a deviation is thus well suitable for approximate burning calculation. But for exact determination of separate items if would be probably necessary to adjust the calculation – apparently with regard to unburned fuel part.
FIGURE 2. Hot water boiler VERNER A25

92 M. Polák, P. Neuberger, J. Sou&ek
TABLE 1. Fuel sample and its elementar analysis
Fuel sampleW
ater
Vol
atil
e co
mbu
stib
le
Non
-vol
atil
e co
mbu
stib
le
Ash
Tota
l fue
l hea
t
Hea
ting
val
ue
C H N S O Cl
[%] [%] [%] [%][MJ//kg]
[MJ//kg]
[%] [%] [%] [%] [%] [%]
hay + 10% coal,pellets 15 mm
8.7 66.8 18.5 5.9 17.7 16.1 44.3 6.4 1.1 0.1 33.1 0.3
hay + bark (1:3),chopped
8.3 68.3 19.6 3.8 17.5 16.1 43.5 5.4 0.4 0.1 38.6 0.1
hay + populus (1:1) + + 20% coal, pellets 15 mm
9.4 65.9 18.4 6.3 18.3 16.8 47.4 5.8 0.9 0.2 29.9 0.2
hay + populus (1:3), chopped
6.5 74.0 15.1 4.3 18.0 16.6 46.1 5.8 0.7 0.1 36.5 0.1
hay + sorrel (1:3), chopped
7.3 69.8 17.5 5.4 16.9 15.4 43.6 6.1 0.6 0.1 36.7 0.1
FIGURE 3. Comparison of model and reality
hay + 10%
coal, pellets
15 mm
hay + bark
(1:3) –
chopped
hay +
populus
(1:1) + 20%
coal, pellets
15 mm
hay +
populus
(1:3) –
chopped
hay + sorrel
(1:3) –
chopped

Experimental verifying of mathematic model for biomass combustion 93
This article was created within the scope of project of National Agency of Agriculture Research No QF4079: “Logistic of bioenergy material”
REFERENCES
PASTOREK Z.; KÁRA, J.; JEVI, P. 2004: Biomasa – obnovitelný zdroj energie. FCC PUBLIC Prague, Prague, 288.
JEVI, P.; ŠEDIVÁ Z.; SLADKÝ V. 1998: Emise p-i energetickém využití biomasy, Energie l/98, Prague.
POLÁK M. 2005: Biomass for heat production. Ph.D. thesis, CUA Prague, 113 p.
POLÁK M.: Fytomass as a fuel for small scale boilers. In: Naukovyj visnik NAU 73/2004. Kyiiv 2004, p. 246–252.
POLÁK M. 2004: The practical experience with fytomass combustion in small scale boilers. In: Collection of abstracts of International conference – Science and research – Tools of global development
strategy, CUA in Prague, p. 38.
Streszczenie: Do!wiadczalna weryÞ kacja mode-
lu matematycznego spalania biomasy. Republika
Czeska posiada ze wszystkich .róde# alternatyw-nych najwi"kszy potencja# w biomasie. Je&li ten potencja# chcemy efektywnie wykorzystywa', to nale!y spe#ni' wszystkie wymogi, które to .ró-d#o posiada. Opracowany model opisuje proces spalania na podstawie analizy elementarnej pali-wa przy czym jest zak#adane niedoskona#e czyli realne spalanie. Wyniki z modelu s nast"pnie porównywane z wynikami spalania eksperymen-talnego. Ró!nica mi"dzy modelem i rzeczywisto-&ci wynosi najwy!ej 5%, przy czym ta warto&' odpowiada paliwu z ni!sz stabilno&ci spalania. W stosunku do paliwa z dobr stabilno&ci spala-nia ró!nica nie przekracza 1–2%.
MS. received December 2007
Authors’ addresses:Ing. Martin Polák, Ph.D.Technical FacultyCzech University of Life ScienceKamýcká 129Prague 6 – Suchdol 165 21Czech Republice-mail: [email protected]
Ji-í Sou/ekResearch Institute of Agricultural EngineeringDrnovská 507Praha 6 - 161 01e-mail: [email protected]


Annals of Warsaw University of Life Sciences – SGGWAgriculture No 52 (Agricultural and Forest Engineering) 2008: 95–101(Ann. Warsaw Univ. of Life Sci. – SGGW, Agricult. 52, 2008)
Abstract: Results of veriÞ cation of the slaughter
waste anaerobic fermentation process. The article deals with the analysis of results of veriÞ cation of a one-stage anaerobic digestion at mesophile and thermophile conditions in two series differing in retention time (26 and 37 days). Substrates consisting of various proportions of poultry crushed bones, pork ligaments, and slurry of beef-cattle and pigs (1:1) were used. Stabilized non-drained remainder of an anaerobic digestion was used as inoculum. Results of veriÞ cation showed effectiveness of slaughter waste processing in biogas stations. However, slaughter waste processing requires installation of equipment for a thermal modiÞ cation of the feed-in substrate (warming up to 70°C for the duration of 1 hour).
Key words: anaerobic fermentation, slaughter waste, bio-degradable waste, biogas, biogas stations; retention.
INTRODUCTION
The basic of biogas production in agriculture is processing of waste agricultural products (mainly livestock excrements but also phytomass), other sector of biogas production is biologically degradable municipal waste and biologically degradable industrial waste, particularly from food industry plants. Currently the attention is concentrated on the slaughterhouse waste processing. Processing of that waste in agricultural biogas plants could signiÞ cantly improve their economy.
In the past years, animal by-products as well as slaughterhouse waste and wastewater have not been taken as waste anymore. We have realized that is a feedstock to be treated in order to get its energy potential. With a rising threat of diseases such as bovine spongiform encephalopathy (BSE) in cattle, tighter legislation and an effort to use non-waste technologies with an effective energy gain there has also been raising demand on deeper research activities regarding to this problems.
Anaerobic digestion has become an established and proven technology as a means of managing solid as well as liquid organic waste.
In this chapter, there are quoted some results of research experiments and information regarding to anaerobic digestion of ABP:
The effect of hydraulic retention time (HRT) and loading on anaerobic digestion of poultry slaughter wastes was studied by Salminen and Rintala (2002). The experiment was carried out in semi-continuously fed laboratory-scale digesters at 31oC. The effect on process performance was highly signiÞ cant: Anaerobic digestion appeared feasible with a loading up to 0.8 kg volatile solids (VS)/m3·d and an HRT of 50–100
•
Results of veriÞ cation of the slaughter waste anaerobic fermentation process1JAROSLAV KÁRA, ZDEN0K PASTOREK1, RADOMÍR ADAMOVSKÝ21Research Institute of Agricultural Engineering, Prague, Czech Republic 2Faculty of Engineering, Czech University of Life Sciences, Prague, Czech Republic

96 J. Kára, Z. Pastorek, R. Adamovský
days. The speciÞ c methane yield was high, from 0.52 to 0.55 m3//kg VSadded. On the other hand, at a higher loading, in the range from 1.0 to 2.1 kg VS/ m3·d, and as shorter HRT, in the range from 25 to 13 days, the process appeared inhibited and/or overloaded, as indicated by the accumulation of volatile fatty acids (VFA) and long-chain fatty acids (LCFA) and the decline in the methane yield. However, the inhibition was reversible. The nitrogen in the feed, ca. 7.8% of the total solids (TS), was organic nitrogen with little ammonia present, whereas in the digested material ammonias accounted for 52––67% (up to 3.8 g/l) of total nitrogen. The TS and VS removals amounted to 76% and 64%, respectively. A new generation mathematical model called <METHANE> model was modiÞ ed in order to describe a system dynamics of slaughter waste degradation (Vavilin 2003). Salminen et al. (2000) used this modiÞ ed version for studying of anaerobic batch degradation of solid poultry slaughterhouse wastes.Broughten et al. (1998) studied anaerobic digestion of sheep tallow. The experiment was carried out in batch reactors operating at mesophilic (35ºC) and thermophilic (50ºC) temperatures with sheep tallow at levels up to 59% of the volatile solids. Tallow was rapidly fermented to LCFA and VFA at 35ºC, but was refractory at 50ºC. Oleic acid was fermented to palmitic, stearic and acetic acid. Methanogenesis was delayed by characteristic adaptation periods before LCFA and VFA
•
•
were completely degraded. This demonstrated that wastes with high lipid contents are amenable to stabilization by mesophilic batch digestion. Dohányos et al. (2003) are studying two methods of meat and bone meal (MBM) treatment – pyrolysis and anaerobic digestion and their combination, eventually. The preliminary experiments of anaerobic digestion were carried out with classically produced MBM at 140ºC and MBM pyrolysed at 200ºC
and 285ºC. The biogas yield was determined by batch experiments with digested sludge as inoculum. The results showed very good biodegradability of MBM and MBM pyrolysed at 200ºC, biogas production reached 0.37 l and 0.452 N·m3/kg of TS, respectively. Raizada et al. (2003) observed per-formances of Þ xed and ß uidized bed reactors used for the degradation of organic waste (rumen content) by a two-stage anaerobic digestion pro-cess at different loading rates (2–12 kg COD m–3·d–1) under mesophilic condition. The performance of the Þ xed bed reactor was better in com-parison to the ß uidized bed reactor and as no propionic acid accumula-tion was observed in contrast to the ß uidized bed reactor. Farinet and Forest (2003) mention brief descriptions of two slaughter-house treatment plants based on an-aerobic digestion in Africa. One is lo-cated in Senegal, the other in Egypt. Both have equipment for digestate composting. The authors suppose a rising further development of this
•
•
•

Results of veriÞ cation of the slaughter waste anaerobic fermentation process 97
combined treatment of slaughter-house waste in Africa, mainly because of the high levels of energy price and compost demand.Ashare et al. (1983, in Straka et al. 2003) studied available values of BOD of various types of waste from meat processing industry. They found out that available BOD of this waste have a great potential e.g. for cattle – blood has 2.3 kg BOD/t LWK (live weight killed), intestinal content has 2.5 kg BOD/t LWK; for poultry – 15.3 kg BOD/ t LWK. The speciÞ c methane production gained from this waste is very high due to a high content of fat.
MATERIALS AND METHOD
The tests were carried out on the single-stage anaerobic digestion principle using 5% dry-matter charges under mesophilic and thermophilic conditions in two series differing in retention times (experiments 1 and 2 respectively).
The following materials were the subject of veriÞ cation:
•
poultry bone pulp (39.8% dry matter),pork sinews (15.2% dry matter),cattle and pig slurry mixed in a proportion 1:1,stabilized non-dehydrated residue after anaerobic digestion, used as inoculum.
The poultry pulp and pork sinews were cut up to particles of 12 mm. The slurry and digestate were mixed in a proportion 1:1 in both the charges for the small reactors (0.002 m3) and the large reactors (0.1 m3). The results of veriÞ cation in the small reactors are quoted in this paper. The substrate proportions for each batch are shown in Table 1; Table 2 shows the material compositions of the batches. The retention times, or times of presence of each batch in the reactor, were 26 days and 37 days during Experiments 1 and 2 respectively.
The biogas production in the small reactors was measured using a gas meter constructed at the Agricultural Technology Research Institute in Prague.
Samples of the stabilized residue were tested for the presence of bacteria of
•
••
•
TABLE 1. Substrate proportions in batches, for small reactors
ReactorProportion[% mass]
Poultry bone pulp[% mass]
Pork sinews[% mass]
1a 100 0 0
2a 90 10 0
3a 80 20 0
4a 70 30 0
5a 60 40 0
6a 90 0 10
7a 80 0 20
8a 70 0 30
9a 60 0 40

98 J. Kára, Z. Pastorek, R. Adamovský
the Salmonella and Enterobacteriaceae genera in microbiological analyses at the Microbiology Laboratory of the National Medical Institute in Prague. The microbiologic methods applied comply with the requirements of EC Regulation 1774/2002 (Salminen, Rintala, Lokshina, Vavilin 2000).
RESULTS AND DISCUSSION
This paper only presents in detail the results of observations of biogas production. The biogas production was measured daily; nevertheless, cumulative production related to 1 kg of dry matter is quoted for the sake of clarity. The measurement results are for the small reactors, verifying the concentrations of the additives, the poultry bone pulp, and the pork sinews.
The tested samples contained poultry bone pulp in concentrations of 10%, 20%, 30%, and 40%, and pork sinews in identical concentrations. Figures 1 to 4 show the results of experiments for bone pulp and pork sinews in the mesophilic range. The experimental developments
were very similar to each other, but differed in certain details. The samples were processed in single-stage reactors under mesophilic and thermophilic conditions (the developments under thermophilic conditions are not quoted here as they were very similar, only the retention times were reduced).
The composition of samples containing the bone pulp seems optimal in terms of biogas production and methane content. The highest cumulative biogas production rate was achieved in the sample containing 40% of poultry bone pulp (381.5 litres per kg of dry matter, and 561.0 litres per kg of dry matter, respectively) after 26 days.
The samples containing 10% and 20% of pork sinews showed a satisfactory production of both biogas and methane. The best result was achieved with the sample containing 10% of pork sinews (460.5 liters per kg of dry matter, and 641.4 liters per kg of dry matter, respectively) after 26-day retention. The samples containing 30% and 40% of pork sinews were characterized by low biogas production rates and high methane contents (70–80%). These
TABLE 2. Material composition of charges in small rectors in both experiments
ReactorProportions
[g]Poultry bone pulp
[g]Pork sinews
[g]Water
[g]1a 1250.0 0.0 0.0 750.0
2a 803.6 89.3 0.0 1107.1
3a 555.6 138.8 0.0 1305.6
4a 397.7 170.5 0.0 1431.8
5a 288.5 192.3 0.0 1519.2
6a 1034.5 0.0 114.9 850.6
7a 851.1 0.0 212.7 936.2
8a 693.1 0.0 297.1 1009.8
9a 555.6 0.0 370.3 1074.1

Results of veriÞ cation of the slaughter waste anaerobic fermentation process 99
0
50
100
150
200
250
300
350
400
450
1 2 3 4 5 6 7 8 9 10 11 12 13 14 15 16 17 18 19 20 21 22 23 24 25 26
days
Bio
ga
s p
rod
ucti
on
l.k
g-1
of d
.m.
0% crushed bones 10% crushed bones 20% crushed bones
30% crushed bones 40% crushed bones
Content of poultry crushed bones:
FIGURE 1. Cumulative biogas production, poultry bone pulp, Experiment 1 (Biogas production [litres per kg of dry matter])
0
100
200
300
400
500
600
1 3 5 7 9 11 13 15 17 19 21 23 25 27 29 31 33 35 37
days
Bio
gas p
rod
uctio
n l.k
g-1
of d
.m.
Content of poultry crushed bones:
FIGURE 2. Cumulative biogas production, poultry bone pulp, Experiment 2
0% crushed bones 10% crushed bones 20% crushed bones
30% crushed bones 40% crushed bones

100 J. Kára, Z. Pastorek, R. Adamovský
samples posed considerable difÞ culties in terms of frothing. The large reactors validated the results in the small reactors, only the frothing of the samples was not as marked, and the maximum biogas production occurred ten days earlier in the thermophilic process (Vavilin 2003).
The stabilized residue after anaerobic digestion was analyzed chemically and
microbiologically, and its suitability for soil application was ascertained.
It can be stated that poultry bone pulp and pork sinews are suitable materials for anaerobic digestion provided that the appropriate mass proportions in the fermented mixture are maintained.
0
50
100
150
200
250
300
350
400
1 2 3 4 5 6 7 8 9 10 11 12 13 14 15 16 17 18 19 20 21 22 23 24 25 26
days
Bio
ga
s p
rod
uc
tio
n l.k
g-1
of
d.m
.
0% 10% sinews 20% sinews 30% sinews 40% sinewsContent of pork sinews:
FIGURE 3. Cumulative biogas production, pork sinews, Experiment 1
0
100
200
300
400
500
600
1 3 5 7 9 11 13 15 17 19 21 23 25 27 29 31 33 35 37
days
Bio
ga
s p
rod
uc
tio
n l.k
g-1
of
d.m
.
FIGURE 4. Cumulative biogas production, pork sinews, Experiment 2
0% sinews 10% sinews 20% sinews 30% sinews 40% sinewsContent of pork sinews:

Results of veriÞ cation of the slaughter waste anaerobic fermentation process 101
CONCLUSIONS
It is effective to use slaughterhouse waste in order to increase the efÞ ciency of biogas stations. Stabilized residue after anaerobic digestion was analyzed chemically and microbiologically, and its suitability for soil application was ascertained. However, processing of slaughterhouse waste in a biogas station requires the installation of a unit for thermal treatment of the input substrate, i.e., heating the material to 70°C for one hour.
This paper has been developed as a result of execution of Czech Ministry of Agriculture projects nos. QG 50039: ‘Processing conÞ scated and other waste using the biogas process’, and QD 3160: ‘Research into new technological procedures for improved efÞ ciency of agricultural and food processing waste utilization’.
REFERENCES
BROUGHTEN M.J., THIELE H.J., BIRCH J.E., COHEN A. 1998: Anaerobic batch digestion of sheep tallow. Water Research, Vol. 32, No 5: 1423–1428.
DOHÁNYOS M., ZÁBRANSKÁ J., STRAKA F. 2003: Possibilities of safe treatment and utilization of veterinary sanitation waste. [In:] IWA – Workshop Anaerobic digestion of slaughterhouse wastes. Proceedings, Narbonne
FARINET J.L., FOREST F. 2003: Agro-energetic valorization of slaughterhouse wastes in Africa. [In:] IWA – Workshop Anaerobic digestion of slaughterhouse wastes. Proceedings, Narbonne.
SALMINEN E.A., RINTALA J.A. 2002: Semi-continous anaerobic digestion of
solid poultry slaughterhouse waste: effect of hydraulic retention time and loading. Water Research, Vol. 36: 3175–3182.
SALMINEN E.A., RINTALA J.A., LOK-SHINA L.Y., VAVILIN V.A. 2000: Anaerobic batch degradation of solid poultry slaughterhouse waste. Water Science and Technology, Vol. 41, No 3: 33–41.
STRAKA F., DOHÁNYOS M., ZÁBRAN-SKÁ J., D DEK J., MALIJEVSKÝ A., NOVÁK J., ODL!ICH J. 2003: Bioplyn. GAS s.r.o., !í"any.
VAVILIN V.A. 2003: Modelling of Anaerobic Degradation of Slaughterhouse Waste. [In:] IWA – Workshop Anaerobic digestion of slaughterhouse wastes. Proceedings, Narbonne.
Streszczenie: Wyniki sprawdzania procesu fer-mentacji anaerobowej odpadów ubojowych. Ar-tyku# zajmuje si$ analiz% wyników sprawdzania jednostopniowego rozpuszczania anaerobowego w warunkach ze &rednimi wymaganiami odno&nie wilgotno&ci i warunkach ciep#olubnych w dwu seriach, odró'niaj%cych si$ okresem retencyjnym (26 i 37 dni). Zosta#y sprawdzone substraty, sk#a-daj%ce si$ z ró'nych stosunków drobiowej, roz-mia'd'onej masy kostnej, &ci$gien wieprzowych, gnojówki byd#a wo#owego i prosi%t (1:1). Stabili-zowana, nieodwodniona reszta po rozpuszczeniu anaerobowym zosta#a wykorzystana jako inocu-lum. Wyniki sprawdzania wskaza#y na efektyw-no&( przerabiania odpadów ubojowych w stacjach biogazowych. Przerabianie odpadów ubojowych wymaga jednak'e instalowania urz%dze) do prze-róbki cieplnej substratu wej&ciowego (podgrzanie do 70°C przez 1 godzin$).
MS. received December 2007
Authors’ address:Ing. Jaroslav Kára, CSc.*eská zem+d+lská univerzita v Praze, Technická fakultaKamýcká 129, 165 21 Praha 6 – SuchdolCzech Republice-mail: [email protected]


Annals of Warsaw University of Life Sciences – SGGWAgriculture No 52 (Agricultural and Forest Engineering) 2008: 103–106(Ann. Warsaw Univ. of Life Sci. – SGGW, Agricult. 52, 2008)
Abstract: New fermentation source in the technology of fermented non-alcoholic beverages. Decoding and identiÞ cation of microbe composition of trivially called rice fungus as a new fermentation source have been studied. It has been found out that Or,zamyces indici -./ is an associative consortium of microorganisms of various groups: Zygosaccharomyces fermentati Naganishi, Pichia membranaefaciens Hansen, Lactobacillus paracasei subsp. 0aracasei, Leuconostoc mesenteroides subsp. dextranicum, Acetobacter aceti, and it is potentially able to bring about the fermentation processes. Technology of new fermented non-alcoholic beverage “Klukovka” of higher biological value has been developed.
Key words: Oryzamyces indici -./ , rice fungus, fermented non – alcoholic drink “Klukovka”, cranberry, microbe composition, organoleptic characteristics, biochemical characteristics.
INTRODUCTION
Development of new non-alcoholic bev-erages enriched with biologically active ingredients and possessing purposefully given properties is one of the current pri-ority trends in non-alcoholic beverage production.
Up-to-date market of the Republic of Belarus is characterized by a wide variety of non-alcoholic beverages. Un-fortunately, they are mainly produced with the use of synthetic or identical to natural food additives – the ß avouring,
colouring, sweetening and conserving agents. Such beverages have simpliÞ ed technology of production, longer shelf but their biological and food value is very dubious.
At present there is much information, that a number of food additives that are most widely used in non-alcoholic industry (benzoic acid and its salts, citric acid, cyclamic acid and its salts) are regarded as cancerogenic substances inß uencing a human body. They seriously threaten the consumer’s health [1].
That is why drinking beverages containing harmful substances for a long period of time affects negatively a human body, and specially children, who are the main consumers of such products.
In this connection, the research works aimed at development of natural non-alcoholic beverages containing no artiÞ cial food additives and enriched with biologically active substances of endogenous origin are very perspective and actual.
In this case the fermented non-alcoholic beverages of plant origin and enriched with microbiological biocomplex metabolites are specially important. This is caused by the fact that quite a number of biologically active substances (vitamins, amino acids, organic acids, minerals) necessary for
New fermentation source in the technology of fermentednon-alcoholic beverages
ELENA TSED, ZOYA BASILENKO, LIDIA KOROLEVA, ELENA LEBEDOK, IRINA IVANOVAThe Mogilev State University of Foodstuffs, Mogilev, Belarus

104 E. Tsed et al.
normal functioning of a human body are produced during the fermentation process; Þ nally, it gives the higher biological value, the treatment and the prophylactic value to the fermented beverages.
Studies on development of new tech-nologies of non-traditional fermentation alcohol – free beverages that possess the treatment and prophylactic proper-ties are carried out at the Mogilev State University of Foodstuffs. Therefore, the Or,zamyces indici -./ polyculture of microorganisms, trivially called rice fun-gus (Indian sea rise, Japanese rise) have been investigated for several years.
Thus, the purpose of this investigation was to study a new non-traditional fermentation source and possibility of using it as a fermenting agent in the production of non-alcoholic fermentation beverages.
RESULTS
In appearance the rice fungus looks like transparent jelly-like granules of various size; it resembles the rice grains in the shape and is considered to be a natural symbiotic polyculture of microorganisms that was formed in the course of evolution. The rice fungus is a widely cultivated home-made product, however, scientiÞ c investigations on the composition and properties of this bioculture are not available.
It is only known that a home-made infusion on the basis of rise fungus possesses both the pleasant organoleptic properties and a whole range of treatment and prophylactic ones. It aids in normalization of metabolic
disturbances and reduction of blood sugar content, enhances the performance efÞ ciency, normalizes acidity of a gastric juice, relieves insomnia, muscle-skeletal diseases, rheum arthritis, stomatitis, pyelonephritis; it also possesses the antiviral, canceridical and immune-stimulating effects [2].
Microbe composition of polyculture Or,zamyces indici -./ has been iden-tiÞ ed; it has been found that the rise fungus is an associative consortium of microorganisms belonging to various taxonomy groups: yeast (Zygosaccha-romyces fermentati Naganishi, Pichia membranaefaciens Hansen), lactic acid bacteria (Lactobacillus paracasei subsp. 0aracasei, Leuconostoc mesenteroides subsp. dextranicum), acetic acid bacte-ria (Acetobacter aceti). While examining physiological characteristics it has been found that microorganisms of symbiotic association of polyculture Or,zamyces indici -./ utilize a signiÞ cant amount of carbohydrates forming the plant sub-strates.
Physiological, biochemical, and technological properties of this bioculture have been studied. Metabolic properties of rice fungus have been determined. This information makes it possible to control substrata fermentation processes effectively and to obtain the product of properties given purposefully. The bioculture of rice fungus Or,zamyces indici -./ has been found to be a very prospective fermentation source in the production of the fermented non-alcoholic beverages [3].
It has also been found that during its vital activity the rice fungus produces a wide range of substances, many of them possessing a high biological activity

New fermentation source in the technology of fermented non-alcoholic beverages 105
and being essential components for maintaining metabolism in human body. Thus, synthesis of free amino acid during vital activity of rice fungus has been studied.
We identiÞ ed that when cultivated, the rice fungus synthesized almost all known amino acids, including 8 essential ones, such as threonine, valine, methionine, leucine, lysine. Moreover, 2 amino acids essential for children – arginine and histidine were determined. It is important because children are among main consumers of non-alcoholic beverages.
Taking into account the whole complex of experimental data, the new production technology for the fermented non-alcoholic beverage “Klukovka”, made of non-traditional fermentation source Or,zamyces indici -./ with
addition of cranberry juice has been developed and patented (Tab. 1).
Biochemical analyses of the new beverage showed that non-alcoholic fermentation beverage produced from polyculture of rise fungus Or,zamyces indici -./ as a fermented agent and additionally enriched with cranberry juice possessed pleasant organoleptic properties and considerable biological value.
This was attributed to the content of the whole range of such biologically active compounds as amino acids, vitamin P, vitamin C, folic acid, reducing substances, etc. in beverage. They take part in metabolism processes of human body (Tab. 2).
In particular, reducing substances take part in energy cell metabolism, amino nitrogen – in the synthesis of proteins of cell structure; vitamin C promotes the
TABLE 1. Organoleptic characteristics of non-alcoholic drink “Klukovka”
Index Description
AppearanceOpaque liquid with no foreign bodies peculiar to the product. A little natural sediment may be present
Color Rose
Taste Sour and sweet
Aroma Cranberry aroma
TABLE 2. Biochemical characteristics of non-alcoholic drink “Klukovka”
Index ValueReducing sugars content [g/100 ml] of non-alcoholic beverage 1.8Amino acid composition [mg/100 ml],including:HistidineArginineProlineMethionineCystineLysine
231.6658.8 ±11.836.8 ±7.4
69.3 ±13.917.4 ±3.5
79.0 ±15.812.2 ±2.4
Vitamin P content [%] 0.98Vitamin C content [mg %] 11.00Folic acid content [m·kg/100 ml] of non-alcoholic beverage 0.15

106 E. Tsed et al.
carbohydrate – protein metabolism, aids in clotting of the blood, intensiÞ es tissue regenerations and synthesis of steroid hormones – collagen and procollagen. It promotes easier iron adsorption, enhances body’s adaptation ability and resistance to infection; vitamin P decreases capillary permeability, maintains blood vessels and makes biological effect of vitamin C more efÞ cient.
The folic acid takes part in regulation of cell Þ ssion process and protein metabolism, stimulates the immune system, regulates fat metabolism in live. A deÞ ciency of folic acid mainly affects the hemopoietic anemia, resulting in bleeding gums, various hemorrhages etc. The lack of folic acid is one of most common deÞ ciencies among modern people.
Moreover, the fact that citric acid and preservatives are not used in the recipe of non-alcoholic beverage allows to increase not only economic efÞ ciency due to food product price reduction, but, Þ rst of all, to get social effects aimed at bringing the human body into a healthy state due to consumption of natural food products containing no exogenous chemical ingredients.
Thus, production and popularization of naturally fermented non-alcoholic beverage will permit to diversify the food products with an appeal to the consumers who take care of their health.
REFERENCES
CHEPURNOY I.P. 2005: IdentiÞ catsia y falsiÞ catsia prodovolstvennyh tovarov, M., Izdatelsko – torgovaya korporatsia “Dashkov y Ko”, 460.
POLEVAYA M.A. 2005: Indiyskiy ris – tselebniy ris. Zhdorovje serdtsa y sosudov, vosstanovlenie posle infarcta, SPb. ID “Ves”, 128.
TSED E.A., PRIBYLSKIY V.L., YAKIREVICH L.M., RIDEVSKAYA L.I., KAMINSKAYA N.A. 2001: Risoviy grib-osnova bezhalcoholnyh napitkov, Pivo y Napitky, 5, 38.
Streszczenie: Nowe ród!o fermentacji w techno-logii sfermentowanego napoju bezalkoholowego. Przeprowadzono badania dekodowania i identyÞ -kacji sk#adu mikroorganizmów w grzybku ry'o-wym jako nowego 1ród#a fermentacji. Stwierdzo-no, 'e Or,zamyces indici -./ stanowi kompleks mikroorganizmów nale'%cych do ró'nych grup: Zygosaccharomyces fermentati Naganishi, Pichia membranaefaciens Hansen, Lactobacillus paraca-sei subsp. 0aracasei, Leuconostoc mesenteroides subsp. dextranicum, Acetobacter aceti. Mo'e on wywo#a( proces fermentacji. Opracowano tech-nologi$ nowego sfermentowanego napoju bez-alkoholowego “Klukovka” o wy'szej warto&ci biologicznej.
MS. received June 2008
Authors’ address:Irina IvanovaDepartment of the Automation of Technological Processes and Productione-mail: [email protected] State University of Foodstuff3 Schmidt Avc.Mogilev 212027Belarys

Annals of Warsaw University of Life Sciences – SGGWAgriculture No 52 (Agricultural and Forest Engineering) 2008: 107–114(Ann. Warsaw Univ. of Life Sci. – SGGW, Agricult. 52, 2008)
Abstract: Agricultural business extension aided by the Case-Based Reasoning method. The paper aims at presentation of a concept of computerized information system, aiding the management with knowledge and experience for agricultural consulting purposes. The Case-Based Reasoning method is presented as a basis for information system development. Additionally, application of uncertain and approximate knowledge was assumed.
Key words: agricultural extension, knowledge management, information system, artiÞ cial intelligence, Case-Based Reasoning, approximate knowledge.
INTRODUCTION
Achieving a success in contemporary agribusiness calls for knowledge, initiative, ß exibility and innovation, thus, there occurs a wider demand for agricultural extension on the increased effectiveness and competitiveness of farms. Therefore, agricultural extension aims at helping the farmers in undertaking correct decisions, especially difÞ cult under conditions of uncertainty, when every advice can be burden with possible errors resulting in economic losses. The risk of errors increases if an advisor have no appropriate knowledge or experience in considered scope; under this situation the agricultural extension
unit can provide the best advice by introducing solutions from the Þ eld of knowledge management, including information systems supporting decision making under conditions of uncertainty. It can result in improvement of decision making process, shortening of time needed for solving the critical problems, increasing productivity and reducing costs [2, 12, 13, 17]. Taking the above into consideration one can formulate the following research thesis: Knowledge and experience properly utilized in agricultural consulting minimizes the risk of economic failure connected with the given advice. VeriÞ cation of this research thesis was attempted by creation of the information system as a tool supporting management with knowledge and experience of agricultural advisor in decision making process based on the Case-Based Reasoning method with consideration to uncertain and approximate knowledge.
MANAGEMENT OF KNOWLEDGE AND EXPERIENCE
Knowledge management is an effective process of learning connected with searching, utilization and dissemination
Agricultural business extension aided by the Case-Based Reasoning method
TADEUSZ WA2CI3SKI1, ANNA MICHALCZYK2 1Department of Production Management and Engineering, Warsaw University of Life Sciences – SGGW, Warsaw, Poland2Faculty of Management, University of Warsaw, Warsaw, Poland

108 T. Wa"ci#ski, A. Michalczyk
of knowledge (open and hidden one), with the use of appropriate technologies and cultural environment in order to increase intellectual capital and organization efÞ ciency [12]. Experience is a knowledge from the past, created by problems and their solutions, thus, as a speciÞ c form of knowledge it is subjected to management and can be supported by technological factor. Experience Management as a sub discipline of knowledge management belongs to the group of subjects investigated at present in the world [7, 10, 11], especially in the Þ eld of informatics and intelligent systems, however, not separated from organization and management sciences. It deals with processes which control creation, storing, utilization and reuse of both the human and machine experiences.
In agricultural extension units the knowledge is a product. The advice-seeking farmer expects to get advice based not only on current knowledge, but also on the branch experience, while the advice-based decisions will sooner or later yield advantageous economic results. It is expected that the advisor will use his own open knowledge acquired during service and also his experience and the connected hidden knowledge, while solving the current problems he will remember his past experiences and the solutions proposed in the similar situation. If they were successful, he would try to act similarly, if not he would avoid them trying to propose other solutions using his experience. The presented mechanism of experience utilization corresponds to inference by analogy and is based on remembering
the past cases understood as a pair: problem – applied solution and skilful determination of similarity between problems.
The experience exists in every extension unit as a knowledge acquired during carried out activity, applied and practically utilized. Many cases (advices) are similar to each other, thus, the previous experiences would facilitate their solving. Lack of experience of a new employee can cause the Þ nancial losses from wrong advice, while codiÞ cation of experience and automatic mechanisms forcing its use will not only save time needed to solve the future problem, but also will stabilize the unit’s operation after quitting jobs by the experienced advisors. It will additionally facilitate acquiring, processing and sharing the hidden knowledge and also increasing knowledge of employees, their efÞ ciency and operational effectiveness [17]. Management of data, information and knowledge, including management of experience in contemporary enterprise will be practically very difÞ cult or even impossible without information support. The most useful are data base systems oriented on aiding the user in realization of decision making processes, created with the use of artiÞ cial intelligence methods [12, 16]. ArtiÞ cial intelligence techniques enable to imitate the human thinking process, aiming at solving the current problem on the basis of collected knowledge and experience. As it is evident from literature review [15], the artiÞ cial intelligence knowledge-based systems, especially expert systems, positively inß uence productivity and staff efÞ ciency, optimize the results of

Agricultural business extension aided by the Case-Based Reasoning method 109
undertaken decisions, increase rate of work by an increase in speed of decision making, and increase the experience volume. A decrease in efforts of problem solving was found also, both in terms of costs and time [17]. The most useful technique in experience management, which imitates the mechanism for experience utilization (thinking by analogy) is the Case-Based Reasoning method (CBR) [7, 10, 11, 16].
CASE-BASED REASONING
Case-Based Reasoning is an artiÞ cial intelligence method of the Þ eld of solving problems, learning and also the technique supporting knowledge management, particularly experience management [1, 8, 9]. This method is based on observing the expert’s thinking, reaching to the past memory for the solutions of known problems (cases) and using these patterns during solving current problems. The case is a pair: problem and its solution, while the case base collects experience in the form of cases, without specifying the rules taken as basis for decision making. This feature distinguishes the system with base case from expert system, where knowledge is expressed with the use of rules. The essence of CBR is: solving the current problem by acceptance of solutions used in the past [1, 8, 9], thus, it assumes that similar problems have similar solutions. Imitating the human thinking, CBR is presented as a cycle consisted of the following phases (stages):
Searching (retrieving) in the case base for the case(s) most similar to considered one;
•
Utilization (reusing) of this case solution in solving the current problem;Evaluation of usability (revising) of old solution(s) in order to match it to considered problem or adaptation (modiÞ cation) of solutions;Memorizing (retaining) of considered problem with applied solution as a new case (experience) for further utilization during solving new problems in future.CBR is used in solving of many
problems as: diagnostics, classiÞ cation, interpretation, planning, designing, teaching, etc. It is assumed that CBR-based system are used in the Þ elds characterized by: regularity, repeatability, similarity of phenomena, continuity of reality subjected to modeling. The CBR method and its application is investigated at present by many researchers, seeking various solutions for its development [7, 10, 11]. The authors think that agricultural extension is such an area.
CONCEPT OF INFORMATION SYSTEM – RESULTS OF INVESTIGATIONS
Development of information system with CBR method application should include: case deÞ nition, selection of case representation, determination of the way for probability measurement, selection of technique for seeking out the similar cases and method for adaptation of solutions. To investigate CBR application in supporting management of knowledge and experience of employees of agricultural extension units, the
•
•
•

110 T. Wa"ci#ski, A. Michalczyk
following assumptions were made basing on references:
Assumption 1. The authors intend to achieve the model of system in the general form, thus, they passed over the problem of case deÞ nition. The case representation based on feature vector [3] was assumed in the form of structure Object-Attribute-Value. Therefore, the case base was deÞ ned as follows:
CB U A D=< >, ,
(1)
where: U is a Þ nite set of cases, A is a non-empty, Þ nite set of attributes de-scribing the problem, D is a non-empty, Þ nite set of attributes describing the problem solution; for each attribute a A, a: U!Ua, where Ua is a set of values of problem description attribute a; for each d D, d: U!Ud, where Ud is a set of val-ues of decision attribute d.
Assumption 2. Seeking out the similar cases according to nearest-neighbour retrieval method [8, 9] by browsing the base, case after case, in order to Þ nd the most similar case.
Assumption 3. Measuring similarity between cases is based on the concept: similarity of cases results from similarity within their features, properties describing the problem. Measurement of similarity was based on local similarity according to formula [8, 9]:
sim c cw sim a c a c
w
aa A a
aa A
( , ')( ( ), ( '))
= ∈
∈
∑∑
(2)where A is a set of features, attributes describing the problem, sima:UaxU!
[0.1] is a local measure determined for attribute a A, Ua is a set of values taken for each a A, wa"0 is signiÞ cance of attribute a A.
It should be noted that in equation (2), the measures of local similarity sima depend on type of values assumed within the feature. It is assumed additionally that the measure of case similarity is a reß exive function (each case is similar to itself) and a symmetrical function (if case c is similar to case c’, then c’ is similar to case c), while attribute’s signiÞ cance enables to determine the effect of feature on similarity of cases. It is assumed that local similarities and signiÞ cance of attributes are known and must be given by the system’s user or calculated with the use of machine learning techniques. Analysis of references enables to conclude that by this method one can compare similarity of cases of heterogeneous, mixed features, both quantitative and qualitative, with the use of real, unprocessed data.
Assumption 4. Interactive adaptation of solutions with participation of system’s user [8, 9].
RESULTS OF INITIAL INVESTIGATIONS
The authors’ investigations carried out towards development of an information system based on CBR at undertaken assumptions point out at some problems in determination of local similarity by the system’s users (equation 2), who can much easier determine the fact of similarity between values of a given attribute than its accurate values or the function (measure) taken in calculations.

Agricultural business extension aided by the Case-Based Reasoning method 111
This is because a man in his everyday life rather estimates than counts, using an approximate knowledge (in this paper it was assumed after (4) that approximate knowledge is based on approximate data burden with error).
The obtained results and conclusions point out at the need of supplementing the classical measurements of similarity with measures including uncertain and approximate knowledge. As it is evident from references [4, 5], solving of this problem can be attempted by assuming that the cases are elements of tolerance spaces, which – as speciÞ c type of approximation spaces – allow for convenient comparison between various objects’ similarities and for application of approximate knowledge.
The tolerance space (TS) [4] is the tuple1 TS 4#U, sim, p $, where U is a non-empty set of objects, sim:UxU![0.1] is a measure of tolerance, p is a threshold value and p [0.1]. Similarity measure is a tolerance measure if it is a reß exive and symmetrical function, thus, for each u,u #U there are fulÞ lled conditions sim(u,u) = 1 and sim(u,u’) = sim(u’,u).
The set of similar objects not discriminated with object u U, for which there exists:
I u u U sim u u p( ) { ' ; ( , ') }= ∈ ≥
(3)
is an environment (neighbourhood) of this object.
1Tuple – “rearranged, Þ nite set of elements” or “rearranged set of n-elements”, sources: http://pl.wikipedia.org.wiki/Krotka of 23.03.2008, Mar-
ciniak M., Szaniawski J.: S!ownik angielsko-polski
dla informatyków. WNT, Warszawa 1990, p. 243.
A very important feature of tolerance space is the fact that similarity of complex structures is based on similarity of simple, elementary set of values. It means that tolerance spaces determined on elementary sets induce the tolerance space for complex structures used for their development. This feature is very important since in CBR method in classical approach the similarity of cases results from similarity of their problems, and this results from similarity of comparable features describing the problem.
In carried out investigations it was assumed that besides the case base there is also known additionally the similarity of features of investigated problem, expressed with tolerance spaces. Then, this similarity is transferred on problem similarity, thus, on case similarity. This assumption is also taken in the system model, which can be presented as follows.
Assumptions for the system.
There is the base of cases CB deÞ ned according to equation (1) and there is also additional knowledge on similarity within the problem features, expressed with tolerance spaces TSa 4 Ua,sima,pa> for each a A, then this similarity is transferred on similarity of cases , thus, tolerance spaces TSa determine the tolerance space above the base of cases TSCB 4 U,sim,p>.
Introduction of above assumption to the system allows for application of object environments (equation 3), in order to determine similarity between cases, which can be described with equation (4):

112 T. Wa"ci#ski, A. Michalczyk
sim c cw S a c a c
w
aa A a
aa A
( , ')( ( ), ( '))
= ∈
∈
∑∑
(4)
where
S x ydla y I x
dla y I xa
a
a
( , )( )
( )=
∈
∉
1
0
where wa is attribute’s signiÞ cance, while function Sa, which determine belonging to environments Ia of attribute a A (equation 3) allows for application of “being not discriminated” within a given feature.
It should be noted that a classical measure of similarity for CBR according to equation (2) is a measure of tolerance and can be used in TS. DeÞ nitions of tolerance measures together with their classiÞ cation and characteristic can be found in references [4, 14].
Cycle of inference CBRTS. Under-taken assumption that CB cases are ele-ments of the tolerance space affects not only the measurement of similarity, but also the cycle of inference, which was proved in carried out experiments. The four-phase cycle CBRTS was obtained, with its Þ rst phase retrievingTS expanded in relation to a classical phase by possibil-ity of searching for the cases not discrim-inated with the case being considered (its environment). It enables to Þ nd quickly existence of precedent, in the context of cases collected in the base. In order to search for the new problem, an algorithm of environment retrieving is proposed for browsing the base, case after case, to Þ nd all cases not discriminated with the case
being considered (for which equation 3 is valid). It was assumed that the remain-ing CBRTS phases are compatible with phases 2, 3 and 4 of classical CBR.
Model of the system. The above assumptions and carried out investigations and conclusions enable to deÞ ne the information system, aiding the management with knowledge and experience for agricultural consulting
purposes, according to equation (5): (5)
where CB, TSa, TSCB form the knowledge base and are conform with undertaken assumptions of the system, while cycle of inference CBRTS is mechanism of interference and I is interface of the user.
The carried out computer experiments proved usability of the proposed model of the system as a tool aiding the management with knowledge and experience of employees of the consulting unit. This procedure aimed at proving that contemporary techniques and tools of software engineering can fulÞ ll the requirements of system realization according to a given concept.
With respect to undertaken scope of work the model was presented in a basic version and is open to further development. The authors think that introduction of tolerance space to CBR is an initial point to further considerations, e.g. to application of approximate set theory, and contributes to development of this method. This problems will be subjected to further investigations.
system CB TS a A TS CBR Ia CB TS=< ∈ >, { : }, , ,

Agricultural business extension aided by the Case-Based Reasoning method 113
REFERENCES
AAMODT A., PLAZA P. 1994: Case-Based Reasoning: Foundational Issues, Methodological Variation and System Approaches, ArtiÞ cial Intelligence Communications, 7(1), http://www.iiia.csic.es/People/enric/AICom.html, (7.01.2008).
ADAMOWICZ M. 2006: Wiedza i jej wp#yw na tworzenie warto&ci i zarz%dzanie orga-nizacj%. Adamowicz M. (red.): Zarz%dza-nie wiedz% w agrobiznesie w warunkach polskiego cz#onkostwa w Unii Europej-skiej, Prace Naukowe KPAiM SGGW nr 35, Wyd. SGGW http://kpaim.sggw.waw.pl/page.php?113, (10.03.2008)
BERGMANN R., KOLODNER J., PLAZA E.: Representation in case-based rea-soning, The Knowledge Engineering Review, Vol. 00:0, 1–4, Cambridge Uni-versity Press, UK, 2005. http://www.iiia.csic.es/People/enric/papers/Representa-tion_in_CBR.pdf, (7.01.2008).
DOHERTY P., 5UKASZEWICZ W., SZA5AS A. 2003: Tolerance Spaces and Approximative Representational Structures, Proceedings of the 26th German Conference on ArtiÞ cial Intelligence KI’2003, LNAI 2821, Springer-Verlag.
DOHERTY P., 5UKASZEWICZ W., SKOWRON A., SZALAS A. 2006: Knowledge Representation Techniques. A Rough Set Approach. Studies in Fuzziness and Soft Computing, vol. 202, Springer Verlag.
EIRMA (European Industrial Research Management Association): The Management of Corporate Knowledge, Summary of EIRMA Working Group 54 Report, Paris (France), 1999. http://www.eirma.org, (29.11.2006).
http: GWEM2005 (Third German Workshop on Experience Management), 2005. http://wm2005.iese.fraunhofer.de/workshop6-en.html, (7.01.2008).
http: Case-Based Reasoning: A Review, 1994. http://www.ai-cbr.org/classroom/cbr-review.html, (7.01.2008).
http: Case-Based Reasoning. http://www.aaai.org/AITopics/html/casebased.html, (7.01.2008).
http: FGWM2007 (Workshop Knowledge and Experience Management).
http:/ / lwa07.informatik.uni-halle.de/fgwm07/fgwm07_en.htm, (7.01.2008).
http: 2006 International Workshop on Experience Management and Engineering (EME’2006) In conjunction with KES2006. http://www.uow.edu.au/~zsun/KES-EME-2006-CFP.htm, (7.01.2008).
JASHAPARA A. 2006: Zarz%dzanie wiedz%, PWE, Warszawa.
KISIELNICKI J. 2003: Informatyka narz$-dziem zarz%dzania wiedz%. - Kisielnicki J. (red.): Informatyka narz$dziem zarz%-dzania w XXI wieku, PJWSTK, Warsza-wa.
MICHALCZYK A. 2006: Miary podobie)-stwa w hierarchicznym grupowaniu ele-mentów przestrzeni tolerancji. Kisiel-nicki J. (red.): Informatyka w globalnym &wiecie, PJWSTK, Warszawa.
MULAWKA J. 1996: Systemy ekspertowe, WNT, Warszawa.
SUN Z., FINNIE G.; Experience Management in Knowledge Management, 2005. http://ro.uow.edu.au/commpapers/33/, (7.01.2008).
WA2CI3SKI T., MICHALCZYK A. 2007: Metoda Case-Based Reasoning, Ekonomi-ka i Organizacja Przedsi$biorstwa, nr 8.
Streszczenie: Doradztwo biznesu rolniczego
wspierane metod$ Case-Based Reasoning. Jest prób% udowodniena tezy, i' w#a&ciwie wyko-rzystana wiedza i do&wiadczenie w konsultingu rolniczym minimalizuje ryzyko niepowodzenia ekonomicznego zwi%zanego z udzielan% porad%. Prób% weryÞ kacji tak postawionej tezy badawczej jest propozycja stworzenia systemu informatycz-nego jako narz$dzia wspomagaj%cego zarz%dza-nie wiedz% i do&wiadczeniem doradcy rolniczego

114 T. Wa"ci#ski, A. Michalczyk
w procesie decyzyjnym – opartego na metodzie Case Based Reasoning z uwzgl$dnieniem mo'li-wo&ci pos#ugiwania si$ wiedz% niepewn% i przy-bli'on%. W artykule omówiono zagadnienia z ob-szaru zarz%dzania wiedz% i do&wiadczeniem oraz przedstawiono metod$ Case-Based Reasoning (CBR) jako podstaw$ budowy systemu informa-tycznego. Zaprezentowano koncepcj$ systemu informatycznego opartego na metodzie CBR i za-#o'eniu, 'e przypadki (cases) s% elementami prze-strzeni tolerancji co daj$ mo'liwo&( pos#ugiwania si$ wiedz% niepewn% i przybli'on%.
MS. received June 2008
Authors’ addresses:Tadeusz Wa&ci)skiKatedra Organizacji i Zarz%dzania Produkcj%, Wydzia# In'ynierii Produkcji SGGWul. Nowoursynowska 16402-787 Warszawa
Anna MichalczykKatedra InformatykiWydzia# Informatyki i EkonomiiWy'sza Szko#a Informatyki i Ekonomii TWPul. Barczewskiego 1110-061 Olsztyn