Ann al R por 20 - data.feedgma.com
224
Annual Report 2018
Transcript of Ann al R por 20 - data.feedgma.com

An
nu
al Rep
ort 2018
Annual Report 2018
The web and mobile HTML versions are published online on the same date as the date of issue of this publication at
https://www.alrajhibank.com.sa/en/investor-relations/pages/annual_report_2018.aspx
Scan to view the mobile version of this Annual Integrated Report

1
In The Name of Allah
The Most Merciful, The Most Gracious
The Custodian of the Two Holy Mosques
King Salman Bin Abdulaziz Al Saud
His Royal Highness Crown Prince
Mohammad Bin Salman Bin Abdulaziz Al Saud

An
nu
al
Re
po
rt
20
183
As “The Blue-chip Islamic Bank”, our strong foundation continues to produce robust returns. A few years ago, we developed a strategic path that began with going back to basics, that formed a solid foundation for successful progress. Today, as we welcome the emerging new technologies and continue to attract new digital customers, we are excited about the bright future ahead.

The Blue-chip Islamic Bank
Annual Report 2018
© 2018 Al Rajhi Bank
Scan to view the online version of this Annual Report
The web and mobile HTML versions are published online on the
same date as the date of issue of this publication at
https://arb.sa/report2018
An
nu
al
Re
po
rt
20
185
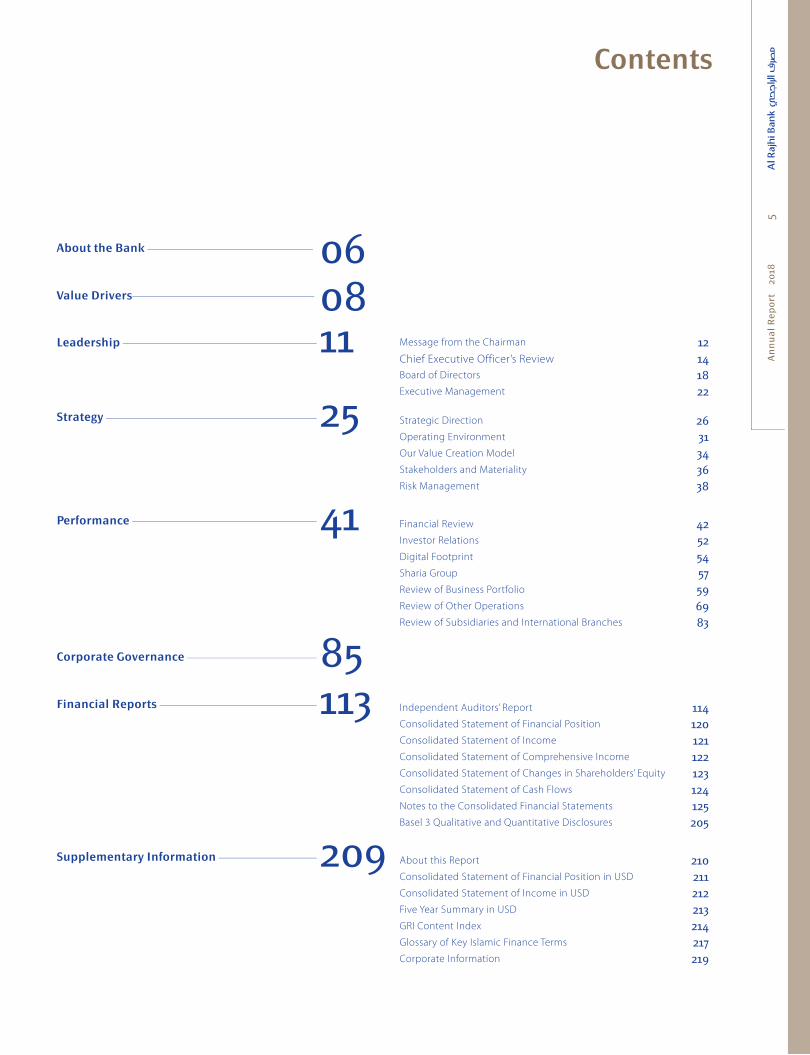
Contents
About the Bank 06Value Drivers 08
11Leadership Message from the Chairman 12Chief Executive Officer’s Review 14Board of Directors 18Executive Management 22
25Strategy Strategic Direction 26Operating Environment 31Our Value Creation Model 34Stakeholders and Materiality 36Risk Management 38
41Performance Financial Review 42Investor Relations 52Digital Footprint 54Sharia Group 57Review of Business Portfolio 59Review of Other Operations 69Review of Subsidiaries and International Branches 83
85Corporate Governance
113Financial Reports Independent Auditors’ Report 114Consolidated Statement of Financial Position 120Consolidated Statement of Income 121Consolidated Statement of Comprehensive Income 122Consolidated Statement of Changes in Shareholders’ Equity 123Consolidated Statement of Cash Flows 124Notes to the Consolidated Financial Statements 125Basel 3 Qualitative and Quantitative Disclosures 205
209Supplementary Information About this Report 210Consolidated Statement of Financial Position in USD 211Consolidated Statement of Income in USD 212Five Year Summary in USD 213GRI Content Index 214Glossary of Key Islamic Finance Terms 217Corporate Information 219

An
nu
al
Re
po
rt
20
186
About the BankAbout the Bank
Value DriversValue Drivers
LeadershipLeadership
StrategyStrategy
PerformancePerformance
Corporate GovernanceCorporate Governance
Financial ReportsFinancial Reports
Supplementary InformationSupplementary Information
About the Bank
The Bank
Vision, Mission, and Values
Our Vision
To be a trusted leader delivering innovative
financial solutions to enhance the quality of life
of people everywhere.
Our Mission
To be the most successful bank admired for
its innovative service, people, technology, and
Sharia compliant products, both locally and
internationally.
Our Values
Everything the Bank does is built around its core
values, which puts the customer at the heart of
all its activities.
Integrity and transparency Being open and honest while maintaining
the highest standards of corporate and
personal ethics
A passion to serve Anticipating and addressing customer
needs to deliver results that go beyond
expectations
Solution oriented
Helping the customers achieve their
objectives through effective and efficient
solutions
Modesty and humility Being humble in thought, word, and deed
Innovativeness Nurturing imagination and fostering
creativity for better results
Meritocracy Defining, differentiating, and reinforcing
excellence in people
Care for society Contributing towards a better tomorrow
History
Referred to as the “Bank” in this document,
Al Rajhi Bank (ARB) received its current name
in 2006 but was originally established in 1957
as an exchange house and converted to a bank
under the name Al Rajhi Banking Corporation in
1987. The Bank is a Saudi joint stock company
that was formed and licensed in accordance
with Royal Decree No. M/59 and Article 6 of the
Council of Ministers’ Resolution No. 245, both
of June 1987. With its headquarters in Riyadh,
Kingdom of Saudi Arabia, the Bank operates
under Commercial Registration No. 1010000096
and is listed on the Saudi Stock Exchange
(Tadawul) with the Ticker No. RJHI.
Objectives
The Bank’s objectives are to carry out banking
and investment activities within the Kingdom
of Saudi Arabia, and beyond, pursuant to the
Bank’s Articles of Association and Bylaws,
the Banking Control Law and the Council of
Ministers’ Resolution (mentioned previously
under History), and in compliance with Islamic
Sharia legislations.
Operations and reach
The second largest Bank in the Kingdom in
terms of assets and the largest Islamic bank
in the world, Al Rajhi Bank (ARB) accounted
for 16.1% of total assets and 17.3% of total
deposits among banks in the Kingdom as of
end 2018. The Bank’s market capitalisation as
of 31 December 2018 was SAR 142.2 Bn. Total
Group assets amounted to SAR 365 Bn. as of
31 December 2018.
The Bank delivers its services through diverse
channels for the convenience of its customers.
These consist of both traditional and modern
channels, including an extensive network of
551 branches including 157 ladies branches and
sections, 5,006 ATMs and 83,958 POS terminals
that span the Kingdom, in addition to online
banking and mobile banking services. While
managing the largest branch network in the
Middle East, the Bank also operates 10 branches
in Jordan and two branches in Kuwait while its
subsidiary in Malaysia operates 18 branches.

An
nu
al
Re
po
rt
20
18
About the Bank
7
About the BankAbout the Bank
Value DriversValue Drivers
LeadershipLeadership
StrategyStrategy
PerformancePerformance
Corporate GovernanceCorporate Governance
Financial ReportsFinancial Reports
Supplementary InformationSupplementary Information
With over nine million customers, the Bank
serves the largest customer base in the
Kingdom, processing the payrolls of over 50%
of government employees. Handling an average
of 172 million transactions per month and over
a million remittances, the Bank now partners
with over 200 correspondent banks in around
50 countries. Its employee cadre numbered
12,732 at end 2018 making the Bank among
the top 10 employers in the Kingdom and the
largest employer in the financial sector.
Al Rajhi Bank Group
Meticulous adherents of Islamic Banking
principles, the members of the Al Rajhi Bank
Group consist of seven subsidiaries in addition
to the Bank. Four of these subsidiaries are
situated within the Kingdom (refer Review of
Subsidiaries on page 83) while three are located
overseas. Together the Group provides clients
with innovative financial and other products
and services that combine Islamic values with
modern commercial requirements.
Refer Review of Subsidiaries on page 83.
Products and services
Retail banking
Corporate banking
SME banking
Treasury International business
BANK
In line with the rapidly
changing international
banking landscape
the Bank provides a range
of products and services
to meet the needs of its
varied customer groups.
Refer Review of Business
Portfolio on page 59.
Together the Group provides
additional services including:
Real estate Securities
Brokerage
Insurance
Professional services
GROUP

An
nu
al
Re
po
rt
20
18
Value Drivers8
About the BankAbout the Bank
Value DriversValue Drivers
LeadershipLeadership
StrategyStrategy
PerformancePerformance
Corporate GovernanceCorporate Governance
Financial ReportsFinancial Reports
Supplementary InformationSupplementary Information
Value Drivers
Total assets (SAR Bn.)
2018 – 3652017 – 343
Increase: 6.40%
Net income (SAR Bn.)
2018 – 10.302017 – 9.10
Increase: 12.90%
Market capitalisation
SAR Bn.
150
120
90
60
30
0201820172014 2015 2016
Customer deposits (SAR Mn.)
2018 – 293,909 2017 – 273,056
Increase: 7.60%
Female customers Growth of 30% over the last three years
Earnings per share (SAR)
2018 – 6.342017 – 5.61
Increase: 13.00%
Cost to income ratio (%)
2018 – 31.70 2017 – 32.90
Improved: 120 bps
Total capital adequacy ratio(%)
2018 – 20.20 2017 – 23.30

An
nu
al
Re
po
rt
20
189
About the BankAbout the Bank
Value DriversValue Drivers
LeadershipLeadership
StrategyStrategy
PerformancePerformance
Corporate GovernanceCorporate Governance
Financial ReportsFinancial Reports
Supplementary InformationSupplementary Information
Digital: manual ratio 2018 – 56:44 2017 – 49:51
Active digital users
3.7 Mn.
Customer Deposits
SAR Bn.
300
240
180
120
60
0201820172014 2015 2016
Staff strength 2018 – 12,732
Saudisation rate (%)
2018 – 96
Largest Islamic Bank worldwideby assets and market capitalisation
No. 1 retail bank in the Middle Eastin retail deposits and income
No. 1 Distribution network in the Middle Eastby number of branches, POS, ATMs and remittance centres
No. 1 in banking transactions in the KSA4 of 10 transactions in KSA
No. 1 Bank brand in the KSABrand Power Score
Value Drivers

Completed in 2018, Al Rajhi Bank Tower is the Bank’s new head office
building which stands out in Riyadh’s ever-changing skyline

Value Drivers
11
About the BankAbout the Bank
Value DriversValue Drivers
LeadershipLeadership
StrategyStrategy
PerformancePerformance
Corporate GovernanceCorporate Governance
Financial ReportsFinancial Reports
Supplementary InformationSupplementary Information
An
nu
al
Re
po
rt
20
1811
Leadership Message from the Chairman
12
Chief Executive Officer’s Review
14
Board of Directors
18
ExecutiveManagement
22

An
nu
al
Re
po
rt
20
18
Message from the Chairman12
About the BankAbout the Bank
Value DriversValue Drivers
LeadershipLeadership
StrategyStrategy
PerformancePerformance
Corporate GovernanceCorporate Governance
Financial ReportsFinancial Reports
Supplementary InformationSupplementary Information
Message from the Chairman
Recording another record Recording another record
year, the Bank continued to year, the Bank continued to
grow and fortify its position grow and fortify its position
as the world’s largest Islamic as the world’s largest Islamic
Bank. Group net income for Bank. Group net income for
the current year increased the current year increased
to SAR 10,297 Mn. from to SAR 10,297 Mn. from
SAR 9,121 Mn. in 2017. SAR 9,121 Mn. in 2017.
This achievement is all the This achievement is all the
more significant given the more significant given the
complex dynamics at work complex dynamics at work
in the wider operating in the wider operating
environment.environment.
Traversing closer to Vision 2030
As Saudi Arabia pushes ahead with plans to
reduce dependence on oil and diversify the
economy, the Bank continued to align its own
strategies with KSA’s Vision 2030. The Kingdom’s
focus on further revitalising the financial sector
by fostering private sector growth, creating
an advanced capital market, and nurturing
financial responsibility among its people will
contribute greatly towards its goal of being
a global investment powerhouse. During the
year under review, the Kingdom continued to
make good progress in its mission to achieve its
Vision 2030 goals. With GDP continuing to grow,
private sector contribution to GDP which was
48.2% in 2017 is projected to be well on its way
to reach the target of 65% by 2030. Public debt
to GDP is projected to be 21% by end 2018.
Saudi owned dwellings (occupied with Saudi
households) increased from 49.1% in 2017 to
51.7% in 2018, while foreign direct investment
edged up to USD 2,388 Mn. for the three
quarters ended 30 September 2018 compared
to USD 1,420 in 2017.
Within Saudi Arabia, our five strategic pillars,
which focus on growth, employees, customers,
digital leadership, and execution excellence,
are continuing to show robust results. Our
subsidiary in Malaysia and our branches in
Kuwait and Jordan ensure that the Bank remains
geographically diverse. We will continue forging
strong partnerships beyond our borders to
provide our stakeholders with greater value
over the years to come.
Plotting a sustainable course
The Bank is fully aware of its responsibility
to be sustainable in running every aspect of
its business. Corporate governance at the
Bank covers the rules, practices, systems
and procedures which direct and control its
activities. Our governance structure helps the
Bank to balance the interests of our multiple
stakeholder groups as we focus our energies
on value creation.
The Corporate Governance Manual and
Regulations for Board Committees and
Management Committees, published in 2014,
are reviewed annually to ensure that they
remain relevant to the changing times. We
also apply the key principles of the Saudi
Arabian Monetary Agency’s (SAMA) Corporate
Governance Code for Banks in all our operations
within the Kingdom of Saudi Arabia and
Corporate Governance Regulations issued
by CMA.
Such stringent adherence to corporate
governance is vitally important in an environment
that is continuously in motion. Every day new
players alight on the global arena, disrupting
the banking industry as we know it with
advanced technology that had not even been
dreamed of a few years ago. If we do not move
nimbly to capitalise on the opportunities while
mitigating the risks, we and our stakeholders
risk being marooned in the past.
An
nu
al
Re
po
rt
20
18
Message from the Chairman
13
About the BankAbout the Bank
Value DriversValue Drivers
LeadershipLeadership
StrategyStrategy
PerformancePerformance
Corporate GovernanceCorporate Governance
Financial ReportsFinancial Reports
Supplementary InformationSupplementary Information
The Board is well aware of these developments
and has already taken prudent but pragmatic
steps to make the best of such rapid
advancements. A number of policies, practices
and procedures relating to corporate governance
were developed during the year and the
Governance Manual updated. In addition, the
Delegation of Authorities (DOA) matrix has been
amended according to regulator requirements.
An independent policy of the Bank relating
to conflicts of interest was adopted while
the policy on related party transactions was
also approved. The aim of approving of such
policy is to establish guidelines to deal with
transactions which have conflict of interest.
Provisioning for the future
We are well aware of the critical role that
employees play in the success of the Bank.
To ensure that our employees career
development needs are met, the Bank
adopted the competencies and functional
succession policy. This policy also helps meet
the immediate and future staffing needs of the
Bank. The promotion of Saudisation is another
benefit of these policies.
To create and sustain an open and enabling
culture within the Bank, the violations reporting
policy was also adopted. It encourages the
reporting of improper behaviour or any activity
that violates the Bank’s policies, procedures
and instructions.
Naturally, we also apply SAMA regulations
regarding remuneration in accordance with the
provisions of the Saudi Company Law.
Our shareholders are a key stakeholder group
that the Bank is committed to continue serving.
As a result of their trust and loyalty, the Bank is
ultimately provided with the means to expand
its business further or capitalise on sudden
business opportunities, should the need arise.
To retain their trust and promote transparency,
the Bank ensured that all material information,
inclusive of banking information required to be
disclosed by SAMA and CMA regulations, was
also disclosed to shareholders.
Focusing on strengthening the Bank’s role in
society, we also adopted a policy for social
responsibility. We continue to give back to
the community by supporting a range of
programmes that are geared to provide relief
and support for the marginalised or disabled
segments of society. We are immensely proud
of the active participation of our employees
in community efforts and look forward to
an increase in the number of volunteer
hours contributed. Taking a leadership role
in increasing financial literacy among the
communities within which we operate, we also
undertook a number of awareness programmes
during the year.
Dividends
I am pleased to report that the Bank distributed
a dividend of SAR 2 per share for the first half of
2018, and proposed a final dividend of SAR 4.25
per share. Total dividends for the year amounted
to SAR 6,906 Mn., representing 67% of earnings.
Acknowledgements
Together with the Board of Directors, I express
our appreciation to the Custodian of the Two
Holy Mosques and the Crown Prince for their
strategic vision and leadership.
My appreciation, expressed on behalf of the
Board, also goes out to the Ministries of Finance,
and Commerce and Investment; the Saudi
Arabian Monetary Agency; the Capital Market
Authority; and their eminences the Chairman
and the members of the Bank’s Sharia Board,
for their invaluable advice and guidance.
The Board and I extend our gratitude to
our shareholders, correspondent banks and
customers. We also thank all employees for their
dedication towards making the Bank’s Vision
and Mission a reality. In conclusion, I thank my
colleagues on the Board of Directors whose
support and counsel I hold in high regard.
Abdullah bin Sulaiman Al Rajhi
Chairman

An
nu
al
Re
po
rt
20
18
Chief Executive Offi cer’s Review14
About the BankAbout the Bank
Value DriversValue Drivers
LeadershipLeadership
StrategyStrategy
PerformancePerformance
Corporate GovernanceCorporate Governance
Financial ReportsFinancial Reports
Supplementary InformationSupplementary Information
Chief Executive Offi cer’s Review
Just as the Kingdom is Just as the Kingdom is
in the process of a great in the process of a great
transformation, the Bank too transformation, the Bank too
continues to engage in its continues to engage in its
own journey of change – own journey of change –
one that will complement one that will complement
and contribute towards and contribute towards
Saudi Arabia’s Vision 2030. Saudi Arabia’s Vision 2030.
During the year under During the year under
review, we accelerated our review, we accelerated our
transformation, continuing transformation, continuing
to deliver superior returns to deliver superior returns
for our shareholders for our shareholders
while further enhancing while further enhancing
our customer and staff our customer and staff
engagement.engagement.
Accelerate growth
For all our shareholders, the starting point
of their expectations remains value creation
through accelerated growth – growth which,
while it exceeds industry, remains both prudent
and pragmatic. Building on its momentum,
the Bank outperformed peers in the market
yet again, registering meaningful market
share improvements across key product lines.
Our mortgage portfolio grew by over 27%
through the introduction of new products
such as Self Construction, a home financing
solution for Ministry of Housing and Real Estate
Development Fund beneficiaries. These efforts
increased the Bank’s market share to 27.9%
compared with 20.6% three years ago. The Bank
also registered market share increases of 4.6%,
6.6% and 30% in terms of remittance centres,
current accounts, and female customers
respectively. With 551 branches, including
157 ladies sections and branches and 236
remittance centres as well as 300 affluent
lounges, we ensured that the Bank’s distribution
network remained the largest and most
technologically advanced in the Kingdom.
To further accelerate growth, we introduced
many firsts during the year, such as
“FX Forwards”, a first of its kind in the Islamic
hedging market, and also a comprehensive
Supply Chain Financing programme which
provides a wide range of solutions for corporate
customers. We also launched POS Merchant
Financing for Small and Medium Enterprises,
merging our SME and retail arms to leverage
our network and enhance customer service.
While we remained focused on our domestic
organic strategy we continued to invest outside
the Kingdom. In Kuwait, we became the first
foreign Bank to launch a second branch.
In Jordan, we opened three more branches,
which will provide our customers with a
wide range of banking products and services.
Malaysia performance improved substantially
and we signed an exclusive 10-year agreement
with Sun Life Malaysia Takaful Berhad,
appointing them sole distributor of Family
Takaful products and services.
We remain focused on effective balance sheet
management in a rising rate environment and
witnessed successful (6%) growth in non-profit
bearing deposits, which increased our market
share to represent over 25% and represents
94% of our total deposits. As a result, the Bank’s
net profit margin improved by 26 basis points
in 2018 to 4.34%. During 2018, a Corporate
Sukuk proposition was developed and
the Bank participated in a high profile Sukuk
issuance in the Kingdom and in several large
syndicated transactions.
An
nu
al
Re
po
rt
20
18
Chief Executive Offi cer’s Review
15
Become employer of choice
For our employees, we must continue being
the employer of choice – providing them
with the career development opportunities
they need to excel. It is only when they are
truly engaged that our employees are able
to anticipate and meet the banking needs of
our customers and empowered to act in our
customers’ best interest.
During the year, we provided 65,000 hours
of training and development. With the aim
of strengthening diversity and increasing the
number of female employees, the Bank also
launched the first dedicated female graduate
development programme during the year.
In 2018, the number of female employees
grew by 54% from 2015, representing 13.5% of
the Bank’s total employee base. Contributing
towards Vision 2030, the Bank also increased its
Saudisation ratio to 96% during the year.
We also sought to provide our employees with
every opportunity to excel at what they do.
For instance, on its journey of transformation,
our HR function embraced innovation. We
launched “SAHL”, a new generation HR Services
mobile application that is integrated with HR
systems. SAHL provides employees with greater
flexibility in utilising and requesting HR services
on their mobiles.
Giving back to the communities within which
we operate, has always been a part of our ethos
and this year was no different. Nearly 3,000
of our people banded together, contributing
over 14,000 hours on 75 social responsibility
programmes in 22 cities. By 2020, our goal is to
be able to report 50,000 cumulative hours of
employee volunteering.
Customer focus
With our people and digital systems
increasingly geared towards providing a
superior customer experience, the Bank is on a
clear trajectory towards meeting its customer
advocacy goals. We monitor our Net Promotor
Score (NPS) very closely focusing on whether
a customer would recommend the Bank to
others. Among banks in the Kingdom, our NPS
improved from 14% in 2015 to 42% in 2018.
We now rank second, up from seventh position
in 2015 out of a total of 12 banks in Saudi
Arabia. We also lead in social media, ranking
first on Twitter, YouTube and Instagram.
We are establishing an innovation centre in
our new facility and will be expanding the
level of customer input in both the design and
prioritisation of new features and products. The
feedback and suggestions from customers have
enhanced our ability to increase conversion to
digital channels and functionality, continuing to
enhance customer experience further.
We delivered 11 new products during 2018 and
have a full pipeline in place for 2019 and beyond.
Digital leadership
In today’s always-connected, always switched-
on world, to meet the needs of our customers,
we must compete with the latest technological
innovations and market disruptions introduced
by both start-ups and the biggest brands in
the consumer and technology space. While this
is no easy challenge, we have already begun
focusing on some of the latest innovations in
the market. Blockchain is one such innovation.
The Bank has partnered with RippleNet, a
global payments network that makes it easier
for customers to connect and transact across
a network of over 200 banks and payment
providers worldwide.
About the BankAbout the Bank
Value DriversValue Drivers
LeadershipLeadership
StrategyStrategy
PerformancePerformance
Corporate GovernanceCorporate Governance
Financial ReportsFinancial Reports
Supplementary InformationSupplementary Information
An
nu
al
Re
po
rt
20
18
Chief Executive Offi cer’s Review16
About the BankAbout the Bank
Value DriversValue Drivers
LeadershipLeadership
StrategyStrategy
PerformancePerformance
Corporate GovernanceCorporate Governance
Financial ReportsFinancial Reports
Supplementary InformationSupplementary Information
To further meet customer needs, during the
year, we harnessed technological innovations
such as fingerprint identification technology
and electronic signatures to make banking safer
and more convenient for our customers.
As part of the ongoing digital transformation
journey, we also focused on mobile and internet
banking enhancements, further expanding our
digital footprint. At year’s end, 56% of customer
transactions were being performed digitally. In
addition, the number of active retail users of the
Bank’s “Mubashar” online banking platform for
Retail customers grew strongly by 61% during
2018 to 3.6 Mn., while active Corporate users
grew by 12.5% to almost 40,000. In terms of
point of sale, we captured 18.9% of the value of
the point of sale in the Kingdom, up from 16.3%
in 2017. We deployed 250 self-service kiosks and
plan to add 200 more in 2019. In 2018, 25% of
transactions were made on a mobile or desktop.
We will continue to forge new partnerships
with Fintech companies in various parts of our
business, including payments, and expanded
use of robotics in our operations.
Execution excellence
Al-Rajhi Bank is committed to ensuring the
highest standards of compliance across all its
activities and functions. With the overarching
goal of maintaining a “World-Class” Compliance
Program, the Bank continues to invest in
“State-of-the-Art” compliance Systems,
technology enabled processes and people. The
Bank successfully transformed its Anti-Money
Laundering (AML), Counter-terrorist Financing
(CTF) and Sanctions frameworks; and has
achieved an established state of maturity.
While continuing to improve the Bank’s
compliance standards and procedures, we
focused on protecting the interests of our
customers and meeting the increasingly
rigorous demands of local and international
regulators. To ensure that we abide with
all the regulatory requirements and new
developments during the year, the Bank
updated its Governance Manual, as well as
all approved policies and procedures for its
businesses across the Kingdom and at our
branches abroad.
We will continue to seek process improvements,
such as digital solutions for retail credit
approvals, sanction screening and other
operational processes. In the near future we
will roll out these initiatives to other lines of
business in the Bank so that efficiency and
effectiveness can be further improved across
business lines and functions. We are one of
the largest users of robotics in the Middle East,
with 253 bots processing around up to 22,000
transactions per day, improving turnaround
time. We also completed our new head office
and data centre during the year.
Acknowledgements
I extend my sincere appreciation to the
Chairman and the Board for their support and
guidance, the Bank’s customers and investors
for their continued loyalty and patronage,
and our employees for their commitment and
hard work.
The quest to succeed has always been strong
within Al Rajhi Bank. While this spirit has
stood the Bank in good stead over the past six
decades, I have no doubt that our leadership
team, our people and our clear ABCDE strategy
outlined in the Report, will continue to position
the Bank for long-term success.
Stefano Paolo Bertamini
Chief Executive Officer

Largest Islamic Bank worldwide by assets and market capitalisation

An
nu
al
Re
po
rt
20
1818
Abdullah Bin Sulaiman Al Rajhi Alaa bin Shakib Al Jabri Salah bin Ali Abalkhail
Committees membership
Executive Committee
Current positions
Chairman of the Board and Chairman
of Executive Committee – Al Rajhi Bank
Chairman of the Board – Al Rajhi Company
for Cooperative Insurance
Chairman of the Board – Farabi
Petrochemicals Company
Chairman of the Board – Al Rajhi
Holding Group
Chairman of the Board – Al Rajhi
Capital Company
Chairman of the Board – Fursan
Travel & Tourism Company
Previous positions
At Al Rajhi Bank since 1979:
Deputy General Manager of Financial Affairs
Deputy General Manager of Investment
and Foreign Relations
Senior Deputy General Manager
General Manager
Chief Executive Officer
Managing Director/Chief Executive Officer
Board Member/Executive Committee Member
Vice Chairman of the Board and Executive
Committee Member
Qualifications
Bachelor of Business Administration –
King Abdulaziz University – 1979
Experience
Contributed to the conversion of Al Rajhi
Exchange and Trade Company into a public joint
stock company and held many leading positions
in ARB for more than 35 years until his current
position as the Chairman of the Board of Directors.
Committees membership
Executive Committee, Board Risk Management
Committee (BRMC), Nominations and
Compensations Committee
Current positions
Vice Chairman, Board Member,
Executive Committee Member and Member
of BRMC and Chairman of Nominations and
Compensations Committee – Al Rajhi Bank
Board Member – Construction
Products Holding Company
Board Member – Rolaco Group
Board Member and Chief Executive
Officer – Medical and Pharmaceutical
Services Company
Previous positions
Board Member – SIMAH
Board Member – Higher Education Fund
Board Member – Saudi Travellers
Cheques Company
Board Member – Arab International
Bank – Tunisia
Head of Risk Group – SABB
General Manager of Western Region – SABB
General Manager of Gulf International Bank
Director of International Business –
National Commercial Bank
Deputy CEO – Gulf International Bank
Corporate Banking Manager –
Saudi Investment Bank
Qualifications
Bachelor of BA – American University in Beirut
Master of BA – Enseed, France
Experience
Having professional experience of more than
30 years, in the banking and financial fields,
during which he held many leading positions
in many local and international banks.
Committees membership
Executive Committee, Governance Committee
Current positions
Board Member, Executive Committee Member
and Chairman of Governance Committee –
Al Rajhi Bank
Board Member – Al Rajhi Capital Company
Partner and Chairman of the Board –
National Veterinary Company
Chairman and Office Owner –
Salah Abalkhail Consulting Engineers
Chairman of the Board – Salah Abalkhail & Co.
Information Technology
Previous positions
At Norconsult Telematics Company since 1972:
Project Engineer Assistant
Project Engineer
Project Manager
Associate Consultant for the Company's projects
Member of Engineering Committee –
Ministry of Commerce
Qualifications
Bachelor of Electrical Engineering –
University of Arizona – 1972
Experience
Working in the field of advisory and investment
for more than 40 years. He assumed the position
of Board Member of Al Rajhi Bank, since the first
tenure, and served as a member on many Board
committees.
Board of DirectorsAbout the BankAbout the Bank
Value DriversValue Drivers
LeadershipLeadership
StrategyStrategy
PerformancePerformance
Corporate GovernanceCorporate Governance
Financial ReportsFinancial Reports
Supplementary InformationSupplementary Information

An
nu
al
Re
po
rt
20
1819
Abdulaziz bin Khaled Al Ghefaily Bader Bin Mohammed Al Rajhi Khaled bin Abdulrahman Al Qwaiz
Committees membership
Executive Committee, Nominations and
Compensations Committee
Current positions
Board Member – Executive Committee
Member – Member of Nominations and
Compensations Committee – Al Rajhi Bank
Board Member – Al Rajhi Capital Company
Board Member – Savola Group
Board Member – Panda Retail Company
Previous positions
Worked from 1981 to 2016 at General
Organization for Social Insurance “GOSI”
Board Member – Industrialization & Energy
Services Company
Board Member – Riyadh Hotels and
Entertainment Co.
Board Member – Saudi Industries
Development Company
Board Member – Tabuk Agriculture
Development Company (TADCO)
Board Member – National Medical
Care Company
Board Member – Herfy Food Services
Qualifications
Bachelor of Economics – King Saud University
Master’s Degree in Economics from Western
Illinois University – USA – 1990
Experience
Working in the field of financial investment
for more than 25 years.
Current positions
Board Member – Al Rajhi Bank.
Managing Director and Vice Chairman –
Mohammed Abdulaziz Al Rajhi & Sons
Investment Company (MARS)
Chairman of Rajhi Steel Industries Co. Ltd.
(Rajhi Steel)
Chairman of the Board – Global
Beverage Company
Chairman of the Board – Al-Jazirah Home
Appliance Co. Ltd.
Chairman of the Board – Falcon Plastic
Products Company
Chairman of the Board – Manafe
Investment Company
Previous positions
Held several leading positions in areas
of management, industry and real estate
investment. He has served as a member of
Boards of Directors of joint-stock companies.
Qualifications
High School
Experience
Having experience of 30 years, Mr Bader
has held several leading positions in areas
of management, industry and real estate
investment and served as a member of Boards
of Directors of many joint-stock companies.
Committees membership
Nominations and Compensations Committee,
Board Risk Management Committee (BRMC)
Current positions
Board Member – Member of Nominations and
Compensations Committee – Chairman of
BRMC – Al Rajhi Bank
Board Member, Audit Committee Member
and Chairman of the Nominations and
Compensations Committee – Swicorp Company
Chairman of the Board, Chairman of the
Executive Committee and member of
Nomination Committee – Riyadh Cables
Group Company
Board Member – EMCOR Facilities Services
Board Member – Unique Solutions for
Chemical Industries (USIC)
Previous positions
Managing Director – ACWA Holding Company
Chief Executive Officer – Astra Industrial Group
General Manager – Corporate Banking Group
in the Central Region – SAMBA Group
General Manager – Credit Group –
Arab National Bank
Manager of Financial and Administrative
Affairs Sector – National Cooperative
Insurance Company
Head of Loan Team – Saudi Industrial
Development Fund
Board and Executive Committee Member –
ACWA Holding Company
Board Member and Chairman of Nominations
and Compensations Committee – Saudi
Tabreed Company
Qualifications
Bachelor of Urban Planning – University
of Washington – USA
Experience
Having more than 30 years of experience in the
banking, fi nancial, and industrial fi eld, during
which he held many leading positions in many
local banks, in the fi eld of retail, wholesale, risk
and insurance.
Board of DirectorsAbout the BankAbout the Bank
Value DriversValue Drivers
LeadershipLeadership
StrategyStrategy
PerformancePerformance
Corporate GovernanceCorporate Governance
Financial ReportsFinancial Reports
Supplementary InformationSupplementary Information
An
nu
al
Re
po
rt
20
1820
Board of Directors
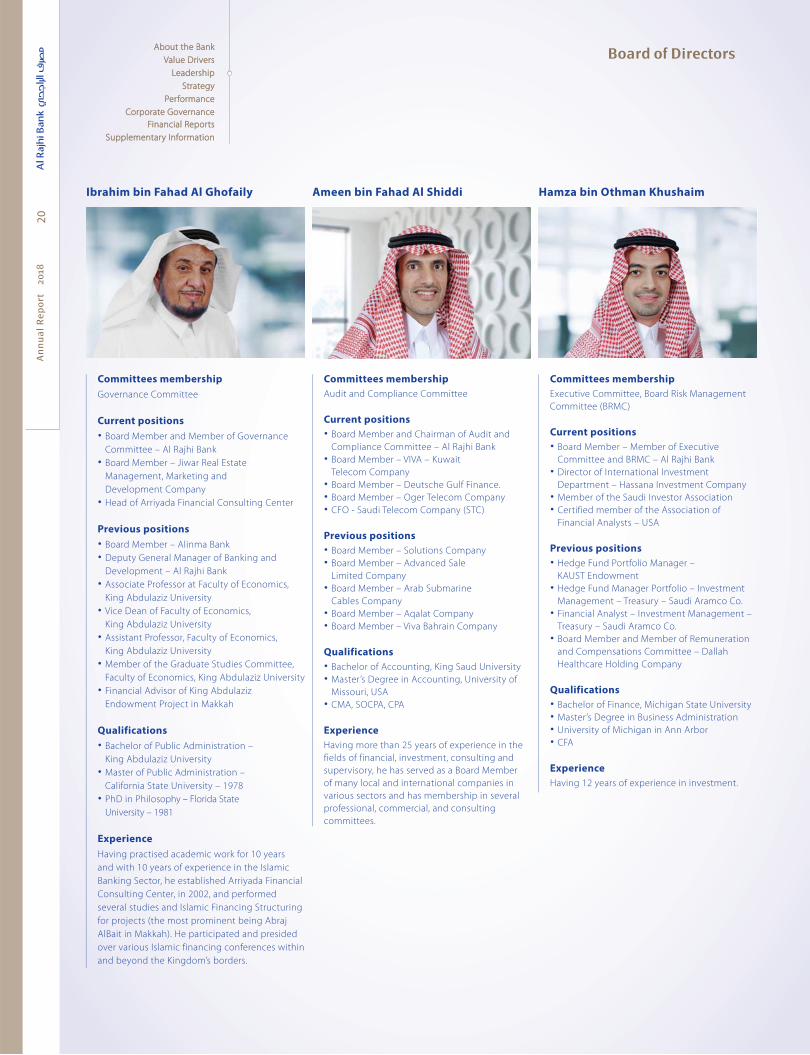
Ibrahim bin Fahad Al Ghofaily Ameen bin Fahad Al Shiddi Hamza bin Othman Khushaim
Committees membership
Governance Committee
Current positions
Board Member and Member of Governance
Committee – Al Rajhi Bank
Board Member – Jiwar Real Estate
Management, Marketing and
Development Company
Head of Arriyada Financial Consulting Center
Previous positions
Board Member – Alinma Bank
Deputy General Manager of Banking and
Development – Al Rajhi Bank
Associate Professor at Faculty of Economics,
King Abdulaziz University
Vice Dean of Faculty of Economics,
King Abdulaziz University
Assistant Professor, Faculty of Economics,
King Abdulaziz University
Member of the Graduate Studies Committee,
Faculty of Economics, King Abdulaziz University
Financial Advisor of King Abdulaziz
Endowment Project in Makkah
Qualifications
Bachelor of Public Administration –
King Abdulaziz University
Master of Public Administration –
California State University – 1978
PhD in Philosophy – Florida State
University – 1981
Experience
Having practised academic work for 10 years
and with 10 years of experience in the Islamic
Banking Sector, he established Arriyada Financial
Consulting Center, in 2002, and performed
several studies and Islamic Financing Structuring
for projects (the most prominent being Abraj
AlBait in Makkah). He participated and presided
over various Islamic financing conferences within
and beyond the Kingdom’s borders.
Committees membership
Audit and Compliance Committee
Current positions
Board Member and Chairman of Audit and
Compliance Committee – Al Rajhi Bank
Board Member – VIVA – Kuwait
Telecom Company
Board Member – Deutsche Gulf Finance.
Board Member – Oger Telecom Company
CFO - Saudi Telecom Company (STC)
Previous positions
Board Member – Solutions Company
Board Member – Advanced Sale
Limited Company
Board Member – Arab Submarine
Cables Company
Board Member – Aqalat Company
Board Member – Viva Bahrain Company
Qualifications
Bachelor of Accounting, King Saud University
Master’s Degree in Accounting, University of
Missouri, USA
CMA, SOCPA, CPA
Experience
Having more than 25 years of experience in the
fields of financial, investment, consulting and
supervisory, he has served as a Board Member
of many local and international companies in
various sectors and has membership in several
professional, commercial, and consulting
committees.
Committees membership
Executive Committee, Board Risk Management
Committee (BRMC)
Current positions
Board Member – Member of Executive
Committee and BRMC – Al Rajhi Bank
Director of International Investment
Department – Hassana Investment Company
Member of the Saudi Investor Association
Certified member of the Association of
Financial Analysts – USA
Previous positions
Hedge Fund Portfolio Manager –
KAUST Endowment
Hedge Fund Manager Portfolio – Investment
Management – Treasury – Saudi Aramco Co.
Financial Analyst – Investment Management –
Treasury – Saudi Aramco Co.
Board Member and Member of Remuneration
and Compensations Committee – Dallah
Healthcare Holding Company
Qualifications
Bachelor of Finance, Michigan State University
Master’s Degree in Business Administration
University of Michigan in Ann Arbor
CFA
Experience
Having 12 years of experience in investment.
About the BankAbout the Bank
Value DriversValue Drivers
LeadershipLeadership
StrategyStrategy
PerformancePerformance
Corporate GovernanceCorporate Governance
Financial ReportsFinancial Reports
Supplementary InformationSupplementary Information
An
nu
al
Re
po
rt
20
1821
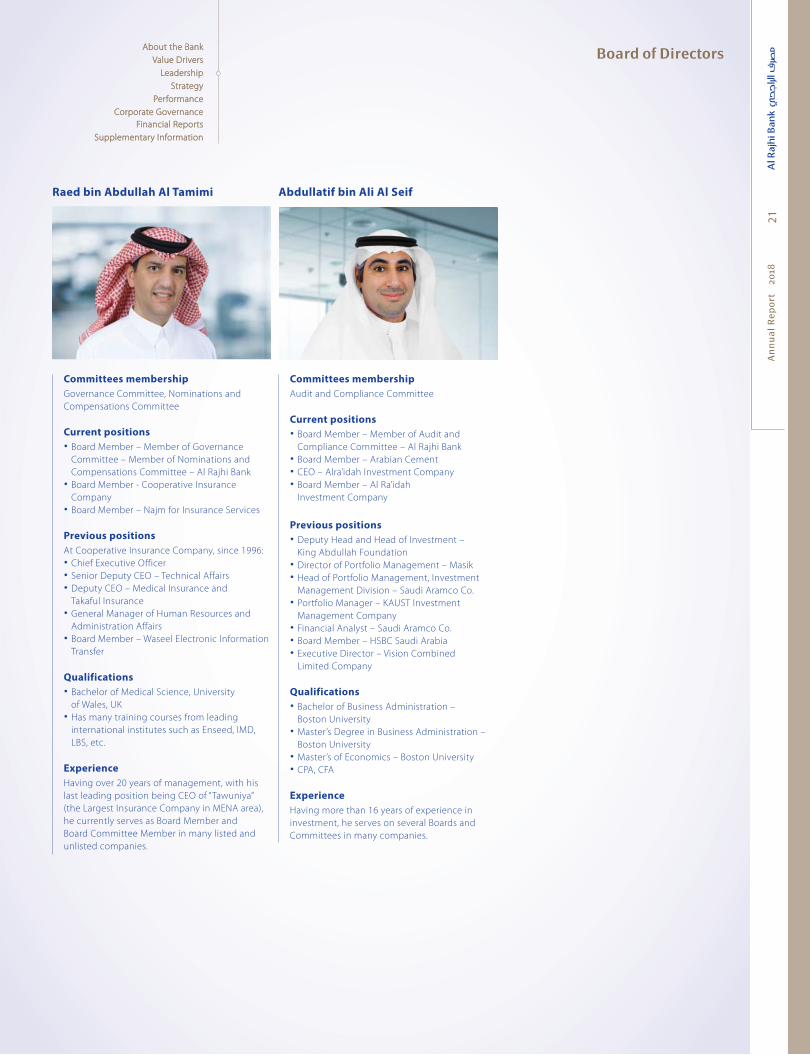
Board of Directors
Raed bin Abdullah Al Tamimi Abdullatif bin Ali Al Seif
Committees membership
Governance Committee, Nominations and
Compensations Committee
Current positions
Board Member – Member of Governance
Committee – Member of Nominations and
Compensations Committee – Al Rajhi Bank
Board Member - Cooperative Insurance
Company
Board Member – Najm for Insurance Services
Previous positions
At Cooperative Insurance Company, since 1996:
Chief Executive Officer
Senior Deputy CEO – Technical Affairs
Deputy CEO – Medical Insurance and
Takaful Insurance
General Manager of Human Resources and
Administration Affairs
Board Member – Waseel Electronic Information
Transfer
Qualifications
Bachelor of Medical Science, University
of Wales, UK
Has many training courses from leading
international institutes such as Enseed, IMD,
LBS, etc.
Experience
Having over 20 years of management, with his
last leading position being CEO of “Tawuniya”
(the Largest Insurance Company in MENA area),
he currently serves as Board Member and
Board Committee Member in many listed and
unlisted companies.
Committees membership
Audit and Compliance Committee
Current positions
Board Member – Member of Audit and
Compliance Committee – Al Rajhi Bank
Board Member – Arabian Cement
CEO – Alra’idah Investment Company
Board Member – Al Ra’idah
Investment Company
Previous positions
Deputy Head and Head of Investment –
King Abdullah Foundation
Director of Portfolio Management – Masik
Head of Portfolio Management, Investment
Management Division – Saudi Aramco Co.
Portfolio Manager – KAUST Investment
Management Company
Financial Analyst – Saudi Aramco Co.
Board Member – HSBC Saudi Arabia
Executive Director – Vision Combined
Limited Company
Qualifications
Bachelor of Business Administration –
Boston University
Master’s Degree in Business Administration –
Boston University
Master’s of Economics – Boston University
CPA, CFA
Experience
Having more than 16 years of experience in
investment, he serves on several Boards and
Committees in many companies.
About the BankAbout the Bank
Value DriversValue Drivers
LeadershipLeadership
StrategyStrategy
PerformancePerformance
Corporate GovernanceCorporate Governance
Financial ReportsFinancial Reports
Supplementary InformationSupplementary Information

An
nu
al
Re
po
rt
20
1822
Executive Management
Stefano Paolo Bertamini Waleed Abdullah Almogbel Abdullah Ali Alkhalifa Christopher Macleen
Current positions
Chief Executive Officer
Current positions
Deputy Chief Executive Officer
Current positions
Chief Financial Officer
Current positions
Chief Risk Officer
Previous positions
Chief Executive officer
(Standard Chartered Bank)
Previous positions
Chief Operating Officer (ARB)
Previous positions
Chief Financial Officer (ANB)
Previous positions
Chief Risk Officer (West Bank)
Qualifications
Master’s Degree – Finance and
International Banking Business
Qualifications
PhD – Accounting and Auditing
Qualifications
Master’s Degree –
Accounting
Qualifications
Bachelor’s Degree –
Accounting
Experience
32 years
Experience
21 years
Experience
28 years
Experience
35 years
Khalid Fahad Alhozaim Omar Mohammad Almudarra Abdulaziz M Al-Shushan Saleh Abdullah Allheidan
Current positions
Chief Human Resources Officer
Current positions
Chief Governance and Legal Officer
Current positions
Chief Internal Audit
Current positions
General Manager – Sharia
Previous positions
General Manager –
Human Resources (Acting) (ARB)
Previous positions
General Manager – Head of Legal –
SAMBA Financial Group
Previous positions
Executive Director (Head of Internal
Audit) ACWA Power
Previous positions
Associate Professor in the High
institute of Judiciary – Al Imam
Mohammed bin Saud Islamic
University
Qualifications
Bachelor’s Degree –
Computer Engineering
Qualifications
Master’s Degree – Law
Qualifications
Executive Master’s Degree –
Business Administration
Qualifications
PhD – in Comparative Fiqh
(Islamic Law)
Experience
19 years
Experience
19 years
Experience
19 years
Experience
33 years
About the BankAbout the Bank
Value DriversValue Drivers
LeadershipLeadership
StrategyStrategy
PerformancePerformance
Corporate GovernanceCorporate Governance
Financial ReportsFinancial Reports
Supplementary InformationSupplementary Information
An
nu
al
Re
po
rt
20
18
Executive Management
23
Saleh Abdullah Alzumaie Majed Abdulrahman Alqwaiz Abdulrahman Abdullah Alfadda Abdullah Sulaiman Alnami
Current positions
General Manager –
Retail Banking Group
Current positions
General Manager –
Corporate Banking Group
Current positions
General Manager –
Treasury and Financial Institutions
Current positions
Chief Compliance Officer
Previous positions
GM RBG (Acting) (ARB)
Previous positions
GM CBS (SABB)
Previous positions
GM Treasury and Investment (SAIB)
Previous positions
Deputy CORO (Riyad Bank)
Qualifications
Bachelor’s Degree –
English Language
Qualifications
Bachelor’s Degree –
Finance Accounting
Qualifications
Bachelor’s Degree –
Electrical Engineering
Qualifications
Master’s Degree –
Management and Business
Experience
28 years
Experience
24 years
Experience
22 years
Experience
24 years
About the BankAbout the Bank
Value DriversValue Drivers
LeadershipLeadership
StrategyStrategy
PerformancePerformance
Corporate GovernanceCorporate Governance
Financial ReportsFinancial Reports
Supplementary InformationSupplementary Information

An
nu
al
Re
po
rt
20
18
Executive Management24
About the BankAbout the Bank
Value DriversValue Drivers
LeadershipLeadership
StrategyStrategy
PerformancePerformance
Corporate GovernanceCorporate Governance
Financial ReportsFinancial Reports
Supplementary InformationSupplementary Information
Number one distribution network in the Middle East in terms of branches,
POS, ATMs and Remittance Centres

An
nu
al
Re
po
rt
20
1825
About the BankAbout the Bank
Value DriversValue Drivers
LeadershipLeadership
StrategyStrategy
PerformancePerformance
Corporate GovernanceCorporate Governance
Financial ReportsFinancial Reports
Supplementary InformationSupplementary Information
25
StrategyStrategic Direction
26
Operating Environment
31
Our Value Creation Model
34
Stakeholders and Materiality
36
Risk Management
38
An
nu
al
Re
po
rt
20
18
An
nu
al
Re
po
rt
20
1826
About the BankAbout the Bank
Value DriversValue Drivers
LeadershipLeadership
StrategyStrategy
PerformancePerformance
Corporate GovernanceCorporate Governance
Financial ReportsFinancial Reports
Supplementary InformationSupplementary Information
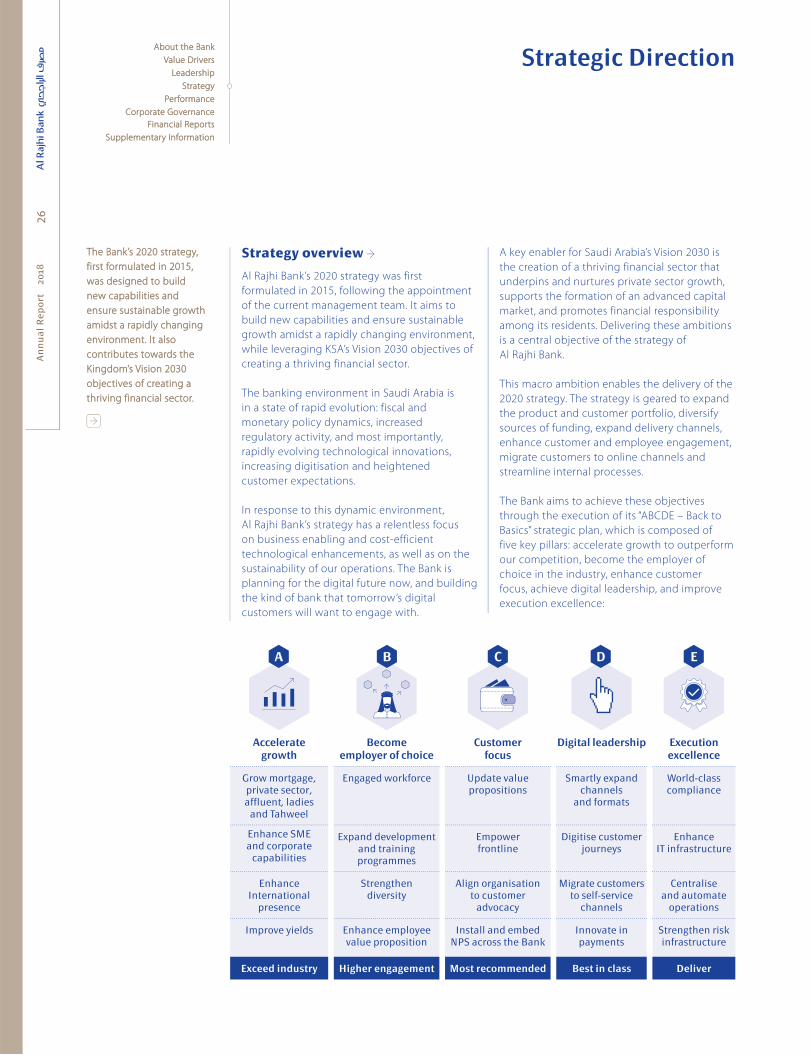
Strategy overview
Al Rajhi Bank’s 2020 strategy was first
formulated in 2015, following the appointment
of the current management team. It aims to
build new capabilities and ensure sustainable
growth amidst a rapidly changing environment,
while leveraging KSA’s Vision 2030 objectives of
creating a thriving financial sector.
The banking environment in Saudi Arabia is
in a state of rapid evolution: fiscal and
monetary policy dynamics, increased
regulatory activity, and most importantly,
rapidly evolving technological innovations,
increasing digitisation and heightened
customer expectations.
In response to this dynamic environment,
Al Rajhi Bank’s strategy has a relentless focus
on business enabling and cost-efficient
technological enhancements, as well as on the
sustainability of our operations. The Bank is
planning for the digital future now, and building
the kind of bank that tomorrow’s digital
customers will want to engage with.
A key enabler for Saudi Arabia’s Vision 2030 is
the creation of a thriving financial sector that
underpins and nurtures private sector growth,
supports the formation of an advanced capital
market, and promotes financial responsibility
among its residents. Delivering these ambitions
is a central objective of the strategy of
Al Rajhi Bank.
This macro ambition enables the delivery of the
2020 strategy. The strategy is geared to expand
the product and customer portfolio, diversify
sources of funding, expand delivery channels,
enhance customer and employee engagement,
migrate customers to online channels and
streamline internal processes.
The Bank aims to achieve these objectives
through the execution of its “ABCDE – Back to
Basics” strategic plan, which is composed of
five key pillars: accelerate growth to outperform
our competition, become the employer of
choice in the industry, enhance customer
focus, achieve digital leadership, and improve
execution excellence:
Strategic Direction
The Bank’s 2020 strategy, The Bank’s 2020 strategy,
first formulated in 2015, first formulated in 2015,
was designed to build was designed to build
new capabilities and new capabilities and
ensure sustainable growth ensure sustainable growth
amidst a rapidly changing amidst a rapidly changing
environment. It also environment. It also
contributes towards the contributes towards the
Kingdom’s Vision 2030 Kingdom’s Vision 2030
objectives of creating a objectives of creating a
thriving financial sector.thriving financial sector.
A B C D E
Accelerate growth
Become employer of choice
Customer focus
Digital leadership Executionexcellence
Grow mortgage, private sector, affluent, ladies
and Tahweel
Engaged workforce Update valuepropositions
Smartly expand channels
and formats
World-classcompliance
Enhance SME and corporate
capabilities
Expand development and training programmes
Empower frontline
Digitise customerjourneys
Enhance IT infrastructure
Enhance International
presence
Strengthen diversity
Align organisation to customer
advocacy
Migrate customers to self-service
channels
Centralise and automate
operations
Improve yields Enhance employee value proposition
Install and embedNPS across the Bank
Innovate in payments
Strengthen riskinfrastructure
Exceed industry Higher engagement Most recommended Best in class Deliver

An
nu
al
Re
po
rt
20
18
Strategic Direction
27
About the BankAbout the Bank
Value DriversValue Drivers
LeadershipLeadership
StrategyStrategy
PerformancePerformance
Corporate GovernanceCorporate Governance
Financial ReportsFinancial Reports
Supplementary InformationSupplementary Information
2018 strategy review Accelerate growth
Several key initiatives are being executed to
accelerate growth ahead of the industry:
Grow the mortgage portfolio
Increase exposure to the private sector
Expand the customer base of female
customers,
Enhance SME and corporate capabilities
Selectively enhance the international
footprint
Improve yields and enhance cross sell
In 2018, the Bank registered meaningful market
share improvements across key product lines
through the introduction of new innovative
products and the selective expansion of its
distribution network.
The mortgage portfolio grew by 27.4% and
our market share grew to 27.9% at end of
2018, compared to 20.6% at the end of 2015.
This was partially driven by the introduction
of new products such as Self Construction, a
financing solution targeting landowners willing
to construct or owners of incomplete properties
looking to complete construction Off Plan, is
another financing solution to fund customers as
they make payments towards the construction
of their residential property currently owned
by a real estate company which will further
accelerate growth in 2019 and beyond.
Al Rajhi Bank has the largest distribution
network in Saudi Arabia with 551 branches,
over 5,000 ATMs, approximately 84 thousand
POS terminals and 236 remittance centres. The
Bank also operates 18 branches in Malaysia,
10 in Jordan and two in Kuwait. Over the past
three years, the Bank also grew its female
customers by 30% with the introduction
of five additional dedicated ladies sections
and branches bringing the total dedicated
sections and branches for ladies to 157, further
cementing the Bank’s distribution network as
the largest in the Kingdom.
The Bank also expanded its corporate and SME
offering, including Islamic FX forwards, Supply
Chain Financing (SCF), facilities that are based
on receivables purchase agreement on behalf of
the Bank’s corporate clients’ suppliers; and POS
Financing, offered to SME customers through
an active point of sale terminal to cover their
short-term and long-term needs.
Sophisticated cash and liquidity management
is crucial for the modern corporate, and Al Rajhi
launched a corporate liquidity management
solution in 2018, providing centralised and
automated cash management for corporate
customers. Additionally, 2018 saw the successful
launch of fully-fledged supply chain finance
solutions (SCF) for its corporate customers.
Al Rajhi Bank is the first bank in the Kingdom
to offer a comprehensive SCF programme with
a wide range of solutions backed by a strong
technological platform available to the entire
value chain of customers, both upstream and
downstream.
The Bank’s focus on the SME sector remained
a key initiative for the year. The Bank merged its
SME business with its retail banking business,
leveraging its retail branch network and
enhancing customer service.
Internationally, 2018 was a year of
advancement: the Bank opened three new
branches in Jordan and one new branch in
Kuwait. In Malaysia performance improved
substantially.
Finally, the Bank has continued to improve
yields during 2018 through effective balance
sheet management in a rising rate environment
and successful growth of 6% in non-profit
bearing deposits, which now comprise 93.6%
of total deposits. As a result, the Bank’s net
profit margin improved by 26 basis points in
2018 to 4.36%.

An
nu
al
Re
po
rt
20
18
Strategic Direction28
Become employer of choice
The Bank’s commitment to remaining the
employer of choice in the industry is a key pillar
of its strategy, and 2018 saw continued efforts
focused on promoting an engaged workforce,
expanding development and training
programmes, strengthening diversity, and
enhancing the employee value proposition.
In November 2018, the Bank moved both its
main office and operations centre to the new
state of the art building in Riyadh.
In 2018, the Bank launched the Al Rajhi Bank
Academy, which includes a School of Banking
providing a series of domain and role specific
certifications as well as running six graduate
development programmes, for students in their
final stages of graduation. The Academy also
launched the School of Leadership. In total,
more than 65,000 training days were delivered
in 2018.
With the aim to strengthen diversity and grow
the number of female employees, the Bank
launched the first dedicated female graduate
development programme and introduced
a nursery allowance programme for female
employees during 2018. The percentage of
female employees grew by 6.2% in 2018, and
today women represent approximately 14%
of the total Bank’s employee workforce.
Customer focus
With the ambition to be recognised as the most
recommended bank in Saudi Arabia, strong
focus is placed on customer advocacy while
embedding improvement in Net Promoter
Score (NPS) into our balanced scorecards. In
2018, the Bank became the number two bank
in the country based on NPS versus the number
seven bank position in 2015.
Through the use of digital advancements and
ongoing agent training and development,
the Bank has further improved customer
experiences to better address customer needs.
During 2018, the Bank registered 10% growth
in its NPS score, a biannual external study is
commissioned by the Bank to measure progress
relative to competition. We measure how
satisfied and likely a customer is to promote the
Bank to other friends and colleagues.
Net Promoter Score (NPS)
%
100
80
60
40
20
0
Base
2015
3,554
14%
4,587
21%
2016 2017
31,058
34%
2018
15,119
42%
Source: Online top down NPS study commissioned by Online top down NPS study commissioned by
Al Rajhi Bank data collection period end September 2018.Al Rajhi Bank data collection period end September 2018.
Detractors Passive Promoters
About the BankAbout the Bank
Value DriversValue Drivers
LeadershipLeadership
StrategyStrategy
PerformancePerformance
Corporate GovernanceCorporate Governance
Financial ReportsFinancial Reports
Supplementary InformationSupplementary Information

An
nu
al
Re
po
rt
20
18
Strategic Direction
29
Digital Leadership
The banking industry is transforming into a
digital industry, and Al Rajhi is at the forefront
of this change. The Bank is committed to being
the pioneer in digital banking by capitalising on
the latest technologies to provide customers
with the highest quality services. In this regard,
the Bank remains focused on smartly expanding
channels, digitising customer journeys,
migrating customers to self-service channels,
and exploring innovations in payment methods.
As part of this ongoing digital transformation
journey, the Bank continues to accelerate its
focus on mobile banking enhancements and
customer journeys to both further grow its
digital footprint and enhance the customer
experience. Today 56% of customer transactions
are performed digitally. In addition, the number
of active retail users of the Bank’s “Al Mubashar”
online platform grew by 64% during 2018 to
3.6 Mn., while active corporate users grew
by 12.8% to almost 40,000. The integration
of WhatsApp and Apple Pay with the Bank’s
mobile application is one of the many
innovations in 2018 that have enhanced
customer experience and ease of use.
Other digital initiatives during 2018 included:
new self-service kiosks were rolled-out and
installed across remittance centres, a trial of
artificial intelligence and voice recognition
technologies was implemented across customer
call centres. Robotics was further expanded to
improve efficiency of back office transactions,
secure cross-border money transfers using
Ripple Blockchain technology were conducted
with other financial institutions. We will
continue to explore innovative opportunities
and partnerships in the fintech industry in 2019
and beyond.
Execution Excellence
Execution excellence is a key enabler of the
Bank, helping it deliver a strong performance
to meet its operational objectives. It also helps
achieve world-class compliance, enhanced
IT infrastructure, automated operations and
strengthened risk infrastructure.
We are one of the largest users of robotics in
the Middle East. We have 253 bots processing
around 22,000 transactions daily. This has
significantly improved our processing leading
to a much faster turnaround time and a better
customer journey.
During 2018, the Bank finalised the construction
of its Tier 4 data centre, granting the Bank the
recognition of being the first bank in the GCC to
have a Tier 4 certification. Full migration to the
new data centre is scheduled for 2019 which
will provide the Bank with world-class modern
infrastructure ensuring resilient risk, security
and compliance controls.
About the BankAbout the Bank
Value DriversValue Drivers
LeadershipLeadership
StrategyStrategy
PerformancePerformance
Corporate GovernanceCorporate Governance
Financial ReportsFinancial Reports
Supplementary InformationSupplementary Information

An
nu
al
Re
po
rt
20
18
Strategic Direction30
2019 Strategy
The Bank will continue to implement its
ABCDE strategy during 2019 which is based
on adopting artificial intelligence solutions,
automation, block chain, cloud computing,
big data analysis and internet of things
similar to the past three years. It is focused
on continuing to deliver superior returns,
enhanced customer and employee engagement
while accelerating digital execution.
Key strategic focus areas for 2019 include:
Continuing to partner with Fintech companies and expand use of Agile
working teams
Continued growth in mortgage and current
accounts
Enhance cross-sell and fee income streams
Accelerate growth in revolving cards and
E-Commerce
Continued investment in the capabilities of its
people and infrastructure
Further enhance digital offerings and customer
journeys
About the BankAbout the Bank
Value DriversValue Drivers
LeadershipLeadership
StrategyStrategy
PerformancePerformance
Corporate GovernanceCorporate Governance
Financial ReportsFinancial Reports
Supplementary InformationSupplementary Information

An
nu
al
Re
po
rt
20
1831
A true evaluation of the A true evaluation of the
Bank’s performance and value Bank’s performance and value
delivery must, of course, take delivery must, of course, take
into account the sociopolitical into account the sociopolitical
and economic trends within and economic trends within
which it operates. This section which it operates. This section
outlines the main forces that outlines the main forces that
shaped the local, regional, and shaped the local, regional, and
global landscape as well as global landscape as well as
the banking sector in general.the banking sector in general.
Operating Environment
After several years of constrained economic
activity, 2018 marked a return to growth for
Saudi Arabia, driven by a steadily rising oil price
for the first three quarters.
The crude price dynamic supported a host
of positive economic indicators: GDP grew
by 2.2%, up from -0.8% in 2017. Broad money
supply (M3) expanded at 2.8%, up from 0.2%
in 2017. Bank claims on the private sector grew
3.0% year-on-year, recovering from the prior
year contraction of 0.8% and overall credit grew
by 2.8%, up from -1.0% in 2017.
80
60
40
20
0
-20
6.0
4.5
3.0
1.5
0
-1.5
KSA growth vs oil prices
% USD/bbl
The crude price dynamic supported a host of positive The crude price dynamic supported a host of positive
economic indicators.economic indicators.
2015 201920182016 2017
GDP growth, constant prices (%)
Brent crude (USD/bbl)
And against this backdrop, policy rate increases
in the US were mirrored in the Kingdom,
leading average 3M SAIBOR rate to increase
by 60 bps to 2.41%.
4
3
2
1
0
-1
3.00
2.25
1.50
0.75
0
-0.75
Interest rates vs inflation
%
3M SAIBOR (LHS)
Inflation, average consumer prices (RHS)
2015 20182016 2017
But a supportive oil price was not the only
driver of economic growth: the reforms initiated
under the Vision 2030 strategy saw macro
growth mirrored in the real economy: Real
estate lending, retail credit and cards were all
particularly strong.
Also, real estate finance has been doubled
comparing to the past years from SAR 3,993 Mn.
to SAR 8,092 Mn. and auto finance grew 79%
annually compared to -1% in 2017. In addition,
deposits grew 2.6% comparing to 0.1% in 2017.
In these conditions, the banking industry
benefited overall, with the domestic banking
sector posting net profits of SAR 48 Bn., up 10%
from 2017.
About the BankAbout the Bank
Value DriversValue Drivers
LeadershipLeadership
StrategyStrategy
PerformancePerformance
Corporate GovernanceCorporate Governance
Financial ReportsFinancial Reports
Supplementary InformationSupplementary Information
An
nu
al
Re
po
rt
20
18
Operating Environment32
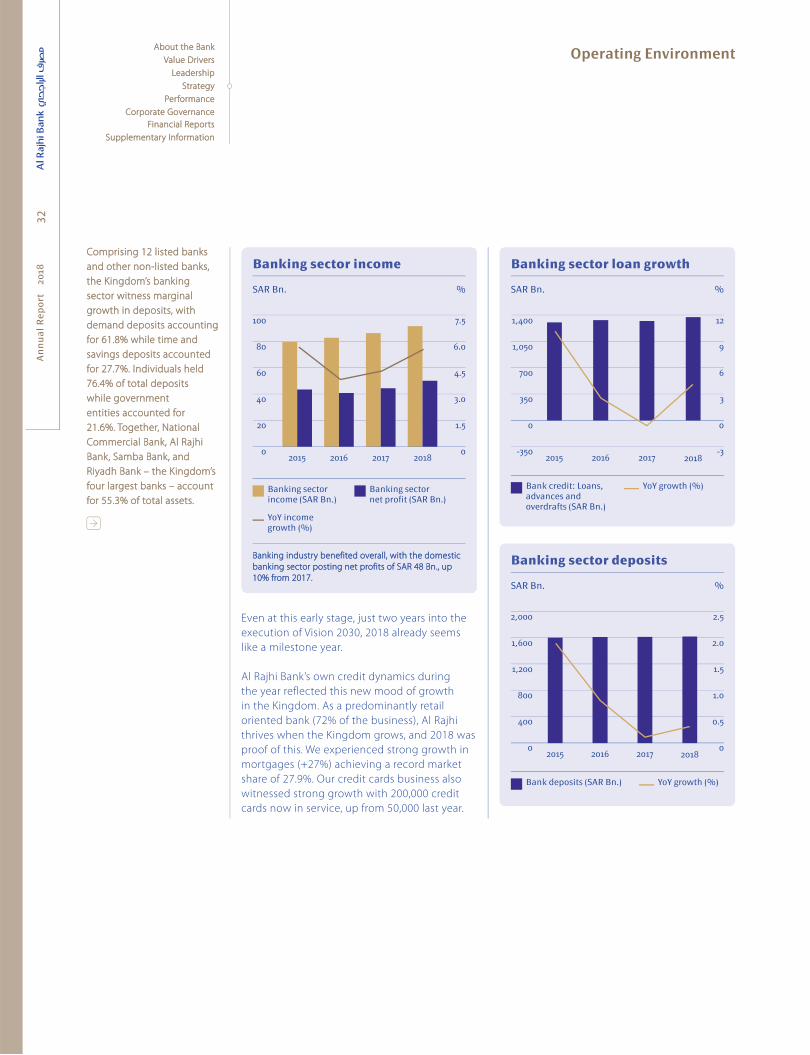
Comprising 12 listed banks Comprising 12 listed banks
and other non-listed banks, and other non-listed banks,
the Kingdom’s banking the Kingdom’s banking
sector witness marginal sector witness marginal
growth in deposits, with growth in deposits, with
demand deposits accounting demand deposits accounting
for 61.8% while time and for 61.8% while time and
savings deposits accounted savings deposits accounted
for 27.7%. Individuals held for 27.7%. Individuals held
76.4% of total deposits 76.4% of total deposits
while government while government
entities accounted for entities accounted for
21.6%. Together, National 21.6%. Together, National
Commercial Bank, Al Rajhi Commercial Bank, Al Rajhi
Bank, Samba Bank, and Bank, Samba Bank, and
Riyadh Bank – the Kingdom’s Riyadh Bank – the Kingdom’s
four largest banks – account four largest banks – account
for 55.3% of total assets. for 55.3% of total assets.
7.5
6.0
4.5
3.0
1.5
0
100
80
60
40
20
0
Banking sector income
SAR Bn. %
2015 2016 2017 2018
Banking industry benefited overall, with the domestic Banking industry benefited overall, with the domestic
banking sector posting net profits of SAR 48 Bn., up banking sector posting net profits of SAR 48 Bn., up
10% from 2017.10% from 2017.
Banking sector income (SAR Bn.)
Banking sector net profit (SAR Bn.)
YoY income growth (%)
12
9
6
3
0
-3
1,400
1,050
700
350
0
-350
Banking sector loan growth
SAR Bn. %
2015 20182016 2017
Bank credit: Loans, advances and overdrafts (SAR Bn.)
YoY growth (%)
2.5
2.0
1.5
1.0
0.5
0
2,000
1,600
1,200
800
400
0
Banking sector deposits
SAR Bn. %
2015 20182016 2017
Bank deposits (SAR Bn.) YoY growth (%)
Even at this early stage, just two years into the
execution of Vision 2030, 2018 already seems
like a milestone year.
Al Rajhi Bank’s own credit dynamics during
the year reflected this new mood of growth
in the Kingdom. As a predominantly retail
oriented bank (72% of the business), Al Rajhi
thrives when the Kingdom grows, and 2018 was
proof of this. We experienced strong growth in
mortgages (+27%) achieving a record market
share of 27.9%. Our credit cards business also
witnessed strong growth with 200,000 credit
cards now in service, up from 50,000 last year.
About the BankAbout the Bank
Value DriversValue Drivers
LeadershipLeadership
StrategyStrategy
PerformancePerformance
Corporate GovernanceCorporate Governance
Financial ReportsFinancial Reports
Supplementary InformationSupplementary Information

An
nu
al
Re
po
rt
20
18
Operating Environment
33
15
12
9
6
3
0
150
120
90
60
30
0
Banking sector mortgage loans
SAR Bn. %
We experienced strong growth in mortgages (+27%) We experienced strong growth in mortgages (+27%)
achieving a record market share of 26.9%.achieving a record market share of 26.9%.
2015 20182016 2017
Mortgage loans by Banks (SAR Bn.)
YoY growth (%)
And this growth was not delivered at a cost to
margin: Partially driven by rate hikes, but also
supported by strong management discipline,
Al Rajhi Bank margins expanded by 26 bps
during the year, to 4.34%.
The banking sector adoption of IFRS 9
accounting standard fundamentally changes
the way banks account for provisions associated
with financing activities. While the settlement
reached between all banks and the General
Authority for Zakat and Tax (GZAT), which will
harmonise the treatment of Zakat for all banks
in future, added to a sense of confidence for
the sector.
In this context, 2018 was a particularly strong
year for Al Rajhi Bank, delivering sector-leading
achievements such as growth in operating
profits, growth in net income, return on equity
and return on assets.
What is particularly gratifying from a
management point of view, though, was
that we did not allow the positive macro-
environment to lead to complacency. On the
contrary, our ongoing ABCDE strategy and focus
on our employees and customers mean that the
Bank has never felt more dynamic.
We delivered 65,000 hours of training to our
staff in 2018, double the 2015 figure. We
continued to improve our customer service,
further accelerated digitisation and product
development. We launched 12 new products
in 2018, including securitisation, supply chain
financing, FX forwards, and point of sale
financing for SMEs.
Our digital leadership is now well established in
the sector due to significant and early adoption
of robotic tools. We have now implemented
253 bots processing over 22,000 transactions
daily. We have focused on improving our
turnaround time and have received Tier 4
certification for our data centre – the first bank
in the Middle East to achieve this.
In summary, all banks in the Kingdom benefited
from macro tailwinds in 2018. Al Rajhi has not
been complacent, and has rigorously pursued
its journey to be The Blue-chip Islamic Bank,
admired for its innovative service, people,
technology and Sharia compliant products,
both locally and internationally with more
vigour than ever.
About the BankAbout the Bank
Value DriversValue Drivers
LeadershipLeadership
StrategyStrategy
PerformancePerformance
Corporate GovernanceCorporate Governance
Financial ReportsFinancial Reports
Supplementary InformationSupplementary Information

An
nu
al
Re
po
rt
20
1834
Our Value Creation Model
As portrayed in the Bank’s business As portrayed in the Bank’s business
model, its inputs (on-balance sheet model, its inputs (on-balance sheet
and off-balance sheet forms of and off-balance sheet forms of
capital), activities, outputs, outcomes capital), activities, outputs, outcomes
and impact are set against the trends and impact are set against the trends
of the operating environment; the of the operating environment; the
Bank’s vision, mission, and values; and Bank’s vision, mission, and values; and
its strategy. The whole is underpinned its strategy. The whole is underpinned
by strong governance practices by strong governance practices
as described in the Management as described in the Management
Discussion and Analysis section, Discussion and Analysis section,
under Governance, Strategy, and under Governance, Strategy, and
Performance on pages 26 to 111. Performance on pages 26 to 111.
The figure illustrates how the The figure illustrates how the
Bank’s inputs feed its activities. Bank’s inputs feed its activities.
These activities can be described as These activities can be described as
enhancements to capitals (such as enhancements to capitals (such as
improved customer products and improved customer products and
services, better quality employee services, better quality employee
development plans, or innovative development plans, or innovative
technological enhancements) which technological enhancements) which
delivered value during the year delivered value during the year
under review. Such activities in turn under review. Such activities in turn
generate outputs. These outputs can generate outputs. These outputs can
be described as the value created be described as the value created
both for the Bank and its stakeholders both for the Bank and its stakeholders
in the short term. The outcomes, such in the short term. The outcomes, such
as (insert example), create value in as (insert example), create value in
the medium term, while the impact the medium term, while the impact
highlights value created in the highlights value created in the
long term.long term.
ActivitiesInputsInputs
Financial capital
Strong book value of the Bank
reflecting profitability and
asset quality
Institutional capital
Cutting edge knowledge-based
intangibles and tangibles owned and
controlled by the Bank
Investor capital
Loyal investor base nurtured and
rewarded through sound governance
and ethical business practices
Customer capital
Trust and loyalty earned by putting
the customer at the heart of all we do
Business partner capital
A bedrock of market confidence and
financial stability through exemplary
stewardship
Employee capital
An innovative team of achievers
driven by a passion to serve
Social and Environmental capital
A license to operate earned through
our contribution towards financial
inclusion aligned with Vision 2030
Operating EnvironmentOperating Environment
StrategyStrategy
Stakeholders and MaterialityStakeholders and Materiality
Vision, Mission and ValuesVision, Mission and Values
ActivitiesActivities
Accelerate growth
Improve portfolios in key
customer segments
Employer of choice
Create a performance-driven culture
where the customer comes first
Customer focus
Provide greater convenience and
security in customer offering
Digital leadership
Expand digital channels and migrate
customers to self-service banking
Execution excellence
Explore and execute measures
to improve operations
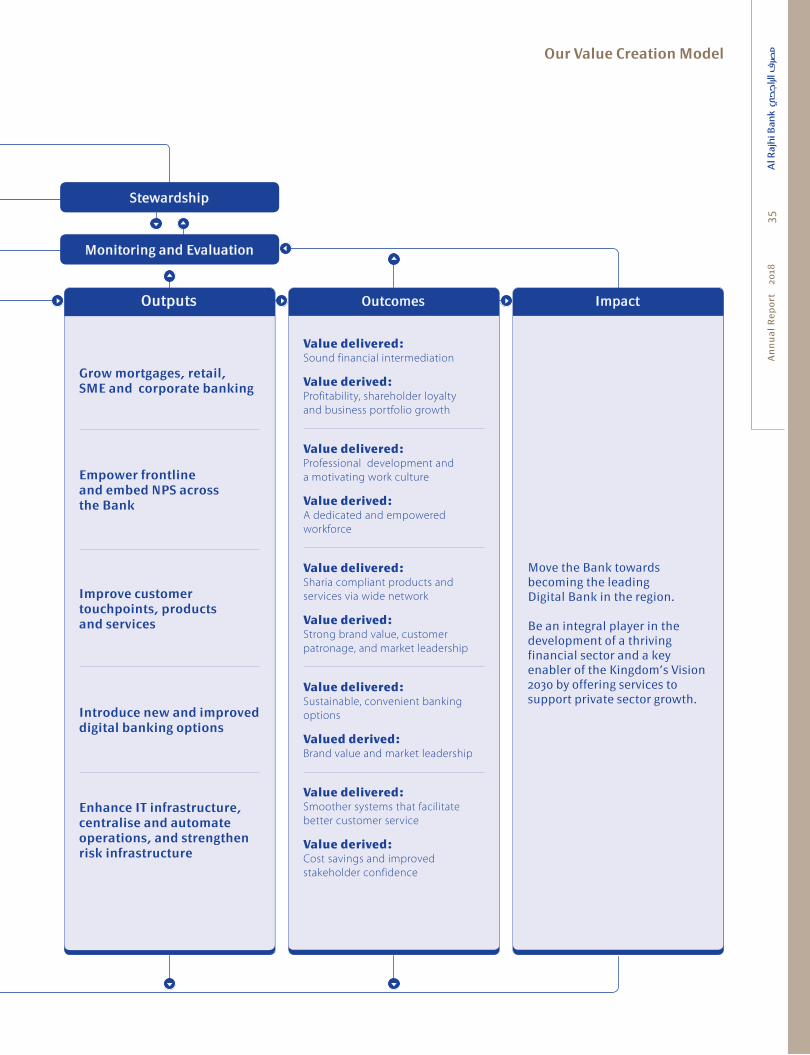
An
nu
al
Re
po
rt
20
18
Our Value Creation Model
35
StewardshipStewardship
Monitoring and EvaluationMonitoring and Evaluation
OutputsOutputs
Grow mortgages, retail, SME and corporate banking
Empower frontline and embed NPS across the Bank
Improve customer touchpoints, products and services
Introduce new and improved digital banking options
Enhance IT infrastructure, centralise and automate operations, and strengthen risk infrastructure
OutcomesOutcomes
Value delivered: Sound financial intermediation
Value derived: Profitability, shareholder loyalty
and business portfolio growth
Value delivered: Professional development and
a motivating work culture
Value derived: A dedicated and empowered
workforce
Value delivered: Sharia compliant products and
services via wide network
Value derived: Strong brand value, customer
patronage, and market leadership
Value delivered: Sustainable, convenient banking
options
Valued derived: Brand value and market leadership
Value delivered: Smoother systems that facilitate
better customer service
Value derived: Cost savings and improved
stakeholder confidence
ImpactImpact
Move the Bank towards becoming the leading Digital Bank in the region.
Be an integral player in the development of a thriving financial sector and a key enabler of the Kingdom’s Vision 2030 by offering services to support private sector growth.

An
nu
al
Re
po
rt
20
1836
We consider as stakeholders We consider as stakeholders
those individuals or entities those individuals or entities
who are materially impacted who are materially impacted
by the Bank’s activities or by the Bank’s activities or
those who have the ability to those who have the ability to
make an impact on the Bank make an impact on the Bank
by their actions, opinions, by their actions, opinions,
attitudes, or perceptions.attitudes, or perceptions.
Key ARB stakeholder groups
TheEnvironment Customers
Society and Local Communities
Government Authorities
Regulators
Investors
Key ARB stakeholder
groups
Business Partners
Employees
Stakeholder engagement
Given the significant impact that the perceptions and behaviour of our stakeholders can have on the
Bank’s ability to conduct its business and meet its strategic goals, and also the Bank’s own capacity to
impact its stakeholders, it is vital for us to identify and communicate effectively with them.
Stakeholders and MaterialityAbout the BankAbout the Bank
Value DriversValue Drivers
LeadershipLeadership
StrategyStrategy
PerformancePerformance
Corporate GovernanceCorporate Governance
Financial ReportsFinancial Reports
Supplementary InformationSupplementary Information

An
nu
al
Re
po
rt
20
18
Stakeholders and Materiality
37
By connecting with our By connecting with our
stakeholders we are able stakeholders we are able
to understand their needs to understand their needs
better and address any better and address any
concerns they may have. concerns they may have.
We are also then able to We are also then able to
balance the distribution of balance the distribution of
value created and better value created and better
prepare ourselves for any prepare ourselves for any
challenges that the future challenges that the future
may bring.may bring.
The Bank utilises the following methods of engagement for its key stakeholder groups.
Principal means of engagement Subjects of engagement
Investors
General Assembly Meeting
Extraordinary General Meetings
Interim financial statements
Annual report
Investor presentations
Press releases
Announcements made on the
Saudi Stock Exchange and
the Bank's corporate website
Investor conferences
Strategy
Financial statements of the Bank
and the Group plans, prospects,
and forecasts
Shareholder returns
Governance
Risk management
Customers
Branches
Service centres
ATM network
Online banking
Corporate website
Print and electronic media
Social media
Customer satisfaction surveys
Customer visits
Net Promoter Score (NPS)
Price
Ease of access
User-friendliness
Banking hours
Specialised needs
Employees
Induction programmes
Development of key performance
indicators (KPIs)
Individual career development plans
Meetings
Staff societies and volunteerism
Performance standards
Career plans
Training and development
Corporate values
Corporate strategies and plans
Trends in banking
Saudisation
Remuneration and benefits
CSR programmes
Society and environment
Education
Youth and employment
Microfinance for women
Programmes for SMEs
Assistance to needy and vulnerable
Financial inclusion
Affordable financing for disadvantaged
segments and community
empowerment
Assistance for disadvantaged
and vulnerable groups
Materiality
Material topics are those that significantly affect the Bank’s ability to create value over the short,
medium and long term, having a significant impact on the opinions, attitudes, and perceptions
of stakeholders. Material topics are defined by their relevance and significance, where the latter
is a function of the magnitude of their impact and the probability of occurrence. The materiality
assessment is conducted in light of the Bank’s value creation process, corporate planning exercise,
emerging global and local trends, and feedback from its many stakeholder engagement mechanisms.
About the BankAbout the Bank
Value DriversValue Drivers
LeadershipLeadership
StrategyStrategy
PerformancePerformance
Corporate GovernanceCorporate Governance
Financial ReportsFinancial Reports
Supplementary InformationSupplementary Information
An
nu
al
Re
po
rt
20
1838 Credit risk
The most common risk for the Bank and the
Group is financial loss due to a counterparty
failing to meet the terms of an obligation to a
transaction. Key sources of credit risk include
credit facilities provided to customers, cash
and deposits held with other banks, and
some off balance sheet financial instruments
such as guarantees relating to purchase and
sale of foreign currencies or letters of credit.
Using quantitative and qualitative aspects
we systematically evaluate a customer’s
creditworthiness. This helps us to maintain a
robust loan portfolio. The Bank is also able to
take remedial measures by conducting periodic
loan reviews that are geared to detect any
weaknesses in the quality of the portfolio.
Liquidity risk
When the Bank is unable to meet its
financial liabilities when they fall due or
replace withdrawn funds without incurring
unacceptable losses, this is termed liquidity
risk. Such a risk would invariably strike a serious
blow to the Bank’s reputation and its ability to
do business going forward. Since the ability
to accurately forecast cash flows and cash
equivalents is crucial to the Bank’s ability to
manage such a risk, they are carried out on the
basis of practice and limits set by the Group and
historical deposit movement.
The Bank’s liquidity is also affected by market
disruptions and credit downgrades. For this
reason, assets are managed judiciously with a
conservative balance of cash, cash equivalents
and other assets maintained at all times. To
further mitigate this risk the Bank focuses on
diversifying its sources of funding.
Market risk
Risks related to currency, profit rate and price
are classed as market risk. They occur when
the fair value or future cash flows of a financial
instrument fluctuate due to changes in market
prices. Profit rate products, foreign currency,
and mutual fund products are all exposed
to general and specific market movements.
As a result, changes in the level of volatility
of market rates or prices such as profit rates,
foreign exchange rates, and quoted market
prices, can impact the performance of the Bank.
Being Sharia compliant means that the Bank is
immune from risks resulting from speculative
operations such as hedging, options, forward
contracts, and derivatives. The Group is not
immune to market risks such as profit rate risk,
foreign currency risk, price risk and operational
risk. Please refer Note 27.3 to the Consolidated
Financial Statements for a detailed discussion.
Operational risk
Operational risk scenarios are more or less
idiosyncratic in nature and generally attributed
to inadequate or failed internal systems and
processes, human actions and/or external events.
During the year under review, the aggregated
results of such stresses indicated manageable
levels of risk while high risk levels were never
breached. This demonstrates the Bank’s overall
resilience and the success of its integrated
approach to the identification, measurement
and monitoring of operational risk.
Concentration risk
If the Bank’s area of business was limited to
one location or its customers to a single type,
it would be at greater risk from the slightest
shocks to its operating environment. Instead,
the Bank is geographically diversified and
counts on the loyalty and patronage of a
varied customer base which spans industries,
countries, and wallet-size. Such diversity
mitigates concentration risk by providing
greater stability in the face of external impacts.
Risk management practices
The role of the Board Risk Management
Committee (BRMC) is to support the Board
of Directors in their role of overseeing the
Bank’s performance in line with the Bank’s
risk appetite. The risk management function
operates within the regulatory framework
set out by the Saudi Arabian Monetary
Authority (SAMA).
The Bank’s Internal Capital Adequacy
Assessment Process (ICAAP) covers the Bank’s
risk management framework, detailing its
risk appetite, risk management approach,
and primary risk controls. Reviewed by the
BRMC and approved by the Board, the ICAAP
is submitted to SAMA on an annual basis.
Similarly, the BRMC reviews and provides
recommendations on the Internal Liquidity
Adequacy Assessment Plan (ILAAP). These are
Risk Management
Operating in a highly Operating in a highly
competitive and dynamic competitive and dynamic
environment, the Bank environment, the Bank
focused on managing a focused on managing a
range of risks during the year range of risks during the year
under review.under review.
About the BankAbout the Bank
Value DriversValue Drivers
LeadershipLeadership
StrategyStrategy
PerformancePerformance
Corporate GovernanceCorporate Governance
Financial ReportsFinancial Reports
Supplementary InformationSupplementary Information
An
nu
al
Re
po
rt
20
18
Risk Management
39submitted to the Board and, upon approval, are
submitted to SAMA annually.
Crucial to the Bank’s management of risk across
its operations is the role of the Credit and
Risk Group headed by the Chief Risk Officer.
Covering credit risk management, operational
risk management and enterprise risk
management, this team works within the risk
frameworks and policies approved by the Board
of Directors. The Group’s reports to the Board of
Directors and related committees span credit
risks and portfolio asset quality, operational
risks, liquidity risks, market risks, reputational
risks, and technology and cyber security risks
among others.
The BRMC also reviews the Credit and
Provisioning Policy, Operational Risk Policies,
Risk Appetite Statements, Market and Liquidity
Risk Policies and Information Security Policy. Its
recommendations are submitted for the Board’s
approval.
The Bank’s liquidity risk is monitored by the
Asset and Liability Committee (ALCO). Their
remit includes day-to-day management of
funds to ensure that funds are available when
necessary to meet commitments; monitoring
liquidity ratios against benchmarks; and
managing the concentration and profile
of debt maturities.
Market risks are regularly monitored by the
Credit Risk Department with reports being sent
to ALCO each month for assessment. ALCO
ensures that risks taken are appropriate but
initiates mitigating action if they are not within
the Bank’s risk appetite.
The diversity of the customer base fortifies
and strengthens the Bank. Having a keen
understanding of different customer
requirements, we segmented this stakeholder
group into three primary segments:
Retail banking customers
Micro customers and Small and Medium Size
Enterprises (MSME)
Corporate banking
This type of segmentation also allows us to
align our value proposition in terms of products,
services, and delivery channels to better cater
to customer needs. Our retail customer-oriented
business model provides a diverse risk profile
that is supplemented by our robust corporate
banking customer base. Our extensive branch
network endears us to our loyal customer base,
generating for us a high level of stable demand
deposits, which in turn has a positive impact on
the Bank’s liquidity.
Supporting our long-term value creation plans,
our risk management practices regulate the
entire customer journey from onboarding to
issuing finances and providing reliable and
relevant products and services.
In line with global standards, the Bank
implemented credit provisioning framework
IFRS 9 and Internal Liquidity Adequacy
Assessment Plan (ILAAP) during the year
under review. It also established Risk Appetite
Statements at business line level, foreign branch
level and subsidiary level. In 2019, the Bank
will focus on enhancing its credit delivery and
management processes and further improving
the robustness of its information security and
disaster recovery infrastructure.
Credit rating
The Bank must manage risks The Bank must manage risks
with prudence combined with prudence combined
with pragmatism in order to with pragmatism in order to
remain profitable. To do so remain profitable. To do so
it has to accurately identify it has to accurately identify
potential risks and the potential risks and the
impact of such risks on the impact of such risks on the
Bank’s value creation process. Bank’s value creation process.
This involves establishing risk This involves establishing risk
thresholds which are derived thresholds which are derived
from the Bank’s risk appetite. from the Bank’s risk appetite.
The policies and procedures The policies and procedures
set up by the Bank help set up by the Bank help
identify and analyse identify and analyse
relevant risks, manage relevant risks, manage
its capital effectively and its capital effectively and
provide shareholders with provide shareholders with
sustainable returns.sustainable returns.
Rating agency Long term Short term
S&P BBB+ A-2
Fitch A- F1
Moody’s A1 P-1
Capital Intelligence A+ A1
Receiving positive credit ratings from
international rating agencies over consecutive
years has been favourable for the Bank’s
reputation. The year under review was no
different (except for one notch downgrading
of Fitch’s rating from A to A-. Moody’s and
S&P maintained their ratings at A1 and BBB+
respectively).
Looking ahead
Expanding its core customer segments
of retail, corporate, and SME in line with
world-class risk management practices,
regulatory standards, international standards,
and best practices continues to be a core focus
for the Bank.
About the BankAbout the Bank
Value DriversValue Drivers
LeadershipLeadership
StrategyStrategy
PerformancePerformance
Corporate GovernanceCorporate Governance
Financial ReportsFinancial Reports
Supplementary InformationSupplementary Information

An
nu
al
Re
po
rt
20
18
Risk Management40
About the BankAbout the Bank
Value DriversValue Drivers
LeadershipLeadership
StrategyStrategy
PerformancePerformance
Corporate GovernanceCorporate Governance
Financial ReportsFinancial Reports
Supplementary InformationSupplementary Information
Number one retail bank in the Middle East by retail deposits and income

An
nu
al
Re
po
rt
20
18
Risk Management
41
About the BankAbout the Bank
Value DriversValue Drivers
LeadershipLeadership
StrategyStrategy
PerformancePerformance
Corporate GovernanceCorporate Governance
Financial ReportsFinancial Reports
Supplementary InformationSupplementary Information
PerformanceFinancial Review
42
Investor Relations
52
Digital Footprint
54
Sharia Group
57
Review of Business Portfolio
59
Review of Other Operations
69
Review of Subsidiaries and International Branches
83
An
nu
al
Re
po
rt
20
1841

An
nu
al
Re
po
rt
20
1842
Financial Review
Income statement
Al Rajhi Bank reported net income of SAR 10,297 Mn. for the full year 2018, reflecting strong
momentum in the delivery of the strategy, and resulting in improved financial metrics.
Bank achieved improved Bank achieved improved
performance during the performance during the
fiscal year 2018, recording fiscal year 2018, recording
growth in most of the key growth in most of the key
performance indicators.performance indicators.
Operating income
Total operating income for 2018 reached
SAR 17,320 Mn., 8.9% higher than in 2017,
reflecting strength across the board in all our
main businesses.
Net financing and investment income totalled
SAR 13,253 Mn., up 10.2% year-on-year. This
was driven by a widening of the financing and
investment margin, which reached 4.34%, as
policy rates increased and our funding platform
continued to deliver a world-class funding mix
at the lowest industry cost.
Fees and other income grew 4.9% to
SAR 4,067 Mn. as strong growth in Treasury
and Al Rajhi Capital offset a more competitive
fee environment in the Retail and Corporate
segments.
Exchange income was SAR 755.8 Mn., down
from SAR 841.8 Mn. in 2017, reflecting a
more volatile market environment, while
other income was SAR 209.7 Mn., down
from SAR 336.4 Mn. last year, due to some
non-recurring items.
FY 2018SAR Mn.
FY 2017
SAR Mn.
YoY
%
Net financing and investment income 13,253 12,029 +10.2
Fees and other income 4,067 3,875 +4.9
Total operating income 17,320 15,905 +8.9
Operating expenses (5,492) (5,237) +4.9
Total impairment charge (1,531) (1,548) -1.1
Net income for the period 10,297 9,121 +12.9
Earnings per share (SAR) 6.34 5.61 +13
Dividends per share (SAR) 4.25 4.00 +6
Return on equity (%) 19.8 17.2 +15
Return on assets (%) 2.9 2.7 +10
Net financing and investment margin (%) 4.34 4.08 +6
Cost to income ratio (%) 31.7 32.9 -4
Cost of risk (%) 0.63 0.66 -3
About the BankAbout the Bank
Value DriversValue Drivers
LeadershipLeadership
StrategyStrategy
PerformancePerformance
Corporate GovernanceCorporate Governance
Financial ReportsFinancial Reports
Supplementary InformationSupplementary Information

An
nu
al
Re
po
rt
20
18
Financial Review
43
About the BankAbout the Bank
Value DriversValue Drivers
LeadershipLeadership
StrategyStrategy
PerformancePerformance
Corporate GovernanceCorporate Governance
Financial ReportsFinancial Reports
Supplementary InformationSupplementary Information
Financial results comparison
Description 2018SAR Mn.
2017
SAR Mn.
2016
SAR Mn.
2015
SAR Mn.
2014
SAR Mn.
Total operating income 17,320 15,905 15,341 13,746 13,667
Operating expenses 5,492 5,237 5,007 4,658 4,519
Net income for the period 10,297 9,121 8,126 7,130 6,836
Operating expenses
Total operating expenses for the year increased by 4.9% to reach SAR 5,492 Mn., largely reflecting the
ongoing investment in our digital capabilities, as well as the introduction of VAT.
The cost-to-income ratio of 31.7% for the year represents a 120 basis point improvement against 2017.
Discrepancies in operational results for the previous year results:
Description 2018
SAR Mn.
2017
SAR Mn.
Change
(+) or (-)
SAR Mn.
Change
%
Total operating income 17,320 15,905 1,415 8.89
Operating expenses 5,492 5,237 255 4.87
Net income for the period 10,297 9,121 1,176 12.90
Impairment charges
Total impairment charges for the year were 1.1% lower than in 2017 at SAR 1,531 Mn. The cost of risk
was 0.63% against 0.66% last year.

An
nu
al
Re
po
rt
20
18
Financial Review44 Balance sheet
Total assets grew by 6.4% year-on-year as the Bank was able to offset a relatively flat financing
landscape by optimising the balance sheet through a reduction of cash balances, and greater
investments in securities and in the interbank market.
FY 2018SAR Mn.
FY 2017
SAR Mn.
YoY
%
Cash and balances with SAMA and other central banks 43,246 48,282 -10.4
Due from banks and other financial Institutions 30,808 10,710 +187.7
Investments, net 43,063 36,401 +18.3
Financing, net 234,063 233,536 +0.2
Total assets 365,004 343,117 +6.4
Due to banks and other financial institutions 7,290 5,523 +32.0
Customers’ deposits 293,909 273,056 +7.6
Total liabilities 316,450 287,366 +10.1
Total shareholders’ equity 48,554 55,751 -12.9
Risk weighted assets 254,506 251,115 +1
Tier 1 capital ratio (%) 19.1 22.2 -14
Total capital adequacy ratio (%) 20.2 23.3 -13
Liquidity coverage ratio (LCR) (%) 196 199 -1
Basel III leverage ratio (%) 12.9 15.7 -18
Financing to customer deposits ratio (%) 80.8 85.5 -6
Non-performing financing ratio (%) 0.95 0.74 +28
Non-performing financing coverage ratio (%) 341.98 313.82 +9
Assets and liabilities comparison
Description 2018SAR ’000
2017
SAR ’000
2016
SAR ’000
2015
SAR ’000
2014
SAR ’000
Cash in SAMA and
other central banks 43,246,043 48,282,471 42,149,905 27,053,716 33,585,377
Dues from banks and
other financial institutions 30,808,011 10,709,795 26,578,525 26,911,056 16,516,208
Investments, net 43,062,565 36,401,092 34,032,879 39,876,864 42,549,623
Financing, net 234,062,789 233,535,573 224,994,124 210,217,868 205,939,960
Property and equipment, net 8,897,587 7,858,127 6,485,162 5,578,931 4,813,941
Investment properties, net 1,297,590 1,314,006 1,330,868 1,350,000 –
Other assets, net 3,629,245 5,015,464 4,140,354 4,631,213 4,306,446
Total assets 365,003,830 343,116,528 339,711,817 315,619,648 307,711,555
Dues to banks and other
financial institutions 7,289,624 5,522,567 8,916,970 4,558,224 2,135,237
Customers’ deposits 293,909,125 273,056,445 272,593,136 257,821,641 256,077,047
Other liabilities 15,251,063 8,786,598 6,254,839 6,600,729 7,603,077
Total liabilities 316,449,812 287,365,610 287,764,945 268,980,594 265,815,361Total shareholders’ equity
About the BankAbout the Bank
Value DriversValue Drivers
LeadershipLeadership
StrategyStrategy
PerformancePerformance
Corporate GovernanceCorporate Governance
Financial ReportsFinancial Reports
Supplementary InformationSupplementary Information
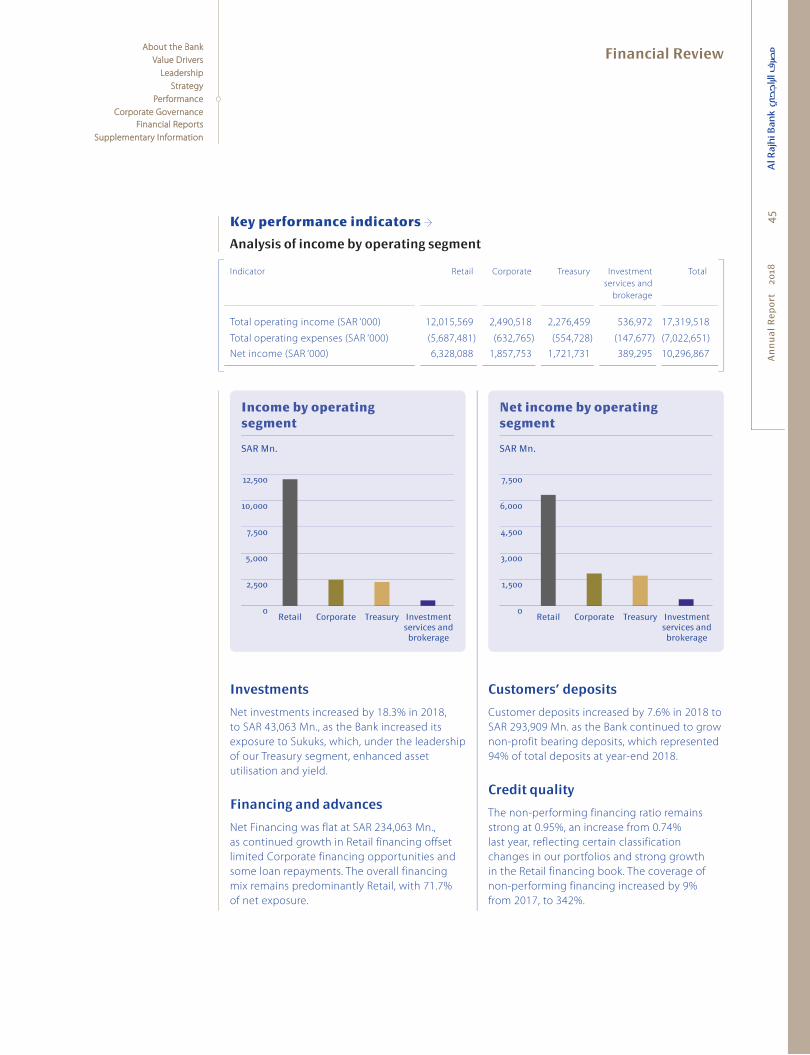
An
nu
al
Re
po
rt
20
18
Financial Review
45Key performance indicators
Analysis of income by operating segment
Indicator Retail Corporate Treasury Investment
services and
brokerage
Total
Total operating income (SAR ‘000) 12,015,569 2,490,518 2,276,459 536,972 17,319,518
Total operating expenses (SAR ‘000) (5,687,481) (632,765) (554,728) (147,677) (7,022,651)
Net income (SAR ‘000) 6,328,088 1,857,753 1,721,731 389,295 10,296,867
12,500
10,000
7,500
5,000
2,500
0Retail Investment
services and brokerage
Corporate Treasury
Income by operating segment
SAR Mn.
7,500
6,000
4,500
3,000
1,500
0Retail Investment
services and brokerage
Corporate Treasury
Net income by operating segment
SAR Mn.
Investments
Net investments increased by 18.3% in 2018,
to SAR 43,063 Mn., as the Bank increased its
exposure to Sukuks, which, under the leadership
of our Treasury segment, enhanced asset
utilisation and yield.
Financing and advances
Net Financing was flat at SAR 234,063 Mn.,
as continued growth in Retail financing offset
limited Corporate financing opportunities and
some loan repayments. The overall financing
mix remains predominantly Retail, with 71.7%
of net exposure.
Customers’ deposits
Customer deposits increased by 7.6% in 2018 to
SAR 293,909 Mn. as the Bank continued to grow
non-profit bearing deposits, which represented
94% of total deposits at year-end 2018.
Credit quality
The non-performing financing ratio remains
strong at 0.95%, an increase from 0.74%
last year, reflecting certain classification
changes in our portfolios and strong growth
in the Retail financing book. The coverage of
non-performing financing increased by 9%
from 2017, to 342%.
About the BankAbout the Bank
Value DriversValue Drivers
LeadershipLeadership
StrategyStrategy
PerformancePerformance
Corporate GovernanceCorporate Governance
Financial ReportsFinancial Reports
Supplementary InformationSupplementary Information
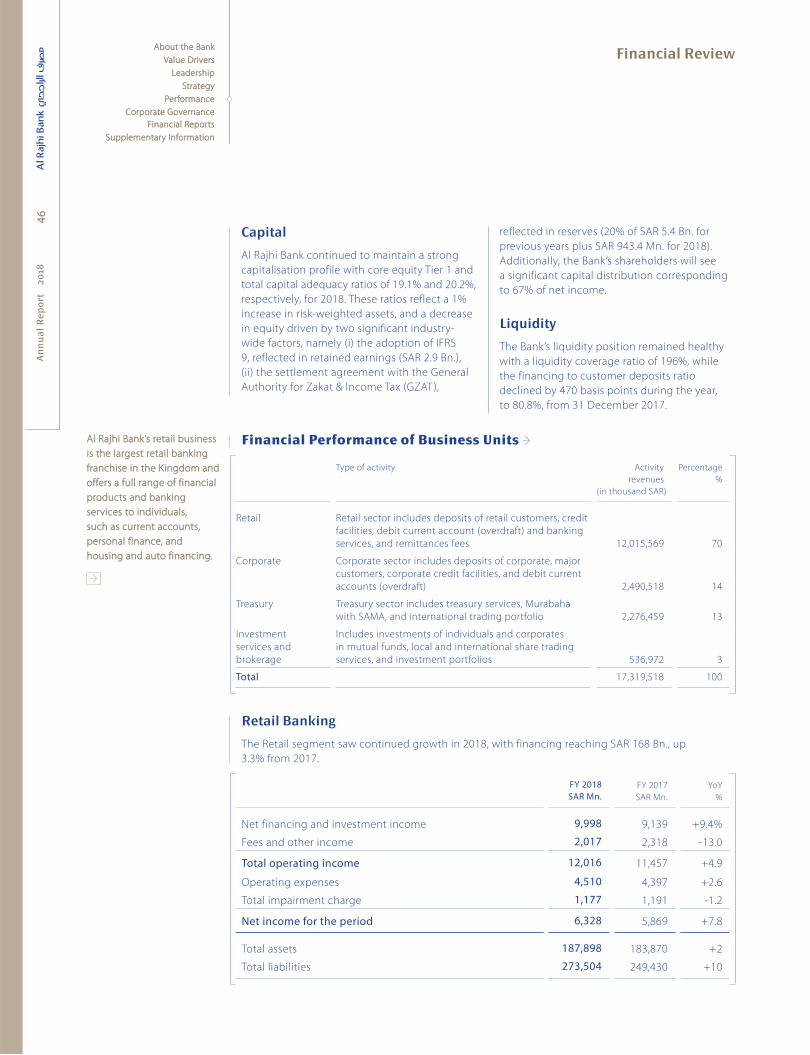
An
nu
al
Re
po
rt
20
18
Financial Review46
Capital
Al Rajhi Bank continued to maintain a strong
capitalisation profile with core equity Tier 1 and
total capital adequacy ratios of 19.1% and 20.2%,
respectively, for 2018. These ratios reflect a 1%
increase in risk-weighted assets, and a decrease
in equity driven by two significant industry-
wide factors, namely (i) the adoption of IFRS
9, reflected in retained earnings (SAR 2.9 Bn.),
(ii) the settlement agreement with the General
Authority for Zakat & Income Tax (GZAT),
Al Rajhi Bank’s retail business Al Rajhi Bank’s retail business
is the largest retail banking is the largest retail banking
franchise in the Kingdom and franchise in the Kingdom and
offers a full range of financial offers a full range of financial
products and banking products and banking
services to individuals, services to individuals,
such as current accounts, such as current accounts,
personal finance, and personal finance, and
housing and auto financing. housing and auto financing.
reflected in reserves (20% of SAR 5.4 Bn. for
previous years plus SAR 943.4 Mn. for 2018).
Additionally, the Bank’s shareholders will see
a significant capital distribution corresponding
to 67% of net income.
Liquidity
The Bank’s liquidity position remained healthy
with a liquidity coverage ratio of 196%, while
the financing to customer deposits ratio
declined by 470 basis points during the year,
to 80.8%, from 31 December 2017.
Financial Performance of Business Units
Type of activity Activity
revenues
(in thousand SAR)
Percentage
%
Retail Retail sector includes deposits of retail customers, credit
facilities, debit current account (overdraft) and banking
services, and remittances fees 12,015,569 70
Corporate Corporate sector includes deposits of corporate, major
customers, corporate credit facilities, and debit current
accounts (overdraft) 2,490,518 14
Treasury Treasury sector includes treasury services, Murabaha
with SAMA, and international trading portfolio 2,276,459 13
Investment
services and
brokerage
Includes investments of individuals and corporates
in mutual funds, local and international share trading
services, and investment portfolios 536,972 3
Total 17,319,518 100
Retail Banking
The Retail segment saw continued growth in 2018, with financing reaching SAR 168 Bn., up
3.3% from 2017.
FY 2018SAR Mn.
FY 2017
SAR Mn.
YoY
%
Net financing and investment income 9,998 9,139 +9.4%
Fees and other income 2,017 2,318 -13.0
Total operating income 12,016 11,457 +4.9
Operating expenses 4,510 4,397 +2.6
Total impairment charge 1,177 1,191 -1.2
Net income for the period 6,328 5,869 +7.8
Total assets 187,898 183,870 +2
Total liabilities 273,504 249,430 +10
About the BankAbout the Bank
Value DriversValue Drivers
LeadershipLeadership
StrategyStrategy
PerformancePerformance
Corporate GovernanceCorporate Governance
Financial ReportsFinancial Reports
Supplementary InformationSupplementary Information
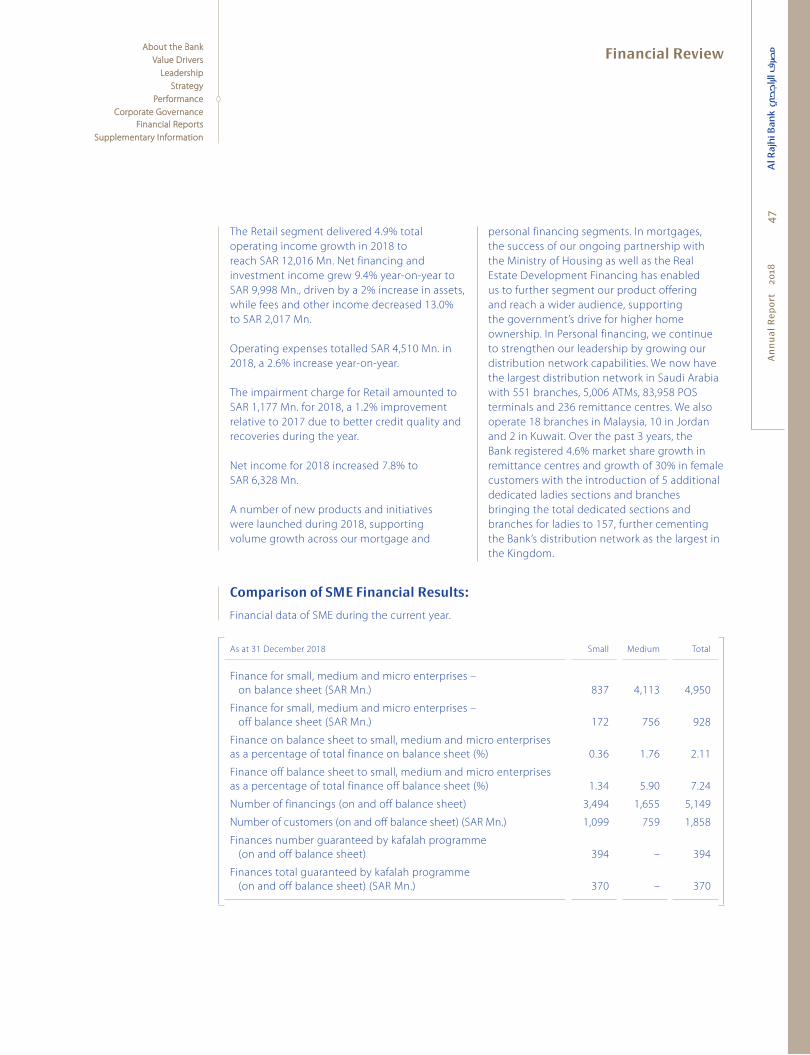
An
nu
al
Re
po
rt
20
18
Financial Review
47
The Retail segment delivered 4.9% total
operating income growth in 2018 to
reach SAR 12,016 Mn. Net financing and
investment income grew 9.4% year-on-year to
SAR 9,998 Mn., driven by a 2% increase in assets,
while fees and other income decreased 13.0%
to SAR 2,017 Mn.
Operating expenses totalled SAR 4,510 Mn. in
2018, a 2.6% increase year-on-year.
The impairment charge for Retail amounted to
SAR 1,177 Mn. for 2018, a 1.2% improvement
relative to 2017 due to better credit quality and
recoveries during the year.
Net income for 2018 increased 7.8% to
SAR 6,328 Mn.
A number of new products and initiatives
were launched during 2018, supporting
volume growth across our mortgage and
personal financing segments. In mortgages,
the success of our ongoing partnership with
the Ministry of Housing as well as the Real
Estate Development Financing has enabled
us to further segment our product offering
and reach a wider audience, supporting
the government’s drive for higher home
ownership. In Personal financing, we continue
to strengthen our leadership by growing our
distribution network capabilities. We now have
the largest distribution network in Saudi Arabia
with 551 branches, 5,006 ATMs, 83,958 POS
terminals and 236 remittance centres. We also
operate 18 branches in Malaysia, 10 in Jordan
and 2 in Kuwait. Over the past 3 years, the
Bank registered 4.6% market share growth in
remittance centres and growth of 30% in female
customers with the introduction of 5 additional
dedicated ladies sections and branches
bringing the total dedicated sections and
branches for ladies to 157, further cementing
the Bank’s distribution network as the largest in
the Kingdom.
Comparison of SME Financial Results:
Financial data of SME during the current year.
As at 31 December 2018 Small Medium Total
Finance for small, medium and micro enterprises –
on balance sheet (SAR Mn.) 837 4,113 4,950
Finance for small, medium and micro enterprises –
off balance sheet (SAR Mn.) 172 756 928
Finance on balance sheet to small, medium and micro enterprises
as a percentage of total finance on balance sheet (%) 0.36 1.76 2.11
Finance off balance sheet to small, medium and micro enterprises
as a percentage of total finance off balance sheet (%) 1.34 5.90 7.24
Number of financings (on and off balance sheet) 3,494 1,655 5,149
Number of customers (on and off balance sheet) (SAR Mn.) 1,099 759 1,858
Finances number guaranteed by kafalah programme
(on and off balance sheet) 394 – 394
Finances total guaranteed by kafalah programme
(on and off balance sheet) (SAR Mn.) 370 – 370
About the BankAbout the Bank
Value DriversValue Drivers
LeadershipLeadership
StrategyStrategy
PerformancePerformance
Corporate GovernanceCorporate Governance
Financial ReportsFinancial Reports
Supplementary InformationSupplementary Information
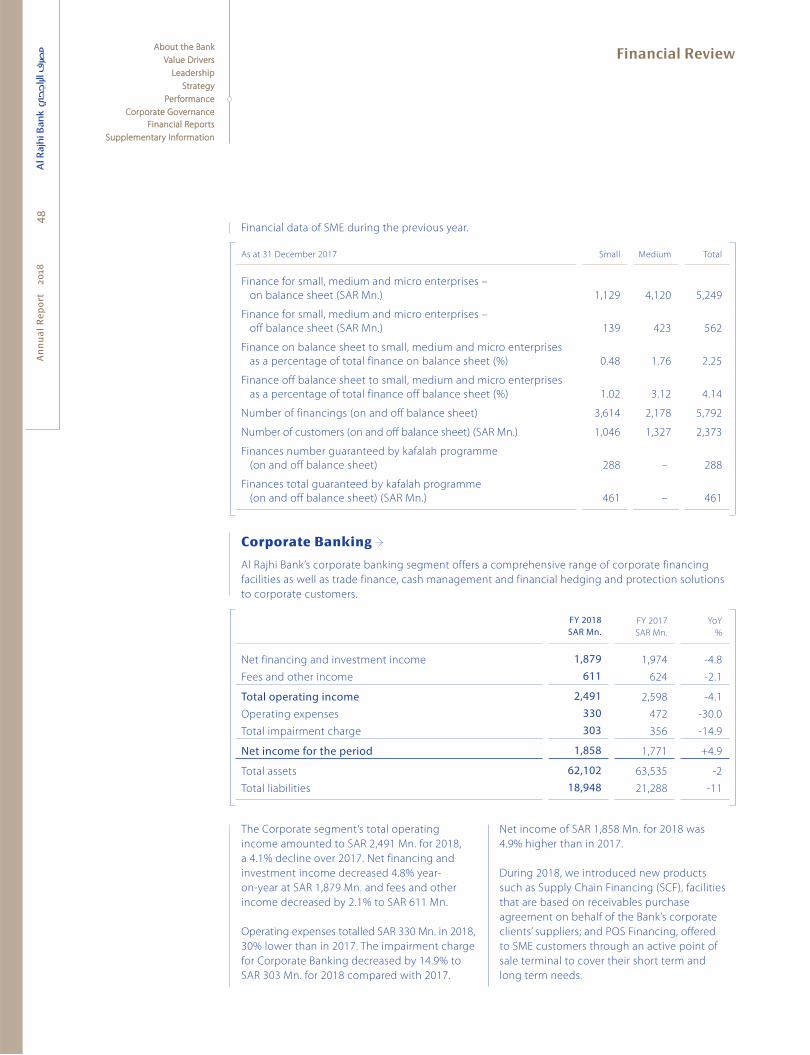
An
nu
al
Re
po
rt
20
18
Financial Review48
Financial data of SME during the previous year.
As at 31 December 2017 Small Medium Total
Finance for small, medium and micro enterprises –
on balance sheet (SAR Mn.) 1,129 4,120 5,249
Finance for small, medium and micro enterprises –
off balance sheet (SAR Mn.) 139 423 562
Finance on balance sheet to small, medium and micro enterprises
as a percentage of total finance on balance sheet (%) 0.48 1.76 2.25
Finance off balance sheet to small, medium and micro enterprises
as a percentage of total finance off balance sheet (%) 1.02 3.12 4.14
Number of financings (on and off balance sheet) 3,614 2,178 5,792
Number of customers (on and off balance sheet) (SAR Mn.) 1,046 1,327 2,373
Finances number guaranteed by kafalah programme
(on and off balance sheet) 288 – 288
Finances total guaranteed by kafalah programme
(on and off balance sheet) (SAR Mn.) 461 – 461
Corporate Banking
Al Rajhi Bank’s corporate banking segment offers a comprehensive range of corporate financing
facilities as well as trade finance, cash management and financial hedging and protection solutions
to corporate customers.
FY 2018SAR Mn.
FY 2017
SAR Mn.
YoY
%
Net financing and investment income 1,879 1,974 -4.8
Fees and other income 611 624 -2.1
Total operating income 2,491 2,598 -4.1
Operating expenses 330 472 -30.0
Total impairment charge 303 356 -14.9
Net income for the period 1,858 1,771 +4.9
Total assets 62,102 63,535 -2
Total liabilities 18,948 21,288 -11
The Corporate segment’s total operating
income amounted to SAR 2,491 Mn. for 2018,
a 4.1% decline over 2017. Net financing and
investment income decreased 4.8% year-
on-year at SAR 1,879 Mn. and fees and other
income decreased by 2.1% to SAR 611 Mn.
Operating expenses totalled SAR 330 Mn. in 2018,
30% lower than in 2017. The impairment charge
for Corporate Banking decreased by 14.9% to
SAR 303 Mn. for 2018 compared with 2017.
Net income of SAR 1,858 Mn. for 2018 was
4.9% higher than in 2017.
During 2018, we introduced new products
such as Supply Chain Financing (SCF), facilities
that are based on receivables purchase
agreement on behalf of the Bank’s corporate
clients’ suppliers; and POS Financing, offered
to SME customers through an active point of
sale terminal to cover their short term and
long term needs.
About the BankAbout the Bank
Value DriversValue Drivers
LeadershipLeadership
StrategyStrategy
PerformancePerformance
Corporate GovernanceCorporate Governance
Financial ReportsFinancial Reports
Supplementary InformationSupplementary Information

An
nu
al
Re
po
rt
20
18
Financial Review
49
Treasury
The treasury segment is responsible for managing the Bank’s financial position to accomplish
successful structuring of maturities and liquidity, investment efficiency and exchange rates and
offers financial hedging and protection solutions to corporate customers.
FY 2018SAR Mn.
FY 2017
SAR Mn.
YoY
%
Net financing and investment income 1,359 895 +51.9
Fees and other income 917 505 +81.6
Total operating income 2,276 1,400 +62.6
Operating expenses 504 231 +117.8
Total impairment charge 51 1 +9192.1
Net income for the period 1,722 1,168 +47.4
Total assets 111,970 92,783 +21
Total liabilities 23,868 16,107 +48
Treasury and Investments reported a strong
performance in 2018, with operating income
rising 62.6% year-on-year to SAR 2,276 Mn. This
was driven by both higher investment balances
and increased net financing and investment
yields causing a 51.9% rise in net financing and
investment income to SAR 1,359 Mn.
Despite volume-related increases in both
operating expenses, to SAR 504 Mn., and
impairments, to SAR 51 Mn., the higher
operating income translated to 47.4%
year-on-year net income growth to
SAR 1,722 Mn. for 2018.
2018 saw several new developments in the
Treasury department, with new product
launches at several desks including Money
Markets and FX, a significant ramping up of
the activities of our Investment Desk and at
our Financial Institutions desk, the creation of
entirely new units such as ALM and Structuring
and Derivatives Desk. Our remittances business,
Tahweel Al Rajhi, has been brought under
the umbrella of the Treasury department to
enhance synergies, as we continue to invest in
our digital platform on this and other channels.
Over 55% of all Tahweel transactions were done
using electronic means last year.
On the technology front, we are excited that
our FI desk played a significant role in the
implementation of new technology using
Ripple, a blockchain-based digital ledger
algorithm, to settle trades with one of our
banking correspondents.
About the BankAbout the Bank
Value DriversValue Drivers
LeadershipLeadership
StrategyStrategy
PerformancePerformance
Corporate GovernanceCorporate Governance
Financial ReportsFinancial Reports
Supplementary InformationSupplementary Information

An
nu
al
Re
po
rt
20
18
Financial Review50
Investment Services and Brokerage
The Bank’s investment services and brokerage business offers asset management and local and
international share trading services.
FY 2018SAR Mn.
FY 2017
SAR Mn.
YoY
%
Net financing and investment income 16 22 -27.1
Fees and other income 521 428 +21.7
Total operating income 537 450 +19.3
Operating expenses 148 137 +8.0
Total impairment charge 0 0
Net income for the period 389 313 +24.2
Total assets 3,033 2,928 +4
Total liabilities 130 540 -76
The Investment Services and Brokerage
business grew 2018 operating income to
SAR 537 Mn., a 19.3% increase over 2017,
driven by brokerage and by investment,
which resulted in 24.2% net income growth
year-on-year to SAR 389 Mn.
Al Rajhi Capital retained its position as the
leading broker on Tadawul, and expanded its
market share to 20.3% from 19.6% in 2017.
The Asset Management business also expanded
significantly with total AUMs (assets under
management) up 40% to SAR 38 Bn.
In addition, the unit’s Real Estate business saw
the milestone IPO of the Al Rajhi REIT Fund,
which was oversubscribed by 174%. Lastly, our
Proprietary Investments, benefited from several
initiatives launched last year and contributed
24% of segment in 2018.
Al Rajhi Capital was named “Best Broker in Saudi
Arabia” by EMEA Finance and “Broker of the Year”
by Euromoney Global Investor, “Best Provider
of Sharia-compliant Funds – 2018’’ by Global
Finance and “Real Estate Investment Firm of the
Year” by Euromoney Global Investor.
Financial Performance of Subsidiaries
Type of activity Activity revenues
(SAR ’000)
Percentage
%
Al Rajhi Bank
Malaysia
An Islamic bank licensed under Islamic Financial Services Law
issued in 2013, incorporated and practices its business in Malaysia. 183,982 -3.29
Al Rajhi Capital A closed joint-stock company, registered in KSA to work as a main
agent and/or provide financial brokerage services, insurance,
management, consultancy, arrangements and keeping. 536,972 19.00
Al Rajhi Takaful
Agency
A limited liability company, registered in KSA to work as an agent
to practice insurance brokerage activities according to agency
agreement with Al Rajhi Cooperative Insurance Company. 3,104 -68.00
Al Rajhi
Development
Co. Ltd.
A limited liability company registered in KSA to support real estate
finance programmes of ARB by transferring and keeping real
estate ownership documents in its name on behalf of the Bank;
collect revenues of selling some properties sold by the Bank;
provide consultancies in real estate and engineering field; register
real estate contracts; and supervising real estate valuation. 31,830 58.00
Al Rajhi
Services Co.
A limited liability company registered in KSA to provide
recruitment services. 186,557 10.00
About the BankAbout the Bank
Value DriversValue Drivers
LeadershipLeadership
StrategyStrategy
PerformancePerformance
Corporate GovernanceCorporate Governance
Financial ReportsFinancial Reports
Supplementary InformationSupplementary Information
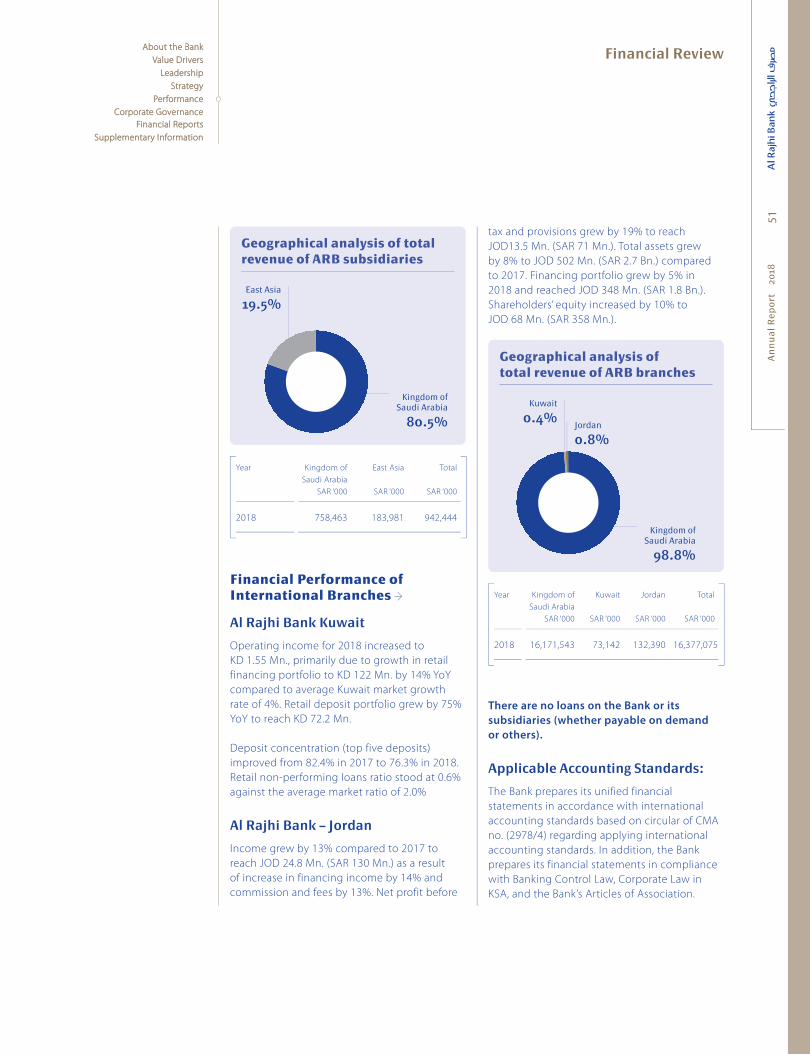
An
nu
al
Re
po
rt
20
18
Financial Review
51
Geographical analysis of total revenue of ARB subsidiaries
East Asia
19.5%
Kingdom of Saudi Arabia
80.5%
Year Kingdom of
Saudi Arabia
SAR ‘000
East Asia
SAR ‘000
Total
SAR ‘000
2018 758,463 183,981 942,444
130 130 -76%
Financial Performance of International Branches
Al Rajhi Bank Kuwait
Operating income for 2018 increased to
KD 1.55 Mn., primarily due to growth in retail
financing portfolio to KD 122 Mn. by 14% YoY
compared to average Kuwait market growth
rate of 4%. Retail deposit portfolio grew by 75%
YoY to reach KD 72.2 Mn.
Deposit concentration (top five deposits)
improved from 82.4% in 2017 to 76.3% in 2018.
Retail non-performing loans ratio stood at 0.6%
against the average market ratio of 2.0%
Al Rajhi Bank – Jordan
Income grew by 13% compared to 2017 to
reach JOD 24.8 Mn. (SAR 130 Mn.) as a result
of increase in financing income by 14% and
commission and fees by 13%. Net profit before
tax and provisions grew by 19% to reach
JOD13.5 Mn. (SAR 71 Mn.). Total assets grew
by 8% to JOD 502 Mn. (SAR 2.7 Bn.) compared
to 2017. Financing portfolio grew by 5% in
2018 and reached JOD 348 Mn. (SAR 1.8 Bn.).
Shareholders’ equity increased by 10% to
JOD 68 Mn. (SAR 358 Mn.).
Geographical analysis of total revenue of ARB branches
Jordan
0.8%
Kuwait
0.4%
Kingdom of Saudi Arabia
98.8%
Year Kingdom of
Saudi Arabia
SAR ‘000
Kuwait
SAR ‘000
Jordan
SAR ‘000
Total
SAR ‘000
2018 16,171,543 73,142 132,390 16,377,075
130 130 540 -76%
There are no loans on the Bank or its
subsidiaries (whether payable on demand
or others).
Applicable Accounting Standards:
The Bank prepares its unified financial
statements in accordance with international
accounting standards based on circular of CMA
no. (2978/4) regarding applying international
accounting standards. In addition, the Bank
prepares its financial statements in compliance
with Banking Control Law, Corporate Law in
KSA, and the Bank’s Articles of Association.
About the BankAbout the Bank
Value DriversValue Drivers
LeadershipLeadership
StrategyStrategy
PerformancePerformance
Corporate GovernanceCorporate Governance
Financial ReportsFinancial Reports
Supplementary InformationSupplementary Information
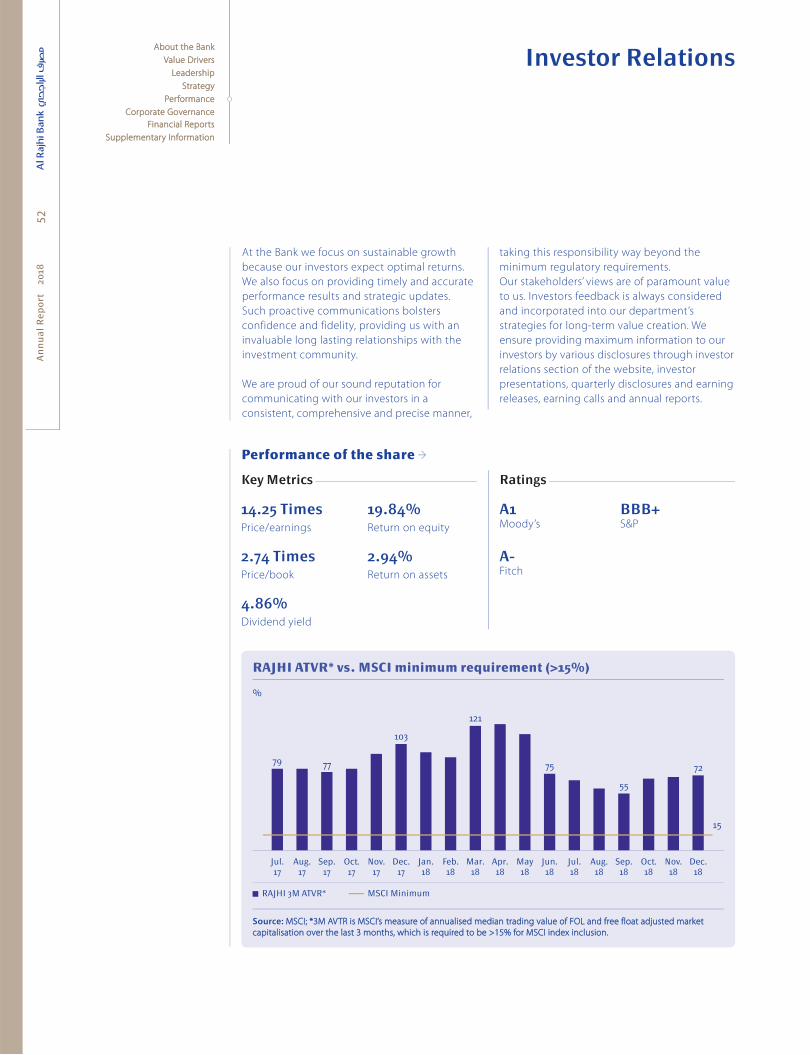
An
nu
al
Re
po
rt
20
1852
Investor Relations
At the Bank we focus on sustainable growth
because our investors expect optimal returns.
We also focus on providing timely and accurate
performance results and strategic updates.
Such proactive communications bolsters
confidence and fidelity, providing us with an
invaluable long lasting relationships with the
investment community.
We are proud of our sound reputation for
communicating with our investors in a
consistent, comprehensive and precise manner,
taking this responsibility way beyond the
minimum regulatory requirements.
Our stakeholders’ views are of paramount value
to us. Investors feedback is always considered
and incorporated into our department’s
strategies for long-term value creation. We
ensure providing maximum information to our
investors by various disclosures through investor
relations section of the website, investor
presentations, quarterly disclosures and earning
releases, earning calls and annual reports.
Performance of the share
Key Metrics Ratings
14.25 TimesPrice/earnings
19.84%Return on equity
A1Moody’s
BBB+S&P
2.74 TimesPrice/book
2.94%Return on assets
A-Fitch
4.86%Dividend yield
RAJHI ATVR* vs. MSCI minimum requirement (>15%)
%
Jul.17
Dec.18
Mar.18
Oct.18
Sep.18
Aug.18
Jul.18
Jun.18
May18
Apr.18
Nov.18
Feb.18
Jan.18
Dec.17
Nov.17
Oct.17
Sep.17
Aug.17
RAJHI 3M ATVR* MSCI Minimum
Source: MSCI; *3M AVTR is MSCI’s measure of annualised median trading value of FOL and free float adjusted market MSCI; *3M AVTR is MSCI’s measure of annualised median trading value of FOL and free float adjusted market
capitalisation over the last 3 months, which is required to be >15% for MSCI index inclusion.capitalisation over the last 3 months, which is required to be >15% for MSCI index inclusion.
79 77
103
121
75
55
72
15
About the BankAbout the Bank
Value DriversValue Drivers
LeadershipLeadership
StrategyStrategy
PerformancePerformance
Corporate GovernanceCorporate Governance
Financial ReportsFinancial Reports
Supplementary InformationSupplementary Information

An
nu
al
Re
po
rt
20
18
Investor Relations
53
Share price
The market value of the Bank’s ordinary share was SAR 87.50 as of 31 December 2018, while it was
SAR 64.62 as of 31 December 2017.
During the year ended 31 December 2018, the highest price recorded by the share was SAR 85.90 on
27 December 2018, while the lowest price recorded was SAR 67.00 on 4 January 2018.
Share price performance top 3 KSA banks (monthly; Rebased to 100)
SAR
Rajhi, 170
NCB, 130
TASI, 94
160
140
120
100
80
60
4031
December 2014
31 December
2018
30 June2018
31 December
2017
30June 2017
31 December
2016
30 June 2016
31 December
2015
30 June2015
RAJHI NCB RIYAD TASI
Riyad, 117
737.6
729.3
549.4
Cumulative monthly trading volumes
Mn.
Jan. Dec.Sep. Oct. Nov.Aug.Jul.Jun.MayApr.Mar.Feb
2018 2017 2016
ARB’s trading volumes remained strong consistently.ARB’s trading volumes remained strong consistently.
ARB has the highest weight ARB has the highest weight
in the MSCI GCC index.in the MSCI GCC index.
About the BankAbout the Bank
Value DriversValue Drivers
LeadershipLeadership
StrategyStrategy
PerformancePerformance
Corporate GovernanceCorporate Governance
Financial ReportsFinancial Reports
Supplementary InformationSupplementary Information

An
nu
al
Re
po
rt
20
1854
Digital Footprint
The four themes for 2018 and our achievements at a glance
We launched a number of digital solutions for key customer segments such as retail, SME, corporate
and private wealth solutions during the year.
1
2
3
4 Themes
New digital channels
Customersatisfaction
Regulatory and compliance
Cost reduction and revenue generation
9Retail
3Corporate
1PWS
11Retail
2Corporate
1Retail
1SME
2PWS
10Retail
Exponential jump in retail banking customers using digital services
Active users for Al Mubasher retail, the Bank’s internet banking service for retail customers,
exceeded 2018 targets.
2.25 Mn.
2.00 Mn.
3.50 Mn.
3.25 Mn.3.00 Mn.
2.75 Mn.3.75 Mn.
2.50 Mn.
2017 2018
Active users – Mubasher
2.2 Mn. 3.6 Mn.
2.25 Mn.
2.00 Mn.
3.50 Mn.
3.25 Mn.3.00 Mn.
2.75 Mn.3.75 Mn.
2.50 Mn.
About the BankAbout the Bank
Value DriversValue Drivers
LeadershipLeadership
StrategyStrategy
PerformancePerformance
Corporate GovernanceCorporate Governance
Financial ReportsFinancial Reports
Supplementary InformationSupplementary Information

An
nu
al
Re
po
rt
20
18
Digital Footprint
55
Corporate banking customers increase interest in digital banking services
Active users of eCorporate, the Bank’s internet banking service for Corporate customers,
increased 12.5% over the previous year.
Active users – eCorporate
2017
35,000
34,000
40,000
39,00038,000
37,00041,000
36,000
35,184
2018
35,000
34,000
40,000
39,00038,000
37,00041,000
36,000
39,588
Digital solutions for SME banking
The eSME app was launched at end 2018 and is our latest offering for this important customer
group, part of our contribution towards the Kingdom’s Vision 2030.
eSME
The eSME application explicitly
targets the Bank’s SME customers.
Existing Retail and Corporate
customers will be migrated to the
new application in order to provide
them with improved services.
Functionalities available:
Home – dashboard
Current accounts
Balance certificate
Cheque book
POS management
Tax invoice
Bill payments
MOI payments
Transfers
Beneficiaries
Standing Orders
Payroll
Payroll cards
National address in eSME
application
Pending actions
My profile
Marketing message
Users management
Token management
Alerts management
Activity logs
About the BankAbout the Bank
Value DriversValue Drivers
LeadershipLeadership
StrategyStrategy
PerformancePerformance
Corporate GovernanceCorporate Governance
Financial ReportsFinancial Reports
Supplementary InformationSupplementary Information
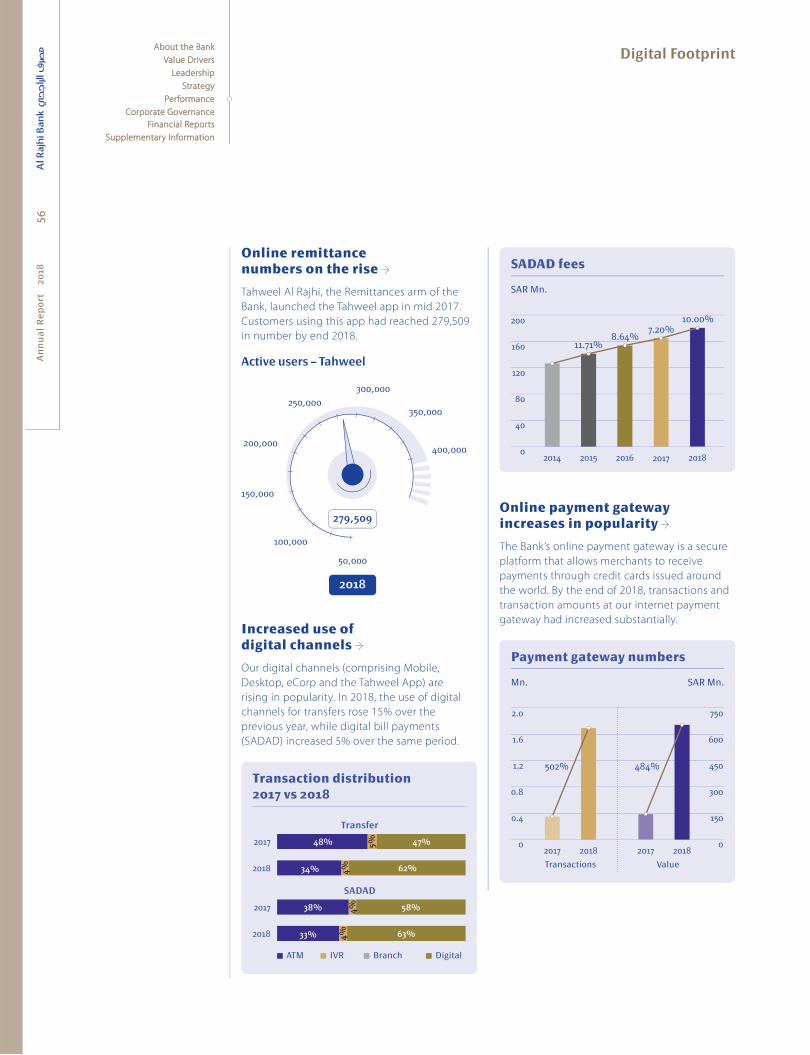
An
nu
al
Re
po
rt
20
18
Digital Footprint56
Online remittance numbers on the rise
Tahweel Al Rajhi, the Remittances arm of the
Bank, launched the Tahweel app in mid 2017.
Customers using this app had reached 279,509
in number by end 2018.
2018
100,000
50,000
350,000
300,000
250,000
200,000400,000
150,000
279,509
Active users – Tahweel
Increased use of digital channels
Our digital channels (comprising Mobile,
Desktop, eCorp and the Tahweel App) are
rising in popularity. In 2018, the use of digital
channels for transfers rose 15% over the
previous year, while digital bill payments
(SADAD) increased 5% over the same period.
Transaction distribution 2017 vs 2018
48% 5% 47%2017
34% 4% 62%2018
Transfer
SADAD
38% 4% 58%2017
33% 4% 63%2018
ATM IVR Branch Digital
SADAD fees
SAR Mn.
200
160
120
80
40
02014 201820172015 2016
11.71%8.64%
7.20%10.00%
Online payment gateway increases in popularity
The Bank’s online payment gateway is a secure
platform that allows merchants to receive
payments through credit cards issued around
the world. By the end of 2018, transactions and
transaction amounts at our internet payment
gateway had increased substantially.
2.0
1.6
1.2
0.8
0.4
02017 2018
502%
750
600
450
300
150
0
484%
2017 2018
ValueTransactions
Payment gateway numbers
Mn. SAR Mn.
About the BankAbout the Bank
Value DriversValue Drivers
LeadershipLeadership
StrategyStrategy
PerformancePerformance
Corporate GovernanceCorporate Governance
Financial ReportsFinancial Reports
Supplementary InformationSupplementary Information

An
nu
al
Re
po
rt
20
1857
To continue its robust dedication towards
Islamic banking, the Bank brought together
an independent Sharia Board, comprising
high-ranking scholars who are specialists
in this field. Through their expert guidance
the Bank is able to ensure Sharia compliance
both within the Kingdom and beyond. The
responsibility for constituting the Board and
approving its regulation lies with the General
Assembly. In addition, it is compulsory for all
Bank departments to be in compliance with the
Sharia Board’s resolutions.
During the 38 Sharia Board meetings held in
2018, the Sharia Board examined 300 subjects
including the Bank’s:
Products
Investment and financing agreements
Contracts
Models
Inquiries
A total of 1,170 resolutions have been issued by
the Bank’s Sharia Board as of 31 December 2018,
while 627 audit standards were issued during
the year.
Coordinating the Bank’s requirements requires
a dedicated team to operate within the Bank
and support the Board’s work. To this end, the
Sharia Group was established, consisting of the
following departments:
Secretariat of the Sharia Board
With the support of a number of legal advisors
on its team, the duties of the Secretariat
include:
Studying the banking products, agreements,
and contracts received from various groups
and departments within the Bank
Preparing the necessary research and
legal studies and presenting it to the
Sharia Board
Informing internal departments of the
directives and resolutions of the Board
Participating in the development of Sharia
products
Providing legal advice to internal
departments in accordance with the
resolutions of the Board
Executing the minutes of the meetings
of the Sharia Board while maintaining and
classifying the same to facilitate use
Sharia Supervisory Department
With the support of an integrated team of legal
supervisors the Department’s role includes:
Supervising all Bank transactions in regard
to the implementation of and compliance
with the resolutions and directions of the
Sharia Board
Ensuring that no product, contract or model
not approved by the Board is employed
Ensuring that employees understand the
Sharia Board's resolutions and apply the
same to their work
Auditing the work of the Bank through
automated systems and field visits in
accordance with professional practice,
governance, and discussions
Preparing the annual plan and the quarterly
operational plans; determining the objectives,
tools and means of auditing used; preparing
the necessary reports and submitting them
to Sharia Board
The models and templates of auditing are
updated as per standards and guidelines issued
periodically by the Board.
Sharia Group
Through its memorandum Through its memorandum
of association, the Bank’s of association, the Bank’s
commitment to provide commitment to provide
Sharia-compliant banking Sharia-compliant banking
has remained strong over the has remained strong over the
past 30 years. past 30 years.
About the BankAbout the Bank
Value DriversValue Drivers
LeadershipLeadership
StrategyStrategy
PerformancePerformance
Corporate GovernanceCorporate Governance
Financial ReportsFinancial Reports
Supplementary InformationSupplementary Information
An
nu
al
Re
po
rt
20
18
Sharia Group58
Bank employees, customers and those with an
interest in Islamic banking have been provided
with legal awareness from the Sharia Group
through the following means:
An educational website for employees
to clarify the Sharia aspects of the Bank's
products and services
Specialised banking courses for Bank
employees numbering 23 during 2018,
with a total of 138 training hours and 500
beneficiaries, including sales staff, future
managers, branch managers, district
managers, operations managers, and other
Bank leaders
A total of six joint workshops on the
Sharia aspects of banking products
Responses to more than 350 telephone
inquiries and over 90 postal inquiries
A total of 10 awareness messages through
internal mail to employees about the Bank's
products and Sharia guidelines for the same
A total of 18 outstanding publications on
Islamic banking and financial transactions,
based on PhD- and MA-level scientific letters
by specialists in this field, prepared, printed
and distributed to interested parties and
commercial libraries
The provision of scientific support to a
number of Sharia researchers in the field of
Islamic banking, with workshops held for PhD
students in the Jurisprudence Department at
the Faculty of Sharia at Imam Muhammad bin
Saud Islamic University
A total of 1,170 resolutions A total of 1,170 resolutions
have been issued by the have been issued by the
Bank’s Sharia Board as of Bank’s Sharia Board as of
31 December 2018, while 31 December 2018, while
627 audit standards were 627 audit standards were
issued during the year.issued during the year.
In addition, the Department was involved in
the following:
Representing the Bank at SAMA meetings
of the Banking Committee and assuming
Chairmanship of the Committee during the
year under review
Participating in workshops related to banking
products held by SAMA in Riyadh and Jeddah
Participating in specialised seminars and
forums such as scientific seminars organised
by the Center of Excellence Research of
the Imam Muhammad bin Saud Islamic
University, the banking seminar organised
by the National Bank and the 16th conference
of the Accounting and Auditing Organization
for Islamic Financial Institutions (AAIOFI) of
the Sharia bodies
About the BankAbout the Bank
Value DriversValue Drivers
LeadershipLeadership
StrategyStrategy
PerformancePerformance
Corporate GovernanceCorporate Governance
Financial ReportsFinancial Reports
Supplementary InformationSupplementary Information
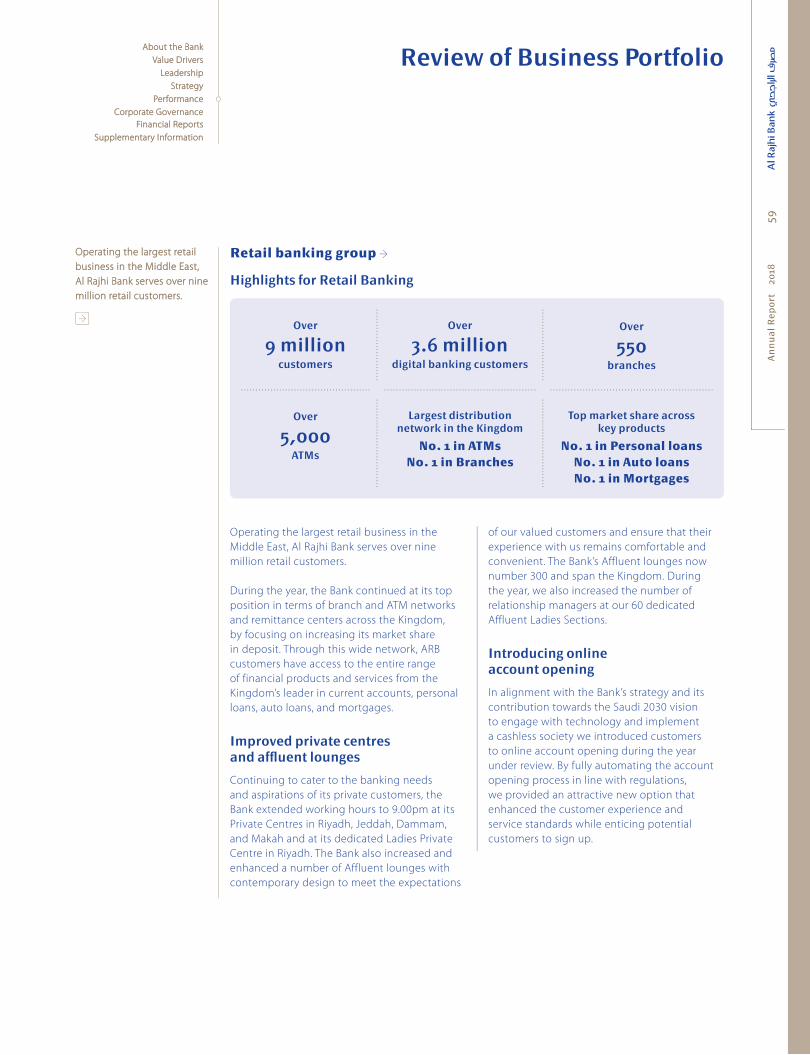
An
nu
al
Re
po
rt
20
1859
Retail banking group
Highlights for Retail Banking
Over
9 million customers
Over
3.6 million digital banking customers
Over
550 branches
Over
5,000 ATMs
Largest distribution network in the Kingdom
No. 1 in ATMsNo. 1 in Branches
Top market share across key products
No. 1 in Personal loansNo. 1 in Auto loansNo. 1 in Mortgages
of our valued customers and ensure that their
experience with us remains comfortable and
convenient. The Bank’s Affluent lounges now
number 300 and span the Kingdom. During
the year, we also increased the number of
relationship managers at our 60 dedicated
Affluent Ladies Sections.
Introducing online account opening
In alignment with the Bank’s strategy and its
contribution towards the Saudi 2030 vision
to engage with technology and implement
a cashless society we introduced customers
to online account opening during the year
under review. By fully automating the account
opening process in line with regulations,
we provided an attractive new option that
enhanced the customer experience and
service standards while enticing potential
customers to sign up.
Review of Business Portfolio
Operating the largest retail business in the
Middle East, Al Rajhi Bank serves over nine
million retail customers.
During the year, the Bank continued at its top
position in terms of branch and ATM networks
and remittance centers across the Kingdom,
by focusing on increasing its market share
in deposit. Through this wide network, ARB
customers have access to the entire range
of financial products and services from the
Kingdom’s leader in current accounts, personal
loans, auto loans, and mortgages.
Improved private centres and affl uent lounges
Continuing to cater to the banking needs
and aspirations of its private customers, the
Bank extended working hours to 9.00pm at its
Private Centres in Riyadh, Jeddah, Dammam,
and Makah and at its dedicated Ladies Private
Centre in Riyadh. The Bank also increased and
enhanced a number of Affluent lounges with
contemporary design to meet the expectations
Operating the largest retail Operating the largest retail
business in the Middle East, business in the Middle East,
Al Rajhi Bank serves over nine Al Rajhi Bank serves over nine
million retail customers. million retail customers.
About the BankAbout the Bank
Value DriversValue Drivers
LeadershipLeadership
StrategyStrategy
PerformancePerformance
Corporate GovernanceCorporate Governance
Financial ReportsFinancial Reports
Supplementary InformationSupplementary Information
An
nu
al
Re
po
rt
20
18
Review of Business Portfolio60
Developing the real estate mortgage market
Despite being one of the largest in the Gulf
region, Saudi Arabia’s real estate market remains
underdeveloped, with only an estimated 47%
of Saudis owning their own home. Rising
incomes, urbanisation, growing families and
a young demographic, however, mean that
the long-term outlook for the KSA real estate
remains positive. A stimulus package of
SAR 72 Bn., that supports housing construction
and waives fees for small businesses and
investors provides further incentive in this
market. The government’s plans to launch large
infrastructure projects, such as Neom City and
Red Sea, to meet the goals of Vision 2030 and
steer the Kingdom away from an oil-dependent
economy means that the real estate market is
one to watch in the coming years.
Capitalising on this situation, the Bank launched
a real estate programme, in cooperation with
the Real Estate Development Fund (REDF)
and the Ministry of Housing (MOH) which
has already resulted in a positive impact on
the book size of our Real Estate financing for
the Retail portfolio. The fund is based on the
Murabaha principle and supports financing
for customers who meet the Bank’s credit
conditions. The Bank will purchase the property
in full on behalf of the customer, with REDF
paying the Bank an advance payment on behalf
of the customer. This project is one example
of the Bank’s contribution towards increasing
home ownership in Saudi Arabia to 60% by
2020 in line with the Saudi Vision 2030.
During the year, the Bank launched 15
high-demand new products and features in the
home financing space, such as self-construction
and off-plan, which were supported by
government initiatives including profit subsidy,
down payment support, and military support.
The launch of these products and features was
augmented by marketing campaigns to ensure
targeted and wider reach among potential and
existing retail banking customers in segments
as varied as salaried, near retirement, retired,
and self-employed. With more such products
and features in the pipeline to be launched
from 2019 to 2025, the Bank is geared to meet
market demand. We look forward to facing the
challenges of 2019 head on as we continue
to maintain the largest market share in this
segment and offer best-in-class customer
service while enhancing our relationship with
REDF/MOH.
Retail expansion strategy
The Bank’s new retail expansion strategy was
supplemented by a new layout for each branch
that was designed to enhance the customer
experience and entice them to try out and
experience digital banking.
Retail expansion strategies implemented during
2018 include:
More machines at self-service kiosks
At its 24-hour, self-service kiosks, known
as ASRAA, the Bank installed a total of 230
machines during the year – considered a
record even by global standards. These kiosks
provide customer with 24x7 banking services.
Draft cheque printing
For the first time in the market customers are
now able to print draft cheques instantly at
any self-service kiosk.
The Bank’s new retail The Bank’s new retail
expansion strategy was expansion strategy was
supplemented by a new supplemented by a new
layout for each branch that layout for each branch that
was designed to enhance was designed to enhance
the customer experience and the customer experience and
entice them to try out and entice them to try out and
experience digital banking. experience digital banking.
About the BankAbout the Bank
Value DriversValue Drivers
LeadershipLeadership
StrategyStrategy
PerformancePerformance
Corporate GovernanceCorporate Governance
Financial ReportsFinancial Reports
Supplementary InformationSupplementary Information

An
nu
al
Re
po
rt
20
18
Review of Business Portfolio
61
Fingerprint technology
Customers can now update their personal
information using fingerprint technology
without having to visit the branch.
This initiative is part of the Bank’s ongoing
strategy to be the market leader in
innovative products and services especially
in self-service banking.
Foreign currency exchange at ATMs
Another pioneering self-service banking
solution introduced during the year was the
facility for customers to exchange foreign
currency at ATMs located at different
international airports. Able to now withdraw
and deposit foreign currency from their
accounts utilising fingerprint technology,
usage of this new service, especially among
transit passengers, is very high.
More interactive teller machines
The Bank also installed 20 interactive teller
machines (ITMs), making ARB the proprietor
of the largest such network in Saudi Arabia.
ITMs allow customers to communicate with
remote tellers through video and audio as
they perform various banking transactions.
This high-tech solution provides customers
with easy and convenient banking options.
Customer loyalty programme
The MOKAFA’A programme was launched
during the year to reciprocate customer
loyalty. This programme allows ARB
customers to earn points every time they
use the Bank’s many products and enhanced
features. These points can be redeemed at a
range of locations belonging to participating
merchants or service providers.
Electronic signatures
Signing a memorandum of understanding
with the specialised companies at the
Ministry of Communication and Information
Technology, the Bank partnered with the
National Centre for Digital Certification, to
provide “Electronic Signature” service for
customers. Instead of having to ask customers
to sign documents in person, the new service
allows them to add signatures to documents
electronically. The new service provides
convenience without compromising security.
After registering at the National Centre for
Digital Certification, MCIT through the Bank,
customers are able to request for any new
service using digital mediums.
Customer spending behaviour and engagement
continues to grow on digital platforms
such as e-commerce and international
transactions which significantly adds to
portfolio profitability.
Cards for convenience
The Al Rajhi Mada Infinite Debit Card was
launched for customers with elite lifestyles.
It provides access to over 1,000 airport lounges
around the world through the Lounge Key
Programme and global concierge services
including for flight, hotel, and restaurant
reservations. Using passwords and CHIP
technology these debit cards have superior
security features and provide customers
with free instant messaging for all financial
transactions.
The Al Fursan Card from Al Rajhi Bank was
also launched during the year under review.
Whenever customers make a payment with
this card they receive free air miles on Saudi
Arabian Airlines.
With the Kingdom’s recent moves to provide
ladies with greater autonomy, the Bank
launched the Selective Credit Card exclusively
for women. The first of its kind in the Kingdom,
this card offers our female customers distinction
and privacy while providing special offers
and discounts at retail outlets for the best in
women’s goods and services.
Customer spending Customer spending
behaviour and engagement behaviour and engagement
continues to grow on continues to grow on
digital platforms such digital platforms such
as e-commerce and as e-commerce and
international transactions international transactions
which significantly adds to which significantly adds to
portfolio profitability. portfolio profitability.
About the BankAbout the Bank
Value DriversValue Drivers
LeadershipLeadership
StrategyStrategy
PerformancePerformance
Corporate GovernanceCorporate Governance
Financial ReportsFinancial Reports
Supplementary InformationSupplementary Information
An
nu
al
Re
po
rt
20
18
Review of Business Portfolio62
The Bank has the third largest and fastest
growing portfolio with a milestone of 200,000
revolving credit cards as at end 2018. The Bank
continues to be the leader in the market in
debit cards, with a market share of eight million
cards in circulation, leading in spend volume
as well.
Responsible lending principles
In May, of the year under review, the Responsible
Lending Principles were issued by SAMA under
Circular Number (46538/99). The main objective
of these regulations is to shift consumer
behaviour towards savings and mortgage
finance and away from consumer finance.
The regulation calls for tighter DBR (Debt
Burden Ratio) restrictions across all products,
especially auto leasing, in addition to the
introduction of an affordability module
which includes the consideration of external
obligations.
Personal fi nance
The Bank continued to advance its Personal
Finance offering, launching the largest
buyout programme which allowed customers
to transfer their salaries to Al Rajhi Bank in
exchange for the settlement of their financing
in other Saudi banks.
Watani Flex Finance, the Bank’s fully
Sharia-compliant personal financing solution
and its most profitable retail banking product,
was further enhanced during the year. Processes
were streamlined to cater to the needs and
aspirations of internal as well as external
stakeholders.
Growing the auto fi nance business
The auto market in general has been witnessing
a gradual slump since mid 2016, a trend which
continued into 2018 owing particularly to the
introduction of SAMA’s Responsible Lending
framework. Despite this, the Bank’s Auto
Finance arm managed to increase its yield.
Issue resolution and improved customer service
was a priority for the Bank’s auto finance
team. To this end, one of our customers’ top
complaints regarding missing duplicate keys
was revisited and a more streamlined solution
introduced. In addition, the Sub Dealer Rebate
programme, a new revenue stream initiative
was introduced.
Focusing on small and medium enterprises
The Saudi Arabian banking sector has a
significant growth opportunity in the small
and medium-sized enterprise (SME) sector.
As part of its contribution towards the Saudi
Vision 2030, Al Rajhi Bank plans to increase its
support towards SME growth by facilitating
various programmes and providing funding
for this sector.
SME business
Our SME business flat-lined in 2018 as a result
of prevalent market conditions and the Bank’s
decision to focus on selective businesses.
The Bank merged its SME business with Retail
Banking to further expand its SME presence
by leveraging the existing Retail Branch
network and identifying key geographical
concentrations of SMEs for better customer
reach. The Bank continued to prudently
maintain the SME lending book while stabilising
asset quality and loss provisions. Key branches
were instructed to provide enhanced customer
service for SME customers. Our SME business
has also enhanced its one-stop-shop concept
with the development of comprehensive credit
programmes for its business segments,
and the launch of POS financing and e-SME
(Internet Banking).
During the coming year, the Bank is planning
a major revamp of its SME business. In line
with Saudi Vision 2030 the Bank will focus on
widening its share of the SME market with
greater emphasis on Healthcare, Education,
Tourism, Services, Transportation, and
Communication. The Bank will also focus on
The Bank has the third largest The Bank has the third largest
and fastest growing portfolio and fastest growing portfolio
with a milestone of 200,000 with a milestone of 200,000
revolving credit cards as revolving credit cards as
at end 2018. The Bank at end 2018. The Bank
continues to be the leader continues to be the leader
in the market in debit cards, in the market in debit cards,
with a market share of eight with a market share of eight
million cards in circulation, million cards in circulation,
leading in spend volume leading in spend volume
as well.as well.
About the BankAbout the Bank
Value DriversValue Drivers
LeadershipLeadership
StrategyStrategy
PerformancePerformance
Corporate GovernanceCorporate Governance
Financial ReportsFinancial Reports
Supplementary InformationSupplementary Information

An
nu
al
Re
po
rt
20
18
Review of Business Portfolio
63
cash management services for SMEs to fulfil
the business needs of cash-heavy traders and
retail businesses.
The Bank will also launch specific and targeted
lending products. Greater emphasis will be
given to process automation and channels to
enhance the customer experience and provide
a seamless banking service. By introducing a
digital platform for customers to interact with
and fulfil their banking needs the Bank will be
further contributing towards the Saudi Vision
2030 to implement a cashless society.
Corporate banking group
The Bank’s Corporate Banking arm put in
another robust performance during the year
under review. The Bank maintained its top
position by increasing volume in cash deposit
machines, payroll, and payroll cards. New
products and services such as the Corporate
Liquidity Management solution and Business to
Business were introduced and further boosted
brand value. We continued to exercise stringent
controls and focus on greater efficiency as we
implemented improved governance standards
and a strict compliance culture.
Significant achievements during the year
include the following:
Developed Corporate Sukuk proposition and
participated in one of the high profile Sukuk
issuances in KSA
Launched auto receivable securitisation
successfully
Closed several structured REIT financing
transactions
Participated in large ticket syndicated and
clubbed transactions
Conducted four business events during the
year, across regions, to reach out to corporate
clients in order to cross sell newly launched
products and services
Enhanced KYC processes and brought in
additional controls to improve the TAT and
customer experience
Launched the Corporate Liquidity
Management solution to provide centralised
and automated cash management for
Corporates
Launched business-to-business (B2B)
solutions to provide STP (straight through
processing) for Corporate Banking,
integrating Banking solutions directly
between businesses and the Bank
Re-launched Cash 24 Card (for cash
depositing services) in compliance
with SAMA’s know-your-customer (KYC)
requirements
Revamped eCorp with enhanced services
to Corporate clients
– Ensuring the e-Commerce statement
is visible in eCorp
– Providing national address filling data
through eCorp
– Upgraded SADAD account OLP Live
with FG3 as required by SADAD
– Launched SADAD Invoice Hub Live
Achieved savings on the cost of CDM
and cash pickup vehicles
Supply Chain Finance
The Bank launched a fully-fledged Supply Chain
Finance solution (SCF) for Corporate customers,
becoming the first Bank in the Kingdom to
offer a wide-ranging suite of solutions backed
by a strong technological platform available to
the entire value chain of customers. The SCF
contributes towards one of Vision 2030’s goals
of supporting private sector growth. It refers
to facilities that are based on a receivables
purchase agreement with the client, which
allows the Bank to be the sole owner of the
receivables due from buyers. Purchases are
made on a structured basis, allowing the Bank to
manage products, disputes, fraud and other risks
that may result in non-payment by the buyer.
During the coming year, During the coming year,
the Bank is planning a major the Bank is planning a major
revamp of its SME business. revamp of its SME business.
In line with Saudi Vision In line with Saudi Vision
2030 the Bank will focus on 2030 the Bank will focus on
widening its share of the widening its share of the
SME market with greater SME market with greater
emphasis on Healthcare, emphasis on Healthcare,
Education, Tourism, Services, Education, Tourism, Services,
Transportation, and Transportation, and
Communication. Communication.
About the BankAbout the Bank
Value DriversValue Drivers
LeadershipLeadership
StrategyStrategy
PerformancePerformance
Corporate GovernanceCorporate Governance
Financial ReportsFinancial Reports
Supplementary InformationSupplementary Information
An
nu
al
Re
po
rt
20
18
Review of Business Portfolio64
The SCF products consist of the following:
Supplier Finance Programme
Receivable Finance
Medical Claim Discounting
Insurance Claim Discounting
(Insurance Corporate Centric)
In addition, to enhance our customer
service proposition, we continued to invest
in technology, systems and our people. We
launched various self-improvement certification
and management development programmes in
partnership with reputed third party providers,
during the year. We also continued to focus on
cross selling to improve customer wallet share
and enhance the customer experience.
Treasury The Treasury Group’s main responsibilities
are three-fold:
Manage the Bank’s overall funding
and liquidity
Meet client requirements for treasury
products
Maintain relationships with International
Financial Institutions
Provide foreign exchange remittance services
to both retail and corporate clients
New products from money market desk
Our money market desk manages the ARB
balance sheet, provides funding for the Bank’s
requirements and optimises the use of funds.
In 2018, the money market desk introduced
products designed to expand the Bank’s liability
product mix such as Repo and Wakalah.
Investment desk contributions
Our investment desk, which was established in
early 2016, has contributed significantly to the
expansion of our investment portfolio over the
last three years. The Investment Desk manages
diversified asset classes including Government
and Corporate Sukuks, Mutual Funds and
Equities. It has also actively worked on yield
enhancement and portfolio re-balancing,
which contributed positively to Treasury’s
overall income, forming 44% and 53% of the
treasury gross yield income in 2017 and 2018
respectively.
Asset liability management function launched
In response to a more comprehensive
and robust internal as well as regulatory
risk management regime, an asset liability
management function was formed as a
separate unit in early 2018 to provide specific
focus on managing the Bank’s liquidity and
profit rate risk.
Financial Institutions Department expands network
The Financial Institutions (FI) Department
executed a strategic network expansion plan
during the year to provide robust support for
customer requirements. It expanded access and
reach through multiple corridors in the face of
strong competition and bank mergers in the
market with the aim of maximising customer
experience. Currently the Bank maintains a wide
network of around 220 FI correspondent banks.
FI has also played a significant role in
implementing new technology such as
block-chain through Ripplenet. After
conducting successful transactions with one
of its correspondent banks, the Bank is now
working with others in different countries using
this technology.
Similarly, FI continues to play a significant role
in supporting the Bank’s Corporate business to
boost its market share in the highly competitive
Trade Finance market.
The Bank maintained its The Bank maintained its
top position by increasing top position by increasing
volume in cash deposit volume in cash deposit
machines, payroll, and machines, payroll, and
payroll cards.payroll cards.
About the BankAbout the Bank
Value DriversValue Drivers
LeadershipLeadership
StrategyStrategy
PerformancePerformance
Corporate GovernanceCorporate Governance
Financial ReportsFinancial Reports
Supplementary InformationSupplementary Information
An
nu
al
Re
po
rt
20
18
Review of Business Portfolio
65
Building new horizons in foreign exchange business
The Bank’s Foreign Exchange (FX) business
has embraced change, presenting customers
with innovative Islamic banking products
and digital solutions to offer convenient
and comprehensive financial solutions. The
Bank installed one of the most sophisticated
pricing engines for FX, and will now focus on
expanding this across its network. The Bank is
now able to offer competitive pricing which
moves in line with the market 24 hours a day.
The fully-integrated and automated FX pricing
engine has state-of-the-art technology to
process multiple FX prices across multiple
channels within seconds.
Bullion business
In parallel, the Bank has penetrated the
KSA bullion business by establishing a Bullion
Desk in a market where only few banks offer
such a service. The Treasury Group has also
increased its presence in the banknotes
business by expanding the existing ATM grid.
We initially added over 20 multi-currency
ATMs at key locations across the Kingdom.
The focus on Banknotes has redefined the
Bank’s standing in the KSA Inter-Bank market,
profiling us as a market maker in the wholesale
banknotes business.
OTC – Islamic FX forward and variants
The new Islamic hedging product for FX
was launched recently giving our clients the
flexibility to explore new opportunities to
hedge their future exchange exposure risks
within the Bank. The product is called the
“Islamic FX Forward” (IFX FWD) and is fully Sharia
compliant. This product contractually obligates
two parties to a reciprocal agreement, to
exchange a certain amount in one currency to
be exchanged to another currency at an agreed
future date and price. The IFX FWD has been at
the forefront, triggering further development in
the Treasury OTC Islamic product suite.
Islamic FX fl exible forward
This is an FX forward contract where settlement
is flexible and the client chooses the date of
settlement within the agreed/specific time
period. Such a product offers our clients the
flexibility to withdraw the required FX amount at
the agreed rate during the life of the contract.
Re-prioritise Tahweel business
In April 2018, the Bank’s remittances arm,
Tahweel Al Rajhi was migrated to Treasury to
garner greater synergies. Tahweel Al Rajhi is an
important element of our business, providing
local and global money transfer services and
banknotes services in addition to many other
premium services in keeping with our passion
to meet all our customers’ banking needs.
Tahweel has the largest network in the Kingdom
with 230 centres offering competitive banking
services using state-of-the-art technology and
serving customers around the clock.
In line with the Bank’s strategy to provide
services that are more convenient to customers,
Tahweel has added new electronic channels,
like Tahweel Mobile Application. Such
self-service banking channels allow customers
to add international beneficiaries, open new
memberships, and make transfers with greater
convenience, without the hassle of having
to line up at the centre. More than 55% of
Tahweel transactions are conducted through
E- channels. In addition, Tahweel has launched
Al Rajhi keyboard which is an online keyboard
that allows customers to execute transfers
through any chatting apps including social
media apps.
The Bank installed one of the The Bank installed one of the
most sophisticated pricing most sophisticated pricing
engines for FX, and will now engines for FX, and will now
focus on expanding this focus on expanding this
across its network. across its network.
About the BankAbout the Bank
Value DriversValue Drivers
LeadershipLeadership
StrategyStrategy
PerformancePerformance
Corporate GovernanceCorporate Governance
Financial ReportsFinancial Reports
Supplementary InformationSupplementary Information
An
nu
al
Re
po
rt
20
18
Review of Business Portfolio66
In 2019, our Treasury business will continue to
provide new innovative services and products
to the Bank’s customers in order to meet their
expectations and to enhance their experiences.
It will also continue to increase its contribution
to the Bank’s overall profitability.
Investments services and brokerage
Business performance
Retained its status as the leading broker on
Tadawul in 2018, Al Rajhi Capital grew its market
share to 20.26%. Asset Management continued
to perform strongly, with total assets under
Management increasing by 40% to SAR 38 Bn.
Its real estate business grew substantially
thanks to the successful IPO of the Al Rajhi
REIT Fund, which was oversubscribed by 174%.
Proprietary Investments, which are based on
income-generating assets, benefited from the
full-year impact of initiatives taken in 2017, and
contributed 24% to overall revenues in 2018.
These achievements were recognised by several
industry awards:
“Best Broker in Saudi Arabia” by EMEA Finance
“Broker of the Year” by Euromoney Global
Investor
“Best Provider of Sharia-Compliant Funds -
2018” by Global Finance
“Real Estate Investment Firm of the Year” from
Euromoney Global Investor
Awards such as the above reflect the strength
and diversity of Al Rajhi Capital’s investment
products and solutions, and the committed
efforts of the entire team.
Strategic progress
Towards the implementation of its five-year
strategy and growth vision for 2020, Al Rajhi
Capital introduced a number of key initiatives in
2018. The Company’s strategy is closely aligned
with the Kingdom’s Vision 2030, National
Transformation Plan 2020; and the Strategic
Plan 2019 of the Capital Market Authority.
Key strategic developments in 2018 include
the launch of a major digital transformation
initiative, to deliver products and services to
clients through digital channels based on a
“mobile first” approach.
During the year, the institutional client base
of Brokerage and Asset Management saw
encouraging growth, with the Institutional
Brokerage team partnering with two leading
regional brokers to execute transactions for
their clients. They helped to position Al Rajhi
Capital as the local broker of choice for
international clients.
With leading funds performing well, Asset
Management successfully added a number
of new discretionary institutional mandates
across asset classes. In addition, the IPO and
subsequent listing on Tadawul of the Al Rajhi
REIT Fund significantly expanded the real estate
business, with the Company’s overall real estate
portfolio now standing at over SAR 3 Bn.
Institutional capability was strengthened
through further enhancements to the critical
areas of employee capital, information
technology and digitisation, operations, risk
and compliance – ably supported by innovative
customer service and marketing initiatives.
In 2019, our Treasury In 2019, our Treasury
business will continue to business will continue to
provide new innovative provide new innovative
services and products to the services and products to the
Bank’s customers in order to Bank’s customers in order to
meet their expectations and meet their expectations and
to enhance their experiences.to enhance their experiences.
About the BankAbout the Bank
Value DriversValue Drivers
LeadershipLeadership
StrategyStrategy
PerformancePerformance
Corporate GovernanceCorporate Governance
Financial ReportsFinancial Reports
Supplementary InformationSupplementary Information

An
nu
al
Re
po
rt
20
18
Review of Business Portfolio
67
International business group
A pioneer in its field and the world’s largest
Islamic bank by capital, the Al Rajhi Bank
brand is one that is on par with other major
international banks around the globe.
Promoting and developing Islamic banking in
countries where the Bank operates through the
introduction of innovative banking products
is one of its key goals. During 2018, the Bank’s
International business performed well.
Al Rajhi Bank – Malaysia
Beginning the year with the announcement
of a new Chairman and member to the Board
of Directors the Bank’s Malaysia subsidiary
performed well during 2018. In fact, our Malaysia
operations outperformed all foreign-owned
Islamic banks in the country from 2014 to
2017, turning in another stellar performance in
2018. Signing an exclusive 10-year agreement
with Sun Life Malaysia Takaful Berhad, the Bank
appointed the former as its sole distributor
of Family Takaful products and services to
its150,000 customer base across the nation.
During the year, the During the year, the
institutional client institutional client
base of Brokerage and base of Brokerage and
Asset Management saw Asset Management saw
encouraging growth, with encouraging growth, with
the Institutional Brokerage the Institutional Brokerage
team partnering with two team partnering with two
leading regional brokers to leading regional brokers to
execute transactions for execute transactions for
their clients.their clients.
KSA18
10
2551
Presence and Branches
Jordan
Kuwait
Malaysia
About the BankAbout the Bank
Value DriversValue Drivers
LeadershipLeadership
StrategyStrategy
PerformancePerformance
Corporate GovernanceCorporate Governance
Financial ReportsFinancial Reports
Supplementary InformationSupplementary Information
An
nu
al
Re
po
rt
20
18
Review of Business Portfolio68
The Bank also expanded our Cash Management
System to be able to provide our customers
in Malaysia with an improved experience.
Keen to provide customers with products
that meet their needs, the Bank also focused
on expanding product offerings such as
Commodity Murabaha.
In the short term we will be looking to:
Drive corporate and retail deposits
Expand our digital offering by introducing
Retail Internet Banking and Tablet Banking
Tap into regional markets with new offerings
Keep investing in talent management
Roll out infrastructure improvements
Continue investing in IT solutions that
are focused on improving efficiency and
enhancing the customer experience.
(Refer Review of subsidiaries for more details.)
Al Rajhi Bank – Kuwait
The Bank became the first foreign bank in
Kuwait to launch a second branch in the
region after local regulations on foreign banks
were lifted.
The Bank’s collaboration with one of the
local banks to provide ATM access to our
customers is a one-of-a-kind project in Kuwait,
providing customers with a wider network
to access our banking services. The Bank also
began operating our first ever call centre in
Kuwait to provide customers with ready access
to their Bank in Kuwait. The Bank also launched
Ijara and Murabaha mortgages to better serve
our customers in Kuwait.
Al Rajhi Bank – Jordan
As part of its strategy to expand its network of
branches, the Bank opened three new branches
in Jordan, taking the total of branches in the
country to 10. Each branch will provide a
wide range of banking products and services
including home finance, personal finance,
car finance and commodities finance, in
addition to other products such as current
account, joint investment account and many
other financial solutions.
During the year under review, During the year under review,
the Bank’s International the Bank’s International
business performed business performed
as well as expected. as well as expected.
About the BankAbout the Bank
Value DriversValue Drivers
LeadershipLeadership
StrategyStrategy
PerformancePerformance
Corporate GovernanceCorporate Governance
Financial ReportsFinancial Reports
Supplementary InformationSupplementary Information
An
nu
al
Re
po
rt
20
1869
Review of Other Operations
Governance and legal group
The Governance and Legal Group has provided
through its sub-departments the expected
added value to the work of the Bank; therefore,
has succeeded in achieving numerous
accomplishments, and developed procedures
aimed to control business and reduce errors
and risks. For example, the Governance
Department has developed many policies,
practices, procedures and control processes
related to governance within the Bank including
Related Party Transactions and Dealing with
Conflicts of Interest Policy, ARB Board Members
Nomination and Appointment Policy and
Authorities Matrix for high-level management
to comply with regulatory requirements.
In addition, it has updated ARB Governance
Manual and has monitored performance of
different committees to ensure having an
approved charter for each committee; while it
has worked on creating new committees and
developing Charters of some committees to
meet business needs and requirements
of regulators.
Furthermore, it has monitored all approved
policies and procedures in ARB KSA and
overseas branches to be updated as required
and to assure abiding by development
requirements.
Governance Department aims at achieving
adherence of the Bank to all governance related
regulatory requirements and it represents the
Bank’s arm to set rules and regulations that
guarantee compliance of all business levels with
best practiced rules of governance.
Board Secretariat has finished all its assigned
jobs in a professional manner and has utilised
modern technology, represented in Convene
system, in circulation of Board and Executive
Committee resolutions to shorten the length
of processing proposals, ensure smooth and
efficient work flow in a timely manner with
immediate access of all Board and Executive
Committee members to Convene.
In addition, Board Secretariat has developed
work process by updating its business
regulations to be compatible with the Bank’s
strategy and targets. It has coordinated and
collaborated with all proposals’ stakeholders
to meet business requirements and achieve
the best interest for the Bank and other related
parties as per approved business regulations.
Board Secretariat has continued to follow up
with Board or Executive Committee members
and the management to ensure effective
processing of all matters related to their
resolutions and instructions.
The Legal Department continued to provide
legal and advisory services as an internal
consultant sector within the Bank and
document the Bank's rights to defend them in
order to preserve its assets and earnings.
The Shareholders Register Secretariat continued
to maintain its performance and professional
communication while implementing formal
regulations and abiding by their rules.
In addition to the disclosure of all mandatory
requirements and distribute all reports and
declarations, where all investors can review the
Bank’s performance on a regular basis.
To ensure that the Bank To ensure that the Bank
abides by all development abides by all development
and regulatory requirements, and regulatory requirements,
the Governance and Legal the Governance and Legal
Group monitored and, Group monitored and,
where necessary, updated where necessary, updated
all approved policies and all approved policies and
procedures for its businesses procedures for its businesses
across the Kingdom and at across the Kingdom and at
overseas branches. overseas branches.
About the BankAbout the Bank
Value DriversValue Drivers
LeadershipLeadership
StrategyStrategy
PerformancePerformance
Corporate GovernanceCorporate Governance
Financial ReportsFinancial Reports
Supplementary InformationSupplementary Information
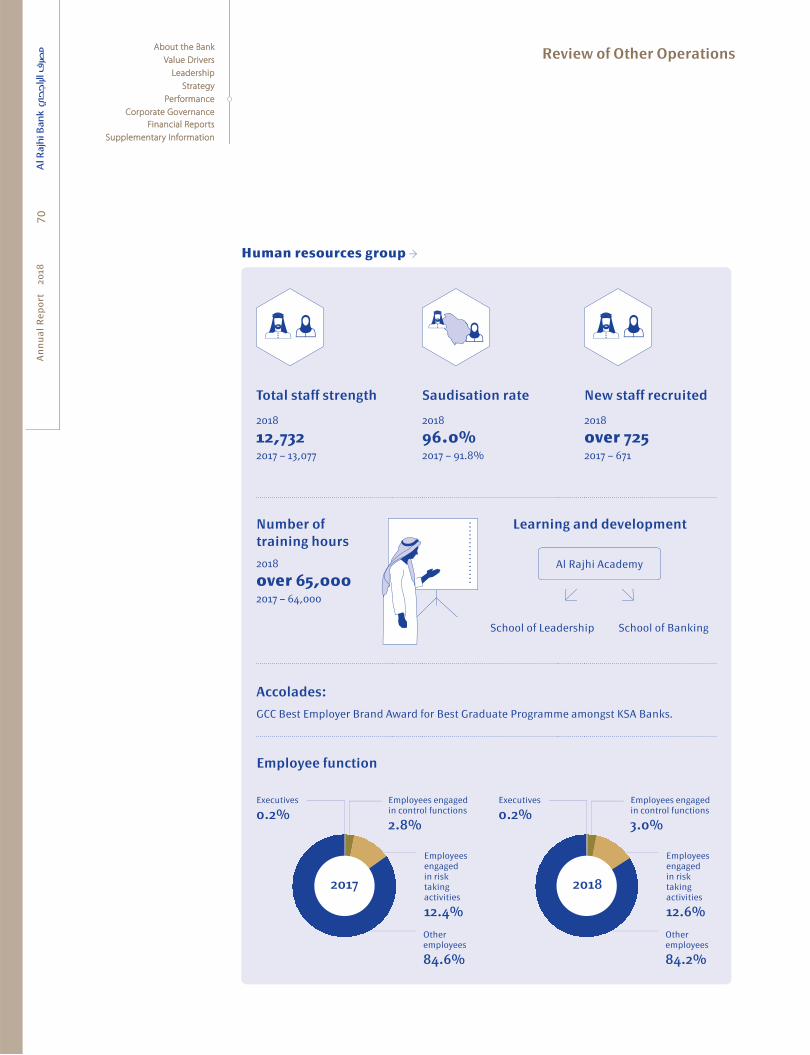
An
nu
al
Re
po
rt
20
18
Review of Other Operations70
Human resources group
Total staff strength
2018
12,7322017 – 13,077
Saudisation rate
2018
96.0% 2017 – 91.8%
New staff recruited
2018
over 725 2017 – 671
Number of training hours
2018
over 65,0002017 – 64,000
Learning and development
Al Rajhi Academy
School of Leadership School of Banking
Accolades:
GCC Best Employer Brand Award for Best Graduate Programme amongst KSA Banks.
Employee function
Employees engaged in control functions
2.8%
Other employees
84.6%
Employees engaged in risk taking activities
12.4%
Executives
0.2%
2017
Employees engaged in control functions
3.0%
Other employees
84.2%
Employees engaged in risk taking activities
12.6%
Executives
0.2%
2018
About the BankAbout the Bank
Value DriversValue Drivers
LeadershipLeadership
StrategyStrategy
PerformancePerformance
Corporate GovernanceCorporate Governance
Financial ReportsFinancial Reports
Supplementary InformationSupplementary Information
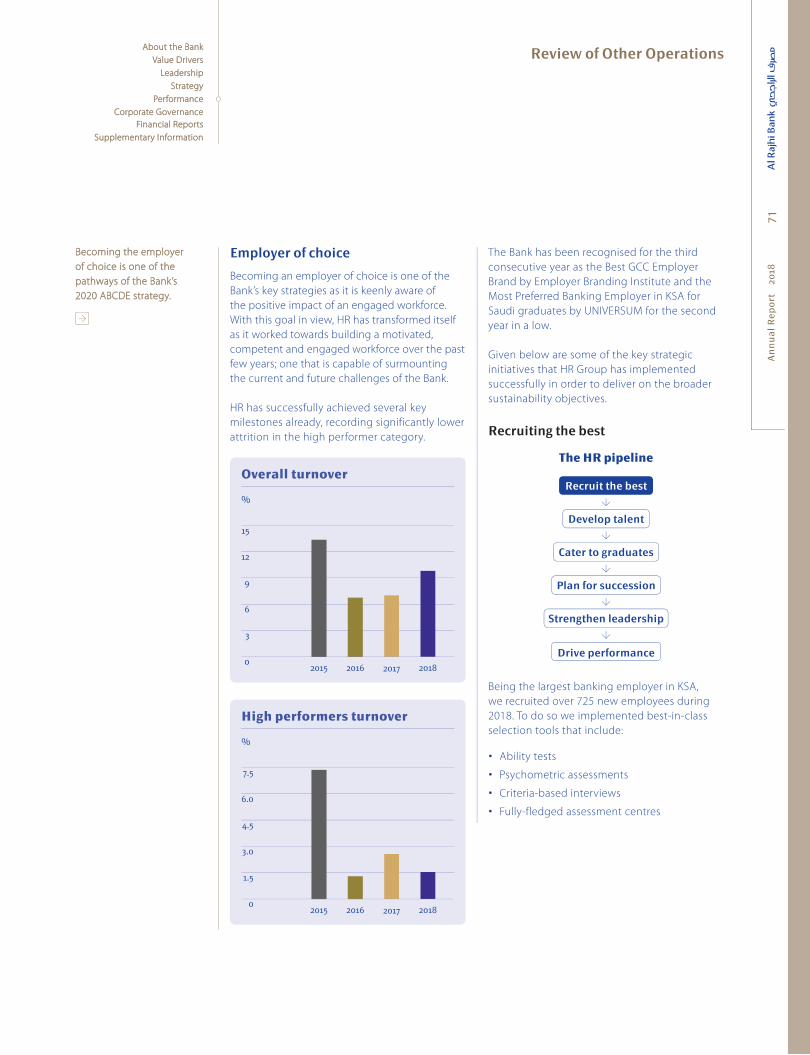
An
nu
al
Re
po
rt
20
18
Review of Other Operations
71
Employer of choice
Becoming an employer of choice is one of the
Bank’s key strategies as it is keenly aware of
the positive impact of an engaged workforce.
With this goal in view, HR has transformed itself
as it worked towards building a motivated,
competent and engaged workforce over the past
few years; one that is capable of surmounting
the current and future challenges of the Bank.
HR has successfully achieved several key
milestones already, recording significantly lower
attrition in the high performer category.
15
12
9
6
3
0201820172015 2016
Overall turnover
%
7.5
6.0
4.5
3.0
1.5
0201820172015 2016
High performers turnover
%
The Bank has been recognised for the third
consecutive year as the Best GCC Employer
Brand by Employer Branding Institute and the
Most Preferred Banking Employer in KSA for
Saudi graduates by UNIVERSUM for the second
year in a low.
Given below are some of the key strategic
initiatives that HR Group has implemented
successfully in order to deliver on the broader
sustainability objectives.
Recruiting the best
Recruit the best
The HR pipeline
Develop talent
Plan for succession
Strengthen leadership
Drive performance
Cater to graduates
Recruit the best
Being the largest banking employer in KSA,
we recruited over 725 new employees during
2018. To do so we implemented best-in-class
selection tools that include:
Ability tests
Psychometric assessments
Criteria-based interviews
Fully-fledged assessment centres
Becoming the employer Becoming the employer
of choice is one of the of choice is one of the
pathways of the Bank’s pathways of the Bank’s
2020 ABCDE strategy.2020 ABCDE strategy.
About the BankAbout the Bank
Value DriversValue Drivers
LeadershipLeadership
StrategyStrategy
PerformancePerformance
Corporate GovernanceCorporate Governance
Financial ReportsFinancial Reports
Supplementary InformationSupplementary Information

An
nu
al
Re
po
rt
20
18
Review of Other Operations72
Recruitments 2018
Head Office
45%
Branches
55%
To ensure a smooth and effective recruitment
process across all regions of the Kingdom we
partnered with and depended on:
Recruitment specialists
The on-boarding team
The automated on-boarding process
Developing and managing talent
The HR pipeline
Recruit the best
Develop talent
Plan for succession
Strengthen leadership
Drive performance
Cater to graduates
Once on board, new recruits are carefully
cultivated by the Talent Council to ensure that
they have the best experience with us and that
we create an environment that brings out their
latent talents.
Establishing sustainable core talent
management practices is an integral part
of the 2020 HR Strategy and a key driver for
achieving our strategic aspirations towards
becoming Employer of Choice. With this
intent, we have set up the ARB Talent Council,
under the patronage of our CEO to reflect
our commitment in developing strong Saudi
leadership. The Talent Council plays a critical
role in identifying, developing, nurturing and
mobilising the Bank’s Saudi talent. It prioritises
talent under the following categories for the
purpose of succession planning for critical roles
across the Bank:
Senior leaders – Tier 1
Junior leaders – Tier 2
Emerging leaders – Tier 3
Catering to graduates
The HR pipeline
Recruit the best
Develop talent
Plan for succession
Strengthen leadership
Drive performance
Cater to graduates
The Bank’s graduate programme has been rated
as the best among all the financial institutions
in the Kingdom for the second consecutive year
by UNIVERSUM. We adopt best in class selection
methodology, including an online ability test
and a motivational interview approach to select
the best Saudi graduates from different national
and international universities.
The Bank’s graduate programmes are also
designed to provide the necessary knowledge
foundation and resilience for young Saudi
female talent to navigate across the current
complex banking environment.
The Bank’s graduate The Bank’s graduate
programmes are also programmes are also
designed to provide the designed to provide the
necessary knowledge necessary knowledge
foundation and resilience foundation and resilience
for young Saudi female for young Saudi female
talent to navigate across the talent to navigate across the
current complex banking current complex banking
environment.environment.
About the BankAbout the Bank
Value DriversValue Drivers
LeadershipLeadership
StrategyStrategy
PerformancePerformance
Corporate GovernanceCorporate Governance
Financial ReportsFinancial Reports
Supplementary InformationSupplementary Information

An
nu
al
Re
po
rt
20
18
Review of Other Operations
73
To date, we have inducted over 150 graduates
within the Bank since the programme began in
2015. There are primarily two types of Graduate
programmes:
Graduate development programme:
The graduate development programme is an
18-month journey that includes classroom
learning, rotation with business and control
functions, attachment with Groups on live
projects, mentoring and coaching, and
contribution to our CSR initiatives. During
the year, we launched the Bank’s first
dedicated female graduate development
programme, the sixth such graduate
programme since its inception four years
before. So far, three batches have graduated,
and three are currently undergoing training.
Thematic development programme:
The thematic graduate development
programme is a 12-month journey and
is focused on building domain specific
capabilities. To date, we have implemented
four such programmes, dedicated
to Corporate Banking, SME, IT and
Transformation and Change Management.
Upon graduation, the participants will take
up roles within their respective business or
functional areas.
Planning for succession
The HR pipeline
Recruit the best
Develop talent
Plan for succession
Strengthen leadership
Drive performance
Cater to graduates
Succession Planning at Al Rajhi Bank is
undertaken with the following objectives
in mind:
Identifying critical positions within the
Bank which have a significant impact on its
financial and control functions
Identifying the status of these positions
(filled/vacant) and the availability of in-house
successors and their preparedness for
identified roles
Developing proactive strategies with respect
to succession planning
The identified successors undergo a variety
of development initiatives engineered and
launched by the HR team in 2018/19 to make
sure that the Bank is investing in bridging the
gaps between the identified successor and
his/her future targeted role.
Building strong business leaders
The HR pipeline
Recruit the best
Develop talent
Plan for succession
Strengthen leadership
Drive performance
Cater to graduates
The Bank has embarked on a mission to
establish the Al Rajhi Bank Academy to develop
the business and leadership capabilities of
its employees and meet the goals of its 2025
strategy to be the Employer of Choice. The
Academy consists of two key pillars, the School
of Leadership and the School of Banking.
During 2018, more than 65,000 training hours
were delivered to ARB employees covering
different domains such as technical, regulatory,
leadership, and personal effectives.
During 2018, more than During 2018, more than
65,000 training hours were 65,000 training hours were
delivered to ARB employees delivered to ARB employees
covering different domains covering different domains
such as technical, regulatory, such as technical, regulatory,
leadership, and personal leadership, and personal
effectiveness. effectiveness.
About the BankAbout the Bank
Value DriversValue Drivers
LeadershipLeadership
StrategyStrategy
PerformancePerformance
Corporate GovernanceCorporate Governance
Financial ReportsFinancial Reports
Supplementary InformationSupplementary Information
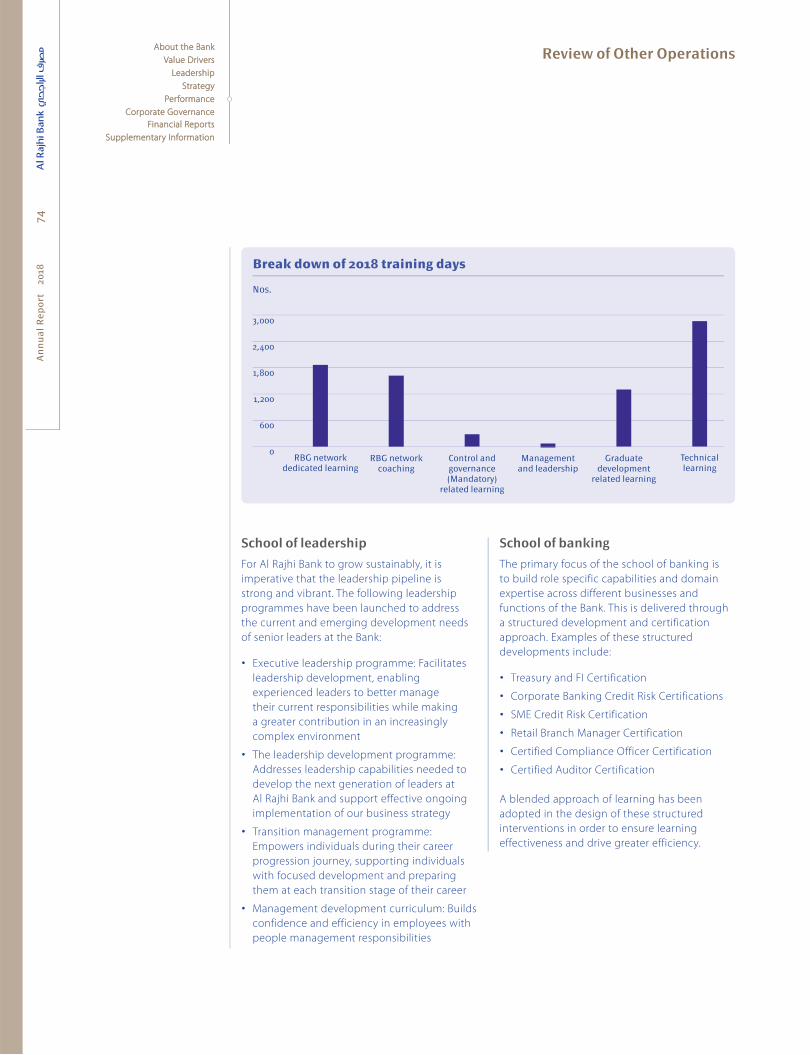
An
nu
al
Re
po
rt
20
18
Review of Other Operations74
3,000
2,400
1,800
1,200
600
0RBG network
coachingControl and governance (Mandatory)
related learning
Management and leadership
Graduate development
related learning
RBG network dedicated learning
Break down of 2018 training days
Nos.
Technical learning
School of leadership
For Al Rajhi Bank to grow sustainably, it is
imperative that the leadership pipeline is
strong and vibrant. The following leadership
programmes have been launched to address
the current and emerging development needs
of senior leaders at the Bank:
Executive leadership programme: Facilitates
leadership development, enabling
experienced leaders to better manage
their current responsibilities while making
a greater contribution in an increasingly
complex environment
The leadership development programme:
Addresses leadership capabilities needed to
develop the next generation of leaders at
Al Rajhi Bank and support effective ongoing
implementation of our business strategy
Transition management programme:
Empowers individuals during their career
progression journey, supporting individuals
with focused development and preparing
them at each transition stage of their career
Management development curriculum: Builds
confidence and efficiency in employees with
people management responsibilities
School of banking
The primary focus of the school of banking is
to build role specific capabilities and domain
expertise across different businesses and
functions of the Bank. This is delivered through
a structured development and certification
approach. Examples of these structured
developments include:
Treasury and FI Certification
Corporate Banking Credit Risk Certifications
SME Credit Risk Certification
Retail Branch Manager Certification
Certified Compliance Officer Certification
Certified Auditor Certification
A blended approach of learning has been
adopted in the design of these structured
interventions in order to ensure learning
effectiveness and drive greater efficiency.
About the BankAbout the Bank
Value DriversValue Drivers
LeadershipLeadership
StrategyStrategy
PerformancePerformance
Corporate GovernanceCorporate Governance
Financial ReportsFinancial Reports
Supplementary InformationSupplementary Information
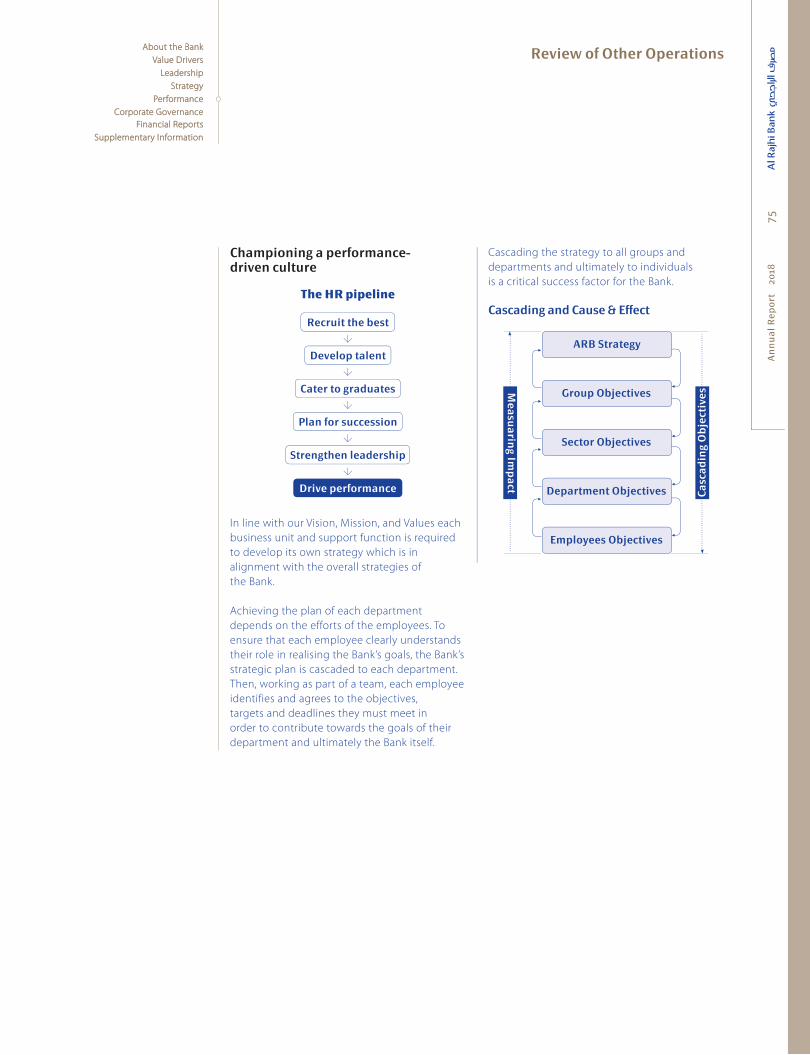
An
nu
al
Re
po
rt
20
18
Review of Other Operations
75
Championing a performance-driven culture
The HR pipeline
Recruit the best
Develop talent
Plan for succession
Strengthen leadership
Drive performance
Cater to graduates
In line with our Vision, Mission, and Values each
business unit and support function is required
to develop its own strategy which is in
alignment with the overall strategies of
the Bank.
Achieving the plan of each department
depends on the efforts of the employees. To
ensure that each employee clearly understands
their role in realising the Bank’s goals, the Bank’s
strategic plan is cascaded to each department.
Then, working as part of a team, each employee
identifies and agrees to the objectives,
targets and deadlines they must meet in
order to contribute towards the goals of their
department and ultimately the Bank itself.
Cascading the strategy to all groups and
departments and ultimately to individuals
is a critical success factor for the Bank.
Cascading and Cause & Effect
Group Objectives
Sector Objectives
Department Objectives
Employees Objectives
ARB Strategy
Ca
sca
din
g O
bje
ctiv
es
Mea
sua
ring Im
pa
ct
About the BankAbout the Bank
Value DriversValue Drivers
LeadershipLeadership
StrategyStrategy
PerformancePerformance
Corporate GovernanceCorporate Governance
Financial ReportsFinancial Reports
Supplementary InformationSupplementary Information

An
nu
al
Re
po
rt
20
18
Review of Other Operations76
These key performance indicators are met through the Performance Management System, which
helps document each employee’s progress. It consists of three main phases as shown below:
Performance management
cycle
Identifying areas for
improvement (training)
Fill and sign the final
appraisal form for the year
Evaluate performance
with evidences
Ongoing monitoring,
coaching and feedback
Setting objectives with timelines and
target
Conduct mid year review and
performance discussion
Beginning of the year
Setting objectives with timelines and targets
Fill and sign the final appraisal form for the year
Middle of the year
Ongoing monitoring, coaching and feedback
Conduct mid-year review and performance discussion
End of the year
Evaluate performancewith evidence
Identify areas for development
3 1
2
The key pillars of the Bank’s compensation
framework are:
1. Governance – Board of Directors oversight
2. Policies and procedures
3. Compensation structure and
incentive schemes
Risk factors are an integral part of the balanced
scorecard for performance management
of Senior Executives. The Bank’s total
compensation approach comprises fixed
and variable compensation. The variable
components are in alignment with good
corporate governance and include claw back
and holdback arrangements.
These key performance These key performance
indicators are met indicators are met
through the Performance through the Performance
Management System, which Management System, which
helps document each helps document each
employee’s progress.employee’s progress.
Pay for Performance Rewards Culture
To ensure consistency and comparability,
the Bank has developed its Employee Value
Proposition and Compensation policies
and practices on a differentiated, pay-for-
performance-and-potential model that is
linked to the Bank’s and the individual’s
performance and market pay position.
The Bank’s rewards strategy and policies are in
complete alignment with SAMA’s requirements.
In February 2018, the Human Resources Group
completed a self-assessment review of the
Bank’s Compensation Incentive Schemes
against SAMA rules and FSB standards.
About the BankAbout the Bank
Value DriversValue Drivers
LeadershipLeadership
StrategyStrategy
PerformancePerformance
Corporate GovernanceCorporate Governance
Financial ReportsFinancial Reports
Supplementary InformationSupplementary Information

An
nu
al
Re
po
rt
20
18
Review of Other Operations
77
Digitised HR services
In line with the Bank’s ABCDE Roadmap and the
HR Strategy to Become an Employer of Choice,
the Human Resources Group launched “SAHL”, a
new generation HR Services application. “SAHL”
is a mobile application that is compatible with
IOS and Android and is integrated with HR
systems that provide employees with the ability
to execute their HR Services anywhere, anytime.
It improves the convenience, efficiency and
reliability of HR services.
Embracing the Kingdom’s Vision 2030
100
80
60
40
20
02014 201820172015 2016
Saudisation trend
%
In line with Vision 2030, the Bank increased its In line with Vision 2030, the Bank increased its
Saudisation ratio to 96% by end of 2018 and increased Saudisation ratio to 96% by end of 2018 and increased
the female workforce by 32% since 2016.the female workforce by 32% since 2016.
HR Governance
A dedicated Governance Unit has been
established within HR covering audit, risk,
compliance and SAMA-related matters.
As one of the largest banking workforces
in the Kingdom, it is of critical importance
that HR maintains strict control and adherence
to all policies, procedures and regulatory
guidelines. Standardised Control and Risk
Governance KPIs are included in all relevant
employees’ scorecards.
Employee engagement and communication
The Bank promotes a culture of strong open
communication with all employees to assess
engagement levels and identify areas that
require further attention. Communication
channels include:
Pulse surveys
Focus group discussions
HR Newsletter
Online employee communication portal
TAWASUL
Annual roadshows and town halls
Ramadan family activities
The overall engagement score significantly
improved in 2018 and we continue to enhance
HR solutions and deliverables to meet employee
expectations.
The Bank promotes a The Bank promotes a
culture of strong open culture of strong open
communication with communication with
all employees to assess all employees to assess
engagement levels and engagement levels and
identify areas that require identify areas that require
further attention.further attention.
About the BankAbout the Bank
Value DriversValue Drivers
LeadershipLeadership
StrategyStrategy
PerformancePerformance
Corporate GovernanceCorporate Governance
Financial ReportsFinancial Reports
Supplementary InformationSupplementary Information
An
nu
al
Re
po
rt
20
18
Review of Other Operations78
Shared Services Group
Information Technology (IT) Department
Throughout 2018, the Bank’s IT Department
continued on its journey towards
transformation and digitisation (refer Digital
Footprint on page 54 for a detailed overview).
Under the patronage of the IT Steering
Committee, multi-year strategic programmes
were initiated and are now well underway,
moving the Bank forward in its ambition to
become the leading digital bank in the region.
Against a backdrop of tightening local and
international regulations, the IT Department
implemented more than 400 initiatives, directly
contributing to the Bank’s strategic agenda,
including:
Regulatory and compliance: Increased
stability and security
Revenue generation and cost efficiency:
Improved profitability
Meeting customer needs: Increased customer
satisfaction
New and improved digital channels and
services: Faster time-to-market
As part of the multi-year transformation journey,
Internet and Mobile banking continues to be
a key focus of our Digital Agenda. Multiple
enhancements have been introduced for both
Retail and SME customers to improve not only
the available services but, importantly, the
Internet and Mobile customer experience. The
integration of the Al Rajhi Mobile Application
with WhatsApp is a great example of innovation
that enhanced the user experience and ease of
use for customers to Bank with Al Rajhi (Refer
Contact Centre Department on page 79).
A richer array of self-service options has been
introduced within our ATM network enabling a
broader spectrum of banking services outside
Branch hours for customers who prefer physical
to virtual interaction.
The Bank continued its focus on cyber security
to maintain safe and secure services for
customers, 24 hours a day, and seven days a
week. This strategy has enabled the Bank to
mitigate and address cyberattacks with zero
impact on customers.
The Bank’s emphasis on customer centricity
requires “state-of-the-art” customer relationship
management tools. During the year, we
empowered our call centre agents with tools
that provided a comprehensive 360o view of
customer needs, enabling us to act swiftly to
fulfil customer requests or address issues.
The Bank also extended the types of accounts
available to customers to enable a broader
set of services to accommodate the needs of
our diverse customer segments. New account
types include:
Citizen account
Family
Escrow
Virtual accounts
Technology is at the heart of our customer
experience as we continue to maintain
and support the needs of our nine million
customers, safely and securely.
Operations Excellence and Governance Department
During the year, this department continued
its focus on reducing errors and enhancing
the customer experience. It did so by bringing
efficiency and cost effectiveness to end-to-end
processes throughout the Bank’s back-office
functions over the short to medium term.
This involves:
Making changes to our current
operating model
Streamlining processes
Implementing control enhancements
Employing the latest technology
As part of the multi-year As part of the multi-year
transformation journey, transformation journey,
Internet and Mobile banking Internet and Mobile banking
continues to be a key focus continues to be a key focus
of our Digital Agenda.of our Digital Agenda.
About the BankAbout the Bank
Value DriversValue Drivers
LeadershipLeadership
StrategyStrategy
PerformancePerformance
Corporate GovernanceCorporate Governance
Financial ReportsFinancial Reports
Supplementary InformationSupplementary Information

An
nu
al
Re
po
rt
20
18
Review of Other Operations
79
On its journey towards operational excellence
the Bank implemented the following initiatives:
Robotic solutions for retail credit approvals,
sanction screening and other operational
processes
Managed services for functions like
reconciliations and card operations
Outsourcing of cash centre operations
One of the most important responsibilities
of this department is to ensure that the Bank
is in compliance with internal and external
policies and regulations. We also ensure that the
Shared Services group is compliant with Audit,
Compliance and Risk requirements. The creation
of this function has helped to improve the
control environment across the Shared Services.
Over the forthcoming year, the focus will be on
rolling these initiatives to other lines of business
in the Bank so that efficiency and effectiveness
can be further improved across the Bank.
Contact Centre Department
The Contact Centre’s objectives are:
To enhance the after-sale services
To respond promptly and effectively to
customer inquiries and requests
To resolve complaints to the customer’s
satisfaction
A snapshot of Contact Centre activity in 2018:
Received more than 7.8 million calls
Received over 1.4 million service requests
Resolved over 204,000 complaints
The Bank successfully launched a new customer
relationship management system, with the 360
degree view of the customer as mentioned
previously. Innovations such as these help us
win the customer’s loyalty and trust, knowing
that we care enough to listen and respond to
their banking needs. We also use a predictive
complaints system using big data technology
to resolve customer issues proactively.
In line with the Bank’s strategy of Digital
Leadership, the Contact Centre launched the
“WhatsApp Channel” – the first bank in the
Kingdom to launch WhatsApp services using
an official business number. This is part of our
omni-channel programme which is designed
to enhance other Contact Centre channels like
email and social media to deliver a seamless
experience across all customer touch points.
Business Operations and Support Department
The Bank’s Business Operations arm takes
responsibility for the smooth delivery of
banking services, handling all back office
operations for all business lines within the Bank.
Its key activities include:
Managing cash and operations for
ATM and Point of Sale (POS)
Managing cash collections and despatching
to branches, Tahweel Centre and retailers
Handling domestic and international
payments
Managing back office for Treasury activities
Processing trade transactions
Processing credit applications for retail
customers
Executing lending deals for corporate,
Mid corporate and SME customers
Supporting all consumer products operations
such as personal loans, credit cards, car lease
and real estate
Archiving documents and ensuring their
authenticity, quality and compliance with
the regulatory instructions
During the year, the Department focused on
improving process efficiency and the control
environment. Business Operations optimised
cash management across all channels and
improved ATM availability to meet and exceed
SAMA service levels. We also improved
processes aimed at reducing customer ATM
claims, streamlining insurance for cars and real
estate assets, and reducing turnaround time for
credit approvals and ancillary services.
The Bank’s Business The Bank’s Business
Operations arm takes Operations arm takes
responsibility for the smooth responsibility for the smooth
delivery of banking services, delivery of banking services,
handling all back office handling all back office
operations for all business operations for all business
lines within the Bank.lines within the Bank.
About the BankAbout the Bank
Value DriversValue Drivers
LeadershipLeadership
StrategyStrategy
PerformancePerformance
Corporate GovernanceCorporate Governance
Financial ReportsFinancial Reports
Supplementary InformationSupplementary Information

An
nu
al
Re
po
rt
20
18
Review of Other Operations80
The Bank implemented a new payments system
which provides it with a platform to introduce
advance payment services. A new fraud
management system was also implemented to
cover the cards acquiring side of transactions.
In addition, we are utilising the services of
specialised vendors who undertake non-core
activities. All these strategies have not just
enhanced efficiency but will also support
standardisation of processes and reduce
operational costs for the Bank.
During 2019, the Department will focus
on the following:
Realigning Business Operations’ end-to-end
accountability model
Further improving service delivery and the
customer experience
The Properties and Support Services
Department is responsible for the management
and implementation of all engineering
projects for the Bank, from planning, design
and construction to renovation and operation,
across of all its properties in all regions of
the Kingdom. The Department is currently
maintaining and supporting more than
900 branches and remittance centres and
more than 5,000 ATMs.
In 2018, the Department successfully
completed the head office building, Al Rajhi
Tower, with a built up area of 100,000m2, and
the operations and technology building, North
Ring Road Complex with a built up area of
68,000m2. Together the buildings have a staff
capacity of more than 3,000 employees and
offers state-of-the-art facilities. Catering to
employee needs these facilities include:
Educational and administrative facilities
State-of-the-art gym
Break out areas for team collaborations
Mosque
Medical unit
Fully-catered dining area
Ample parking spaces for the entire
employee cadre
In addition, the Department completed the
new ladies’ headquarters occupying 22,000m2
with a staff capacity of more than a 1,000
female employees.
The Department is responsible for managing
all of the Bank’s suppliers and service providers
in terms of contracts, purchase orders and
invoices.
It is also responsible for providing security
and safety for all Bank assets in the
Kingdom, through the application of various
policies, technologies, and security devices to
ensure safe work flow at all times.
Compliance Group
Compliance and financial crimes risks have
become some of the most significant ongoing
concerns for financial institutions in the
Kingdom, where regulatory penalties have
dramatically increased since 2016 and the
scope of regulatory focus continues to expand.
Accordingly, the Compliance Group has
expanded beyond offering advice on statutory
rules, regulations, and laws and become an
active regulatory co-owner of risk, providing
independent oversight over the control
framework. The new approach starts by defining
which risks apply to a given business process
and identifying where exactly in the process
they occur.
The Compliance Group supports the Bank in
achieving its objectives by complying with all
rules and regulations applicable within the
Kingdom of Saudi Arabia and covered by global
standards and best practice.
The Compliance Group has two main functions:
compliance and financial crimes.
Compliance is mainly responsible for:
Interpreting the regulatory requirements
Identifying the associated risk that might
impact the Bank’s reputation
Implementing regulatory requirements
The Compliance Group The Compliance Group
supports the Bank in supports the Bank in
achieving its objectives by achieving its objectives by
complying with all rules complying with all rules
and regulations applicable and regulations applicable
within the Kingdom of Saudi within the Kingdom of Saudi
Arabia and covered by global Arabia and covered by global
standards and best practice. standards and best practice.
About the BankAbout the Bank
Value DriversValue Drivers
LeadershipLeadership
StrategyStrategy
PerformancePerformance
Corporate GovernanceCorporate Governance
Financial ReportsFinancial Reports
Supplementary InformationSupplementary Information

An
nu
al
Re
po
rt
20
18
Review of Other Operations
81
Financial Crimes is a specialised department
that is responsible for combating:
Money laundering
Terrorism financing
Financing weapons of mass destruction
Bribery and corruption
Sanction and name screening
Self-supervision
The Group Chief Compliance Officer (GCCO)
leads the compliance function and assists
Management in identifying and assessing
compliance issues and in guiding and
educating staff on related matters. The GCCO
has a direct contact with the Board of Directors,
Chairman of the Board or its members. In
addition, he directly reports to the Board Audit
and Compliance Committee, and also reports to
the CEO administratively.
The GCCO has oversight of the Compliance
programmes of the Bank’s Overseas Branches
(Jordan and Kuwait) and Banking Subsidiary
(Malaysia).
Key accomplishments in 2018
Major investments in governance, systems, data,
processes and people capabilities were made
over the past three years.
Described below are the key accomplishments
in 2018:
Compliance organisation and people:
The Bank continues to invest in Compliance.
The current headcount of the Compliance
Department as of December 2018 is 151,
a growth of 147 % in FTE count. Female
staff number 16. Training and awareness
campaigns continued to be enhanced and
expanded across the Bank.
Transaction monitoring and reporting of
suspicious transactions (AML): In 2018,
the latest version of the AML Transaction
Monitoring System was introduced
with improved visual analytics and case
Major investments in Major investments in
governance, systems, data, governance, systems, data,
processes and people processes and people
capabilities were made capabilities were made
over the past three years. over the past three years.
management features implemented in the
Kingdom, Jordan, and Kuwait. A Robotics
Process Automation solution was also
introduced.
Sanctions programme: The Bank made
major enhancements to its Sanctions
Programme. In 2018, the Bank implemented
the “Daily-Delta Screening” methodology.
Using this solution, the Bank’s customers and
beneficiaries are screened on a daily basis
against sanction list updates.
Customer risk assessment: The Customer
Risk Assessment Methodology and model
was enhanced in 2018. The AML risk rating for
all customers (KSA, Jordan, and Kuwait) was
updated.
Compliance management system:
An automated Compliance Management
System was implemented which contains the
compliance catalogue (library of regulatory
requirements) and risk registers. This system
was rolled out across Saudi Arabia, the Bank’s
overseas branches (Jordan and Kuwait) and
its subsidiary (Malaysia).
Compliance training and awareness:
Major programmes delivered to improve the
training and awareness across all three lines
of defense.
World-class compliance: Our vision for 2019 compliance programme
In line with global best practices in 2019, the
Compliance Group will focus on emerging
risks surrounding “disruptive” technologies and
innovations. These include assessment and
mitigation of:
Money laundering and terrorist
financing risks
On-line customer on-boarding
Robotics process automation
Block-chain
About the BankAbout the Bank
Value DriversValue Drivers
LeadershipLeadership
StrategyStrategy
PerformancePerformance
Corporate GovernanceCorporate Governance
Financial ReportsFinancial Reports
Supplementary InformationSupplementary Information

An
nu
al
Re
po
rt
20
18
Review of Other Operations82
The Internal Audit Group’s The Internal Audit Group’s
Mission is assuring the Board Mission is assuring the Board
of Directors independently of Directors independently
and objectively about the and objectively about the
efficiency and effectiveness efficiency and effectiveness
of internal audit systems, of internal audit systems,
risk management, Bank risk management, Bank
governance and the optimal governance and the optimal
use of available resources use of available resources
to achieve the operational to achieve the operational
and strategic objectives of and strategic objectives of
the Bank.the Bank.
Internal audit group
Internal audit represents the third defence
line that provides reasonable assurance
on the efficiency and effectiveness of
other control functions, including Risk and
Compliance Departments as second line of
defence. Moreover, the role of the Executive
Management of the Bank includes designing
and implementing effective internal controls
as a first line of defence. The Internal Audit
Group’s objectives include providing to the
Board of Directors reasonable, objective and
independent assurance on the efficiency
and effectiveness of internal control systems,
risk management, and Bank’s governance
including integrity and accuracy of information,
regulatory reporting, level of compliance
with policies, regulatory requirements, assets
safeguarding measures and best utilisation of
resources to achieve the Bank’s operating and
strategic objectives.
The work scope of Internal Audit Group
includes: Bank’s activities within the Kingdom,
oversight of internal audit activities located in
overseas branches and subsidiaries.
To achieve its objectives, internal audit carries
out its activities following a risk-based audit
approach and the international auditing
standards issued by The Institute of Internal
Auditors supported by a qualified, skilled and
experienced team to carry out its activities in
an effective and professional manner. To ensure
effectiveness and transparency, the audit team
has been granted the required access to the
Bank’s records, systems, employees’ activities
and unlimited access to Bank’s premises.
Corporate social responsibility
In 2018, the Bank gave back to the communities
within which it operates by initiating several
social responsibility programmes that included
the participation of Bank employees.
75 social responsibility programmes in 22 cities
2,904 volunteer employees
2,288 male volunteers
616 females
11,215 volunteer hours
by males
2,900 volunteer hours by females
Total volunteer hours
14,115
The Bank was keen to ensure diversity in
groups that benefited from these programmes
including:
The differently-abled
Orphans
The unfortunate
Those with special needs
In addition, the Bank supported anti-smoking
programmes and focused on raising financial
awareness in secondary schools in Riyadh.
The Bank participated in international days to
raise awareness of important issues and spread
knowledge within the community.
About the BankAbout the Bank
Value DriversValue Drivers
LeadershipLeadership
StrategyStrategy
PerformancePerformance
Corporate GovernanceCorporate Governance
Financial ReportsFinancial Reports
Supplementary InformationSupplementary Information

An
nu
al
Re
po
rt
20
1883
Subsidiaries
Al Rajhi Bank Malaysia
An Islamic bank licensed under Islamic financial
services law issued in 2013, incorporated and
practices its business in Malaysia.
Al Rajhi Capital
A closed joint stock company, registered in KSA
to work as a main agent and/or provide financial
brokerage services, insurance, management,
consultancy, arrangements and book keeping.
Al Rajhi Takaful Agency
A limited liability company, registered in KSA to
work as an agent to practice insurance brokerage
activities according to agency agreement with
Al Rajhi Cooperative Insurance Company.
Review of Subsidiaries and International Branches
Al Rajhi Development Company Ltd.
A limited liability company registered in KSA
to support real estate finance programmes
of ARB by transferring and keeping real
estate ownership documents in its name on
behalf of the Bank, collect revenues of selling
some properties sold by the Bank, provide
consultancies in real estate and engineering
field, register real estate contracts and
supervising real estate valuation.
Al Rajhi Services Company
A limited liability company registered in KSA to
provide recruitment services.
There are no loans on the Bank or its subsidiaries
(whether payable on demand or others).
To meet its goals, including To meet its goals, including
the promotion and the promotion and
development of Islamic development of Islamic
banking within and beyond banking within and beyond
the Kingdom’s borders, the Kingdom’s borders,
the Bank has established the Bank has established
a number of subsidiaries a number of subsidiaries
of which it owns all or a of which it owns all or a
majority of shares. majority of shares.
Subsidiary name Capital Ownership
%
Country
(place of operation)
Country
(place of foundation)
Al Rajhi Bank Malaysia 1,051,714,300 100 Malaysia Malaysia
Al Rajhi Capital 500,000,000 100 KSA KSA
Al Rajhi Takaful Agency 2,000,000 99 KSA KSA
Al Rajhi Development Company Ltd. 1,000,000 100 KSA KSA
Al Rajhi Services Company 500,000 100 KSA KSA
International Branches
Al Rajhi Bank (Kuwait)
A foreign branch registered with the Central
Bank of Kuwait.
Al Rajhi Bank (Jordan)
A foreign branch operating in Hashemite
Kingdom of Jordan providing all financial,
banking, and investments services and
importing and trading in precious metals and
stones in accordance with Islamic Sharia rules
and under the applicable banking law.
Subsidiary name Capital Ownership
%
Country
(place of operation)
Country
(place of foundation)
Al Rajhi Bank Kuwait 389,888,426 100 Kuwait Kuwait
Al Rajhi Bank Jordan 264,842,950 100 Jordan Jordan
About the BankAbout the Bank
Value DriversValue Drivers
LeadershipLeadership
StrategyStrategy
PerformancePerformance
Corporate GovernanceCorporate Governance
Financial ReportsFinancial Reports
Supplementary InformationSupplementary Information
An
nu
al
Re
po
rt
20
18
Review of Subsidiaries and International Branches84
About the BankAbout the Bank
Value DriversValue Drivers
LeadershipLeadership
StrategyStrategy
PerformancePerformance
Corporate GovernanceCorporate Governance
Financial ReportsFinancial Reports
Supplementary InformationSupplementary Information
Number one banking brand in the Kingdom of Saudi Arabia Brand Finance

An
nu
al
Re
po
rt
20
18
85
About the BankAbout the Bank
Value DriversValue Drivers
LeadershipLeadership
StrategyStrategy
PerformancePerformance
Corporate GovernanceCorporate Governance
Financial ReportsFinancial Reports
Supplementary InformationSupplementary Information
85
Corporate Governance
An
nu
al
Re
po
rt
20
18

An
nu
al
Re
po
rt
20
1886
About the BankAbout the Bank
Value DriversValue Drivers
LeadershipLeadership
StrategyStrategy
PerformancePerformance
Corporate GovernanceCorporate Governance
Financial ReportsFinancial Reports
Supplementary InformationSupplementary Information
Corporate governance encompasses the set
of rules, practices, systems and procedures
which direct and control the activities of an
organisation. The governance structure helps
the Organisation to balance the interests of
the various stakeholders in the process of
value creation.
Policies relating to the governance manual
In 2014, the Bank issued a Corporate
Governance Manual and a Governance Manual
Supplement which includes term of references
(Charters) for Board Committees and
Management Committees.
These documents are subject to annual review.
Furthermore, the Bank applies the key principles
of the Saudi Arabian Monetary Authority’s
(SAMA) Corporate Governance Principles for
Banks operating in the Kingdom of Saudi Arabia
that was issued in June 2012, as updated on
23 March 2014, in addition to Capital Market’s
Authority’s (CMA) Corporate Governance
Regulations and International best practices
A number of policies, practices and procedures
relating to corporate governance have been
developed. The Governance Manual was
updated during the year. The Delegation of
Authorities (DOA) matrix has been amended
to adequately reflect internal practices.
A comprehensive policy of the Bank relating
to Management of Related Parties Transactions
and conflicts of interest was adopted in
2018 in order to address relevant regulatory
requirements from the Companies Law, CMA
Governance Manual and SAMA’s principles
and guidelines; a policy for Nomination and
Membership in the Board of Directors was
adopted by the General Assembly Meeting held
on 4 March 2013 and was further amended and
approved by the General Assembly Meeting
held on 22 October 2017 to reflect all the
changes derived from the Companies law and
relevant regulations from CMA and SAMA,
detailed procedures were developed in 2018.
In addition, a policy for Remunerations and
Compensation of Board Members was approved
by the General Assembly Meeting held on
22 October 2017, such policy provides detailed
approach for determination of remuneration
paid to Board and External members within the
Board of Directors, Board Committees and Audit
and Compliance Committee.
The competencies and functional succession
policy and plans has also been adopted both
for Board members and key positions within
Executive Management. This provides for career
development for staff with high potential and
also meets the immediate and future staffing
needs of the Bank. It also promotes Saudization.
The Whistle-Blowing policy encourages the
reporting of improper behavior or any activity
that violates the Bank’s policies, procedures and
instructions.
The Bank, through its comprehensive disclosure
policy, ensured that all material information,
inclusive of banking information required to
be disclosed by SAMA and CMA regulations is
disclosed to shareholders. The Bank has also
adopted a policy for social responsibility,
that aims at strengthening the social role
of the Bank.
The Bank has developed an Introduction
Pack to assist new Board members. This pack
contains information on the financial and legal
aspects of the Bank. In addition, Board members
are provided with all information needed to
perform their duties. They are also provided
with training on any relevant subject including
the regulatory, financial and economic aspects
pertaining to the Bank and its operating
environment.
The Bank has procedures in place to settle
customer complaints which are monitored
by the SAMA.
Corporate Governance

An
nu
al
Re
po
rt
20
18
Corporate Governance
87
About the BankAbout the Bank
Value DriversValue Drivers
LeadershipLeadership
StrategyStrategy
PerformancePerformance
Corporate GovernanceCorporate Governance
Financial ReportsFinancial Reports
Supplementary InformationSupplementary Information
Corporate Governance Regulations of the CMA
Bank has given due cognisance to the
currently applicable corporate governance
regulations as enumerated by the Capital
Market Authority of the KSA. Given below is a
report on corporate governance practices at
the Bank and the extent of compliance with
the relevant CMA regulations.
Implementation and non-implementation of provisions of the CMA Regulations
The Bank applies all provisions of Corporate
Governance Regulations issued by the Capital
Market Authority (CMA), except the following
guiding provisions:
Profi les of the members of Board, Committee and Executive Management
Board structure
The Board of Directors of the Bank comprises
11 members elected by the Ordinary General
Assembly every three years. Any member may
stand for re-election after completing his or her
term in accordance with the Bank’s regulations.
Refer Board of Directors on page 18 and
Executive Management on page 22 for the
profiles of the Members of Board, Committee
and Executive Management.
Article Requirements Reasons for not applying
Article (41) –
Clause “E”
The Board shall carry out the necessary
arrangements to obtain an assessment
of its performance from a competent
third party every three years.
(Guiding paragraph)
The assessment is conducted
internally on an annual basis.
Article (54) –
Clause ”B”
The Chairman of the Audit Committee
shall be an Independent Director.
(Guiding paragraph)
A Non-Executive Board member chairs
the Audit and Compliance Committee
at ARB and he has been selected
based on his qualifications which are
found appropriate for the position.
Article (87) The Ordinary General Assembly, based
on the Board recommendation, shall
establish a policy that guarantees a
balance between its objectives and
those of the community for purposes
of developing the social and economic
conditions of the community.
(Guiding article)
ARB has a Social Responsibility Policy
approved by the BoD.

An
nu
al
Re
po
rt
20
18
Corporate Governance88
About the BankAbout the Bank
Value DriversValue Drivers
LeadershipLeadership
StrategyStrategy
PerformancePerformance
Corporate GovernanceCorporate Governance
Financial ReportsFinancial Reports
Supplementary InformationSupplementary Information
Names of the companies inside and outside the Kingdom in which a Board member is a member of their current or previous Board member or manager
Member name Names of companies
where the Board member
is a member of its current
Boards or one of its Directors
Inside/
outside
Kingdom
Legal entity
(listed joint stock company/
unlisted joint stock company/
limited liability)
Names of companies,
in which the Board
member is a member of
its previous Boards or one
of its previous Directors
Inside/
outside
Kingdom
Legal entity
(listed joint
stock company/
unlisted joint
stock company/
limited liability)
Abdullah bin
Sulaiman
Al Rajhi
Al Rajhi Bank
Al Rajhi Company for
Cooperative Insurance
Farabi Petrochemicals
Company
Al Rajhi Holding Group
Al Rajhi Capital
Fursan Travel & Tourism
Company
Inside the
Kingdom
Listed joint stock
company
Listed joint stock
company
Unlisted company
Unlisted company
Unlisted company
Limited liability company
Al Rajhi Bank (CEO) Inside the
Kingdom
Listed
joint stock
company
Salah bin Ali
Aba Alkhail
Al Rajhi Bank
Al Rajhi Capital
National Veterinary
Company
Abalkhail Consulting
Engineers
Salah Aba Alkhail & Co.
Information Technology
Inside the
Kingdom
Listed joint stock
company
Unlisted company
Unlisted company
Limited liability
company
Limited liability
company
Abdulaziz
bin Khaled
Al Ghefaily
Al Rajhi Bank
Al Rajhi Capital
Savola Group
Panda Retail Company
Inside the
Kingdom
Listed joint stock
company
Unlisted company
Listed joint stock
company
Unlisted company
Industrialization
& Energy Services
Company (TAQA)
Dur Hospitality
Saudi Industries
Development
Company
Tabuk Agriculture
Development
Company
National Medical
Care Company
Herfy Food
Company
Inside the
Kingdom
Unlisted
company
Unlisted
company
Unlisted
company
Listed
joint stock
company
Listed
joint stock
company
Unlisted
company
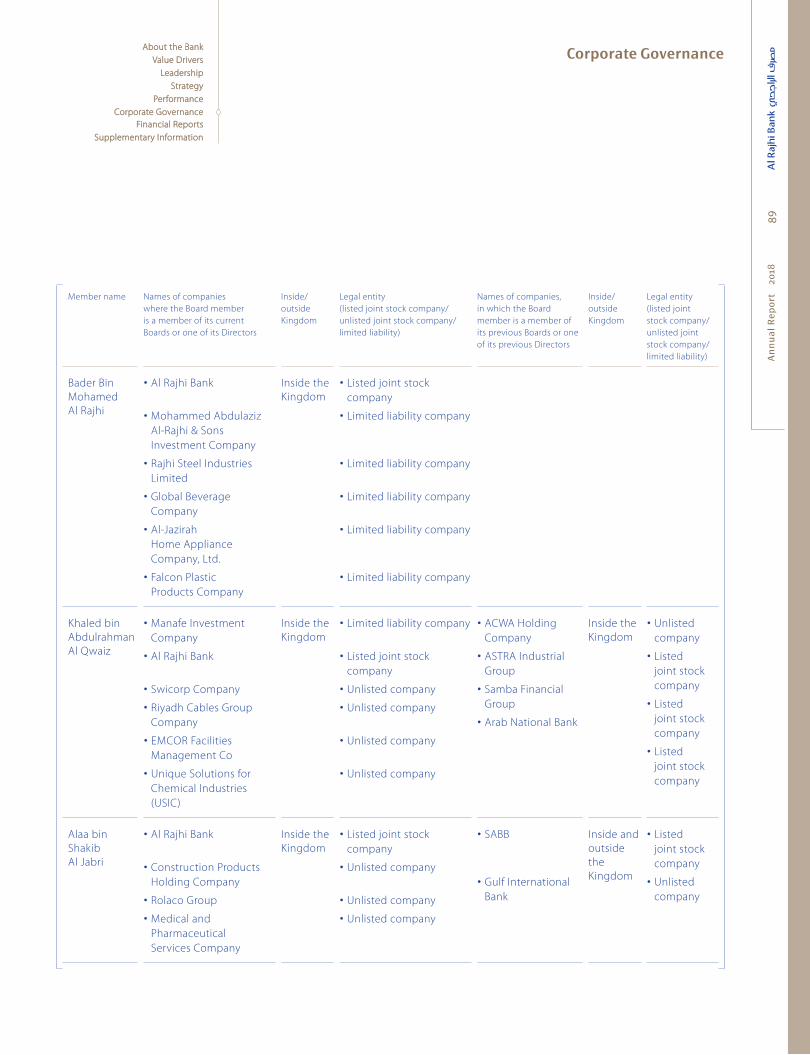
An
nu
al
Re
po
rt
20
18
Corporate Governance
89
About the BankAbout the Bank
Value DriversValue Drivers
LeadershipLeadership
StrategyStrategy
PerformancePerformance
Corporate GovernanceCorporate Governance
Financial ReportsFinancial Reports
Supplementary InformationSupplementary Information
Member name Names of companies
where the Board member
is a member of its current
Boards or one of its Directors
Inside/
outside
Kingdom
Legal entity
(listed joint stock company/
unlisted joint stock company/
limited liability)
Names of companies,
in which the Board
member is a member of
its previous Boards or one
of its previous Directors
Inside/
outside
Kingdom
Legal entity
(listed joint
stock company/
unlisted joint
stock company/
limited liability)
Bader Bin
Mohamed
Al Rajhi
Al Rajhi Bank
Mohammed Abdulaziz
Al-Rajhi & Sons
Investment Company
Rajhi Steel Industries
Limited
Global Beverage
Company
Al-Jazirah
Home Appliance
Company, Ltd.
Falcon Plastic
Products Company
Inside the
Kingdom
Listed joint stock
company
Limited liability company
Limited liability company
Limited liability company
Limited liability company
Limited liability company
Khaled bin
Abdulrahman
Al Qwaiz
Manafe Investment
Company
Al Rajhi Bank
Swicorp Company
Riyadh Cables Group
Company
EMCOR Facilities
Management Co
Unique Solutions for
Chemical Industries
(USIC)
Inside the
Kingdom
Limited liability company
Listed joint stock
company
Unlisted company
Unlisted company
Unlisted company
Unlisted company
ACWA Holding
Company
ASTRA Industrial
Group
Samba Financial
Group
Arab National Bank
Inside the
Kingdom
Unlisted
company
Listed
joint stock
company
Listed
joint stock
company
Listed
joint stock
company
Alaa bin
Shakib
Al Jabri
Al Rajhi Bank
Construction Products
Holding Company
Rolaco Group
Medical and
Pharmaceutical
Services Company
Inside the
Kingdom
Listed joint stock
company
Unlisted company
Unlisted company
Unlisted company
SABB
Gulf International
Bank
Inside and
outside
the
Kingdom
Listed
joint stock
company
Unlisted
company
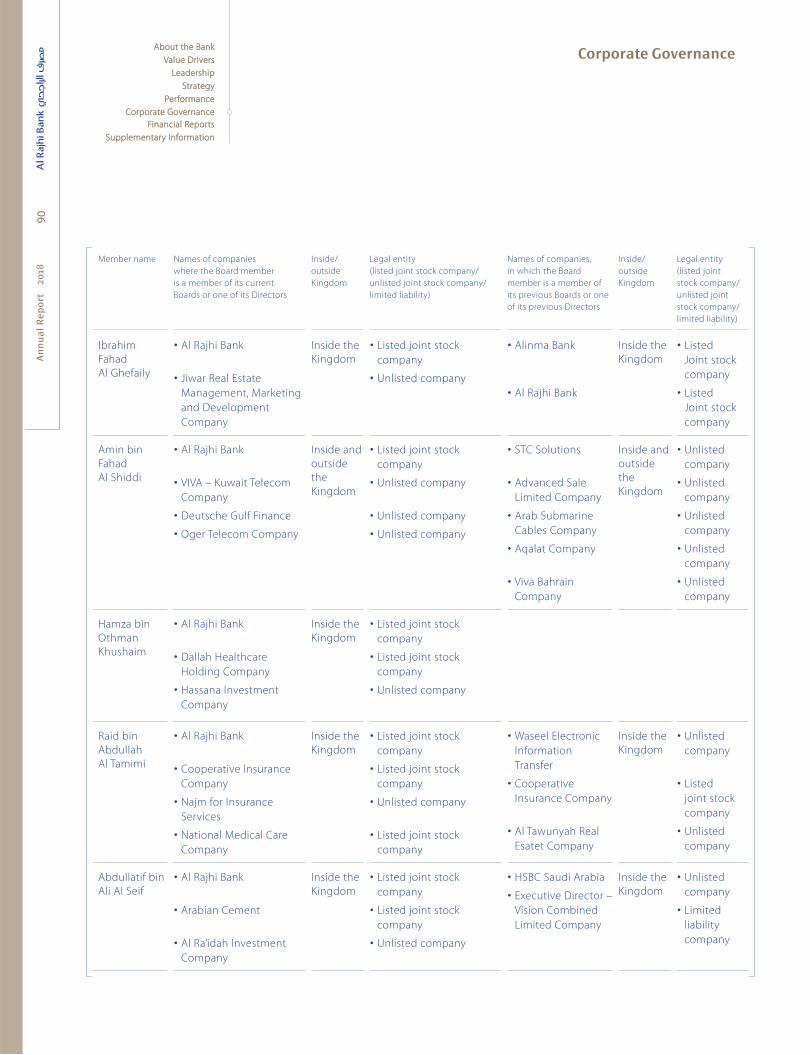
An
nu
al
Re
po
rt
20
18
Corporate Governance90
About the BankAbout the Bank
Value DriversValue Drivers
LeadershipLeadership
StrategyStrategy
PerformancePerformance
Corporate GovernanceCorporate Governance
Financial ReportsFinancial Reports
Supplementary InformationSupplementary Information
Member name Names of companies
where the Board member
is a member of its current
Boards or one of its Directors
Inside/
outside
Kingdom
Legal entity
(listed joint stock company/
unlisted joint stock company/
limited liability)
Names of companies,
in which the Board
member is a member of
its previous Boards or one
of its previous Directors
Inside/
outside
Kingdom
Legal entity
(listed joint
stock company/
unlisted joint
stock company/
limited liability)
Ibrahim
Fahad
Al Ghefaily
Al Rajhi Bank
Jiwar Real Estate
Management, Marketing
and Development
Company
Inside the
Kingdom
Listed joint stock
company
Unlisted company
Alinma Bank
Al Rajhi Bank
Inside the
Kingdom
Listed
Joint stock
company
Listed
Joint stock
company
Amin bin
Fahad
Al Shiddi
Al Rajhi Bank
VIVA – Kuwait Telecom
Company
Deutsche Gulf Finance
Oger Telecom Company
Inside and
outside
the
Kingdom
Listed joint stock
company
Unlisted company
Unlisted company
Unlisted company
STC Solutions
Advanced Sale
Limited Company
Arab Submarine
Cables Company
Aqalat Company
Viva Bahrain
Company
Inside and
outside
the
Kingdom
Unlisted
company
Unlisted
company
Unlisted
company
Unlisted
company
Unlisted
company
Hamza bin
Othman
Khushaim
Al Rajhi Bank
Dallah Healthcare
Holding Company
Hassana Investment
Company
Inside the
Kingdom
Listed joint stock
company
Listed joint stock
company
Unlisted company
Raid bin
Abdullah
Al Tamimi
Al Rajhi Bank
Cooperative Insurance
Company
Najm for Insurance
Services
National Medical Care
Company
Inside the
Kingdom
Listed joint stock
company
Listed joint stock
company
Unlisted company
Listed joint stock
company
Waseel Electronic
Information
Transfer
Cooperative
Insurance Company
Al Tawunyah Real
Esatet Company
Inside the
Kingdom
Unlisted
company
Listed
joint stock
company
Unlisted
company
Abdullatif bin
Ali Al Seif
Al Rajhi Bank
Arabian Cement
Al Ra’idah Investment
Company
Inside the
Kingdom
Listed joint stock
company
Listed joint stock
company
Unlisted company
HSBC Saudi Arabia
Executive Director –
Vision Combined
Limited Company
Inside the
Kingdom
Unlisted
company
Limited
liability
company

An
nu
al
Re
po
rt
20
18
Corporate Governance
91
About the BankAbout the Bank
Value DriversValue Drivers
LeadershipLeadership
StrategyStrategy
PerformancePerformance
Corporate GovernanceCorporate Governance
Financial ReportsFinancial Reports
Supplementary InformationSupplementary Information
Composition of the Board and classifi cation of its members, as Executive Directors, Non-Executive Directors, or Independent Directors
According to the definitions of Article 2 of the Corporate Governance Regulations issued by
CMA, Board members are classified as follows:
No. Member name Membership classification (Executive/Non-Executive/Independent)
1. Abdullah bin Sulaiman Al Rajhi Non-Executive
2. Salah bin Ali Aba Alkhail Non-Executive
3. Abdulaziz bin Khaled Al Ghefaily Non-Executive
4. Bader bin Mohamed Al Rajhi Non-Executive
5. Khaled bin Abdulrahman Al Qwaiz Non-Executive
6. Alaa bin Shakib Al Jabiri Independent
7. Ibrahim bin Fahad Al Ghofaily Independent
8. Amin bin Fahad Al Shiddi Non-Executive
9. Hamza bin Othman Khushaim Non-Executive
10. Raid bin Abdullah Al Tamimi Independent
11. Abdullatif bin Ali Al Seif Independent
Committees of the Board of Directors
The functions and responsibilities of the
Committees are laid down in internal guidelines
and regulatory requirements. The membership
term is three years which ends with the term
of the Board. The Board of Directors has the
authority to appoint, reappoint or terminate any
member of the Committees. The Committees
submit their recommendations and the minutes
of meetings to the Board of Directors.
A brief description of ARB Committees’
competences and functions is given below:
Executive Committee
The Executive Committee (ExCom), headed
by the Chairman of the Board of Directors,
carries out all the functions and authorities
the Bank entrusts it with, including: assuming
the responsibility for all businesses of
Al Rajhi Bank, taking the quick decisions with
respect to urgent matters and issues related
to the business of the Bank. Also, ExCom
will be responsible for approving all credit
facilities exceeding the authorities of the
Credit Committee, approving the real estate
guarantees documented for default facilities,
approving the contracts exceeding the powers
of the Committees operating in the Bank
and the CEO within limits of the approved
budget and within powers determined by the
Board of Directors.
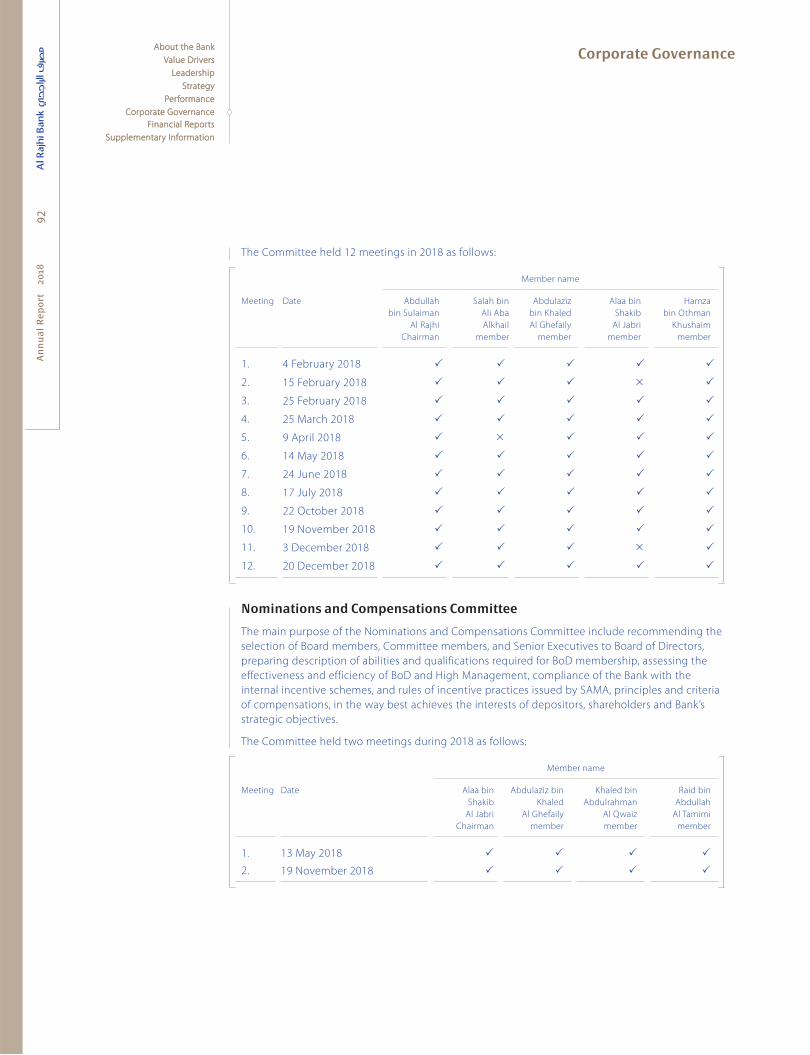
An
nu
al
Re
po
rt
20
18
Corporate Governance92
About the BankAbout the Bank
Value DriversValue Drivers
LeadershipLeadership
StrategyStrategy
PerformancePerformance
Corporate GovernanceCorporate Governance
Financial ReportsFinancial Reports
Supplementary InformationSupplementary Information
The Committee held 12 meetings in 2018 as follows:
Member name
Meeting Date Abdullah
bin Sulaiman
Al Rajhi
Chairman
Salah bin
Ali Aba
Alkhail
member
Abdulaziz
bin Khaled
Al Ghefaily
member
Alaa bin
Shakib
Al Jabri
member
Hamza
bin Othman
Khushaim
member
1. 4 February 2018
2. 15 February 2018
3. 25 February 2018
4. 25 March 2018
5. 9 April 2018
6. 14 May 2018
7. 24 June 2018
8. 17 July 2018
9. 22 October 2018
10. 19 November 2018
11. 3 December 2018
12. 20 December 2018
Nominations and Compensations Committee
The main purpose of the Nominations and Compensations Committee include recommending the
selection of Board members, Committee members, and Senior Executives to Board of Directors,
preparing description of abilities and qualifications required for BoD membership, assessing the
effectiveness and efficiency of BoD and High Management, compliance of the Bank with the
internal incentive schemes, and rules of incentive practices issued by SAMA, principles and criteria
of compensations, in the way best achieves the interests of depositors, shareholders and Bank’s
strategic objectives.
The Committee held two meetings during 2018 as follows:
Member name
Meeting Date Alaa bin
Shakib
Al Jabri
Chairman
Abdulaziz bin
Khaled
Al Ghefaily
member
Khaled bin
Abdulrahman
Al Qwaiz
member
Raid bin
Abdullah
Al Tamimi
member
1. 13 May 2018
2. 19 November 2018
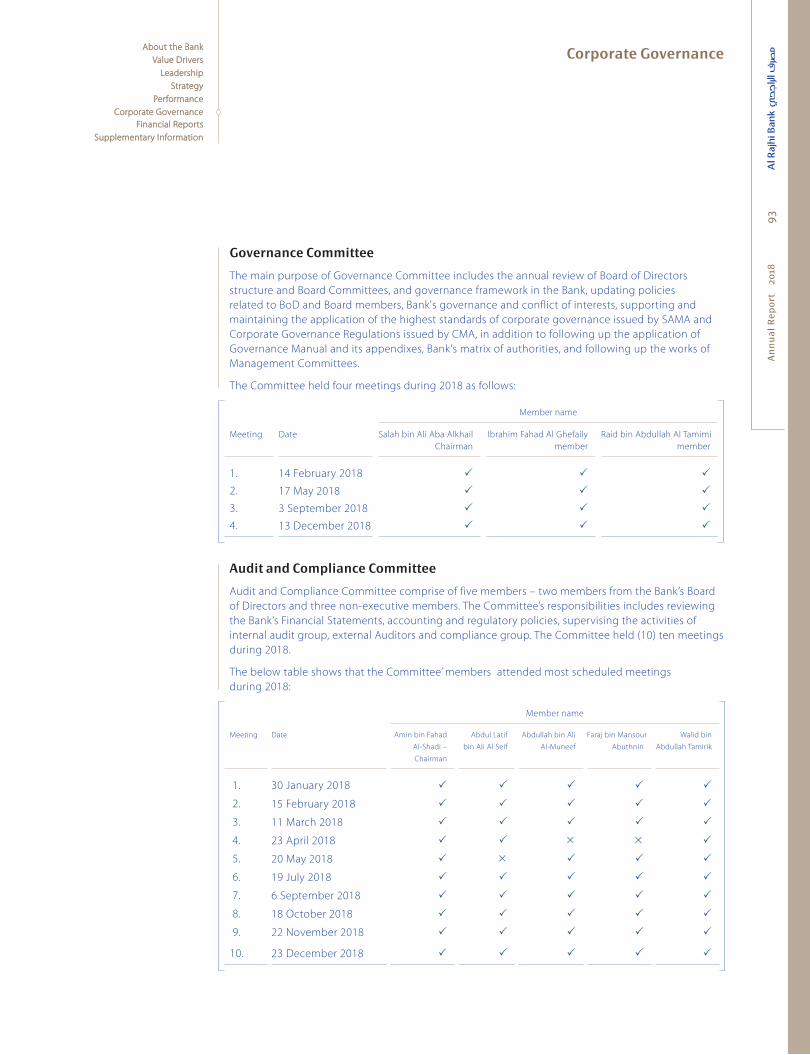
An
nu
al
Re
po
rt
20
18
Corporate Governance
93
About the BankAbout the Bank
Value DriversValue Drivers
LeadershipLeadership
StrategyStrategy
PerformancePerformance
Corporate GovernanceCorporate Governance
Financial ReportsFinancial Reports
Supplementary InformationSupplementary Information
Governance Committee
The main purpose of Governance Committee includes the annual review of Board of Directors
structure and Board Committees, and governance framework in the Bank, updating policies
related to BoD and Board members, Bank's governance and conflict of interests, supporting and
maintaining the application of the highest standards of corporate governance issued by SAMA and
Corporate Governance Regulations issued by CMA, in addition to following up the application of
Governance Manual and its appendixes, Bank's matrix of authorities, and following up the works of
Management Committees.
The Committee held four meetings during 2018 as follows:
Member name
Meeting Date Salah bin Ali Aba Alkhail
Chairman
Ibrahim Fahad Al Ghefaily
member
Raid bin Abdullah Al Tamimi
member
1. 14 February 2018
2. 17 May 2018
3. 3 September 2018
4. 13 December 2018
Audit and Compliance Committee
Audit and Compliance Committee comprise of five members – two members from the Bank’s Board
of Directors and three non-executive members. The Committee’s responsibilities includes reviewing
the Bank’s Financial Statements, accounting and regulatory policies, supervising the activities of
internal audit group, external Auditors and compliance group. The Committee held (10) ten meetings
during 2018.
The below table shows that the Committee’ members attended most scheduled meetings
during 2018:
Member name
Meeting Date Amin bin Fahad
Al-Shadi –
Chairman
Abdul Latif
bin Ali Al Seif
Abdullah bin Ali
Al-Muneef
Faraj bin Mansour
Abuthnin
Walid bin
Abdullah Tamirik
1. 30 January 2018
2. 15 February 2018
3. 11 March 2018
4. 23 April 2018
5. 20 May 2018
6. 19 July 2018
7. 6 September 2018
8. 18 October 2018
9. 22 November 2018
10. 23 December 2018
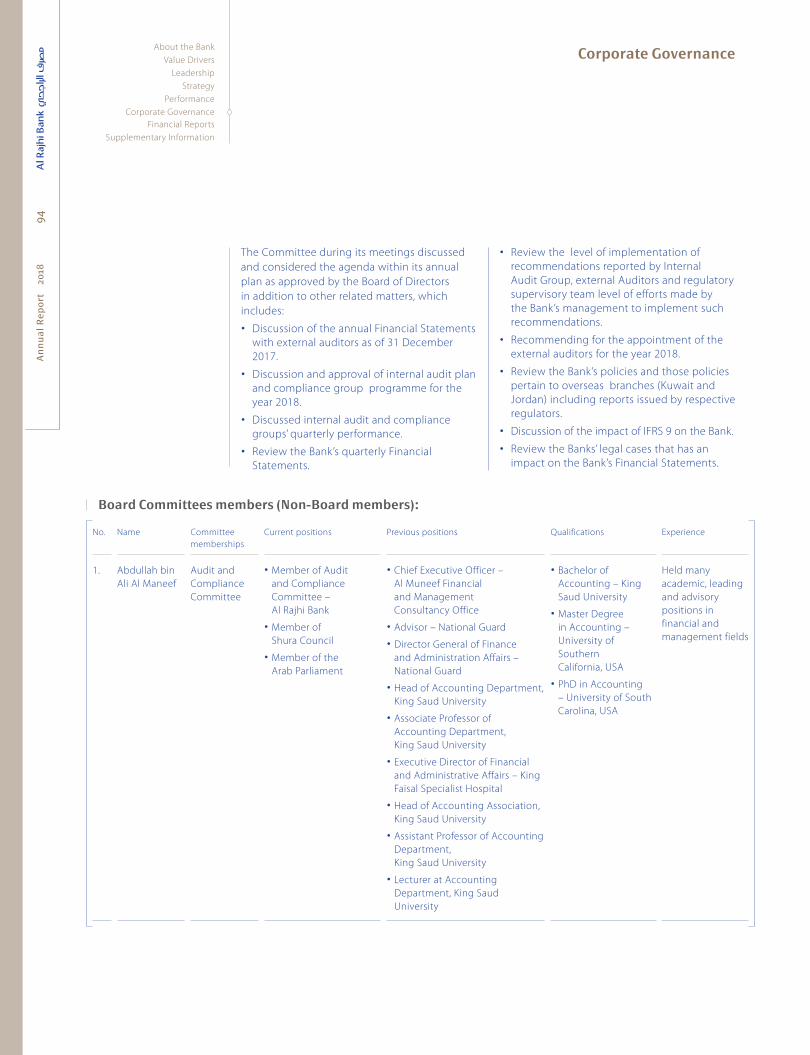
An
nu
al
Re
po
rt
20
18
Corporate Governance94
The Committee during its meetings discussed
and considered the agenda within its annual
plan as approved by the Board of Directors
in addition to other related matters, which
includes:
y Discussion of the annual Financial Statements
with external auditors as of 31 December
2017.
y Discussion and approval of internal audit plan
and compliance group programme for the
year 2018.
y Discussed internal audit and compliance
groups’ quarterly performance.
y Review the Bank’s quarterly Financial
Statements.
y Review the level of implementation of
recommendations reported by Internal
Audit Group, external Auditors and regulatory
supervisory team level of efforts made by
the Bank’s management to implement such
recommendations.
y Recommending for the appointment of the
external auditors for the year 2018.
y Review the Bank’s policies and those policies
pertain to overseas branches (Kuwait and
Jordan) including reports issued by respective
regulators.
y Discussion of the impact of IFRS 9 on the Bank.
y Review the Banks’ legal cases that has an
impact on the Bank’s Financial Statements.
Board Committees members (Non-Board members):
No. Name Committee
memberships
Current positions Previous positions Qualifications Experience
1. Abdullah bin
Ali Al Maneef
Audit and
Compliance
Committee
y Member of Audit
and Compliance
Committee –
Al Rajhi Bank
y Member of
Shura Council
y Member of the
Arab Parliament
y Chief Executive Officer –
Al Muneef Financial
and Management
Consultancy Office
y Advisor – National Guard
y Director General of Finance
and Administration Affairs –
National Guard
y Head of Accounting Department,
King Saud University
y Associate Professor of
Accounting Department,
King Saud University
y Executive Director of Financial
and Administrative Affairs – King
Faisal Specialist Hospital
y Head of Accounting Association,
King Saud University
y Assistant Professor of Accounting
Department,
King Saud University
y Lecturer at Accounting
Department, King Saud
University
y Bachelor of
Accounting – King
Saud University
y Master Degree
in Accounting –
University of
Southern
California, USA
y PhD in Accounting
– University of South
Carolina, USA
Held many
academic, leading
and advisory
positions in
financial and
management fields
About the Bank
Value Drivers
Leadership
Strategy
Performance
Corporate Governance
Financial Reports
Supplementary Information
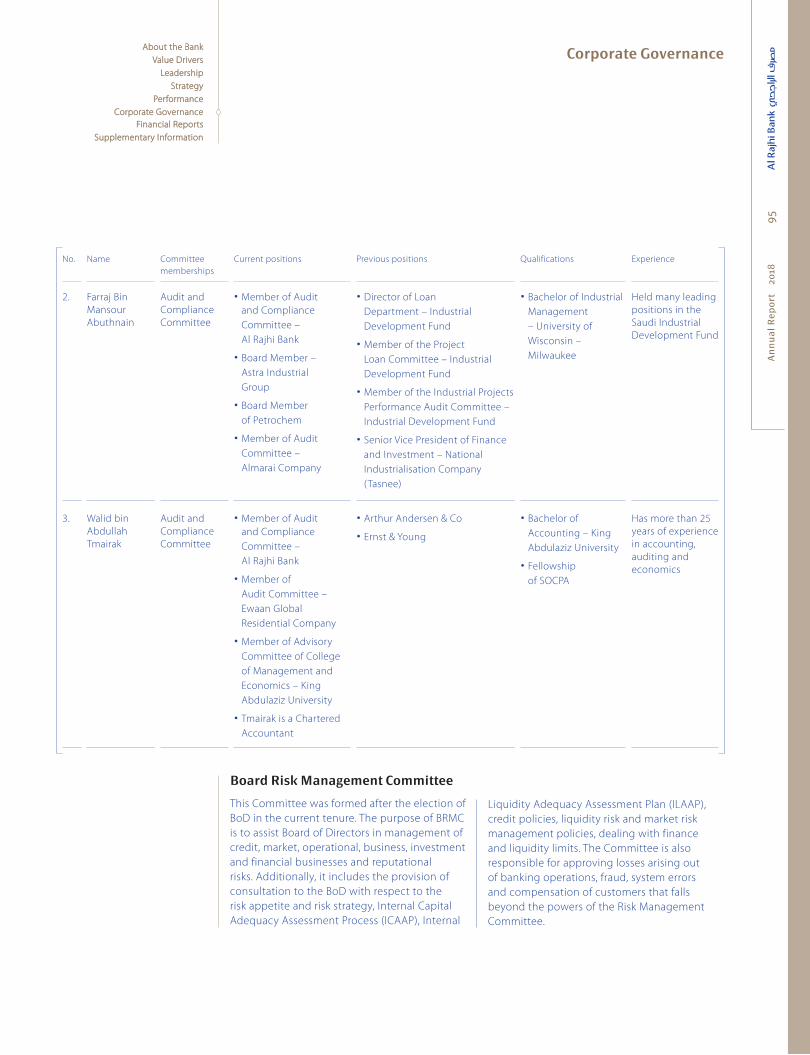
An
nu
al
Re
po
rt
20
18
Corporate Governance
95
About the BankAbout the Bank
Value DriversValue Drivers
LeadershipLeadership
StrategyStrategy
PerformancePerformance
Corporate GovernanceCorporate Governance
Financial ReportsFinancial Reports
Supplementary InformationSupplementary Information
No. Name Committee
memberships
Current positions Previous positions Qualifications Experience
2. Farraj Bin
Mansour
Abuthnain
Audit and
Compliance
Committee
Member of Audit
and Compliance
Committee –
Al Rajhi Bank
Board Member –
Astra Industrial
Group
Board Member
of Petrochem
Member of Audit
Committee –
Almarai Company
Director of Loan
Department – Industrial
Development Fund
Member of the Project
Loan Committee – Industrial
Development Fund
Member of the Industrial Projects
Performance Audit Committee –
Industrial Development Fund
Senior Vice President of Finance
and Investment – National
Industrialisation Company
(Tasnee)
Bachelor of Industrial
Management
– University of
Wisconsin –
Milwaukee
Held many leading
positions in the
Saudi Industrial
Development Fund
3. Walid bin
Abdullah
Tmairak
Audit and
Compliance
Committee
Member of Audit
and Compliance
Committee –
Al Rajhi Bank
Member of
Audit Committee –
Ewaan Global
Residential Company
Member of Advisory
Committee of College
of Management and
Economics – King
Abdulaziz University
Tmairak is a Chartered
Accountant
Arthur Andersen & Co
Ernst & Young
Bachelor of
Accounting – King
Abdulaziz University
Fellowship
of SOCPA
Has more than 25
years of experience
in accounting,
auditing and
economics
Board Risk Management Committee
This Committee was formed after the election of
BoD in the current tenure. The purpose of BRMC
is to assist Board of Directors in management of
credit, market, operational, business, investment
and financial businesses and reputational
risks. Additionally, it includes the provision of
consultation to the BoD with respect to the
risk appetite and risk strategy, Internal Capital
Adequacy Assessment Process (ICAAP), Internal
Liquidity Adequacy Assessment Plan (ILAAP),
credit policies, liquidity risk and market risk
management policies, dealing with finance
and liquidity limits. The Committee is also
responsible for approving losses arising out
of banking operations, fraud, system errors
and compensation of customers that falls
beyond the powers of the Risk Management
Committee.
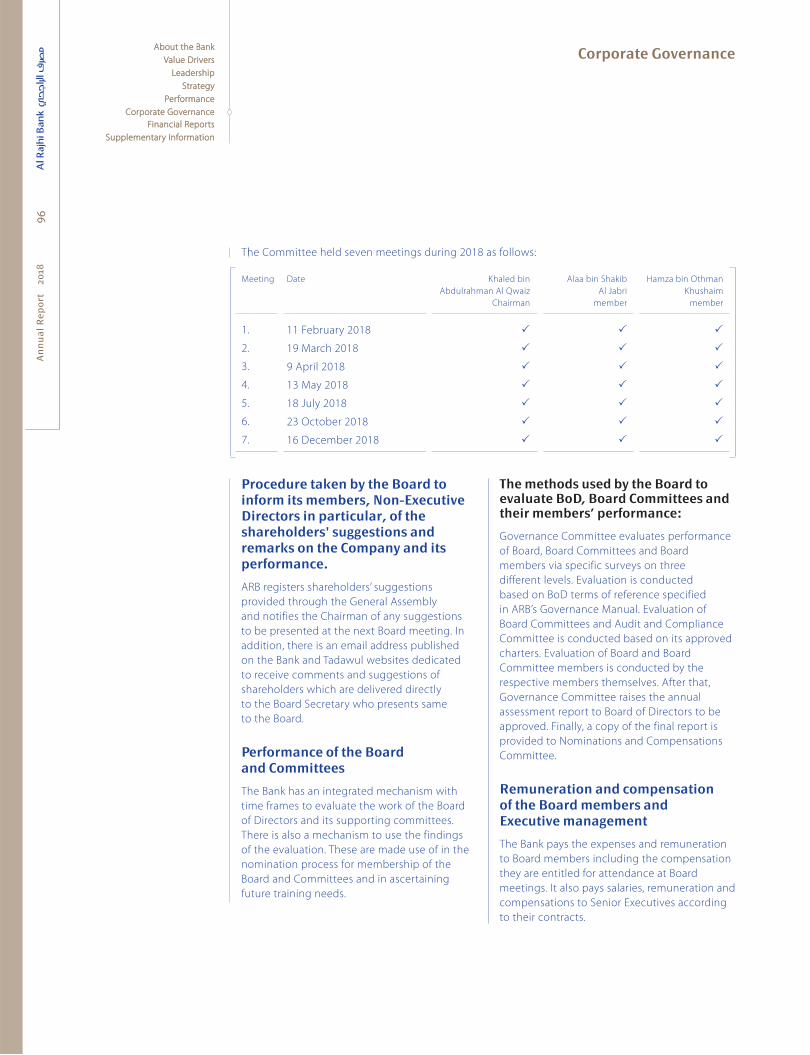
An
nu
al
Re
po
rt
20
18
Corporate Governance96
About the BankAbout the Bank
Value DriversValue Drivers
LeadershipLeadership
StrategyStrategy
PerformancePerformance
Corporate GovernanceCorporate Governance
Financial ReportsFinancial Reports
Supplementary InformationSupplementary Information
The Committee held seven meetings during 2018 as follows:
Meeting Date Khaled bin
Abdulrahman Al Qwaiz
Chairman
Alaa bin Shakib
Al Jabri
member
Hamza bin Othman
Khushaim
member
1. 11 February 2018
2. 19 March 2018
3. 9 April 2018
4. 13 May 2018
5. 18 July 2018
6. 23 October 2018
7. 16 December 2018
Procedure taken by the Board to inform its members, Non-Executive Directors in particular, of the shareholders' suggestions and remarks on the Company and its performance.
ARB registers shareholders’ suggestions
provided through the General Assembly
and notifies the Chairman of any suggestions
to be presented at the next Board meeting. In
addition, there is an email address published
on the Bank and Tadawul websites dedicated
to receive comments and suggestions of
shareholders which are delivered directly
to the Board Secretary who presents same
to the Board.
Performance of the Board and Committees
The Bank has an integrated mechanism with
time frames to evaluate the work of the Board
of Directors and its supporting committees.
There is also a mechanism to use the findings
of the evaluation. These are made use of in the
nomination process for membership of the
Board and Committees and in ascertaining
future training needs.
The methods used by the Board to evaluate BoD, Board Committees and their members’ performance:
Governance Committee evaluates performance
of Board, Board Committees and Board
members via specific surveys on three
different levels. Evaluation is conducted
based on BoD terms of reference specified
in ARB’s Governance Manual. Evaluation of
Board Committees and Audit and Compliance
Committee is conducted based on its approved
charters. Evaluation of Board and Board
Committee members is conducted by the
respective members themselves. After that,
Governance Committee raises the annual
assessment report to Board of Directors to be
approved. Finally, a copy of the final report is
provided to Nominations and Compensations
Committee.
Remuneration and compensation of the Board members and Executive management
The Bank pays the expenses and remuneration
to Board members including the compensation
they are entitled for attendance at Board
meetings. It also pays salaries, remuneration and
compensations to Senior Executives according
to their contracts.

An
nu
al
Re
po
rt
20
18
Corporate Governance
97
About the BankAbout the Bank
Value DriversValue Drivers
LeadershipLeadership
StrategyStrategy
PerformancePerformance
Corporate GovernanceCorporate Governance
Financial ReportsFinancial Reports
Supplementary InformationSupplementary Information
a) Summary of signifi cant items of policy for remunerations of BoD and Board Committees and executive management members
1. Board of Directors remuneration and compensations:
ARB’s Board members will receive a fixed
annual remuneration of SAR 400,000 for their
membership in ARB’s Board of Directors and
their participation in its activities.
Board member will receive an attendance
fee of SAR 5,000 for his attendance of each
Board meeting either personally or through
electronic remote channels.
ARB shall compensate Board members for
their actual expenses paid to attend the
Board meetings including travelling and
accommodation expenses.
2. Remuneration and compensations of BoD members for their membership in Board Committees:
ARB’s Board members will not receive
an additional remuneration for their
membership in ARB’s Board Committees as
the annual remuneration will include any
other remuneration paid for the Director for
his participation in any Board Committee.
Board member will receive an attendance fee
of SAR 5,000 for his attendance of each Board
Committee either personally or through
electronic remote channels.
ARB shall compensate Board members for
their actual expenses paid to attend the
Committees’ meetings including travelling
and accommodation expenses.
3. Remuneration and compensations of Audit and Compliance Committee members:
ARB’s Audit and Compliance Committee
members, either from inside or outside
the Board, will receive a fixed annual
remuneration of SAR 150,000 for their
membership in the Committee and his
participation in its activities provided
that annual remuneration for Audit and
Compliance Committee member from
inside the Board shall not exceed the annual
limits set by Policy for Remuneration and
Compensation approved by ARB’s General
Assembly.
Audit and Compliance Committee members
will receive an attendance fee of SAR 5,000 for
his attendance of each Committee meeting
either personally or through electronic
remote channels.
ARB shall compensate Committee members
for their actual expenses paid to attend the
Board meetings including travelling and
accommodation expenses.
4. Granting shares:
ARB does not grant shares as remuneration
for any Board, Board Committee and Audit
Compliance Committee members.
5. Allocation and payment mechanisms for remuneration and compensation:
Remuneration and compensation for Board
members and Non-Board members will be
allocated annually based on recommendation
from Nomination and Compensation
Committee and approval of Board, amounts
will then be presented to the next General
Assembly meeting for ratification.
Remuneration can vary to reflect the
Director’s experience, independence and
number of attended meetings among other
criteria.
Attendance fees are paid annually to
Directors based on their attendance sheets
for Board, Board Committees, and Audit and
Compliance Committee meetings.
Payments are done through bank transfers,
cheques, or any other methods, and Directors
are informed of details through relevant
departments.
Remuneration and Compensations paid to
directors should not exceed SAR 500,000
annually, payment of any additional due
amounts will be stopped. Total amounts
paid to Directors should not exceed 5% of
total net profits.
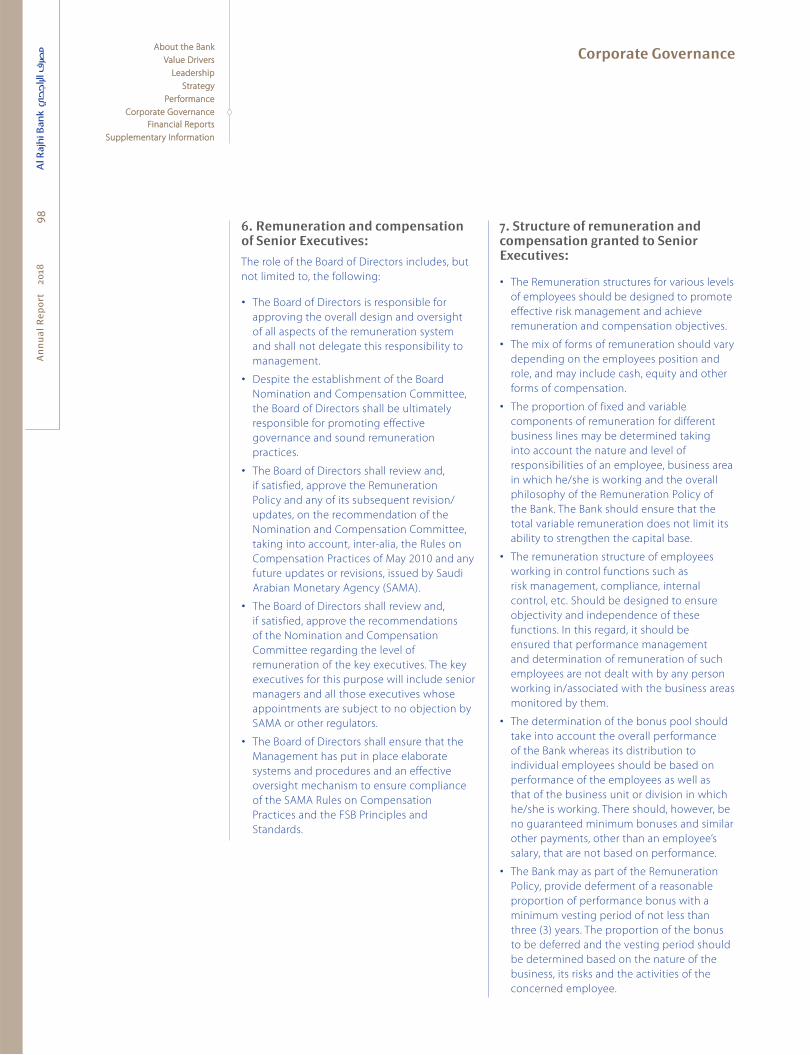
An
nu
al
Re
po
rt
20
18
Corporate Governance98
About the BankAbout the Bank
Value DriversValue Drivers
LeadershipLeadership
StrategyStrategy
PerformancePerformance
Corporate GovernanceCorporate Governance
Financial ReportsFinancial Reports
Supplementary InformationSupplementary Information
6. Remuneration and compensation of Senior Executives:
The role of the Board of Directors includes, but
not limited to, the following:
The Board of Directors is responsible for
approving the overall design and oversight
of all aspects of the remuneration system
and shall not delegate this responsibility to
management.
Despite the establishment of the Board
Nomination and Compensation Committee,
the Board of Directors shall be ultimately
responsible for promoting effective
governance and sound remuneration
practices.
The Board of Directors shall review and,
if satisfied, approve the Remuneration
Policy and any of its subsequent revision/
updates, on the recommendation of the
Nomination and Compensation Committee,
taking into account, inter-alia, the Rules on
Compensation Practices of May 2010 and any
future updates or revisions, issued by Saudi
Arabian Monetary Agency (SAMA).
The Board of Directors shall review and,
if satisfied, approve the recommendations
of the Nomination and Compensation
Committee regarding the level of
remuneration of the key executives. The key
executives for this purpose will include senior
managers and all those executives whose
appointments are subject to no objection by
SAMA or other regulators.
The Board of Directors shall ensure that the
Management has put in place elaborate
systems and procedures and an effective
oversight mechanism to ensure compliance
of the SAMA Rules on Compensation
Practices and the FSB Principles and
Standards.
7. Structure of remuneration and compensation granted to Senior Executives:
The Remuneration structures for various levels
of employees should be designed to promote
effective risk management and achieve
remuneration and compensation objectives.
The mix of forms of remuneration should vary
depending on the employees position and
role, and may include cash, equity and other
forms of compensation.
The proportion of fixed and variable
components of remuneration for different
business lines may be determined taking
into account the nature and level of
responsibilities of an employee, business area
in which he/she is working and the overall
philosophy of the Remuneration Policy of
the Bank. The Bank should ensure that the
total variable remuneration does not limit its
ability to strengthen the capital base.
The remuneration structure of employees
working in control functions such as
risk management, compliance, internal
control, etc. Should be designed to ensure
objectivity and independence of these
functions. In this regard, it should be
ensured that performance management
and determination of remuneration of such
employees are not dealt with by any person
working in/associated with the business areas
monitored by them.
The determination of the bonus pool should
take into account the overall performance
of the Bank whereas its distribution to
individual employees should be based on
performance of the employees as well as
that of the business unit or division in which
he/she is working. There should, however, be
no guaranteed minimum bonuses and similar
other payments, other than an employee’s
salary, that are not based on performance.
The Bank may as part of the Remuneration
Policy, provide deferment of a reasonable
proportion of performance bonus with a
minimum vesting period of not less than
three (3) years. The proportion of the bonus
to be deferred and the vesting period should
be determined based on the nature of the
business, its risks and the activities of the
concerned employee.
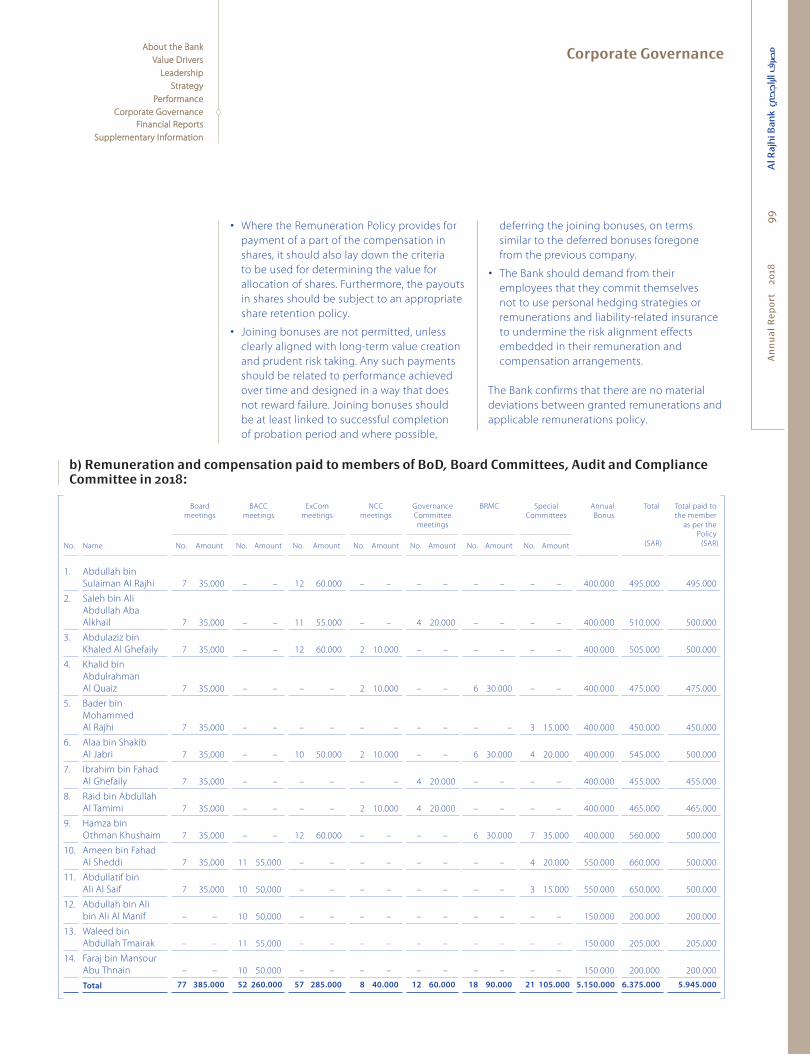
An
nu
al
Re
po
rt
20
18
Corporate Governance
99
About the BankAbout the Bank
Value DriversValue Drivers
LeadershipLeadership
StrategyStrategy
PerformancePerformance
Corporate GovernanceCorporate Governance
Financial ReportsFinancial Reports
Supplementary InformationSupplementary Information
Where the Remuneration Policy provides for
payment of a part of the compensation in
shares, it should also lay down the criteria
to be used for determining the value for
allocation of shares. Furthermore, the payouts
in shares should be subject to an appropriate
share retention policy.
Joining bonuses are not permitted, unless
clearly aligned with long-term value creation
and prudent risk taking. Any such payments
should be related to performance achieved
over time and designed in a way that does
not reward failure. Joining bonuses should
be at least linked to successful completion
of probation period and where possible,
deferring the joining bonuses, on terms
similar to the deferred bonuses foregone
from the previous company.
The Bank should demand from their
employees that they commit themselves
not to use personal hedging strategies or
remunerations and liability-related insurance
to undermine the risk alignment effects
embedded in their remuneration and
compensation arrangements.
The Bank confirms that there are no material
deviations between granted remunerations and
applicable remunerations policy.
b) Remuneration and compensation paid to members of BoD, Board Committees, Audit and Compliance Committee in 2018:
Board
meetings
BACC
meetings
ExCom
meetings
NCC
meetings
Governance
Committee
meetings
BRMC Special
Committees
Annual
Bonus
Total
(SAR)
Total paid to
the member
as per the
Policy
(SAR)No. Name No. Amount No. Amount No. Amount No. Amount No. Amount No. Amount No. Amount
1. Abdullah bin
Sulaiman Al Rajhi 7 35,000 – – 12 60.000 – – – – – – – – 400.000 495.000 495.000
2. Saleh bin Ali
Abdullah Aba
Alkhail 7 35,000 – – 11 55.000 – – 4 20.000 – – – – 400.000 510.000 500.000
3. Abdulaziz bin
Khaled Al Ghefaily 7 35,000 – – 12 60.000 2 10.000 – – – – – – 400.000 505.000 500.000
4. Khalid bin
Abdulrahman
Al Quaiz 7 35,000 – – – – 2 10.000 – – 6 30.000 – – 400.000 475.000 475.000
5. Bader bin
Mohammed
Al Rajhi 7 35,000 – – – – – – – – – – 3 15.000 400.000 450.000 450.000
6. Alaa bin Shakib
Al Jabri 7 35,000 – – 10 50.000 2 10.000 – – 6 30.000 4 20.000 400.000 545.000 500.000
7. Ibrahim bin Fahad
Al Ghefaily 7 35,000 – – – – – – 4 20.000 – – – – 400.000 455.000 455.000
8. Raid bin Abdullah
Al Tamimi 7 35,000 – – – – 2 10.000 4 20.000 – – – – 400.000 465.000 465.000
9. Hamza bin
Othman Khushaim 7 35,000 – – 12 60.000 – – – – 6 30.000 7 35.000 400.000 560.000 500.000
10. Ameen bin Fahad
Al Sheddi 7 35,000 11 55,000 – – – – – – – – 4 20.000 550.000 660.000 500.000
11. Abdullatif bin
Ali Al Saif 7 35,000 10 50,000 – – – – – – – – 3 15.000 550.000 650.000 500.000
12. Abdullah bin Ali
bin Ali Al Manif – – 10 50,000 – – – – – – – – – – 150.000 200.000 200.000
13. Waleed bin
Abdullah Tmairak – – 11 55,000 – – – – – – – – – – 150.000 205.000 205.000
14. Faraj bin Mansour
Abu Thnain – – 10 50,000 – – – – – – – – – – 150.000 200.000 200.000
Total 77 385.000 52 260.000 57 285.000 8 40.000 12 60.000 18 90.000 21 105.000 5.150.000 6.375.000 5.945.000

An
nu
al
Re
po
rt
20
18
Corporate Governance10
0About the BankAbout the Bank
Value DriversValue Drivers
LeadershipLeadership
StrategyStrategy
PerformancePerformance
Corporate GovernanceCorporate Governance
Financial ReportsFinancial Reports
Supplementary InformationSupplementary Information
c) Remunerations and compensations paid to fi ve Senior Executives who have received highest remunerations from the Company including CEO and CFO in 2018.
Description Five Senior
Executives
(CEO and CFO
included)
Salaries and compensations 9,765,000
Allowances 5,085,744
Periodic and annual rewards 35,228,250
Incentives schemes –
Any other in-kind compensations or benefits paid annually or monthly –
Total 50,078,994
Any penalty, precautionary measure, or precautionary legal binding imposed on the Bank by CMA or any other supervisory, regulatory, judicial authority
Fines imposed by CMA: NILNIL
Fines imposed by SAMA:
Violation Fiscal year 2017 Fiscal year 2018
Violations of Number of
resolutions
Total amount
of fines in
Saudi Riyal
Number of
resolutions
Total amount
of fines in
Saudi Riyal
SAMA supervisory instructions 43 15,864,000 34 2,315,000
SAMA instructions related
to customer protection 1 10,000 – –
SAMA instructions related
to due-diligence – – – –
SAMA instructions related to
service level of ATMs and POSs 2 227,377 – –
SAMA instructions related to
due diligence in AML and TF 1 120,000 3 450,000

An
nu
al
Re
po
rt
20
18
Corporate Governance
101
About the BankAbout the Bank
Value DriversValue Drivers
LeadershipLeadership
StrategyStrategy
PerformancePerformance
Corporate GovernanceCorporate Governance
Financial ReportsFinancial Reports
Supplementary InformationSupplementary Information
Fines imposed by Ministry of Municipal and Rural Affairs:
Violation Fiscal year 2017 Fiscal year 2018
Total amount
of fines in
Saudi Riyal
Total amount
of fines in
Saudi Riyal
Increase of building area percentage for ATMs, lack of setbacks,
visible advertising posters on branches facades and ATMs, and
non-existence of licenses for some bank’s locations 2,044,500 1,588,000
Most of the Bank’s operating activities carried
out automatically through different core
system, which minimizes manual errors and
fraud incidences opportunities.
Oversight on the Bank’s activities and
important decisions taken through
committees established to ensure that the
Bank’s activities carried out appropriately in
order to safeguard the Bank’s assets.
The Bank has dedicated specialized functions
on evaluating the effectiveness of the Bank’s
internal control systems, which includes
internal audit, compliance, anti-fraud and
other risks management functions.
Existence of an effective Audit and
Compliance Committee supervising internal
and External Auditors activities in order to
support and promote their independence.
This Committee receives regular and periodic
reports on audits carried out on different
functions within the Bank.
Regular reviews on the efficiency and
adequacy of the internal control system is
carried out by Internal Audit based on an
annual plan approved by the Audit and
Compliance Committee beside reviews
of effectiveness of internal control by the
External Auditors and supervisory reviews
conducted by the SAMA.
Internal control
The Bank’s Management is responsible for
designing an appropriate internal control
system through the Board of directors direct
supervision to ensure availability of effective
controls in mitigating those risks may impact
achieving the Bank’s strategic and operating
objectives. The Bank’s executive management
has adopted a comprehensive internal
control system aligned with SAMA regulatory
requirements.
The following are some of the key components
of the Bank’s internal control system:
The Bank has developed and approved
a governance framework, which is the
mandate for preparing and updates controls
requirements including defining roles and
responsibilities at the Bank’s different levels
including Board of Directors and Board
committees and other committees.
The Bank has group of policies and
procedures that govern its business activities,
which subject to a periodic updates to
ensure it’s completeness, efficiency and
appropriateness to Bank’s activities.
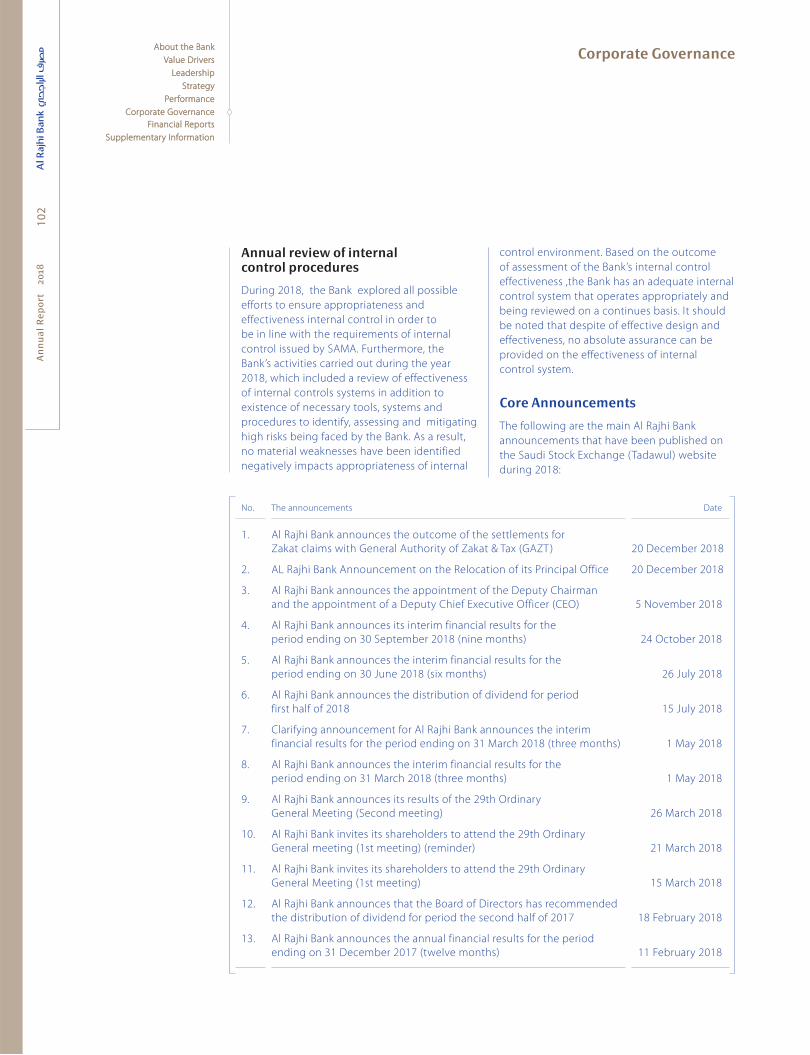
An
nu
al
Re
po
rt
20
18
Corporate Governance10
2About the BankAbout the Bank
Value DriversValue Drivers
LeadershipLeadership
StrategyStrategy
PerformancePerformance
Corporate GovernanceCorporate Governance
Financial ReportsFinancial Reports
Supplementary InformationSupplementary Information
Annual review of internal control procedures
During 2018, the Bank explored all possible
efforts to ensure appropriateness and
effectiveness internal control in order to
be in line with the requirements of internal
control issued by SAMA. Furthermore, the
Bank’s activities carried out during the year
2018, which included a review of effectiveness
of internal controls systems in addition to
existence of necessary tools, systems and
procedures to identify, assessing and mitigating
high risks being faced by the Bank. As a result,
no material weaknesses have been identified
negatively impacts appropriateness of internal
control environment. Based on the outcome
of assessment of the Bank’s internal control
effectiveness ,the Bank has an adequate internal
control system that operates appropriately and
being reviewed on a continues basis. It should
be noted that despite of effective design and
effectiveness, no absolute assurance can be
provided on the effectiveness of internal
control system.
Core Announcements
The following are the main Al Rajhi Bank
announcements that have been published on
the Saudi Stock Exchange (Tadawul) website
during 2018:
No. The announcements Date
1. Al Rajhi Bank announces the outcome of the settlements for
Zakat claims with General Authority of Zakat & Tax (GAZT) 20 December 2018
2. AL Rajhi Bank Announcement on the Relocation of its Principal Office 20 December 2018
3. Al Rajhi Bank announces the appointment of the Deputy Chairman
and the appointment of a Deputy Chief Executive Officer (CEO) 5 November 2018
4. Al Rajhi Bank announces its interim financial results for the
period ending on 30 September 2018 (nine months) 24 October 2018
5. Al Rajhi Bank announces the interim financial results for the
period ending on 30 June 2018 (six months) 26 July 2018
6. Al Rajhi Bank announces the distribution of dividend for period
first half of 2018 15 July 2018
7. Clarifying announcement for Al Rajhi Bank announces the interim
financial results for the period ending on 31 March 2018 (three months) 1 May 2018
8. Al Rajhi Bank announces the interim financial results for the
period ending on 31 March 2018 (three months) 1 May 2018
9. Al Rajhi Bank announces its results of the 29th Ordinary
General Meeting (Second meeting) 26 March 2018
10. Al Rajhi Bank invites its shareholders to attend the 29th Ordinary
General meeting (1st meeting) (reminder) 21 March 2018
11. Al Rajhi Bank invites its shareholders to attend the 29th Ordinary
General Meeting (1st meeting) 15 March 2018
12. Al Rajhi Bank announces that the Board of Directors has recommended
the distribution of dividend for period the second half of 2017 18 February 2018
13. Al Rajhi Bank announces the annual financial results for the period
ending on 31 December 2017 (twelve months) 11 February 2018

An
nu
al
Re
po
rt
20
18
Corporate Governance
103
About the BankAbout the Bank
Value DriversValue Drivers
LeadershipLeadership
StrategyStrategy
PerformancePerformance
Corporate GovernanceCorporate Governance
Financial ReportsFinancial Reports
Supplementary InformationSupplementary Information
General Assembly
The Bank always adheres to the concerned Government regulations in all matters relating to Ordinary
General Assembly and Extraordinary ones. All regulatory provisions are accompanied by sufficient
information to enable shareholders to make their decisions.
Historical information of General Assembly meetings during the fi scal year:
Attendance record
No. Name Ordinary AGM number 29 on
25 March 2018
1. Abdullah bin Sulaiman Al Rajhi
2. Salah bin Ali Aba Alkhail
3. Alaa bin Shakib Aljabri
4. Khaled bin Abdulrahman Alqwaiz
5. Amin bin Fahad Alshiddi
6. Bader bin Mohammed Al Rajhi (Representative of Mohammed
Abdulaziz Al Rajhi & Sons Investment Co.)
7. Abdullatif bin Ali Alseif (Representative of Public Pension Agency)
8. Hamza bin Othman Khushaim (Representative of GOSI)
9. Abdulaziz bin Khalid A Alghefaily
10. Raid bin Abdullah Al Tamimi
11. Ibrahim bin Fahad Alghefaily

An
nu
al
Re
po
rt
20
18
Corporate Governance10
4About the BankAbout the Bank
Value DriversValue Drivers
LeadershipLeadership
StrategyStrategy
PerformancePerformance
Corporate GovernanceCorporate Governance
Financial ReportsFinancial Reports
Supplementary InformationSupplementary Information
Bank’s signifi cant plans, decisions and the future expectations
ARB maintains its leading position in retail as
its market share represents 36.4% of total retail
loans granted in Q3 2018. The Bank intends
to enhance its leadership in this sector by
increasing finance portfolio in general and real
estate finance in particular. The Bank intends to
initiate investment in the latest technology to
ensure providing the best banking services and
products as well as expanding customer base
by expanding branch network and electronic
banking channels.
Bank’s dividends distribution policy
The Bank distributes the specified annual net
profits, after deduction of all general expenses
and other costs and arranging the necessary
provisions to confront doubtful debts,
investment losses and urgent commitments for
which the Board of Directors evaluates the risk
level under the Banking Control Law and Saudi
Arabian Monetary Authority (SAMA) directions
as follows:
a. The due Zakat amounts scheduled to be
paid by shareholders are calculated and
the Bank pays such amounts to competent
parties.
b. The Bank transfers not less than 25% of the
remaining net profits to the following year
after deducting the Zakat of the statutory
reserve to ensure that the mentioned reserve
becomes equal–at least–to the paid capital.
c. Of the remaining profits, not less than 5% of
the paid capital after deducting the statutory
reserves and Zakat to be distributed to
shareholders according to recommendations
of the Board of Directors and decisions of the
General Assembly. If the percentage left from
the profits due to shareholders is insufficient
to pay the above-mentioned percentage, the
shareholders may not claim to pay it during
the next year(s) and the General Assembly
may not decide to distribute a percentage of
profit greater than the one proposed by the
Board of Directors.
d. After allocating the amounts mentioned
in items (a), (b) and (c); the remaining
amount will be used according to the
recommendation of the Board of Directors
and the decision of the General Assembly.
Distribution of dividends
Profits distributed during the year 18 July 2018 Percentage of profits
to be distributed at the
end of the year
Total profits
Percentage of dividend to share
book value 20 22.5 42.5
Total 3,250,000 3,656,000.25 6,906,000.25
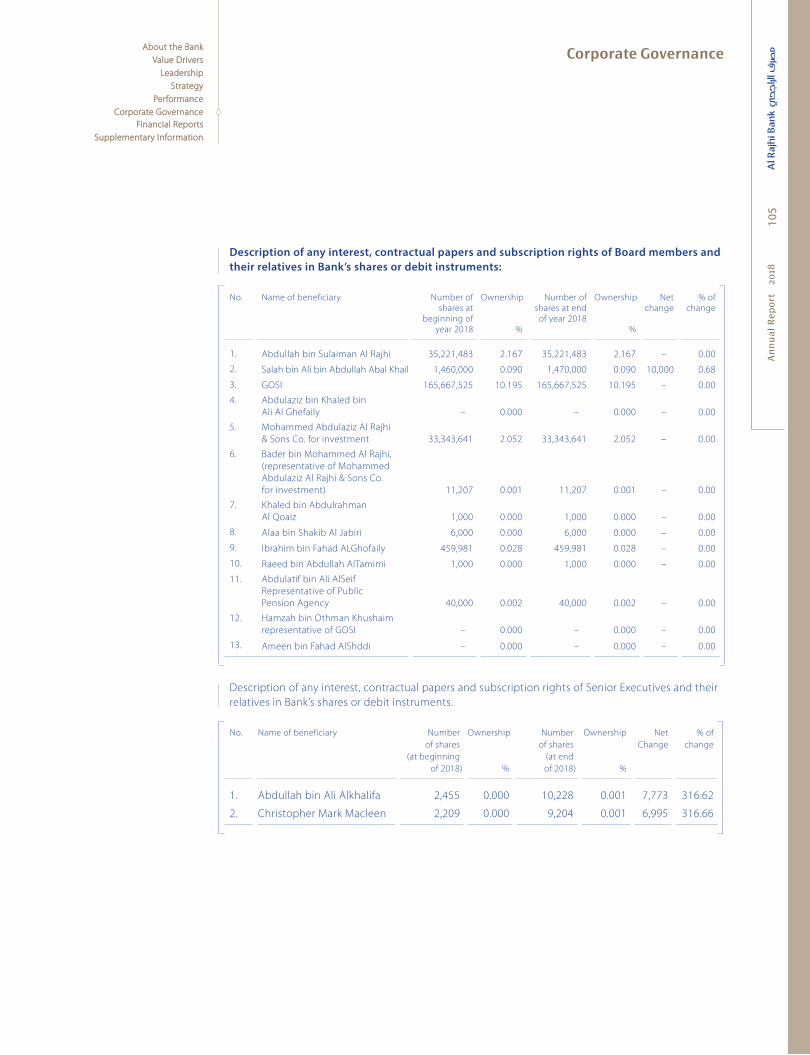
An
nu
al
Re
po
rt
20
18
Corporate Governance
105
About the BankAbout the Bank
Value DriversValue Drivers
LeadershipLeadership
StrategyStrategy
PerformancePerformance
Corporate GovernanceCorporate Governance
Financial ReportsFinancial Reports
Supplementary InformationSupplementary Information
Description of any interest, contractual papers and subscription rights of Board members and
their relatives in Bank’s shares or debit instruments:
No. Name of beneficiary Number of shares at
beginning ofyear 2018
Ownership
%
Number of shares at end
of year 2018
Ownership
%
Netchange
% ofchange
1. Abdullah bin Sulaiman Al Rajhi 35,221,483 2.167 35,221,483 2.167 – 0.00
2. Salah bin Ali bin Abdullah Abal Khail 1,460,000 0.090 1,470,000 0.090 10,000 0.68
3. GOSI 165,667,525 10.195 165,667,525 10.195 – 0.00
4. Abdulaziz bin Khaled bin
Ali Al Ghefaily – 0.000 – 0.000 – 0.00
5. Mohammed Abdulaziz Al Rajhi
& Sons Co. for investment 33,343,641 2.052 33,343,641 2.052 – 0.00
6. Bader bin Mohammed Al Rajhi,
(representative of Mohammed
Abdulaziz Al Rajhi & Sons Co.
for investment) 11,207 0.001 11,207 0.001 – 0.00
7. Khaled bin Abdulrahman
Al Qoaiz 1,000 0.000 1,000 0.000 – 0.00
8. Alaa bin Shakib Al Jabiri 6,000 0.000 6,000 0.000 – 0.00
9. Ibrahim bin Fahad ALGhofaily 459,981 0.028 459,981 0.028 – 0.00
10. Raeed bin Abdullah AlTamimi 1,000 0.000 1,000 0.000 – 0.00
11. Abdulatif bin Ali AlSeif
Representative of Public
Pension Agency 40,000 0.002 40,000 0.002 – 0.00
12. Hamzah bin Othman Khushaim
representative of GOSI – 0.000 – 0.000 – 0.00
13. Ameen bin Fahad AlShddi – 0.000 – 0.000 – 0.00
Description of any interest, contractual papers and subscription rights of Senior Executives and their
relatives in Bank’s shares or debit instruments.
No. Name of beneficiary Number
of shares
(at beginning
of 2018)
Ownership
%
Number
of shares
(at end
of 2018)
Ownership
%
Net
Change
% of
change
1. Abdullah bin Ali Alkhalifa 2,455 0.000 10,228 0.001 7,773 316.62
2. Christopher Mark Macleen 2,209 0.000 9,204 0.001 6,995 316.66

An
nu
al
Re
po
rt
20
18
Corporate Governance10
6About the BankAbout the Bank
Value DriversValue Drivers
LeadershipLeadership
StrategyStrategy
PerformancePerformance
Corporate GovernanceCorporate Governance
Financial ReportsFinancial Reports
Supplementary InformationSupplementary Information
Board sessions and attendance
The Board of Directors held seven sessions during 2018:
Number of meetings (7)
No. Member name First
meeting
25 February
2018
Second
meeting
25 March
2018
Third
meeting
14 May
2018
Fourth
meeting
17 July
2018
Fifth
meeting
22 October
2018
Sixth
meeting
23 October
2018
Seventh
meeting
20 December
2018
1. Abdullah bin
Sulaiman Al Rajhi
2. Salah bin Ali Aba
Alkhail
3. Abdulaziz bin Khaled
Al Ghefaily
4. Bader bin Mohamed
Al Rajhi
5. Khaled bin
Abdulrahman
Al Qwaiz
6. Alaa bin Shakib
Al Jabri
7. Ibrahim Fahad
Al-Ghefaily
8. Amin bin Fahad
Al Shiddi
9. Hamza bin Othman
Khushaim
10. Raid bin Abdullah
Al-Tamimi
11. Abdullatif bin
Ali Al Seif
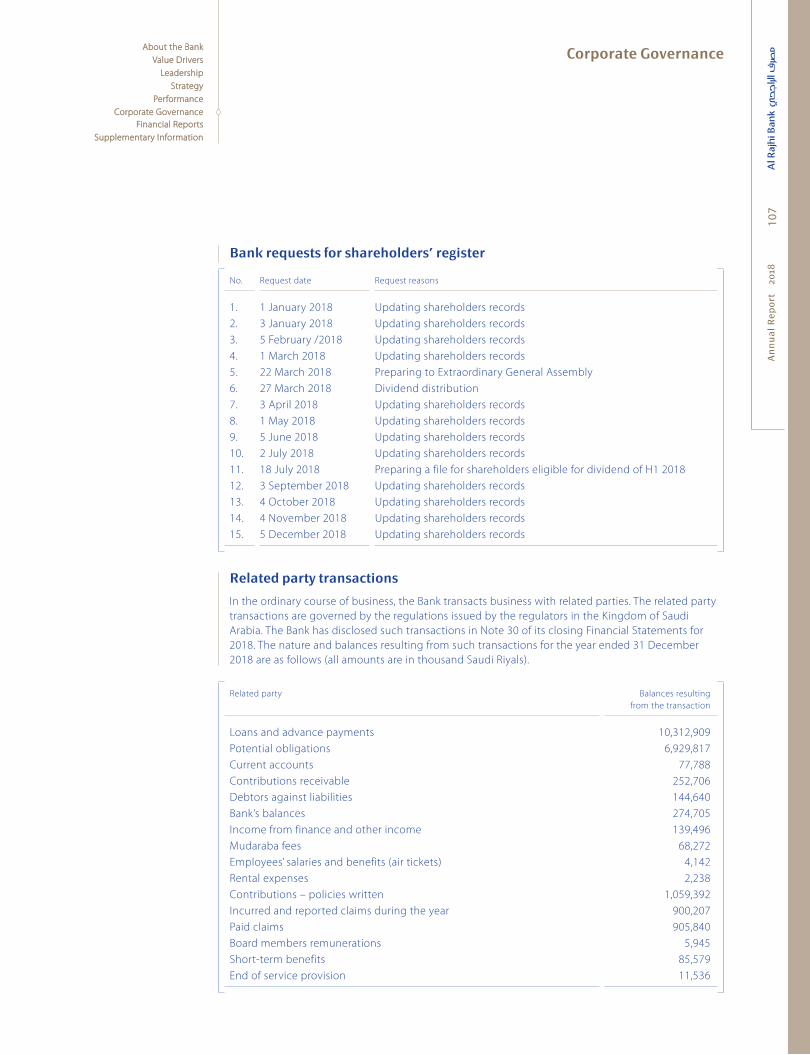
An
nu
al
Re
po
rt
20
18
Corporate Governance
107
About the BankAbout the Bank
Value DriversValue Drivers
LeadershipLeadership
StrategyStrategy
PerformancePerformance
Corporate GovernanceCorporate Governance
Financial ReportsFinancial Reports
Supplementary InformationSupplementary Information
Bank requests for shareholders’ register
No. Request date Request reasons
1. 1 January 2018 Updating shareholders records
2. 3 January 2018 Updating shareholders records
3. 5 February /2018 Updating shareholders records
4. 1 March 2018 Updating shareholders records
5. 22 March 2018 Preparing to Extraordinary General Assembly
6. 27 March 2018 Dividend distribution
7. 3 April 2018 Updating shareholders records
8. 1 May 2018 Updating shareholders records
9. 5 June 2018 Updating shareholders records
10. 2 July 2018 Updating shareholders records
11. 18 July 2018 Preparing a file for shareholders eligible for dividend of H1 2018
12. 3 September 2018 Updating shareholders records
13. 4 October 2018 Updating shareholders records
14. 4 November 2018 Updating shareholders records
15. 5 December 2018 Updating shareholders records
Related party transactions
In the ordinary course of business, the Bank transacts business with related parties. The related party
transactions are governed by the regulations issued by the regulators in the Kingdom of Saudi
Arabia. The Bank has disclosed such transactions in Note 30 of its closing Financial Statements for
2018. The nature and balances resulting from such transactions for the year ended 31 December
2018 are as follows (all amounts are in thousand Saudi Riyals).
Related party Balances resulting
from the transaction
Loans and advance payments 10,312,909
Potential obligations 6,929,817
Current accounts 77,788
Contributions receivable 252,706
Debtors against liabilities 144,640
Bank’s balances 274,705
Income from finance and other income 139,496
Mudaraba fees 68,272
Employees’ salaries and benefits (air tickets) 4,142
Rental expenses 2,238
Contributions – policies written 1,059,392
Incurred and reported claims during the year 900,207
Paid claims 905,840
Board members remunerations 5,945
Short-term benefits 85,579
End of service provision 11,536

An
nu
al
Re
po
rt
20
18
Corporate Governance10
8About the BankAbout the Bank
Value DriversValue Drivers
LeadershipLeadership
StrategyStrategy
PerformancePerformance
Corporate GovernanceCorporate Governance
Financial ReportsFinancial Reports
Supplementary InformationSupplementary Information
Information of 2018 transactions and contracts in which the Bank is a party and any of Board members or senior executives,
or any of their related parties has an interest:
Commercial and services contracts (Figures are in SAR)
No. Related party Party with direct
indirect interest
Position
in ARB
Type of relation with
related party
Relation type Period Conditions Transactions/
contracts
amount
SAR
1. Fursan Travel &
Tourism Co.
Abdullah bin
Sulaiman Al Rajhi
Board
member
Owned by Board
member
Travel tickets for
employees contract
Pricing
contract
and annually
renewable
Standard
conditions
without
preferences
4,141,611
2. STC Amin bin Fahad
Alshiddi
Board
member
Senior executive
in the company
Integrated
communications
services and solutions
contract – SMS
services
Pricing
contract
for two years
Standard
conditions
without
preferences
36,708,895
3. STC Amin bin Fahad
Alshiddi
Board
member
Senior executive
in the company
Integrated
communications
services and solutions
contract – rented
lines
Pricing
contract
for three years
Standard
conditions
without
preferences
55,450,171
4. STC Amin bin Fahad
Alshiddi
Board
member
Senior executive
in the company
Contract and services
for connecting PoS
devices to network
Pricing
contract
and annually
renewable
Standard
conditions
without
preferences
28,208,748
5. Arabian Internet
and Telecom
Services
(STC Solutions)
Amin bin Fahad
Alshiddi
Board
member
He has an influence
on company’s
decisions as he is a
senior executive in
the parent company
(STC)
Internet services
contract
Annual
contract
Standard
conditions
without
preferences
1,512,000
6. Arabian Internet
and Telecom
Services
(STC Solutions)
Amin bin Fahad
Alshiddi
Board
member
He has an influence
on company’s
decisions as he is a
senior executive in
the parent company
(STC)
Supply, instalation
and maintenance
of devices Dell-EMC
contract
4 years Standard
conditions
without
preferences
75,111,584
7. Global Beverage
Holding Company
Bader bin
Mohammed
Al Rajhi
Board
member
Chairman of the
company’s
Board of Directors
Bottled water
supply services
Annual
contract
(as per the best
quotation)
Standard
conditions
without
preferences
299,987
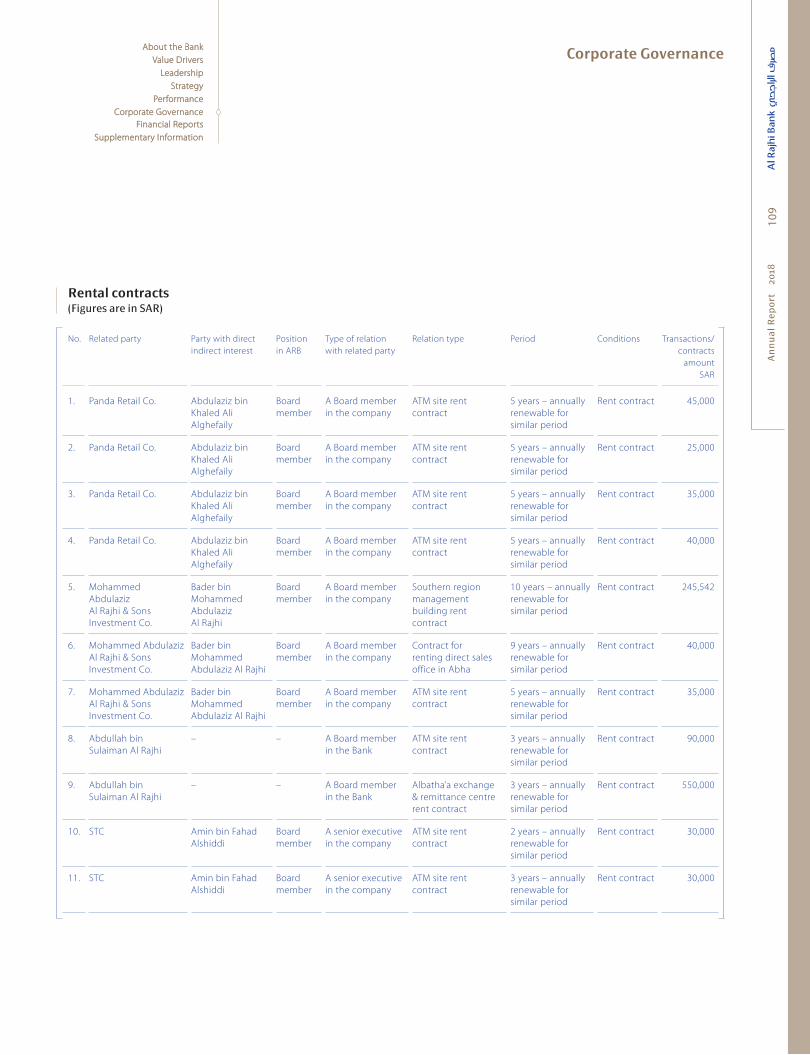
An
nu
al
Re
po
rt
20
18
Corporate Governance
109
About the BankAbout the Bank
Value DriversValue Drivers
LeadershipLeadership
StrategyStrategy
PerformancePerformance
Corporate GovernanceCorporate Governance
Financial ReportsFinancial Reports
Supplementary InformationSupplementary Information
Rental contracts (Figures are in SAR)
No. Related party Party with direct
indirect interest
Position
in ARB
Type of relation
with related party
Relation type Period Conditions Transactions/
contracts
amount
SAR
1. Panda Retail Co. Abdulaziz bin
Khaled Ali
Alghefaily
Board
member
A Board member
in the company
ATM site rent
contract
5 years – annually
renewable for
similar period
Rent contract 45,000
2. Panda Retail Co. Abdulaziz bin
Khaled Ali
Alghefaily
Board
member
A Board member
in the company
ATM site rent
contract
5 years – annually
renewable for
similar period
Rent contract 25,000
3. Panda Retail Co. Abdulaziz bin
Khaled Ali
Alghefaily
Board
member
A Board member
in the company
ATM site rent
contract
5 years – annually
renewable for
similar period
Rent contract 35,000
4. Panda Retail Co. Abdulaziz bin
Khaled Ali
Alghefaily
Board
member
A Board member
in the company
ATM site rent
contract
5 years – annually
renewable for
similar period
Rent contract 40,000
5. Mohammed
Abdulaziz
Al Rajhi & Sons
Investment Co.
Bader bin
Mohammed
Abdulaziz
Al Rajhi
Board
member
A Board member
in the company
Southern region
management
building rent
contract
10 years – annually
renewable for
similar period
Rent contract 245,542
6. Mohammed Abdulaziz
Al Rajhi & Sons
Investment Co.
Bader bin
Mohammed
Abdulaziz Al Rajhi
Board
member
A Board member
in the company
Contract for
renting direct sales
office in Abha
9 years – annually
renewable for
similar period
Rent contract 40,000
7. Mohammed Abdulaziz
Al Rajhi & Sons
Investment Co.
Bader bin
Mohammed
Abdulaziz Al Rajhi
Board
member
A Board member
in the company
ATM site rent
contract
5 years – annually
renewable for
similar period
Rent contract 35,000
8. Abdullah bin
Sulaiman Al Rajhi
– – A Board member
in the Bank
ATM site rent
contract
3 years – annually
renewable for
similar period
Rent contract 90,000
9. Abdullah bin
Sulaiman Al Rajhi
– – A Board member
in the Bank
Albatha’a exchange
& remittance centre
rent contract
3 years – annually
renewable for
similar period
Rent contract 550,000
10. STC Amin bin Fahad
Alshiddi
Board
member
A senior executive
in the company
ATM site rent
contract
2 years – annually
renewable for
similar period
Rent contract 30,000
11. STC Amin bin Fahad
Alshiddi
Board
member
A senior executive
in the company
ATM site rent
contract
3 years – annually
renewable for
similar period
Rent contract 30,000

An
nu
al
Re
po
rt
20
18
Corporate Governance11
0About the BankAbout the Bank
Value DriversValue Drivers
LeadershipLeadership
StrategyStrategy
PerformancePerformance
Corporate GovernanceCorporate Governance
Financial ReportsFinancial Reports
Supplementary InformationSupplementary Information
Insurance Contracts (Figures are in SAR)
No. Related party Party with direct
indirect interest
Position
in ARB
Type of relation
with related party
Relation type Period Conditions Transactions/
contracts
amount
SAR
1. Al Rajhi Co. for
Cooperative
Insurance
Abdullah bin
Sulaiman
Abdulaziz Al Rajhi
Board
member
A Board member
in the company
Comprehensive insurance
for banks, properties, work
disruption, managers and
executives
Annual
contracts
Standard
conditions
without
preferences
7,665,921
2. Al Rajhi Co. for
Cooperative
Insurance
Abdullah bin
Sulaiman
Abdulaziz Al Rajhi
Board
member
A Board member
in the company
Comprehensive insurance
for cars
Annual
contracts
No preferred
conditions or
benefits
1,051,726,079
Regulatory payments
The Bank’s regulatory payments during the year consisted of Zakat due by shareholders, taxes, amounts paid to the General
Organisation for Social Insurance (GOSI), Visa and Passport costs etc.
Details of payments made during the year are given below:
Description
2018
Brief description ReasonsPaid
Payable until
the end of the
financial period
(not paid)
Zakat 1,081,054,185 – Paid –
Tax 29,181,464.05 – Paid –
VAT 110,120,152.12 – Paid
GOSI 247,939,702.00 – Paid –
Visa and Passports costs 828,704.00 – Paid –
Ministry of Labour Fees 6,028,289.00 – Paid –
There were no amounts due for the financial period but unpaid.

An
nu
al
Re
po
rt
20
18
Corporate Governance
111
About the BankAbout the Bank
Value DriversValue Drivers
LeadershipLeadership
StrategyStrategy
PerformancePerformance
Corporate GovernanceCorporate Governance
Financial ReportsFinancial Reports
Supplementary InformationSupplementary Information
Employee Benefi ts and Plans
The Bank provides its employees with a number
of benefits which are paid during or at the end
of their service according to Saudi Labour Law
and Bank policies. The provision for employees’
end of service benefits is accrued using accrual
valuation according to Saudi Labour Law and
local regulatory requirements. The provision for
end of service benefits stood at SAR 848 Mn.
Al Rajhi Bank also grants free shares to its
senior employees and those of its subsidiary
companies who are seen as valuable human
assets. This helps to ensure the long-term
commitment of these employees. Granting of
shares is based on the approval of the Board
of Directors upon their commendation of the
Nomination and Remuneration Committee.
Books of Accounts
The Consolidated Financial Statements are
prepared in accordance with the Accounting
Standards for Financial Institutions promulgated
by SAMA and the International Financial
Reporting Standards (IFRS). The Bank also prepares
its Consolidated Financial Statements to comply
with the requirements of Banking Control Law
and the Companies Law in the Kingdom of Saudi
Arabia, and the Bank’s Articles of Association.
Basel 3
Certain qualitative and quantitative
disclosures are published by ARB. These
disclosures are available in the Annual Basel
Report and are available on the ARB website
(www.alrajhibank.com.sa).
Auditors
During the Ordinary General Assembly of
shareholders, PricewaterhouseCoopers and
KPMG Al Fozan and Partners were designated
as Auditors of the Bank’s accounts for the fiscal
year 2018. The next General Assembly will
designate the External Auditors for the fiscal
year of 2019, based on a recommendation from
the Audit and Compliance Committee.
The Board of Directors has not recommended
replacing the External Auditors before the end
of their contract.
Acknowledgment of Board of Directors
According to the available information,
Auditor’s report, and current market data, the
Board of Directors acknowledge the following:
Accounting records have been prepared
properly.
Internal control system has been prepared
based on proper fundamentals and executed
efficiently.
There is no doubt about the Bank’s ability to
continue its business.
Conclusion
The Board of Directors is pleased to express
their pride in the positive results achieved by
the Bank in 2018. On this occasion, the Board
would like to convey its appreciation to the
Custodian of the Two Holy Mosques, Crown
Prince, and our wise Government.
The Board would also like to express its sincere
appreciation to the Ministry of Finance, Ministry of
Commerce & Investment, Saudi Arabian Monetary
Authority (SAMA) and the Capital Market Authority
(CMA) for their consistent cooperation and
support in developing the banking sector, which
manifests itself in the reinforcement and growth
of the national economy.
The Board would also like to seize this
opportunity to express its gratitude and
appreciation to the honorable shareholders,
customers and correspondents for their
support, trust and cooperation, which has led
to the achievement of further advancement
and prosperity for the Bank. Last but not least,
the Board would like to present its sincere
appreciation to all the Bank employees for their
loyal efforts and devotion in accomplishing
their obligations and tasks. In addition, the
Bank extends its appreciation to Sharia Board
members for their loyal efforts and effective
contributions to the Bank’s business.

An
nu
al
Re
po
rt
20
18
Corporate Governance11
2About the BankAbout the Bank
Value DriversValue Drivers
LeadershipLeadership
StrategyStrategy
PerformancePerformance
Corporate GovernanceCorporate Governance
Financial ReportsFinancial Reports
Supplementary InformationSupplementary Information
An
nu
al
Re
po
rt
20
1811
3
Financial Reports
Independent Auditors’ Report
114
Consolidated Statement of Financial Position
120
Consolidated Statement of Income
121
Consolidated Statement of Comprehensive Income
122
Consolidated Statement of Changes in Shareholders’ Equity
123
Consolidated Statement of Cash Flows
124
Notes to the Consolidated Financial Statements
125
Basel 3 Qualitative and Quantitative Disclosures
205
An
nu
al
Re
po
rt
20
1811
3

An
nu
al
Re
po
rt
20
1811
4About the BankAbout the Bank
Value DriversValue Drivers
LeadershipLeadership
StrategyStrategy
PerformancePerformance
Corporate GovernanceCorporate Governance
Financial ReportsFinancial Reports
Supplementary InformationSupplementary Information
Independent Auditors’ Report
Independent auditors’ report on the audit of the consolidated financial statements to the shareholders of Al Rajhi Banking and Investment Corporation (a Saudi Joint Stock Company)
Opinion
We have audited the consolidated financial statements of Al Rajhi Banking and Investment Corporation (“the Bank”) and its We have audited the consolidated financial statements of Al Rajhi Banking and Investment Corporation (“the Bank”) and its
subsidiaries (collectively referred to as “the Group”), which comprise the consolidated statement of financial position as at subsidiaries (collectively referred to as “the Group”), which comprise the consolidated statement of financial position as at
31 December 2018, and the consolidated statement of income, consolidated statement of comprehensive income, consolidated 31 December 2018, and the consolidated statement of income, consolidated statement of comprehensive income, consolidated
statement of changes in shareholders’ equity and consolidated statement of cash flows for the year then ended, and notes to the statement of changes in shareholders’ equity and consolidated statement of cash flows for the year then ended, and notes to the
consolidated financial statements, including a summary of significant accounting policies. consolidated financial statements, including a summary of significant accounting policies.
In our opinion, the accompanying consolidated financial statements present fairly, in all material respects, the consolidated financial In our opinion, the accompanying consolidated financial statements present fairly, in all material respects, the consolidated financial
position of the Group as at 31 December 2018, and its consolidated financial performance and its consolidated cash flows for the position of the Group as at 31 December 2018, and its consolidated financial performance and its consolidated cash flows for the
year then ended in accordance with International Financial Reporting Standards (“IFRS”) as modified by the Saudi Arabian Monetary year then ended in accordance with International Financial Reporting Standards (“IFRS”) as modified by the Saudi Arabian Monetary
Authority (“SAMA”) for the accounting of zakat and income tax. Authority (“SAMA”) for the accounting of zakat and income tax.
Basis for opinion
We conducted our audit in accordance with the International Standards on Auditing that are endorsed in the Kingdom of We conducted our audit in accordance with the International Standards on Auditing that are endorsed in the Kingdom of
Saudi Arabia. Our responsibilities under those standards are further described in the Saudi Arabia. Our responsibilities under those standards are further described in the Auditors’ responsibilities for the audit of the Auditors’ responsibilities for the audit of the consolidated financial statementsconsolidated financial statements section of our report. We are independent of the Group in accordance with the professional code section of our report. We are independent of the Group in accordance with the professional code
of conduct and ethics as endorsed in the Kingdom of Saudi Arabia that are relevant to our audit of the consolidated financial of conduct and ethics as endorsed in the Kingdom of Saudi Arabia that are relevant to our audit of the consolidated financial
statements, and we have fulfilled our other ethical responsibilities in accordance with these requirements. We believe that the audit statements, and we have fulfilled our other ethical responsibilities in accordance with these requirements. We believe that the audit
evidence we have obtained is sufficient and appropriate to provide a basis for our opinion.evidence we have obtained is sufficient and appropriate to provide a basis for our opinion.
Key audit matters
Key audit matters are those matters that, in our professional judgement, were of most significance in our audit of the consolidated Key audit matters are those matters that, in our professional judgement, were of most significance in our audit of the consolidated
financial statements for the current year. These matters were addressed in the context of our audit of the consolidated financial financial statements for the current year. These matters were addressed in the context of our audit of the consolidated financial
statements as a whole, and in forming our opinion thereon, and we do not provide a separate opinion on these matters. For each statements as a whole, and in forming our opinion thereon, and we do not provide a separate opinion on these matters. For each
matter below, a description of how our audit addressed the matter is provided in that context:matter below, a description of how our audit addressed the matter is provided in that context:
KPMG Al Fozan & PartnersCertified Public Accountants
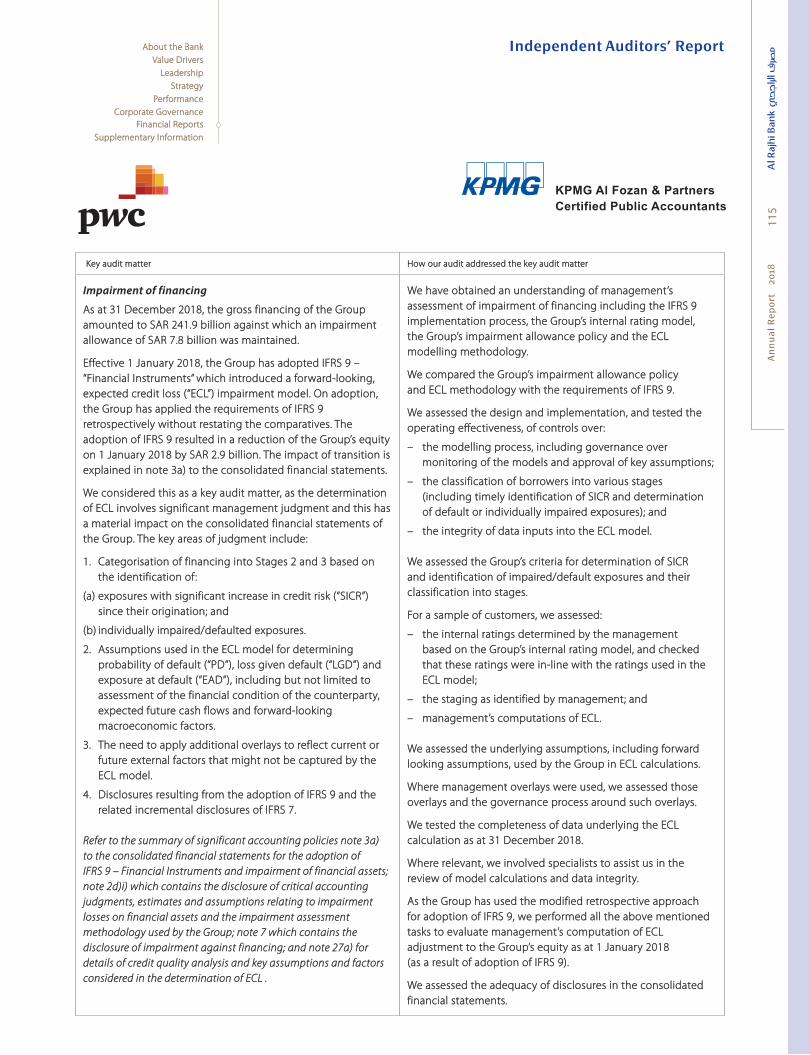
Independent Auditors’ Report
An
nu
al
Re
po
rt
20
1811
5
About the BankAbout the Bank
Value DriversValue Drivers
LeadershipLeadership
StrategyStrategy
PerformancePerformance
Corporate GovernanceCorporate Governance
Financial ReportsFinancial Reports
Supplementary InformationSupplementary Information
Key audit matterKey audit matter How our audit addressed the key audit matterHow our audit addressed the key audit matter
Impairment of financing Impairment of financing
As at 31 December 2018, the gross financing of the Group As at 31 December 2018, the gross financing of the Group
amounted to SAR 241.9 billion against which an impairment amounted to SAR 241.9 billion against which an impairment
allowance of SAR 7.8 billion was maintained.allowance of SAR 7.8 billion was maintained.
Effective 1 January 2018, the Group has adopted IFRS 9 – Effective 1 January 2018, the Group has adopted IFRS 9 –
“Financial Instruments” which introduced a forward-looking, “Financial Instruments” which introduced a forward-looking,
expected credit loss (“ECL”) impairment model. On adoption, expected credit loss (“ECL”) impairment model. On adoption,
the Group has applied the requirements of IFRS 9 the Group has applied the requirements of IFRS 9
retrospectively without restating the comparatives. The retrospectively without restating the comparatives. The
adoption of IFRS 9 resulted in a reduction of the Group’s equity adoption of IFRS 9 resulted in a reduction of the Group’s equity
on 1 January 2018 by SAR 2.9 billion. The impact of transition is on 1 January 2018 by SAR 2.9 billion. The impact of transition is
explained in note 3a) to the consolidated financial statements.explained in note 3a) to the consolidated financial statements.
We considered this as a key audit matter, as the determination We considered this as a key audit matter, as the determination
of ECL involves significant management judgment and this has of ECL involves significant management judgment and this has
a material impact on the consolidated financial statements of a material impact on the consolidated financial statements of
the Group. The key areas of judgment include:the Group. The key areas of judgment include:
1. Categorisation of financing into Stages 2 and 3 based on 1. Categorisation of financing into Stages 2 and 3 based on
the identification of:the identification of:
(a) exposures with significant increase in credit risk (“SICR”) (a) exposures with significant increase in credit risk (“SICR”)
since their origination; and since their origination; and
(b) individually impaired/defaulted exposures.(b) individually impaired/defaulted exposures.
2. Assumptions used in the ECL model for determining 2. Assumptions used in the ECL model for determining
probability of default (“PD”), loss given default (“LGD”) and probability of default (“PD”), loss given default (“LGD”) and
exposure at default (“EAD”), including but not limited to exposure at default (“EAD”), including but not limited to
assessment of the financial condition of the counterparty, assessment of the financial condition of the counterparty,
expected future cash flows and forward-looking expected future cash flows and forward-looking
macroeconomic factors.macroeconomic factors.
3. The need to apply additional overlays to reflect current or 3. The need to apply additional overlays to reflect current or
future external factors that might not be captured by the future external factors that might not be captured by the
ECL model.ECL model.
4. Disclosures resulting from the adoption of IFRS 9 and the 4. Disclosures resulting from the adoption of IFRS 9 and the
related incremental disclosures of IFRS 7.related incremental disclosures of IFRS 7.
Refer to the summary of significant accounting policies note 3a) Refer to the summary of significant accounting policies note 3a) to the consolidated financial statements for the adoption of to the consolidated financial statements for the adoption of IFRS 9 – Financial Instruments and impairment of financial assets; IFRS 9 – Financial Instruments and impairment of financial assets; note 2d)i) which contains the disclosure of critical accounting note 2d)i) which contains the disclosure of critical accounting judgments, estimates and assumptions relating to impairment judgments, estimates and assumptions relating to impairment losses on financial assets and the impairment assessment losses on financial assets and the impairment assessment methodology used by the Group; note 7 which contains the methodology used by the Group; note 7 which contains the disclosure of impairment against financing; and note 27a) for disclosure of impairment against financing; and note 27a) for details of credit quality analysis and key assumptions and factors details of credit quality analysis and key assumptions and factors considered in the determination of ECL .considered in the determination of ECL .
We have obtained an understanding of management’s We have obtained an understanding of management’s
assessment of impairment of financing including the IFRS 9 assessment of impairment of financing including the IFRS 9
implementation process, the Group’s internal rating model, implementation process, the Group’s internal rating model,
the Group’s impairment allowance policy and the ECL the Group’s impairment allowance policy and the ECL
modelling methodology. modelling methodology.
We compared the Group’s impairment allowance policy We compared the Group’s impairment allowance policy
and ECL methodology with the requirements of IFRS 9.and ECL methodology with the requirements of IFRS 9.
We assessed the design and implementation, and tested the We assessed the design and implementation, and tested the
operating effectiveness, of controls over:operating effectiveness, of controls over:
– the modelling process, including governance over – the modelling process, including governance over
monitoring of the models and approval of key assumptions;monitoring of the models and approval of key assumptions;
– the classification of borrowers into various stages – the classification of borrowers into various stages
(including timely identification of SICR and determination (including timely identification of SICR and determination
of default or individually impaired exposures); and of default or individually impaired exposures); and
– the integrity of data inputs into the ECL model.– the integrity of data inputs into the ECL model.
We assessed the Group’s criteria for determination of SICR We assessed the Group’s criteria for determination of SICR
and identification of impaired/default exposures and their and identification of impaired/default exposures and their
classification into stages.classification into stages.
For a sample of customers, we assessed:For a sample of customers, we assessed:
– the internal ratings determined by the management – the internal ratings determined by the management
based on the Group’s internal rating model, and checked based on the Group’s internal rating model, and checked
that these ratings were in-line with the ratings used in the that these ratings were in-line with the ratings used in the
ECL model; ECL model;
– the staging as identified by management; and – the staging as identified by management; and
– management’s computations of ECL.– management’s computations of ECL.
We assessed the underlying assumptions, including forward We assessed the underlying assumptions, including forward
looking assumptions, used by the Group in ECL calculations.looking assumptions, used by the Group in ECL calculations.
Where management overlays were used, we assessed those Where management overlays were used, we assessed those
overlays and the governance process around such overlays.overlays and the governance process around such overlays.
We tested the completeness of data underlying the ECL We tested the completeness of data underlying the ECL
calculation as at 31 December 2018.calculation as at 31 December 2018.
Where relevant, we involved specialists to assist us in the Where relevant, we involved specialists to assist us in the
review of model calculations and data integrity.review of model calculations and data integrity.
As the Group has used the modified retrospective approach As the Group has used the modified retrospective approach
for adoption of IFRS 9, we performed all the above mentioned for adoption of IFRS 9, we performed all the above mentioned
tasks to evaluate management’s computation of ECL tasks to evaluate management’s computation of ECL
adjustment to the Group’s equity as at 1 January 2018 adjustment to the Group’s equity as at 1 January 2018
(as a result of adoption of IFRS 9).(as a result of adoption of IFRS 9).
We assessed the adequacy of disclosures in the consolidated We assessed the adequacy of disclosures in the consolidated
financial statements.financial statements.
KPMG Al Fozan & PartnersCertified Public Accountants

Independent Auditors’ ReportA
nn
ua
l R
ep
ort
2
018
116
About the BankAbout the Bank
Value DriversValue Drivers
LeadershipLeadership
StrategyStrategy
PerformancePerformance
Corporate GovernanceCorporate Governance
Financial ReportsFinancial Reports
Supplementary InformationSupplementary Information
Key audit matterKey audit matter How our audit addressed the key audit matterHow our audit addressed the key audit matter
Fees from banking servicesFees from banking servicesThe Group charges administrative fees upfront to borrowers The Group charges administrative fees upfront to borrowers
in respect of financing transactions. in respect of financing transactions.
All such fees are an integral part of generating an involvement All such fees are an integral part of generating an involvement
with the resulting financial instrument and therefore, these with the resulting financial instrument and therefore, these
fees should be considered as part of the effective yield fees should be considered as part of the effective yield
on financing and recognised within ‘Gross financing and on financing and recognised within ‘Gross financing and
investment income’. investment income’.
However, due to the large volume of transactions with mostly However, due to the large volume of transactions with mostly
individually insignificant fee amounts, management used individually insignificant fee amounts, management used
certain assumptions and thresholds for recognition of such certain assumptions and thresholds for recognition of such
fees and classified them within “Fee from banking services, net”.fees and classified them within “Fee from banking services, net”.
We considered this as a key audit matter since the use of We considered this as a key audit matter since the use of
management assumptions and judgments could result management assumptions and judgments could result
in material misstatement to the consolidated financial in material misstatement to the consolidated financial
statements, as they affect the timing and recognition of fees. statements, as they affect the timing and recognition of fees.
Refer to the summary of significant accounting policies note 3e) Refer to the summary of significant accounting policies note 3e) to the consolidated financial statements.to the consolidated financial statements.
We performed the following audit procedures:We performed the following audit procedures:
– We assessed the design and implementation and tested – We assessed the design and implementation and tested
the operating effectiveness of key controls over the the operating effectiveness of key controls over the
consistent application of management’s assumptions consistent application of management’s assumptions
and thresholds for recognition of fee income.and thresholds for recognition of fee income.
– We evaluated the assumptions and thresholds used – We evaluated the assumptions and thresholds used
by management for making adjustments to the effective by management for making adjustments to the effective
yield of financing and checked the recording of such yield of financing and checked the recording of such
adjustments.adjustments.
– We obtained management’s assessment of the impact of – We obtained management’s assessment of the impact of
the use of assumptions and thresholds and performed the the use of assumptions and thresholds and performed the
following:following:
– on a sample basis, traced the historical and current year on a sample basis, traced the historical and current year
data used by management to the underlying accounting data used by management to the underlying accounting
records; andrecords; and
– assessed management’s estimation of the impact of fees – assessed management’s estimation of the impact of fees
on ‘Fee from banking services, net’ and classification in on ‘Fee from banking services, net’ and classification in
‘Gross financing and investment income’.‘Gross financing and investment income’.
KPMG Al Fozan & PartnersCertified Public Accountants
Independent Auditors’ Report
An
nu
al
Re
po
rt
20
1811
7
About the BankAbout the Bank
Value DriversValue Drivers
LeadershipLeadership
StrategyStrategy
PerformancePerformance
Corporate GovernanceCorporate Governance
Financial ReportsFinancial Reports
Supplementary InformationSupplementary Information
Other information included in the Group’s 2018 annual report
The Board of Directors (“the Directors”) is responsible for the other information. Other information consists of the information The Board of Directors (“the Directors”) is responsible for the other information. Other information consists of the information
included in the Group’s 2018 annual report, other than the consolidated financial statements and our auditors’ report thereon. The included in the Group’s 2018 annual report, other than the consolidated financial statements and our auditors’ report thereon. The
annual report is expected to be made available to us after the date of this auditors’ report. annual report is expected to be made available to us after the date of this auditors’ report.
Our opinion on the consolidated financial statements does not cover the other information, and we do not and will not express any Our opinion on the consolidated financial statements does not cover the other information, and we do not and will not express any
form of assurance conclusion thereon.form of assurance conclusion thereon.
In connection with our audit of the consolidated financial statements, our responsibility is to read the other information identified In connection with our audit of the consolidated financial statements, our responsibility is to read the other information identified
above when it becomes available and, in doing so, consider whether the other information is materially inconsistent with the above when it becomes available and, in doing so, consider whether the other information is materially inconsistent with the
consolidated financial statements or our knowledge obtained in the audit, or otherwise appears to be materially misstated. consolidated financial statements or our knowledge obtained in the audit, or otherwise appears to be materially misstated.
When we read the other information, if we conclude that there is a material misstatement therein, we are required to communicate When we read the other information, if we conclude that there is a material misstatement therein, we are required to communicate
the matter to those charged with governance.the matter to those charged with governance.
Responsibilities of the Directors and those charged with governance for the consolidated financial statements
The Directors are responsible for the preparation and fair presentation of the consolidated financial statements in accordance with The Directors are responsible for the preparation and fair presentation of the consolidated financial statements in accordance with
IFRS as modified by SAMA for the accounting of zakat and income tax, applicable requirements of the Regulation for Companies, the IFRS as modified by SAMA for the accounting of zakat and income tax, applicable requirements of the Regulation for Companies, the
Banking Control Law in the Kingdom of Saudi Arabia and the Bank’s By-Laws, and for such internal control as the Directors determine Banking Control Law in the Kingdom of Saudi Arabia and the Bank’s By-Laws, and for such internal control as the Directors determine
is necessary to enable the preparation of consolidated financial statements that are free from material misstatement, whether due to is necessary to enable the preparation of consolidated financial statements that are free from material misstatement, whether due to
fraud or error. fraud or error.
In preparing the consolidated financial statements, the Directors are responsible for assessing the Group’s ability to continue as a In preparing the consolidated financial statements, the Directors are responsible for assessing the Group’s ability to continue as a
going concern, disclosing, as applicable, matters related to going concern and using the going concern basis of accounting unless going concern, disclosing, as applicable, matters related to going concern and using the going concern basis of accounting unless
the Directors either intend to liquidate the Group or to cease operations, or have no realistic alternative but to do so.the Directors either intend to liquidate the Group or to cease operations, or have no realistic alternative but to do so.
Those charged with governance are responsible for overseeing the Group’s financial reporting process. Those charged with governance are responsible for overseeing the Group’s financial reporting process.
Auditors’ responsibilities for the audit of the consolidated financial statements
Our objectives are to obtain reasonable assurance about whether the consolidated financial statements as a whole are free from Our objectives are to obtain reasonable assurance about whether the consolidated financial statements as a whole are free from
material misstatement, whether due to fraud or error, and to issue an auditors’ report that includes our opinion. Reasonable material misstatement, whether due to fraud or error, and to issue an auditors’ report that includes our opinion. Reasonable
assurance is a high level of assurance, but is not a guarantee that an audit conducted in accordance with the International assurance is a high level of assurance, but is not a guarantee that an audit conducted in accordance with the International
Standards on Auditing that are endorsed in the Kingdom of Saudi Arabia will always detect a material misstatement when it exists. Standards on Auditing that are endorsed in the Kingdom of Saudi Arabia will always detect a material misstatement when it exists.
Misstatements can arise from fraud or error and are considered material if, individually or in the aggregate, they could reasonably be Misstatements can arise from fraud or error and are considered material if, individually or in the aggregate, they could reasonably be
expected to influence the economic decisions of users taken on the basis of these consolidated financial statements.expected to influence the economic decisions of users taken on the basis of these consolidated financial statements.
KPMG Al Fozan & PartnersCertified Public Accountants

Independent Auditors’ ReportA
nn
ua
l R
ep
ort
2
018
118
About the BankAbout the Bank
Value DriversValue Drivers
LeadershipLeadership
StrategyStrategy
PerformancePerformance
Corporate GovernanceCorporate Governance
Financial ReportsFinancial Reports
Supplementary InformationSupplementary Information
As part of an audit in accordance with the International Standards on Auditing that are endorsed in the Kingdom of Saudi Arabia, As part of an audit in accordance with the International Standards on Auditing that are endorsed in the Kingdom of Saudi Arabia,
we exercise professional judgment and maintain professional skepticism throughout the audit. We also:we exercise professional judgment and maintain professional skepticism throughout the audit. We also:
Identify and assess the risks of material misstatement of the consolidated financial statements, whether due to fraud or error; Identify and assess the risks of material misstatement of the consolidated financial statements, whether due to fraud or error;
design and perform audit procedures responsive to those risks; and obtain audit evidence that is sufficient and appropriate design and perform audit procedures responsive to those risks; and obtain audit evidence that is sufficient and appropriate
to provide a basis for our opinion. The risk of not detecting a material misstatement resulting from fraud is higher than for to provide a basis for our opinion. The risk of not detecting a material misstatement resulting from fraud is higher than for
one resulting from error, as fraud may involve collusion, forgery, intentional omissions, misrepresentations, or the override one resulting from error, as fraud may involve collusion, forgery, intentional omissions, misrepresentations, or the override
of internal control.of internal control.
Obtain an understanding of internal control relevant to the audit in order to design audit procedures that are appropriate in the Obtain an understanding of internal control relevant to the audit in order to design audit procedures that are appropriate in the
circumstances, but not for the purpose of expressing an opinion on the effectiveness of the Group’s internal control.circumstances, but not for the purpose of expressing an opinion on the effectiveness of the Group’s internal control.
Evaluate the appropriateness of accounting policies used and the reasonableness of accounting estimates and related disclosures Evaluate the appropriateness of accounting policies used and the reasonableness of accounting estimates and related disclosures
made by the Directors.made by the Directors.
Conclude on the appropriateness of the Directors’ use of the going concern basis of accounting and, based on the audit evidence Conclude on the appropriateness of the Directors’ use of the going concern basis of accounting and, based on the audit evidence
obtained, whether a material uncertainty exists related to events or conditions that may cast significant doubt on the Group’s obtained, whether a material uncertainty exists related to events or conditions that may cast significant doubt on the Group’s
ability to continue as a going concern. If we conclude that a material uncertainty exists, we are required to draw attention in our ability to continue as a going concern. If we conclude that a material uncertainty exists, we are required to draw attention in our
auditors’ report to the related disclosures in the consolidated financial statements or, if such disclosures are inadequate, to modify auditors’ report to the related disclosures in the consolidated financial statements or, if such disclosures are inadequate, to modify
our opinion. Our conclusions are based on the audit evidence obtained up to the date of our auditors’ report. However, future our opinion. Our conclusions are based on the audit evidence obtained up to the date of our auditors’ report. However, future
events or conditions may cause the Group to cease to continue as a going concern.events or conditions may cause the Group to cease to continue as a going concern.
Evaluate the overall presentation, structure and content of the consolidated financial statements, including the disclosures, and Evaluate the overall presentation, structure and content of the consolidated financial statements, including the disclosures, and
whether the consolidated financial statements represent the underlying transactions and events in a manner that achieves fair whether the consolidated financial statements represent the underlying transactions and events in a manner that achieves fair
presentation.presentation.
Obtain sufficient appropriate audit evidence regarding the financial information of the entities or business activities within the Obtain sufficient appropriate audit evidence regarding the financial information of the entities or business activities within the
Group to express an opinion on the consolidated financial statements. We are responsible for the direction, supervision and Group to express an opinion on the consolidated financial statements. We are responsible for the direction, supervision and
performance of the Group audit. We remain jointly responsible for our audit opinion.performance of the Group audit. We remain jointly responsible for our audit opinion.
We communicate with those charged with governance regarding, among other matters, the planned scope and timing of the We communicate with those charged with governance regarding, among other matters, the planned scope and timing of the
audit and significant audit findings, including any significant deficiencies in internal control that we identify during our audit.audit and significant audit findings, including any significant deficiencies in internal control that we identify during our audit.
We also provide those charged with governance with a statement that we have complied with relevant ethical requirements We also provide those charged with governance with a statement that we have complied with relevant ethical requirements
regarding independence, and communicate to them all relationships and other matters that may reasonably be thought to bear regarding independence, and communicate to them all relationships and other matters that may reasonably be thought to bear
on our independence and, where applicable, related safeguards.on our independence and, where applicable, related safeguards.
KPMG Al Fozan & PartnersCertified Public Accountants

Independent Auditors’ Report
An
nu
al
Re
po
rt
20
1811
9
About the BankAbout the Bank
Value DriversValue Drivers
LeadershipLeadership
StrategyStrategy
PerformancePerformance
Corporate GovernanceCorporate Governance
Financial ReportsFinancial Reports
Supplementary InformationSupplementary Information
From the matters communicated with those charged with governance, we determine those matters that were of most significance From the matters communicated with those charged with governance, we determine those matters that were of most significance
in the audit of the consolidated financial statements for the year ended 31 December 2018 and are therefore the key audit matters. in the audit of the consolidated financial statements for the year ended 31 December 2018 and are therefore the key audit matters.
We describe these matters in our auditors’ report unless law or regulation precludes public disclosure about the matter or when, We describe these matters in our auditors’ report unless law or regulation precludes public disclosure about the matter or when,
in extremely rare circumstances, we determine that a matter should not be communicated in our report because the adverse in extremely rare circumstances, we determine that a matter should not be communicated in our report because the adverse
consequences of doing so would reasonably be expected to outweigh the public interest benefits of such communication.consequences of doing so would reasonably be expected to outweigh the public interest benefits of such communication.
Report on other legal and regulatory requirements
Based on the information that has been made available to us, nothing has come to our attention that causes us to believe that the Based on the information that has been made available to us, nothing has come to our attention that causes us to believe that the
Bank is not in compliance, in all material respects, with the applicable requirements of the Regulation for Companies, the Banking Bank is not in compliance, in all material respects, with the applicable requirements of the Regulation for Companies, the Banking
Control Law in the Kingdom of Saudi Arabia and the Bank’s By-Laws in so far as they affect the preparation and presentation of the Control Law in the Kingdom of Saudi Arabia and the Bank’s By-Laws in so far as they affect the preparation and presentation of the
consolidated financial statements.consolidated financial statements.
PricewaterhouseCoopersPricewaterhouseCoopers
P O Box 8282P O Box 8282
Riyadh 11482Riyadh 11482
Kingdom of Saudi ArabiaKingdom of Saudi Arabia
Omar M. Al SaggaOmar M. Al Sagga
Certified Public AccountantCertified Public Accountant
Registration No. 369Registration No. 369
KPMG Al Fozan & PartnersKPMG Al Fozan & Partners
Certified Public AccountantsCertified Public Accountants
P O Box 92876P O Box 92876
Riyadh 11663Riyadh 11663
Kingdom of Saudi ArabiaKingdom of Saudi Arabia
Abdullah Hamad Al FozanAbdullah Hamad Al Fozan
Certified Public AccountantCertified Public Accountant
License No. 348License No. 348
5 Jumada II 1440H5 Jumada II 1440H
(10 February 2019)(10 February 2019)
KPMG Al Fozan & PartnersCertified Public Accountants
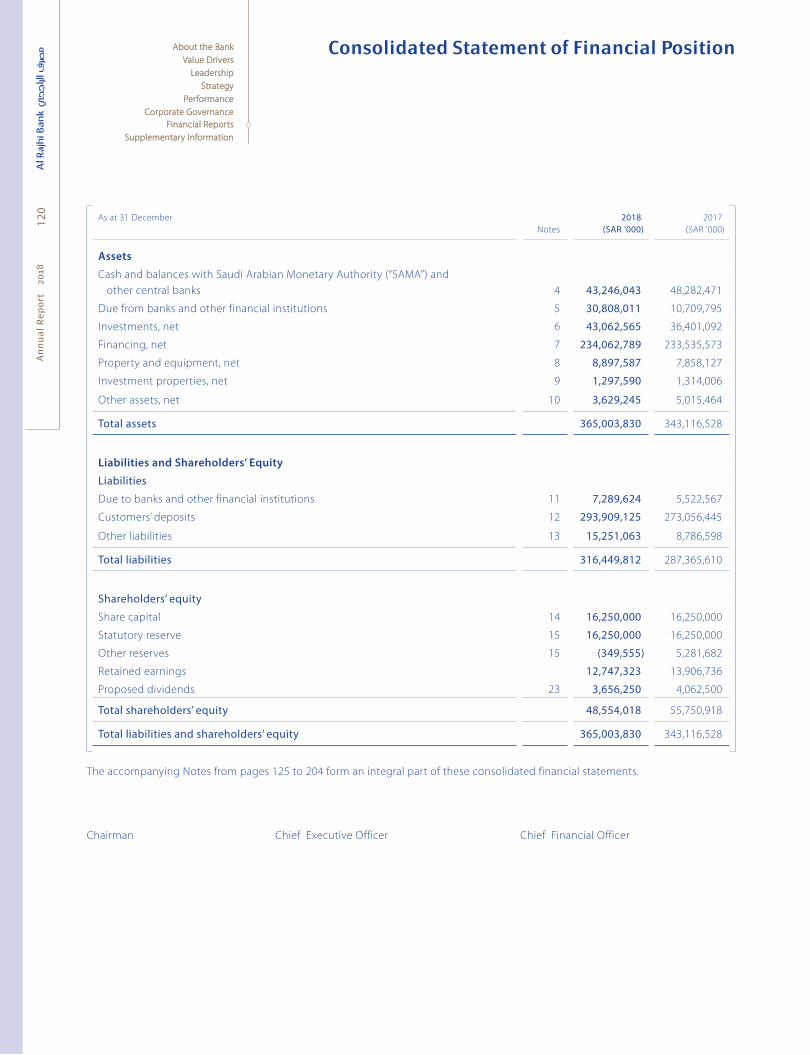
An
nu
al
Re
po
rt
20
1812
0About the BankAbout the Bank
Value DriversValue Drivers
LeadershipLeadership
StrategyStrategy
PerformancePerformance
Corporate GovernanceCorporate Governance
Financial ReportsFinancial Reports
Supplementary InformationSupplementary Information
As at 31 December
Notes
2018(SAR ’000)
2017
(SAR ’000)
Assets
Cash and balances with Saudi Arabian Monetary Authority (“SAMA”) and
other central banks 4 43,246,043 48,282,471
Due from banks and other financial institutions 5 30,808,011 10,709,795
Investments, net 6 43,062,565 36,401,092
Financing, net 7 234,062,789 233,535,573
Property and equipment, net 8 8,897,587 7,858,127
Investment properties, net 9 1,297,590 1,314,006
Other assets, net 10 3,629,245 5,015,464
Total assets 365,003,830 343,116,528
Liabilities and Shareholders’ Equity
Liabilities
Due to banks and other financial institutions 11 7,289,624 5,522,567
Customers’ deposits 12 293,909,125 273,056,445
Other liabilities 13 15,251,063 8,786,598
Total liabilities 316,449,812 287,365,610
Shareholders’ equity
Share capital 14 16,250,000 16,250,000
Statutory reserve 15 16,250,000 16,250,000
Other reserves 15 (349,555) 5,281,682
Retained earnings 12,747,323 13,906,736
Proposed dividends 23 3,656,250 4,062,500
Total shareholders’ equity 48,554,018 55,750,918
Total liabilities and shareholders’ equity 365,003,830 343,116,528
The accompanying Notes from pages 125 to 204 form an integral part of these consolidated financial statements.
Chairman Chief Executive Officer Chief Financial Officer
Consolidated Statement of Financial Position
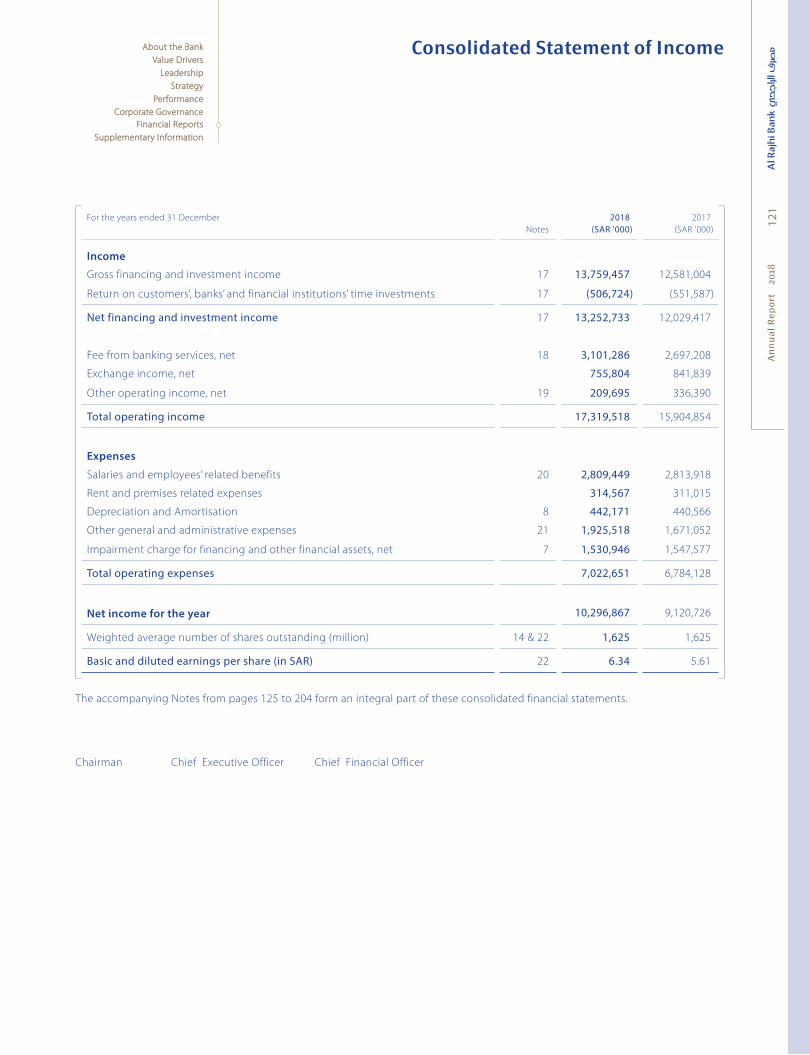
An
nu
al
Re
po
rt
20
1812
1
About the BankAbout the Bank
Value DriversValue Drivers
LeadershipLeadership
StrategyStrategy
PerformancePerformance
Corporate GovernanceCorporate Governance
Financial ReportsFinancial Reports
Supplementary InformationSupplementary Information
For the years ended 31 December
Notes
2018(SAR ’000)
2017
(SAR ’000)
Income
Gross financing and investment income 17 13,759,457 12,581,004
Return on customers’, banks’ and financial institutions’ time investments 17 (506,724) (551,587)
Net financing and investment income 17 13,252,733 12,029,417
Fee from banking services, net 18 3,101,286 2,697,208
Exchange income, net 755,804 841,839
Other operating income, net 19 209,695 336,390
Total operating income 17,319,518 15,904,854
Expenses
Salaries and employees’ related benefits 20 2,809,449 2,813,918
Rent and premises related expenses 314,567 311,015
Depreciation and Amortisation 8 442,171 440,566
Other general and administrative expenses 21 1,925,518 1,671,052
Impairment charge for financing and other financial assets, net 7 1,530,946 1,547,577
Total operating expenses 7,022,651 6,784,128
Net income for the year 10,296,867 9,120,726
Weighted average number of shares outstanding (million) 14 & 22 1,625 1,625
Basic and diluted earnings per share (in SAR) 22 6.34 5.61
The accompanying Notes from pages 125 to 204 form an integral part of these consolidated financial statements.
Chairman Chief Executive Officer Chief Financial Officer
Consolidated Statement of Income
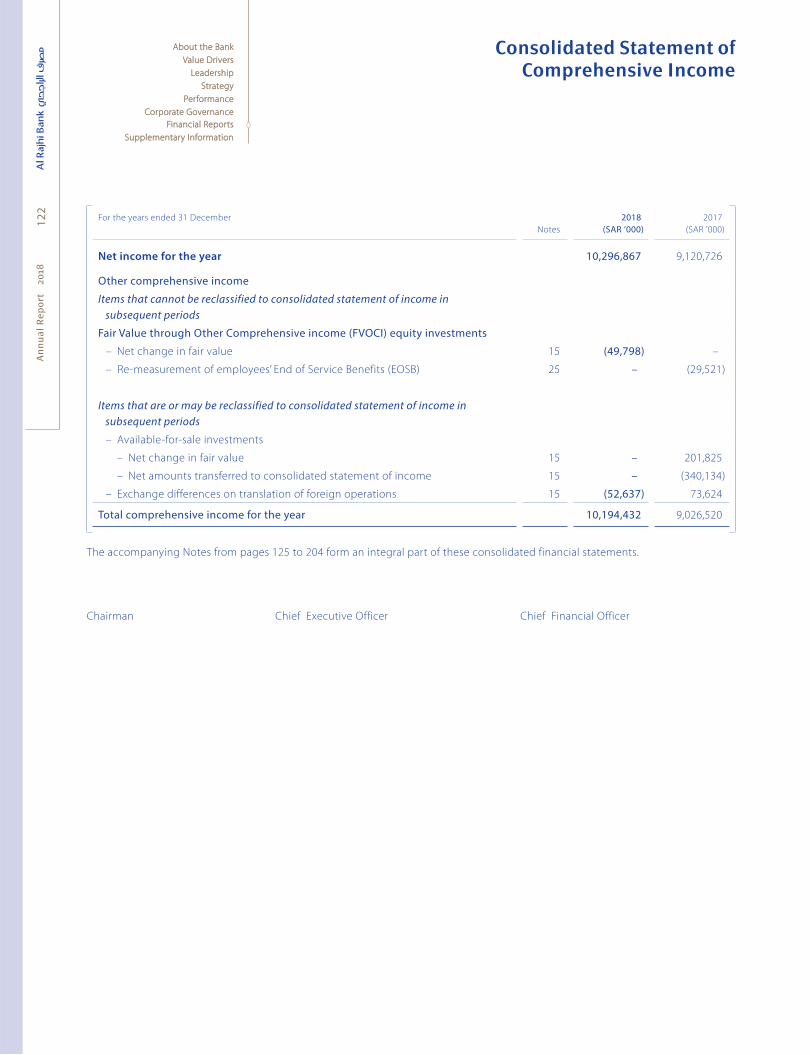
An
nu
al
Re
po
rt
20
1812
2About the BankAbout the Bank
Value DriversValue Drivers
LeadershipLeadership
StrategyStrategy
PerformancePerformance
Corporate GovernanceCorporate Governance
Financial ReportsFinancial Reports
Supplementary InformationSupplementary Information
Consolidated Statement of Comprehensive Income
For the years ended 31 December
Notes
2018(SAR ’000)
2017
(SAR ’000)
Net income for the year 10,296,867 9,120,726
Other comprehensive income
Items that cannot be reclassified to consolidated statement of income in subsequent periods
Fair Value through Other Comprehensive income (FVOCI) equity investments
– Net change in fair value 15 (49,798) –
– Re-measurement of employees’ End of Service Benefits (EOSB) 25 – (29,521)
Items that are or may be reclassified to consolidated statement of income in subsequent periods
– Available-for-sale investments
– Net change in fair value 15 – 201,825
– Net amounts transferred to consolidated statement of income 15 – (340,134)
– Exchange differences on translation of foreign operations 15 (52,637) 73,624
Total comprehensive income for the year 10,194,432 9,026,520
The accompanying Notes from pages 125 to 204 form an integral part of these consolidated financial statements.
Chairman Chief Executive Officer Chief Financial Officer

An
nu
al
Re
po
rt
20
1812
3
About the BankAbout the Bank
Value DriversValue Drivers
LeadershipLeadership
StrategyStrategy
PerformancePerformance
Corporate GovernanceCorporate Governance
Financial ReportsFinancial Reports
Supplementary InformationSupplementary Information
For the years ended 31 December
Notes
Sharecapital
(SAR ’000)
Statutoryreserve
(SAR ’000)
Other reserves
(SAR ’000)
Retained earnings
(SAR ’000)
Proposed dividends(SAR ’000)
Total
(SAR ’000)
2018
Balance at 31 December 2017 16,250,000 16,250,000 5,281,682 13,906,736 4,062,500 55,750,918Impact of adopting IFRS 9 3 – – (129,789) (2,752,899) – (2,882,688)Other adjustment 38 – – – (799,356) – (799,356)Restated balance at 1 January 2018 23 16,250,000 16,250,000 5,151,893 10,354,481 4,062,500 52,068,874Dividend for the second half 2017 23 – – – – (4,062,500) (4,062,500)Interim dividends for the first half of 2018 15 – – – (3,250,000) – (3,250,000)Net change in fair value of
FVOCI investments 15 – – (49,798) – – (49,798)Net movement in foreign
currency translation reserve 15 – – (52,637) – – (52,637)Net other comprehensive income
recognised directly in equity – – (102,435) – – (102,435)Net income for the period – – – 10,296,867 – 10,296,867Total comprehensive income for
the period (102,435) 10,296,867 – 10,194,432Zakat for previous year(s) 15 – – (5,379,724) (25,547) – (5,405,271)
Zakat for current year and other transfers 15 – – (19,289) (972,228) – (991,517)
Proposed final dividends for 2018 – – – (3,656,250) 3,656,250 –
Balance at 31 December 2018 16,250,000 16,250,000 (349,555) 12,747,323 3,656,250 48,554,018
2017
Balance at 1 January 2017 16,250,000 16,250,000 4,773,362 12,236,010 2,437,500 51,946,872
Transfer to other reserves for zakat – – 758,000 (758,000) – –
Dividends for the second half of 2016 – – – – (2,437,500) (2,437,500)
Interim dividends for the first half of 2017 23 – – – (2,437,500) – (2,437,500)
Net change in fair value of
available-for-sale investments 15 – – 201,825 – – 201,825
Net amounts transferred to consolidated
statement of income 15 – – (340,134) – – (340,134)
Net movement in foreign currency
translation reserve 15 – – 73,624 – – 73,624
Net income recognised directly in
shareholder’s equity – – (64,685) – – (64,685)
Net income for the year – – – 9,120,726 – 9,120,726
Re-measurement of employee EOSB – – (29,521) – – (29,521)
Total comprehensive income for the year – – (94,206) 9,120,726 – 9,026,520
Zakat paid – – (155,474) – – (155,474)
Zakat Payable transferred to other liability – – – (192,000) – (192,000)
Proposed final dividends for 2017 23 – – – (4,062,500) 4,062,500 –
Balance at 31 December 2017 16,250,000 16,250,000 5,281,682 13,906,736 4,062,500 55,750,918Balance at 31 December 2017 16,250,000 16,250,000 5,281,682 13,906,736 4,062,500 55,750,918
The accompanying Notes from pages 125 to 204 form an integral part of these consolidated financial statements.
Chairman Chief Executive Officer Chief Financial Officer
Consolidated Statement ofChanges in Shareholders’ Equity
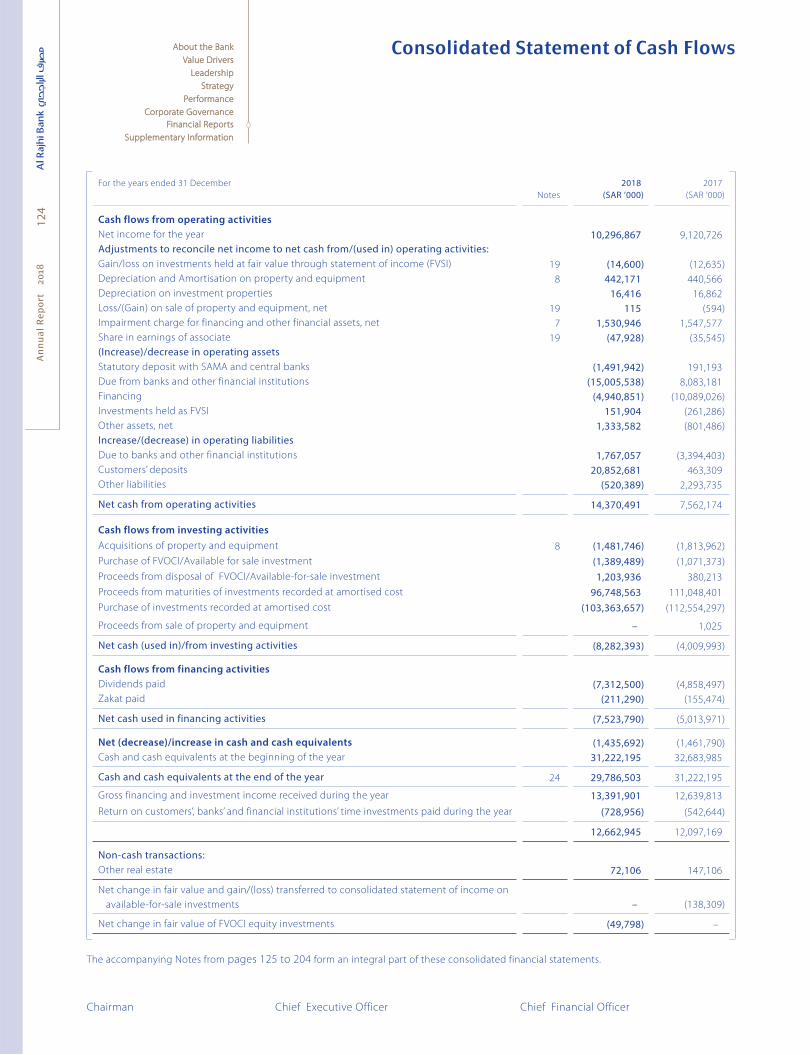
An
nu
al
Re
po
rt
20
1812
4About the BankAbout the Bank
Value DriversValue Drivers
LeadershipLeadership
StrategyStrategy
PerformancePerformance
Corporate GovernanceCorporate Governance
Financial ReportsFinancial Reports
Supplementary InformationSupplementary Information
For the years ended 31 December
Notes
2018(SAR ’000)
2017
(SAR ’000)
Cash flows from operating activities
Net income for the year 10,296,867 9,120,726
Adjustments to reconcile net income to net cash from/(used in) operating activities:Gain/loss on investments held at fair value through statement of income (FVSI) 19 (14,600) (12,635)
Depreciation and Amortisation on property and equipment 8 442,171 440,566
Depreciation on investment properties 16,416 16,862
Loss/(Gain) on sale of property and equipment, net 19 115 (594)
Impairment charge for financing and other financial assets, net 7 1,530,946 1,547,577
Share in earnings of associate 19 (47,928) (35,545)
(Increase)/decrease in operating assetsStatutory deposit with SAMA and central banks (1,491,942) 191,193
Due from banks and other financial institutions (15,005,538) 8,083,181
Financing (4,940,851) (10,089,026)
Investments held as FVSI 151,904 (261,286)
Other assets, net 1,333,582 (801,486)
Increase/(decrease) in operating liabilitiesDue to banks and other financial institutions 1,767,057 (3,394,403)
Customers’ deposits 20,852,681 463,309
Other liabilities (520,389) 2,293,735
Net cash from operating activities 14,370,491 7,562,174
Cash flows from investing activities
Acquisitions of property and equipment 8 (1,481,746) (1,813,962)
Purchase of FVOCI/Available for sale investment (1,389,489) (1,071,373)
Proceeds from disposal of FVOCI/Available-for-sale investment 1,203,936 380,213
Proceeds from maturities of investments recorded at amortised cost 96,748,563 111,048,401
Purchase of investments recorded at amortised cost (103,363,657) (112,554,297)
Proceeds from sale of property and equipment – 1,025
Net cash (used in)/from investing activities (8,282,393) (4,009,993)
Cash flows from financing activities
Dividends paid (7,312,500) (4,858,497)
Zakat paid (211,290) (155,474)
Net cash used in financing activities (7,523,790) (5,013,971)
Net (decrease)/increase in cash and cash equivalents (1,435,692) (1,461,790)
Cash and cash equivalents at the beginning of the year 31,222,195 32,683,985
Cash and cash equivalents at the end of the year 24 29,786,503 31,222,195
Gross financing and investment income received during the year 13,391,901 12,639,813
Return on customers’, banks’ and financial institutions’ time investments paid during the year (728,956) (542,644)
12,662,945 12,097,169
Non-cash transactions:Other real estate 72,106 147,106
Net change in fair value and gain/(loss) transferred to consolidated statement of income on
available-for-sale investments – (138,309)
Net change in fair value of FVOCI equity investments (49,798) –
The accompanying Notes from pages 125 to 204 form an integral part of these consolidated financial statements.
Chairman Chief Executive Officer Chief Financial Officer
Consolidated Statement of Cash Flows
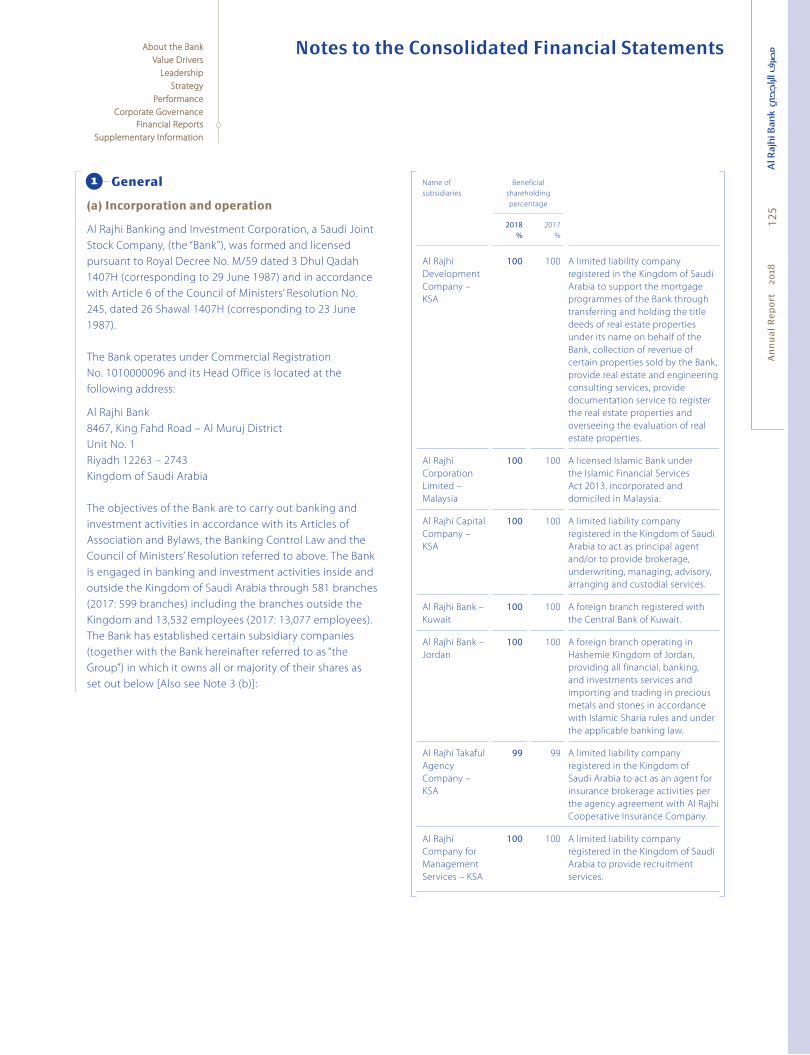
An
nu
al
Re
po
rt
20
1812
5
About the BankAbout the Bank
Value DriversValue Drivers
LeadershipLeadership
StrategyStrategy
PerformancePerformance
Corporate GovernanceCorporate Governance
Financial ReportsFinancial Reports
Supplementary InformationSupplementary Information
General
(a) Incorporation and operation(a) Incorporation and operation
Al Rajhi Banking and Investment Corporation, a Saudi Joint
Stock Company, (the “Bank”), was formed and licensed
pursuant to Royal Decree No. M/59 dated 3 Dhul Qadah
1407H (corresponding to 29 June 1987) and in accordance
with Article 6 of the Council of Ministers’ Resolution No.
245, dated 26 Shawal 1407H (corresponding to 23 June
1987).
The Bank operates under Commercial Registration
No. 1010000096 and its Head Office is located at the
following address:
Al Rajhi Bank
8467, King Fahd Road – Al Muruj District
Unit No. 1
Riyadh 12263 – 2743
Kingdom of Saudi Arabia
The objectives of the Bank are to carry out banking and
investment activities in accordance with its Articles of
Association and Bylaws, the Banking Control Law and the
Council of Ministers’ Resolution referred to above. The Bank
is engaged in banking and investment activities inside and
outside the Kingdom of Saudi Arabia through 581 branches
(2017: 599 branches) including the branches outside the
Kingdom and 13,532 employees (2017: 13,077 employees).
The Bank has established certain subsidiary companies
(together with the Bank hereinafter referred to as “the
Group”) in which it owns all or majority of their shares as
set out below [Also see Note 3 (b)]:
1 Name of
subsidiaries
Beneficial
shareholding
percentage
2018%
2017
%
Al Rajhi
Development
Company –
KSA
100 100 A limited liability company
registered in the Kingdom of Saudi
Arabia to support the mortgage
programmes of the Bank through
transferring and holding the title
deeds of real estate properties
under its name on behalf of the
Bank, collection of revenue of
certain properties sold by the Bank,
provide real estate and engineering
consulting services, provide
documentation service to register
the real estate properties and
overseeing the evaluation of real
estate properties.
Al Rajhi
Corporation
Limited –
Malaysia
100 100 A licensed Islamic Bank under
the Islamic Financial Services
Act 2013, incorporated and
domiciled in Malaysia.
Al Rajhi Capital
Company –
KSA
100 100 A limited liability company
registered in the Kingdom of Saudi
Arabia to act as principal agent
and/or to provide brokerage,
underwriting, managing, advisory,
arranging and custodial services.
Al Rajhi Bank –
Kuwait
100 100 A foreign branch registered with
the Central Bank of Kuwait.
Al Rajhi Bank –
Jordan
100 100 A foreign branch operating in
Hashemie Kingdom of Jordan,
providing all financial, banking,
and investments services and
importing and trading in precious
metals and stones in accordance
with Islamic Sharia rules and under
the applicable banking law.
Al Rajhi Takaful
Agency
Company –
KSA
99 99 A limited liability company
registered in the Kingdom of
Saudi Arabia to act as an agent for
insurance brokerage activities per
the agency agreement with Al Rajhi
Cooperative Insurance Company.
Al Rajhi
Company for
Management
Services – KSA
100 100 A limited liability company
registered in the Kingdom of Saudi
Arabia to provide recruitment
services.
Notes to the Consolidated Financial Statements

Notes to the Consolidated Financial StatementsA
nn
ua
l R
ep
ort
2
018
126
About the BankAbout the Bank
Value DriversValue Drivers
LeadershipLeadership
StrategyStrategy
PerformancePerformance
Corporate GovernanceCorporate Governance
Financial ReportsFinancial Reports
Supplementary InformationSupplementary Information
The subsidiaries are wholly or substantially owned by the
Bank and therefore, the non-controlling interest which
is insignificant is not disclosed. All the above-mentioned
subsidiaries have been consolidated. As of 31 December
2018 and 2017, interests in subsidiaries not directly owned
by the Bank are owned by representative shareholders for
the beneficial interest of the Bank.
(b) Sharia Authority(b) Sharia Authority
As a commitment from the Bank for its activities to be
in compliance with Islamic Sharia legislations, since its
inception, the Bank has established a Sharia Authority to
ascertain that the Bank’s activities are subject to its approval
and control. The Sharia Authority had reviewed several of the
Bank’s activities and issued the required decisions thereon.
Basis of Preparation
(a) Statement of compliance(a) Statement of compliance
The (consolidated) financial statements of the Bank (Group)
have been prepared;
– in accordance with “International Financial Reporting
Standards (IFRS) as modified by Saudi Arabian Monetary
Authority (SAMA) for the accounting of zakat and income
tax”, (relating to the application of International Accounting
Standard (IAS) 12 – “Income Taxes” and IFRIC 21 – “Levies”
in so far as these relate to accounting for Saudi Arabian
zakat and income tax); and.
– in compliance with the provisions of Banking Control Law,
the Regulations for Companies in the Kingdom of Saudi
Arabia and By-laws of the Bank.
(b) Basis of measurement and preparation(b) Basis of measurement and preparation
The consolidated financial statements are prepared under the
historical cost convention except for the measurement at fair
value of investments held as fair value through statement of
income (“FVSI”) and fair value through other comprehensive
income (“FVOCI”) investments.
The Bank presents its statement of financial position in order
of liquidity. An analysis regarding recovery or settlement
within 12 months after the reporting date (current) and more
than 12 months after the reporting date (non-current) is
presented in Note 27.2.
2
(c) Functional and presentation currency(c) Functional and presentation currency
The consolidated financial statements are presented in
Saudi Arabian Riyals (“SAR”), which is the Bank’s functional
currency and are rounded off to the nearest thousand except
otherwise indicated.
(d) Critical accounting judgements, (d) Critical accounting judgements, estimates and assumptionsestimates and assumptions
The preparation of consolidated financial statements in
conformity with IFRS requires the use of certain critical
accounting estimates and assumptions that affect the
reported amounts of assets and liabilities. It also requires
management to exercise its judgements in the process of
applying the Bank’s accounting policies. Such estimates,
assumptions and judgements are continually evaluated
and are based on historical experience and other factors,
including obtaining professional advice and expectations
of future events that are believed to be reasonable under
the circumstances. Revisions to accounting estimates are
recognised in the period in which the estimate is revised,
if the revision affects only that period, or in the period of
revision and in future periods if the revision affects both
current and future periods.
The key assumptions concerning the future and other key
sources of estimation uncertainty at the reporting date,
that have a significant risk of causing a material adjustment
to the carrying amounts of assets and liabilities within the
next financial year, are described below. The Bank, based its
assumptions and estimates on parameters available when
the consolidated financial statements were prepared. Existing
circumstances and assumptions about future developments,
however, may change due to market changes or
circumstances beyond the control of the Bank. Such changes
are reflected in the assumptions when they occur. Significant
areas where management has used estimates, assumptions
or exercised judgements is as follows:
(i) Impairment losses on financial assets(i) Impairment losses on financial assets
The measurement of impairment losses both under IFRS 9
and IAS 39 across all categories of financial assets requires
judgement, in particular, the estimation of the amount
and timing of future cash flows and collateral values when
determining impairment losses and the assessment of a
significant increase in credit risk. These estimates are driven
by a number of factors, changes in which can result in
different levels of allowances.

Notes to the Consolidated Financial Statements
An
nu
al
Re
po
rt
20
1812
7
About the BankAbout the Bank
Value DriversValue Drivers
LeadershipLeadership
StrategyStrategy
PerformancePerformance
Corporate GovernanceCorporate Governance
Financial ReportsFinancial Reports
Supplementary InformationSupplementary Information
The Bank’s ECL calculations are outputs of complex models
with a number of underlying assumptions regarding the
choice of variable inputs and their interdependencies.
Elements of the ECL models that are considered accounting
judgements and estimates include:
The Bank’s internal credit grading model, which assigns
PDs to the individual grades
The Bank’s criteria for assessing if there has been a
significant increase in credit risk and so allowances for
financial assets should be measured on a Lifetime ECL basis
and the qualitative assessment
The segmentation of financial assets when their ECL is
assessed on a collective basis
Development of ECL models, including the various
formulas and the choice of inputs
Determination of associations between macroeconomic
scenarios and, economic inputs and collateral values, and
the effect on PDs, EADs and LGDs
Selection of forward-looking macroeconomic scenarios
and their probability weightings, to derive the economic
inputs into the ECL models
(ii) Fair value of financial instruments(ii) Fair value of financial instruments
The Group measures financial instruments at fair value at
each balance sheet date.
Fair value is the price that would be received to sell an
asset or paid to transfer a liability in an orderly transaction
between market participants at the measurement date. The
fair value measurement is based on the presumption that the
transaction to sell the asset or transfer the liability takes place
either:
In the principal market for the asset or liability, or
In the absence of a principal market, in the most
advantageous market for the asset or liability
The principal or the most advantageous market must be
accessible to the Group.
The fair value of an asset or a liability is measured using
the assumptions that market participants would use
when pricing the asset or liability, assuming that market
participants act in their economic best interest.
A fair value measurement of a non-financial asset takes into
account a market participant’s ability to generate economic
benefits by using the asset in its highest and best use or by
selling it to another market participant that would use the
asset in its highest and best use.
The Bank uses valuation techniques that are appropriate
in the circumstances and for which sufficient data are
available to measure fair value, maximising the use of
relevant observable inputs and minimising the use of
unobservable inputs.
All assets and liabilities for which fair value is measured
or disclosed in the financial statements are categorised
within the fair value hierarchy, described as follows, based
on the lowest level input that is significant to the fair value
measurement as a whole:
- Level 1 – Quoted (unadjusted) market prices in active
markets for identical assets or liabilities.
- Level 2 – Inputs other than quoted prices included within
Level 1 that are observable either directly (i.e. as prices) or
indirectly (i.e. derived from prices). This category includes
instruments valued using: quoted market prices in active
markets for similar instruments; quoted prices for identical
or similar instruments in markets that are considered less
than active; or other valuation techniques in which all
significant inputs are directly or indirectly observable from
market data.
- Level 3 – Valuation techniques for which the lowest level
input that is significant to the fair value measurement is
unobservable.
(iii) Determination of control over investees(iii) Determination of control over investees
The control indicators are subject to management’s
judgements that can have a significant effect in the case
of the Bank’s interests in investments funds.
Investment fundsInvestment funds
The Group acts as Fund Manager to a number of investment
funds. Determining whether the Group controls such an
investment fund usually focuses on the assessment of the
aggregate economic interests of the Group in the Fund
(comprising any carried profits and expected management
fees) and the investor’s rights to remove the Fund Manager.
As a result the Group has concluded that it acts as an
agent for the investors in all cases, and therefore has not
consolidated these funds.

Notes to the Consolidated Financial StatementsA
nn
ua
l R
ep
ort
2
018
128
About the BankAbout the Bank
Value DriversValue Drivers
LeadershipLeadership
StrategyStrategy
PerformancePerformance
Corporate GovernanceCorporate Governance
Financial ReportsFinancial Reports
Supplementary InformationSupplementary Information
(iv) Provisions for liabilities and charges(iv) Provisions for liabilities and charges
The Bank receives legal claims against it in the normal course
of business. Management has made judgments as to the
likelihood of any claim succeeding in making provisions.
The time of concluding legal claims is uncertain, as is the
amounts of possible outflow of economic benefits. Timing
and cost ultimately depends on the due process being
followed as per the Law.
(v) Going concern(v) Going concern
The consolidated financial statements have been prepared
on a going concern basis. The Bank’s management has
made an assessment of the Bank’s ability to continue as
a going concern and is satisfied that the Bank has the
resources to continue in business for the foreseeable
future. Furthermore, the management is not aware of any
material uncertainties that may cast significant doubt upon
the Bank’s ability to continue as a going concern.
Summary of Signifi cant Accounting Policies
The significant accounting policies adopted in the
preparation of these consolidated financial statements are set
out below:
(a) Change in accounting policies(a) Change in accounting policies
The accounting policies used in the preparation of these
consolidated financial statements are consistent with those
used in the preparation of the annual consolidated financial
statements for the year ended 31 December, 2017 except
for the adoption of the following new standards and other
amendments to existing standards and a new interpretation
mentioned below. Except for adoption of IFRS 9, these
amendments and adoption has had no material impact on
the consolidated financial statements of the Group on the
current period or prior periods. The impact and disclosures
pertaining to adoption of IFRS 9 has been disclosed in the
later part of these financial statements.
Adoption of New StandardsAdoption of New Standards
Effective 1 January 2018, the Group has adopted the
following accounting standards and the impact of the
adoption of these standards is explained below.
3
Except for the adoption of the following new accounting
standards, several other amendments and interpretations
apply for the first time in 2018, but do not have impact on
the consolidated financial statements of the Bank.
Adoption of IFRS 15 – Revenue from Adoption of IFRS 15 – Revenue from contracts with customerscontracts with customers
The Bank adopted IFRS 15 – “Revenue from Contracts with
Customers” resulting in a change in the revenue recognition
policy of the Bank in relation to its contracts with customers.
IFRS 15 was issued in May 2014 and is effective for annual
periods commencing on or after 1 January 2018. IFRS 15
outlines a single comprehensive model of accounting
for revenue arising from contracts with customers and
supersedes current revenue guidance, which is found
currently across several Standards and Interpretations within
IFRSs. It established a new five-step model that will apply
to revenue arising from contracts with customers. Under
IFRS 15, revenue is recognised at an amount that reflects the
consideration to which an entity expects to be entitled in
exchange for transferring goods or services to a customer.
IFRS 15 also includes a comprehensive set of disclosure
requirements that will result in an entity providing users of
financial statements with comprehensive information about
the nature, amount, timing and uncertainty of revenue and
cash flows arising from the entity’s contracts with customers.
The Bank has assessed that the impact of IFRS 15 is not
material on the consolidated financial statements of the
Group as at the initial adoption and the reporting date.
Adoption of IFRS 9 – Financial instrumentsAdoption of IFRS 9 – Financial instruments
The Bank has adopted IFRS 9 – Financial Instruments issued
in July 2014 with a date of initial application of 1 January
2018. The requirements of IFRS 9 represent a significant
change from IAS 39 Financial Instruments: Recognition
and Measurement. The new standard brings fundamental
changes to the accounting for financial assets and to certain
aspects of the accounting for financial liabilities.

Notes to the Consolidated Financial Statements
An
nu
al
Re
po
rt
20
1812
9
About the BankAbout the Bank
Value DriversValue Drivers
LeadershipLeadership
StrategyStrategy
PerformancePerformance
Corporate GovernanceCorporate Governance
Financial ReportsFinancial Reports
Supplementary InformationSupplementary Information
The key changes to the Bank’s accounting policies resulting
from its adoption of IFRS 9 are summarised below.
Classification of financial assets and financial liabilitiesClassification of financial assets and financial liabilities
IFRS 9 contains three principal classification categories
for financial assets: measured at amortised cost (“AC”), fair
value through other comprehensive income (“FVOCI”) and
fair value through profit or loss (“FVSI”). This classification is
generally based on the business model in which a financial
asset is managed and its contractual cash flows. The standard
eliminates the existing IAS 39 categories of held-to-maturity,
loans and receivables and available for sale.
IFRS 9 largely retains the existing requirements in IAS 39 for
the classification of financial liabilities. However, although
under IAS 39 all fair value changes of liabilities designated
under the fair value option were recognised in profit or loss,
under IFRS 9 fair value changes are generally presented as
follows:
The amount of change in the fair value that is attributable
to changes in the credit risk of the liability is presented in
OCI; and
The remaining amount of change in the fair value is
presented in profit or loss.
Impairment of financial assetsImpairment of financial assets
IFRS 9 replaces the “incurred loss” model in IAS 39 with
an “expected credit loss” model (“ECL”). The new impairment
model also applies to certain loan commitments and
financial guarantee contracts but not to equity investments.
The allowance is based on the ECLs associated with the
probability of default in the next twelve months unless there
has been a significant increase in credit risk since origination.
If the financial asset meets the definition of purchased or
originated credit impaired (POCI), the allowance is based
on the change in the ECLs over the life of the asset. POCI
assets are financial assets that are credit impaired on initial
recognition. POCI assets are recorded at fair value at original
recognition and interest income is subsequently recognised
based on a credit-adjusted EIR. ECLs are only recognised or
released to the extent that there is a subsequent change in
the expected credit losses.
Under IFRS 9, credit losses are recognised earlier than
under IAS 39.
IFRS 7 – Financial Instruments: Disclosures IFRS 7 – Financial Instruments: Disclosures
To reflect the differences between IFRS 9 and IAS 39,
IFRS 7 Financial Instruments: Disclosures were updated
and the Bank has adopted it, together with IFRS 9, for year
beginning 1 January 2018. Changes include transition
disclosures as shown in Note 3, detailed qualitative and
quantitative information about the ECL calculations such
as the assumptions and inputs used are set out in Note 27.
Reconciliations from opening to closing ECL allowances
are presented in Notes 7.
TransitionTransition
Changes in accounting policies resulting from the adoption
of IFRS 9 have been applied retrospectively, except as
described below:
Comparative periods have not been restated. A difference
in the carrying amounts of financial assets and financial
liabilities resulting from the adoption of IFRS 9 are
recognised in retained earnings and reserves as at
1 January 2018. Accordingly, the information presented
for 2017 does not reflect the requirements of IFRS 9 and
therefore is not comparable to the information presented
for 2018 under IFRS 9.
The following assessments have been made on the basis
of the facts and circumstances that existed at the date of
initial application.
i. The determination of the business model within
which a financial asset is held.
ii. The designation and revocation of previous designated
financial assets and financial liabilities as measured at
FVSI.
iii. The designation of certain investments in equity
instruments not held for trading as FVOCI.
It is assumed that the credit risk has not increased
significantly for those debt securities which carry low
credit risk at the date of initial application of IFRS 9.

Notes to the Consolidated Financial StatementsA
nn
ua
l R
ep
ort
2
018
130
About the BankAbout the Bank
Value DriversValue Drivers
LeadershipLeadership
StrategyStrategy
PerformancePerformance
Corporate GovernanceCorporate Governance
Financial ReportsFinancial Reports
Supplementary InformationSupplementary Information
A. Financial assets and financial liabilitiesA. Financial assets and financial liabilities
(i) Classification of financial assets and financial liabilities on the date of initial application of IFRS 9(i) Classification of financial assets and financial liabilities on the date of initial application of IFRS 9
The following table shows the original measurement categories in accordance with IAS 39 and the new measurement categories
under IFRS 9 for the Bank’s financial assets and financial liabilities as at 1 January 2018.
Original
classification
under IAS 39
New
classification
under IFRS 9
Original carrying
value under
IAS 39
(SAR ‘000)
New carrying
value under
IFRS 9
(SAR ‘000)
Financial assets
Cash and balances with Saudi Arabian Monetary
Authority (“SAMA”) and other central banks Loans and receivables Amortised cost 48,282,471 48,282,471
Due from banks and other financial institutions Loans and receivables Amortised cost 10,709,795 10,705,849
Investments held at amortised cost
Murabaha with Saudi Government and SAMA Held to maturity Amortised cost 23,452,869 23,437,245
Sukuk Held to maturity Amortised cost 9,805,139 9,775,876
Held to maturity FVTPL 800,000 800,000
Investments held as FVSI
Equity investments FVSI FVOCI 23,487 23,487
Mutual funds FVSI FVTPL 389,193 389,193
Available-for-sale investments
Equity investments Available for sale FVOCI 771,293 771,293
Mutual funds Available for sale FVTPL 1,034,286 1,034,286
Financing, net Loans and receivables Amortised cost 233,535,573 230,701,718
328,804,106 325,921,418
Financial liabilities
Due to banks and other financial institutions Amortised cost Amortised cost 5,522,567 5,522,567
Customers’ deposits Amortised cost Amortised cost 273,056,445 273,056,445
Other liabilities Amortised cost Amortised cost 8,786,598 8,786,598
287,365,610 287,365,6108,786,598 273,056,445

Notes to the Consolidated Financial Statements
An
nu
al
Re
po
rt
20
1813
1
About the BankAbout the Bank
Value DriversValue Drivers
LeadershipLeadership
StrategyStrategy
PerformancePerformance
Corporate GovernanceCorporate Governance
Financial ReportsFinancial Reports
Supplementary InformationSupplementary Information
(ii) Reconciliation of carrying amounts under IAS 39 to carrying amounts under IFRS 9 at the adoption of IFRS 9(ii) Reconciliation of carrying amounts under IAS 39 to carrying amounts under IFRS 9 at the adoption of IFRS 9
The following table reconciles the carrying amounts under IAS 39 to the carrying amounts under IFRS 9 on transition to IFRS 9
on 1 January 2018.
IAS 39 carrying
amount as at
31 December 2017
(SAR ‘000)
Reclassification
(SAR ‘000)
Re-measurement
(SAR ‘000)
IFRS 9 carrying amount as at
1 January 2018(SAR ‘000)
Financial assets
Amortised cost
Cash and balances with Saudi Arabian Monetary Authority
(“SAMA”) and other central banks:
Opening balance 48,282,471 – – –
Closing balance 48,282,471 – – 48,282,471
Due from banks and other financial institutions
Opening balance 10,709,795 – – –
Remeasurement (ECL allowance) (Note 1) – – (3,946) –
Closing balance 10,709,795 – (3,946) 10,705,849
Financing – Net:
Opening balance 233,535,573 – – –
Remeasurement (ECL allowance) (Note 1) – – (2,833,855) –
Closing balance 233,535,573 – (2,833,855) 230,701,718
Investment:
Opening balance 34,058,008 – – –
To FVTPL – (800,000) – –
Remeasurement (ECL allowance) (Note 1) – – (44,887) –
Closing balance 34,058,008 (800,000) (44,887) 33,213,121
Total financial assets 326,585,847 (800,000) (2,882,688) 322,903,159
Note 1: Impairment allowance is increased due to change from incurred to expected credit loss (ECL).

Notes to the Consolidated Financial StatementsA
nn
ua
l R
ep
ort
2
018
132
About the BankAbout the Bank
Value DriversValue Drivers
LeadershipLeadership
StrategyStrategy
PerformancePerformance
Corporate GovernanceCorporate Governance
Financial ReportsFinancial Reports
Supplementary InformationSupplementary Information
IAS 39 carrying
amount as at
31 December 2017
(SAR ’000)
Reclassification
(SAR ’000)
Remeasurement
(SAR ’000)
IFRS 9 carrying amount as at
1 January 2018(SAR ’000)
Financial assets
Available for sale
Investment:
Opening balance 1,805,579 – – –
Transferred to:
FVOCI – equity (Note 1) – (771,293) – –
FVSI (Note 2) – (1,034,286) – –
Total available for sale 1,805,579 (1,805,579) – –
FVSI
Investment:
Opening balance 412,680 – – –
From available for sale (Note 2) – 1,034,286 – –
From amortised cost (Note 3) – 800,000 – –
Transfer to FVOCI (Note 1) – (23,487) – –
Total FVSI 412,680 1,810,799 – 2,223,479
FVOCI
Investment:
Opening balance – – – –
From available for sale – 771,293 – –
From FVSI – 23,487 – –
Total FVOCI – 794,780 – 794,780
Financial liabilities
At Amortised cost
Due to banks and other financial institutions 5,522,567 – – 5,522,567
Customers deposits 273,056,445 – – 273,056,445
Other liabilities 8,786,598 – – 8,786,598
Total at amortised cost 287,365,610 – – 287,365,610287,365,610
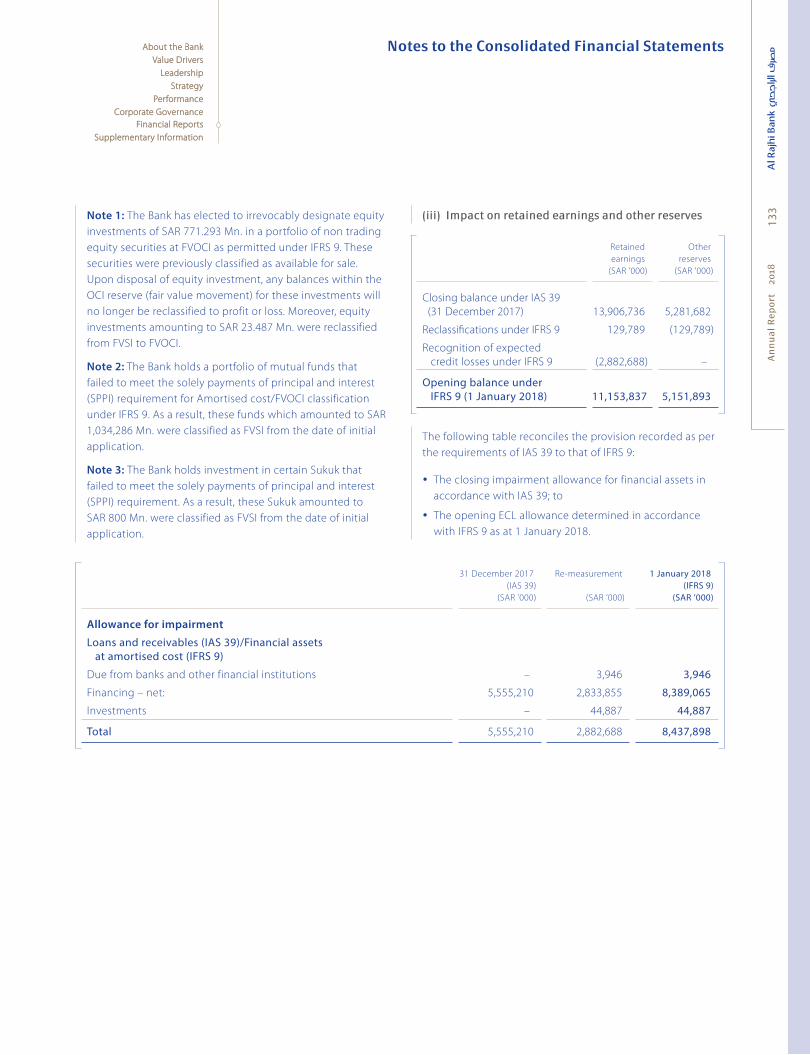
Notes to the Consolidated Financial Statements
An
nu
al
Re
po
rt
20
1813
3
About the BankAbout the Bank
Value DriversValue Drivers
LeadershipLeadership
StrategyStrategy
PerformancePerformance
Corporate GovernanceCorporate Governance
Financial ReportsFinancial Reports
Supplementary InformationSupplementary Information
Note 1: The Bank has elected to irrevocably designate equity
investments of SAR 771.293 Mn. in a portfolio of non trading
equity securities at FVOCI as permitted under IFRS 9. These
securities were previously classified as available for sale.
Upon disposal of equity investment, any balances within the
OCI reserve (fair value movement) for these investments will
no longer be reclassified to profit or loss. Moreover, equity
investments amounting to SAR 23.487 Mn. were reclassified
from FVSI to FVOCI.
Note 2: The Bank holds a portfolio of mutual funds that
failed to meet the solely payments of principal and interest
(SPPI) requirement for Amortised cost/FVOCI classification
under IFRS 9. As a result, these funds which amounted to SAR
1,034,286 Mn. were classified as FVSI from the date of initial
application.
Note 3: The Bank holds investment in certain Sukuk that
failed to meet the solely payments of principal and interest
(SPPI) requirement. As a result, these Sukuk amounted to
SAR 800 Mn. were classified as FVSI from the date of initial
application.
(iii) Impact on retained earnings and other reserves(iii) Impact on retained earnings and other reserves
Retained
earnings
(SAR ’000)
Other
reserves
(SAR ’000)
Closing balance under IAS 39
(31 December 2017) 13,906,736 5,281,682
Reclassifi cations under IFRS 9 129,789 (129,789)
Recognition of expected
credit losses under IFRS 9 (2,882,688) –
Opening balance under IFRS 9 (1 January 2018) 11,153,837 5,151,893
The following table reconciles the provision recorded as per
the requirements of IAS 39 to that of IFRS 9:
The closing impairment allowance for financial assets in
accordance with IAS 39; to
The opening ECL allowance determined in accordance
with IFRS 9 as at 1 January 2018.
31 December 2017
(IAS 39)
(SAR ’000)
Re-measurement
(SAR ’000)
1 January 2018 (IFRS 9)
(SAR ’000)
Allowance for impairment
Loans and receivables (IAS 39)/Financial assets at amortised cost (IFRS 9)
Due from banks and other financial institutions – 3,946 3,946
Financing – net: 5,555,210 2,833,855 8,389,065
Investments – 44,887 44,887
Total 5,555,210 2,882,688 8,437,898
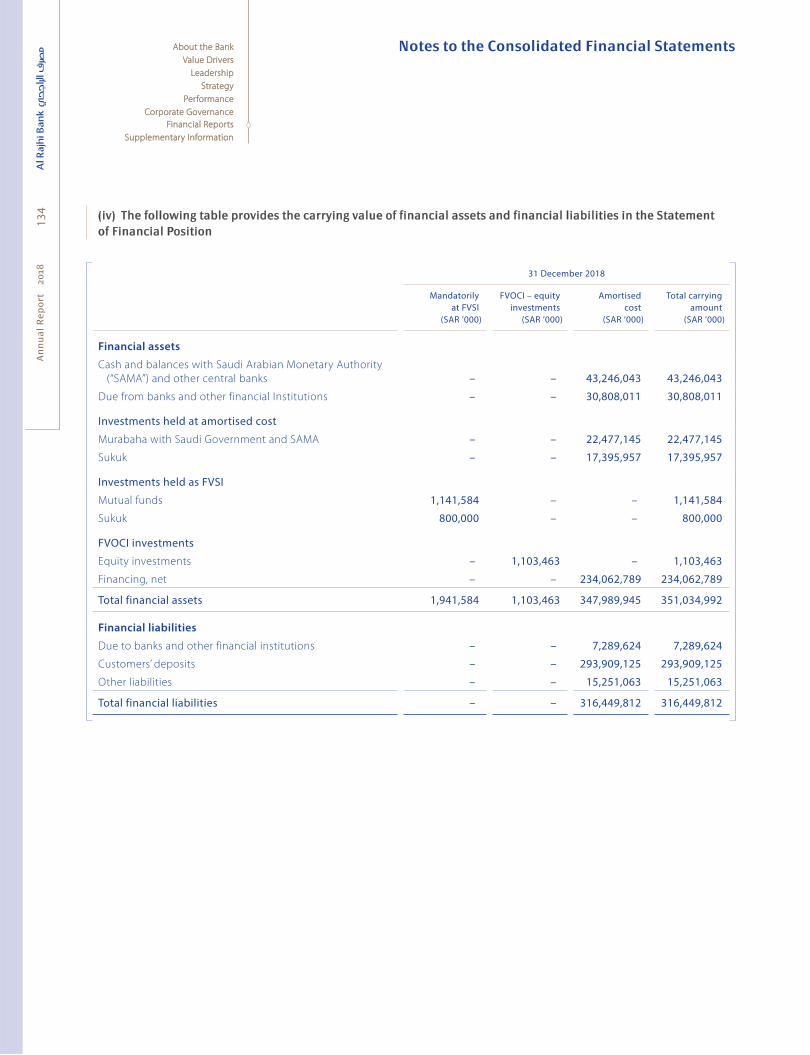
Notes to the Consolidated Financial StatementsA
nn
ua
l R
ep
ort
2
018
134
About the BankAbout the Bank
Value DriversValue Drivers
LeadershipLeadership
StrategyStrategy
PerformancePerformance
Corporate GovernanceCorporate Governance
Financial ReportsFinancial Reports
Supplementary InformationSupplementary Information
(iv) The following table provides the carrying value of financial assets and financial liabilities in the Statement (iv) The following table provides the carrying value of financial assets and financial liabilities in the Statement of Financial Positionof Financial Position
31 December 2018
Mandatorily at FVSI
(SAR ’000)
FVOCI – equity investments
(SAR ’000)
Amortised cost
(SAR ’000)
Total carrying amount
(SAR ’000)
Financial assets
Cash and balances with Saudi Arabian Monetary Authority
(“SAMA”) and other central banks – – 43,246,043 43,246,043
Due from banks and other financial Institutions – – 30,808,011 30,808,011
Investments held at amortised cost
Murabaha with Saudi Government and SAMA – – 22,477,145 22,477,145
Sukuk – – 17,395,957 17,395,957
Investments held as FVSI
Mutual funds 1,141,584 – – 1,141,584
Sukuk 800,000 – – 800,000
FVOCI investments
Equity investments – 1,103,463 – 1,103,463
Financing, net – – 234,062,789 234,062,789
Total financial assets 1,941,584 1,103,463 347,989,945 351,034,992
Financial liabilities
Due to banks and other financial institutions – – 7,289,624 7,289,624
Customers’ deposits – – 293,909,125 293,909,125
Other liabilities – – 15,251,063 15,251,063
Total financial liabilities – – 316,449,812 316,449,812

Notes to the Consolidated Financial Statements
An
nu
al
Re
po
rt
20
1813
5
About the BankAbout the Bank
Value DriversValue Drivers
LeadershipLeadership
StrategyStrategy
PerformancePerformance
Corporate GovernanceCorporate Governance
Financial ReportsFinancial Reports
Supplementary InformationSupplementary Information
31 December 2017
Note Trading
(SAR ’000)
Designated
as at FVSI
(SAR ’000)
Held to
maturity
(SAR ’000)
Loans and
receivables
(SAR ’000)
Available
for sale
(SAR ’000)
Other
amortised
(SAR ’000)
Total carrying
amount
(SAR ’000)
Financial assets
Cash and balances with
Saudi Arabian Monetary
Authority (“SAMA”) and
other central banks – – – 48,282,471 – – 48,282,471
Due from banks and other
financial Institutions – – – 10,709,795 – – 10,709,795
Investments held at amortised cost
Murabaha with Saudi
Government and SAMA
– – 23,452,869 – – – 23,452,869
Sukuk – – 10,605,139 – – – 10,605,139
Investments held as FVSI
Equity investments – 23,487 – – – – 23,487
Mutual funds – 389,193 – – – – 389,193
Available-for-sale investments
Equity investments – – – – 771,293 – 771,293
Mutual funds – – – – 1,034,286 – 1,034,286
Financing, net – – – 233,535,573 – – 233,535,573
Total financial assets – 412,680 34,058,008 292,527,839 1,805,579 – 328,804,106
Financial liabilities
Due to banks and other
financial institutions – – – – – 5,522,567 5,522,567
Customers’ deposits – – – – – 273,056,445 273,056,445
Other liabilities – – – – – 8,786,598 8,786,598
Total financial liabilities – – – – – 287,365,610 287,365,610
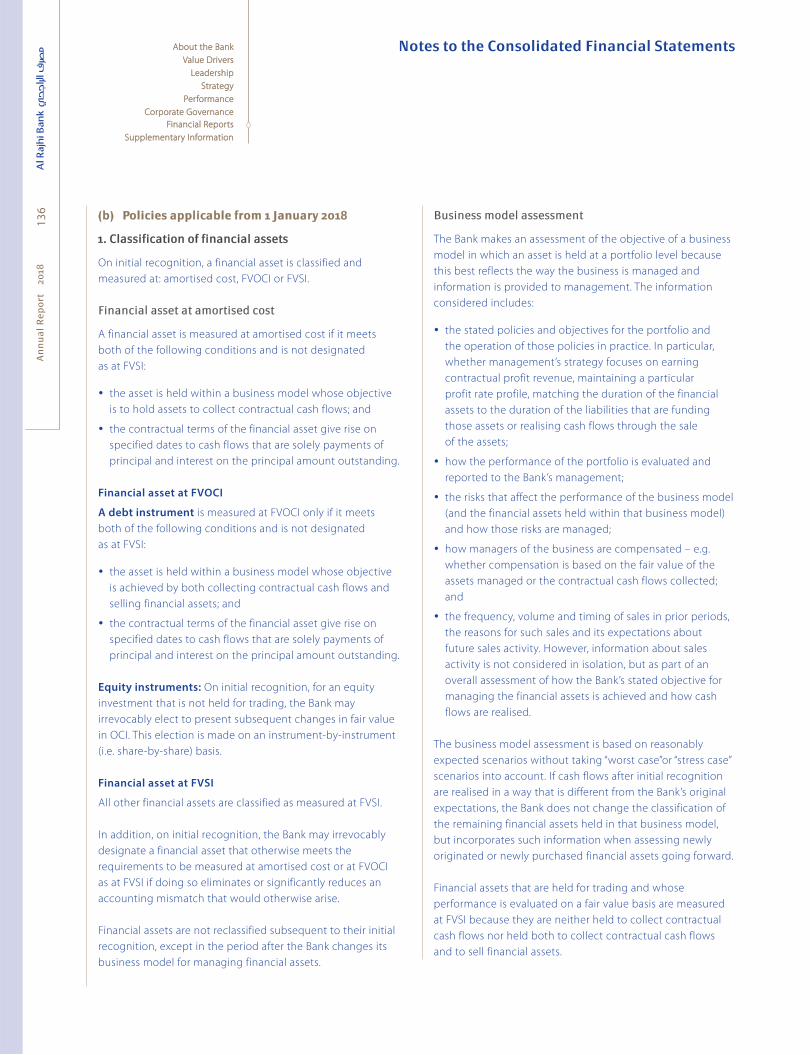
Notes to the Consolidated Financial StatementsA
nn
ua
l R
ep
ort
2
018
136
About the BankAbout the Bank
Value DriversValue Drivers
LeadershipLeadership
StrategyStrategy
PerformancePerformance
Corporate GovernanceCorporate Governance
Financial ReportsFinancial Reports
Supplementary InformationSupplementary Information
(b) Policies applicable from 1 January 2018(b) Policies applicable from 1 January 2018
1. Classification of financial assets1. Classification of financial assets
On initial recognition, a financial asset is classified and
measured at: amortised cost, FVOCI or FVSI.
Financial asset at amortised costFinancial asset at amortised cost
A financial asset is measured at amortised cost if it meets
both of the following conditions and is not designated
as at FVSI:
the asset is held within a business model whose objective
is to hold assets to collect contractual cash flows; and
the contractual terms of the financial asset give rise on
specified dates to cash flows that are solely payments of
principal and interest on the principal amount outstanding.
Financial asset at FVOCI
A debt instrument is measured at FVOCI only if it meets
both of the following conditions and is not designated
as at FVSI:
the asset is held within a business model whose objective
is achieved by both collecting contractual cash flows and
selling financial assets; and
the contractual terms of the financial asset give rise on
specified dates to cash flows that are solely payments of
principal and interest on the principal amount outstanding.
Equity instruments: On initial recognition, for an equity
investment that is not held for trading, the Bank may
irrevocably elect to present subsequent changes in fair value
in OCI. This election is made on an instrument-by-instrument
(i.e. share-by-share) basis.
Financial asset at FVSI
All other financial assets are classified as measured at FVSI.
In addition, on initial recognition, the Bank may irrevocably
designate a financial asset that otherwise meets the
requirements to be measured at amortised cost or at FVOCI
as at FVSI if doing so eliminates or significantly reduces an
accounting mismatch that would otherwise arise.
Financial assets are not reclassified subsequent to their initial
recognition, except in the period after the Bank changes its
business model for managing financial assets.
Business model assessmentBusiness model assessment
The Bank makes an assessment of the objective of a business
model in which an asset is held at a portfolio level because
this best reflects the way the business is managed and
information is provided to management. The information
considered includes:
the stated policies and objectives for the portfolio and
the operation of those policies in practice. In particular,
whether management’s strategy focuses on earning
contractual profit revenue, maintaining a particular
profit rate profile, matching the duration of the financial
assets to the duration of the liabilities that are funding
those assets or realising cash flows through the sale
of the assets;
how the performance of the portfolio is evaluated and
reported to the Bank’s management;
the risks that affect the performance of the business model
(and the financial assets held within that business model)
and how those risks are managed;
how managers of the business are compensated – e.g.
whether compensation is based on the fair value of the
assets managed or the contractual cash flows collected;
and
the frequency, volume and timing of sales in prior periods,
the reasons for such sales and its expectations about
future sales activity. However, information about sales
activity is not considered in isolation, but as part of an
overall assessment of how the Bank’s stated objective for
managing the financial assets is achieved and how cash
flows are realised.
The business model assessment is based on reasonably
expected scenarios without taking “worst case”or “stress case”
scenarios into account. If cash flows after initial recognition
are realised in a way that is different from the Bank’s original
expectations, the Bank does not change the classification of
the remaining financial assets held in that business model,
but incorporates such information when assessing newly
originated or newly purchased financial assets going forward.
Financial assets that are held for trading and whose
performance is evaluated on a fair value basis are measured
at FVSI because they are neither held to collect contractual
cash flows nor held both to collect contractual cash flows
and to sell financial assets.
Notes to the Consolidated Financial Statements
An
nu
al
Re
po
rt
20
1813
7
About the BankAbout the Bank
Value DriversValue Drivers
LeadershipLeadership
StrategyStrategy
PerformancePerformance
Corporate GovernanceCorporate Governance
Financial ReportsFinancial Reports
Supplementary InformationSupplementary Information
Assessments whether contractual cash flows are
solely payments of principal and interest
For the purposes of this assessment, “principal” is the fair
value of the financial asset on initial recognition. “Interest” is
the consideration for the time value of money, the credit and
other basic lending risk associated with the principal amount
outstanding during a particular period and other basic
lending costs (e.g. liquidity risk and administrative costs),
along with profit margin.
In assessing whether the contractual cash flows are solely
payments of principal and interest, the Bank considers the
contractual terms of the instrument. This includes assessing
whether the financial asset contains a contractual term that
could change the timing or amount of contractual cash flows
such that it would not meet this condition. In making the
assessment, the Bank considers:
contingent events that would change the amount and
timing of cash flows;
leverage features;
prepayment and extension terms;
terms that limit the Bank’s claim to cash flows from
specified assets (e.g. non-recourse asset arrangements);
and
features that modify consideration of the time value
of money- e.g. periodical reset of interest rates.
Reclassification Reclassification
The Bank reclassifies the financial assets between FVSI,
FVOCI and amortised cost if and only if under rare
circumstances its business model objective for its financial
assets changes so its previous business model assessment
would no longer apply.
Financing and InvestmentFinancing and Investment
The Bank offers profit based products including Mutajara,
instalment sales, Murabaha and Istisnaa to its customers in
compliance with Sharia rules.
The Bank classifies its Principal financing and Investment
as follows:
Financing: These financing represents loans granted
to customers. These financings mainly constitute four
broad categiries i.e. Mutajara, Installment sales, Murabaha
and credit cards. The Bank classifies these financings at
amortised cost.
Due from banks and other financial institutions: These
consists of placements with financial Institutions (FIs). The
Bank classifies these balances due from banks and other
financial institutions at amortised cost as they are held to
collect contractual cash flows and pass SPPI criterion.
Investments (Murabaha with SAMA): These investments
consists of placements with Saudi Arabian Monetary
Authority (SAMA). The Bank classifies these investments at
amortised cost as they are held to collect contractual cash
flows and pass SPPI criterion.
Investments (Sukuk): These investments consists of
Investment in various Sukuk. The Bank classifies these
investment at amortised cost except for those Sukuk which
fails SPPI criterion, are classified at FVSI.
Equity Investments: These are the strategic equity
investments which the Bank does not expect to sell, for
which Bank has made an irrevocable election on the date of
initial recognition to present the fair value changes in other
comprehensive income.
Investments (Mutual Funds): The investments consist of
Investment in various Mutual Funds. The Bank classifies these
investment at FVSI as these investments fail SPPI criterion.
2. Classification of financial liabilities2. Classification of financial liabilities
The Bank classifies its financial liabilities, other than
financial guarantees and loan commitments, as measured
at amortised cost.
All amounts due to banks and other financial institutions and
customer deposits are initially recognised at fair value less
transaction costs.
Subsequently, financial liabilities are measured at amortised
cost, unless they are required to be measured at fair value
through profit or loss.

Notes to the Consolidated Financial StatementsA
nn
ua
l R
ep
ort
2
018
138
About the BankAbout the Bank
Value DriversValue Drivers
LeadershipLeadership
StrategyStrategy
PerformancePerformance
Corporate GovernanceCorporate Governance
Financial ReportsFinancial Reports
Supplementary InformationSupplementary Information
3. Derecognition3. Derecognition
(a) Financial assets(a) Financial assets
The Bank derecognises a financial asset when the contractual
rights to the cash flows from the financial asset expire, or it
transfers the rights to receive the contractual cash flows in a
transaction in which substantially all of the risks and rewards
of ownership of the financial asset are transferred or in which
the Bank neither transfers nor retains substantially all of the
risks and rewards of ownership and it does not retain control
of the financial asset.
On derecognition of a financial asset, the difference between
the carrying amount of the asset (or the carrying amount
allocated to the portion of the asset derecognised) and the
sum of (i) the consideration received (including any new
asset obtained less any new liability assumed) and (ii) any
cumulative gain or loss that had been recognised in OCI is
recognised in profit or loss.
From 1 January 2018, any cumulative gain/loss recognised in
OCI in respect of equity investment securities designated as
at FVOCI is not recognised in profit or loss on derecognition
of such securities. Any interest in transferred financial assets
that qualify for derecognition that is created or retained by
the Bank is recognised as a separate asset or liability.
In transactions in which the Bank neither retains nor transfers
substantially all of the risks and rewards of ownership of
a financial asset and it retains control over the asset, the
Bank continues to recognise the asset to the extent of its
continuing involvement, determined by the extent to which
it is exposed to changes in the value of the transferred asset.
(b) Financial liabilities(b) Financial liabilities
The Bank derecognises a financial liability when its
contractual obligations are discharged or cancelled
or expired.
4. Modifications of financial assets 4. Modifications of financial assets and financial liabilities and financial liabilities
(a) Financial assets(a) Financial assets
If the terms of a financial asset are modified, the Bank
evaluates whether the cash flows of the modified asset are
substantially different. If the cash flows are substantially
different, then the contractual rights to cash flows from the
original financial asset are deemed to have expired.
In this case, the original financial asset is derecognised and
a new financial asset is recognised at fair value.
If the cash flows of the modified asset carried at amortised
cost are not substantially different, then the modification
does not result in derecognition of the financial asset. In
this case, the Bank recalculates the gross carrying amount
of the financial asset and recognises the amount arising
from adjusting the gross carrying amount as a modification
gain or loss in profit or loss. If such a modification is carried
out because of financial difficulties of the borrower, then
the gain or loss is presented together with impairment
losses. In other cases, it is presented as interest income.
(b) Financial liabilities(b) Financial liabilities
The Bank derecognises a financial liability when its terms
are modified and the cash flows of the modified liability are
substantially different. In this case, a new financial liability
based on the modified terms is recognised at fair value. The
difference between the carrying amount of the financial
liability extinguished and the new financial liability with
modified terms is recognised in profit or loss.
5. Impairment 5. Impairment
The Bank recognises loss allowances for ECL on the
following financial instruments that are not measured
at FVSI:
financial assets that are debt instruments;
lease receivables;
financial guarantee contracts issued; and
loan commitments issued.
No impairment loss is recognised on equity investments.

Notes to the Consolidated Financial Statements
An
nu
al
Re
po
rt
20
1813
9
About the BankAbout the Bank
Value DriversValue Drivers
LeadershipLeadership
StrategyStrategy
PerformancePerformance
Corporate GovernanceCorporate Governance
Financial ReportsFinancial Reports
Supplementary InformationSupplementary Information
The Bank measures loss allowances at an amount equal to
lifetime ECL, except for the following, for which they are
measured as 12-month ECL:
debt investment securities that are determined to have low
credit risk at the reporting date; and
other financial instruments on which credit risk has not
increased significantly since their initial recognition.
The Bank considers a debt security to have low credit risk
when their credit risk rating is equivalent to the globally
understood definition of ‘investment grade’.
12-month ECL are the portion of ECL that result from default
events on a financial instrument that are possible within the
12 months after the reporting date.
Measurement of ECLMeasurement of ECL
ECL are a probability-weighted estimate of credit losses.
It is measured as follows:
financial assets that are not credit-impaired at the
reporting date: as the present value of all cash shortfalls
(i.e. the difference between the cash flows due to the
entity in accordance with the contract and the cash flows
that the Bank expects to receive);
financial assets that are credit-impaired at the reporting
date: as the difference between the gross carrying amount
and the present value of estimated future cash flows;
undrawn loan commitments: as the present value of the
difference between the contractual cash flows that are due
to the Bank if the commitment is drawn down and the cash
flows that the Bank expects to receive; and
financial guarantee contracts: the expected payments
to reimburse the holder less any amounts that the Bank
expects to recover.
Restructured financial assetsRestructured financial assets
If the terms of a financial asset are renegotiated or modified
or an existing financial asset is replaced with a new one due
to financial difficulties of the borrower, then an assessment is
made of whether the financial asset should be derecognised
and ECL are measured as follows:
If the expected restructuring will not result in derecognition
of the existing asset, then the expected cash flows arising
from the modified financial asset are included in calculating
the cash shortfalls from the existing asset.
If the expected restructuring will result in derecognition
of the existing asset, then the expected fair value of the
new asset is treated as the final cash flow from the existing
financial asset at the time of its derecognition .This amount
is included in calculating the cash shortfalls from the existing
financial asset that are discounted from the expected date
of derecognition to the reporting date using the original
effective interest rate of the existing financial asset.
Credit-impaired financial assetsCredit-impaired financial assets
At each reporting date, the Bank assesses whether
financial assets carried at amortised cost are credit-impaired.
A financial asset is “credit-impaired” when one or more events
that have detrimental impact on the estimated future cash
flows of the financial asset have occurred.
Evidence that a financial asset is credit-impaired includes the
following observable data:
significant financial difficulty of the borrower or issuer;
a breach of contract such as a default or past due event;
the restructuring of a loan or advance by the Bank on
terms that the Bank would not consider otherwise;
it is becoming probable that the borrower will enter
bankruptcy or other financial reorganisation; or
the disappearance of an active market for a security
because of financial difficulties.
A loan that has been renegotiated due to deterioration
in the borrower’s condition is usually considered to be
credit-impaired unless there is evidence that the risk of not
receiving contractual cash flows has reduced significantly
and there are no other indicators of impairment. In addition,
a retail loan that is overdue for 90 days or more is considered
impaired.
In making an assessment of whether an investment in
sovereign debt is credit-impaired, the Bank considers the
following factors.
The market’s assessment of creditworthiness as reflected in
the yields.
The rating agencies’ assessments of creditworthiness.
The country’s ability to access the capital markets for
new debt issuance.
The probability of debt being restructured, resulting in
holders suffering losses through voluntary or mandatory
debt forgiveness.

Notes to the Consolidated Financial StatementsA
nn
ua
l R
ep
ort
2
018
140
About the BankAbout the Bank
Value DriversValue Drivers
LeadershipLeadership
StrategyStrategy
PerformancePerformance
Corporate GovernanceCorporate Governance
Financial ReportsFinancial Reports
Supplementary InformationSupplementary Information
The international support mechanisms in place to
provide the necessary support as ‘lender of last resort’ to
that country, as well as the intention, reflected in public
statements, of governments and agencies to use those
mechanisms. This includes an assessment of the depth of
those mechanisms and, irrespective of the political intent,
whether there is the capacity to fulfil the required criteria.
Presentation of allowance for ECL in the Statement Presentation of allowance for ECL in the Statement of Financial Positionof Financial Position
Loss allowances for ECL are presented in the statement
of financial position as follows:
financial assets measured at amortised cost: as a
deduction from the gross carrying amount of the assets;
where a financial instrument includes both a drawn and
an undrawn component, and the Bank cannot identify
the ECL on the loan commitment component separately
from those on the drawn component: the Bank presents
a combined loss allowance for both components. The
combined amount is presented as a deduction from the
gross carrying amount of the drawn component. Any
excess of the loss allowance over the gross amount of the
drawn component is presented as a provision.
Write-offWrite-off
Loans and debt securities are written off (either partially or in
full) when there is no realistic prospect of recovery. However,
financial assets that are written off could still be subject to
enforcement activities in order to comply with the Bank’s
procedures for recovery of amounts due. If the amount to be
written off is greater than the accumulated loss allowance,
the difference is first treated as an addition to the allowance
that is then applied against the gross carrying amount. Any
subsequent recoveries are credited to credit loss expense.
Collateral valuationCollateral valuation
To mitigate its credit risks on financial assets, the Bank
seeks to use collateral, where possible. The collateral
comes in various forms, such as cash, securities, letters
of credit/guarantees, real estate, receivables, inventories,
other non-financial assets and credit enhancements such
as netting agreements. The Bank’s accounting policy for
collateral assigned to it through its lending arrangements
under IFRS 9 is the same as it was under IAS 39. Collateral,
unless repossessed, is not recorded on the Bank’s statement
of financial position. However, the fair value of collateral
affects the calculation of ECL. It is generally assessed,
at a minimum, at inception and re-assessed on a periodic
basis. However, some collateral, for example, cash or market
securities relating to margining requirements, is valued daily.
To the extent possible, the Bank uses active market data
for valuing financial assets held as collateral. Non-financial
collateral, such as real estate, is valued based on data
provided by third parties such as mortgage brokers, or based
on housing price indices.
Collateral repossessedCollateral repossessed
The Bank’s accounting policy under IFRS 9 remains the same
as it was under IAS 39. The Bank’s policy is to determine
whether a repossessed asset can be best used for its internal
operations or should be sold. Assets determined to be useful
for the internal operations are transferred to their relevant
asset category at the lower of their repossessed value or the
carrying value of the original secured asset. Assets for which
selling is determined to be a better option are transferred
to assets held for sale at their fair value (if financial assets)
and fair value less cost to sell for non-financial assets at the
repossession date in, line with the Bank’s policy.
6. Financial guarantees and loan commitments 6. Financial guarantees and loan commitments
“Financial guarantees” are contracts that require the Bank
to make specified payments to reimburse the holder for a
loss that it incurs because a specified debtor fails to make
payment when it is due in accordance with the terms of a
debt instrument. ‘Loan commitments’ are firm commitments
to provide credit under pre-specified terms and conditions.
Financial guarantees issued or commitments to provide a
loan at a below-market profit rate are initially measured at
fair value and the initial fair value is amortised over the life
of the guarantee or the commitment. Subsequently, they
are measured as follows:
from 1 January 2018: at the higher of this amortised
amount and the amount of loss allowance; and
Before 1 January 2018: at the higher of this amortised
amount and the present value of any expected payment
to settle the liability when a payment under the contract
has become probable.

Notes to the Consolidated Financial Statements
An
nu
al
Re
po
rt
20
1814
1
About the BankAbout the Bank
Value DriversValue Drivers
LeadershipLeadership
StrategyStrategy
PerformancePerformance
Corporate GovernanceCorporate Governance
Financial ReportsFinancial Reports
Supplementary InformationSupplementary Information
The Bank has issued no loan commitments that are measured
at FVSI. For other loan commitments:
from 1 January 2018: the Bank recognises loss allowance;
Before 1 January 2018: the Bank recognises a provision in
accordance with lAS 37 if the contract was considered to
be onerous.
7. Foreign Currencies 7. Foreign Currencies
The foreign currency gain or loss on monetary items is
the difference between amortised cost in the functional
currency at the beginning of the year adjusted for the
effective profits rate and payments during the year and
the amortised cost in foreign currency translated at the
exchange rate at the end of the year.
Realised and unrealised gains or losses on exchange are
credited or charged to the interim condensed consolidated
statement of comprehensive income.
Foreign currency differences arising on translation are
generally recognised in profit or loss. However, foreign
currency differences arising from the translation of available-
for-sale equity instruments (before 1 January 2018) or equity
investments in respect of which an election has been made
to present subsequent changes in fair value in OCI
(from 1 January 2018) are recognised in OCI.
The monetary assets and liabilities of foreign subsidiaries are
translated into SAR at rates of exchange prevailing at the date
of the interim condensed consolidated statement of financial
position. The statements of income of foreign subsidiaries are
translated at the weighted average exchange rates for the
year.
8. Rendering of services 8. Rendering of services
The Bank provides various services to its customer. These
services are either rendered separately or bundled together
with rendering of other services.
The Bank has concluded that revenue from rendering
of various services related to payment service system,
share trading services, remittance business, SADAD and
Mudaraba (i.e. subscription, management and performance
fees), should be recognised at the point when services are
rendered i.e. when performance obligation is satisfied.
1. Financing and Investment1. Financing and Investment
The Bank offers non-profit based products including Mutajara,
instalment sales, Murabaha and Istisnaa to its customers in
compliance with Sharia rules.
The Bank classifies its principal financing and
investment as follows:
i. Held at amortised cost – such financing and certain
investments which meets the definition of loans and
receivables under IAS 39, are classified as held at
amortised cost, and comprise Mutajara, instalment sale,
Istisnaa, Murabaha and credit cards operations accounts
balances. Investments held at amortised cost are initially
recognised at fair value and subsequently measured
at amortised cost (using effective yield basis) less any
amounts written off, and allowance for impairment.
Financings are non-derivative financial assets originated or
acquired by the Bank with fixed or determinable payments.
Financings are recognised when cash is advanced to
borrowers. They are derecognised when either borrower
repays their obligations, or the financings are sold or
written off, or substantially all the risks and rewards of
ownership are transferred.
All financing are initially measured at fair value, plus
incremental direct transaction costs (above certain
threshold) and are subsequently measured at amortised
cost using effective yield basis. Following the initial
recognition, subsequent transfers between the various
classes of financings is not ordinarily permissible. The
subsequent period-end reporting values for various
classes of financings are determined on the basis as set
out in the following paragraphs.
ii. Held to Maturity – Investments having fixed or
determinable payments and fixed maturity that the
Group has the positive intention and ability to hold
to maturity are classified as held to maturity. Held to
maturity investments are initially recognised at fair
value including direct and incremental transaction
costs and subsequently measured at amortised cost,
less provision for impairment in value. Amortised cost
is calculated by taking into account any discount or
premium on acquisition using an effective yield basis.
Any gain or loss on such investments is recognised in the
consolidated statement of income when the investment
is derecognised or impaired.

Notes to the Consolidated Financial StatementsA
nn
ua
l R
ep
ort
2
018
142
About the BankAbout the Bank
Value DriversValue Drivers
LeadershipLeadership
StrategyStrategy
PerformancePerformance
Corporate GovernanceCorporate Governance
Financial ReportsFinancial Reports
Supplementary InformationSupplementary Information
Investments classified as held to maturity cannot ordinarily
be sold or reclassified without impacting the Group’s ability
to use this classification.
However, sales and reclassifications in any of the following
circumstances would not impact the Group’s ability to use
this classification.
Sales or reclassifications that are so close to maturity that
the changes in market rate of commission would not
have a significant effect on the fair value.
Sales or reclassifications after the Group has collected
substantially all the assets’ original principal.
Sales or reclassifications attributable to non-recurring
isolated events beyond the Group’s control that could
not have been reasonably anticipated.
iii. Held as FVSI – Investments in this category are classified
as either investment held for trading or those designated
as FVSI on initial recognition. Investments classified as
trading are acquired principally for the purpose of selling
or repurchasing in the short term. These investments
comprise mutual funds and equity investments. Such
investments are measured at fair value and any changes in
the fair values are charged to the consolidated statement
of income. Transaction costs, if any, are not added to
the fair value measurement at initial recognition of
FVSI investments and are expensed in the consolidated
financial statements. Investment income and dividend
income on financial assets held as FVSI are reflected under
other operating income in the consolidated statement of
income.
Investments at FVSI are not reclassified subsequent to
their initial recognition, except that non-derivative FVSI
instruments, other than those designated as FVSI upon
initial recognition, may be reclassified out of the FVSI
(i.e. trading) category if they are no longer held for the
purpose of being sold or repurchased in the near term,
and the following conditions are met:
If the financial asset would have met the definition
of financing and receivables, if the financial asset had
not been required to be classified as held for trading
at initial recognition, then it may be reclassified if the
entity has the intention and ability to hold the financial
asset for the foreseeable future or until maturity.
If the financial asset would not have met the
definition of financing and receivables, and then it
may be reclassified out of the trading category only in
“rare circumstances”.
iv. Available-for-sale – Available-for-sale investments are
those non-derivative equity securities which are neither
classified as Held to maturity investments, financing nor
designated as FVSI, that are intended to be held for an
unspecified period of time, which may be sold in response
to needs for liquidity or changes in special commission
rates, exchange rates or equity prices.
Investments which are classified as “available-for-sale”
are initially recognised at fair value including direct
and incremental transaction costs and subsequently
measured at fair value except for unquoted equity
securities whose fair value cannot be reliably measured
are carried at cost. Unrealised gains or losses arising
from changes in fair value are recognised in other
comprehensive income until the investment is de-
recognised or impaired whereupon any cumulative gain
or loss previously recognised in other comprehensive
income are reclassified to consolidated statement of
income. A security held as available-for-sale may be
reclassified to “Other investments held at amortised
cost” if it otherwise would have met the definition of
“Other investments held at amortised cost” and if the
Bank has the intention and ability to hold that financial
asset for the foreseeable future or
until maturity.
2. Impairment of financial assets2. Impairment of financial assets
Held at amortised cost
An assessment is made at the date of each consolidated
statement of financial position to determine whether there
is objective evidence of impairment as a result of one or
more events that occurred after the initial recognition of
the financial asset or a group of financial assets and that a
loss event(s) has an impact on the estimated future cash
flows of the financial asset or group of financial assets
that can be reliably estimated. If such evidence exists, the
difference between the assets carrying amount and the
present value of estimated future cash flows is calculated
and any impairment loss, is recognised for changes in
the asset’s carrying amount. The carrying amount of the
financial assets held at amortised cost, is adjusted either
directly or through the use of an allowance for impairment
account, and the amount of the adjustment is included in
the Consolidated Statement of Income.
Notes to the Consolidated Financial Statements
An
nu
al
Re
po
rt
20
1814
3
About the BankAbout the Bank
Value DriversValue Drivers
LeadershipLeadership
StrategyStrategy
PerformancePerformance
Corporate GovernanceCorporate Governance
Financial ReportsFinancial Reports
Supplementary InformationSupplementary Information
A specific provision for credit losses due to impairment of
a financing or any other financial asset held at amortised
cost is established if there is objective evidence that the
Bank will not be able to collect all amounts due. The amount
of the specific provision is the difference between the
carrying amount and the estimated recoverable amount.
The estimated recoverable amount is the present value of
expected cash flows, including amounts estimated to be
recoverable from guarantees and collateral, discounted based
on the original effective yield rate.
Considerable judgement by management is required in
the estimation of the amount and timing of future cash
flows when determining the level of provision required.
Such estimates are essentially based on assumptions about
several factors involving varying degrees of judgment and
uncertainty, and actual results may differ resulting in future
changes to such allowance for impairment. In addition to
the specific allowance for impairment described above,
the Bank also makes collective impairment allowance for
impairment, which are evaluated on a group basis and are
created for losses, where there is objective evidence that
unidentified losses exist at the reporting date. The amount
of the provision is estimated based on the historical default
patterns of the investment and financing counter-parties as
well as their credit ratings, taking into account the current
economic climate. In assessing collective impairment,
the Bank also uses internal loss estimates and makes an
adjustment if current economic and credit conditions are
such that the actual losses are likely to be greater or lesser
than is suggested by historical trends. Loss rates are regularly
benchmarked against actual outcomes to ensure that they
remain appropriate.
The criteria that the Bank uses to determine that there is an
objective evidence of impairment loss include:
Delinquency in contractual payments of principal or profit.
Cash flow difficulties experienced by the customer.
Breach of repayment covenants or conditions.
Initiation of bankruptcy proceedings against the customer.
Deterioration of the customer’s competitive position.
Deterioration in the value of collateral.
When financing amount is uncollectible, it is written-off
against the related allowance for impairment. Such financing
is written-off after all necessary procedures have been
completed and the amount of the loss has been determined.
Financing whose terms have been renegotiated are no
longer considered to be past due but are treated as new
financing. Restructuring policies and practices are based on
indicators or criteria which, indicate that payment will most
likely continue. The financing continue to be subject to an
individual or collective impairment assessment, calculated
using the financing’s original effective yield rate.
Financing are generally renegotiated either as part of an
ongoing customer relationship or in response to an adverse
change in the circumstances of the borrower. In the latter
case, renegotiation can result in an extension of the due
date of payment or repayment plans under which the Group
offers a revised rate of commission to genuinely distressed
borrowers. This results in the asset continuing to be overdue
and individually impaired as the renegotiated payments of
commission and principal do not recover the original carrying
amount of the financing. In other cases, renegotiation lead to
a new agreement, this is treated as a new financing.
If, in a subsequent period, the amount of the impairment
loss decreases and the decrease can be related objectively
to an event occurring after the impairment was recognised
(such as an improvement in the customer’s credit rating),
the previously recognised impairment loss is reversed
by adjusting the allowance for impairment account. The
amount of the reversal is recognised in the statement
of income as impairment charge. Financial assets are
written-off only in circumstances where effectively all
possible means of recovery have been exhausted.
Collectively assessed impairment allowances are
provided for:
Portfolios of homogeneous assets mainly relating to
the retail financing portfolio that are individually not
significant.
On the corporate portfolio for financing where losses have
been incurred but not yet identified, by using historical
experience, judgement and statistical techniques.

Notes to the Consolidated Financial StatementsA
nn
ua
l R
ep
ort
2
018
144
About the BankAbout the Bank
Value DriversValue Drivers
LeadershipLeadership
StrategyStrategy
PerformancePerformance
Corporate GovernanceCorporate Governance
Financial ReportsFinancial Reports
Supplementary InformationSupplementary Information
Available for-sale equity investments
For equity investments held as available-for-sale, a
significant or prolonged decline in fair value below
its cost represents objective evidence of impairment.
The impairment loss cannot be reversed through the
statement of income as long as the asset continues to be
recognised i.e. any increase in fair value after impairment
has been recorded can only be recognised in equity. On
derecognition, any cumulative gain or loss previously
recognised in equity is included in the consolidated
statement of income for the year.
3. De-recognition of financial assets and 3. De-recognition of financial assets and financial liabilitiesfinancial liabilities
A financial asset (or a part of a financial asset, or a part of a
group of similar financial assets) is derecognised when the
contractual rights to the cash flows from the financial asset
expire or the asset is transferred and the transfer qualifies
for de-recognition.
A financial liability (or a part of a financial liability) can only
be derecognised when it is extinguished, that is when the
obligation specified in the contract is either discharged,
cancelled or expired.
4. Guarantees4. Guarantees
In the ordinary course of business the Bank gives
guarantees which include letters of credit, letters of
guarantee, acceptances and stand-by letters of credit.
Initially, the received margins are recognised as liabilities
at fair value, being the value of the premium received
and included in customers’ deposits in the consolidated
financial statements. Subsequent to the initial recognition,
the Bank’s liability under each guarantee is measured at the
higher of the amortised premium and the best estimate
of expenditure required to settle any financial obligations
arising as a result of guarantees. Any increase in the
liability relating to the financial guarantee is taken to the
consolidated statement of income in “impairment charge
for credit losses, net”. The premium received is recognised
in the consolidated statement of income under “Fees from
banking services, net” on a straight line basis over the life
of the guarantee.
5. Foreign currencies5. Foreign currencies
The consolidated financial statements are presented in Saudi
Arabian Riyals (“SAR”), which is also the Bank’s functional
currency. Each entity determines its own functional currency
and items included in the financial statements of each entity
are measured using that functional currency. Transactions in
foreign currencies are translated into SAR at exchange rates
prevailing on the dates of the transactions. Monetary assets
and liabilities at the year-end (other than monetary items
that form part of the net investment in foreign operations
are translated into SAR at exchange rates prevailing on the
reporting date.
The foreign currency gain or loss on monetary items is the
difference between amortised cost in the functional currency
at the beginning of the year adjusted for the effective profits
rate and payments during the year and the amortised cost
in foreign currency translated at exchange rate at the end of
the year.
Foreign exchange gains or losses from settlement of
transactions and translation of period end monetary
assets and liabilities denominated in foreign currencies are
recognised in the consolidated statement of income.
Non-monetary items that are measured in terms of historical
cost in a foreign currency are translated using the exchange
rates as at the dates of the initial transactions. Non-monetary
items measured at fair value in a foreign currency are
translated using the exchange rates at the date when the fair
value is determined.
As at the reporting date, the assets and liabilities of foreign
operations are translated into SAR at the rate of exchange
as at the statement of financial position date, and their
statement of incomes are translated at the weighted average
exchange rates for the year. Exchange differences arising
on translation are recognised in the statements of other
comprehensive income.
When a foreign operation is disposed of such that control,
significant influence or joint control is lost, the cumulative
amount in the translation reserve related to that foreign
operation is reclassified to the statement of income as part
of the gain or loss on disposal. When the Group disposes of
only part of its interest in a subsidiary that includes a foreign
operation while retaining control, the relevant proportion
of the cumulative amount is reattributed to non-controlling
interests.
Notes to the Consolidated Financial Statements
An
nu
al
Re
po
rt
20
1814
5
About the BankAbout the Bank
Value DriversValue Drivers
LeadershipLeadership
StrategyStrategy
PerformancePerformance
Corporate GovernanceCorporate Governance
Financial ReportsFinancial Reports
Supplementary InformationSupplementary Information
(b) Basis of consolidation
These consolidated financial statements comprise the
financial statements of the Bank and its subsidiaries as set out
in note 1 to these financial statements (collectively referred
to as “the Group”). The financial statements of subsidiaries
are prepared for the same reporting year as that of the Bank,
using consistent accounting policies.
Subsidiaries are investees controlled by the Group. The
Group controls an investee if it is exposed to, or has rights
to, variable returns from its involvement with the investee
and has the ability to affect those returns through its power
over the investee. The financial statements of subsidiaries
are included in the consolidated financial statements from
the date on which control commences until the date when
control ceases.
The consolidated financial statements have been prepared
using uniform accounting policies and valuation methods for
like transactions and other events in similar circumstances.
Specifically, the Group controls an investee
if and only if the Group has:
Power over the investee (i.e. existing rights that give
it the current ability to direct the relevant activities
of the investee);
Exposure, or rights, to variable returns from its involvement
with the investee; and
The ability to use its power over the investee
to affect amount of its returns.
When the Group has less than majority of the voting or
similar rights of an investee entity, the Bank considers all
relevant facts and circumstances in assessing whether it has
power over the entity, including:
The contractual arrangement with the other vote
holders of the investee
Rights arising from other contractual arrangements
The Bank’s voting rights and potential voting rights granted
by equity instruments such as shares
The Group re-assesses whether or not it controls an investee
if facts and circumstances indicate that there are changes
to one or more of the three elements of control. Assets,
liabilities, income and expenses of a subsidiary acquired or
disposed of during the year are included in the statement of
comprehensive income from the date the Group gains
control until the date the Group ceases to control the
subsidiary. A change in the ownership interest of a subsidiary,
without a loss of control, is accounted for as an equity
transaction. If the Bank loses control over a subsidiary, it:
derecognises the assets and liabilities of the subsidiary
derecognises the cumulative translation differences
recorded in shareholder’s equity
recognises the fair value of the consideration received
recognises the fair value of any investment retained
recognises any surplus or deficit in profit or loss
reclassifies the parent’s share of components previously
recognised in OCI to profit or loss or retained earnings, as
appropriate as would be required if the Bank had directly
disposed of the related assets or liabilities.
Intra-group balances and any income and expenses arising
from intra-group transactions, are eliminated in preparing
these consolidated financial statements.
Investment in associate
An associate is an entity over which the Bank exercises
significant influence (but not control), over financial and
operating policies and which is neither a subsidiary nor a
joint arrangement. Investments in associates are initially
recognised at cost and subsequently accounted for
under the equity method of accounting and are carried
in the consolidated statement of financial position at
the lower of the equity-accounted or the recoverable
amount. Equity-accounted value represents the cost
plus post-acquisition changes in the Bank’s share of net
assets of the associate (share of the results, reserves
and accumulated gains/losses based on latest available
financial statements) less impairment, if any.
The previously recognised impairment loss in respect
of investment in associate can be reversed through the
consolidated statement of income, such that the carrying
amount of the investment in the statement of financial
position remains at the lower of the equity-accounted
(before provision for impairment) or the recoverable amount.
On derecognition the difference between the carrying
amount of investment in the associate and the fair value of
the consideration received is recognised in the consolidated
statement of income.
Notes to the Consolidated Financial StatementsA
nn
ua
l R
ep
ort
2
018
146
About the BankAbout the Bank
Value DriversValue Drivers
LeadershipLeadership
StrategyStrategy
PerformancePerformance
Corporate GovernanceCorporate Governance
Financial ReportsFinancial Reports
Supplementary InformationSupplementary Information
(c) Trade date
All regular way purchases and sales of financial assets are
recognised and derecognised on the trade date (i.e. the date
on which the Bank commits to purchase or sell the assets).
Regular way purchases or sales of financial assets require
delivery of those assets within the time frame generally
established by regulation or convention in the market place.
All other financial assets and financial liabilities (including
assets and liabilities designated at fair value through
statement of income) are initially recognised on the trade
date at which the Group becomes a party to the contractual
provisions of the instrument.
(d) Offsetting financial instruments
Financial assets and financial liabilities are offset and are
reported net in the consolidated statement of financial
position when there is a legally enforceable right to set off
the recognised amounts, and when the Group intends to
settle on a net basis, or to realise the asset and settle the
liability simultaneously. Income and expenses are not offset
in the consolidated statement of income unless required or
permitted by any accounting standard or interpretation,
and as specifically disclosed in the accounting policies of
the Bank.
(e) Revenue recognition
The following specific recognition criteria must be met before
revenue is recognised.
Income from Mutajara, Murabaha, investments held at
amortised cost, instalment sale, Istisnaa financing and
credit cards services is recognised based on the effective
yield basis on the outstanding balances. The effective
yield is the rate that exactly discounts the estimated
future cash receipts through the expected life of the
financial asset (or, where appropriate, a shorter period)
to the carrying amount of the financial asset . When
calculating the effective yield, the Group estimates future
cash flows considering all contractual terms of the
financial instrument but excluding future credit losses.
Fees and commissions are recognised when the service
has been provided.
Financing commitment fees that are likely to be drawn
down and other credit related fees are deferred (above
certain threshold) and, together with the related direct
cost, are recognised as an adjustment to the effective
yield on the financing. When a financing commitment is
not expected to result in the draw-down of a financing,
financing commitment fees are recognised on a
straight-line basis over the commitment period.
Fee and commission income that are integral to the effective
interest rate on a financial asset or financial liability are
included in the effective interest rate.
Portfolio and other management advisory and service fees
are recognised based on the applicable service contracts,
over the period when the service is being provided i.e.
related performance obligation is satisfied.
Fees received for asset management, wealth Management,
financial planning, custody services and other similar
services that are provided over an extended period of time,
are recognised over the period when the service is being
provided i.e. related performance obligation is satisfied .
Asset management fees related to investment funds are
recognised over the period the service is being provided.
The same principle applies to Wealth management and
Custody Services that are continuously recognised over a
period of time.
Dividend income is recognised when the right to receive
income is established which is generally when the
shareholders approve the dividend. Dividends are reflected as
a component of net trading income, net income from
FVSI financial instruments or other operating income based
on the underlying classification of the equity instrument.

Notes to the Consolidated Financial Statements
An
nu
al
Re
po
rt
20
1814
7
About the BankAbout the Bank
Value DriversValue Drivers
LeadershipLeadership
StrategyStrategy
PerformancePerformance
Corporate GovernanceCorporate Governance
Financial ReportsFinancial Reports
Supplementary InformationSupplementary Information
Foreign currency exchange income/loss is recognised
when earned/incurred.
Net trading income results from trading activities and include
all realised and unrealised gains and losses from changes in
fair value and related gross investment income or expense,
dividends for financial assets and financial liabilities held for
trading and foreign exchange differences.
Net income from FVSI financial instruments relates to
financial assets and liabilities designated as FVSI and includes
all realised and unrealised fair value changes, investment
income, dividends and foreign exchange differences.
(f ) Other real estate
The Bank, in the ordinary course of business, acquires certain
real estate against settlement of financing. Such real estate
are considered as assets held for sale and are initially stated
at the lower of net realisable value of due financing and the
current fair value of the related properties, less any costs
to sell (if material). No depreciation is charged on such real
estate. Rental income from other real estate is recognised in
the consolidated statement of income.
Subsequent to initial recognition, any subsequent write
down to fair value, less costs to sell, are charged to the
consolidated statement of income. Any subsequent
revaluation gain in the fair value less costs to sell of these
assets, to the extent this does not exceed the cumulative
write down previously recognised are recognised, in the
consolidated statement of income. Gains or losses on
disposal are recognised in the consolidated statement
of income.
(g) Investment properties
Investment properties are held for long-term rental yield
and are not occupied by the Group. They are carried at cost,
and depreciation is charged to the consolidated statement
of income.
The cost of investment properties is depreciated using
the straight-line method over the estimated useful life
of the assets.
(h) Property and equipment
Property and equipment is stated at cost less accumulated
depreciation and accumulated impairment loss. Land is
not depreciated. The cost of other property and equipment
is depreciated using the straight-line method over the
estimated useful life of the assets, as follows:
Leasehold land improvements over the lesser of the period
of the lease or the useful life
- Buildings 33 years
- Leasehold building improvements over the lease period
or 3 years, whichever is shorter
- Equipment and furniture 3 to 10 years
The assets’ residual values and useful lives are reviewed, and
adjusted if appropriate, at the date of each statement of
financial position.
Gains and losses on disposals are determined by comparing
proceeds with carrying amount. These are included in
consolidated statement of income.
All assets are reviewed for impairment at each reporting
date and whenever events or changes in circumstances
indicate that the carrying amount may not be recoverable.
Any carrying amount is written down immediately to its
recoverable amount if the asset’s carrying amount is greater
than its estimated recoverable amount.
(h) Customers’ deposits
Customer deposits are financial liabilities that are initially
recognised at fair value less transaction cost, being the fair
value of the consideration received, and are subsequently
measured at amortised cost.
(i) Provisions
Provisions are recognised when the Bank has present legal or
constructive obligation as a result of past events, it is probable
that an outfl ow of resources embodying economic benefi ts will
be required to settle the obligation, and a reliable estimate of
the amount of the obligation can be made.
Notes to the Consolidated Financial StatementsA
nn
ua
l R
ep
ort
2
018
148
About the BankAbout the Bank
Value DriversValue Drivers
LeadershipLeadership
StrategyStrategy
PerformancePerformance
Corporate GovernanceCorporate Governance
Financial ReportsFinancial Reports
Supplementary InformationSupplementary Information
( j) Accounting for leases
1. Where the Group is the lessee
Leases that do not transfer to the Group substantially all of
the risk and benefits of ownership of the asset are classified
as operating leases. Consequently, all of the leases entered
into by the Bank are all operating leases. Payments made
under operating leases are charged to the consolidated
statement of income on a straight-line basis over the period
of the lease.
1. Where the Group is the lessor
When an operating lease is terminated before the lease
period has expired, any payment required to be made to the
lessor by way of penalty, net of anticipated rental income
(if any), is recognised as an expense in the period in which
termination takes place.
The Group evaluates non-lease arrangements such as
outsourcing and similar contracts to determine if they
contain a lease which is then accounted for separately.
When assets are transferred under a finance lease, including
assets under Islamic lease arrangements (e.g. Ijara Muntahia
Bittamleek or Ijara with ownership promise) (if applicable)
the present value of the lease payments is recognised as a
receivable and disclosed under “Financing”. The difference
between the gross receivable and the present value of the
receivable is recognised as unearned finance income. Lease
income is recognised over the term of the lease using the net
investment method, which reflects a constant periodic rate
of return.
(k) Cash and cash equivalents
For the purposes of the consolidated statement of cash flows,
‘cash and cash equivalents’ include notes and coins on hand,
balances with SAMA (excluding statutory deposits) and due
from banks and other financial institutions with original
maturity of 90 days or less from the date of acquisition which
are subject to insignificant risk of changes in their fair value.
(l) Short-term employee benefits
Short-term employee benefits are measured on an
undiscounted basis and are expensed as the related service
is provided.
(m) Special commission excluded from the consolidated
statement of income
In accordance with the Sharia Authority’s resolutions, special
commission income (non-Sharia compliant income) received
by the Bank, is excluded from the determination of financing
and investment income of the Bank, and is transferred to
other liabilities in the consolidated statement of financial
position and is subsequently paid-off to charities institution.
(n) Provisions for employees’ end of service benefits
The provision for employees’ end of service benefits is accrued
using actuarial valuation according to the regulations of Saudi
labour law and local regulatory requirements.
(o) Share-based payments
The Bank’s founders had established a share-based
compensation plan under which the entity receives services
from the eligible employees as consideration for equity
instruments of the Bank which are granted the employees.
(p) Mudaraba funds
The Group carries out Mudaraba transactions on behalf of its
customers, and are treated by the Group as being restricted
investments. These are included as off balance sheet items.
The Group’s share of profits from managing such funds is
included in the Group’s consolidated statement of income.
(q) Zakat
As per the SAMA Circular No. 381000074519 dated
11 April 2017 and subsequent amendments through certain
clarifications relating to the accounting for zakat and income
tax (“SAMA Circular”), the Zakat and Income tax are to be
accrued on a quarterly basis through shareholders equity
under retained earnings.
(r) Investment management services
The Bank provides investment management services to its
customers, through its subsidiary which include management
of certain mutual funds. Assets held in trust or in a fiduciary
capacity are not treated as assets of the Group and,
accordingly, are not included in the Group’s consolidated
financial statements. The Group’s share of these funds is
included under FVSI investments. Fees earned are disclosed
in the consolidated statement of income.

Notes to the Consolidated Financial Statements
An
nu
al
Re
po
rt
20
1814
9
About the BankAbout the Bank
Value DriversValue Drivers
LeadershipLeadership
StrategyStrategy
PerformancePerformance
Corporate GovernanceCorporate Governance
Financial ReportsFinancial Reports
Supplementary InformationSupplementary Information
(s) Bank’s products definition
The Bank provides its customers with banking products
based on interest avoidance concept and in accordance
with Sharia regulations. The following is a description of some
of the financing products:
Mutajara financing:
It is a financing agreement whereby the Bank purchases
a commodity or an asset and sells it to the client based on a
purchase promise from the client with a deferred price higher
than the cash price, accordingly the client becomes debtor to
the Bank with the sale amount and for the period agreed in
the contract.
Instalment sales financing:
It is a financing agreement whereby the Bank purchases
a commodity or an asset and sells it to the client based on a
purchase promise from the client with a deferred price higher
than the cash price. Accordingly the client becomes
a debtor to the Bank with the sale amount to be paid through
instalments as agreed in the contract.
Istisnaa financing:
It is a financing agreement whereby the Bank contracts to
manufacture a commodity with certain known and accurate
specifications according to the client’s request. The client
becomes a debtor to the Bank for the manufacturing price,
which includes cost plus profit.
Murabaha financing:
It is a financing agreement whereby the Bank purchases
a commodity or asset and sells it to the client with a price
representing the purchase price plus a profit known and
agreed by the client which means that the client is aware
of the cost and profit separately.
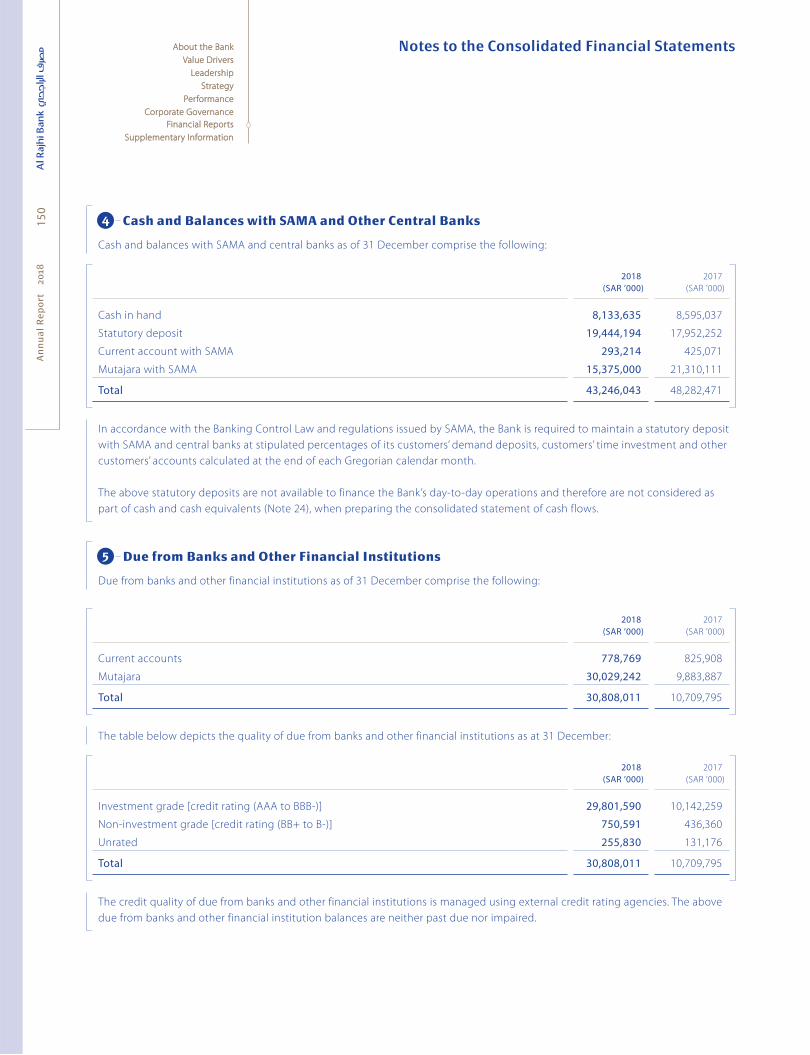
Notes to the Consolidated Financial StatementsA
nn
ua
l R
ep
ort
2
018
150
About the BankAbout the Bank
Value DriversValue Drivers
LeadershipLeadership
StrategyStrategy
PerformancePerformance
Corporate GovernanceCorporate Governance
Financial ReportsFinancial Reports
Supplementary InformationSupplementary Information
Cash and Balances with SAMA and Other Central Banks
Cash and balances with SAMA and central banks as of 31 December comprise the following:
2018(SAR ’000)
2017
(SAR ’000)
Cash in hand 8,133,635 8,595,037
Statutory deposit 19,444,194 17,952,252
Current account with SAMA 293,214 425,071
Mutajara with SAMA 15,375,000 21,310,111
Total 43,246,043 48,282,471
In accordance with the Banking Control Law and regulations issued by SAMA, the Bank is required to maintain a statutory deposit
with SAMA and central banks at stipulated percentages of its customers’ demand deposits, customers’ time investment and other
customers’ accounts calculated at the end of each Gregorian calendar month.
The above statutory deposits are not available to finance the Bank’s day-to-day operations and therefore are not considered as
part of cash and cash equivalents (Note 24), when preparing the consolidated statement of cash flows.
Due from Banks and Other Financial Institutions
Due from banks and other financial institutions as of 31 December comprise the following:
2018(SAR ’000)
2017
(SAR ’000)
Current accounts 778,769 825,908
Mutajara 30,029,242 9,883,887
Total 30,808,011 10,709,795
The table below depicts the quality of due from banks and other financial institutions as at 31 December:
2018(SAR ’000)
2017
(SAR ’000)
Investment grade [credit rating (AAA to BBB-)] 29,801,590 10,142,259
Non-investment grade [credit rating (BB+ to B-)] 750,591 436,360
Unrated 255,830 131,176
Total 30,808,011 10,709,795
The credit quality of due from banks and other financial institutions is managed using external credit rating agencies. The above
due from banks and other financial institution balances are neither past due nor impaired.
4
5

Notes to the Consolidated Financial Statements
An
nu
al
Re
po
rt
20
1815
1
About the BankAbout the Bank
Value DriversValue Drivers
LeadershipLeadership
StrategyStrategy
PerformancePerformance
Corporate GovernanceCorporate Governance
Financial ReportsFinancial Reports
Supplementary InformationSupplementary Information
Investments, Net
(a) Investments comprise the following as of 31 December:
2018(SAR ’000)
2017
(SAR ’000)
Investment in an associate 172,753 124,825
Investments held at amortised cost
Murabaha with Saudi Government and SAMA 22,477,145 23,452,869
Sukuk 17,395,957 10,605,139
Less: Impairment (Stage 1) (28,337) –
Total investments held at amortised cost 39,844,765 34,058,008
Investments held as FVSI
Equity investments – 23,487
Mutual funds 1,141,584 389,193
Sukuk 800,000 –
Total investments held as FVSI 1,941,584 412,680
FVOCI investments
Equity investments 1,103,463 771,293
Mutual funds – 1,034,286
Total FVOCI investments 1,103,463 1,805,579
Investments 43,062,565 36,401,092
The designated FVSI investments included above are designated upon initial recognition as FVSI are in accordance with the
documented risk management strategy of the Bank.
All investments held at amortised costs are neither past due nor impaired as of 31 December 2018.
Equity investment securities designated as at FVOCIEquity investment securities designated as at FVOCI
At 1 January 2018, the Bank designated its equity securities as at FVOCI. In 2017, these investments were classified as available
for sale and FVSI. The FVOCI designation was made because the investments are expected to be held for the long-term for
strategic purposes. The Bank does not hold these equity investments for trading purposes.
None of the material strategic investments were disposed of during 2018, and there were no transfers of any cumulative gain
or loss within equity relating to these investments.
6
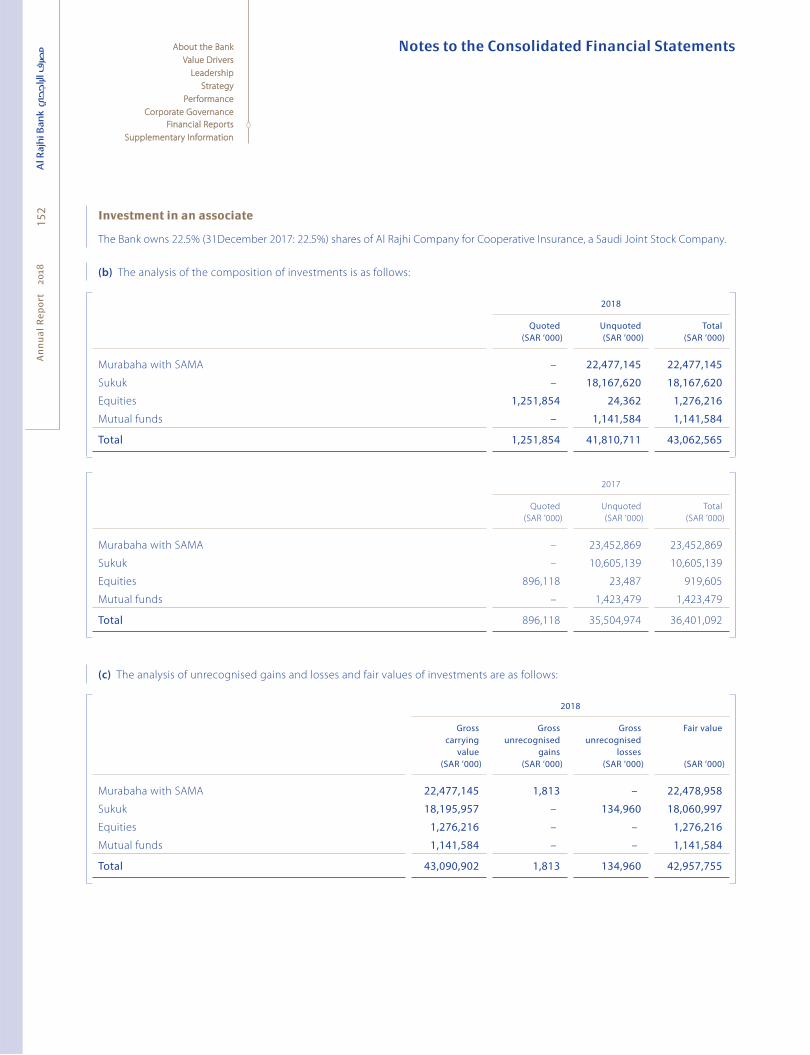
Notes to the Consolidated Financial StatementsA
nn
ua
l R
ep
ort
2
018
152
About the BankAbout the Bank
Value DriversValue Drivers
LeadershipLeadership
StrategyStrategy
PerformancePerformance
Corporate GovernanceCorporate Governance
Financial ReportsFinancial Reports
Supplementary InformationSupplementary Information
Investment in an associateInvestment in an associate
The Bank owns 22.5% (31December 2017: 22.5%) shares of Al Rajhi Company for Cooperative Insurance, a Saudi Joint Stock Company.
(b) The analysis of the composition of investments is as follows:
2018
Quoted(SAR ’000)
Unquoted(SAR ’000)
Total(SAR ’000)
Murabaha with SAMA – 22,477,145 22,477,145
Sukuk – 18,167,620 18,167,620
Equities 1,251,854 24,362 1,276,216
Mutual funds – 1,141,584 1,141,584
Total 1,251,854 41,810,711 43,062,565
2017
Quoted
(SAR ’000)
Unquoted
(SAR ’000)
Total
(SAR ’000)
Murabaha with SAMA – 23,452,869 23,452,869
Sukuk – 10,605,139 10,605,139
Equities 896,118 23,487 919,605
Mutual funds – 1,423,479 1,423,479
Total 896,118 35,504,974 36,401,092
(c) The analysis of unrecognised gains and losses and fair values of investments are as follows:
2018
Gross carrying
value(SAR ’000)
Gross unrecognised
gains(SAR ’000)
Gross unrecognised
losses (SAR ’000)
Fair value
(SAR ’000)
Murabaha with SAMA 22,477,145 1,813 – 22,478,958
Sukuk 18,195,957 – 134,960 18,060,997
Equities 1,276,216 – – 1,276,216
Mutual funds 1,141,584 – – 1,141,584
Total 43,090,902 1,813 134,960 42,957,755

Notes to the Consolidated Financial Statements
An
nu
al
Re
po
rt
20
1815
3
About the BankAbout the Bank
Value DriversValue Drivers
LeadershipLeadership
StrategyStrategy
PerformancePerformance
Corporate GovernanceCorporate Governance
Financial ReportsFinancial Reports
Supplementary InformationSupplementary Information
2017
Gross
carrying
value
(SAR ’000)
Gross
unrecognised
gains
(SAR ’000)
Gross
unrecognised
losses
(SAR ’000)
Fair value
(SAR ’000)
Murabaha with SAMA 23,452,869 6,984 – 23,459,853
Sukuk 10,605,139 – 45,503 10,559,636
Equities 919,605 – – 919,605
Mutual funds 1,423,479 – – 1,423,479
Total 36,401,092 6,984 45,503 36,362,573
(d) Credit quality of investments
2018(SAR ’000)
2017
(SAR ’000)
Murabaha with SAMA 22,477,145 23,452,869
Sukuk – Investment grade 18,195,957 10,605,139
Total 40,673,102 34,058,008
Investment grade includes those investments having credit exposure equivalent to Standard & Poor’s rating of AAA to BBB. The
unrated category only comprise unquoted sukuks. Fitch has assigned A+ rating to the KSA as a country, as at 31 December 2018.
(e) The following is an analysis of foreign investments according to investment categories as at 31 December:
2018(SAR ’000)
2017
(SAR ’000)
Investments held at amortised cost
Sukuk 1,539,271 1,545,059
Investments held as FVSI
Equity investments 21,282 21,300
Mutual funds 562,477 347,180
Total 2,123,030 1,913,539

Notes to the Consolidated Financial StatementsA
nn
ua
l R
ep
ort
2
018
154
About the BankAbout the Bank
Value DriversValue Drivers
LeadershipLeadership
StrategyStrategy
PerformancePerformance
Corporate GovernanceCorporate Governance
Financial ReportsFinancial Reports
Supplementary InformationSupplementary Information
(f ) The following is an analysis of investments according to counterparties as at 31 December:
2018(SAR ’000)
2017
(SAR ’000)
Government and quasi government 23,840,814 24,820,739
Companies 1,279,065 971,969
Banks and other financial institutions 16,829,439 9,184,905
Mutual funds 1,141,584 1,423,479
Less: Impairment (28,337) –
Net investments 43,062,565 36,401,092
Financing, Net
7.1 Financing7.1 Financing
(a) Net financing as of 31 December comprises the following:
2018
Performing
(SAR ’000)
Non-performing
(SAR ’000)
Allowance for impairment
(SAR ’000)
Net financing
(SAR ’000)
Mutajara 47,552,342 1,024,320 (2,562,159) 46,014,503
Instalment sale 175,407,901 591,541 (4,024,656) 171,974,786
Murabaha 14,671,326 662,570 (1,219,747) 14,114,149
Credit cards 1,973,379 11,881 (25,909) 1,959,351
Total 239,604,948 2,290,312 (7,832,471) 234,062,789
2017
Performing
(SAR ’000)
Non-performing
(SAR ’000)
Allowance for
impairment
(SAR ’000)
Net financing
(SAR ’000)
Mutajara 48,729,890 1,052,534 (2,387,590) 47,394,834
Instalment sale 172,631,262 521,289 (1,938,279) 171,214,272
Murabaha 15,058,355 175,196 (1,221,817) 14,011,734
Credit cards 901,097 21,160 (7,524) 914,733
Total 237,320,604 1,770,179 (5,555,210) 233,535,573
7
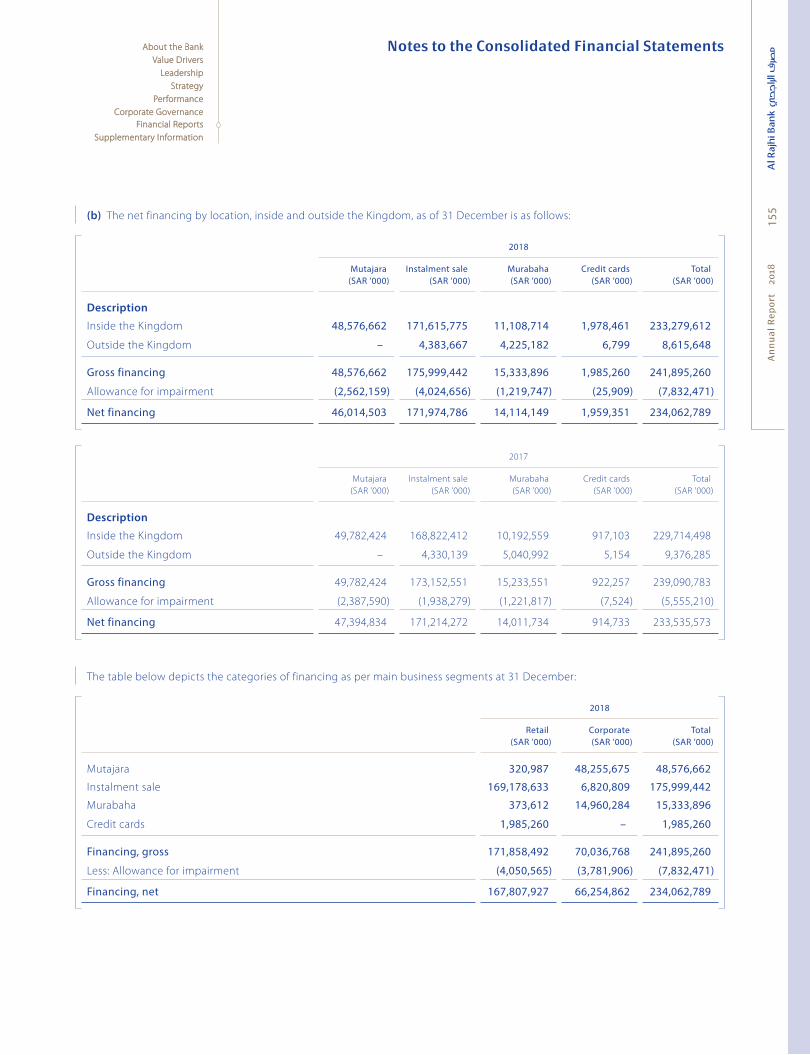
Notes to the Consolidated Financial Statements
An
nu
al
Re
po
rt
20
1815
5
About the BankAbout the Bank
Value DriversValue Drivers
LeadershipLeadership
StrategyStrategy
PerformancePerformance
Corporate GovernanceCorporate Governance
Financial ReportsFinancial Reports
Supplementary InformationSupplementary Information
(b) The net financing by location, inside and outside the Kingdom, as of 31 December is as follows:
2018
Mutajara(SAR ’000)
Instalment sale(SAR ’000)
Murabaha (SAR ’000)
Credit cards(SAR ’000)
Total(SAR ’000)
Description
Inside the Kingdom 48,576,662 171,615,775 11,108,714 1,978,461 233,279,612
Outside the Kingdom – 4,383,667 4,225,182 6,799 8,615,648
Gross financing 48,576,662 175,999,442 15,333,896 1,985,260 241,895,260
Allowance for impairment (2,562,159) (4,024,656) (1,219,747) (25,909) (7,832,471)
Net financing 46,014,503 171,974,786 14,114,149 1,959,351 234,062,789
2017
Mutajara
(SAR ’000)
Instalment sale
(SAR ’000)
Murabaha
(SAR ’000)
Credit cards
(SAR ’000)
Total
(SAR ’000)
Description
Inside the Kingdom 49,782,424 168,822,412 10,192,559 917,103 229,714,498
Outside the Kingdom – 4,330,139 5,040,992 5,154 9,376,285
Gross financing 49,782,424 173,152,551 15,233,551 922,257 239,090,783
Allowance for impairment (2,387,590) (1,938,279) (1,221,817) (7,524) (5,555,210)
Net financing 47,394,834 171,214,272 14,011,734 914,733 233,535,573
The table below depicts the categories of financing as per main business segments at 31 December:
2018
Retail(SAR ’000)
Corporate(SAR ’000)
Total (SAR ’000)
Mutajara 320,987 48,255,675 48,576,662
Instalment sale 169,178,633 6,820,809 175,999,442
Murabaha 373,612 14,960,284 15,333,896
Credit cards 1,985,260 – 1,985,260
Financing, gross 171,858,492 70,036,768 241,895,260
Less: Allowance for impairment (4,050,565) (3,781,906) (7,832,471)
Financing, net 167,807,927 66,254,862 234,062,789167,807,927 66,254,862 234,062,789

Notes to the Consolidated Financial StatementsA
nn
ua
l R
ep
ort
2
018
156
About the BankAbout the Bank
Value DriversValue Drivers
LeadershipLeadership
StrategyStrategy
PerformancePerformance
Corporate GovernanceCorporate Governance
Financial ReportsFinancial Reports
Supplementary InformationSupplementary Information
2017
Retail
(SAR ’000)
Corporate
(SAR ’000)
Total
(SAR ’000)
Mutajara 132,645 49,649,779 49,782,424
Instalment sale 164,893,047 8,259,504 173,152,551
Murabaha 414,109 14,819,442 15,233,551
Credit cards 922,257 – 922,257
Financing, gross 166,362,058 72,728,725 239,090,783
Less: Allowance for impairment (2,023,434) (3,531,776) (5,555,210)
Financing, net 164,338,624 69,196,949 233,535,573164,338,624 69,196,949 233,535,573
(c) The table below summarises financing balances at 31 December that are neither past due nor impaired, past due but not
impaired and impaired, as per the main business segments of the Group:
2018
Neither past due nor impaired
(SAR ’000)
Past due but not impaired(SAR ’000)
Impaired
(SAR ’000)
Total
(SAR ’000)
Allowance for impairment
(SAR ’000)
Net financing
(SAR ’000)
Retail 170,978,735 276,300 603,457 171,858,492 (4,050,565) 167,807,927
Corporate 62,082,584 6,267,329 1,686,855 70,036,768 (3,781,906) 66,254,862
Total 233,061,319 6,543,629 2,290,312 241,895,260 (7,832,471) 234,062,789
2017
Neither past due
nor impaired
(SAR ’000)
Past due but not
impaired
(SAR ’000)
Impaired
(SAR ’000)
Total
(SAR ’000)
Allowance for
impairment
(SAR ’000)
Net financing
(SAR ’000)
Retail 165,405,592 414,018 542,448 166,362,058 (2,023,434) 164,338,624
Corporate 67,503,558 3,997,436 1,227,731 72,728,725 (3,531,776) 69,196,949
Total 232,909,150 4,411,454 1,770,179 239,090,783 (5,555,210) 233,535,573
Financing past due for less than 90 days is not treated as impaired, unless other available information proves otherwise.
“Neither past due nor impaired” and “past due but not impaired” comprise total performing financing.
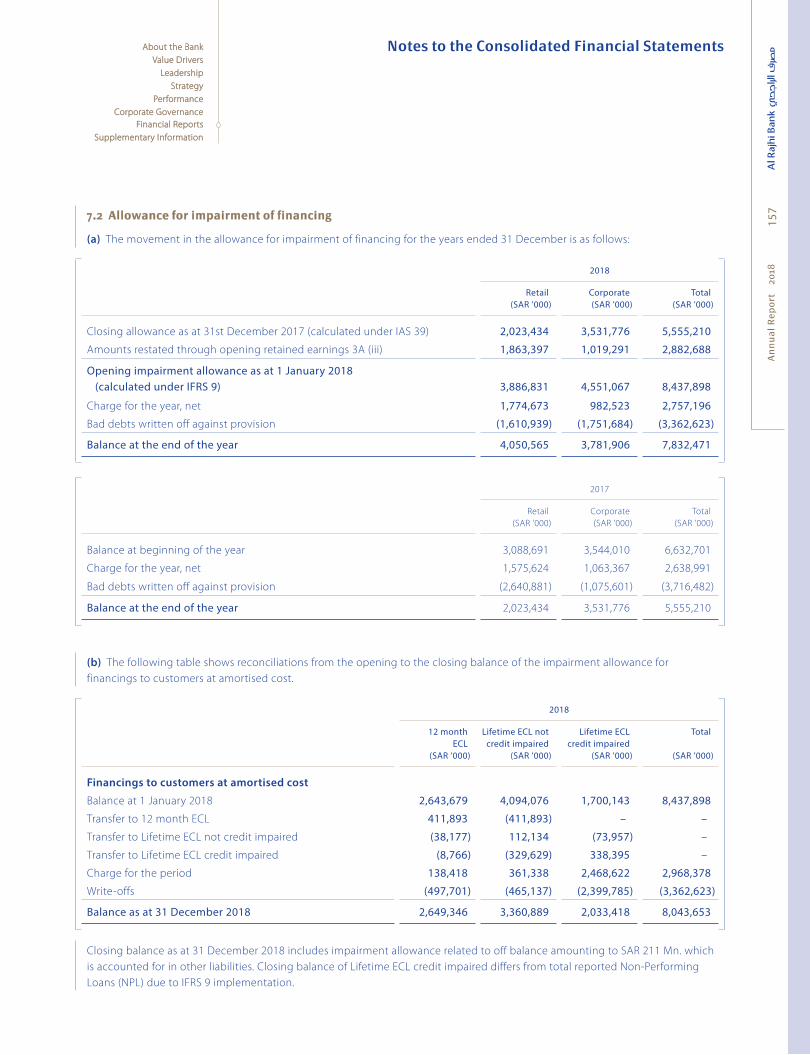
Notes to the Consolidated Financial Statements
An
nu
al
Re
po
rt
20
1815
7
About the BankAbout the Bank
Value DriversValue Drivers
LeadershipLeadership
StrategyStrategy
PerformancePerformance
Corporate GovernanceCorporate Governance
Financial ReportsFinancial Reports
Supplementary InformationSupplementary Information
7.2 Allowance for impairment of financing7.2 Allowance for impairment of financing
(a) The movement in the allowance for impairment of financing for the years ended 31 December is as follows:
2018
Retail(SAR ’000)
Corporate(SAR ’000)
Total (SAR ’000)
Closing allowance as at 31st December 2017 (calculated under IAS 39) 2,023,434 3,531,776 5,555,210
Amounts restated through opening retained earnings 3A (iii) 1,863,397 1,019,291 2,882,688
Opening impairment allowance as at 1 January 2018 (calculated under IFRS 9) 3,886,831 4,551,067 8,437,898
Charge for the year, net 1,774,673 982,523 2,757,196
Bad debts written off against provision (1,610,939) (1,751,684) (3,362,623)
Balance at the end of the year 4,050,565 3,781,906 7,832,471167,807,927 66,254,862 234,062,789
2017
Retail
(SAR ’000)
Corporate
(SAR ’000)
Total
(SAR ’000)
Balance at beginning of the year 3,088,691 3,544,010 6,632,701
Charge for the year, net 1,575,624 1,063,367 2,638,991
Bad debts written off against provision (2,640,881) (1,075,601) (3,716,482)
Balance at the end of the year 2,023,434 3,531,776 5,555,210164,338,624 69,196,949 233,535,573
(b) The following table shows reconciliations from the opening to the closing balance of the impairment allowance for
financings to customers at amortised cost.
2018
12 monthECL
(SAR ’000)
Lifetime ECL not credit impaired
(SAR ’000)
Lifetime ECL credit impaired
(SAR ’000)
Total
(SAR ’000)
Financings to customers at amortised cost
Balance at 1 January 2018 2,643,679 4,094,076 1,700,143 8,437,898
Transfer to 12 month ECL 411,893 (411,893) – –
Transfer to Lifetime ECL not credit impaired (38,177) 112,134 (73,957) –
Transfer to Lifetime ECL credit impaired (8,766) (329,629) 338,395 –
Charge for the period 138,418 361,338 2,468,622 2,968,378
Write-offs (497,701) (465,137) (2,399,785) (3,362,623)
Balance as at 31 December 2018 2,649,346 3,360,889 2,033,418 8,043,6533,360,889 2,033,418 8,043,653
Closing balance as at 31 December 2018 includes impairment allowance related to off balance amounting to SAR 211 Mn. which
is accounted for in other liabilities. Closing balance of Lifetime ECL credit impaired differs from total reported Non-Performing
Loans (NPL) due to IFRS 9 implementation.
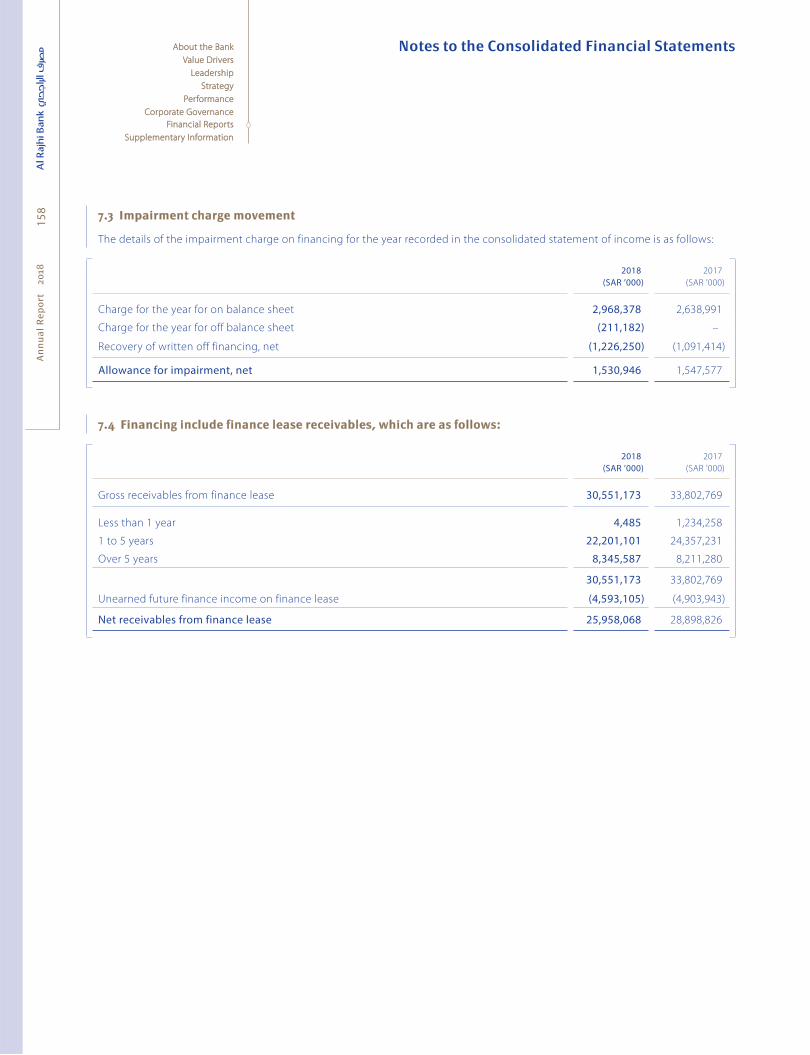
Notes to the Consolidated Financial StatementsA
nn
ua
l R
ep
ort
2
018
158
About the BankAbout the Bank
Value DriversValue Drivers
LeadershipLeadership
StrategyStrategy
PerformancePerformance
Corporate GovernanceCorporate Governance
Financial ReportsFinancial Reports
Supplementary InformationSupplementary Information
7.3 Impairment charge movement7.3 Impairment charge movement
The details of the impairment charge on financing for the year recorded in the consolidated statement of income is as follows:
2018(SAR ’000)
2017
(SAR ’000)
Charge for the year for on balance sheet 2,968,378 2,638,991
Charge for the year for off balance sheet (211,182) –
Recovery of written off financing, net (1,226,250) (1,091,414)
Allowance for impairment, net 1,530,946 1,547,577
7.4 Financing include finance lease receivables, which are as follows:7.4 Financing include finance lease receivables, which are as follows:
2018(SAR ’000)
2017
(SAR ’000)
Gross receivables from finance lease 30,551,173 33,802,769
Less than 1 year 4,485 1,234,258
1 to 5 years 22,201,101 24,357,231
Over 5 years 8,345,587 8,211,280
30,551,173 33,802,769
Unearned future finance income on finance lease (4,593,105) (4,903,943)
Net receivables from finance lease 25,958,068 28,898,826

Notes to the Consolidated Financial Statements
An
nu
al
Re
po
rt
20
1815
9
About the BankAbout the Bank
Value DriversValue Drivers
LeadershipLeadership
StrategyStrategy
PerformancePerformance
Corporate GovernanceCorporate Governance
Financial ReportsFinancial Reports
Supplementary InformationSupplementary Information
Property and Equipment, Net
Property and equipment, net comprises the following as of 31 December:
Land
(SAR ’000)
Buildings
(SAR ’000)
Leasehold land
and buildings
improvements
(SAR ’000)
Equipment and
furniture
(SAR ’000)
Total2018
(SAR ’000)
Cost
At 1 January 2017 2,009,863 3,219,265 932,383 4,533,276 10,694,787
Additions 310,996 459,651 9,288 1,034,027 1,813,962
Disposals (263) (429) – (39,284) (39,976)
At 31 December 2017 2,320,596 3,678,487 941,671 5,528,019 12,468,773
Additions 23,229 502,482 34,242 959,949 1,519,902
Disposals – – (26,159) (35,391) (61,550)
At 31 December 2018 2,343,825 4,180,969 949,754 6,452,577 13,927,125
Accumulated depreciation
At 1 January 2017 – 352,187 888,632 2,968,806 4,209,625
Charge for the year – 58,684 14,403 367,479 440,566
Disposals – (430) – (39,115) (39,545)
At 31 December 2017 – 410,441 903,035 3,297,170 4,610,646
Charge for the year – 65,388 13,628 363,155 442,171
Disposals – – – (23,279) (23,279)
At 31 December 2018 – 475,829 916,663 3,637,046 5,029,538
Net book value
At 31 December 2018 2,343,825 3,705,140 33,091 2,815,531 8,897,587
At 31 December 2017 2,320,596 3,268,046 38,636 2,230,849 7,858,127
Buildings include work-in-progress amounting to SAR 2,172 Mn. as at 31 December 2018 (2017: SAR 1,803 Mn.).
Equipment and furniture includes information technology-related assets having net book value of SAR 2,573 Mn. as at
31 December 2018 (2017: SAR 2,082 Mn.).
Investment Properties, Net
Investment properties consist of properties acquired by the Group in the year 2016. The net book value of the investment
properties approximates the fair value.
8
9
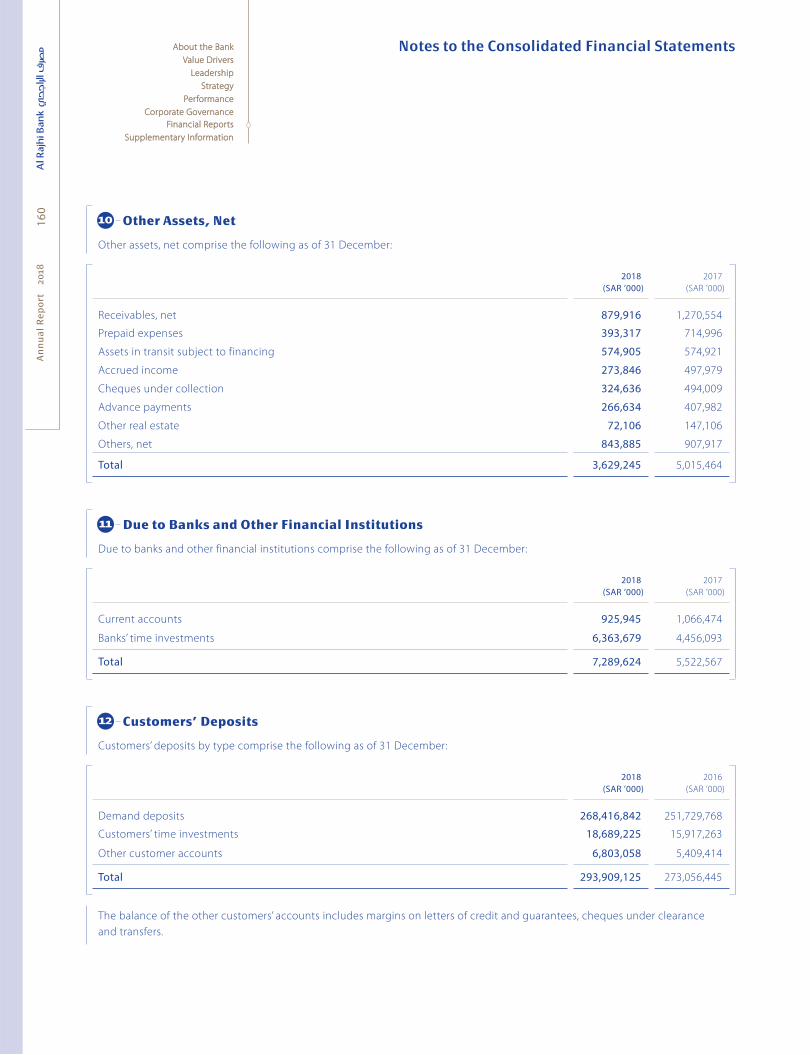
Notes to the Consolidated Financial StatementsA
nn
ua
l R
ep
ort
2
018
160
About the BankAbout the Bank
Value DriversValue Drivers
LeadershipLeadership
StrategyStrategy
PerformancePerformance
Corporate GovernanceCorporate Governance
Financial ReportsFinancial Reports
Supplementary InformationSupplementary Information
Other Assets, Net
Other assets, net comprise the following as of 31 December:
2018(SAR ’000)
2017
(SAR ’000)
Receivables, net 879,916 1,270,554
Prepaid expenses 393,317 714,996
Assets in transit subject to financing 574,905 574,921
Accrued income 273,846 497,979
Cheques under collection 324,636 494,009
Advance payments 266,634 407,982
Other real estate 72,106 147,106
Others, net 843,885 907,917
Total 3,629,245 5,015,464
Due to Banks and Other Financial Institutions
Due to banks and other financial institutions comprise the following as of 31 December:
2018(SAR ’000)
2017
(SAR ’000)
Current accounts 925,945 1,066,474
Banks’ time investments 6,363,679 4,456,093
Total 7,289,624 5,522,567
Customers’ Deposits
Customers’ deposits by type comprise the following as of 31 December:
2018(SAR ’000)
2016
(SAR ’000)
Demand deposits 268,416,842 251,729,768
Customers’ time investments 18,689,225 15,917,263
Other customer accounts 6,803,058 5,409,414
Total 293,909,125 273,056,445
The balance of the other customers’ accounts includes margins on letters of credit and guarantees, cheques under clearance
and transfers.
10
11
12

Notes to the Consolidated Financial Statements
An
nu
al
Re
po
rt
20
1816
1
About the BankAbout the Bank
Value DriversValue Drivers
LeadershipLeadership
StrategyStrategy
PerformancePerformance
Corporate GovernanceCorporate Governance
Financial ReportsFinancial Reports
Supplementary InformationSupplementary Information
Customers’ deposits by currency comprise the following as of 31 December:
2018(SAR ’000)
2016
(SAR ’000)
Saudi Arabian Riyals 282,460,829 260,388,240
Foreign currencies 11,448,296 12,668,205
Total 293,909,125 273,056,445
Other Liabilities
Other liabilities comprise the following as of 31 December:
2018(SAR ’000)
2017
(SAR ’000)
Accounts payable 3,602,605 3,436,195
Provision for employees’ end of service benefits (see Note 25) 901,970 848,422
Accrued expenses 974,599 837,597
Charities (see Note 31) 56,350 16,854
Zakat payable 6,348,660 –
Other 3,366,879 3,647,530
Total 15,251,063 8,786,598
Share Capital
The authorised, issued and fully paid share capital of the Bank consists of 1,625 million shares of SAR 10 each (2017: 1,625 million
shares of SAR 10 each).
Statutory and Other Reserves
The Banking Control Law in Saudi Arabia and the By-Laws of the Bank require a transfer to statutory reserve at a minimum of 25%
of the annual net income for the year. Such transfers continue until the reserve equals the paid up share capital. This reserve is
presently not available for distribution.
Previously, the Bank was recording the amount of Zakat it calculates in other reserves until the final amount of Zakat payable
can be determined.
13
14
15
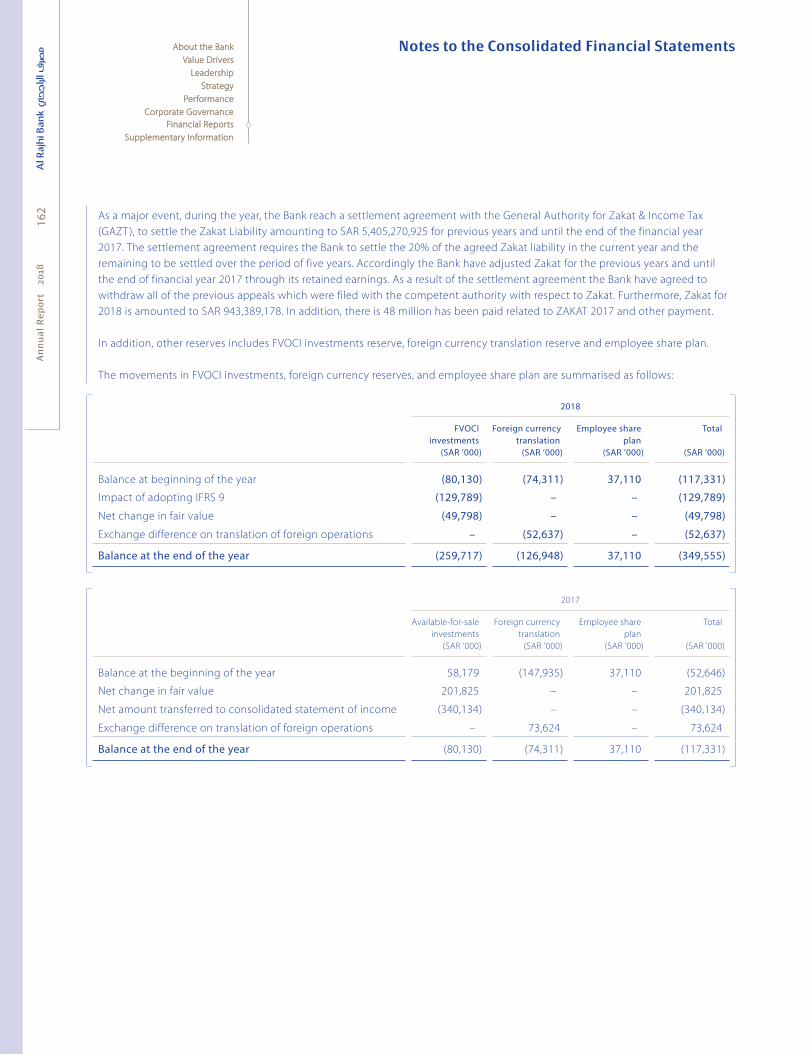
Notes to the Consolidated Financial StatementsA
nn
ua
l R
ep
ort
2
018
162
About the BankAbout the Bank
Value DriversValue Drivers
LeadershipLeadership
StrategyStrategy
PerformancePerformance
Corporate GovernanceCorporate Governance
Financial ReportsFinancial Reports
Supplementary InformationSupplementary Information
As a major event, during the year, the Bank reach a settlement agreement with the General Authority for Zakat & Income Tax
(GAZT), to settle the Zakat Liability amounting to SAR 5,405,270,925 for previous years and until the end of the financial year
2017. The settlement agreement requires the Bank to settle the 20% of the agreed Zakat liability in the current year and the
remaining to be settled over the period of five years. Accordingly the Bank have adjusted Zakat for the previous years and until
the end of financial year 2017 through its retained earnings. As a result of the settlement agreement the Bank have agreed to
withdraw all of the previous appeals which were filed with the competent authority with respect to Zakat. Furthermore, Zakat for
2018 is amounted to SAR 943,389,178. In addition, there is 48 million has been paid related to ZAKAT 2017 and other payment.
In addition, other reserves includes FVOCI investments reserve, foreign currency translation reserve and employee share plan.
The movements in FVOCI investments, foreign currency reserves, and employee share plan are summarised as follows:
2018
FVOCI investments
(SAR ’000)
Foreign currency translation
(SAR ’000)
Employee shareplan
(SAR ’000)
Total
(SAR ’000)
Balance at beginning of the year (80,130) (74,311) 37,110 (117,331)
Impact of adopting IFRS 9 (129,789) – – (129,789)
Net change in fair value (49,798) – – (49,798)
Exchange difference on translation of foreign operations – (52,637) – (52,637)
Balance at the end of the year (259,717) (126,948) 37,110 (349,555)
2017
Available-for-sale
investments
(SAR ’000)
Foreign currency
translation
(SAR ’000)
Employee share
plan
(SAR ’000)
Total
(SAR ’000)
Balance at the beginning of the year 58,179 (147,935) 37,110 (52,646)
Net change in fair value 201,825 – – 201,825
Net amount transferred to consolidated statement of income (340,134) – – (340,134)
Exchange difference on translation of foreign operations – 73,624 – 73,624
Balance at the end of the year (80,130) (74,311) 37,110 (117,331)

Notes to the Consolidated Financial Statements
An
nu
al
Re
po
rt
20
1816
3
About the BankAbout the Bank
Value DriversValue Drivers
LeadershipLeadership
StrategyStrategy
PerformancePerformance
Corporate GovernanceCorporate Governance
Financial ReportsFinancial Reports
Supplementary InformationSupplementary Information
Commitments and Contingencies
(a) Legal proceedings(a) Legal proceedings
As at 31 December 2018, there were certain legal proceedings outstanding against the Bank in the normal course of business
including those relating to the extension of credit facilities. Such proceedings are being reviewed by the concerned parties.
Provisions have been made for some of these legal cases based on the assessment of the Bank’s legal advisors.
(b) Capital commitments(b) Capital commitments
As at 31 December 2018, the Bank had capital commitments of SAR 170 million (2017: SAR 629 million) relating to contracts for
computer software update and development, and SAR 65 million (2017: SAR 410 million) relating to building new workstation,
and development and improvement of new and existing branches.
(c) Credit related commitments and contingencies(c) Credit related commitments and contingencies
The primary purpose of these instruments is to ensure that funds are available to customers as required. Credit related
commitments and contingencies mainly comprise letters of guarantee, standby letters of credit, acceptances and unused
commitments to extend credit. Guarantees and standby letters of credit, which represent irrevocable assurances that the Bank
will make payments in the event that a customer cannot meet his obligations to third parties, carry the same credit risk as
financing.
Letters of credit, which are written undertakings by the Bank on behalf of a customer authorising a third party to draw drafts on
the Bank up to a stipulated amount under specific terms and conditions, are collateralised by the underlying shipments of goods
to which they relate, and therefore, carry less risk. Acceptances comprise undertakings by the Bank to pay bills of exchange
drawn on customers. The Bank expects most acceptances to be presented before being reimbursed by the customers.
Cash requirements under guarantees and letters of credit are considerably less than the amount of the commitment because the
Bank does not expect the third party to draw necessarily funds under the agreement.
Commitments to extend credit represent unused portions of authorisation to extended credit, principally in the form of
financing, guarantees and letters of credit.
(d) Credit related commitments and contingencies(d) Credit related commitments and contingencies
With respect to credit risk relating to commitments to extend unused credit, the Bank is potentially exposed to a loss in an
amount which is equal to the total unused commitments. The likely amount of loss, which cannot be reasonably estimated, is
expected to be considerably less than the total unused commitments, since most commitments to extend credit are contingent
upon customers maintaining specific credit standards. The total outstanding commitments to extend credit do not necessarily
represent future cash requirements, as many of these commitments could expire without being funded.
16

Notes to the Consolidated Financial StatementsA
nn
ua
l R
ep
ort
2
018
164
About the BankAbout the Bank
Value DriversValue Drivers
LeadershipLeadership
StrategyStrategy
PerformancePerformance
Corporate GovernanceCorporate Governance
Financial ReportsFinancial Reports
Supplementary InformationSupplementary Information
1.1. The contractual maturities of the Bank’s commitments and contingent liabilities are as follows at 31 December:
2018
Less than 3 months
(SAR ’000)
From 3 to 12 months
(SAR ’000)
From 1 to 5 years
(SAR ’000)
Over 5 years
(SAR ’000)
Total
(SAR ’000)
Letters of credit 562,899 417,925 1,945 – 982,769
Acceptances 261,183 208,706 – – 469,889
Letters of guarantee 1,270,202 2,405,041 1,159,962 41,956 4,877,161
Irrevocable commitments to extend credit 2,459,684 2,901,726 855,965 265,061 6,482,436
Total 4,553,968 5,933,398 2,017,872 307,017 12,812,255
2017
Less than 3
months
(SAR ’000)
From 3 to 12
months
(SAR ’000)
From 1 to 5
years
(SAR ’000)
Over 5
years
(SAR ’000)
Total
(SAR ’000)
Letters of credit 1,027,240 82,382 68,626 – 1,178,248
Acceptances 313,137 117,327 – – 430,464
Letters of guarantee 1,790,856 1,986,680 1,183,423 8,396 4,969,355
Irrevocable commitments to extend credit 875,279 2,983,742 2,969,064 161,284 6,989,369
Total 4,006,512 5,170,131 4,221,113 169,680 13,567,436
2.2. The analysis of commitments and contingencies by counterparty is as follows as at 31 December:
2018(SAR ’000)
2017
(SAR ’000)
Corporates 11,704,696 10,728,656
Banks and other financial institutions 1,107,559 2,838,780
Total 12,812,255 13,567,436
(d) Operating lease commitments(d) Operating lease commitments
The future minimum lease payments under non-cancelable operating leases, where the Bank is the lessee, are as follows as at
31 December:
2018(SAR ’000)
2017
(SAR ’000)
Less than 1 year 400 41,163
1 to 5 years 234,652 197,712
Over 5 years 52,458 56,362
Total 287,510 295,237
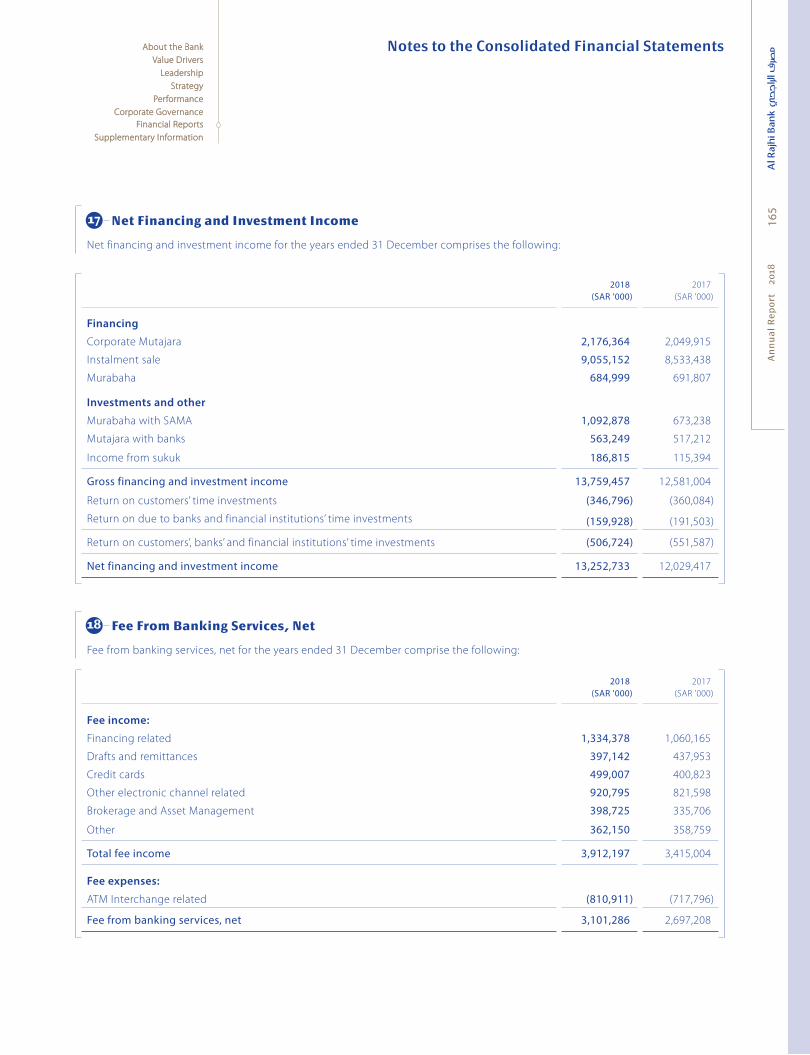
Notes to the Consolidated Financial Statements
An
nu
al
Re
po
rt
20
1816
5
About the BankAbout the Bank
Value DriversValue Drivers
LeadershipLeadership
StrategyStrategy
PerformancePerformance
Corporate GovernanceCorporate Governance
Financial ReportsFinancial Reports
Supplementary InformationSupplementary Information
Net Financing and Investment Income
Net financing and investment income for the years ended 31 December comprises the following:
2018(SAR ’000)
2017
(SAR ’000)
Financing
Corporate Mutajara 2,176,364 2,049,915
Instalment sale 9,055,152 8,533,438
Murabaha 684,999 691,807
Investments and other
Murabaha with SAMA 1,092,878 673,238
Mutajara with banks 563,249 517,212
Income from sukuk 186,815 115,394
Gross financing and investment income 13,759,457 12,581,004
Return on customers’ time investments (346,796) (360,084)
Return on due to banks and financial institutions’ time investments (159,928) (191,503)
Return on customers’, banks’ and financial institutions’ time investments (506,724) (551,587)
Net financing and investment income 13,252,733 12,029,41713,252,733
Fee From Banking Services, Net
Fee from banking services, net for the years ended 31 December comprise the following:
2018(SAR ’000)
2017
(SAR ’000)
Fee income:
Financing related 1,334,378 1,060,165
Drafts and remittances 397,142 437,953
Credit cards 499,007 400,823
Other electronic channel related 920,795 821,598
Brokerage and Asset Management 398,725 335,706
Other 362,150 358,759
Total fee income 3,912,197 3,415,004
Fee expenses:
ATM Interchange related (810,911) (717,796)
Fee from banking services, net 3,101,286 2,697,208
17
18

Notes to the Consolidated Financial StatementsA
nn
ua
l R
ep
ort
2
018
166
About the BankAbout the Bank
Value DriversValue Drivers
LeadershipLeadership
StrategyStrategy
PerformancePerformance
Corporate GovernanceCorporate Governance
Financial ReportsFinancial Reports
Supplementary InformationSupplementary Information
Other Operating Income
Other operating income for the years ended 31 December comprises the following:
2018(SAR ’000)
2017
(SAR ’000)
Dividend income 39,852 30,176
(Loss)/Gain on sale of property and equipment, net (115) 594
Rental income from investment property 115,280 81,592
Share in earnings of associate 47,928 35,545
Gain/(loss) on investments held as FVSI 14,600 12,635
Income from sale of various investments – 3,374
Loss on sale of other real state (32,000) –
Gain on sale of equity investment – 72,144
Other income, net 24,150 100,330
Total 209,695 336,390
Salaries and Employees’ Related Benefits
The following tables provide an analysis of the salaries and employees’ related benefits for the years ended 31 December:
2018
Variable compensations paid
Number of employees
Fixed compensation
(SAR ’000)
Cash
(SAR ’000)
Shares
Executives 17 31,515 18,352 35,712
Employees engaged in risk-taking activities 1,460 391,876 57,459 15,818
Employees engaged in control functions 463 146,484 32,964 15,534
Other employees 11,592 1,876,868 197,110 18,360
Total 13,532 2,446,743 305,885 85,424
Accrued fixed compensations in 2018 148,136 – –
Other employees’ costs 214,570 – –
Gross total 13,532 2,809,449 305,885 85,424
19
20

Notes to the Consolidated Financial Statements
An
nu
al
Re
po
rt
20
1816
7
About the BankAbout the Bank
Value DriversValue Drivers
LeadershipLeadership
StrategyStrategy
PerformancePerformance
Corporate GovernanceCorporate Governance
Financial ReportsFinancial Reports
Supplementary InformationSupplementary Information
2017
Variable compensations paid
Number of
employees
Fixed
compensation
(SAR ’000)
Cash
(SAR ’000)
Shares
Executives 18 29,328 18,588 30,577
Employees engaged in risk-taking activities 1,486 384,212 63,815 17,155
Employees engaged in control functions 363 169,956 27,097 12,221
Other employees 11,210 1,769,152 171,720 17,468
Total 13,077 2,352,648 281,220 77,421
Accrued fixed compensations in 2018 241,622 – –
Other employees’ costs 219,648 – –
Gross total 13,077 2,813,918 281,220 77,42113,684 2,873,687 286,329 6,797
Salaries and employees’ related benefits include end of services, General Organisation for Social Insurance, business trips, training
and other benefits.
As the Kingdom of Saudi Arabia is part of the G-20, instructions were given to all financial institutions in the Kingdom to comply
with the standards and principles of Basel II and the Financial Stability Board.
SAMA, as the regulatory for financial institutions in Saudi Arabia, issued regulations on compensations and bonus in accordance
with the standards and principles of Basel II and the Financial Stability Board.
In light of the above SAMA’s regulations, the Bank issued compensation and bonuses policy which was implemented after the
Board of Directors approval.
The scope of this policy is extended to include the Bank and its subsidiary companies (local and international) that are operating
in the financial service sector. Accordingly, it includes all official employees, permanent and temporary contracted employees
and service providers (contribution in risk position if SAMA allows the use of external resources).
For consistency with other banking institutions in the Kingdom of Saudi Arabia, the Bank has used a combination of fixed and
variable compensation to attract and maintain talent. The fixed compensation is assessed on a yearly basis by comparing it to
other local banks in the Kingdom of Saudi Arabia including the basic salaries, allowance and benefits which is related to the
employees’ ranks. The variable compensation is related to the employees performance and their compatibility to achieve the
agreed on objectives. It includes incentives, performance bonus and other benefits. Incentives are mainly paid to branches’
employees whereby the performance bonuses are paid to head office employees and others who do not qualify for incentives.
These bonuses and compensation are approved by the Board of Directors as a percentage of the Bank’s income.

Notes to the Consolidated Financial StatementsA
nn
ua
l R
ep
ort
2
018
168
About the BankAbout the Bank
Value DriversValue Drivers
LeadershipLeadership
StrategyStrategy
PerformancePerformance
Corporate GovernanceCorporate Governance
Financial ReportsFinancial Reports
Supplementary InformationSupplementary Information
Other General and Administrative Expenses
Other general and administrative expenses for the years ended 31 December comprises the following:
2018(SAR ’000)
2017
(SAR ’000)
Communications & Utilities Expenses 356,061 310,007
Maintenance & Security Expenses 415,660 400,168
Cash Feeding & Transfer Expenses 327,112 329,331
Software & IT Support Expenses 178,317 161,396
Other Operational Expenses 648,368 470,150
Total 1,925,518 1,671,052
Earnings Per Share
Earnings per share for the years ended 31 December 2018 and 2017 have been calculated by dividing the net income for the year
by the weighted average number of shares outstanding. The weighted average number of ordinary shares outstanding during
the year is the number of ordinary shares outstanding at the beginning of the year, adjusted by the number of ordinary shares
bought back or issued during the period multiplied by a time-weighting factor, if any. The time-weighting factor is the number
of days that the shares are outstanding as a proportion of the total number of days in the year.
Paid and Proposed Gross Dividends and Zakat
The Bank distributed dividends for the first half of 2018 amounting to SAR 3,250,000 thousand (i.e. SAR 2 per share)
(2017: SAR 2,437,500 thousand (i.e. SAR 1.5 per share). Also the Bank proposed final dividends for the year 2018 amounting to
SAR 3,656,250 thousand (i.e. SAR 2.25 per share) (2017: SAR 4,062,500 thousand i.e. SAR 2.5 per share).
Cash and Cash Equivalents
Cash and cash equivalents included in the consolidated statement of cash flows comprise the following:
2018(SAR ’000)
2017
(SAR ’000)
Cash in hand 8,133,635 8,595,037
Due from banks and other financial institutions maturing within 90 days from the date
of purchased 5,984,654 891,976
Balances with SAMA and other central banks (current accounts) 293,214 425,071
Mutajara with SAMA 15,375,000 21,310,111
Total 29,786,503 31,222,195
21
22
23
24
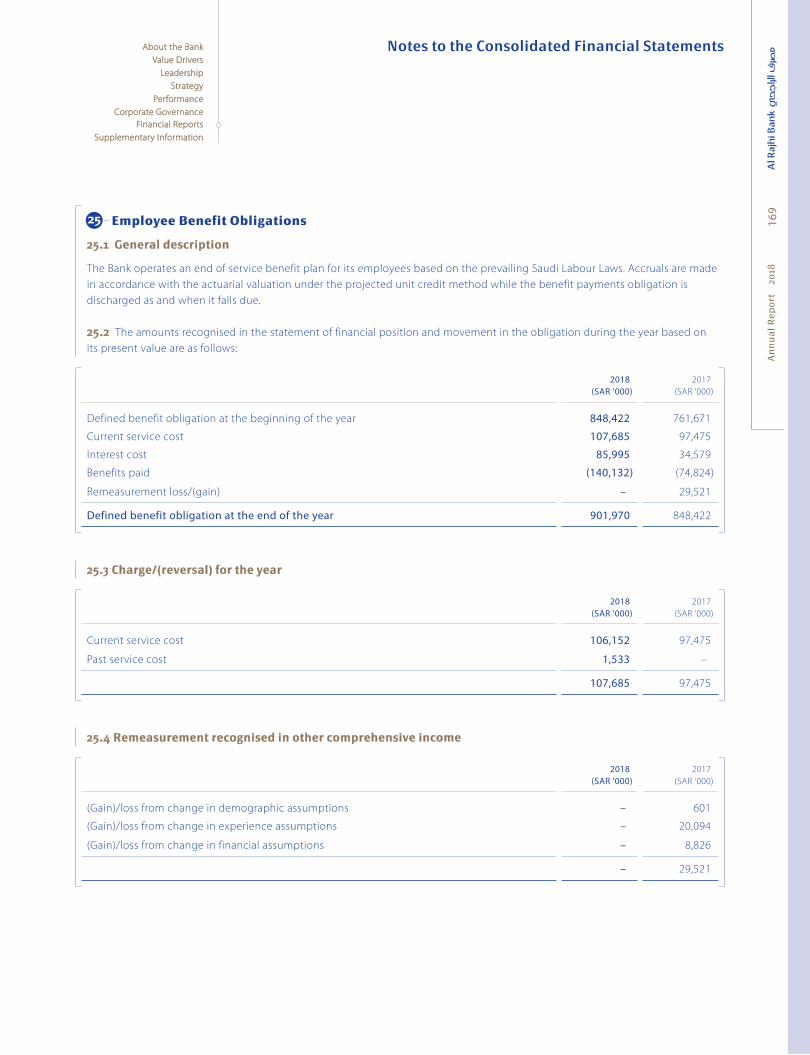
Notes to the Consolidated Financial Statements
An
nu
al
Re
po
rt
20
1816
9
About the BankAbout the Bank
Value DriversValue Drivers
LeadershipLeadership
StrategyStrategy
PerformancePerformance
Corporate GovernanceCorporate Governance
Financial ReportsFinancial Reports
Supplementary InformationSupplementary Information
Employee Benefit Obligations
25.1 General description25.1 General description
The Bank operates an end of service benefit plan for its employees based on the prevailing Saudi Labour Laws. Accruals are made
in accordance with the actuarial valuation under the projected unit credit method while the benefit payments obligation is
discharged as and when it falls due.
25.2 25.2 The amounts recognised in the statement of financial position and movement in the obligation during the year based on
its present value are as follows:
2018(SAR ’000)
2017
(SAR ’000)
Defined benefit obligation at the beginning of the year 848,422 761,671
Current service cost 107,685 97,475
Interest cost 85,995 34,579
Benefits paid (140,132) (74,824)
Remeasurement loss/(gain) – 29,521
Defined benefit obligation at the end of the year 901,970 848,422
25.3 Charge/(reversal) for the year25.3 Charge/(reversal) for the year
2018(SAR ’000)
2017
(SAR ’000)
Current service cost 106,152 97,475
Past service cost 1,533 –
107,685 97,475
25.4 Remeasurement recognised in other comprehensive income25.4 Remeasurement recognised in other comprehensive income
2018(SAR ’000)
2017
(SAR ’000)
(Gain)/loss from change in demographic assumptions – 601
(Gain)/loss from change in experience assumptions – 20,094
(Gain)/loss from change in financial assumptions – 8,826
– 29,521
25
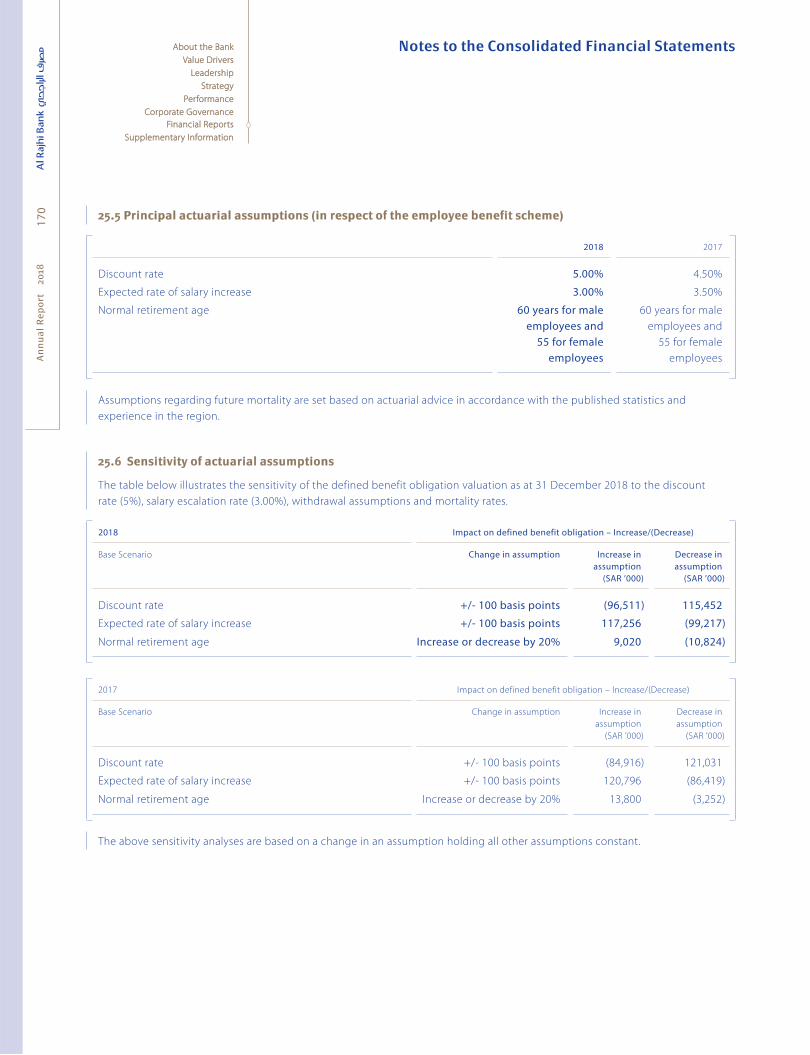
Notes to the Consolidated Financial StatementsA
nn
ua
l R
ep
ort
2
018
170
About the BankAbout the Bank
Value DriversValue Drivers
LeadershipLeadership
StrategyStrategy
PerformancePerformance
Corporate GovernanceCorporate Governance
Financial ReportsFinancial Reports
Supplementary InformationSupplementary Information
25.5 Principal actuarial assumptions (in respect of the employee benefit scheme)25.5 Principal actuarial assumptions (in respect of the employee benefit scheme)
2018 2017
Discount rate 5.00% 4.50%
Expected rate of salary increase 3.00% 3.50%
Normal retirement age 60 years for male employees and
55 for female employees
60 years for male
employees and
55 for female
employees
Assumptions regarding future mortality are set based on actuarial advice in accordance with the published statistics and
experience in the region.
25.6 Sensitivity of actuarial assumptions25.6 Sensitivity of actuarial assumptions
The table below illustrates the sensitivity of the defined benefit obligation valuation as at 31 December 2018 to the discount
rate (5%), salary escalation rate (3.00%), withdrawal assumptions and mortality rates.
2018 Impact on defined benefit obligation – Increase/(Decrease)
Base Scenario Change in assumption Increase in assumption
(SAR ’000)
Decrease in assumption
(SAR ’000)
Discount rate +/- 100 basis points (96,511) 115,452
Expected rate of salary increase +/- 100 basis points 117,256 (99,217)
Normal retirement age Increase or decrease by 20% 9,020 (10,824)13,684 6,797
2017 Impact on defined benefit obligation – Increase/(Decrease)
Base Scenario Change in assumption Increase in
assumption
(SAR ’000)
Decrease in
assumption
(SAR ’000)
Discount rate +/- 100 basis points (84,916) 121,031
Expected rate of salary increase +/- 100 basis points 120,796 (86,419)
Normal retirement age Increase or decrease by 20% 13,800 (3,252)13,684 6,797
The above sensitivity analyses are based on a change in an assumption holding all other assumptions constant.
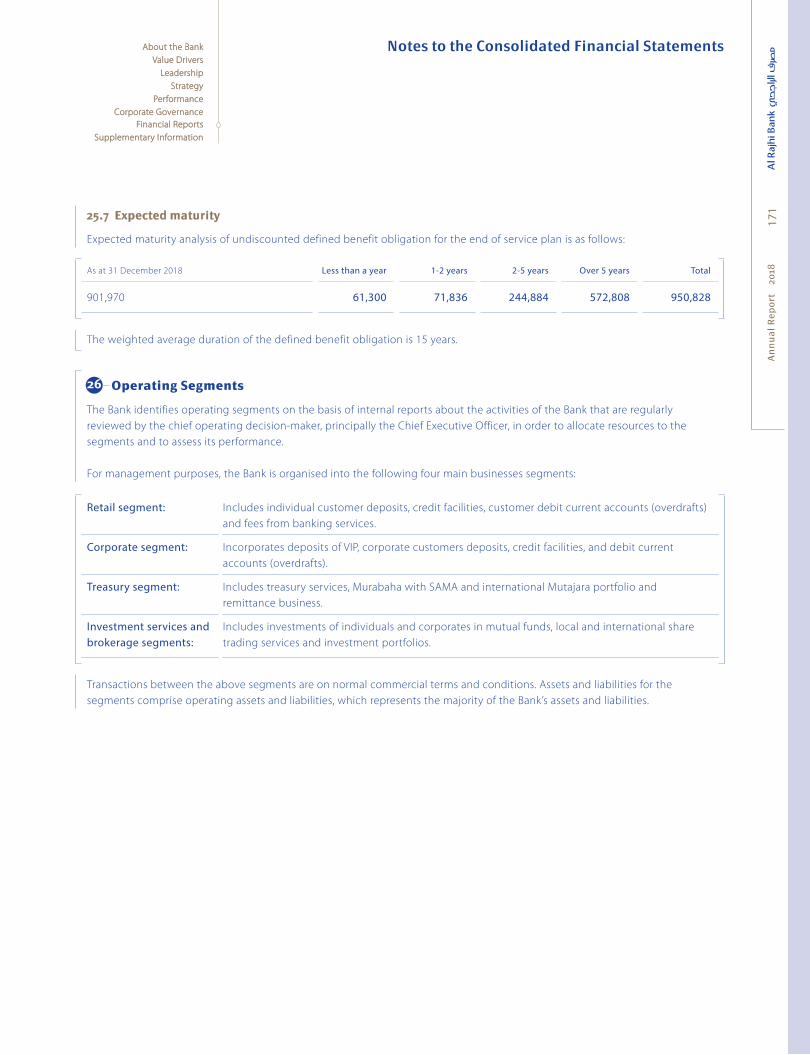
Notes to the Consolidated Financial Statements
An
nu
al
Re
po
rt
20
1817
1
About the BankAbout the Bank
Value DriversValue Drivers
LeadershipLeadership
StrategyStrategy
PerformancePerformance
Corporate GovernanceCorporate Governance
Financial ReportsFinancial Reports
Supplementary InformationSupplementary Information
25.7 Expected maturity25.7 Expected maturity
Expected maturity analysis of undiscounted defined benefit obligation for the end of service plan is as follows:
As at 31 December 2018 Less than a year 1-2 years 2-5 years Over 5 years Total
901,970 61,300 71,836 244,884 572,808 950,828
The weighted average duration of the defined benefit obligation is 15 years.
Operating Segments
The Bank identifies operating segments on the basis of internal reports about the activities of the Bank that are regularly
reviewed by the chief operating decision-maker, principally the Chief Executive Officer, in order to allocate resources to the
segments and to assess its performance.
For management purposes, the Bank is organised into the following four main businesses segments:
Retail segment: Includes individual customer deposits, credit facilities, customer debit current accounts (overdrafts)
and fees from banking services.
Corporate segment: Incorporates deposits of VIP, corporate customers deposits, credit facilities, and debit current
accounts (overdrafts).
Treasury segment: Includes treasury services, Murabaha with SAMA and international Mutajara portfolio and
remittance business.
Investment services and brokerage segments:
Includes investments of individuals and corporates in mutual funds, local and international share
trading services and investment portfolios.
Transactions between the above segments are on normal commercial terms and conditions. Assets and liabilities for the
segments comprise operating assets and liabilities, which represents the majority of the Bank’s assets and liabilities.
26

Notes to the Consolidated Financial StatementsA
nn
ua
l R
ep
ort
2
018
172
About the BankAbout the Bank
Value DriversValue Drivers
LeadershipLeadership
StrategyStrategy
PerformancePerformance
Corporate GovernanceCorporate Governance
Financial ReportsFinancial Reports
Supplementary InformationSupplementary Information
(a) The Bank’s total assets and liabilities, together with its total operating income and expenses, and net income, as of and for
the years ended 31 December for each segment are as follows:
2018
Retail segment
(SAR ’000)
Corporate segment
(SAR ’000)
Treasury segment
(SAR ’000)
Investment services and
brokerage segment
(SAR ’000)
Total
(SAR ’000)
Total assets 187,897,978 62,102,390 111,970,301 3,033,161 365,003,830
Total liabilities 273,503,541 18,947,567 23,868,335 130,369 316,449,812
Financing and investments income from
external customers 8,968,075 2,790,552 1,976,310 24,520 13,759,457
Inter-segment operating income/(expense) 1,154,739 (697,360) (457,379) – –
Gross financing and investment income 10,122,814 2,093,192 1,518,931 24,520 13,759,457
Return on customers’, banks’ and
financial institutions’ time investments (124,676) (213,870) (159,928) (8,250) (506,724)
Net financing and investment income 9,998,138 1,879,322 1,359,003 16,270 13,252,733
Fees from banking services, net 1,848,899 570,304 283,358 398,725 3,101,286
Exchange income, net 143,513 40,892 571,399 – 755,804
Other operating income, net 25,019 – 62,699 121,977 209,695
Total operating income 12,015,569 2,490,518 2,276,459 536,972 17,319,518
Depreciation (415,035) (7,358) (14,009) (5,769) (442,171)
Impairment charge for financing, net (1,177,409) (302,894) (50,643) – (1,530,946)
Other operating expenses (4,095,037) (322,513) (490,076) (141,908) (5,049,534)
Total operating expenses (5,687,481) (632,765) (554,728) (147,677) (7,022,651)
Net income for the year 6,328,088 1,857,753 1,721,731 389,295 10,296,867

Notes to the Consolidated Financial Statements
An
nu
al
Re
po
rt
20
1817
3
About the BankAbout the Bank
Value DriversValue Drivers
LeadershipLeadership
StrategyStrategy
PerformancePerformance
Corporate GovernanceCorporate Governance
Financial ReportsFinancial Reports
Supplementary InformationSupplementary Information
2017
Retail segment
(SAR ’000)
Corporate
segment
(SAR ’000)
Treasury
segment
(SAR ’000)
Investment
services and
brokerage
segment
(SAR ’000)
Total
(SAR ’000)
Total assets 183,869,949 63,535,245 92,783,499 2,927,835 343,116,528
Total liabilities 249,429,672 21,288,466 16,107,112 540,360 287,365,610
Financing and investments income from
external customers 8,230,257 2,862,192 1,466,239 22,316 12,581,004
Inter-segment operating income/(expense) 984,000 (648,377) (335,623) – –
Gross financing and investment income 9,214,257 2,213,815 1,130,616 22,316 12,581,004
Return on customers’, banks’ and
financial institutions’ time investments (75,531) (240,145) (235,911) – (551,587)
Net financing and investment income 9,138,726 1,973,670 894,705 22,316 12,029,417
Fees from banking services, net 1,758,574 573,605 37,114 327,915 2,697,208
Exchange income, net 427,996 50,714 363,129 – 841,839
Other operating income, net 131,306 – 105,063 100,021 336,390
Total operating income 11,456,602 2,597,989 1,400,011 450,252 15,904,854
Depreciation (410,957) (10,866) (12,834) (5,910) (440,566)
Impairment charge for financing, net (1,191,115) (355,917) (545) – (1,547,577)
Other operating expenses (3,985,776) (460,695) (218,634) (130,880) (4,795,985)
Total operating expenses (5,587,847) (827,478) (232,013) (136,790) (6,784,128)
Net income for the year 5,868,755 1,770,511 1,167,998 313,462 9,120,726
(b) The Group’s credit exposure by business segments as of 31 December is as follows:
2018
Retail segment
(SAR ’000)
Corporate segment
(SAR ’000)
Treasury segment
(SAR ’000)
Investment services and brokerage
segment(SAR ’000)
Total
(SAR ’000)
Consolidated balance sheet assets 158,519,040 52,392,321 94,463,095 2,558,909 307,933,365
Commitments and contingencies excluding
irrevocable commitments to extend credit – 6,329,819 – – 6,329,819

Notes to the Consolidated Financial StatementsA
nn
ua
l R
ep
ort
2
018
174
About the BankAbout the Bank
Value DriversValue Drivers
LeadershipLeadership
StrategyStrategy
PerformancePerformance
Corporate GovernanceCorporate Governance
Financial ReportsFinancial Reports
Supplementary InformationSupplementary Information
2017
Retail segment
(SAR ’000)
Corporate
segment
(SAR ’000)
Treasury
segment
(SAR ’000)
Investment services
and brokerage
segment
(SAR ’000)
Total
(SAR ’000)
Consolidated balance sheet assets 164,609,073 62,660,677 51,727,163 2,927,835 281,924,748
Commitments and contingencies excluding
irrevocable commitments to extend credit – 6,776,468 – – 6,776,468
27.1 Credit risk27.1 Credit risk
Credit risk is considered to be the most significant and
pervasive risk for the Bank. The Bank takes on exposure
to credit risk, which is the risk that the counter-party to
a financial transaction will fail to discharge an obligation
causing the Bank to incur a financial loss. Credit risk arises
principally from financing (credit facilities provided to
customers) and from cash and deposits held with other
banks. Further, there is credit risk in certain off-balance
sheet financial instruments, including guarantees relating
to purchase and sale of foreign currencies, letters of credit,
acceptances and commitments to extend credit. Credit risk
monitoring and control is performed by the CRMG which
sets parameters and thresholds for the Bank’s financing
activities.
(a) Credit risk measurement(a) Credit risk measurement
(i) Financing(i) Financing
The Bank has structured a number of financial products
which are in accordance with Sharia law in order to meet
the customers demand. These products are all classified as
financing assets in the Bank’s consolidated statement of
financial position. In measuring credit risk of financing at
a counterparty level, the Bank considers the overall credit
worthiness of the customer based on a proprietary risk
methodology. This risk rating methodology utilises a 10
point scale based on quantitative and qualitative factors
with seven performing categories (rated 1 to 7) and three
non-performing categories (rated 8-10). The risk rating
process is intended to advise the various independent
approval authorities of the inherent risks associated with
the counterparty and assist in determining suitable pricing
commensurate with the associated risk.
Financial Risk Management
The Bank’s activities expose it to a variety of financial
risks and those activities involve the analysis, evaluation,
acceptance and management of some degree of risk or
combination of risks. Taking risk is core to the banking
business, and these risks are an inevitable consequence of
participating in financial markets. The Bank’s aim is therefore
to achieve an appropriate balance between risk and return
and minimise potential adverse effects on the Bank’s
financial performance.
The Bank’s risk management policies, procedures and
systems are designed to identify and analyse these risks
and to set appropriate risk mitigates and controls. The Bank
reviews its risk management policies and systems on an
ongoing basis to reflect changes in markets, products and
emerging best practices.
Risk management is performed by the Credit and Risk
Management Group (“CRMG”) under policies approved by
the Board of Directors. The CRMG identifies and evaluates
financial risks in close co-operation with the Bank’s
operating units. The most important types of risks identified
by the Bank are credit risk, liquidity risk and market risk.
Market risk includes currency risk, profit rate risk, operational
risk and price risk.
27
Notes to the Consolidated Financial Statements
An
nu
al
Re
po
rt
20
1817
5
About the BankAbout the Bank
Value DriversValue Drivers
LeadershipLeadership
StrategyStrategy
PerformancePerformance
Corporate GovernanceCorporate Governance
Financial ReportsFinancial Reports
Supplementary InformationSupplementary Information
Specific provisions are evaluated individually for all different
types of financing, whereas additional provisions are
evaluated based on collective impairment of financing,
and are created for credit losses where there is objective
evidence that the unidentified potential losses are present
at the reporting date. The amount of the specific provision
is the difference between the carrying amount and the
estimated recoverable amount. The collective provision
is based upon deterioration in the internal credit ratings
allocated to the borrower or group of borrowers. These
internal grading take into consideration factors such as the
current economic condition in which the borrowers operate.
Any deterioration in country risk, industry, as well as identifi ed
structural weaknesses or deterioration in cash flows.
(ii) Credit risk grades(ii) Credit risk grades
For corporate exposures, the Bank allocates each exposure
to a credit risk grade based on a variety of data that is
determined to be predictive of the risk of default and
applying experienced credit judgment. Credit risk grades are
defined using qualitative and quantitative factors that are
indicative of risk of default. These factors vary depending on
the nature of the exposure and the type of borrower.
Credit risk grades are defined and calibrated such that the
risk of default occurring increases exponentially as the credit
risk deteriorates so, for example, the difference in risk of
default between credit risk grades 1 and 2 is smaller than
the difference between credit risk grades 2 and 3.
Each corporate exposure is allocated to a credit risk grade
at initial recognition based on available information about
the borrower. Exposures are subject to ongoing monitoring,
which may result in an exposure being moved to a different
credit risk grade. The monitoring of corporate exposure
involves use of the following data.
Information obtained during periodic review of customer
files – e.g. audited financial statements, management
accounts, budgets and projections.
Data from credit reference agencies, press articles,
changes in external credit ratings.
Actual and expected significant changes in the political,
regulatory and technological environment of the
borrower or in its business activities.
(iii) Generating the term structure of PD(iii) Generating the term structure of PD
Credit risk grades are a primary input into the determination
of the term structure of PD for exposures. The Bank collects
performance and default information about its customers
analysed by segment as well as by credit risk grading.
The Bank employs analytical techniques incorporating
internal default estimates backed by transition matrices
published by external agencies to construct PD term
structures that can be applied to each exposure based on
the its remaining lifetime. These PD tern structures are then
adjusted to incorporate the impact of macroeconomic
outlook to arrive at a forward looking estimate of PD across
the lifetime.
For retail exposure, borrower and loan specific information
collected at the time of application, repayment behaviour
etc. are used to construct risk based segmentation using
Chi-square Automatic Interaction Detection (CHAID) (or
Decision Tree) technique. Risk segments are constructed
to identify and aggregate customer with similar risk
characteristics. For each risk segment thus formed, PD term
structures are constructed using historical data that can be
applied to each exposure based on its remaining lifetime.
Based on consideration of a variety of external actual and
forecast information from published sources, the Bank
formulates a forward looking adjustment to PD term
structures to arrive at forward looking PD estimates across
the lifetime using macro economic models.
Risk rating 1
Exceptional – Obligors of unquestioned credit standing at
the pinnacle of credit quality.
Risk rating 2
Excellent – Obligors of the highest quality, presently and
prospectively. Virtually no risk in lending to this class,
Cash flows reflect exceptionally large and stable margins
of protection. Projected cash flows including anticipated
credit extensions indicate strong liquidity levels and debt
service coverage. Balance Sheet parameters are strong, with
excellent asset quality in terms of value and liquidity.

Notes to the Consolidated Financial StatementsA
nn
ua
l R
ep
ort
2
018
176
About the BankAbout the Bank
Value DriversValue Drivers
LeadershipLeadership
StrategyStrategy
PerformancePerformance
Corporate GovernanceCorporate Governance
Financial ReportsFinancial Reports
Supplementary InformationSupplementary Information
Risk rating 3
Superior – Typically obligors at the lower end of the high
quality range with excellent prospects. Very good asset
quality and liquidity. Consistently strong debt capacity and
coverage. There could however be some elements, which
with a low likelihood might impair performance in the
future.
Risk rating 4
Good – Typically obligors in the high end of the
medium range who are definitely sound with minor risk
characteristics. Elements of strength are present in such
areas as liquidity, stability of margins, cash flows, diversity
of assets, and lack of dependence on one type of business.
Risk rating 5
Satisfactory – These are obligors with smaller margins of
debt service coverage and with some elements of reduced
strength. Satisfactory asset quality, liquidity, and good debt
capacity and coverage. A loss year or declining earnings
trend may occur, but the borrowers have sufficient strength
and financial flexibility to offset these issues.
Risk rating 6
Adequate – Obligors with declining earnings, strained
cash flow, increasing leverage and/or weakening market
fundamentals that indicate above average risk, such
borrowers have limited additional debt capacity, modest
coverage, average or below average asset quality and
market share. Present borrower performance is satisfactory,
but could be adversely affected by developing collateral
quality/adequacy etc.
Risk rating 7
Very high risk – Generally undesirable business constituting
an undue and unwarranted credit risk but not to the point
of justifying a substandard classification. No loss of principal
or profit has taken place. Potential weakness might include
a weakening financial condition, an unrealistic repayment
program, inadequate sources of funds, or a lack of adequate
collateral, credit information or documentation. The entity
is undistinguished and mediocre. No new or incremental
credits will generally be considered for this category.
Risk rating 8
Substandard – Obligors in default and 90 Days Past Due
on repayment of their obligations. Unacceptable business
credit. Normal repayment is in jeopardy, and there exists
well defined weakness in support of the same. The asset
is inadequately protected by the current net worth and
paying capacity of the obligor or pledged collateral. Specific
provision raised as an estimate of potential loss.
Risk rating 9
Doubtful – Obligors in default and 180 Days Past Due (DPD)
on their contracted obligations, however in the opinion of
the management recovery/ salvage value against corporate
and real estate obligors is a possibility, and hence write-off
should be deferred. Full repayment questionable. Serious
problems exist to the point where a partial loss of principle
is likely. Weaknesses are so pronounced that on the basis
of current information, conditions and values, collection
in full is highly improbable. Specific provision raised as
an estimate of potential loss. However, for retail obligors
(except real estate) and credit cards, total loss is expected.
A 100% Specific Provisioning must be triggered followed by
the write-off process should be effected as per Al Rajhi Bank
write-off policy.
Risk rating 10
Loss – Obligors in default and 360 Days Past Due (DPD)
on their obligations. Total loss is expected. An uncollectible
assets which does not warrant classification as an active
asset. A 100% Specific Provisioning must be triggered
followed by the write-off process should be effected
as per Al Rajhi Bank write-off policy.
(iv) ECL – Significant increase in credit risk(iv) ECL – Significant increase in credit risk
When determining whether the risk of default on a
financial instrument has increased significantly since initial
recognition, the Bank considers reasonable and supportable
information that is relevant and available without undue
cost or effort. This includes both quantitative and qualitative
information and analysis, based on the Bank’s historical
experience and expert credit assessment and including
forward-looking information.

Notes to the Consolidated Financial Statements
An
nu
al
Re
po
rt
20
1817
7
About the BankAbout the Bank
Value DriversValue Drivers
LeadershipLeadership
StrategyStrategy
PerformancePerformance
Corporate GovernanceCorporate Governance
Financial ReportsFinancial Reports
Supplementary InformationSupplementary Information
For Corporate portfolio, the Bank’s assessment of significant
increase in credit risk is based on facility level except for
watch-list accounts whereby Bank assessment is based on
counterparty. Significant increase in credit risk assessment
for retail loans is carried out at customer level within same
product family. All the exposures which are considered
to have significantly increased in credit risk are subject to
lifetime ECL.
The Bank considers all investment grade debt securities
issued by sovereigns including Gulf Corporation Council
(GCC) countries to have low credit risk.
(v) Determining whether credit risk has increased (v) Determining whether credit risk has increased significantlysignificantly
In determining whether credit risk has increased
significantly since initial recognition, the Bank uses its
internal credit risk grading system, external risk ratings,
quantitative changes in PDs, delinquency status of accounts,
expert credit judgement and, where possible, relevant
historical experience.
The credit risk of a particular exposure is deemed to
have increased significantly since initial recognition
base on quantitative assessment and/or using its expert
credit judgment and, where possible, relevant historical
experience, the Bank may determine that an exposure
has undergone a significant increase in credit risk based
on particular qualitative indicators that it considers are
indicative of such and whose effect may not otherwise be
fully reflected in its quantitative analysis on a timely basis.
As a backstop, the Bank considers that a significant increase
in credit risk occurs no later than when an asset is more than
30 days past due. Days past due are determined by counting
the number of days since the earliest elapsed due date in
respect of which full payment has not been received. Due
dates are determined without considering any grace period
that might be available to the borrower.
The Bank monitors the effectiveness of the criteria used to
identify significant increases in credit risk by regular reviews
to confirm that:
The criteria are capable of identifying significant increases
in credit risk before an exposure is in default;
The criteria do not align with the point in time when an
asset becomes 30 days past due; and
There is no unwarranted volatility in loss allowance from
transfers between 12-month PD (stage 1) and lifetime
PD (stage 2).
The Bank classifies its financial instruments into stage 1,
stage 2 and stage 3, based on the applied impairment
methodology, as described below:
Stage
1
for financial instruments where there has not been
a significant increase in credit risk since initial
recognition and that are not credit-impaired on
origination, the Bank recognises an allowance
based on the 12-month ECL. All accounts at
origination would be classified as Stage 1.
Stage
2
for financial instruments where there has been
a significant increase in credit risk since initial
recognition but they are not credit-impaired, the
Bank recognises an allowance for the lifetime ECL
for all financings categorised in this stage based on
the actual/expected behavioural maturity profile
including restructuring or rescheduling
of facilities.
Stage
3
for credit-impaired financial instruments, the Bank
recognises the lifetime ECL. Default identification
process i.e. DPD of 90 or more is used as stage 3.
(vi) Modified financial assets(vi) Modified financial assets
The contractual terms of a loan may be modified for a
number of reasons, including changing market conditions,
customer retention and other factors not related to a current
or potential credit deterioration of the customer. An existing
loan whose terms have been modified may be derecognised
and the renegotiated loan recognised as a new loan at fair
value in accordance with the accounting policy.

Notes to the Consolidated Financial StatementsA
nn
ua
l R
ep
ort
2
018
178
About the BankAbout the Bank
Value DriversValue Drivers
LeadershipLeadership
StrategyStrategy
PerformancePerformance
Corporate GovernanceCorporate Governance
Financial ReportsFinancial Reports
Supplementary InformationSupplementary Information
The Bank renegotiates loans to customers in financial
difficulties (referred to as ‘forbearance activities’ to maximise
collection opportunities and minimise the risk of default.
Under the Bank’s forbearance policy, loan forbearance is
granted on a selective basis if the debtor is currently in
default on its debt or if there is a high risk of default, there
is evidence that the debtor made all reasonable efforts to
pay under the original contractual terms and the debtor is
expected to be able to meet the revised terms.
The revised terms usually include extending the maturity,
changing the timing of profit payments and amending the
terms of loan covenants. Both retail and corporate loans are
subject to the forbearance policy.
Forbearance is a qualitative indicator of a significant increase
in credit risk and an expectation of forbearance may
constitute evidence that an exposure is credit-impaired/
in default. A customer needs to demonstrate consistently
good payment behaviour over a period of 12 months before
the exposure is no longer considered to be credit-impaired/
in default.
(vii) Definition of “Default”(vii) Definition of “Default”
The Bank considers a financial asset to be in default when:
The borrower is unlikely to pay its credit obligations to the
Bank in full, without recourse by the Bank to actions such
as realising security (if any is held); or
The borrower is past due more than 90 days on any
material credit obligation to the Bank.
Overdrafts are considered as being past due once the
customer has breached an advised limit or been advised of a
limit smaller than the current amount outstanding.
In assessing whether a borrower is in default. the Bank
considers indicators that are:
Qualitative – e.g. breaches of covenant;
Quantitative – e.g. overdue status and non-payment on
another obligation of the same issuer to the Bank; and
Based on data developed internally and obtained from
external sources.
Inputs into the assessment of whether a financial instrument
is in default and their significance may vary over time to
reflect changes in circumstances.
(viii) Incorporation of forward looking information(viii) Incorporation of forward looking information
The Bank incorporates forward-looking information
into both its assessment of whether the credit risk of
an instrument has increased significantly since its initial
recognition and its measurement of ECL. Based on
consideration of a variety of external actual and forecast
information from published sources, the Bank formulates a
forward looking adjustment to PD term structures to arrive
at forward looking PD estimates across the lifetime using
macroeconomic models.
The Bank considers scenarios in range of 3-5 years horizon
(consistent with forecast available from public sources)
beyond which long term average macroeconomic
conditions prevail. Externally available macroeconomic
forecast from International Monetary Fund (IMF) and Saudi
Arabian Monetary Authority (SAMA) are used for making
base case forecast. For other scenarios, adjustment are made
to base case forecast based on expert judgement.
The base case represents a most-likely outcome as
published by external sources. The other scenarios represent
more optimistic and more pessimistic outcomes.
Economic Indicators Weightage
2018
%
GDP growth rate 56.29
Government expenditure to GDP 43.71
Predicted relationships between the key indicators and
default and loss rates on various portfolios of financial assets
have been developed based on analysing historical data.
(ix) Measurement of ECL(ix) Measurement of ECL
The Bank measures an ECL at an individual instrument level
taking into account the projected cash flows, PD, LGD, CCF
and discount rate.
The key inputs into the measurement of ECL are the term
structure of the following variables:
i. probability of default (PD);
ii. loss given default (LGD);
iii. exposure at default (EAD).
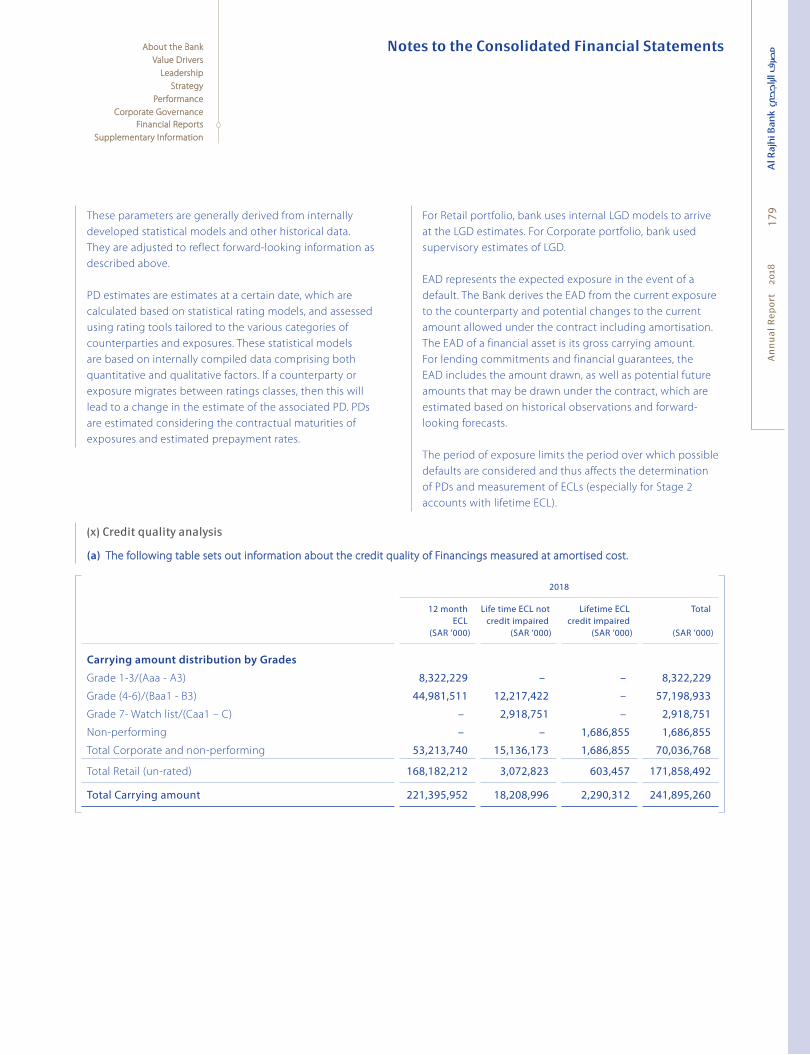
Notes to the Consolidated Financial Statements
An
nu
al
Re
po
rt
20
1817
9
About the BankAbout the Bank
Value DriversValue Drivers
LeadershipLeadership
StrategyStrategy
PerformancePerformance
Corporate GovernanceCorporate Governance
Financial ReportsFinancial Reports
Supplementary InformationSupplementary Information
These parameters are generally derived from internally
developed statistical models and other historical data.
They are adjusted to reflect forward-looking information as
described above.
PD estimates are estimates at a certain date, which are
calculated based on statistical rating models, and assessed
using rating tools tailored to the various categories of
counterparties and exposures. These statistical models
are based on internally compiled data comprising both
quantitative and qualitative factors. If a counterparty or
exposure migrates between ratings classes, then this will
lead to a change in the estimate of the associated PD. PDs
are estimated considering the contractual maturities of
exposures and estimated prepayment rates.
For Retail portfolio, bank uses internal LGD models to arrive
at the LGD estimates. For Corporate portfolio, bank used
supervisory estimates of LGD.
EAD represents the expected exposure in the event of a
default. The Bank derives the EAD from the current exposure
to the counterparty and potential changes to the current
amount allowed under the contract including amortisation.
The EAD of a financial asset is its gross carrying amount.
For lending commitments and financial guarantees, the
EAD includes the amount drawn, as well as potential future
amounts that may be drawn under the contract, which are
estimated based on historical observations and forward-
looking forecasts.
The period of exposure limits the period over which possible
defaults are considered and thus affects the determination
of PDs and measurement of ECLs (especially for Stage 2
accounts with lifetime ECL).
(x) Credit quality analysis(x) Credit quality analysis
(a) The following table sets out information about the credit quality of Financings measured at amortised cost. The following table sets out information about the credit quality of Financings measured at amortised cost.
2018
12 monthECL
(SAR ’000)
Life time ECL not credit impaired
(SAR ’000)
Lifetime ECL credit impaired
(SAR ’000)
Total
(SAR ’000)
Carrying amount distribution by Grades
Grade 1-3/(Aaa - A3) 8,322,229 – – 8,322,229
Grade (4-6)/(Baa1 - B3) 44,981,511 12,217,422 – 57,198,933
Grade 7- Watch list/(Caa1 – C) – 2,918,751 – 2,918,751
Non-performing – – 1,686,855 1,686,855
Total Corporate and non-performing 53,213,740 15,136,173 1,686,855 70,036,768
Total Retail (un-rated) 168,182,212 3,072,823 603,457 171,858,492
Total Carrying amount 221,395,952 18,208,996 2,290,312 241,895,260

Notes to the Consolidated Financial StatementsA
nn
ua
l R
ep
ort
2
018
180
About the BankAbout the Bank
Value DriversValue Drivers
LeadershipLeadership
StrategyStrategy
PerformancePerformance
Corporate GovernanceCorporate Governance
Financial ReportsFinancial Reports
Supplementary InformationSupplementary Information
(xi) Financings(xi) Financings
(a) The net financing concentration risks and the related provision, by major economic sectors at 31 December are as follows: The net financing concentration risks and the related provision, by major economic sectors at 31 December are as follows:
2018
Description Performing
(SAR ’000)
Non-Performing
(SAR ’000)
Allowance for impairment
(SAR ’000)
Net financing
(SAR ’000)
Commercial 19,670,493 746,180 (618,139) 19,798,534
Industrial 28,007,663 774,347 (696,112) 28,085,898
Building and construction 3,442,028 71,682 (82,411) 3,431,299
Consumer 171,255,069 603,423 (470,400) 171,388,092
Services 16,295,853 80,751 (75,584) 16,301,020
Agriculture and fishing 467,960 – – 467,960
Others 465,882 13,929 (6) 479,805
Total 239,604,948 2,290,312 (1,942,652) 239,952,608
Collective allowance for impairment (5,889,819) (5,889,819)
Balance (7,832,471) 234,062,789
2017
Description Performing
(SAR ’000)
Non-
Performing
(SAR ’000)
Allowance for
impairment
(SAR ’000)
Net financing
(SAR ’000)
Commercial 26,967,699 513,822 (263,818) 27,217,703
Industrial 19,443,855 564,975 (518,704) 19,490,126
Building and construction 3,504,017 107,193 (178,804) 3,432,406
Consumer 165,819,609 542,448 (641,327) 165,720,730
Services 20,099,055 41,741 (25,689) 20,115,107
Agriculture and fishing 1,464,247 – – 1,464,247
Others 22,122 – – 22,122
Total 237,320,604 1,770,179 (1,628,342) 237,462,441
Collective allowance for impairment (3,926,868) (3,926,868)
Balance (5,555,210) 233,535,573

Notes to the Consolidated Financial Statements
An
nu
al
Re
po
rt
20
1818
1
About the BankAbout the Bank
Value DriversValue Drivers
LeadershipLeadership
StrategyStrategy
PerformancePerformance
Corporate GovernanceCorporate Governance
Financial ReportsFinancial Reports
Supplementary InformationSupplementary Information
(b) The tables below set out the aging of financing past due but not impaired as of 31 December: The tables below set out the aging of financing past due but not impaired as of 31 December:
2018
Age Mutajara
(SAR ’000)
Instalmentsale
(SAR ’000)
Credit cards
(SAR ’000)
Total
(SAR ’000)
up to 30 days 5,640,509 180,122 – 5,820,631
31-60 days 338,418 40,829 12,700 391,947
61-90 days 288,367 26,209 16,475 331,051
Total 6,267,294 247,160 29,175 6,543,629
Fair value of collateral 485,726 – – 485,726
2017
Age Mutajara
(SAR ’000)
Instalment
sale
(SAR ’000)
Credit cards
(SAR ’000)
Total
(SAR ’000)
up to 30 days 2,645,513 256,582 – 2,902,095
31-60 days 437,734 82,667 10,627 531,028
61-90 days 914,189 51,569 12,573 978,331
Total 3,997,436 390,818 23,200 4,411,454
Fair value of collateral 594,752 – – 594,752
The Banks in the ordinary course of lending activities hold
collaterals as security to mitigate credit risk in financings .
These collaterals mostly include time, demand, and other
cash deposits, financial guarantees, local and international
equities, real estate and other fixed assets. Real estate
collaterals against financing are considered as held for sale
and included in other assets.
The collaterals are held mainly against commercial and
consumer loans and are managed against relevant
exposures at their net realisable values. For financial assets
that are credit impaired at the reporting period, quantitative
information about the collateral held as security is needed
to the extent that such collateral mitigates credit risk.
(c) The table below sets out gross balances of individually The table below sets out gross balances of individually
impaired financing, together with the fair value of related impaired financing, together with the fair value of related
collateral held by the Group as at 31 December:collateral held by the Group as at 31 December:
2018
Retail(SAR ’000)
Corporate(SAR ’000)
Total(SAR ’000)
Individually
impaired financing 603,457 1,686,855 2,290,312
Fair value of collateral – 485,726 485,726
2017
Retail
(SAR ’000)
Corporate
(SAR ’000)
Total
(SAR ’000)
Individually
impaired financing 542,448 1,227,731 1,770,179
Fair value of collateral – 594,752 594,752

Notes to the Consolidated Financial StatementsA
nn
ua
l R
ep
ort
2
018
182
About the BankAbout the Bank
Value DriversValue Drivers
LeadershipLeadership
StrategyStrategy
PerformancePerformance
Corporate GovernanceCorporate Governance
Financial ReportsFinancial Reports
Supplementary InformationSupplementary Information
(d) The table below stratify credit exposures from corporate The table below stratify credit exposures from corporate
financing by ranges of loan-to-value (LTV) ratio. LTV is financing by ranges of loan-to-value (LTV) ratio. LTV is
calculated as the ratio of the gross amount of the financing calculated as the ratio of the gross amount of the financing
or the amount committed for loan commitments to the or the amount committed for loan commitments to the
value of the collateral. The gross amounts exclude any value of the collateral. The gross amounts exclude any
impairment allowance.impairment allowance.
2018(SAR ’000)
2017
(SAR ’000)
Less than 50% 7,368,209 2,965,647
51-70% 12,531,682 5,490,525
71-90% 20,630,702 8,113,447
91-100% 17,198,582 35,060,621
More than 100% 2,492,999 986,265
Total exposure 60,222,174 52,616,505
(b) Settlement risk(b) Settlement risk
The Bank is also exposed to settlement risk in its dealings
with other financial institutions. This risk arises when the
Bank pays its side of the transaction to the other bank or
counterparty before receiving payment from the third party.
The risk is that the third party may not pay its obligation.
While these exposures are short in duration but they can be
significant. The risk is mitigated by dealing with highly rated
counterparties, holding collateral and limiting the size of the
exposures according to the risk rating of the counterparty.
(c) Risk limit control and mitigation policies(c) Risk limit control and mitigation policies
The responsibility for credit risk management is
enterprise-wide in scope. Strong risk management is
integrated into daily processes, decision making and
strategy setting, thereby making the understanding and
management of credit risk the responsibility of every
business segment. The following business units within the
Bank assist in the credit control process:
Corporate Credit Unit
Credit Administration, Monitoring and Control Unit
Remedial Unit
Credit Policy Unit
Retail Credit Unit
The monitoring and management of credit risk associated
with these financing are made by setting approved credit
limits. The Bank manages limits and controls concentrations
of credit risk wherever they are identified - in particular,
to individual customers and groups, and to industries and
countries.
Concentrations of credit risks arise when a number of
customers are engaged in similar business activities,
activities in the same geographic region, or have similar
economic features that would cause their ability to meet
contractual obligations to be similarly affected by changes
in economic, political or other conditions. Concentrations
of credit risks indicate the relative sensitivity of the Bank’s
performance to developments affecting a particular industry
or geographical location.
The Bank seeks to manage its credit risk exposure through
diversification of its financing to ensure there is no undue
concentration of risks with to individuals or groups of
customers in specific geographical locations or economic
sectors.
The Bank manages credit risk by placing limits on the
amount of risk accepted in relation to individual customers
and groups, and to geographic and economic segments.
Such risks are monitored on a regular basis and are subject
to an annual or more frequent review, when considered
necessary. Limits on the level of credit risk by product,
economic sector and by country are reviewed at least
annually by the executive committee.
Exposure to credit risk is also managed through regular
analysis on the ability of customers and potential customers
to meet financial and contractual repayment obligations
and by revising credit limits where appropriate.

Notes to the Consolidated Financial Statements
An
nu
al
Re
po
rt
20
1818
3
About the BankAbout the Bank
Value DriversValue Drivers
LeadershipLeadership
StrategyStrategy
PerformancePerformance
Corporate GovernanceCorporate Governance
Financial ReportsFinancial Reports
Supplementary InformationSupplementary Information
Some other specific control and mitigation measures are
outlined below:
c.1 Collateralc.1 Collateral
The Bank implements guidelines on the level and quality
of specific classes of collateral, The principal collateral
types are:
Mortgages over residential and commercial properties.
Cash, shares, and general assets for customer.
Shares for Murabaha (collateralised share trading)
transactions.
The primary purpose of these instruments is to ensure that
funds are available to a customer as required. Guarantees
and standby letters of credit carry the same credit risk as
traditional banking products of the Bank.
Documentary and commercial letters of credit – which are
written undertakings by the Bank on behalf of a customer
authorising a third party to draw drafts on the Bank up to a
stipulated amount under specific terms and conditions, are
collateralised by the underlying goods to which they relate,
and therefore, risk is partially mitigated.
Commitments to extend credit represent unused portions
of authorisations to extend credit in the form of further
financing products, guarantees or letters of credit. With
respect to credit risk on commitments to extend credit,
the Bank is potentially exposed to loss in an amount equal
to the total unused commitments. However, the likely
amount of loss is less than the total unused commitments,
as most commitments to extend credit are contingent upon
customers maintaining specific credit standards.
(d) Impairment and provisioning policies(d) Impairment and provisioning policies
Allowance for impairment is recognised for financial
reporting purposes only for stage 3 losses that have been
incurred at the statement of financial position date based
on objective evidence of impairment, and management
judgment.
The table below sets out the maximum exposure to credit
risk at the reporting date without considering collateral or
other credit enhancements and includes the off-balance
sheet financial instruments involving credit risks as at
31 December:
2018(SAR ’000)
2017
(SAR ’000)
On-balance sheet items Investments:
Murabaha with Saudi Government and SAMA 22,477,145 23,452,869
Sukuk 18,195,957 10,605,139
Due from banks and other financial institutions 30,808,011 10,709,795
Financing, net
Corporate 66,254,862 69,196,949
Retail 167,807,927 164,338,624
Total on-balance sheet items 305,543,902 278,303,376
Off-balance sheet items:
Letters of credit and acceptances 1,452,658 1,608,712
Letters of guarantee 4,877,161 4,969,355
Irrevocable commitments to extend credit 6,482,436 6,989,368
Total off-balance sheet items 12,812,255 13,567,435
Maximum exposure to credit risk 318,356,157 291,870,811
The above table represents a worst case scenario of credit risk exposure to the Bank at 31 December 2018 and 2017, without
taking account of any collateral held or other credit enhancements attached. For on-balance-sheet assets, the exposures set out
above are based on net carrying amounts as reported in the consolidated statement of financial position.

Notes to the Consolidated Financial StatementsA
nn
ua
l R
ep
ort
2
018
184
About the BankAbout the Bank
Value DriversValue Drivers
LeadershipLeadership
StrategyStrategy
PerformancePerformance
Corporate GovernanceCorporate Governance
Financial ReportsFinancial Reports
Supplementary InformationSupplementary Information
27.2 Liquidity risk27.2 Liquidity risk
Liquidity risk is the risk that the Bank will be unable to
meet its payment obligations associated with its financial
liabilities when they fall due and to replace funds when they
are withdrawn. The consequence may be the failure to meet
obligations to repay deposits and financing parties and
fulfil financing commitments. Liquidity risk can be caused
by market disruptions or by credit downgrades, which may
cause certain sources of funding to become unavailable
immediately. Diverse funding sources available to the Bank
help mitigate this risk. Assets are managed with liquidity in
mind, maintaining a conservative balance of cash and cash
equivalents.
Liquidity risk management processLiquidity risk management process
The Bank’s liquidity management process is as monitored by
the Bank’s Asset and Liabilities Committee (ALCO), includes:
Day-to-day funding, managed by Treasury to ensure that
requirements can be met and this includes replenishment
of funds as they mature or are invested;
Monitoring balance sheet liquidity ratios against internal
and regulatory requirements;
Managing the concentration and profile of debt
maturities;
Maintain diversified funding sources; and
Liquidity management and asset and liability
mismatching.
Monitoring and reporting take the form of analysing cash
flows of items with both contractual and non-contractual
maturities. The net cash flows are measured and ensured
that they are within acceptable ranges. The Treasury/
ALCO also monitors, the level and type of undrawn lending
commitments, usage of overdraft facilities and the potential
impact of contingent liabilities such as standby letters of
credit and guarantees may have on the Bank’s liquidity
position.
The tables below summarise the maturity profile of the
Bank’s assets and liabilities, on the basis of the remaining
maturity as of the consolidated statement of financial
position date to the contractual maturity date.
Management monitors the maturity profile to ensure that
adequate liquidity is maintained, Assets available to meet
all of the liabilities and to cover outstanding financing
commitments include cash, balances with SAMA and due
from banks. Further, in accordance with the Banking Control
Law and Regulations issued by SAMA, the Bank maintains
a statutory deposit equal to a sum not less than 7% of
total customers’ deposits, and 4% of total other customers’
accounts. In addition to the statutory deposit, the Bank
maintains a liquid reserve of not less than 20% of the
deposit liabilities, in the form of cash, gold or assets which
can be converted into cash within a period not exceeding
30 days. Also, the Bank has the ability to raise additional
funds through special financing arrangements with SAMA
including deferred sales transactions.
The contractual maturities of financial assets and liabilities
as of 31 December based on discounted cash flows are as
follows. The table below reflect the expected cash flows
indicated by the deposit retention history of the Group.
Management monitors rolling forecast of the Group’s
liquidity position and cash and cash equivalents on the basis
of expected cash flows. This is carried out in accordance
with practice and limits set by the Group and based on the
pattern of historical deposit movement. In addition, the
Group’s liquidity management policy involves projecting
cash flows in major currencies and considering the level of
liquid assets necessary to meet these, monitoring balance
sheet liquidity ratios against internal and external regulatory
requirements and maintaining debt financing plans.
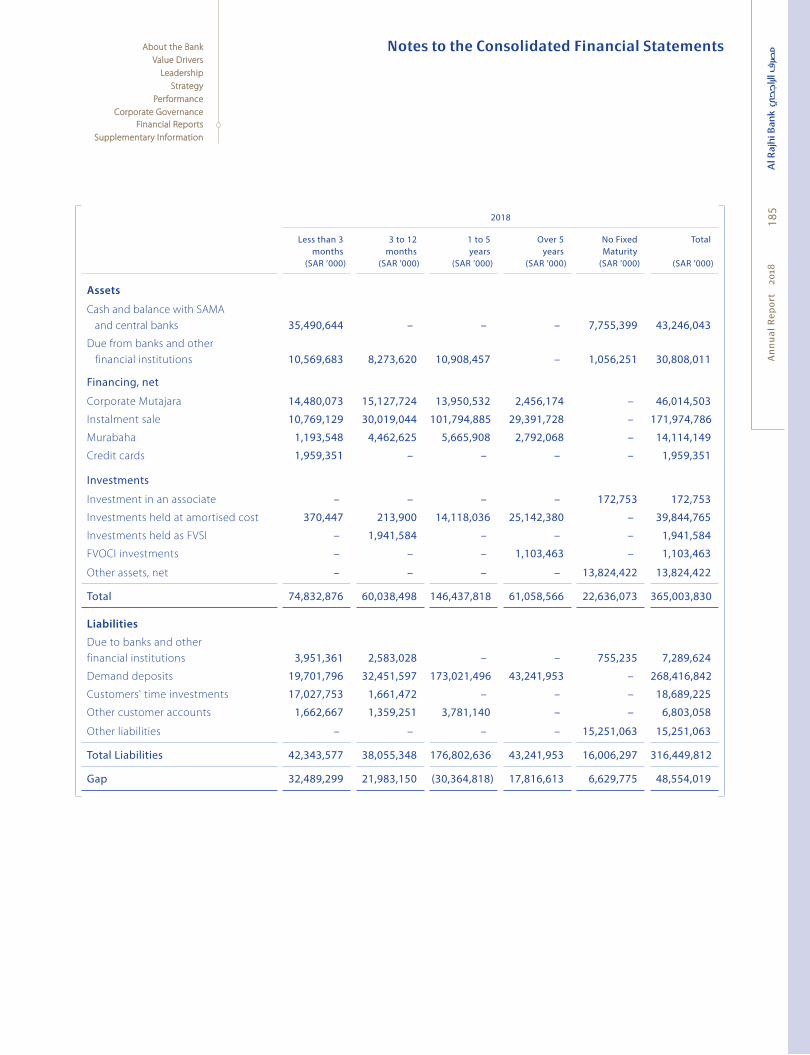
Notes to the Consolidated Financial Statements
An
nu
al
Re
po
rt
20
1818
5
About the BankAbout the Bank
Value DriversValue Drivers
LeadershipLeadership
StrategyStrategy
PerformancePerformance
Corporate GovernanceCorporate Governance
Financial ReportsFinancial Reports
Supplementary InformationSupplementary Information
2018
Less than 3 months
(SAR ’000)
3 to 12 months
(SAR ’000)
1 to 5 years
(SAR ’000)
Over 5 years
(SAR ’000)
No Fixed Maturity
(SAR ’000)
Total
(SAR ’000)
Assets
Cash and balance with SAMA
and central banks 35,490,644 – – – 7,755,399 43,246,043
Due from banks and other
financial institutions 10,569,683 8,273,620 10,908,457 – 1,056,251 30,808,011
Financing, net
Corporate Mutajara 14,480,073 15,127,724 13,950,532 2,456,174 – 46,014,503
Instalment sale 10,769,129 30,019,044 101,794,885 29,391,728 – 171,974,786
Murabaha 1,193,548 4,462,625 5,665,908 2,792,068 – 14,114,149
Credit cards 1,959,351 – – – – 1,959,351
Investments
Investment in an associate – – – – 172,753 172,753
Investments held at amortised cost 370,447 213,900 14,118,036 25,142,380 – 39,844,765
Investments held as FVSI – 1,941,584 – – – 1,941,584
FVOCI investments – – – 1,103,463 – 1,103,463
Other assets, net – – – – 13,824,422 13,824,422
Total 74,832,876 60,038,498 146,437,818 61,058,566 22,636,073 365,003,830
Liabilities
Due to banks and other
financial institutions 3,951,361 2,583,028 – – 755,235 7,289,624
Demand deposits 19,701,796 32,451,597 173,021,496 43,241,953 – 268,416,842
Customers' time investments 17,027,753 1,661,472 – – – 18,689,225
Other customer accounts 1,662,667 1,359,251 3,781,140 – – 6,803,058
Other liabilities – – – – 15,251,063 15,251,063
Total Liabilities 42,343,577 38,055,348 176,802,636 43,241,953 16,006,297 316,449,812
Gap 32,489,299 21,983,150 (30,364,818) 17,816,613 6,629,775 48,554,01932,489,299 17,816,613 6,629,775

Notes to the Consolidated Financial StatementsA
nn
ua
l R
ep
ort
2
018
186
About the BankAbout the Bank
Value DriversValue Drivers
LeadershipLeadership
StrategyStrategy
PerformancePerformance
Corporate GovernanceCorporate Governance
Financial ReportsFinancial Reports
Supplementary InformationSupplementary Information
2017
Less than 3
months
(SAR ’000)
3 to 12
months
(SAR ’000)
1 to 5
years
(SAR ’000)
Over 5
years
(SAR ’000)
No Fixed
Maturity
(SAR ’000)
Total
(SAR ’000)
Assets
Cash and balance with SAMA
and central banks 39,758,880 – – – 8,523,591 48,282,471
Due from banks and other
financial institutions 1,240,890 6,019,134 1,349,887 1,123,040 976,844 10,709,795
Financing, net
Corporate Mutajara 3,496,901 31,085,237 6,603,136 6,209,560 – 47,394,834
Instalment sale 3,252,120 37,121,858 109,151,183 21,689,108 – 171,214,269
Murabaha 4,812,673 3,318,574 3,173,356 2,707,131 – 14,011,734
Credit cards 914,733 – – – – 914,733
Investments
Investment in an associate – – – – 124,825 124,825
Investments held at amortised cost 999,925 – 7,135,000 25,923,083 – 34,058,008
Investments held as FVSI – – 389,193 – – 389,193
FVOCI investments – – – 1,829,066 – 1,829,066
Other assets, net – – – – 2,262,542 2,262,542
Total 54,476,122 77,544,806 127,801,755 59,480,988 11,887,802 331,191,470
Liabilities
Due to banks and other
financial institutions 4,772,259 – – – 750,308 5,522,567
Demand deposits 18,476,965 30,434,129 162,265,008 40,553,666 – 251,729,768
Customers' time investments 14,502,218 1,415,045 – – – 15,917,263
Other customer accounts 1,322,061 1,080,801 3,006,552 – – 5,409,414
Other liabilities 7,921,322 – – – – 7,921,322
Total 46,994,825 32,929,975 165,271,560 40,553,666 750,308 286,500,334
Gap 7,481,297 44,614,828 (37,469,805) 18,927,322 11,137,494 44,691,136
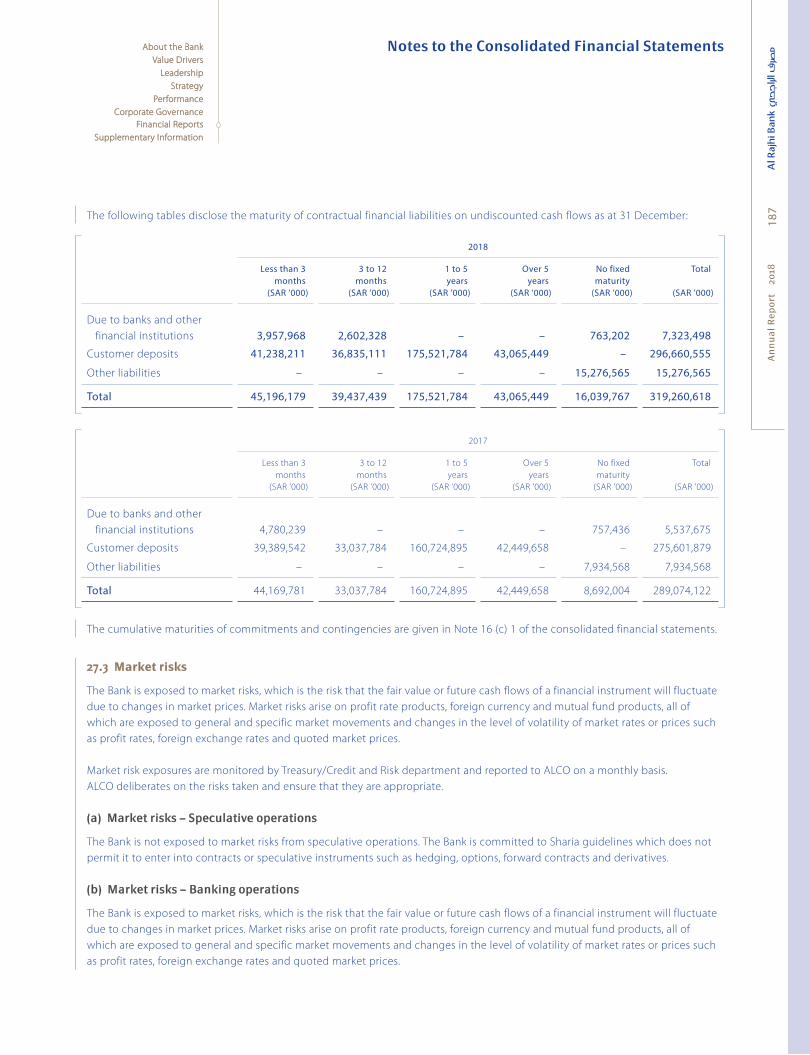
Notes to the Consolidated Financial Statements
An
nu
al
Re
po
rt
20
1818
7
About the BankAbout the Bank
Value DriversValue Drivers
LeadershipLeadership
StrategyStrategy
PerformancePerformance
Corporate GovernanceCorporate Governance
Financial ReportsFinancial Reports
Supplementary InformationSupplementary Information
The following tables disclose the maturity of contractual financial liabilities on undiscounted cash flows as at 31 December:
2018
Less than 3 months
(SAR ’000)
3 to 12 months
(SAR ’000)
1 to 5 years
(SAR ’000)
Over 5 years
(SAR ’000)
No fixed maturity
(SAR ’000)
Total
(SAR ’000)
Due to banks and other
financial institutions 3,957,968 2,602,328 – – 763,202 7,323,498
Customer deposits 41,238,211 36,835,111 175,521,784 43,065,449 – 296,660,555
Other liabilities – – – – 15,276,565 15,276,565
Total 45,196,179 39,437,439 175,521,784 43,065,449 16,039,767 319,260,618
2017
Less than 3
months
(SAR ’000)
3 to 12
months
(SAR ’000)
1 to 5
years
(SAR ’000)
Over 5
years
(SAR ’000)
No fixed
maturity
(SAR ’000)
Total
(SAR ’000)
Due to banks and other
financial institutions 4,780,239 – – – 757,436 5,537,675
Customer deposits 39,389,542 33,037,784 160,724,895 42,449,658 – 275,601,879
Other liabilities – – – – 7,934,568 7,934,568
Total 44,169,781 33,037,784 160,724,895 42,449,658 8,692,004 289,074,122
The cumulative maturities of commitments and contingencies are given in Note 16 (c) 1 of the consolidated financial statements.
27.3 Market risks27.3 Market risks
The Bank is exposed to market risks, which is the risk that the fair value or future cash flows of a financial instrument will fluctuate
due to changes in market prices. Market risks arise on profit rate products, foreign currency and mutual fund products, all of
which are exposed to general and specific market movements and changes in the level of volatility of market rates or prices such
as profit rates, foreign exchange rates and quoted market prices.
Market risk exposures are monitored by Treasury/Credit and Risk department and reported to ALCO on a monthly basis.
ALCO deliberates on the risks taken and ensure that they are appropriate.
(a) Market risks – Speculative operations(a) Market risks – Speculative operations
The Bank is not exposed to market risks from speculative operations. The Bank is committed to Sharia guidelines which does not
permit it to enter into contracts or speculative instruments such as hedging, options, forward contracts and derivatives.
(b) Market risks – Banking operations(b) Market risks – Banking operations
The Bank is exposed to market risks, which is the risk that the fair value or future cash flows of a financial instrument will fluctuate
due to changes in market prices. Market risks arise on profit rate products, foreign currency and mutual fund products, all of
which are exposed to general and specific market movements and changes in the level of volatility of market rates or prices such
as profit rates, foreign exchange rates and quoted market prices.

Notes to the Consolidated Financial StatementsA
nn
ua
l R
ep
ort
2
018
188
About the BankAbout the Bank
Value DriversValue Drivers
LeadershipLeadership
StrategyStrategy
PerformancePerformance
Corporate GovernanceCorporate Governance
Financial ReportsFinancial Reports
Supplementary InformationSupplementary Information
Profit rate riskProfit rate risk
Cash flow profit rate risk is the risk that the future cash flows of a financial instrument will fluctuate due to changes in market
profit rates. The Bank does not have any significant exposure to the effects of fluctuations in prevailing level of market profit rates
on its future cash flows as a significant portion of profit earning financial assets and profit bearing liabilities are at fixed rates and
are carried in the financial statements at amortised cost. In addition to this, a substantial portion of the Bank’s financial liabilities
are non-profit bearing.
Commission rate risk arises from the possibility that the changes in profit rates will affect either the fair values or the future cash
flows of the financial instruments. The Board has established commission rate gap limits for stipulated periods. The Bank monitors
positions daily and uses gap management strategies to ensure maintenance of positions within the established gap limits.
The following table depicts the sensitivity to a reasonable possible change in profit rates, with other variables held constant,
on the Bank’s statement of income or equity. The sensitivity of the income is the effect of the assumed changes in profit
rates on the net income for one year, based on the floating rate non-trading financial assets and financial liabilities held as at
31 December 2018 and 2017. The sensitivity of equity is same as sensitivity of income since the Bank does not have fixed rate
FVOCI financial assets as at 31 December 2018 and 2017. All the banking book exposures are monitored and analysed in currency
concentrations and relevant sensitivities are disclosed in SAR million.
2018
Currency Increase in basis Sensitivity of gross financing and investment income
As at 31 December
(SAR Mn.)
Average
(SAR Mn.)
Maximum for
(SAR Mn.)
Minimum
(SAR Mn.)
SAR +25 201 204 216 193
Decrease in basis Sensitivity of gross financing and investment income
Currency As at 31 December
(SAR Mn.)
Average
(SAR Mn.)
Maximum for
(SAR Mn.)
Minimum
(SAR Mn.)
SAR -25 (201) (204) (216) (193)
2017
Currency Increase in basis Sensitivity of gross financing and investment income
As at
31 December
(SAR Mn.)
Average
(SAR Mn.)
Maximum for
(SAR Mn.)
Minimum
(SAR Mn.)
SAR +25 202 191 209 169
Decrease in basis Sensitivity of gross financing and investment income
Currency As at
31 December
(SAR Mn.)
Average
(SAR Mn.)
Maximum for
(SAR Mn.)
Minimum
(SAR Mn.)
SAR -25 (202) (191) (209) (169)
*Profit rate movements affect reported equity through retained earnings, i.e. increases or decreases in financing and investment income.

Notes to the Consolidated Financial Statements
An
nu
al
Re
po
rt
20
1818
9
About the BankAbout the Bank
Value DriversValue Drivers
LeadershipLeadership
StrategyStrategy
PerformancePerformance
Corporate GovernanceCorporate Governance
Financial ReportsFinancial Reports
Supplementary InformationSupplementary Information
Commission sensitivity of assets, liabilities and off balance sheet itemsCommission sensitivity of assets, liabilities and off balance sheet items
2018
Less than 3 months
(SAR ’000)
3 to 6 months
(SAR ’000)
6 to 12 months
(SAR ’000)
1 to 5 years
(SAR ’000)
Over 5 years
(SAR ’000)
Non- Commission
Sensitive
Total
(SAR ’000)
Assets
Cash and balance with SAMA 35,112,408 – – – – 8,133,635 43,246,043
Due from banks and
other financial institutions 11,306,178 987,681 7,810,067 9,647,834 – 1,056,251 30,808,011
Investments
Investment in an associate – – – – – 172,753 172,753
Investments held at
amortised cost 23,952,560 – 13,318,036 2,574,169 – 39,844,765
Investments held as FVSI – – – 1,941,584 1,941,584
Available-for-sale investments – – – 1,103,463 – 1,103,463
Financing, net
Corporate Mutajara 17,239,834 19,924,825 3,958,429 4,891,415 – – 46,014,503
Instalment sale 13,409,580 13,669,220 21,812,332 99,409,717 23,673,937 – 171,974,786
Murabaha 4,064,638 4,406,381 182 4,784,157 858,791 – 14,114,149
Credit cards 1,959,351 – – – – – 1,959,351
Other assets – – – – – 13,824,422 13,824,422
Total assets 107,044,549 38,988,108 33,581,010 132,051,159 30,151,944 23,187,061 365,003,830
Liabilities
Due to banks and
other financial institutions 6,534,389 – – – – 755,235 7,289,624
Customer deposits 53,768,764 12,293,302 23,253,246 179,101,531 – – 268,416,843
Customers’ time investments 17,027,753 213,057 1,448,415 – – – 18,689,225
Other customer accounts 1,362,776 311,575 589,356 4,539,350 – – 6,803,057
Other liabilities – – – – – 15,251,063 15,251,063
Total liabilities 78,693,681 12,817,934 25,291,017 183,640,881 – 16,006,298 316,449,812
Gap 28,350,868 26,170,174 8,289,993 (51,589,722) 30,151,944 7,180,763 48,554,018
Profit rate sensitivity – On statement of
financial positions 28,350,868 26,170,174 8,289,993 (51,589,722) 30,151,944 7,180,763 48,554,018
Profit rate sensitivity – Off statement of
financial positions 439,043 – – – – – 439,043
Total profit rate sensitivity gap 27,911,825 26,170,174 8,289,993 (51,589,722) 30,151,944 7,180,763 48,114,975
Cumulative profit rate sensitivity gap 27,911,825 54,081,999 62,371,992 10,782,270 41,990,464 48,114,975 90,228,289
27,911,825 54,081,999 62,371,992

Notes to the Consolidated Financial StatementsA
nn
ua
l R
ep
ort
2
018
190
About the BankAbout the Bank
Value DriversValue Drivers
LeadershipLeadership
StrategyStrategy
PerformancePerformance
Corporate GovernanceCorporate Governance
Financial ReportsFinancial Reports
Supplementary InformationSupplementary Information
The Bank manages exposure to the effects of various risks associated with fluctuations in the prevailing levels of market
commission rates on its financial position and cash flows.
The Board sets limits on the level of mismatch of commission rate reprising that may be undertaken, which is monitored daily
by Bank Treasury.
The table below summarises the Bank’s exposure to profit rate risks. Included in the table are the Bank’s financial instruments
at carrying amounts, categorised by the earlier of contractual repricing or maturity dates.
The Bank is exposed to profit rate risk as a result of mismatches or gaps in the amounts of assets and liabilities and off balance
sheet instruments that mature or re-price in a given period. The Bank manages this risk by matching the re-pricing of assets
and liabilities through risk management strategies.
2017
Less than 3
months
(SAR ’000)
3 to 6
months
(SAR ’000)
6 to 12
months
(SAR ’000)
1 to 5
years
(SAR ’000)
Over 5
years
(SAR ’000)
Non
Commission
Sensitive
Total
(SAR ’000)
Assets
Cash and balance with SAMA 39,687,434 – – – – 8,595,037 48,282,471
Due from banks and
other financial institutions 2,217,734 113,993 5,905,141 1,349,887 – 1,123,040 10,709,795
Investments
Investment in an associate – – – – – 124,825 124,825
Investments held at
amortised cost 23,300,000 2,025,000 – 7,135,000 1,598,008 – 34,058,008
Investments held as FVSI – – – – 389,193 389,193
Available-for-sale investments – – – – 1,829,066 – 1,829,066
Financing, net
Corporate Mutajara 15,075,878 19,326,741 3,443,515 7,637,634 1,911,066 – 47,394,834
Instalment sale 19,190,499 10,039,850 18,901,845 104,625,719 18,456,359 – 171,214,272
Murabaha 3,768,368 2,666,288 1,687,143 3,178,456 2,711,479 – 14,011,734
Credit cards 914,733 – – – – – 914,733
Other assets – – – – – 4,537,079 4,537,079
Total assets 104,154,647 34,171,873 29,937,642 123,926,696 26,895,171 14,379,981 333,466,010
Liabilities
Due to banks and
other financial institutions 4,772,259 – – – – 750,308 5,522,567
Customer deposits 50,426,040 11,529,046 21,807,626 167,967,056 – 251,729,768
Customers’ time investments 14,885,092 91,881 940,423 – – – 15,917,263
Other customer accounts 1,083,604 247,747 468,623 3,609,439 5,409,414
Other liabilities – – – – – 8,455,319 8,455,319
Total liabilities 71,166,995 11,868,674 23,216,672 171,576,495 – 9,205,627 287,034,463

Notes to the Consolidated Financial Statements
An
nu
al
Re
po
rt
20
1819
1
About the BankAbout the Bank
Value DriversValue Drivers
LeadershipLeadership
StrategyStrategy
PerformancePerformance
Corporate GovernanceCorporate Governance
Financial ReportsFinancial Reports
Supplementary InformationSupplementary Information
2017
Less than 3
months
(SAR ’000)
3 to 6
months
(SAR ’000)
6 to 12
months
(SAR ’000)
1 to 5
years
(SAR ’000)
Over 5
years
(SAR ’000)
Non
Commission
Sensitive
Total
(SAR ’000)
Gap 32,987,652 22,303,199 6,720,970 (47,649,799) 26,895,171 5,174,354 46,431,547
Profit rate sensitivity – On statement of
financial positions 32,987,652 22,303,199 6,720,970 (47,649,799) 26,895,171 5,174,354 46,431,547
Profit rate sensitivity – Off statement of
financial positions 472,420 – – – – – 472,420
Total profit rate sensitivity gap 32,515,232 22,303199 6,720,970 (47,649,799) 26,895,171 5,174,354 45,959,127
Cumulative profit rate sensitivity gap 32,515,232 50,538,583 58,740,173 13,056,216 41,907,813 – 87,071,372
27,911,825 54,081,999 62,371,992
The tables below summarise the Bank’s exposure to foreign currency exchange rate risk at 31 December 2018 and 2017 and
the concentration of currency risks. Included in the table are the Bank’s fi nancial instruments at carrying amounts, categorised by
currency:
2018
UAE Dirham
(SAR ’000)
Japanese Yen
(SAR ’000)
Euro
(SAR ’000)
Malaysian Ringgit
(SAR ’000)
US Dollar
(SAR ’000)
Pound Sterling
(SAR ’000)
Other
(SAR ’000)
Total
(SAR ’000)
Assets
Cash and cash equivalents 25,946 – 29,291 193,088 568,393 15,538 504,016 1,336,273
Due from banks and other
financial institutions 117,748 5,302 145,528 520,081 1,979,909 30,803 721,623 3,520,994
Financing, net – – – 4,564,609 5,077,371 – 3,778,869 13,420,848
Investments – – 375 1,305,296 1,132,989 – 255,390 2,694,050
Fixed assets 1,226 – 6,578 41,423 269,965 993 36,782 356,966
Other assets, net – – 1,258 174,711 63,244 332 17,209 256,754
Total assets 144,919 5,302 183,029 6,799,208 9,091,871 47,665 5,313,890 21,585,885
Liabilities
Due to banks and other
financial institutions 71 – 5,169 569,557 3,304,930 17 (564,139) 3,315,605
Customer deposits 9,629 2,284 109,079 5,146,634 1,268,627 48,735 4,863,308 11,448,296
Other liabilities 17,305 699 97,032 117,000 695,523 8,882 196,799 1,133,241
Total liabilities 27,005 2,983 211,280 5,833,192 5,269,080 57,634 4,495,969 15,897,143
Net 117,914 2,319 28,250 966,017 3,822,791 (9,969) 817,921 5,688,743117,914 2,319 (28,250) 966,017 3,822,791 (9,969) 817,921 5,688,743

Notes to the Consolidated Financial StatementsA
nn
ua
l R
ep
ort
2
018
192
About the BankAbout the Bank
Value DriversValue Drivers
LeadershipLeadership
StrategyStrategy
PerformancePerformance
Corporate GovernanceCorporate Governance
Financial ReportsFinancial Reports
Supplementary InformationSupplementary Information
2017
UAE
Dirham
(SAR ’000)
Japanese
Yen
(SAR ’000)
Euro
(SAR ’000)
Malaysian
Ringgit
(SAR ’000)
US Dollar
(SAR ’000)
Pound
Sterling
(SAR ’000)
Other
(SAR ’000)
Total
(SAR ’000)
Assets
Cash and cash equivalents 25,828 – 23,232 356,412 370,979 21,031 587,309 1,384,791
Due from banks and other
financial institutions 72,459 3,393 195,812 858,354 554,364 33,096 705,180 2,422,658
Financing, net – – 393 1,634,458 864,990 – 257,432 2,757,273
Investments – – – 5,522,749 4,389,826 – 3,724,296 13,636,871
Fixed assets 55 – 5,174 42,091 142,676 549 36,702 227,247
Other assets, net – – 655 191,139 61,125 (24) 34,003 286,898
Total assets 98,342 3,393 225,266 8,605,203 6,383,960 54,652 5,344,922 20,715,738
Liabilities
Due to banks and other
financial institutions 12,176 – 2,085 1,100,092 493,262 18 501,812 2,109,445
Customer deposits 3,711 2,639 186,830 6,865,588 1,054,707 56,596 4,498,133 12,668,204
Other liabilities 13,926 910 60,415 91,245 414,488 7,750 218,845 807,579
Total liabilities 29,813 3,549 249,330 8,056,925 1,962,457 64,364 5,218,790 15,585,228
Net 68,529 (156) (24,064) 548,278 4,421,503 (9,712) 126,132 5,130,51068,529 (156) (24,064) 548,278 4,421,503 (9,712) 126,132 5,130,510
Foreign currency risksForeign currency risks
Currency risk represents the risk of change in the value of financial instruments due to changes in foreign exchange rates.
The Bank management has set limits on positions by currencies, which are regularly monitored to ensure that positions are
maintained within the limits.
The table below shows the currencies to which the Bank has a significant exposure as at 31 December 2018 on its non-trading
monetary assets and liabilities and forecasted cash flows. The analysis calculates the effect of reasonable possible movement
of the currency rate against SAR, with all other variables held constant, on the statement of income (due to the fair value of the
currency sensitive non-trading monetary assets and liabilities) and equity. A positive effect shows a potential increase in the
statement of income statement of income or equity, whereas a negative effect shows a potential net reduction in the statement
of income or statement of changes in shareholders’ equity.

Notes to the Consolidated Financial Statements
An
nu
al
Re
po
rt
20
1819
3
About the BankAbout the Bank
Value DriversValue Drivers
LeadershipLeadership
StrategyStrategy
PerformancePerformance
Corporate GovernanceCorporate Governance
Financial ReportsFinancial Reports
Supplementary InformationSupplementary Information
Currency exposures as at 31 December 2018 Change in currencyrate in %
Effect on net income (SAR Mn.)
Effect on equity (SAR Mn.)
AED +/-2 2,358 2,358
USD +/-2 76,146 76,146
EUR +/-5 -768 -768
INR +/-5 1,813 1,813
PKR +/-5 547 547
Currency exposures as at 31 December 2017 Change in currency
rate in %
Effect on net income
(SAR million)
Effect on equity
(SAR million)
AED +/-2 2.12 2.12
USD +/-2 88.66 88.66
EUR +/-5 -0.98 -0.98
INR +/-5 0.40 0.40
PKR +/-5 0.87 0.87
Currency positionCurrency position
The Bank manages exposure to the effects of fluctuations in prevailing foreign currency exchange rates on its financial position
and cash flows. The Board of Directors sets limits on the level of exposure by currency and in total for both overnight and
intraday positions, which are monitored daily. At the end of the year, the Bank had the following significant net exposures
denominated in foreign currencies:
2018(SAR ’000)
(Long/(short)
2017
(SAR ’000)
(Long/(short)
US Dollar 3,807,308 4,432,919
Japanese Yen 2,319 -157
Euro -15,364 -19,569
Pound Sterling -7,569 -9,713
Others 282,013 115,844
Total 4,068,707 4,519,324

Notes to the Consolidated Financial StatementsA
nn
ua
l R
ep
ort
2
018
194
About the BankAbout the Bank
Value DriversValue Drivers
LeadershipLeadership
StrategyStrategy
PerformancePerformance
Corporate GovernanceCorporate Governance
Financial ReportsFinancial Reports
Supplementary InformationSupplementary Information
(c) Price risk(c) Price risk
The Bank has certain investments which are carried at fair value through the income statement (FVSI) and includes investments
in quoted mutual funds and other investments. Price risk arises due to changes in quoted market prices of these mutual funds.
As these investments are in a limited number of funds and are not significant to the total investment portfolio, the Bank monitors
them periodically and determines the risk of holding them based on changes in market prices.
Other investments have little or no risks as these are bought for immediate sales. Investments are made only with a confirmed
sale order and therefore involve minimal risk.
Equity price risk Equity price risk
Equity risk refers to the risk of decrease in fair values of equities in the Bank’s non-trading investment portfolio as a result of
reasonable possible changes in levels of equity indices and the value of individual stocks.
The effect on the Bank’s equity investments held as FVOCI/available-for-sale due to reasonable possible change in prices,
with all other variables held constant is as follows:
31 December 2018 31 December 2017
Local Market indices Change inequity price %
Effect in SAR million
Change in
equity price %
Effect in
SAR million
Local Share Equity + /- 10 +/- 107,910 + /- 10 +/- 77,129
(d) Operational risk(d) Operational risk
Operational risk is the risk of loss resulting from inadequate or failed internal processes, people, systems, and external events.
Operational risk is inherent in most of the Bank’s activities this necessitates an integrated approach to the identification,
measurement and monitoring of operational risk.
An Operational Risk Management Unit (ORMU) has been established within the Credit and Risk Management Group which
facilitates the management of Operational Risk within the Bank. ORMU facilitates the management of Operational Risk by setting
policies, developing systems, tools and methodologies, overseeing their implementation and use within the business units and
providing ongoing monitoring and guidance across the Bank.
The three primary operational risk management processes in the Bank are Risk Control Self Assessment, Operational Loss
Database and eventual implementation of Key Risk Indicators which are designed to function in a mutually reinforcing manner.
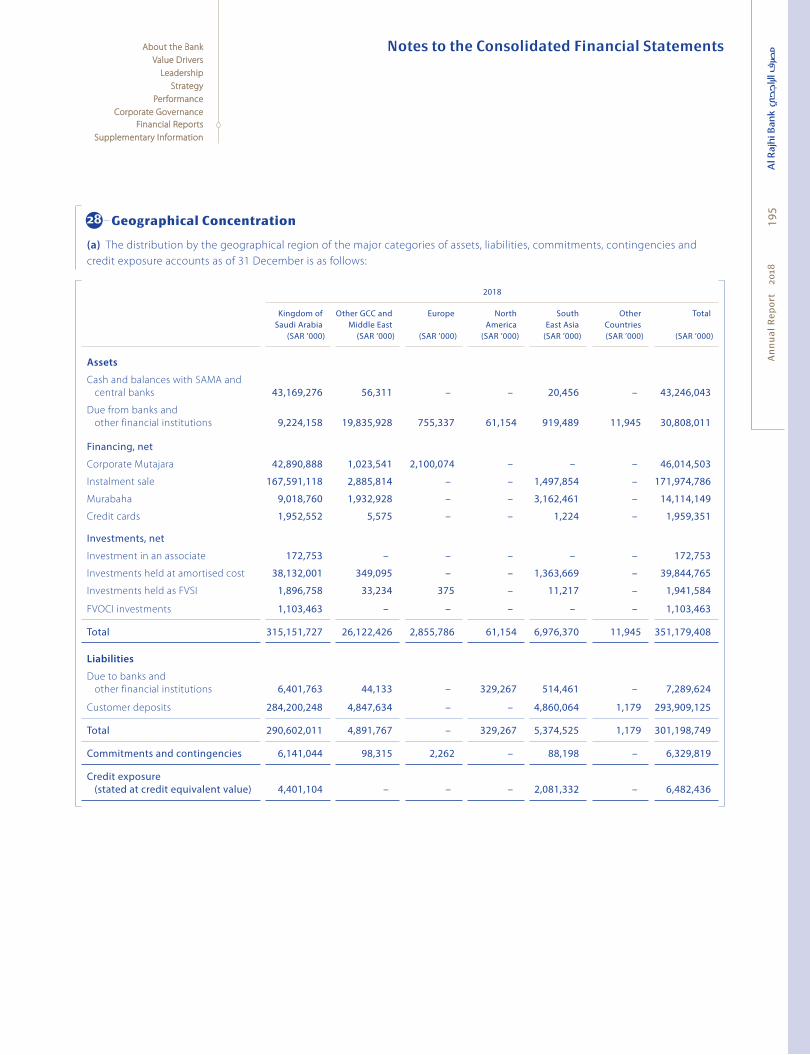
Notes to the Consolidated Financial Statements
An
nu
al
Re
po
rt
20
1819
5
About the BankAbout the Bank
Value DriversValue Drivers
LeadershipLeadership
StrategyStrategy
PerformancePerformance
Corporate GovernanceCorporate Governance
Financial ReportsFinancial Reports
Supplementary InformationSupplementary Information
Geographical Concentration
(a) The distribution by the geographical region of the major categories of assets, liabilities, commitments, contingencies and
credit exposure accounts as of 31 December is as follows:
2018
Kingdom of Saudi Arabia
(SAR ’000)
Other GCC and Middle East
(SAR ’000)
Europe
(SAR ’000)
North America
(SAR ’000)
South East Asia
(SAR ’000)
Other Countries(SAR ’000)
Total
(SAR ’000)
Assets
Cash and balances with SAMA and
central banks 43,169,276 56,311 – – 20,456 – 43,246,043
Due from banks and
other financial institutions 9,224,158 19,835,928 755,337 61,154 919,489 11,945 30,808,011
Financing, net
Corporate Mutajara 42,890,888 1,023,541 2,100,074 – – – 46,014,503
Instalment sale 167,591,118 2,885,814 – – 1,497,854 – 171,974,786
Murabaha 9,018,760 1,932,928 – – 3,162,461 – 14,114,149
Credit cards 1,952,552 5,575 – – 1,224 – 1,959,351
Investments, net
Investment in an associate 172,753 – – – – – 172,753
Investments held at amortised cost 38,132,001 349,095 – – 1,363,669 – 39,844,765
Investments held as FVSI 1,896,758 33,234 375 – 11,217 – 1,941,584
FVOCI investments 1,103,463 – – – – – 1,103,463
Total 315,151,727 26,122,426 2,855,786 61,154 6,976,370 11,945 351,179,408
Liabilities
Due to banks and
other financial institutions 6,401,763 44,133 – 329,267 514,461 – 7,289,624
Customer deposits 284,200,248 4,847,634 – – 4,860,064 1,179 293,909,125
Total 290,602,011 4,891,767 – 329,267 5,374,525 1,179 301,198,749
Commitments and contingencies 6,141,044 98,315 2,262 – 88,198 – 6,329,819
Credit exposure (stated at credit equivalent value) 4,401,104 – – – 2,081,332 – 6,482,436
28

Notes to the Consolidated Financial StatementsA
nn
ua
l R
ep
ort
2
018
196
About the BankAbout the Bank
Value DriversValue Drivers
LeadershipLeadership
StrategyStrategy
PerformancePerformance
Corporate GovernanceCorporate Governance
Financial ReportsFinancial Reports
Supplementary InformationSupplementary Information
2017
Kingdom of
Saudi Arabia
(SAR ’000)
Other GCC and
Middle East
(SAR ’000)
Europe
(SAR ’000)
North
America
(SAR ’000)
South
East Asia
(SAR ’000)
Other
Countries
(SAR ’000)
Total
(SAR ’000)
Assets
Cash and balances with SAMA and
central banks 47,364,215 563,370 – – 354,887 – 48,282,472
Due from banks and
other financial institutions 2,873,774 6,298,191 233,716 271,962 1,030,678 1,474 10,709,795
Financing, net
Corporate Mutajara 45,733,013 – 1,661,821 – – – 47,394,834
Instalment sale 166,922,446 2,553,313 – – 1,680,651 – 171,156,410
Murabaha 9,003,654 1,167,348 – – 3,840,732 – 14,011,734
Credit cards 889,808 3,789 – – 1,365 – 894,962
Investments, net
Investment in an associate 124,825 – – – – – 124,825
Investments held at amortised cost 32,512,949 177,189 – – 1,367,870 – 34,058,008
Investments held as FVSI 2,188 288,893 393 – 121,206 – 412,680
FVOCI investments 1,636,474 168,191 – – 915 1,805,580
Total 307,140,977 11,220,284 1,895,930 271,962 8,398,304 1,474 328,928,931
Liabilities
Due to banks and
other financial institutions 4,371,081 422,487 6,615 251,218 467,968 3,198 5,522,567
Customer deposits 261,776,977 4,429,765 – – 6,849,703 – 273,056,445
Total 266,148,058 4,852,252 6,615 251,218 7,317,671 3,198 278,579,012
Commitments and contingencies 10,167,478 406,234 2,818 – 2,989,605 1,300 13,567,435
Credit exposure (stated at credit equivalent value) 5,109,109 178,503 1,409 – 1,486,847 600 6,776,468
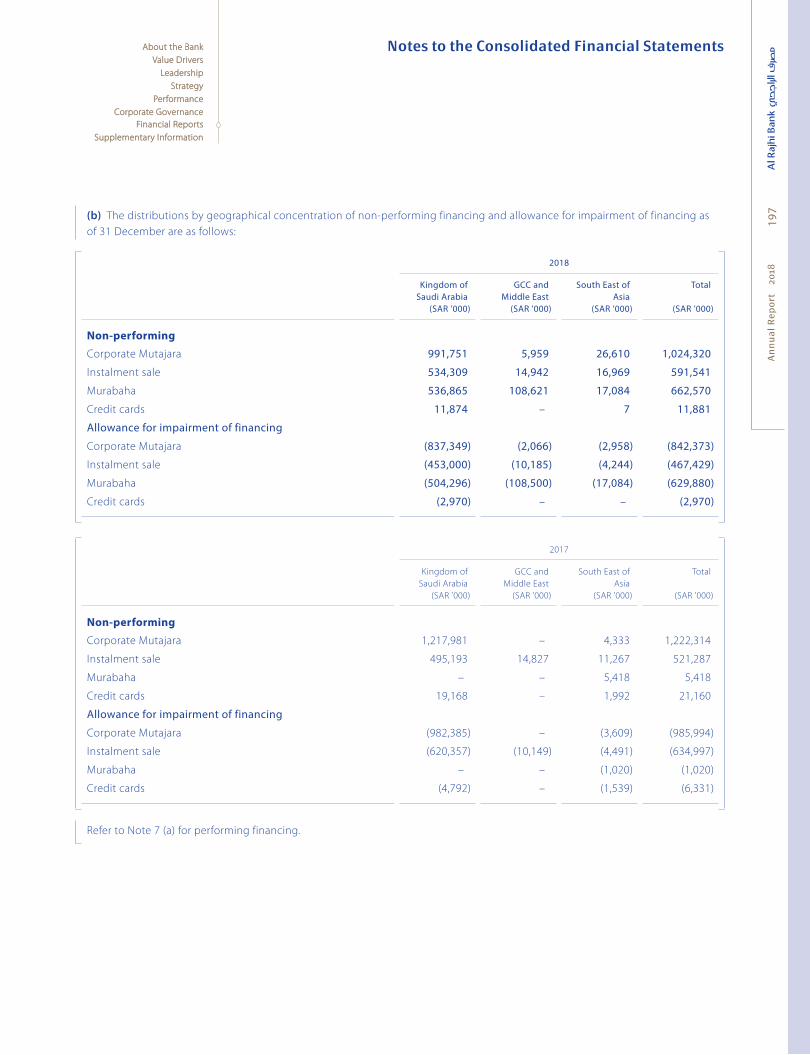
Notes to the Consolidated Financial Statements
An
nu
al
Re
po
rt
20
1819
7
About the BankAbout the Bank
Value DriversValue Drivers
LeadershipLeadership
StrategyStrategy
PerformancePerformance
Corporate GovernanceCorporate Governance
Financial ReportsFinancial Reports
Supplementary InformationSupplementary Information
(b) The distributions by geographical concentration of non-performing financing and allowance for impairment of financing as
of 31 December are as follows:
2018
Kingdom of Saudi Arabia
(SAR ’000)
GCC and Middle East
(SAR ’000)
South East of Asia
(SAR ’000)
Total
(SAR ’000)
Non-performing
Corporate Mutajara 991,751 5,959 26,610 1,024,320
Instalment sale 534,309 14,942 16,969 591,541
Murabaha 536,865 108,621 17,084 662,570
Credit cards 11,874 – 7 11,881
Allowance for impairment of financing
Corporate Mutajara (837,349) (2,066) (2,958) (842,373)
Instalment sale (453,000) (10,185) (4,244) (467,429)
Murabaha (504,296) (108,500) (17,084) (629,880)
Credit cards (2,970) – – (2,970)
2017
Kingdom of
Saudi Arabia
(SAR ’000)
GCC and
Middle East
(SAR ’000)
South East of
Asia
(SAR ’000)
Total
(SAR ’000)
Non-performing
Corporate Mutajara 1,217,981 – 4,333 1,222,314
Instalment sale 495,193 14,827 11,267 521,287
Murabaha – – 5,418 5,418
Credit cards 19,168 – 1,992 21,160
Allowance for impairment of financing
Corporate Mutajara (982,385) – (3,609) (985,994)
Instalment sale (620,357) (10,149) (4,491) (634,997)
Murabaha – – (1,020) (1,020)
Credit cards (4,792) – (1,539) (6,331)
Refer to Note 7 (a) for performing financing.

Notes to the Consolidated Financial StatementsA
nn
ua
l R
ep
ort
2
018
198
About the BankAbout the Bank
Value DriversValue Drivers
LeadershipLeadership
StrategyStrategy
PerformancePerformance
Corporate GovernanceCorporate Governance
Financial ReportsFinancial Reports
Supplementary InformationSupplementary Information
Fair Value of Financial Assets and Liabilities
Determination of fair value and fair value hierarchyDetermination of fair value and fair value hierarchy
The Bank uses the following hierarchy for determining and disclosing the fair value of financial instruments:
Level 1: Quoted prices in active markets for the same instrument (i.e. without modification or additions).
Level 2: Quoted prices in active markets for similar assets and liabilities or other valuation techniques for which all significant
inputs are based on observable market data.
Level 3: Valuation techniques for which any significant input is not based on observable market data.
Fair value is the price that would be received to sell an asset or paid to transfer a liability in an orderly transaction between
market participants at the measurement date. The fair value measurement is based on the presumption that the transaction
takes place either:
– In the accessible principal market for the asset or liability, or
– In the absence of a principal market, in the most advantageous accessible market for the asset or liability.
Carrying amounts and fair value:Carrying amounts and fair value:
The following table shows the carrying amount and fair values of financial assets and financial liabilities, including their levels in
the fair value hierarchy. It does not include fair value information for financial assets and financial liabilities not measured at fair
value if the carrying amount is a reasonable approximation of fair value.
31 December 2018
Carrying value(SAR ’000)
Level 1(SAR ’000)
Level 2(SAR ’000)
Level 3(SAR ’000)
Total(SAR ’000)
Financial assets
Financial assets measured at fair value
Investments held at FVSI 1,141,584 – 1,141,584 – 1,141,584
FVOCI investment 1,103,463 1,079,101 – 24,362 1,103,463
Sukuk 800,000 – – 800,000 800,000
Financial assets not measured at fair value
Due from banks and other financial institutions 30,808,011 – – 30,701,027 30,701,027
Investments held at amortised cost
– Murabaha with Saudi Government and
SAMA 22,477,145 – – 22,478,958 22,478,958
– Sukuk 17,395,957 – – 17,274,997 17,274,997
Gross financing 241,895,260 – – 242,364,635 242,364,635
Total 315,621,420 1,079,101 1,141,584 313,643,979 315,864,664
Financial liabilities
Financial liabilities not measured at fair value
Due to banks and other financial institutions 7,289,624 – – 7,287,557 7,287,557
Customers’ deposits 293,909,125 – – 293,909,125 293,909,125
Total 301,198,749 – – 301,196,682 301,196,682
29

Notes to the Consolidated Financial Statements
An
nu
al
Re
po
rt
20
1819
9
About the BankAbout the Bank
Value DriversValue Drivers
LeadershipLeadership
StrategyStrategy
PerformancePerformance
Corporate GovernanceCorporate Governance
Financial ReportsFinancial Reports
Supplementary InformationSupplementary Information
31 December 2017
Carrying value
(SAR ’000)
Level 1
(SAR ’000)
Level 2
(SAR ’000)
Level 3
(SAR ’000)
Total
(SAR ’000)
Financial assets
Financial assets measured at fair value
Investments held at FVSI 412,680 – 389,193 23,487 412,680
Available-for-sale investments 1,805,579 771,293 1,034,286 – 1,805,579
Financial assets not measured at fair value
Due from banks and other financial institutions 10,709,795 – – 10,698,223 10,698,223
Investments held at amortised cost
– Murabaha with SAMA 23,452,869 – – 23,459,853 23,459,853
– Sukuk 10,605,139 – – 10,559,636 10,559,636
Gross Financing 239,090,783 – – 248,834,350 248,834,350
Total 286,076,845 771,293 1,423,479 293,575,549 295,770,321
Financial liabilities
Financial liabilities not measured at fair value
Due to banks and other financial institutions 5,522,567 – – 5,522,554 5,522,554
Customers’ deposits 273,056,445 – – 273,056,440 273,056,440
Total 278,579,012 – – 278,578,994 278,578,994
FVSI and FVOCI investments classified as Level 2 include mutual funds, the fair value of which is determined based on the
latest reported net assets value (NAV) as at the date of statement of consolidated financial position.
The Level 3 financial assets measured at fair value represent investments recorded at cost. The carrying value of these
investments approximate fair value.
Gross financing classified as Level 3 has been valued using expected cash flows discounted at relevant SIBOR as at
31 December 2018. Investments held at amortised cost, due to/from banks and other financial institution have been valued
using the actual cash flows discounted at relevant SIBOR/SAMA Murabaha rates as at 31 December 2018.
The value obtained from the relevant valuation model may differ from the transaction price of a financial instrument.
The difference between the transaction price and the model value commonly referred to as “day one profit and loss” is either
amortised over the life of the transaction, deferred until the instrument’s fair value can be determined using market observable
data, or realised through disposal. Subsequent changes in fair value are recognised immediately in the statement of income
without reversal of deferred day one profits and losses.
During the current year, no financial assets/liabilities have been transferred between Level 1 and/or Level 2 fair value hierarchy.

Notes to the Consolidated Financial StatementsA
nn
ua
l R
ep
ort
2
018
200
About the BankAbout the Bank
Value DriversValue Drivers
LeadershipLeadership
StrategyStrategy
PerformancePerformance
Corporate GovernanceCorporate Governance
Financial ReportsFinancial Reports
Supplementary InformationSupplementary Information
Related Party Transactions
In the ordinary course of business, the Bank transacts business with related parties. The related party transactions are governed
by limits set by the Banking Control Law and the regulations issued by SAMA. The nature and balances resulting from such
transactions as at and for the year ended 31 December are as follows:
2018(SAR ’000)
2017
(SAR ’000)
Related parties
Members of the Board of Directors
Mutajara 69,967 39,163
Contingent liabilities* 16,634 –
Current accounts 77,788 586
Companies and establishments guaranteed by members of the Board of Directors
Mutajara 10,242,942 1,585,464
Contingent liabilities* 6,913,183 16,334
Other major shareholders (above 5% equity share)
Mutajara – 3,308,232
Contingent liabilities* – –
Current accounts – –
Other liabilities – 26,067
Associate
Contributions receivable 252,706 121,017
Payable against claims 144,640 150,243
Bank balances 274,705 289,236
*off balance sheet items.
30

Notes to the Consolidated Financial Statements
An
nu
al
Re
po
rt
20
1820
1
About the BankAbout the Bank
Value DriversValue Drivers
LeadershipLeadership
StrategyStrategy
PerformancePerformance
Corporate GovernanceCorporate Governance
Financial ReportsFinancial Reports
Supplementary InformationSupplementary Information
Income and expenses pertaining to transactions with related parties included in the consolidated financial statements for the
years ended 31 December are as follows:
2018(SAR ’000)
2017
(SAR ’000)
Income from financing and other 139,496 194,190
Mudaraba fees 68,272 49,860
Employees’ salaries and benefits (air tickets) 4,142 4,253
Rent and premises related expenses 2,238 1,131
Contribution – Policies written 1,059,392 1,339,545
Claims incurred and notified during the period 900,207 1,139,983
Claims paid 905,840 1,023,048
Board of Directors’ remunerations 5,945 5,418
The amounts of compensations recorded in favour of or paid to the Board of Directors and the Executive Management Personnel
during the years ended 31 December are as follows:
2018(SAR ’000)
2017
(SAR ’000)
Short-term benefits 85,579 37,866
Provision for end of service benefits 11,536 1,280
The executive management personnel are those persons having authority and responsibility for planning, directing and
controlling the activities of the Banks directly or indirectly.

Notes to the Consolidated Financial StatementsA
nn
ua
l R
ep
ort
2
018
202
About the BankAbout the Bank
Value DriversValue Drivers
LeadershipLeadership
StrategyStrategy
PerformancePerformance
Corporate GovernanceCorporate Governance
Financial ReportsFinancial Reports
Supplementary InformationSupplementary Information
Mudaraba Funds
Mudaraba funds as of 31 December comprise the following:
2018(SAR ’000)
2017
(SAR ’000)
Customers’ Mudaraba and investments 21,070,580 21,199,185
Current accounts, metals – 2,031
Total 21,070,580 21,201,216
Mudaraba and investments represents customer’s investment portfolio managed by Al Rajhi Capital Company and are considered
as off balance sheet. consistent with the accounting policies of the Group, such balances are not included in the consolidated
financial statements as these are held by the Group in fiduciary capacity.
Special Commissions Excluded from the Consolidated Statement of Income
The following represents the movements in charities account, which is included in other liabilities (see Note 13):
2018(SAR ’000)
2017
(SAR ’000)
Balance at beginning of the year 16,854 23,785
Additions during the year 40,520 5,201
Payments made during the year (1,024) (12,132)
Balance at end of the year 56,350 16,854
Investment Management Services
The Group offers investment services to its customers. The Group has established a number of Mudaraba funds in different
investment aspects. These funds are managed by the Bank’s Investment Department, and a portion of the funds is also invested
in participation with the Group. The Group also offers investment management services to its customers through its subsidiary,
which include management of funds with total assets under management of SAR 41,294 Mn. (2017: SAR 26,595 Mn.). The mutual
funds are not controlled by the Bank and neither are under significant influence to be considered as associates. Mutual funds’
financial statements are not included in the consolidated statement of financial position of the Group. The Group’s share of
investments in these funds is included under investments, and is disclosed under related party transactions. Funds invested by
the Group in those investment funds amounted to SAR 1,142 Mn. at 31 December 2018 (2017: SAR 1,423 Mn.).
31
32
33

Notes to the Consolidated Financial Statements
An
nu
al
Re
po
rt
20
1820
3
About the BankAbout the Bank
Value DriversValue Drivers
LeadershipLeadership
StrategyStrategy
PerformancePerformance
Corporate GovernanceCorporate Governance
Financial ReportsFinancial Reports
Supplementary InformationSupplementary Information
Capital Adequacy
The Bank’s objectives when managing capital are, to comply with the capital requirements set by SAMA to safeguard the Bank’s
ability to continue as a going concern; and to maintain a strong capital base.
Capital adequacy and the use of regulatory capital are monitored daily by the Bank’s Management, SAMA requires the banks to
hold the minimum level of the regulatory capital and also to maintain a ratio of total regulatory capital to the risk-weighted
assets at or above 8%.
The Bank monitors the adequacy of its capital using ratios established by SAMA. These ratios measure capital adequacy by
comparing the Bank’s eligible capital with its consolidated statement of financial position, commitments and contingencies,
to reflect their relative risk as of 31 December 2018 and 2017.
2018(SAR ’000)
2017
(SAR ’000)
Credit risk weighted assets 222,309,112 219,687,988
Operational risk weighted assets 28,094,351 26,832,383
Market risk weighted assets 4,102,847 4,594,750
Total Pillar I – risk weighted assets 254,506,310 251,115,121
Tier I – capital 48,554,018 55,750,918
Tier II – capital 2,778,864 2,746,100
Total Tier I and II capital 51,332,882 58,497,018
Capital Adequacy Ratio
Tier I ratio (%) 19.08 22.20
Tier I and II ratio (%) 20.17 23.29
Standards Issued but not yet Effective
IFRS 16 “Leases”IFRS 16 “Leases”
IFRS 16 – “Leases”, applicable for the period beginning on or after 1 January 2019. The new standard eliminates the current
dual accounting model for lessees under IAS 17, which distinguishes between on-balance sheet finance leases and off-balance
sheet operating leases. Instead, IFRS 16 proposes on-balance sheet accounting model. The impact is not material for the Bank.
IAS 19 “Employee Benefits”IAS 19 “Employee Benefits”
Plan Amendment, Curtailment or Settlement (Amendments to IAS 19) to harmonise accounting practices and to provide more
relevant information for decision-making. An entity applies the amendments to plan amendments, curtailments or settlements
occurring on or after the beginning of the first annual reporting period that begins on or after 1 January 2019.
These amendments are not expected to have material impact on the consolidated financial statements of the Group.
34
35

Notes to the Consolidated Financial StatementsA
nn
ua
l R
ep
ort
2
018
204
About the BankAbout the Bank
Value DriversValue Drivers
LeadershipLeadership
StrategyStrategy
PerformancePerformance
Corporate GovernanceCorporate Governance
Financial ReportsFinancial Reports
Supplementary InformationSupplementary Information
Approval of the Board of Directors
The consolidated financial statements were approved by the Board of Directors on 5 Jumada II 1440H (corresponding to
10 February 2019).
Comparative Figures
Figures have been rearranged or reclassified wherever necessary for the purpose of better presentation, however, no significant
rearrangements or reclassifications have been made in these consolidated financial statements.
Other Adjustment
The Bank has conducted a review of the timing of the recognition of up-front fees and special commission income relating
to retail credit products. As a result of the review, the method of the application of the accounting policy on timing of the
recognition of up-front fees and special commission income has been amended to appropriately reflect the systematic deferral
of the recognition of such income. Based on materiality considerations, an adjustment of SAR 799.356 Mn. was only made to the
opening retained earnings as at 1 January 2018 with a corresponding adjustment to deferred income as at that date.
Subsequent Events
The Board of Directors proposed, on 3 January 2019, a distribution of final dividends to the shareholders for the year amounting
to SAR 3,656.25 Mn., of SAR 2.25 per share.
In addition, the Board of Directors has recommended to increase the share capital to SAR 25,000 Mn. by granting share dividends
of 7 shares for every 13 shares owned. The Board’s proposal is subject to the approval of the Extraordinary General Assembly in
the next meeting.
36
37
38
39
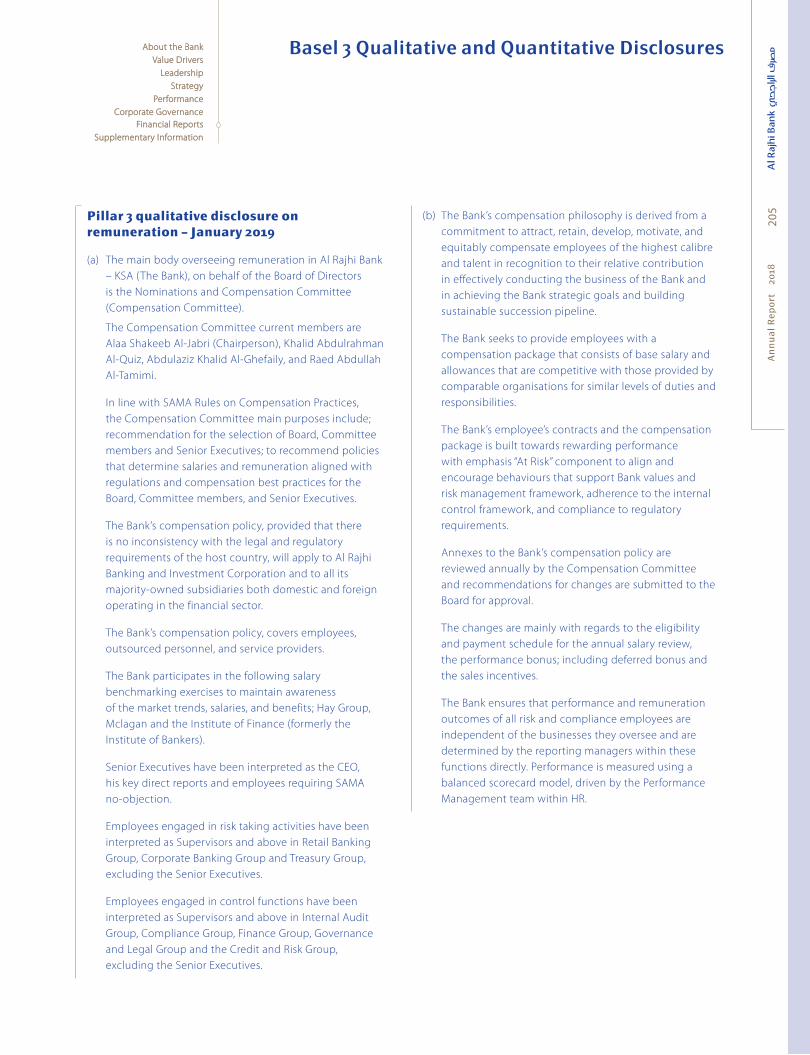
An
nu
al
Re
po
rt
20
1820
5
About the BankAbout the Bank
Value DriversValue Drivers
LeadershipLeadership
StrategyStrategy
PerformancePerformance
Corporate GovernanceCorporate Governance
Financial ReportsFinancial Reports
Supplementary InformationSupplementary Information
Basel 3 Qualitative and Quantitative Disclosures
Pillar 3 qualitative disclosure on remuneration – January 2019
(a) The main body overseeing remuneration in Al Rajhi Bank
– KSA (The Bank), on behalf of the Board of Directors
is the Nominations and Compensation Committee
(Compensation Committee).
The Compensation Committee current members are
Alaa Shakeeb Al-Jabri (Chairperson), Khalid Abdulrahman
Al-Quiz, Abdulaziz Khalid Al-Ghefaily, and Raed Abdullah
Al-Tamimi.
In line with SAMA Rules on Compensation Practices,
the Compensation Committee main purposes include;
recommendation for the selection of Board, Committee
members and Senior Executives; to recommend policies
that determine salaries and remuneration aligned with
regulations and compensation best practices for the
Board, Committee members, and Senior Executives.
The Bank’s compensation policy, provided that there
is no inconsistency with the legal and regulatory
requirements of the host country, will apply to Al Rajhi
Banking and Investment Corporation and to all its
majority-owned subsidiaries both domestic and foreign
operating in the financial sector.
The Bank’s compensation policy, covers employees,
outsourced personnel, and service providers.
The Bank participates in the following salary
benchmarking exercises to maintain awareness
of the market trends, salaries, and benefits; Hay Group,
Mclagan and the Institute of Finance (formerly the
Institute of Bankers).
Senior Executives have been interpreted as the CEO,
his key direct reports and employees requiring SAMA
no-objection.
Employees engaged in risk taking activities have been
interpreted as Supervisors and above in Retail Banking
Group, Corporate Banking Group and Treasury Group,
excluding the Senior Executives.
Employees engaged in control functions have been
interpreted as Supervisors and above in Internal Audit
Group, Compliance Group, Finance Group, Governance
and Legal Group and the Credit and Risk Group,
excluding the Senior Executives.
(b) The Bank’s compensation philosophy is derived from a
commitment to attract, retain, develop, motivate, and
equitably compensate employees of the highest calibre
and talent in recognition to their relative contribution
in effectively conducting the business of the Bank and
in achieving the Bank strategic goals and building
sustainable succession pipeline.
The Bank seeks to provide employees with a
compensation package that consists of base salary and
allowances that are competitive with those provided by
comparable organisations for similar levels of duties and
responsibilities.
The Bank’s employee’s contracts and the compensation
package is built towards rewarding performance
with emphasis “At Risk” component to align and
encourage behaviours that support Bank values and
risk management framework, adherence to the internal
control framework, and compliance to regulatory
requirements.
Annexes to the Bank’s compensation policy are
reviewed annually by the Compensation Committee
and recommendations for changes are submitted to the
Board for approval.
The changes are mainly with regards to the eligibility
and payment schedule for the annual salary review,
the performance bonus; including deferred bonus and
the sales incentives.
The Bank ensures that performance and remuneration
outcomes of all risk and compliance employees are
independent of the businesses they oversee and are
determined by the reporting managers within these
functions directly. Performance is measured using a
balanced scorecard model, driven by the Performance
Management team within HR.

Basel 3 Qualitative and Quantitative DisclosuresA
nn
ua
l R
ep
ort
2
018
206
About the BankAbout the Bank
Value DriversValue Drivers
LeadershipLeadership
StrategyStrategy
PerformancePerformance
Corporate GovernanceCorporate Governance
Financial ReportsFinancial Reports
Supplementary InformationSupplementary Information
(c) Al Rajhi Bank has defined risk management framework
which take into account a range of risks managed
by the Bank, risk appetite contains both qualitative
and quantitative measures across major risk classes
including credit, market, operational and liquidity risk to
ensure performance is measured and monitored on risk
adjusted basis.
Al Rajhi Bank’s compensation policy was designed within
a risk reward framework. Risk factors are an integral
part of the balanced scorecard for Senior Managers
performance management. Risk measures thresholds
have been defined which are required triggers for
variable and long-term bonuses qualifying assessments.
The Chief Risk Officer reviews and provides input on
the incentive plan taking into consideration the risk
and return trade-off. To ensure long term and other
risk factors are fully considered, the proportion of the
variable bonus that is deferred increases with levels
of seniority.
(d) Individual remuneration outcomes are discretionary and
linked to both Al Rajhi Bank and individual performance
outcomes for all Senior Managers and material risk
takers. Al Rajhi Bank implements an online balanced
scorecard performance management framework, based
on the Kaplan model. The KPI’s are cascaded down from
the Bank level, down to individual employees and each
employee’s KPI are measured based on the financial,
processes, customer service and people elements, as
appropriate for their job and seniority level. For senior
staff, there are some standard KPI’s that ensure that
adherence to regulations, Risk and compliance are
constantly considered. Each individual’s performance
is assessed at year end against their agreed balanced
scorecard of financial and non-financial objectives.
The Bank operates within a natural performance
distribution curve, per group, as follows: 5% to be rated
as exceptional, 20% to be rated as outstanding, 65% to
be rated as Strong, 5% to be rated as average, and the
remaining 5% to be rated as poor.
(e) To encourage employees to have a longer-term view,
the Bank defers part of the Bonus for eligible Senior
Managers and outstanding managers.
This deferral is in the form of shares vested over three
years as follows; 1/3 at the beginning of the second year,
1/3 at the beginning of the third year and the remaining
1/3 at the beginning of the fourth year.
The Bank’s compensation includes the provision to
initiate claw back on past bonuses or holdback on
the deferred bonus in instances, inter-alia, where an
employee’s specific deal has failed or are incurring losses
or in relation to gross misconduct, consistent disregard
of bank policy, compliance breaches.
(f ) The Bank’s total compensation approach comprises fixed
and variable compensation. The fixed compensation
includes basic salary, which reflects seniority, experience
and skills and is benchmarked to the KSA banking sector.
Other fixed compensation includes the KSA standard
guaranteed payments for housing, transport and 13th
and 14th months, known in Al Rajhi Bank, as Ramadan
and year end payments.
The variable compensation, for business groups, are
paid either on a monthly, quarterly, half-yearly or annual
basis, depending on the business group, product type or
seniority and individual performance. For the Head office
and other support functions, the variable pay is mainly
in the form of individual annual performance bonus and
is based on seniority and individual performance. For
Senior Staff, at least 40% of their bonus is deferred.
In line with the SAMA Rules on compensation practices,
both, the incentive plans and the Bonus plans (including
the deferred bonus) are approved by both the Chief Risk
Officer and the Board of Directors.
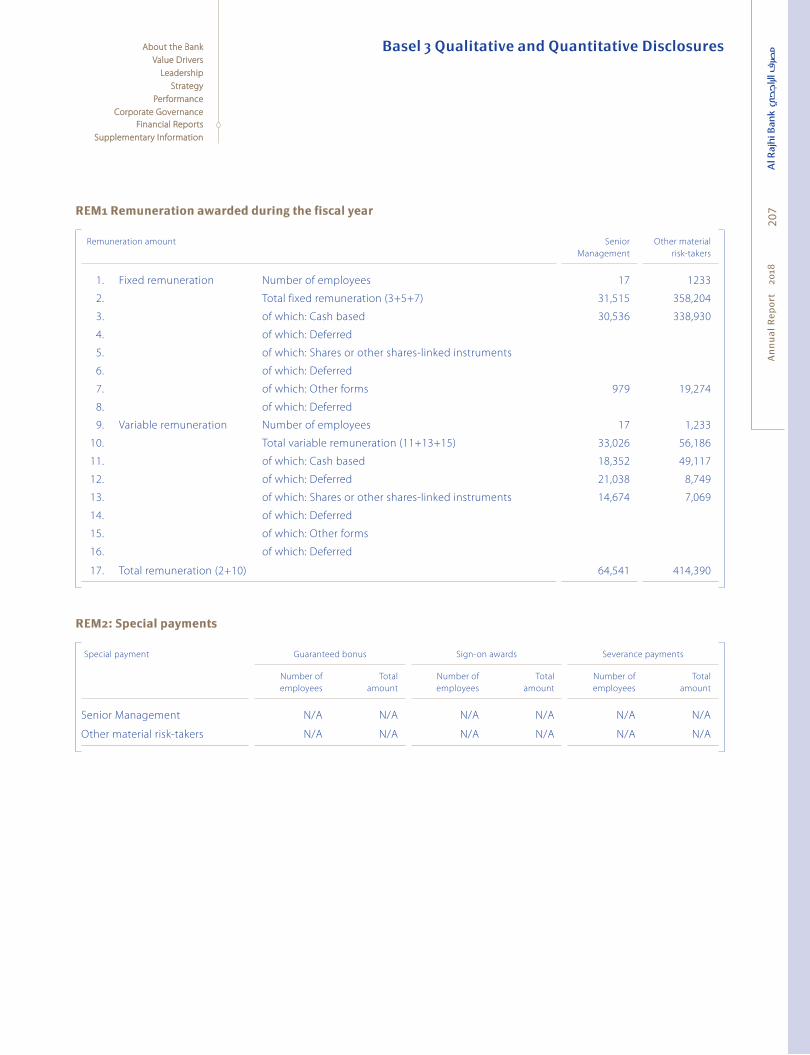
Basel 3 Qualitative and Quantitative Disclosures
An
nu
al
Re
po
rt
20
1820
7
About the BankAbout the Bank
Value DriversValue Drivers
LeadershipLeadership
StrategyStrategy
PerformancePerformance
Corporate GovernanceCorporate Governance
Financial ReportsFinancial Reports
Supplementary InformationSupplementary Information
REM1 Remuneration awarded during the fiscal yearREM1 Remuneration awarded during the fiscal year
Remuneration amount Senior
Management
Other material
risk-takers
1. Fixed remuneration Number of employees 17 1233
2. Total fixed remuneration (3+5+7) 31,515 358,204
3. of which: Cash based 30,536 338,930
4. of which: Deferred
5. of which: Shares or other shares-linked instruments
6. of which: Deferred
7. of which: Other forms 979 19,274
8. of which: Deferred
9. Variable remuneration Number of employees 17 1,233
10. Total variable remuneration (11+13+15) 33,026 56,186
11. of which: Cash based 18,352 49,117
12. of which: Deferred 21,038 8,749
13. of which: Shares or other shares-linked instruments 14,674 7,069
14. of which: Deferred
15. of which: Other forms
16. of which: Deferred
17. Total remuneration (2+10) 64,541 414,390
REM2: Special paymentsREM2: Special payments
Special payment Guaranteed bonus Sign-on awards Severance payments
Number of
employees
Total
amount
Number of
employees
Total
amount
Number of
employees
Total
amount
Senior Management N/A N/A N/A N/A N/A N/A
Other material risk-takers N/A N/A N/A N/A N/A N/A

Basel 3 Qualitative and Quantitative DisclosuresA
nn
ua
l R
ep
ort
2
018
208
About the BankAbout the Bank
Value DriversValue Drivers
LeadershipLeadership
StrategyStrategy
PerformancePerformance
Corporate GovernanceCorporate Governance
Financial ReportsFinancial Reports
Supplementary InformationSupplementary Information
REM3: Deferred remunerationREM3: Deferred remuneration
a b c d e
Deferred and retained remuneration Total amount
of outstanding
deferred
remuneration
Of which: Total amount of
outstanding deferred and
retained remuneration
exposed to ex post explicit
and/or implicit adjustment
Total amount of
amendment during the
year due to ex post
explicit adjustments
Total amount
of amendment
during the
year due to
ex post implicit
adjustments
Total amount
of deferred
remuneration
paid out in the
financial year
Senior Management
Cash 0 0 0 0 0
Shares 10,395,099 10,395,099 0 0 13,463,533
Cash-linked instruments 0 0
Other 0 0 0 0 0
Other material risk-takers
Cash 0 0 0 0 2,753,439
Shares 39,648,502 39,648,502 0 19,145,439
Cash-linked instruments 0 0
Other 0 0 0 0 0
Total 50,043,601 50,043,601 0 0 35,362,411

An
nu
al
Re
po
rt
20
18
209
About the BankAbout the Bank
Value DriversValue Drivers
LeadershipLeadership
StrategyStrategy
PerformancePerformance
Corporate GovernanceCorporate Governance
Financial ReportsFinancial Reports
Supplementary InformationSupplementary Information
Supplementary Information
About this Report
210
Consolidated Statement of Financial Position in USD
211
Consolidated Statement of Income in USD
212
Five Year Summary in USD
213
GRI Content Index
214
Glossary of Key Islamic Finance Terms
217
Corporate Information
219
An
nu
al
Re
po
rt
20
1820
9

An
nu
al
Re
po
rt
20
1821
0About the BankAbout the Bank
Value DriversValue Drivers
LeadershipLeadership
StrategyStrategy
PerformancePerformance
Corporate GovernanceCorporate Governance
Financial ReportsFinancial Reports
Supplementary InformationSupplementary Information
Report structure
This Annual Report of Al Rajhi Bank provides the reader with
a clear and concise picture of how the Bank plans to execute
strategy (as far as it is prudent to disclose such information) in
light of the mega trends shaping its operating environment.
The Report describes the planned course of action by which
the Bank will navigate known and unknown waters as it
perpetuates the value creation process in the short, medium
and long term. The Report covers the various aspects of the
Bank’s business and the interrelationships between them as
it provides the reader with a clearer understanding of future
direction.
The preparation of our Annual Report strengthened and
reinforced integrated thinking across the Bank, making the
Bank more sustainable in creating value over the long term.
In preparing this Report, we drew mainly on the concepts,
principles, and guidelines from the following sources:
International Integrated Reporting Framework
(www.theiirc.org)
The Smart Integrated Reporting MethodologyTM
Global Reporting Initiative Sustainability Reporting Guidelines
– GRI Standards (www.globalreporting.org)
Financial reporting and sustainability reporting are integrated
throughout the contents of this Report to highlight the broad
concept of value creation and capital formation.
Continuing its leadership role in the digital sphere, the Bank has
provided an interactive online report which complements the
printed report while serving the diverse information needs of its
many stakeholder groups.
Report boundary
The Financial Statements within this Report illustrate the
consolidated performance of the entire Group, comprising
Al Rajhi Bank (referred to as “the Bank” in this Report) and its
subsidiaries (collectively referred to as the “Group”, detailed
in Note 1 on page 125). Reporting on the Bank’s social and
environmental impact within the Management Discussion and
Analysis, generally excludes these entities, which account for
a small portion of the Group’s revenue, assets, and workforce.
When contributions by other Group entities are discussed they
are referred to as “Group” or “Consolidated”.
Our key stakeholder groups have been taken into account
when deciding on material aspects to report on, such as topics
that reflect the Bank’s significant economic, environmental,
and social impacts which, in turn, can significantly influence
stakeholder decisions. The Bank’s reporting focuses on aspects
that are material or important – those that may substantively
affect the Bank’s ability to create value over the short, medium
and long term and which have a significant probability of
occurrence.
Compliance
Covering the 12-month period from 1 January to 31 December
2018, this Report is consistent with the Bank’s usual annual
reporting cycle for financial and sustainability reporting. The
contents of the Report are in compliance with all applicable
laws, regulations and standards, and guidelines for voluntary
disclosures. Additional details can be found in the Corporate
Governance Report (pages 85 to 111), Financial Statements and
the Notes thereon (pages 113 to 204), and in the Independent
Auditors’ Report (pages 114 and 119).
When launching new ventures and initiatives the Group always
takes into consideration the financial, economic, social, and
environmental consequences of its actions. With its best in
class systems and risk management processes, the Bank is in
complete compliance with all local regulatory requirements.
Queries
Your comments or questions on this Report are always
welcome. In this regard the Bank invites you to contact:
About this Report

An
nu
al
Re
po
rt
20
1821
1
About the BankAbout the Bank
Value DriversValue Drivers
LeadershipLeadership
StrategyStrategy
PerformancePerformance
Corporate GovernanceCorporate Governance
Financial ReportsFinancial Reports
Supplementary InformationSupplementary Information
As at 31 December 2018(USD ’000)
2017
(USD ’000)
Assets
Cash and balances with Saudi Arabian Monetary Agency (“SAMA”) and other central banks 11,532,278 12,875,326
Due from banks and other financial institutions 8,215,470 2,855,945
Investments 11,483,351 9,706,958
Financing, net 62,416,744 62,276,153
Investment property 346,024 350,402
Property and equipment, net 2,372,690 2,095,501
Other assets 967,799 1,337,457
Total Assets 97,334,355 91,497,741
Liabilities and Shareholders’ Equity
Liabilities
Due to banks and other financial institutions 1,943,900 1,472,685
Customer deposits 78,375,767 72,815,052
Other liabilities 4,066,950 2,343,093
Total Liabilities 84,386,617 76,630,829
Shareholders’ Equity
Share capital 4,333,333 4,333,333
Statutory reserve 4,333,333 4,333,333
Other reserves (93,215) 1,408,449
Retained earnings 3,399,286 3,708,463
Proposed gross dividends and Zakat 975,000 1,083,333
Total Shareholders’ Equity 12,947,738 14,866,911
Total Liabilities and Shareholders’ Equity 97,334,355 91,497,741
The Consolidated Statement of Financial Position and the Consolidated Statement of Income given on pages 211 and 212 are
solely for the convenience of shareholders, investors, bankers and other users of Financial Statements and do not form part of
the financial statements.
Exchange rate of SAR 3.75 per US dollar has been used for the above conversion of SAR Financial Statements into US dollar.
Consolidated Statement of Financial Position in USD

An
nu
al
Re
po
rt
20
1821
2About the BankAbout the Bank
Value DriversValue Drivers
LeadershipLeadership
StrategyStrategy
PerformancePerformance
Corporate GovernanceCorporate Governance
Financial ReportsFinancial Reports
Supplementary InformationSupplementary Information
For the years ended 31 December 2018(USD ’000)
2017
(USD ’000)
Income
Gross financing and investment income 3,669,189 3,354,934
Return on customers’, banks’ and financial institutions’ time investments (135,126) (147,090)
Net financing and investment income 3,534,062 3,207,845
Fee from banking services, net 827,010 719,255
Exchange income, net 201,548 224,490
Other operating income, net 55,919 89,704
Total operating income 4,618,538 4,241,294
Expenses
Salaries and employees’ related benefits 749,186 750,378
Rent and premises related expenses 83,885 82,937
Depreciation and amortisation 117,912 117,484
Other general and administrative expenses 513,471 445,614
Impairment charge for financing, net 408,252 412,687
Total operating expenses 1,872,707 1,809,101
Net income for the year 2,745,831 2,432,194
Weighted average number of shares outstanding (million) 1,625 1,625
Basic and diluted earnings per share (in USD) 1.69 1.50
Exchange rate of SAR 3.75 per US dollar has been used for the above conversion of SAR Financial Statements into US dollar.
Consolidated Statement of Income in USD

An
nu
al
Re
po
rt
20
1821
3
About the BankAbout the Bank
Value DriversValue Drivers
LeadershipLeadership
StrategyStrategy
PerformancePerformance
Corporate GovernanceCorporate Governance
Financial ReportsFinancial Reports
Supplementary InformationSupplementary Information
Key indicators from the consolidated financial statements for the years ended 31 December
For the years ended 31 December 2018 2017 2016 2015 2014
Operating results for the year, USD million
Net financing and investment income 3,534 3,208 2,977 2,656 2,618
Total operating income 4,619 4,241 4,076 3,666 3,645
Total operating expenses 1,873 1,809 1,909 1,764 1,822
Net income 2,746 2,432 2,166 1,901 1,823
Total comprehensive income 2,719 2,407 2,192 1,845 1,806
Assets and liabilities, USD million
Financing, net 62,417 62,276 59,998 56,058 54,917
Customer deposits 78,376 72,814 72,691 68,327 68,287
Total assets 97,334 91,498 90,590 84,165 82,057
Total liabilities 84,387 76,631 76,737 71,728 70,884
Total shareholders’ equity 12,948 14,867 13,853 12,437 11,172
Profitability
Return on average assets, % 2.90 2.67 2.48 2.29 2.33
Return on average equity, % 19.80 16.94 16.49 16.11 17.01
Basic and diluted earnings per share, USD 1.69 1.50 1.33 1.17 1.12
Dividend per share, USD 1.13 0.66 0.60 0.67 0.73
Regulatory ratios
Capital adequacy ratio:
Tier I, % 19.08 22.20 20.86 19.74 18.48
Tier I and II, % 20.17 23.29 21.98 20.83 19.59
Growth
Staff Nos. 12,732 13,077 13,684 12,374 11,761
Branches (Nos.) 551 554 539 525 501
ATMs (Nos.) 5,006 4,794 4,475 4,500 3,997
POS Terminals (Nos.) 83,958 74,612 62,118 51,000 32,792
Exchange rate of SAR 3.75 per US dollar has been used for the above conversion of SAR Financial Statements into US dollar.
Five Year Summary in USD
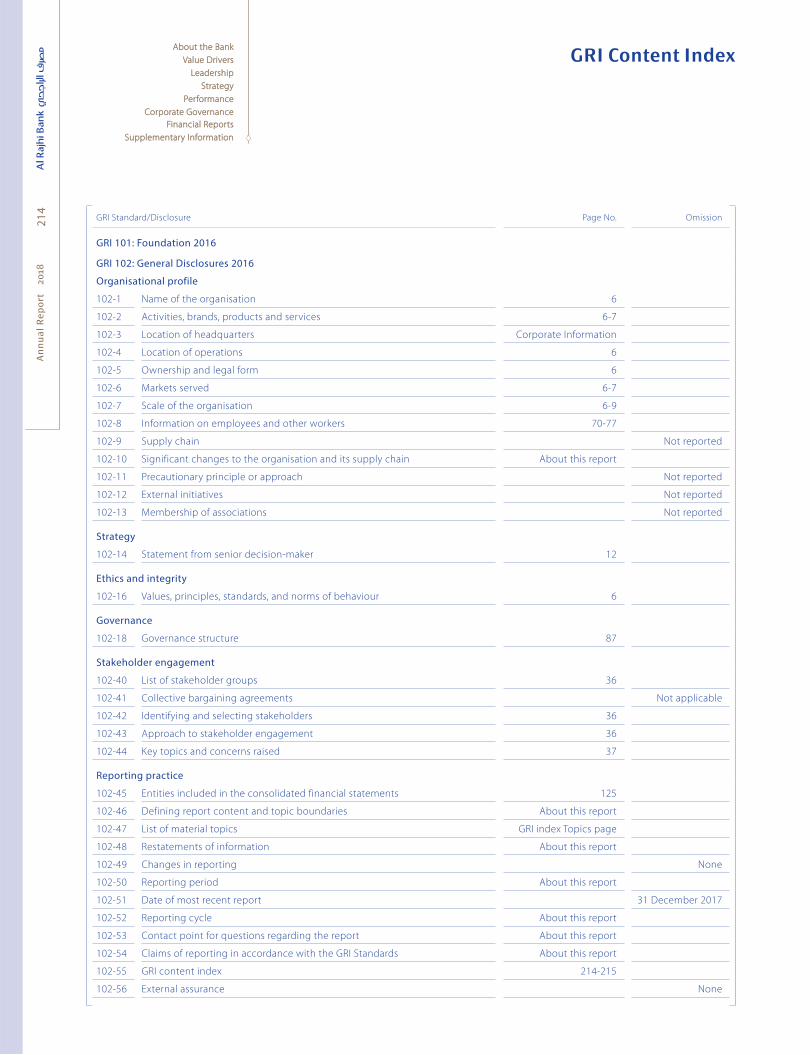
An
nu
al
Re
po
rt
20
1821
4About the BankAbout the Bank
Value DriversValue Drivers
LeadershipLeadership
StrategyStrategy
PerformancePerformance
Corporate GovernanceCorporate Governance
Financial ReportsFinancial Reports
Supplementary InformationSupplementary Information
GRI Standard/Disclosure Page No. Omission
GRI 101: Foundation 2016
GRI 102: General Disclosures 2016
Organisational profile
102-1 Name of the organisation 6
102-2 Activities, brands, products and services 6-7
102-3 Location of headquarters Corporate Information
102-4 Location of operations 6
102-5 Ownership and legal form 6
102-6 Markets served 6-7
102-7 Scale of the organisation 6-9
102-8 Information on employees and other workers 70-77
102-9 Supply chain Not reported
102-10 Significant changes to the organisation and its supply chain About this report
102-11 Precautionary principle or approach Not reported
102-12 External initiatives Not reported
102-13 Membership of associations Not reported
Strategy
102-14 Statement from senior decision-maker 12
Ethics and integrity
102-16 Values, principles, standards, and norms of behaviour 6
Governance
102-18 Governance structure 87
Stakeholder engagement
102-40 List of stakeholder groups 36
102-41 Collective bargaining agreements Not applicable
102-42 Identifying and selecting stakeholders 36
102-43 Approach to stakeholder engagement 36
102-44 Key topics and concerns raised 37
Reporting practice
102-45 Entities included in the consolidated financial statements 125
102-46 Defining report content and topic boundaries About this report
102-47 List of material topics GRI index Topics page
102-48 Restatements of information About this report
102-49 Changes in reporting None
102-50 Reporting period About this report
102-51 Date of most recent report 31 December 2017
102-52 Reporting cycle About this report
102-53 Contact point for questions regarding the report About this report
102-54 Claims of reporting in accordance with the GRI Standards About this report
102-55 GRI content index 214-215
102-56 External assurance None
GRI Content Index
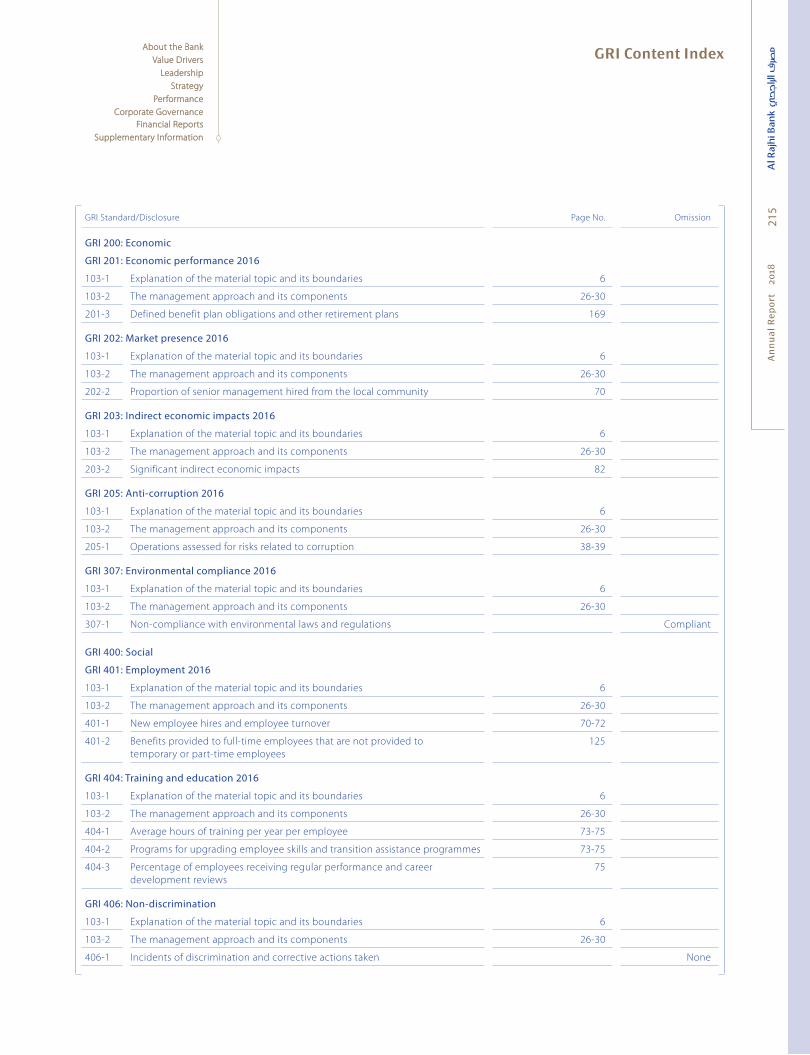
An
nu
al
Re
po
rt
20
18
GRI Content Index
215
About the BankAbout the Bank
Value DriversValue Drivers
LeadershipLeadership
StrategyStrategy
PerformancePerformance
Corporate GovernanceCorporate Governance
Financial ReportsFinancial Reports
Supplementary InformationSupplementary Information
GRI Standard/Disclosure Page No. Omission
GRI 200: Economic
GRI 201: Economic performance 2016
103-1 Explanation of the material topic and its boundaries 6
103-2 The management approach and its components 26-30
201-3 Defined benefit plan obligations and other retirement plans 169
GRI 202: Market presence 2016
103-1 Explanation of the material topic and its boundaries 6
103-2 The management approach and its components 26-30
202-2 Proportion of senior management hired from the local community 70
GRI 203: Indirect economic impacts 2016
103-1 Explanation of the material topic and its boundaries 6
103-2 The management approach and its components 26-30
203-2 Significant indirect economic impacts 82
GRI 205: Anti-corruption 2016
103-1 Explanation of the material topic and its boundaries 6
103-2 The management approach and its components 26-30
205-1 Operations assessed for risks related to corruption 38-39
GRI 307: Environmental compliance 2016
103-1 Explanation of the material topic and its boundaries 6
103-2 The management approach and its components 26-30
307-1 Non-compliance with environmental laws and regulations Compliant
GRI 400: Social
GRI 401: Employment 2016
103-1 Explanation of the material topic and its boundaries 6
103-2 The management approach and its components 26-30
401-1 New employee hires and employee turnover 70-72
401-2 Benefits provided to full-time employees that are not provided to
temporary or part-time employees
125
GRI 404: Training and education 2016
103-1 Explanation of the material topic and its boundaries 6
103-2 The management approach and its components 26-30
404-1 Average hours of training per year per employee 73-75
404-2 Programs for upgrading employee skills and transition assistance programmes 73-75
404-3 Percentage of employees receiving regular performance and career
development reviews
75
GRI 406: Non-discrimination
103-1 Explanation of the material topic and its boundaries 6
103-2 The management approach and its components 26-30
406-1 Incidents of discrimination and corrective actions taken None
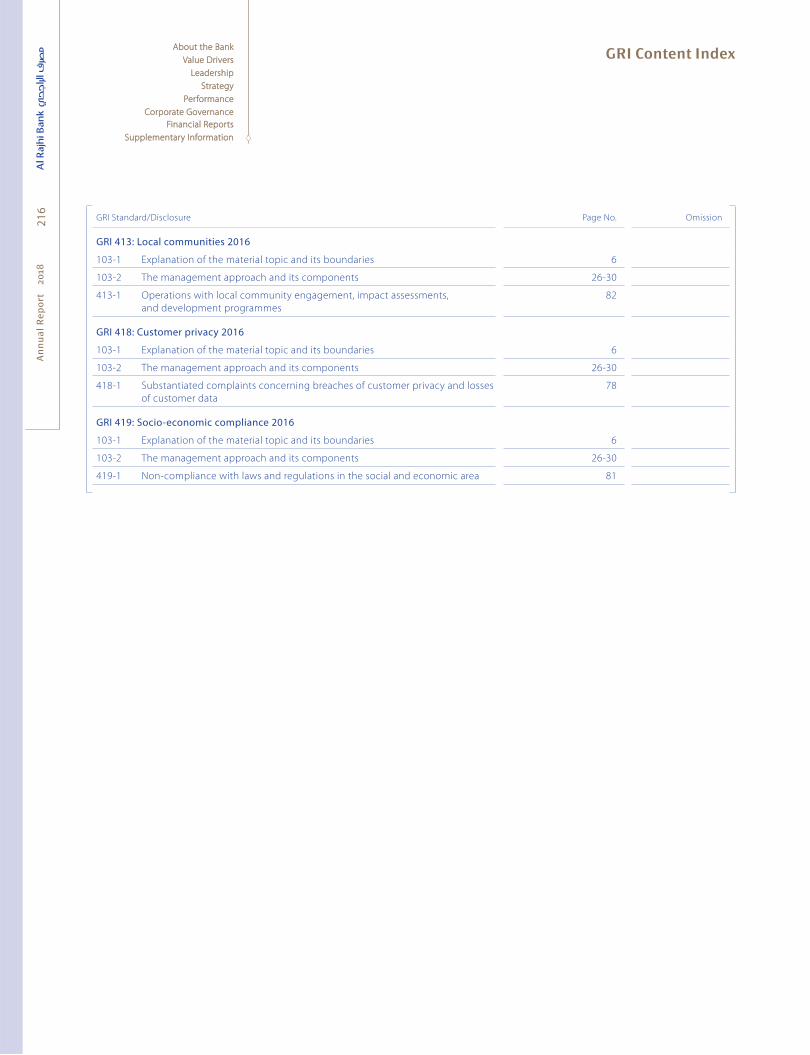
An
nu
al
Re
po
rt
20
18
GRI Content Index21
6About the BankAbout the Bank
Value DriversValue Drivers
LeadershipLeadership
StrategyStrategy
PerformancePerformance
Corporate GovernanceCorporate Governance
Financial ReportsFinancial Reports
Supplementary InformationSupplementary Information
GRI Standard/Disclosure Page No. Omission
GRI 413: Local communities 2016
103-1 Explanation of the material topic and its boundaries 6
103-2 The management approach and its components 26-30
413-1 Operations with local community engagement, impact assessments,
and development programmes
82
GRI 418: Customer privacy 2016
103-1 Explanation of the material topic and its boundaries 6
103-2 The management approach and its components 26-30
418-1 Substantiated complaints concerning breaches of customer privacy and losses
of customer data
78
GRI 419: Socio-economic compliance 2016
103-1 Explanation of the material topic and its boundaries 6
103-2 The management approach and its components 26-30
419-1 Non-compliance with laws and regulations in the social and economic area 81
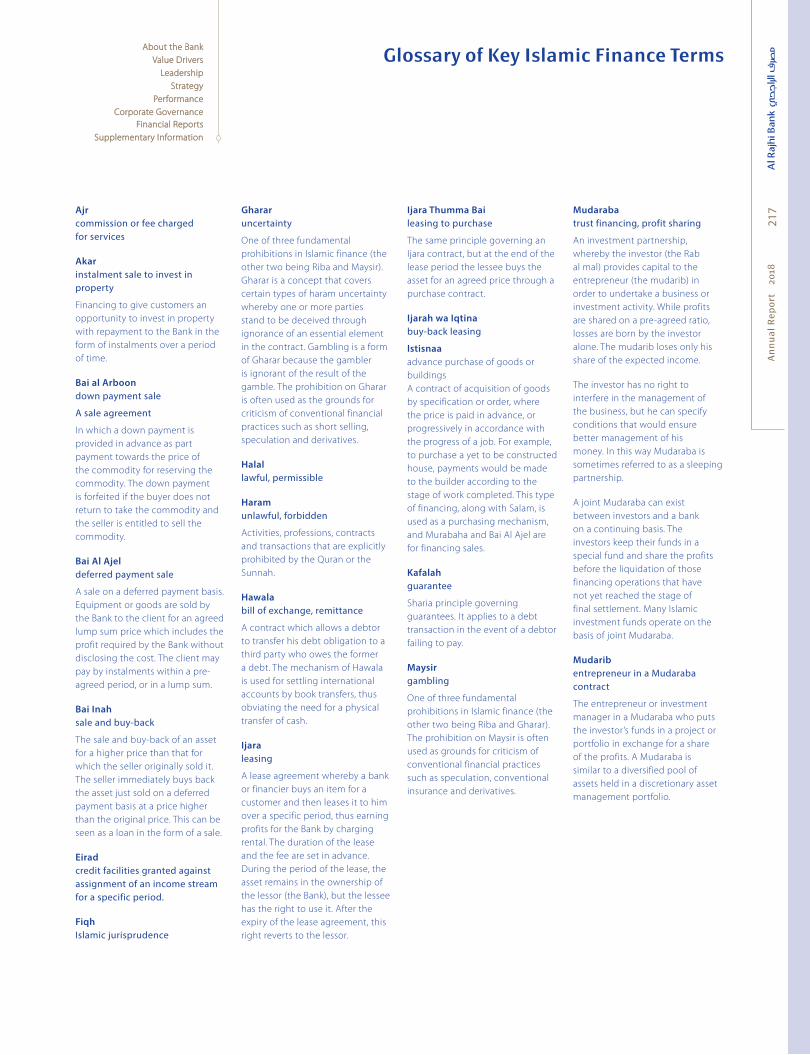
An
nu
al
Re
po
rt
20
1821
7
About the BankAbout the Bank
Value DriversValue Drivers
LeadershipLeadership
StrategyStrategy
PerformancePerformance
Corporate GovernanceCorporate Governance
Financial ReportsFinancial Reports
Supplementary InformationSupplementary Information
Ajr
commission or fee charged for services
Akar
instalment sale to invest in property
Financing to give customers an
opportunity to invest in property
with repayment to the Bank in the
form of instalments over a period
of time.
Bai al Arboon
down payment sale
A sale agreement
In which a down payment is
provided in advance as part
payment towards the price of
the commodity for reserving the
commodity. The down payment
is forfeited if the buyer does not
return to take the commodity and
the seller is entitled to sell the
commodity.
Bai Al Ajel
deferred payment sale
A sale on a deferred payment basis.
Equipment or goods are sold by
the Bank to the client for an agreed
lump sum price which includes the
profit required by the Bank without
disclosing the cost. The client may
pay by instalments within a pre-
agreed period, or in a lump sum.
Bai Inah
sale and buy-back
The sale and buy-back of an asset
for a higher price than that for
which the seller originally sold it.
The seller immediately buys back
the asset just sold on a deferred
payment basis at a price higher
than the original price. This can be
seen as a loan in the form of a sale.
Eirad
credit facilities granted against assignment of an income stream for a specific period.
Fiqh
Islamic jurisprudence
Gharar
uncertainty
One of three fundamental
prohibitions in Islamic finance (the
other two being Riba and Maysir).
Gharar is a concept that covers
certain types of haram uncertainty
whereby one or more parties
stand to be deceived through
ignorance of an essential element
in the contract. Gambling is a form
of Gharar because the gambler
is ignorant of the result of the
gamble. The prohibition on Gharar
is often used as the grounds for
criticism of conventional financial
practices such as short selling,
speculation and derivatives.
Halal
lawful, permissible
Haram
unlawful, forbidden
Activities, professions, contracts
and transactions that are explicitly
prohibited by the Quran or the
Sunnah.
Hawala
bill of exchange, remittance
A contract which allows a debtor
to transfer his debt obligation to a
third party who owes the former
a debt. The mechanism of Hawala
is used for settling international
accounts by book transfers, thus
obviating the need for a physical
transfer of cash.
Ijara
leasing
A lease agreement whereby a bank
or financier buys an item for a
customer and then leases it to him
over a specific period, thus earning
profits for the Bank by charging
rental. The duration of the lease
and the fee are set in advance.
During the period of the lease, the
asset remains in the ownership of
the lessor (the Bank), but the lessee
has the right to use it. After the
expiry of the lease agreement, this
right reverts to the lessor.
Ijara Thumma Bai
leasing to purchase
The same principle governing an
Ijara contract, but at the end of the
lease period the lessee buys the
asset for an agreed price through a
purchase contract.
Ijarah wa Iqtina
buy-back leasing
Istisnaa
advance purchase of goods or
buildings
A contract of acquisition of goods
by specification or order, where
the price is paid in advance, or
progressively in accordance with
the progress of a job. For example,
to purchase a yet to be constructed
house, payments would be made
to the builder according to the
stage of work completed. This type
of financing, along with Salam, is
used as a purchasing mechanism,
and Murabaha and Bai Al Ajel are
for financing sales.
Kafalah
guarantee
Sharia principle governing
guarantees. It applies to a debt
transaction in the event of a debtor
failing to pay.
Maysir
gambling
One of three fundamental
prohibitions in Islamic finance (the
other two being Riba and Gharar).
The prohibition on Maysir is often
used as grounds for criticism of
conventional financial practices
such as speculation, conventional
insurance and derivatives.
Mudaraba
trust financing, profit sharing
An investment partnership,
whereby the investor (the Rab
al mal) provides capital to the
entrepreneur (the mudarib) in
order to undertake a business or
investment activity. While profits
are shared on a pre-agreed ratio,
losses are born by the investor
alone. The mudarib loses only his
share of the expected income.
The investor has no right to
interfere in the management of
the business, but he can specify
conditions that would ensure
better management of his
money. In this way Mudaraba is
sometimes referred to as a sleeping
partnership.
A joint Mudaraba can exist
between investors and a bank
on a continuing basis. The
investors keep their funds in a
special fund and share the profits
before the liquidation of those
financing operations that have
not yet reached the stage of
final settlement. Many Islamic
investment funds operate on the
basis of joint Mudaraba.
Mudarib
entrepreneur in a Mudaraba contract
The entrepreneur or investment
manager in a Mudaraba who puts
the investor’s funds in a project or
portfolio in exchange for a share
of the profits. A Mudaraba is
similar to a diversified pool of
assets held in a discretionary asset
management portfolio.
Glossary of Key Islamic Finance Terms

An
nu
al
Re
po
rt
20
18
Glossary of Key Islamic Finance Terms21
8About the BankAbout the Bank
Value DriversValue Drivers
LeadershipLeadership
StrategyStrategy
PerformancePerformance
Corporate GovernanceCorporate Governance
Financial ReportsFinancial Reports
Supplementary InformationSupplementary Information
Murabaha
cost-plus financing
A form of credit in which the
Bank buys an item and sells it to
the customer on a deferred basis.
The price includes a profit margin
agreed by both parties. Repayment,
usually in instalments, is specified
in the contract.
The legality of this financing
technique has been questioned
because of its similarity to Riba.
However, the modern Murabaha
has become a popular financing
technique among Islamic banks,
used widely for consumer finance,
real estate and the purchase of
machinery and for financing short-
term trade.
Musharaka
joint venture, profit and loss sharing
An investment partnership in
which all partners are entitled to
a share in the profits of a project
in a mutually agreed ratio. Losses
are shared in proportion to the
amount invested. All partners to a
Musharaka contribute funds and
have the right to exercise executive
powers in that project, similar to a
conventional partnership structure
and the holding of voting shares in
a limited company.
This equity financing arrangement
is widely regarded as the purest
form of Islamic financing. The two
main forms of Musharaka are –
Permanent Musharaka: an
Islamic bank participates in the
equity of a project and receives
a share of the profit on a pro rata
basis. The length of contract is
unspecified, making it suitable
for financing projects where
funds are committed over a
long period.
Diminishing Musharaka: this
allows equity participation and
sharing of profits on a pro rata
basis, and provides a method
through which the Bank keeps
on reducing its equity in the
project, ultimately transferring
ownership of the asset to the
participants. The contract
provides for payment over and
above the Bank’s share in the
profit for the equity held by
the Bank. Simultaneously the
entrepreneur purchases some of
the Bank’s equity, progressively
reducing it until the Bank has
no equity and thus ceases to be
a partner.
Mutajar
an asset financing mechanism with deferred payment
A financing agreement whereby
the bank purchases a commodity
or an asset and sells it to the client
based on a purchase promise from
the client with a deferred price
higher than the cash price, thus
making the client a debtor to the
Bank for the sale amount and for
the period agreed in the contract.
Qard Hasan
benevolent loan
A loan contract between two
parties for social welfare or for
short-term bridging finance.
Repayment is for the same amount
as the amount borrowed. The
borrower can pay more than the
amount borrowed so long as it is
not stated by contract.
Riba
interest
An increase, addition, unjust return,
or advantage obtained by the
lender as a condition of a loan.
Any risk-free or “guaranteed” rate
of return on a loan or investment
is Riba. Riba in all its forms is
prohibited in Islam.
In conventional terms, Riba and
“interest” are used interchangeably,
although the legal notion extends
beyond mere interest.
Sharia
Islamic jurisprudence
Sukuk
Islamic bond
An asset-backed bond which is
structured in accordance with
Sharia and may be traded in
the market. A Sukuk represents
proportionate beneficial ownership
in the underlying asset, which will
be leased to the client to yield the
return on the Sukuk.
Takaful
Islamic insurance
Based on the principle of mutual
assistance, Takaful provides mutual
protection of assets and property
and offers joint risk-sharing in
the event of a loss by one of the
participants. Takaful is similar to
mutual insurance in that members
are the insurers as well as the
insured. Conventional insurance
is prohibited in Islam because its
dealings contain several haram
elements, such as Gharar and Riba.
Tawarruq
reverse Murabaha
In personal financing, a client
with a genuine need buys an
item on credit from the Bank on a
deferred payment basis and then
immediately resells it for cash to a
third party. In this way, the client
can obtain cash without taking out
an interest-based loan.
Ujrah
fee
The financial charge for using
services, or Manfaat (wages,
allowance, commission, etc.).
Waqf
charitable trust
Zakat
religious tax
An obligatory contribution which
every wealthy Muslim is required
to pay to the Islamic state, or
to distribute amongst the poor.
According to Islam, Zakat – the
third pillar of Islam – purifies
wealth and souls. Zakat is levied on
cash, cattle, agricultural produce,
minerals, capital invested in
industry and business.

An
nu
al
Re
po
rt
20
1821
9
About the BankAbout the Bank
Value DriversValue Drivers
LeadershipLeadership
StrategyStrategy
PerformancePerformance
Corporate GovernanceCorporate Governance
Financial ReportsFinancial Reports
Supplementary InformationSupplementary Information
Corporate Information
Name
Al Rajhi Banking and Investment Corporation
Trade Name
Al Rajhi Bank
Commercial Registration No.
1010000096
Registered Logo
Legal Form
A Saudi joint stock company, formed and
licensed pursuant to Royal Decree No. M/59
dated 3 Dhul Qadah 1407H (29 June 1987),
in accordance with Article 6 of the Council of
Ministers Resolution No. 245, dated 26 Shawal
1407H (23 June 1987).
Stock Exchange Listing
The shares of the Bank are listed on the Saudi
Stock Exchange (Tadawul).
Stock code: 1120.SSE
Subsidiary Companies and Branches
Name of subsidiary Country of operation Country of establishment
Al Rajhi Capital Company Kingdom of Saudi Arabia Kingdom of Saudi Arabia
Al Rajhi Development Company Limited Kingdom of Saudi Arabia Kingdom of Saudi Arabia
Al Rajhi Takaful Agency Company Kingdom of Saudi Arabia Kingdom of Saudi Arabia
Al Rajhi Management Services Company Kingdom of Saudi Arabia Kingdom of Saudi Arabia
Al Rajhi Corporation Limited Malaysia Malaysia
Al Rajhi Bank (Kuwait branch) Kuwait Kingdom of Saudi Arabia
Al Rajhi Bank (Jordan branch) Jordan Kingdom of Saudi Arabia
Auditors
PricewaterhouseCoopers
KPMG Al Fozan & Partners
Head Office/Registered Office
Al Rajhi Bank
8467, King Fahd Road – Al Muruj District
Unit No. 1
Riyadh 12263 – 2743
Kingdom of Saudi Arabia
Tel: +966920003344 (KSA) |
+966114603333 (International)
Fax: +966114603351, +966114600705
Web: www.alrajhibank.com.saWeb: www.alrajhibank.com.sa
E-mail: [email protected]

Notes

Produced by VisageSpice (Pvt) Limited, a carbon neutral company that offsets its direct and indirect GHG emissions through verified sources.
www.VisageSpice.com

https://arb.sa/report2018-ar