Aniceto Orbeta1 August 2015 A. Introduction...financing for those who wants to be trained. These can...
20
Preliminary Draft Not for Quotation The National System of Technical Vocational Education and Training in the Philippines: Review and Reform Ideas Aniceto Orbeta 1 August 2015 A. Introduction Skills upgrading and development have both short and long‐term roles in development. Long‐term development requires continuous upgrading of skills. This takes an even heightened role with rapidly changing technology. To the extent that TVET is able to increase the productivity and income of poor also serves the long‐term equity objective. In the short‐term, skill upgrading also enhances the employability of the unemployed and facilitates transfers to new occupations of the underproductive currently employed. The role of the National System of Technical Vocational Education and Training in the Philippines in all of these is critical. This paper reviews the state of Philippine National System of Technical and Vocational Education and Training (NSTVET). This is part of the ECLAC/ESCAP Project “Strengthening the capacities of Latin America and Asia to develop and improve labour training systems and to protect workers against unemployment.” The paper is organized as follows. The next section provides a description of the characteristics of an improved NSTVET described in sectoral reviews. This is then followed by a description of the characteristics and analysis of the performance of the existing NSTVET. The concluding section provides a summary of recommendations to improve the system. B. Characteristics of an Improved System This section describes the desirable characteristics of a NSTVET. These characteristics are summarized from recommendations from sectoral reviews. A good estimate of the demand for TVET services Good planning requires a reliable estimate on the demand for TVET services at the skill level. Unfortunately, skills are evolving and what constitutes as TVET is also growing. This requires continues monitoring and consultations with firms – the ultimate users of skill. Labor market information and tracer studies are key for correctly estimating demand for TVET services. This provides information on what skills are needed and how these are utilized in the labor market (ADB 2004). But NSTVET may need to expand its scope of services. In the Third International Congress in TVET, it was emphasized the demands on TVET are no longer confined to skill 1 Senior Research Fellow, Philippine Institute for Development Studies (PIDS). Deputy Director General Emmanuel Esguerra of the National Economic Development Authority (NEDA) provided guidance in the preparation of this report. Opinions expressed here are of the author and does not necessarily reflect the positions of PIDS. Assistance of the Social Services Staff of NEDA led by Director Erlinda Capones is gratefully acknowledged. Assistance of TESDA particularly of Executive Directors and Marissa Legaspi (Planning Office) and Maria Susan de la Rama (Certification Office) and the member of their staffs are also gratefully acknowledged. All errors are the responsibility of the authors.
Transcript of Aniceto Orbeta1 August 2015 A. Introduction...financing for those who wants to be trained. These can...

Preliminary Draft Not for Quotation
The National System of Technical Vocational Education and Training in the Philippines: Review and Reform Ideas
Aniceto Orbeta1 August 2015
A. Introduction Skills upgrading and development have both short and long‐term roles in development. Long‐term development requires continuous upgrading of skills. This takes an even heightened role with rapidly changing technology. To the extent that TVET is able to increase the productivity and income of poor also serves the long‐term equity objective. In the short‐term, skill upgrading also enhances the employability of the unemployed and facilitates transfers to new occupations of the underproductive currently employed. The role of the National System of Technical Vocational Education and Training in the Philippines in all of these is critical. This paper reviews the state of Philippine National System of Technical and Vocational Education and Training (NSTVET). This is part of the ECLAC/ESCAP Project “Strengthening the capacities of Latin America and Asia to develop and improve labour training systems and to protect workers against unemployment.” The paper is organized as follows. The next section provides a description of the characteristics of an improved NSTVET described in sectoral reviews. This is then followed by a description of the characteristics and analysis of the performance of the existing NSTVET. The concluding section provides a summary of recommendations to improve the system. B. Characteristics of an Improved System
This section describes the desirable characteristics of a NSTVET. These characteristics are
summarized from recommendations from sectoral reviews.
A good estimate of the demand for TVET services
Good planning requires a reliable estimate on the demand for TVET services at the skill level.
Unfortunately, skills are evolving and what constitutes as TVET is also growing. This requires
continues monitoring and consultations with firms – the ultimate users of skill.
Labor market information and tracer studies are key for correctly estimating demand for TVET
services. This provides information on what skills are needed and how these are utilized in the labor
market (ADB 2004). But NSTVET may need to expand its scope of services. In the Third International
Congress in TVET, it was emphasized the demands on TVET are no longer confined to skill
1 Senior Research Fellow, Philippine Institute for Development Studies (PIDS). Deputy Director General Emmanuel Esguerra of the National Economic Development Authority (NEDA) provided guidance in the preparation of this report. Opinions expressed here are of the author and does not necessarily reflect the positions of PIDS. Assistance of the Social Services Staff of NEDA led by Director Erlinda Capones is gratefully acknowledged. Assistance of TESDA particularly of Executive Directors and Marissa Legaspi (Planning Office) and Maria Susan de la Rama (Certification Office) and the member of their staffs are also gratefully acknowledged. All errors are the responsibility of the authors.

2
requirements for work but also for lifelong learning (UNESCO, 2012). In addition, TVET needs to
prepare for several other dimensions. One, it was emphasized there that there is the need to
prepare TVET for an increasingly fast changing and unpredictable world. That there is a need to put
more emphasis on learning how to learn and how to adapt rather than just learning specific
occupations. Two, there is also a need to balance generic learning skills, social skill and vocational
skills. Social skills in terms of working in multicultural environment will also be necessary with
increasing globalization. Finally, there is a need to develop multiple pathways for the school to work
transition facilitating the switch from general to vocational education; from formal, non‐formal and
informal approaches.
Access by workers in general
TVET should be accessible to three types of clients, namely, (a) the unemployed, (b) the currently
employed who want to increase their income, and (c) the employed who want to re‐tool. A good
NSTVET system should be able to address all these different training needs. Access is not just a
function of availability of training per se but should also be defined in terms of availability of
financing for those who wants to be trained. These can take the form of grants‐in‐aid for the poor or
loans for the non‐poor.
Access by workers from vulnerable groups
A fee‐based TVET will discriminate against those who have no means to pay. This provides the
rationale for developing financing schemes to increase the access of the vulnerable groups such as
the unemployed, the underemployed and the poor in order to increase both their employability and
income. The NSTVET should also be accessible to specific groups of people such as women, youth,
those with low education and the disabled.
Access by small and medium enterprises
That TVET should have a very strong industry orientation has never been questioned. It is in fact one
of the critical characteristics of a good NSTVET. It should be designed to support increases in
productivity on the shop floor. But a common concern is that SMEs may not have the financial
capacities nor the training resources to conduct or finance training that will increase their
productivity to make them competitive and grow. A desirable characteristic of NSTVET is accessibility
particularly to SMEs.
Quality control mechanisms, including certification of programs and competencies
When TVET is provided mainly by the private sector, there is the accompanying need for effective
quality control mechanisms. As mentioned, this is the primary role of government in TVET. It cannot,
however, do this on its own. For quality control and certification mechanisms to be effective, firms
should value them. Sophisticated certification mechanisms that do not convince firms as effective
will be useless. There should be a continuing effort at checking the effectiveness of the certification
mechanisms with one primary indicator – whether firms value them in recruitment and in their
operations.

3
Funding the system
The funding system should clearly delineate what should be privately funded and what should be
publicly funded. Returns beyond the basic level accrues more to the individual, hence, the argument
that TVET education should generally privately funded. The role of government should be confined
to those elements that have public good character. Providing effective regulatory services and
information on the TVET system are clearly public goods. This is increasingly becoming accepted as
government’s primary function in TVET (UNESCO, 2012). If government finds it necessary to play
roles beyond these basic functions, these should be guided by public finance principles. There are
two reasons for government intervention ‐ equity and efficiency. Equity objectives justify
government financing to improve the employability and increase the income of the poor and
vulnerable groups. Efficiency objectives are often used, for instance, to justify the financing of
expensive cutting‐edge technology training that has a clear public good character as well as helping
workers shift from low productivity to high productivity employment. There is, of course, the added
proviso that even if government is justified in intervening, it has to show that it has the least cost
alternative.
An important dimension to facilitate efficient financial planning from all perspectives is a need to
develop and standardized unit cost for TVET, particularly for the commonly offered skills (ADB,
2009a). Transparent costs of training for each skill will help students decide on which skill they can
afford to finance. This will also help firms and policy makers decide which skill training they can
afford to pay in case they decide to support specific types of training.
The use of performance‐based training funds can be effective in stimulating relevance, equity,
flexibility of the training systems (ADB, 2004).
With demand for TVET services expanding, making the most of existing resources should be
paramount. The opportunity for using online system for training delivery should be fully explored
(UNESCO, 2012).
Organizational structure and coordination across institutions
Government should primarily be in regulation and information provision and not in training
provision. Provision should be the primary responsibility of the private sector. This is the basic
principle of organizing TVET systems.
Interaction between government, TVET Institutions, firms and workers should be at all levels. It
should not be limited to national bodies like the TESDA but at industry/sectoral and local levels.
General mandates at the national and sectoral levels should be geared towards core content and
competencies. There should be room, however, for translation of these core content and
competencies to address local needs (Kis and Park, 2012)
Links with other labor market policies
By the very nature of TVET, it must be responsive to signals from the labor market. This presupposes
that useful labor market information should be available regularly. This should also mean that firms,
TVIs and government meet regularly to review training regulations to check for their relevance.

4
These meetings should also discuss which skill training needs to be promoted or discouraged based
on labor market signals such as employment rates and wages.
The reform of the TVET should not be done as a separate undertaking but in an integrated manner
to respond to the many economic, equity and transformational challenges (UNESCO, 2012). The call
is for TVET to contribute to economic growth, social equity, inclusion and sustainable transformation
of society.
C. A review of the characteristics of the existing NSTVET in the Philippines
1. Basic Structure
Mode of Delivery and Type of Programs
There are three major modes of providing TVET training, namely, institutions based (school‐based
and center‐based), enterprise‐based, and community‐based. School‐based programs refer to
regular longer‐term (1‐year, 2‐year, 3‐year courses) TVET programs and short‐term programs (less
than 1 year duration) conducted in a school. Center‐based programs are mainly short duration
programs (less than one year) conducted in TESDA regional and provincial training centers, LGU
training centers, firms with training centers, or by other training providers in a training center.
Enterprise‐based programs refer to short duration dual training systems / apprenticeship and
learnership programs conducted in the workplace by an enterprise, school or training center and
other providers. Community‐based programs refer to short‐term programs conducted or
coordinated by NGOs, LGUs, training centers and other TVET providers which are intended to
address the specific needs of a community. These programs are usually conducted in more informal
settings such as barangay hall, basketball courts and other available venues in a community.
TVET Clients
Who are the primary clients of TVET? Data from the most recent IES covering 2012 graduates2 show
that TVET participants cover the entire range of educational backgrounds. While, as expected,
majority are high school graduates (50%), there is a considerable proportion of college
undergraduates (19%) and even college graduates (13%) who take up TVET. Some 9% are previous
TVET graduates (6%) and TVET undergraduates (3%). There are even high school undergraduates
(7%) (Figure 1).
2While the more desirable data would be enrollment, there is no readily available data that gives the profile of those enrolled in TVET.

5
Figure 1. Distribution of TVET Graduates by Education Attainment before training, 2012
Source: 2013 IES
There can be varied reasons for taking TVET courses. According the 2013 IES, the biggest proportion
(45%) is for employment, the next is to gain skills (38%) then a far third is for skills upgrading (7%)
(Figure 2). So TVET is taken for employment and to gain or upgrade skills.
Figure 2. Distribution of TVET graduates by reason for taking TVET, 2012
Source: 2013 IES
Enrollment and Graduates
College Graduate and beyond
13%
College Undergrad
19%
Tech‐Voc graduate
6%
Tech‐Voc undergraduate
3%
High school graduate50%
High school undergraduate
7%
Some elementary1%
Not indicated1%
For employment/to
get job45%To gain skills
38%
For skills upgrading/enhan
cement7%
Personal use2%
TVET qualification is popular(many are enrolling)
2%
Not indicated2%
Others2%
For promotion/ Increase in income1%
Nothing to do1%
6
The composition of enrolment and graduation in 2010 shows that institutions‐based training
accounts for more than half (56%, 51% respectively) of the enrollment and graduates (Table 1). A
close second (40% and 45%, respectively) is the community‐based while the enterprise‐based
programs account for only a very small proportion (4%) for both enrollment and graduation.
There appears to be an increasing proportion of enrollees and graduates from institutions‐based
mode. From the enrollment side this group increased from 29% in 2005 to 56% in 2010. The
community‐based trainees declined from 68% in 2005 to 40% in 2010. Understandably, a similar
pattern can be observed for graduates.
Table 1. Enrollment and Graduation by Mode of Delivery
Delivery Mode 2005 2010 2013
Number % Number % Number %
Enrolled 1,683,382 100.0 1,568,617 100.0 1,943,589 100.0
Institution‐based 487,086 28.9 860,919 54.9 1,039,690 53.5
Enterprise‐based 59,003 3.5 86,978 5.5 77,518 4.0
Community‐based 1,137,293 67.6 620,720 39.6 826,381 42.5
Graduates 1,154,333 100.0 1,344,371 100.0 1,765,757 100.0
Institution‐based 334,757 29.0 671,488 49.9 896,580 50.8
Enterprise‐based 101,550 8.8 73,352 5.5 68,659 3.9
Community‐based 718,026 62.2 599,531 44.6 800,518 45.3
Sources of Data: Corporate Affairs Office/LMID‐Planning Office, TESDA
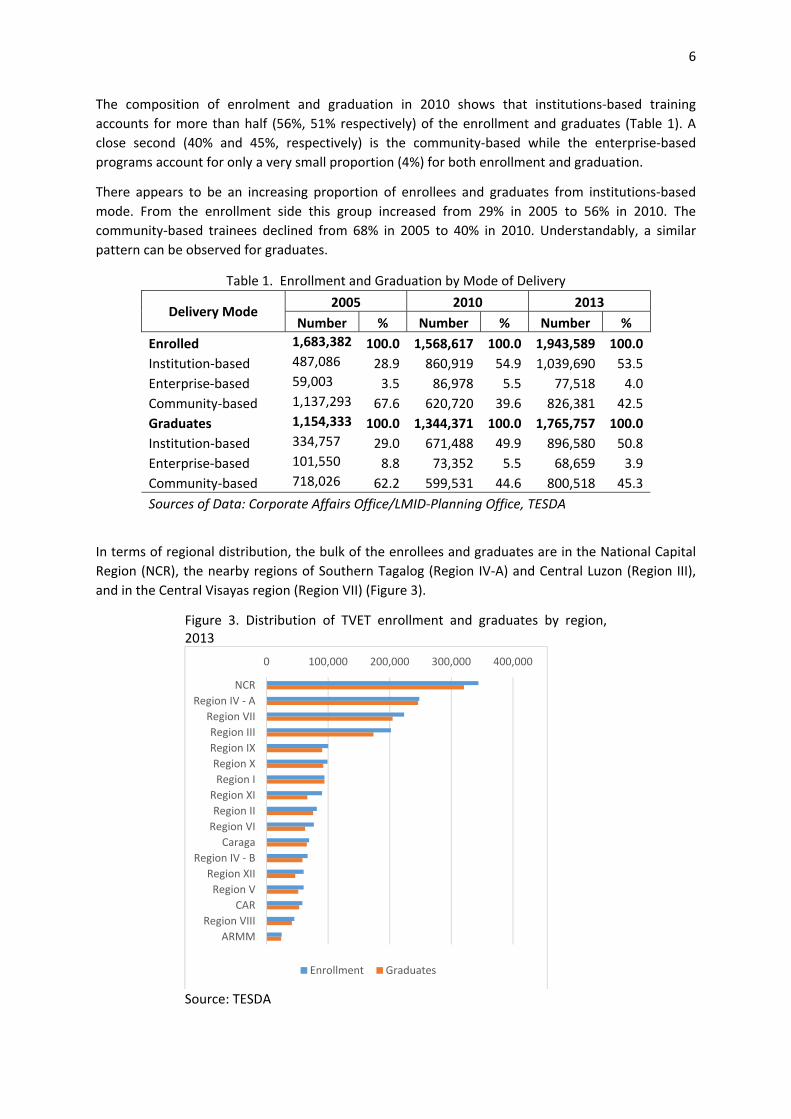
In terms of regional distribution, the bulk of the enrollees and graduates are in the National Capital
Region (NCR), the nearby regions of Southern Tagalog (Region IV‐A) and Central Luzon (Region III),
and in the Central Visayas region (Region VII) (Figure 3).
Figure 3. Distribution of TVET enrollment and graduates by region, 2013
Source: TESDA
0 100,000 200,000 300,000 400,000
NCR
Region IV ‐ A
Region VII
Region III
Region IX
Region X
Region I
Region XI
Region II
Region VI
Caraga
Region IV ‐ B
Region XII
Region V
CAR
Region VIII
ARMM
Enrollment Graduates

7
Sectoral Orientation
The recent sectoral orientation of the TVET graduates reflects the primary growing sectors of the
country namely ICT, tourism and health and other social services. Data from the tracer study for
2012 graduates shows that the biggest proportions are in information and communications
technology (ICT) (26.7%), tourism (24.2%) and health, social and other community development
(12.4%) (Figure 4).
Figure 4. Sectoral Orientation of Graduates, 2012
Source: 2013 IES
TVET Institutions
The number of private Technical and Vocational Institution (TVIs) increased from some 3,096 in 2001
to 4,733 in 2013 (Table 2). This perhaps explains the increase in the proportion of enrollment and
graduates in institutions‐based training. Table 2 also shows that the TVET industry is dominated by
the private sector, particularly, in recent years when the proportion of private TVIs increased from
61% in 2001 to 90% in 2013. However, when one compares the number of graduates the
contribution of the pubic rises to 32% with TESDA training institutes contributing 11% and the other
public institutes contributing 21% (Figure 5). This indictes that public TVIs are substantially larger.
Table 2. Number of TVET Providers by type
Type 2001 2010 2013
Number % Number % Number %
26.7
24.2
12.4
5.7
5.3
4.8
4.8
3.6
2.9
2.1
1.5
1.0
1.0
0.9
0.7
0.5
0.5
0.5
0.2
0.2
0.1
0.1
0.1
0.0 5.0 10.0 15.0 20.0 25.0 30.0
Information and…
Tourism
Health, Social and Other…
Automotive and Land…
Metals and Engineering
Construction
Electronics
Processed Food and Beverages
Agriculture and Fishery
Livelihood
Garments
Others
Language
Wholesale and Retail Trading
Maritime
Heating, Ventilation,…
Manufacturing
TVET
Decorative Crafts
Furniture and Fixtures
Footwear and Leathergoods
Aviation
Utilities

8
Public 1,220 39 422 10 467 10
Private 1,876 61 3,906 90 4,266 90
Total 3,096 100 4,328 100 4,733 100
Sources of data: Philippine TVET Statistics 2005‐2011, TESDA
Figure 5. Distribution of graduates by type of TVI, 2012
Source: Source: 2013 IES
In terms of regional distribution, there is heavy concentration in the national capital region (28%)
and the nearby provinces of Regions IV‐A (10%) and Region 3 (9%) (Figure 6). This partly explains the
distribution of enrollment and graduates given in Figure 3, i.e. regions that had the most number of
enrollees and graduates are those with the most number of providers.
Figure 6. Number of TVET providers by Region by Type, 2013
Sources of data: Philippine TVET Statistics 2005‐2011, TESDA
Other Public21%
Private68%
TTI11%
0 200 400 600 800 1000 1200
CARAGA
ARMM
IV‐B
ll
IX
VIII
CAR
XII
X
XI
VI
V
VII
l
III
IV‐A
NCR
Private Public

9
It is important to point out that Peano et al. (2008) report that only 53% of community based
training providers have their own training centers.
2. Governance and Management
TESDA is mandated by law to be the regulator of technical and vocational education training
institutions. RA 7796 mandates TESDA Board to “primarily be responsible for formulating and
continuing, coordinated and fully integrated technical education and skills development policies,
plans and programs.” The highest policy making body is the 12‐member TESDA Board chaired by the
Secretary of Labor and with representations from the government, private firms and workers’
organizations. It guides the development of the TVET sector through the development of the
National Technical Education and Skill Development Plan (NTESDP). The latest NTESDP is the 3rd cycle
covering the period 2011‐2016.
TESDA manages the TVET sector by regulating the operations of the private technical vocational
institutes (TVIs) and participating directly in training provision by operating several TESDA training
institutes (TTIs). As of 2013, TESDA manages 120 training institutes (TTIs) consisting of 21 regional
training centers, 43 provincial training centers, and 56 technical vocational schools. It regulates the
TVIs through mandatory program registration. Before a Certificate of Program Registration (CoPR) is
issued, site visits are conducted.
TESDA provides technical assistance to community‐based training programs. It collaborates with
LGUs, NGOs and other organizations or individuals. It provides training modules, related equipment,
supplies and materials; recommends qualified trainers; and co‐signs training certificates.
3. Quality Assurance3
There are several instruments used by TESDA to ensure quality of TVET training from the supply side.
This include (a) mandatory program registration, (b) promulgation of training regulations, and (c)
trainer certification.
Mandatory program registration. TESDA does quality assurance at several levels. The TESDA Act of
1994 (RA7796) empowers TESDA to establish and maintain a system for accrediting coordinating,
integrating, monitoring and evaluating formal and non‐formal TVET programs.” Ïn pursuance of this
mandate the TESDA Board issued the Unified TVET Program Registration and Accreditation System
(UTPRAS) that requires that all programs offered in public and private Technical and Vocational
Institutions (TVIs), with and without training regulations, be registered.
Before a TVI can offer a program, it has to comply with the requirements of program registration.
Besides the necessary permits, the review of program application includes ocular site inspection and
curriculum evaluation. Once the requirements are complied with, a Certificate of Program
Registration (CoPR) is issued.
Promulgation of training regulations (TR). The TESDA Qualification Standards Office convenes
experts from the respective industries to formulate TRs. These TRs are revisited and updated every
3‐5 years. After the TRs are issued a training program will be classified as “with training regulations
3 The discussion on this section draws heavily from the Orbeta et al (2015) “Quality Assurance in Philippine Education: A Review” Draft report.

10
(WTR)” otherwise it is classified as with “no training regulations (NTR)”. Table 3 shows that out of
20,045 registered programs in December 2010, 16,966 (85%) have training regulations.
Table 3. Registered TVET Programs, 2010
Type Number %
With training regulations 16,966 85
No training regulations 3,079 15
Total 20,045 100
Source: NTESDP 2011‐2016
Trainer certification. Trainers undergo a certification process. The trainer is expected to have at the
minimum a National Certificate (NC) after which he should earn a trainer’s certificate. There are
several levels of trainers including: i) trainer, ii) developer/ designer of curriculum, iii) mentor, and
iv) master trainer. Unfortunately, there is no readily available data on how many trainers there are
and how many have trainer’s certificate of each type.
The assessment process performs some form of external validation. Graduates are encouraged to
earn a national certificate (NC) which is the badge of having specific competency.
Trainee certification. TESDA supervises the trainee certification system.
D. Analysis of Performance of the Existing System
Estimation of the demand for TVET Services
Unfortunately there seems to be no commonly accepted estimate of the demand for TVET services.
What are available are enrollment and graduation data reported by TESDA. These are reflective of
both demand and supply of TVET services. Tables 1 shows that the number of enrollees in 2013 is 1.9
million and the graduates for the same year 1.7 million. It was mentioned earlier that distribution
across the regions of enrollment and graduates follows closely the distribution of TVIs (Figures 3 &
5). In addition, the distribution of graduates by sector also shows that the bulk of graduates are in
the growth areas of ICT, tourism and health and social services (Figure 4).
Only starting 2012 does the Labor Force Survey (LFS) ask respondents who of working age (15 years
and above) if they have graduated from a TVET course4. The January round of the 2013 LFS estimates
those who had completed a TVET course to be 3.2 million (4.8%) of the 66.2 million working age
population. This should be a better estimate than those based on highest graded completed. For
instance, Orbeta and Abrigo (2013) mentioned that the only 3.1% of the working age population in
the APIS 2008 had TVET as their highest grade completed. That this is an underestimate is shown by
4 In earlier rounds of LFS, only the highest grade completed is asked and this does not include TVET courses. Even if this is included as in APIS, this would underestimate those who have taken TVET courses because those who have some college or are college graduates and above will not mention TVET as their highest grade completed. We already mentioned using data from TVET graduates of 2010 at as much as 19% of TVET graduates are either college undergraduates or graduates before taking TVET course.

11
the APIS 2008 showing only 147 thousand enrolled in post‐secondary education for 2008 while the
TESDA estimate for the same year is 2 million enrollees. Even with this more reliable estimate, this
proportion hardly reflects the importance analysts have been putting on TVET.
Access by Workers
There appears to be no readily available direct measure of access by workers to TVET. The indication
of access can be generated from the profile of enrollees as well as graduates. Unfortunately, there is
no readily available data on the profile of enrollees. The only available data to characterize the
access by workers is the profile of graduates in the IES of TESDA. As mentioned in the earlier
sections, the clients of TVET are not merely high school graduates but that a considerable proportion
are college graduates and college undergraduates. Data from 2012 graduates show that as much as
74% of the graduates were unemployed before they went into training. As Figure 2 shows, the bulk
of the trainees embark on training to gain employment (45%) and to gain skills (38%).
Access by Vulnerable groups
There appears to be no obvious discrimination in the TVET by sex as the male and female
composition of graduates in 2012 is about even 50.6% for males and 49.4% for females. As expected
majority of the graduates in 2012 are in young age groups of 15‐24 (61%) and 25‐34 (23%) years old.
By socio‐economic status5, the distribution of those enrolled in post‐secondary and those who had
post‐secondary education is clearly not favoring the poor (Figures 7 & 8). While there is some
tendency for public TVIs to enroll more from the lower socioeconomic status, the bigger proportions
of enrollment are in the middle socioeconomic classes. In terms of highest grade completed, this is
even more favoring the upper classes. One well known explanation is that the poor rarely finish
elementary so they are already dropping out of the school system at early ages.
Figure 7. Distribution of Enrollment in Post‐Secondary Courses by Per Capita Income Decile, by Type of TVI, 2013
Figure 8. Distribution of 15 years and above with Post‐Secondary as Highest Grade Completed
by Per Capital Income Decile, 2013
5 This should be qualified by the earlier comment that this data set appears to be an underestimate of those who have taken TVET courses. Unfortunately, APIS is the only dataset that allows showing the enrollment and highest grade completed TVET courses by different income classes.
3
4
76
10
13
15 16 16
10
0
2
4
6
8
10
12
14
16
18

12
Source of basic data: PSA APIS 2013
Access by SMEs
Funding the System
The only attempt at understanding the sources and uses of financing TVET in the Philippines was
done by Peano et al (2008). Their estimate puts a structure to sources and uses of TVET financing. In
terms of funding sources, they found that 46.5% of the resources come from the public sector with
the contribution of LGUs of about 14% (Figure 9). The 53.5% contribution from private sources came
from trainees (28.6%), firms (15.6%), NGOs and foundations (6.8%) and income generation (2.5%). In
terms of uses the findings are that the highest proportion is in the longer 1 to 3 year courses (47%)
followed by the short courses of less than 3 months (20%), administration (15%), apprenticeship and
learnerships (12%) and medium length courses of 3 to 9 months (6%) (Figure 10).
Figure 9. Financing TVET by Source, 2002 Figure 10. TVET Expenditure by Type, 2002
8
11
18
11
5
25
11
5 6
11
4
10
16
19
13
10
14
10
3
0
5
10
15
20
25
30
Public Private

13
Source: Peano et al. (2008)
Nearly one‐third (30.4%) of the graduates in 2012 have a scholarship (IES 2013). This represents a
substantial increase from 17% among 2007 graduates (Orbeta and Abrigo, 2013). Majority of the
beneficiaries are for TWSP (56.8%), followed by PESFA (10.3) and the rest (32.9%) are from a long list
of scholarships including those from legislators, LGUs and private organizations.
Financing for TESDA programs come from different sources. The NTESDP 2011‐2016 reports that for
the period 2008‐2010 half (50.4%) of the funding came from contribution of legislators and less than
1% came directly from appropriations from the government budget. An important component of
private financing came from training fees (28.6%). Other private funding sources are companies
who fund apprenticeships and learnership programs and NGOs and foundations who run short
courses.
The large dependence on the financing from legislators in the financing structure of the TESDA
programs in recent years is worrisome. This structure of financing may not help achieve
comprehensive equity and efficiency objectives as legislators are known to respond more to local
needs of constituents rather than based on a comprehensive assessment of TVET needs. Another
reason is that this may not be sustainable.
Quality Control Mechanisms
The quality control systems appears to be in place. As described earlier, this starts from the issuance
of the Certificate of Program Registration which imposes the requirements on existing training
regulations. After graduation, a certification process is also in place.
One of the issues raised in the earlier review of Orbeta and Abrigo (2013) is that less than half of the
TVET graduates in 2007 took the assessment test. This issue seems to be addressed consistently.
Figure 11 shows the proportion seeking certification. This is clearly shown to be increasing
consistently through the years – a good indication that this part of the quality control mechanism is
being promoted. It also shows that the certification rates are consistently very high.
Figure 11. Enrollment, Graduation, Assessment and Certification, 2005‐2013
Public Administration46%Trainees
29%
Companies
16%
NGOs and foundatio
ns7%
Income generatio
n2%
Courses 1 to 3 years
47%
Short courses
(less than 3 months)20%
General administrat
ion15%
Apprenticeship and
learnership12%
Courses 3 to 9
months6%

By secto
Current
than 80
having p
Source of B
or, the certi
Labor Statis
%, all other
perfect certif
Source: Cu2015
‐
500,000
1,000,000
1,500,000
2,000,000
2,500,000
2
4
6
8
10
12
Basic Data: P
fication rate
tics show th
r fields have
fication rates
Figu
urrent Labor
2005 20
Enrollee
89 84
0
20
40
60
80
00
20
PSA‐BLES Yea
es appear to
at except fo
higher cert
s (Figure 12).
ure 12. Certif
Statistics, Bu
006 2007
es Gra
85 8979
arbook of Lab
o be uniform
or ICT and ele
tification wit
.
fication rates
ureau of Lab
2008 2009
duates
10088 91
bor Statistics
mly high for
ectronics wh
th two (furn
s by sector, 2
bor and Emp
9 2010 2
Assessed
91
79
92
s 2014
all sectors.
ich had cert
itures and f
2013
loyment Stat
011 2012
Certified
8996 91
1
Data from t
tification rate
fixtures and
tistics, June
2013
10088
14
the BLES
es of less
utilities)

15
The system for regulating curriculum content appears to be in place with the institution of UPTRAS
requiring registration of all programs offered in public and private TVIs. What is needed is to work
towards a 100% coverage of both registering of courses as well as on development training
regulations for each. The data from 2012 graduates show that while the number of training with
training regulations is already 68%, there are still 19% registered with no training regulations and
14% not registered.
It is revealing that from the IES data for 2012 graduates the major reasons for not taking assessment
examinations is that assessment is not mandatory (26%) and that there is no assessment tools or
assessor or assessment center in the area (22%). A relatively smaller proportion are because they
are working, schooling or abroad (17%), financial constraint (8%), and feeling that skills are
insufficient (4%) (Figure 13). There is then a case for working on making assessment much more
universally available for both skills and areas.
Figure 13. Reasons for not taking Assessment, 2012
Source: 2013 IES
There is no direct measure of the importance of certification to firms/employers. A close enough
measure is the question in the IES that asks graduates whether their employers provides incentives
for certificate (NC/COC) holders. Data from the 2013 IES reveals that 68% does not and only 26% do
(Figure 14). This clearly indicates that there may be a need to work harder to make the certifications
a valuable tool for firms.
Figure 14. Do employers provide incentives to certificate holders, 2012
Assessment not mandatory
26%
Others23%
No assessment tools/assessor/ce
nter22%
Working/Schooling/Abroad
17%
Financial constraint
8%
Skills/Knowledge insufficient
4%

16
Source: 2013 IES
What requires a lot of work is the registry of trainers and assessors and their profile. Up to now
there is no readily available data on the profile of trainers and assessors. The numbers of available
trainers and assessors are not even continuously provided. There is also a need to know the profiles
of the trainers and assessors.
The performance of TVIs in terms of graduation and passing the assessment rates by program
appears not to be compiled and publicized. These are very important information for an informed
decision of prospective trainees, regulators and policy makers.
Organizational structure and coordination across institutions
By law TESDA is mandated to manage the whole TVET system. But it is also operates 120 training
institutes scattered throughout the country. It is thus both a player and a regulator at the same
time. This has been criticized by many (e.g. Lanzona, 2008) as giving undue advantage to TESDA
training institutes compared to private TVIs.
At the policy level, the TESDA Board, the highest policy making body is composed government,
private sector, labor and training institute representatives. The government representatives consist
of Secretary of Labor as Chair and with memberships from the Department of Education, Trade and
Industry, Agriculture, Science and Technology, Interior and Local Governments. This is the primary
point of coordination at the policy level.
At the operational level, from the training institute side, coordination is achieved in the
development and continuous review of training regulations. The development and review is done by
industry experts convened by TESDA. TESDA also certifies trainers.
On the trainee side, assessment and certification are conducted and supervised by TESDA which
issues certification.
It is to the credit of TESDA to have continuously conducted several rounds of impact evaluation
surveys. This really are more like tracer studies. This is the source of the basic data used to describe
the system in this report. In order to continuously improve the instrument and generate more
exhaustive analysis from the dataset, TESDA should consider putting out a public use file (PUF) and
invite researchers to analyze the data to answer questions about the TVET system in the country. As
No68%
Yes26%
Not indicated
6%

17
in many surveys of the PSA, opening the data for more eyes would improve quality of the datasets as
the instrument and survey procedure will be exposed to survey specialists and analysts.
Links with other labor market policies
The primary link of the TVET to other labor market policies is through the TESDA Board. It is also
worth reiterating that the Board is chaired by the Secretary of Labor, the department where labor
market policies are cleared and issued.
While there is constant push for better labor market information, it is not clear how much of this had
been supplied. Understandably, it is even more unclear how much of whatever information is
supplied had be used to inform decisions to review training regulations, course offerings of TVIs and
decision of would trainees.
E. Proposals to Improve Philippine NSTVET
This section provides a summary of recommendations to reform the NSTVET in the country. Some of
the recommendations came from recent sectoral reviews and presentations in TVET congresses.
Others are additional proposals from more recent literature and assessment done for this review.
TESDA should focus more on regulation and information provision
TESDA is currently the regulator of the NSTVET but at the same time operates 120 training
institutions scattered throughout the country. The call is for TESDA to focus more on regulation and
information provision (Lanzona, 2008; Orbeta and Abrigo, 2013). Regulation and information
provision are the main functions of government in TVET provision is only called for when the private
sector choose not to provide a critical service. If government needs to be in the provider market, it
should also make sure that the programs are contestable by other providers so it will also be subject
to market discipline like the offering of the private sector. The problem with non‐contestable
programs is that these will continue to exist even with doubtful performance because financing is
not related to performance.
Greater emphasis on enterprise‐based trainings
Enterprise‐based training is widely accepted as a preferred mode of delivery. Secretary Baldoz in her
presentation in the Second TVET Congress in (Oct 2013) identified the improvement in
apprenticeship / internship as a key action agenda. Many analysts (e.g., Lanzona, 2008; di Gropello
et al., 2010, Orbeta and Abrigo, 2013) highlight that enterprise‐based training and TVET modalities
that involves firms – such as the DTS – deserve more emphasis. One obvious reason is that it has
high employment rates‐the ultimate objective of training. However, it also continues to account for
the smallest proportion of trainees among the different modes of delivery. From the previous
section is shows that it only accounts for 4% of enrollment and 4% of graduation in 2010 (Table 1).
One can list many reasons for this puzzling outcome. Fundamental of these is the incompatibilities of
underlying incentives and possible sources of financing. Another important issue is that this can also

18
be subject to strategic behavior of firms because in‐firm wage‐training contracts will be difficult to
monitor, hence, also difficult to enforce.
Finding ways of promoting enterprise‐based training is a long standing recommendation. Corollary
to this recommendation is the review of legislation on apprenticeships and dual training are
recommended. There is in fact a bill (HB 5303) that recently passed the House of Representatives
proposing amendments to the apprenticeship law.
There is a need to understand better enterprise‐based training so that ways of promoting this mode
of delivery can be discovered. The importance of this mode will even become heightened with fast
changing technology in the work place where schools will increasingly be left behind technology
changes.
Making training continuously relevant to industry needs.
This recommendation come in different forms and many are articulated in the 2nd TVET Congress.
For instance, Secretary Baldoz, tourism and agriculture representatives called for the continued
review of curriculums and training regulations. Another recommendation with the same objective is
establishing or convening of industry councils for regular labor market signaling. Still another
recommendation is for TVET to address specific skill needs of roadmaps and important value chains.
Still another recommendation is increasing TVI‐industry linkages. Finally, di Gropello et al., (2010)
pointed out that a simple way to ensure continued inputs from industry in TVET is to increase the
representation of industry in the TESDA board.
Greater performance orientation in access to public training funds
Government had some experience with contracting service provision such as the experience with
Information Technology‐Business Process Association of the Philippines (IT‐BPAP) on training IT and
business process workers. When government contracts out service provision, selection should be by
competitive contracting with well‐defined performance measures. This presupposes clear
performance standards that would facilitate decision on whether a beneficiary should continue to
have access to government subsidies. This also means that effective sanction mechanisms are in
place that will prevent providers from receiving government subsidies when performance is below
standards (Lanzona, 2008; di Gropello etal, 2010)
There is considerable public financing for training. This can be used to nudge TVET to achieve
strategic development objectives. For instance, it can be harnessed to increase industry participation
in training like the experience with IT‐BPAP and similar arrangements. However, all of these strategic
intervention should be subjective to independent rigorous evaluations.
Improve targeting of financial assistance for TVET.
Secretary Baldoz in the 2nd TVET Congress argues for continued provision of financial assistance to
skill training. Orbeta and Abrigo (2013) argued for a more transparent selection methods of
beneficiaries. They have argued that a more transparent criteria will minimize influence peddling in
the selection of beneficiaries. The objective of financial assistance is to help the poor gain the skills
they are not able to pay. Loans for the financially constrained but non‐poor should be considered as

19
well. The practice of providing financial assistance to those who do not pass qualifying exams lowers
the probability of beneficiaries satisfactorily completing the program resulting into wasteful
investments.
Ensuring Quality in Community‐Based Training
Community‐based training competes with institution‐based training as the major mode of providing
training. It has been mentioned that many of these don’t have their own training facilities raising
concerns on quality. Some are worried that these might be mostly supply‐driven training. Yet, recent
data from the Impact Evaluation Surveys for graduates in 2012 shows that it has the highest
employment rates (72.5%) among the three modes of delivery higher even than enterprise‐based
training (72.2%). One view that explains this seeming puzzle is that these are more responsive to
community needs than institution‐based training. Certainly, more studies are needed to have a more
definitive answers to these puzzles. For the moment, there should be a systematic effort at ensuring
that the quality of community‐based training are acceptable.
Improving Data generation and Dissemination on TVIs and Trainers
Supporting the idea that TESDA focus more on regulation would be better information. One of the
poorest segment on the information on TVET is the characteristics of the TVIs and trainers. This
needs to improve if TESDA is to perform better its primary function of regulating the TVET industry.
Improving capacity for monitoring and evaluation
As TESDA focuses more on regulation and strategic financing, the capacity to continuously design
better instruments, test them and analyze their impacts rigorously should be systematically built in
the institution.
F. References
ADB (2004). Improving Technical Education and Vocational Training Strategies for Asia ADB (2009a) Good Practice in Technical and Vocational Education and Training. ADB (2009b) Financing Technical and Vocational Education and Training in the People’s Republic of China. ADB (2014) Sustainable Vocational Training Toward Industrial Upgrading and Economic Transformation. Di Gropello, E., H. Tan and P. Tandon (2010) Skills for the Labor Market in the Philippines. The World Bank. Kis, V. and E. Park (2012) A Skills beyond School Review of Korea. OECD. DOI: 10.1787/20777736

20
Lanzona (2008) “Technical and Vocational Education and Training in the Philippines.” Background report prepared for the WB. Orbeta, A. and M. Abrigo (2013) ”An Assessment of TESDA Scholarship Programs ” PIDS RPS 2013‐01. Orbeta, A. et al (2015) “Quality Assurance in Philippine Education: A Review” Draft report. Peano, S., B. de Dios, D. Atchoarena and U. Mendoza (2008) “Investment in Technical Vocational Education and Training (TVET) in the Philippines,” UNESCO UNESCO (2012) “Third International Congress on Technical and Vocational Education and Training”


![CaseReport IatrogenicSevereSplenicInjuryafterColonoscopy · References [1] S. Barbeiro, C. Atalaia-Martins, P. Marcos, J. Nobre, C. Gonçalves, and C. Aniceto, “Splenic rupture](https://static.fdocuments.in/doc/165x107/60d714ccfea66c6e141753fc/casereport-iatrogenicseveresplenicinjuryaftercolonoscopy-references-1-s-barbeiro.jpg)