![[Proposed] Final Judgment : U.S. v. Anheuser-Busch InBev ...](https://static.fdocuments.in/doc/165x107/62bf7a16dc0e776c7907c58b/proposed-final-judgment-us-v-anheuser-busch-inbev-.jpg)
[Proposed] Final Judgment : U.S. v. Anheuser-Busch InBev ...
1
Brussels / 9 May 2018 / 7.00am CET
ab-inbev.com
Press Release
Anheuser-Busch InBev reports First Quarter 2018 Results
HIGHLIGHTS
• Revenue: Revenue grew by 4.7% in the quarter, with revenue per hl growth of 4.9%, driven by revenue management initiatives as well as continued strong premium brand performance. On a constant geographic basis, revenue per hl grew by 5.3%.
• Volume: Total volumes declined by 0.2%, while own beer volumes grew by 0.5%. Good growth in own beer volumes was achieved in Mexico, Colombia and Argentina, partly offset by the US and Brazil. Our non-beer volumes declined by 6.9%, driven by soft results from Brazil and Peru.
• Global Brands: Combined revenues of our three global brands, Budweiser, Stella Artois and Corona, grew by 7.9% globally, and by 12.2% outside of their home markets. Budweiser revenues declined by 1.3%, driven by a decline in the US, but grew by 2.5% outside of the US driven by strong growth in Brazil, Paraguay, India and South Korea. Stella Artois revenues grew by 12.3%, with good performances in Argentina and the UK. Corona had another great quarter, with revenues growing 25.1% overall and 40.3% outside of Mexico, led by China and Western Europe.
• Cost of Sales (CoS): CoS increased by 1.3% in 1Q18 and by 1.5% on a per hl basis. On a constant geographic basis, CoS per hl increased by 2.4% assisted by synergy delivery.
• EBITDA: EBITDA grew by 6.6% with margin expansion of 70 bps to 38.2% as a result of top-line growth and aided by cost synergies, partly offset by increased sales and marketing investments ahead of the FIFA World CupTM as well as lower other operating income due to a difficult comparable.
• Net finance results: Net finance costs (excluding non-recurring net finance costs) were 1 545 million USD in 1Q18 as compared to 1 492 million USD in 1Q17. This was mainly due to a negative mark-to-market adjustment of 242 million USD in 1Q18, linked to the hedging of our share-based payment programs, compared to a gain of 130 million USD in 1Q17.
• Income taxes: Income tax was 673 million USD in 1Q18, up from 418 million USD in 1Q17 with the normalized effective tax rate increasing to 28.3% from 20.4%, negatively impacted by the mark-to-market adjustments linked to the hedging of our share-based payments programs and the timing of certain deductions.
• Profit: Normalized profit attributable to equity holders of AB InBev was 1 443 million USD in 1Q18 as compared to 1 458 million USD in 1Q17.
• Earnings per share: Normalized earnings per share (EPS) decreased to 0.73 USD in 1Q18 from 0.74 USD in 1Q17.
• Combination with SAB: The business integration is progressing well, with synergies and cost savings of 160 million USD captured during 1Q18.
The enclosed information constitutes regulated information as defined in the Belgian Royal Decree of 14 November 2007 regarding the duties of issuers of financial instruments which have been admitted for trading on a regulated market.
Except where otherwise stated, the comments below are based on organic growth figures and refer to 1Q18 versus the same period of last year. For important notes and disclaimers please refer to pages 14 and 15.
2
Brussels / 9 May 2018 / 7.00am CET
ab-inbev.com
Press Release
MANAGEMENT COMMENTS
In 1Q18, we saw revenue growth of 4.7%, with own beer volumes growing by 0.5%. Global revenue growth was driven by good volume performances in Mexico, Colombia and Argentina, further enhanced by our revenue management and premiumization initiatives around the world. Organic EBITDA grew by 6.6% with margin expansion of 70 bps to 38.2%. This result was driven by our revenue delivery and continued synergy capture, though partially offset by the phasing of sales and marketing initiatives ahead of the FIFA World CupTM, as flagged during our FY17 results. Our global brands continued to deliver solid results, with revenue growth of 7.9% globally and 12.2% outside of their respective home markets. These brands typically command a premium and contribute higher margins when sold outside of their home markets. Budweiser revenues declined by 1.3% due primarily to a soft performance in the US. However, excluding the US, Budweiser saw growth of 2.5% driven by Brazil, Paraguay, India and South Korea. Stella Artois delivered double-digit top-line growth, led by Argentina, the UK and the US. Corona continued to lead the way, with revenues up by 25.1% and by 40.3% outside of Mexico, fueled by strong results from a diverse set of markets.
Figure 1. Consolidated performance (million USD)
1Q17 1Q18 Organic
growth
Total Volumes (thousand hls) 147 872 134 831 -0.2%
AB InBev own beer 117 729 118 351 0.5%
Non-beer volumes 29 243 15 342 -6.9%
Third party products 900 1 138 26.5%
Revenue 12 922 13 073 4.7%
Gross profit 7 693 8 085 6.9%
Gross margin 59.5% 61.8% 126 bps
Normalized EBITDA 4 809 4 989 6.6%
Normalized EBITDA margin 37.2% 38.2% 70 bps
Normalized EBIT 3 721 3 935 9.7%
Normalized EBIT margin 28.8% 30.1% 140 bps
Profit attributable to equity holders of AB InBev 1 405 1 018
Normalized profit attributable to equity holders of AB InBev 1 458 1 443
Earnings per share (USD) 0.71 0.52
Normalized earnings per share (USD) 0.74 0.73
Figure 2. Volumes (thousand hls)
1Q17 Scope Organic 1Q18
growth Total
Volume
Own beer
volume
North America 25 836 33 -1 055 24 814 -4.1% -4.2%
Latin America West 25 531 - 20 2 150 27 661 8.4% 10.7%
Latin America North 30 419 - 61 -2 806 27 551 -9.2% -6.4%
Latin America South 9 090 17 507 9 614 5.6% 5.9%
EMEA 32 919 -12 742 372 20 549 1.8% 1.4%
Asia Pacific 23 683 14 600 24 296 2.5% 1.6%
Global Export and Holding Companies 395 - - 49 346 -12.3% -12.3%
AB InBev Worldwide 147 872 -12 759 - 281 134 831 -0.2% 0.5%
Organic growth
3
Brussels / 9 May 2018 / 7.00am CET
ab-inbev.com
Press Release
Our portfolio of global brands allows us to reach consumers across a variety of occasions, and we see potential for further growth as premiumization continues to be a global trend. We are also stepping up our distribution and activation of this portfolio across many new markets, such as Colombia, Peru, Ecuador, Australia and South Africa. Coming into the second quarter, we are looking forward to the opportunities presented by the FIFA World CupTM, with Budweiser acting as a global sponsor. We have many exciting plans in place to activate Budweiser around this platform in existing and new markets driving further awareness, penetration and ultimately brand preference. This quarter, we also committed to our 2025 Sustainability Goals in smart agriculture, water stewardship, circular packaging, and climate action. Having achieved all previous sustainability goals over the past decade, we will continue to advance our environmental and social commitments while introducing new programs that have a positive impact on the communities where we operate.
Our 2025 Sustainability Goals are as follows:
• Smart Agriculture: 100% of our direct farmers will be skilled, connected and financially empowered.
• Water Stewardship: 100% of our communities in high stress areas will have measurably improved water availability and quality.
• Circular Packaging: 100% of our products will be in packaging that is returnable or made from majority recycled content.
• Climate Action: o 100% of our purchased electricity will be from renewable sources; and a o 25% reduction in CO2 emissions across our value chain.
Our Dream is to bring people together for a better world, which is why we are committed to supporting a healthy environment and strong communities. We look forward to updating you on the progress of these goals in the years to come. Our integration with SAB continues to progress well. We delivered 160 million USD of synergies and cost savings this quarter. More importantly, we continue to scale up our category expansion framework in a way that allows us to focus on organic growth in all segments across our geographic footprint. We are excited about the potential of this framework and we remain committed to leading the global beer category, positioning ourselves to deliver sustainable, long-term organic growth for many years to come.
4
Brussels / 9 May 2018 / 7.00am CET
ab-inbev.com
Press Release
2018 OUTLOOK
(i) Overall Performance: While recognizing volatility in some of our key markets, we expect to deliver strong Revenue and EBITDA growth in FY18 driven by the solid performance of our brand portfolio and strong commercial plans. Our growth model is now far more focused on category development, and as a consequence, we expect to deliver revenue per hl growth ahead of inflation based on premiumization and revenue management initiatives, while keeping costs below inflation. While 1Q18 was slightly better than we initially expected, we remain confident that growth will accelerate for the balance of the year, primarily in the second half.
(ii) Synergies: We maintain our 3.2 billion USD synergy and cost savings expectation on a constant currency basis as of August 2016. From this total, 547 million USD was reported by former SAB as of 31 March 2016, and 2 293 million USD was captured in total through 31 March 2018. The balance of roughly 900 million USD is expected to be captured in the next two to three years.
(iii) Net Finance Costs: We expect the average net debt coupon in FY18 to be around 3.7%. Net pension
interest expenses and accretion expenses are expected to be approximately 30 and 100 million USD per quarter, respectively. Other financial results will continue to be impacted by any gains and losses related to the hedging of our share-based payment programs.
(iv) Effective Tax Rate: We expect the normalized ETR in FY18 to be in the range of 24% to 26%,
excluding any future gains and losses relating to the hedging of our share-based programs. This guidance includes the impact of the US tax reform which introduces a lower US corporate tax rate, offset by a broader tax base and new limitations on certain business deductions. The ETR guidance is based upon available interpretation of the US tax reform act and may change as the company receives additional clarification and implementation guidance.
(v) Net Capital Expenditure: We expect net capital expenditure of between 4.0 and 4.5 billion USD in
FY18. (vi) Debt: Approximately 42% of our gross debt is denominated in currencies other than the US dollar,
principally the euro. Our optimal capital structure remains a net debt to EBITDA ratio of around 2x. (vii) Dividends: We continue to expect dividends to be a growing flow over time, although growth in the
short term is expected to be modest given the importance of deleveraging.
5
Brussels / 9 May 2018 / 7.00am CET
ab-inbev.com
Press Release
BUSINESS REVIEW
United States We estimate that industry Sales-to-Retailers (STRs) in the United States declined by 2.3% in 1Q18, due primarily to colder-than-average temperatures, while underlying beer trends remain unchanged. Our own STRs were down 3.3% while our Sales-to-Wholesalers (STWs) were down 4.4%, and we continue to expect STRs and STWs to converge on a full year basis. Our revenues, which are based on STWs, decreased by 2.5% in 1Q18. Revenue per hl grew by 1.9%, driven by revenue management initiatives and positive brand mix. Our Above Premium brand portfolio continues to accelerate, increasing share by 80 bps in 1Q18. Michelob Ultra once again led the way in our premiumization strategy, with volumes up by double-digits as the top share gainer in the US for the twelfth consecutive quarter. This performance was enhanced by increased awareness following two commercials in the Super Bowl in February. Additionally, we launched a new line extension called Michelob Ultra Pure Gold in 1Q18, which is brewed with organic grains, has lower calories and lower carbohydrates, and priced at a premium to Michelob Ultra. Stella Artois continued to gain share this quarter, as did our regional craft portfolio which outperformed the overall segment. Our Premium and Premium Light brands, Budweiser and Bud Light, saw improved share trends in 1Q18 with total market share losses of 35 bps and 70 bps, respectively. Budweiser has been consistently improving its brand consideration and penetration trends, and in 1Q18 the brand reported flat share of the Premium segment versus 1Q17. Our communication is focused on the people behind the Budweiser brand, and this year’s Super Bowl commercial emphasized our commitment to helping those impacted by natural disasters through our water donation program. While we continue to face challenges on Bud Light, we are seeing consistent improvements in brand health and market share trends. Bud Light was the leading beer brand in social conversation for the second consecutive quarter behind the success of the popular ‘Dilly Dilly’ campaign, as we activated key cultural moments across the country. We continue to strengthen our messaging around the brand’s quality credentials and are seeing pockets of improvement around the country driven by hyper-local programming and execution. These actions have contributed to positive momentum in brand penetration and consideration and improved share trends within the Premium Light segment. While we acknowledge we still have work to do, we remain committed to and focused on stabilizing Bud Light’s volume trends and share performance within its segment. Our Value brand portfolio underperformed the industry this quarter, driven by a tough comparable following last year’s Busch Super Bowl campaign. Our Near Beer portfolio performed well this quarter and we continue to see this as an important segment for category growth and health. Natty Rush and Spiked Seltzer grew by triple-digits during the quarter and we are excited about our plans to build on this momentum during the summer. Overall, we estimate a decline in total market share of approximately 50 bps in 1Q18, a sequential improvement in share trend since the second quarter of last year. The share decline was entirely driven by the impact of the industry segment mix shift. Our EBITDA declined by 5.0% with margin contraction of 102 bps to 39.0%, driven by the top-line contraction, the increase of the year-over-year hedge price of commodities and higher distribution expenses due to increased freight costs in the US, a trend that began in the second half of 2017. We continued to see progress in our commercial strategy this quarter and remain committed to improving both our top and bottom line performance in the US.
6
Brussels / 9 May 2018 / 7.00am CET
ab-inbev.com
Press Release
Mexico Mexico delivered a very strong 1Q18, with volumes growing in the mid-teens and revenue growing in the high-teens. This was driven by our commercial strategies and further helped by the timing of Easter. Our brand portfolio delivered strong double digit growth across the board with the Corona brand family executing a successful pack assortment strategy, Victoria retaining its healthy momentum by continuing to leverage its Mexican heritage platform, and Bud Light scaling up its music platforms across the country and gaining further penetration in the North region. Premiumization remains a key opportunity for future growth in Mexico, like many other markets in which we operate, where the premium segment is only a low-single digit percentage of the total country’s volume. Our premium brands have been accelerating their double digit growth, led by Michelob Ultra capitalizing on increasing health and wellness trends, and Stella Artois successfully developing new occasions. EBITDA grew by 15.8% in 1Q18, driven by strong top-line growth and lower distribution expenses. EBITDA margin contracted by 82 bps to 41.3% due to the cycling of a one-time gain in operating income in 1Q17.
Colombia Our Colombian business also performed well with revenue growth of 12.1%. Revenue per hl growth of 4.4% was driven by favorable brand mix and prior year revenue management initiatives. Strong volume growth of 7.3% was led by beer volume growth of 8.3%, and our non-beer volumes improved by 1.5%. Beer volume growth was underpinned by global as well as core brands and enhanced by trade activations, and also helped by the timing of Easter. We saw further growth of our global brand portfolio, as we increased the distribution of Corona and Budweiser. We also introduced Beck’s as a classic lager in the market to target occasions both with meals and when socializing with friends in and out of home. Within the core portfolio, Aguila had a particularly strong quarter on the back of FIFA World CupTM activations and grew by more than 50%, with a creative campaign leveraging nostalgia from the last time Colombia was in the FIFA World CupTM. We estimate that beer has gained a further 260 bps share of total alcohol this quarter. EBITDA grew by over 20% with almost 400 bps of margin expansion. This was driven by strong top-line performance and further synergy delivery, partially offset by increased investment behind our brands. Brazil As expected, 1Q18 was a challenging quarter. Revenue decreased by 1.8%, with beer volumes down by 8.1% and non-beer volumes declining 19.4%. Weak volume performance was due to: i) a softer industry as a result of an earlier Carnival and poor weather, and ii) cycling a tough comparable as a result of significant market outperformance last year. Despite the short-term volatility, we made progress in many of our commercial platforms to position ourselves for future growth. This quarter we launched a new Visual Brand Identity (VBI) for Antarctica exploring the brand’s tradition and quality, and building on the learnings from the recently launched VBIs for Skol and Brahma. We also undertook several initiatives related to packaging and route-to-market that offer more affordable options to consumers and improve profitability. In the premium segment, our global brand portfolio outperformed the market, growing volumes by double-digits as consumers continue to trade up to premium brands. Volumes shortfall was partially offset by net revenue per hl improvement resulting from revenue management initiatives implemented in 3Q17. Tight cost management coupled with favorable FX resulted in an EBITDA increase of 5.5% and margin expansion of 291 bps to 41.6%.
7
Brussels / 9 May 2018 / 7.00am CET
ab-inbev.com
Press Release
With the first quarter behind us, we continue to believe we have the commercial plans in place to resume volume growth in the second quarter and further accelerate EBITDA growth for the balance of the year. We remain consistent in our strategy, leveraging our growth platforms and making good progress in each of them to further pave the way for sustainable long-term growth of the beer category. South Africa
Our South African business saw revenue growth of mid-single digits, driven by high single digit revenue per hl growth and low single digit volume declines. The above-inflation excise tax increases announced in the annual budget in February were followed by a price increase on 1 March unlike the prior year when the tax increase was absorbed until 1 July. This reduced demand in the mainstream segment with a consequent loss of market share during the earlier Easter peak season. Budweiser was launched nationally in March in preparation for the upcoming FIFA World CupTM. The global brand portfolio including Stella Artois and Corona grew by more than 200% in the quarter and gained over 600 bps of share in the growing premium segment. Castle Lite continues its strong growth in the core plus segment and this quarter achieved the highest ever online engagement through its partnership with the famous rap artist Chance the Rapper. Castle Free continues to expand the beer category into the no-alcohol space and recently announced a multi-year sponsorship of the National Rugby 7s team. In the near beer segment, the successful launch of a new variant contributed to over 30% growth in Flying Fish. The 1-liter returnable bottle launched in 3Q17 was rolled out nationally during 1Q18, offering core and core plus brands in an affordable multi-serve format to reach new consumers in more occasions. Synergy capture, combined with disciplined cost management led to double-digit EBITDA growth and more than 300 bps of EBITDA margin expansion. China Revenue grew by 4.4% in 1Q18 despite cycling double-digit growth in 1Q17, driven by volume growth of 1.6% and revenue per hl growth of 2.7% Chinese New Year again offered excellent opportunities to connect and celebrate with consumers both on and off-line. Budweiser remains the leading brand among high income consumers, showing continued improvement in brand preference following a successful Chinese New Year activation. Our High End Company continues to record high double-digit volume growth, led by an outstanding performance by Corona, which became the number one imported beer in China, according to publicly available data. This was further aided by robust growth of our craft and specialties portfolio. Additionally, our e-commerce business in China continues to perform very well, with volumes up by high double-digits in the quarter. Our estimated market share continued to rise above 20% in an industry that showed a modest recovery in 1Q18 after we estimate it declined by 0.9% in FY17. The business delivered organic EBITDA growth of 10.6%, with an increase of more than 200 bps in EBITDA margin to 35.5%, driven by favorable price mix, productivity gains and geographic footprint optimization. We believe our brand portfolio, which over-indexes our national market share in the faster-growing premium and super premium segments and on-line channels, remains well-positioned to continue growing ahead of the industry.

8
Brussels / 9 May 2018 / 7.00am CET
ab-inbev.com
Press Release
Highlights from our other markets Canada reported an improved performance this quarter, with an improved industry trend and healthy performance across our portfolio contributing to top-line growth. Bud Light remains the fastest growing brand in the country, and we also saw double-digit growth from Michelob Ultra. In the high end segment, Stella Artois and Corona were the top two fastest growing brands, and our local craft portfolio grew by double-digits. Peru recorded double-digit revenue growth on flattish beer volumes and negative soft drink sales as a result of the revenue management initiatives implemented in 4Q17 and favorable brand mix. We saw solid growth in all three global brands, as well as a strong Cristal brand activation in support of the national team on their way to the FIFA World CupTM. Ecuador recorded revenue growth in the mid-teens, coupled with double-digit volume growth, in an economy recovering from the impact of the earthquake in April 2016. In Latin America South, mid-single digit volume growth was recorded in Argentina, Paraguay, Uruguay and Bolivia, all contributing to revenue growth of 24.4% for the region. Argentina saw beer market share growth for the third consecutive quarter with the repositioning of the two largest core brands, Quilmes Clásica and Brahma, both growing volumes by high single digits following a successful application of the category expansion framework. Our global brands once again recorded double-digit revenue growth throughout the region, and we look forward to activating Budweiser in Argentina during the FIFA World CupTM now that it has rejoined our portfolio. Within EMEA, Western Europe grew revenue by low-single digits, underpinned by volume growth and outperforming a weak industry. Our UK business delivered double-digit revenue growth, despite cycling a tough comparable. In Eastern Europe, revenue contraction was driven by the continued decline of volumes in Russia. Additionally, on 30 March 2018, we completed the 50:50 merger of our and Anadolu Efes' existing Russia and Ukraine businesses. The combined business will be fully consolidated in the Anadolu Efes financial accounts. As a result of the transaction, we stopped consolidating our Russia and Ukraine businesses and account for our investment in AB InBev Efes under the equity method, as of that date. In Africa excluding South Africa, our own beer volumes grew by double-digits in nearly all countries in which we operate. The top contributor for the quarter was Nigeria, which grew own beer volumes in the high teens. Budweiser was launched in Nigeria in March with strong early demand. It will be supported by traditional and digital media aided by its global sponsorship of the FIFA World CupTM, in which the Nigerian national team will be competing. Australia continued to post strong commercial gains with revenue growing by high single-digits this quarter. Great Northern remains a key engine of growth, along with Carlton Dry, which has generated a strong consumer response to its recent ‘Underthink It’ campaign. Our high end portfolio was again a solid contributor to top-line growth, with effective Corona and Stella Artois premiumization initiatives and double-digit growth in our craft portfolio led by 4 Pines, Pirate Life and Wild Yak.
9
Brussels / 9 May 2018 / 7.00am CET
ab-inbev.com
Press Release
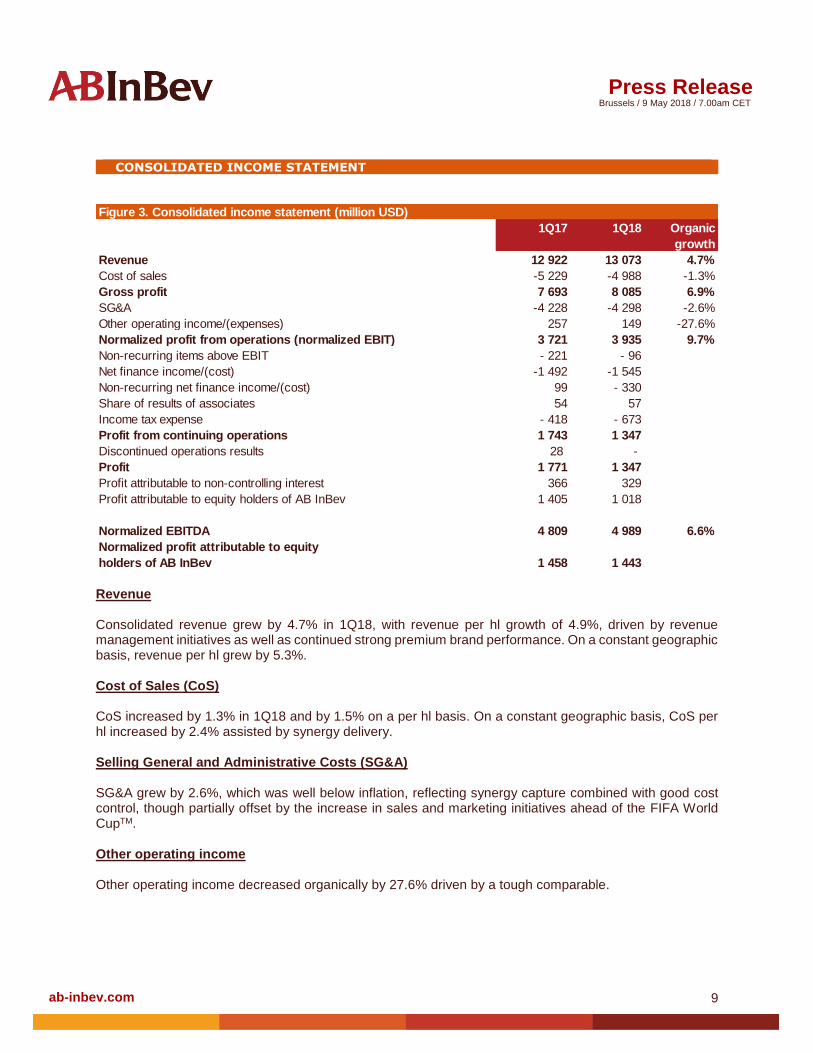
CONSOLIDATED INCOME STATEMENT
Revenue Consolidated revenue grew by 4.7% in 1Q18, with revenue per hl growth of 4.9%, driven by revenue management initiatives as well as continued strong premium brand performance. On a constant geographic basis, revenue per hl grew by 5.3%. Cost of Sales (CoS) CoS increased by 1.3% in 1Q18 and by 1.5% on a per hl basis. On a constant geographic basis, CoS per hl increased by 2.4% assisted by synergy delivery. Selling General and Administrative Costs (SG&A) SG&A grew by 2.6%, which was well below inflation, reflecting synergy capture combined with good cost control, though partially offset by the increase in sales and marketing initiatives ahead of the FIFA World CupTM. Other operating income Other operating income decreased organically by 27.6% driven by a tough comparable.
Figure 3. Consolidated income statement (million USD)
1Q17 1Q18 Organic
growth
Revenue 12 922 13 073 4.7%
Cost of sales -5 229 -4 988 -1.3%
Gross profit 7 693 8 085 6.9%
SG&A -4 228 -4 298 -2.6%
Other operating income/(expenses) 257 149 -27.6%
Normalized profit from operations (normalized EBIT) 3 721 3 935 9.7%
Non-recurring items above EBIT - 221 - 96
Net finance income/(cost) -1 492 -1 545
Non-recurring net finance income/(cost) 99 - 330
Share of results of associates 54 57
Income tax expense - 418 - 673
Profit from continuing operations 1 743 1 347
Discontinued operations results 28 -
Profit 1 771 1 347
Profit attributable to non-controlling interest 366 329
Profit attributable to equity holders of AB InBev 1 405 1 018
Normalized EBITDA 4 809 4 989 6.6%
Normalized profit attributable to equity
holders of AB InBev 1 458 1 443
10
Brussels / 9 May 2018 / 7.00am CET
ab-inbev.com
Press Release
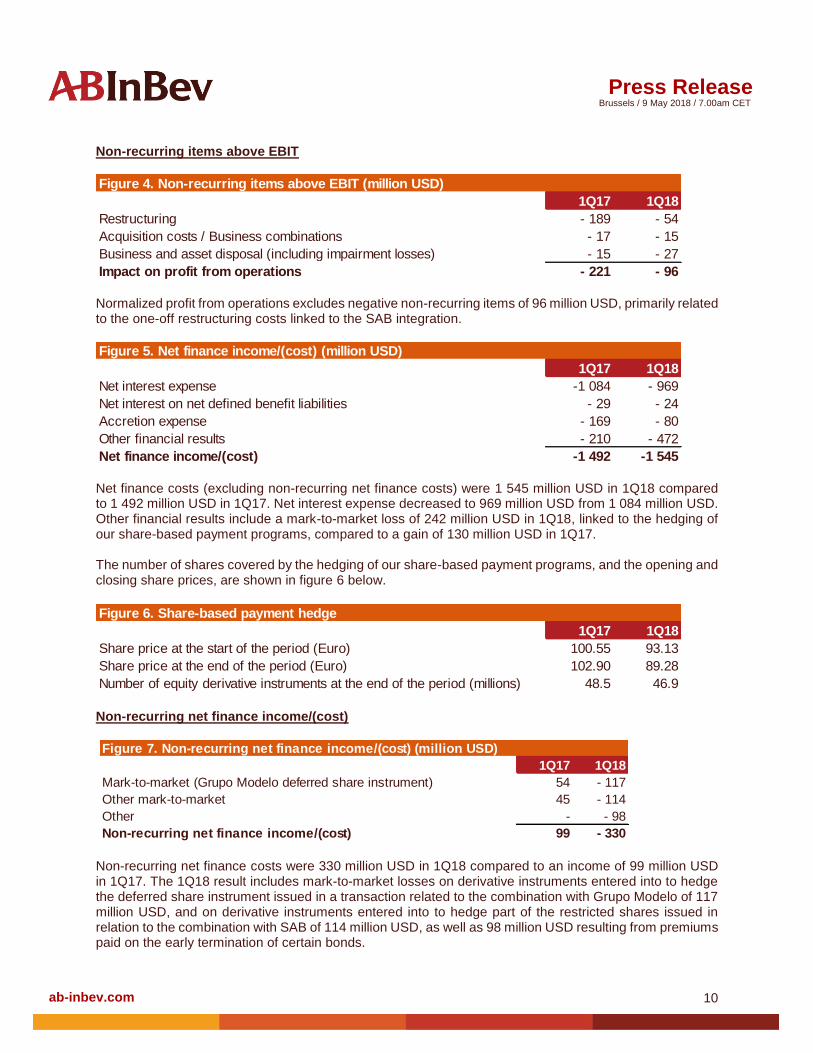
Non-recurring items above EBIT
Normalized profit from operations excludes negative non-recurring items of 96 million USD, primarily related to the one-off restructuring costs linked to the SAB integration.
Net finance costs (excluding non-recurring net finance costs) were 1 545 million USD in 1Q18 compared to 1 492 million USD in 1Q17. Net interest expense decreased to 969 million USD from 1 084 million USD. Other financial results include a mark-to-market loss of 242 million USD in 1Q18, linked to the hedging of our share-based payment programs, compared to a gain of 130 million USD in 1Q17. The number of shares covered by the hedging of our share-based payment programs, and the opening and closing share prices, are shown in figure 6 below.
Non-recurring net finance income/(cost)
Non-recurring net finance costs were 330 million USD in 1Q18 compared to an income of 99 million USD in 1Q17. The 1Q18 result includes mark-to-market losses on derivative instruments entered into to hedge the deferred share instrument issued in a transaction related to the combination with Grupo Modelo of 117 million USD, and on derivative instruments entered into to hedge part of the restricted shares issued in relation to the combination with SAB of 114 million USD, as well as 98 million USD resulting from premiums paid on the early termination of certain bonds.
Figure 4. Non-recurring items above EBIT (million USD)
1Q17 1Q18
Restructuring - 189 - 54
Acquisition costs / Business combinations - 17 - 15
Business and asset disposal (including impairment losses) - 15 - 27
Impact on profit from operations - 221 - 96
Figure 5. Net finance income/(cost) (million USD)
1Q17 1Q18
Net interest expense -1 084 - 969
Net interest on net defined benefit liabilities - 29 - 24
Accretion expense - 169 - 80
Other financial results - 210 - 472
Net finance income/(cost) -1 492 -1 545
Figure 6. Share-based payment hedge
1Q17 1Q18
Share price at the start of the period (Euro) 100.55 93.13
Share price at the end of the period (Euro) 102.90 89.28
Number of equity derivative instruments at the end of the period (millions) 48.5 46.9
Figure 7. Non-recurring net finance income/(cost) (million USD)
1Q17 1Q18
Mark-to-market (Grupo Modelo deferred share instrument) 54 - 117
Other mark-to-market 45 - 114
Other - - 98
Non-recurring net finance income/(cost) 99 - 330
11
Brussels / 9 May 2018 / 7.00am CET
ab-inbev.com
Press Release
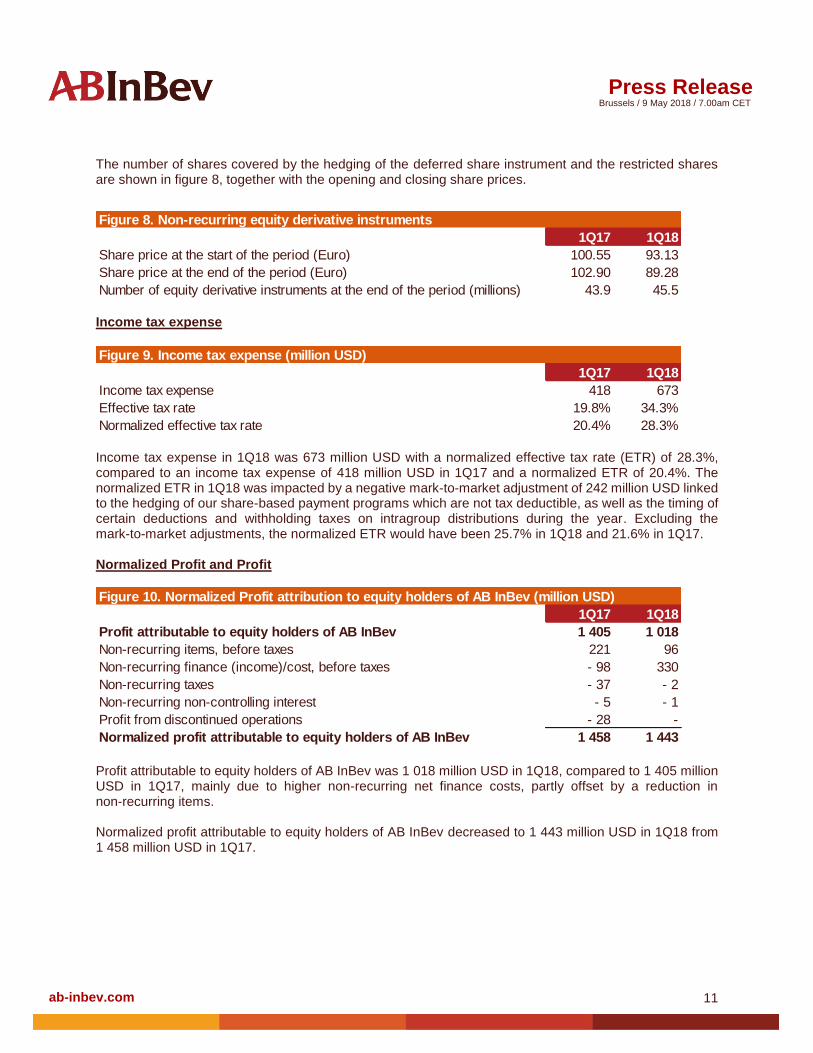
The number of shares covered by the hedging of the deferred share instrument and the restricted shares are shown in figure 8, together with the opening and closing share prices.
Income tax expense
Income tax expense in 1Q18 was 673 million USD with a normalized effective tax rate (ETR) of 28.3%, compared to an income tax expense of 418 million USD in 1Q17 and a normalized ETR of 20.4%. The normalized ETR in 1Q18 was impacted by a negative mark-to-market adjustment of 242 million USD linked to the hedging of our share-based payment programs which are not tax deductible, as well as the timing of certain deductions and withholding taxes on intragroup distributions during the year. Excluding the mark-to-market adjustments, the normalized ETR would have been 25.7% in 1Q18 and 21.6% in 1Q17. Normalized Profit and Profit
Profit attributable to equity holders of AB InBev was 1 018 million USD in 1Q18, compared to 1 405 million USD in 1Q17, mainly due to higher non-recurring net finance costs, partly offset by a reduction in non-recurring items. Normalized profit attributable to equity holders of AB InBev decreased to 1 443 million USD in 1Q18 from 1 458 million USD in 1Q17.
Figure 8. Non-recurring equity derivative instruments
1Q17 1Q18
Share price at the start of the period (Euro) 100.55 93.13
Share price at the end of the period (Euro) 102.90 89.28
Number of equity derivative instruments at the end of the period (millions) 43.9 45.5
Figure 9. Income tax expense (million USD)
1Q17 1Q18
Income tax expense 418 673
Effective tax rate 19.8% 34.3%
Normalized effective tax rate 20.4% 28.3%
Figure 10. Normalized Profit attribution to equity holders of AB InBev (million USD)
1Q17 1Q18
Profit attributable to equity holders of AB InBev 1 405 1 018
Non-recurring items, before taxes 221 96
Non-recurring finance (income)/cost, before taxes - 98 330
Non-recurring taxes - 37 - 2
Non-recurring non-controlling interest - 5 - 1
Profit from discontinued operations - 28 -
Normalized profit attributable to equity holders of AB InBev 1 458 1 443
12
Brussels / 9 May 2018 / 7.00am CET
ab-inbev.com
Press Release
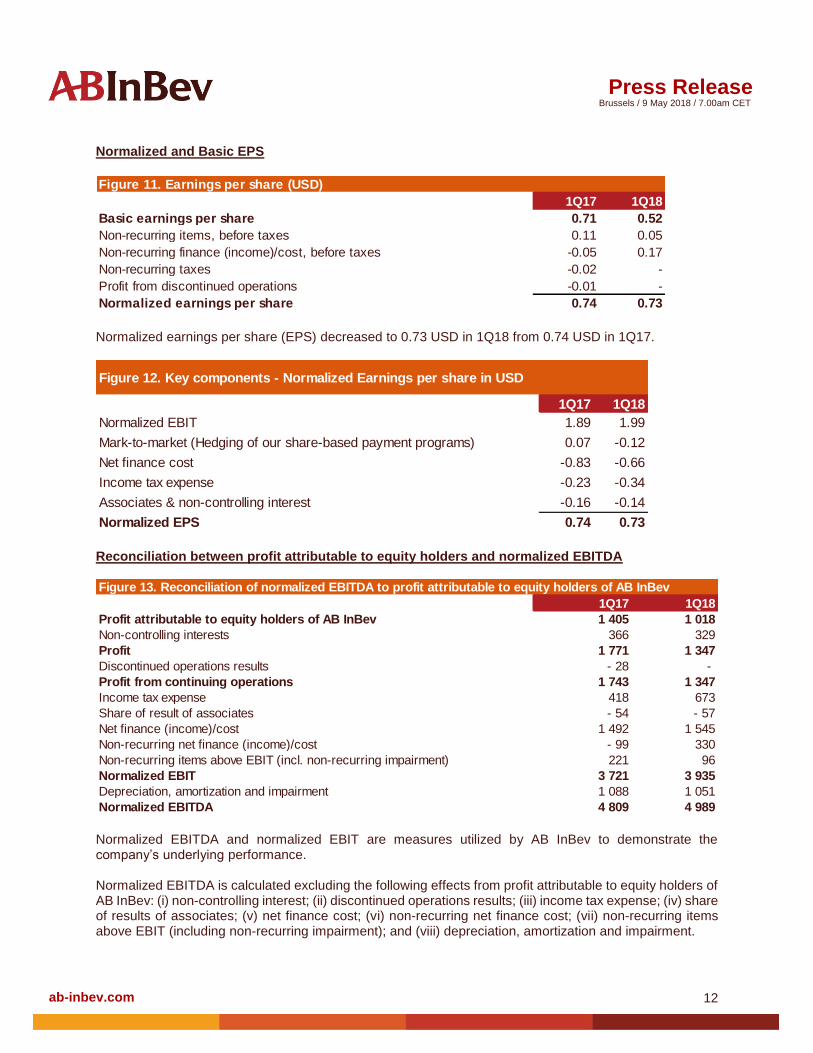
Normalized and Basic EPS
Normalized earnings per share (EPS) decreased to 0.73 USD in 1Q18 from 0.74 USD in 1Q17.
Reconciliation between profit attributable to equity holders and normalized EBITDA
Normalized EBITDA and normalized EBIT are measures utilized by AB InBev to demonstrate the company’s underlying performance. Normalized EBITDA is calculated excluding the following effects from profit attributable to equity holders of AB InBev: (i) non-controlling interest; (ii) discontinued operations results; (iii) income tax expense; (iv) share of results of associates; (v) net finance cost; (vi) non-recurring net finance cost; (vii) non-recurring items above EBIT (including non-recurring impairment); and (viii) depreciation, amortization and impairment.
Figure 11. Earnings per share (USD)
1Q17 1Q18
Basic earnings per share 0.71 0.52
Non-recurring items, before taxes 0.11 0.05
Non-recurring finance (income)/cost, before taxes -0.05 0.17
Non-recurring taxes -0.02 -
Profit from discontinued operations -0.01 -
Normalized earnings per share 0.74 0.73
Figure 12. Key components - Normalized Earnings per share in USD
1Q17 1Q18
Normalized EBIT 1.89 1.99
Mark-to-market (Hedging of our share-based payment programs) 0.07 -0.12
Net finance cost -0.83 -0.66
Income tax expense -0.23 -0.34
Associates & non-controlling interest -0.16 -0.14
Normalized EPS 0.74 0.73
1Q17 1Q18
Profit attributable to equity holders of AB InBev 1 405 1 018
Non-controlling interests 366 329
Profit 1 771 1 347
Discontinued operations results - 28 -
Profit from continuing operations 1 743 1 347
Income tax expense 418 673
Share of result of associates - 54 - 57
Net finance (income)/cost 1 492 1 545
Non-recurring net finance (income)/cost - 99 330
Non-recurring items above EBIT (incl. non-recurring impairment) 221 96
Normalized EBIT 3 721 3 935
Depreciation, amortization and impairment 1 088 1 051
Normalized EBITDA 4 809 4 989
Figure 13. Reconciliation of normalized EBITDA to profit attributable to equity holders of AB InBev
13
Brussels / 9 May 2018 / 7.00am CET
ab-inbev.com
Press Release
Normalized EBITDA and normalized EBIT are not accounting measures under IFRS accounting and should not be considered as an alternative to profit attributable to equity holders as a measure of operational performance, or an alternative to cash flow as a measure of liquidity. Normalized EBITDA and normalized EBIT do not have a standard calculation method and AB InBev’s definition of normalized EBITDA and normalized EBIT may not be comparable to that of other companies.
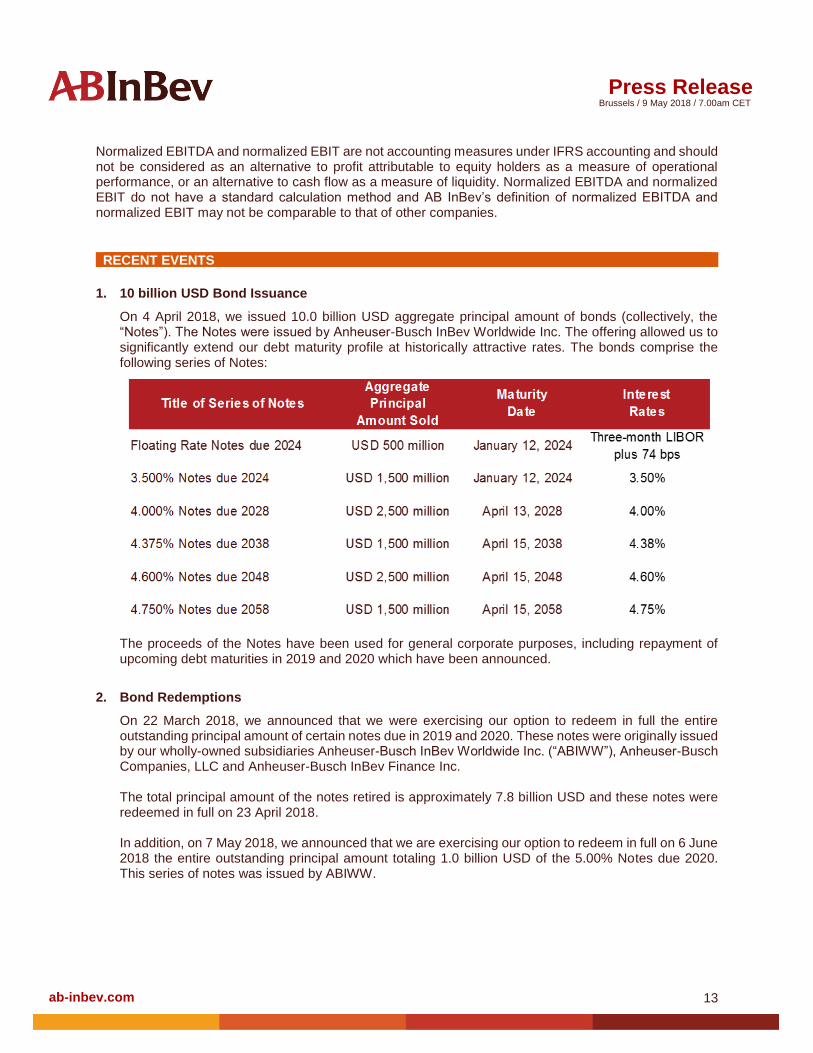
1. 10 billion USD Bond Issuance
On 4 April 2018, we issued 10.0 billion USD aggregate principal amount of bonds (collectively, the “Notes”). The Notes were issued by Anheuser-Busch InBev Worldwide Inc. The offering allowed us to significantly extend our debt maturity profile at historically attractive rates. The bonds comprise the following series of Notes:
The proceeds of the Notes have been used for general corporate purposes, including repayment of upcoming debt maturities in 2019 and 2020 which have been announced.
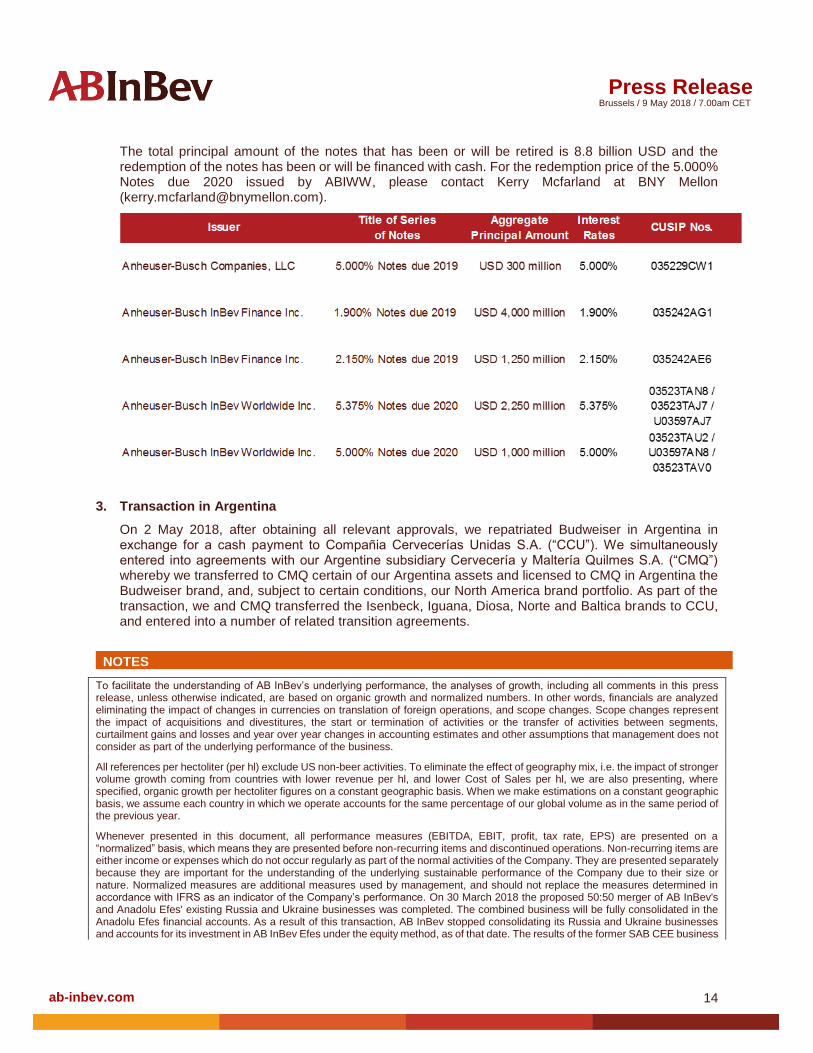
2. Bond Redemptions
On 22 March 2018, we announced that we were exercising our option to redeem in full the entire outstanding principal amount of certain notes due in 2019 and 2020. These notes were originally issued by our wholly-owned subsidiaries Anheuser-Busch InBev Worldwide Inc. (“ABIWW”), Anheuser-Busch Companies, LLC and Anheuser-Busch InBev Finance Inc. The total principal amount of the notes retired is approximately 7.8 billion USD and these notes were redeemed in full on 23 April 2018. In addition, on 7 May 2018, we announced that we are exercising our option to redeem in full on 6 June 2018 the entire outstanding principal amount totaling 1.0 billion USD of the 5.00% Notes due 2020. This series of notes was issued by ABIWW.
RECENT EVENTS
14
Brussels / 9 May 2018 / 7.00am CET
ab-inbev.com
Press Release
The total principal amount of the notes that has been or will be retired is 8.8 billion USD and the redemption of the notes has been or will be financed with cash. For the redemption price of the 5.000% Notes due 2020 issued by ABIWW, please contact Kerry Mcfarland at BNY Mellon ([email protected]).
3. Transaction in Argentina
On 2 May 2018, after obtaining all relevant approvals, we repatriated Budweiser in Argentina in exchange for a cash payment to Compañia Cervecerías Unidas S.A. (“CCU”). We simultaneously entered into agreements with our Argentine subsidiary Cervecería y Maltería Quilmes S.A. (“CMQ”) whereby we transferred to CMQ certain of our Argentina assets and licensed to CMQ in Argentina the Budweiser brand, and, subject to certain conditions, our North America brand portfolio. As part of the transaction, we and CMQ transferred the Isenbeck, Iguana, Diosa, Norte and Baltica brands to CCU, and entered into a number of related transition agreements.
NOTES
To facilitate the understanding of AB InBev’s underlying performance, the analyses of growth, including all comments in this press release, unless otherwise indicated, are based on organic growth and normalized numbers. In other words, financials are analyzed eliminating the impact of changes in currencies on translation of foreign operations, and scope changes. Scope changes represent the impact of acquisitions and divestitures, the start or termination of activities or the transfer of activities between segments, curtailment gains and losses and year over year changes in accounting estimates and other assumptions that management does not consider as part of the underlying performance of the business.
All references per hectoliter (per hl) exclude US non-beer activities. To eliminate the effect of geography mix, i.e. the impact of stronger volume growth coming from countries with lower revenue per hl, and lower Cost of Sales per hl, we are also presenting, where specified, organic growth per hectoliter figures on a constant geographic basis. When we make estimations on a constant geographic basis, we assume each country in which we operate accounts for the same percentage of our global volume as in the same period of the previous year.
Whenever presented in this document, all performance measures (EBITDA, EBIT, profit, tax rate, EPS) are presented on a “normalized” basis, which means they are presented before non-recurring items and discontinued operations. Non-recurring items are either income or expenses which do not occur regularly as part of the normal activities of the Company. They are presented separately because they are important for the understanding of the underlying sustainable performance of the Company due to their size or nature. Normalized measures are additional measures used by management, and should not replace the measures determined in accordance with IFRS as an indicator of the Company’s performance. On 30 March 2018 the proposed 50:50 merger of AB InBev's and Anadolu Efes' existing Russia and Ukraine businesses was completed. The combined business will be fully consolidated in the Anadolu Efes financial accounts. As a result of this transaction, AB InBev stopped consolidating its Russia and Ukraine businesses and accounts for its investment in AB InBev Efes under the equity method, as of that date. The results of the former SAB CEE business
15
Brussels / 9 May 2018 / 7.00am CET
ab-inbev.com
Press Release
are presented as “discontinued operations result” until their disposal on 31 March 2017. Values in the figures and annexes may not add up, due to rounding.
1Q18 EPS is based upon a weighted average of 1,974 million shares for 1Q18 compared to a weighted average of 1,970 million shares for 1Q17.
Legal Disclaimer
This release contains “forward-looking statements”. These statements are based on the current expectations and views of future events and developments of the management of AB InBev and are naturally subject to uncertainty and changes in circumstances. The forward-looking statements contained in this release include, among other things, statements relating to AB InBev’s business combination with SAB and other statements other than historical facts. Forward-looking statements include statements typically containing words such as “will”, “may”, “should”, “believe”, “intends”, “expects”, “anticipates”, “targets”, “estimates”, “likely”, “foresees” and words of similar import. All statements other than statements of historical facts are forward-looking statements. You should not place undue reliance on these forward-looking statements, which reflect the current views of the management of AB InBev, are subject to numerous risks and uncertainties about AB InBev and are dependent on many factors, some of which are outside of AB InBev’s control. There are important factors, risks and uncertainties that could cause actual outcomes and results to be materially different, including the ability to realize synergies from the business combination with SAB, the risks and uncertainties relating to AB InBev described under Item 3.D of AB InBev’s Annual Report on Form 20-F (“Form 20-F”) filed with the US Securities and Exchange Commission (“SEC”) on 19 March 2018. Other unknown or unpredictable factors could cause actual results to differ materially from those in the forward-looking statements.
The forward-looking statements should be read in conjunction with the other cautionary statements that are included elsewhere, including AB InBev’s most recent Form 20-F and other reports furnished on Form 6-K, and any other documents that AB InBev has made public. Any forward-looking statements made in this communication are qualified in their entirety by these cautionary statements and there can be no assurance that the actual results or developments anticipated by AB InBev will be realized or, even if substantially realized, that they will have the expected consequences to, or effects on, AB InBev or its business or operations. Except as required by law, AB InBev undertakes no obligation to publicly update or revise any forward-looking statements, whether as a result of new information, future events or otherwise.
The first quarter 2018 (1Q18) financial data set out in Figure 1 (except for the volume information), Figures 3 to 5, 7, 9 to 11 and 13 of this press release have been extracted from the group’s unaudited condensed consolidated interim financial statements as of and for the three months ended 31 March 2018, which have been reviewed by our statutory auditors Deloitte Bedrijfsrevisoren BCVBA in accordance with the standards of the Public Company Accounting Oversight Board (United States). The auditors concluded that, based on their review, nothing had come to their attention that caused them to believe that those interim financial statements were not presented fairly, in all material respects, in accordance with IAS 34 “Interim Financial Reporting”, as issued by the IASB and as adopted by the European Union. Financial data included in Figures 6, 8 and 12 have been extracted from the underlying accounting records as of and for the three months ended 31 March 2018 (except for the volume information).
CONFERENCE CALL AND WEBCAST
Investor Conference call and Webcast on Wednesday, 9 May 2018: 3.00pm Brussels / 2.00pm London / 9.00am New York Registration details Webcast (listen-only mode) https://bit.ly/2KoMvX2 Conference call (with interactive Q&A) https://bit.ly/2uGfb9e
NOTES
16
Brussels / 9 May 2018 / 7.00am CET
ab-inbev.com
Press Release
ANHEUSER-BUSCH INBEV CONTACTS Media
Investors
Marianne Amssoms Tel: +1-212-573-9281 E-mail: [email protected]
Henry Rudd Tel: +1-212-503-2890
E-maE-mail: [email protected] Aimee Baxter Tel: +1-718-650-4003 E-mail: [email protected]
Mariusz Jamka Tel: +32-16-27-68-88 E-mail: [email protected]
Ingvild Van Lysebetten Tel: +32-16-27-66-08 E-mail: [email protected]
Lauren Abbott Tel: +1-212-573-9287 E-mail: [email protected]
About Anheuser-Busch InBev Anheuser-Busch InBev is a publicly traded company (Euronext: ABI) based in Leuven, Belgium, with secondary listings on the Mexico (MEXBOL: ANB) and South Africa (JSE: ANH) stock exchanges and with American Depositary Receipts on the New York Stock Exchange (NYSE: BUD). Our Dream is to bring people together for a better world. Beer, the original social network, has been bringing people together for thousands of years. We are committed to building great brands that stand the test of time and to brewing the best beers using the finest natural ingredients. Our diverse portfolio of well over 500 beer brands includes global brands Budweiser®, Corona® and Stella Artois®; multi-country brands Beck’s®, Castle®, Castle Lite®, Hoegaarden® and Leffe®; and local champions such as Aguila®, Antarctica®, Bud Light®, Brahma®, Cass®, Chernigivske®, Cristal®, Harbin®, Jupiler®, Klinskoye®, Michelob Ultra®, Modelo Especial®, Quilmes®, Victoria®, Sedrin®, Sibirskaya Korona® and Skol®. Our brewing heritage dates back more than 600 years, spanning continents and generations. From our European roots at the Den Hoorn brewery in Leuven, Belgium. To the pioneering spirit of the Anheuser & Co brewery in St. Louis, US. To the creation of the Castle Brewery in South Africa during the Johannesburg gold rush. To Bohemia, the first brewery in Brazil. Geographically diversified with a balanced exposure to developed and developing markets, we leverage the collective strengths of nearly 200,000 employees based in more than 50 countries worldwide. For 2017, AB InBev’s reported revenue was 56.4 billion USD (excluding JVs and associates).

17
Brussels / 9 May 2018 / 7.00am CET
ab-inbev.com
Press Release
Annex 1
AB InBev Worldwide1Q17
Scope Currency
Translation
Organic
Growth
1Q18 Organic
Growth
Total volumes (thousand hls) 147 872 -12 759 - - 281 134 831 -0.2%
of which AB InBev own beer 117 729 10 - 612 118 351 0.5%
Revenue 12 922 - 654 230 575 13 073 4.7%
Cost of sales -5 230 410 - 105 - 63 -4 988 -1.3%
Gross profit 7 693 -245 125 512 8 085 6.9%
SG&A -4 228 142 - 108 - 105 -4 298 -2.6%
Other operating income/(expenses) 257 - 42 - 7 - 59 149 -27.6%
Normalized EBIT 3 721 - 144 11 348 3 935 9.7%
Normalized EBITDA 4 809 - 168 40 308 4 989 6.6%
Normalized EBITDA margin 37.2% 38.2% 70 bps
North America1Q17
Scope Currency
Translation
Organic
Growth
1Q18 Organic
GrowthTotal volumes (thousand hls) 25 836 33 - -1 055 24 814 -4.1%
Revenue 3 514 4 19 - 78 3 460 -2.2%
Cost of sales -1 337 8 - 7 32 -1 304 2.4%
Gross profit 2 177 13 12 - 47 2 156 -2.1%
SG&A -1 019 - 14 - 9 - 4 -1 045 -0.3%
Other operating income/(expenses) 15 - - - 14 1 -95.8%
Normalized EBIT 1 173 - 1 3 - 64 1 111 -5.5%
Normalized EBITDA 1 371 - 1 4 - 65 1 309 -4.7%
Normalized EBITDA margin 39.0% 37.8% -99 bps
Latin America West1Q17
Scope Currency
Translation
Organic
Growth
1Q18 Organic
GrowthTotal volumes (thousand hls) 25 531 - 20 - 2 150 27 661 8.4%
Revenue 1 976 - 2 86 276 2 336 14.0%
Cost of sales - 585 - 4 -27 - 66 - 682 -11.2%
Gross profit 1 391 - 6 58 210 1 654 15.2%
SG&A - 647 5 -28 - 40 - 710 -6.2%
Other operating income/(expenses) 25 - - - 19 6 -75.5%
Normalized EBIT 769 - 1 30 152 950 19.7%
Normalized EBITDA 921 - 1 36 152 1 110 16.6%
Normalized EBITDA margin 46.6% 47.5% 105 bps
Latin America North1Q17
Scope Currency
Translation
Organic
Growth
1Q18 Organic
GrowthTotal volumes (thousand hls) 30 419 -61 - -2 806 27 551 -9.2%
Revenue 2 335 -8 - 47 - 1 2 279 0.0%
Cost of sales - 997 3 18 102 - 875 10.2%
Gross profit 1 337 -5 - 29 101 1 404 7.6%
SG&A - 733 2 15 - 22 - 738 -3.1%
Other operating income/(expenses) 91 - - 2 - 5 85 -5.6%
Normalized EBIT 696 - 3 - 16 74 751 10.6%
Normalized EBITDA 901 - 3 - 20 72 949 8.0%
Normalized EBITDA margin 38.6% 41.7% 309 bps

18
Brussels / 9 May 2018 / 7.00am CET
ab-inbev.com
Press Release
Annex 1
Latin America South1Q17
Scope Currency
Translation
Organic
Growth
1Q18 Organic
GrowthTotal volumes (thousand hls) 9 090 17 - 507 9 614 5.6%
Revenue 872 2 - 132 213 956 24.4%
Cost of sales - 315 -1 40 - 61 - 337 -19.3%
Gross profit 557 1 - 91 152 619 27.2%
SG&A - 208 - 33 - 57 - 232 -27.1%
Other operating income/(expenses) - - - - 5 -4 -1,081.4%
Normalized EBIT 349 1 - 58 90 383 25.8%
Normalized EBITDA 399 1 - 65 100 436 25.1%
Normalized EBITDA margin 45.7% 45.6% 27 bps
EMEA1Q17
Scope Currency
Translation
Organic
Growth
1Q18 Organic
GrowthTotal volumes (thousand hls) 32 919 -12 742 - 372 20 549 1.8%
of which AB InBev own beer 18 784 4 - 264 19 051 1.4%
Revenue 2 341 - 659 166 71 1 919 4.2%
Cost of sales -1 126 408 - 65 - 51 - 835 -7.3%
Gross profit 1 215 - 252 101 19 1 084 2.0%
SG&A - 779 167 - 65 - 14 - 691 -2.3%
Other operating income/(expenses) 26 - 3 1 - 12 13 -49.8%
Normalized EBIT 462 - 88 37 - 6 405 -1.6%
Normalized EBITDA 664 - 113 54 6 611 1.0%
Normalized EBITDA margin 28.4% 31.8% -100 bps
Asia Pacific1Q17
Scope Currency
Translation
Organic
Growth
1Q18 Organic
GrowthTotal volumes (thousand hls) 23 683 14 - 600 24 296 2.5%
Revenue 1 801 8 138 94 2 040 5.2%
Cost of sales - 806 - 4 -60 -1 - 871 -0.1%
Gross profit 995 4 78 93 1 169 9.4%
SG&A - 600 - 5 -42 25 - 621 4.2%
Other operating income/(expenses) 42 - 3 - 5 41 -10.8%
Normalized EBIT 437 - 1 39 114 589 26.1%
Normalized EBITDA 654 - 1 51 56 760 8.6%
Normalized EBITDA margin 36.3% 37.2% 116 bps
Global Export and Holding
Companies1Q17
Scope Currency
Translation
Organic
Growth
1Q18 Organic
Growth
Total volumes (thousand hls) 395 - - -49 346 -12.3%
Revenue 83 - - - 84 0.4%
Cost of sales - 63 - 1 -4 - 18 - 85 -27.9%
Gross profit 21 - 1 -4 - 17 - 1 -87.8%
SG&A - 242 -13 - 13 6 - 261 2.4%
Other operating income/(expenses) 57 - 39 - 9 - 9 -2.7%
Normalized EBIT - 165 - 52 -25 - 12 - 254 -5.4%
Normalized EBITDA - 100 - 51 - 21 - 14 - 185 -9.1%