Anheuser-Busch InBev reports Fourth Quarter and Full … · Anheuser-Busch InBev reports Fourth...
22
Brussels, 3 March 2011 – 1 / 22 Anheuser-Busch InBev reports Fourth Quarter and Full Year 2010 Results Except where otherwise stated, the comments below are based on organic figures and refer to 4Q10 and FY10 versus the same period of last year. For important disclaimers please refer to pages 2/3 HIGHLIGHTS • Revenue growth: Revenue rose 4.4% in FY10 and 5.9% in 4Q10, with revenue per hl up 2.3% in FY10 and 5.0% in 4Q10. On a constant geographic basis, i.e. eliminating the impact of faster growth in countries with lower revenue per hl, organic revenue growth per hl improved 3.6% in FY10 and 6.0% in 4Q10 • Volume performance: Total volumes and own beer volumes growth in FY10 was 2.1%, with non-beer volumes up 3.8%. In 4Q10, total volumes and own beer volumes increased 1.4%, and non-beer volumes grew 2.0% • Focus Brands: FY10 Focus Brand volumes grew 4.8% led by Skol, Brahma and Antarctica in Brazil, Harbin and Budweiser in China, and Budweiser in the United Kingdom. Global Budweiser volumes increased 1.7% in FY10. In 4Q10, Focus Brand volumes grew 4.8% • Market share gains: In FY10, we gained or maintained market share in markets representing over half of our total beer volumes • Cost of Sales: Cost of Sales (CoS) increased 1.1% in FY10, and decreased 1.2% per hl organically. In 4Q10, CoS decreased 0.2%, and also fell 0.5% per hl. On a constant geographic basis, CoS per hl increased 0.6% in FY10 and 0.5% in 4Q10 • Synergies: FY10 synergies of 620 million USD related to the combination with Anheuser- Busch, including 170 million USD of synergies achieved in 4Q10, bringing total synergies by the end of 2010 to 1 980 million USD • EBITDA: Normalized EBITDA in FY10 grew 10.6% to 13 869 million USD, with EBITDA margin of 38.2% compared to 35.8% in FY09, up 209 bp organically. 4Q10 EBITDA rose 21.9% to 3 895 million USD with a margin of 41.1%, an organic improvement of 520 bp, driven by EBITDA margin improvements in all operating Zones • Profit: Normalized profit attributable to equity holders of AB InBev grew 28.3% to 5 040 million USD in FY10 from 3 927 million USD in FY09 on a reported basis, and by 39% to 1 219 million USD in 4Q10, from 877 million USD in 4Q09 on a reported basis, reflecting a strong operational performance. FY10 profit attributable to equity holders of AB InBev shareholders declined 12.7% to 4 026 million USD due to the non-recurring capital gains from asset disposals of 1 541 million USD in FY09 • Non-recurring finance costs: Normalized profit attributable to equity holders of AB InBev in FY10 excludes non-cash 192 million USD of accelerated accretion expenses and 733 million USD of negative mark-to-market adjustments for hedges no longer effective. 4Q10 normalized profit attributable to equity holders of AB InBev excludes 202 million USD of negative mark-to-market adjustments • Net debt: Our net debt as of 31 December 2010 was 39.7 billion USD, a decrease of 5.5 billion USD from 31 December 2009, for a net debt to normalized EBITDA ratio of 2.9 versus 3.7 last year, on the Reference Base • Dividend: The AB InBev Board proposes a dividend of 0.80 EUR per share, subject to shareholder approval. If approved, the shares will trade ex-coupon as of 27 April 2011 and dividends will be payable as from 2 May 2011. The record date will be 29 April 2011 • 2010 Annual Report and Financial Statements are available on our website at www.ab-inbev.com The enclosed information constitutes regulated information as defined in the Belgian Royal Decree of 14 November 2007 regarding the duties of issuers of financial instruments which have been admitted for trading on a regulated market.
Transcript of Anheuser-Busch InBev reports Fourth Quarter and Full … · Anheuser-Busch InBev reports Fourth...

Brussels, 3 March 2011 – 1 / 22
Anheuser-Busch InBev reports Fourth Quarter and
Full Year 2010 Results
Except where otherwise stated, the comments below are based on organic figures and refer to 4Q10 and FY10 versus the same period of last year. For important disclaimers please refer to pages 2/3
HIGHLIGHTS
• Revenue growth: Revenue rose 4.4% in FY10 and 5.9% in 4Q10, with revenue per hl up
2.3% in FY10 and 5.0% in 4Q10. On a constant geographic basis, i.e. eliminating the
impact of faster growth in countries with lower revenue per hl, organic revenue growth per
hl improved 3.6% in FY10 and 6.0% in 4Q10
• Volume performance: Total volumes and own beer volumes growth in FY10 was 2.1%,
with non-beer volumes up 3.8%. In 4Q10, total volumes and own beer volumes increased
1.4%, and non-beer volumes grew 2.0%
• Focus Brands: FY10 Focus Brand volumes grew 4.8% led by Skol, Brahma and Antarctica
in Brazil, Harbin and Budweiser in China, and Budweiser in the United Kingdom. Global
Budweiser volumes increased 1.7% in FY10. In 4Q10, Focus Brand volumes grew 4.8%
• Market share gains: In FY10, we gained or maintained market share in markets
representing over half of our total beer volumes
• Cost of Sales: Cost of Sales (CoS) increased 1.1% in FY10, and decreased 1.2% per hl
organically. In 4Q10, CoS decreased 0.2%, and also fell 0.5% per hl. On a constant
geographic basis, CoS per hl increased 0.6% in FY10 and 0.5% in 4Q10
• Synergies: FY10 synergies of 620 million USD related to the combination with Anheuser-
Busch, including 170 million USD of synergies achieved in 4Q10, bringing total synergies by
the end of 2010 to 1 980 million USD
• EBITDA: Normalized EBITDA in FY10 grew 10.6% to 13 869 million USD, with EBITDA
margin of 38.2% compared to 35.8% in FY09, up 209 bp organically. 4Q10 EBITDA rose
21.9% to 3 895 million USD with a margin of 41.1%, an organic improvement of 520 bp,
driven by EBITDA margin improvements in all operating Zones
• Profit: Normalized profit attributable to equity holders of AB InBev grew 28.3% to 5 040
million USD in FY10 from 3 927 million USD in FY09 on a reported basis, and by 39% to
1 219 million USD in 4Q10, from 877 million USD in 4Q09 on a reported basis, reflecting a
strong operational performance. FY10 profit attributable to equity holders of AB InBev
shareholders declined 12.7% to 4 026 million USD due to the non-recurring capital gains
from asset disposals of 1 541 million USD in FY09
• Non-recurring finance costs: Normalized profit attributable to equity holders of AB
InBev in FY10 excludes non-cash 192 million USD of accelerated accretion expenses and
733 million USD of negative mark-to-market adjustments for hedges no longer effective.
4Q10 normalized profit attributable to equity holders of AB InBev excludes 202 million USD
of negative mark-to-market adjustments
• Net debt: Our net debt as of 31 December 2010 was 39.7 billion USD, a decrease of 5.5
billion USD from 31 December 2009, for a net debt to normalized EBITDA ratio of 2.9
versus 3.7 last year, on the Reference Base
• Dividend: The AB InBev Board proposes a dividend of 0.80 EUR per share, subject to
shareholder approval. If approved, the shares will trade ex-coupon as of 27 April 2011 and
dividends will be payable as from 2 May 2011. The record date will be 29 April 2011
• 2010 Annual Report and Financial Statements are available on our website at
www.ab-inbev.com
The enclosed information constitutes regulated information as defined in the Belgian Royal Decree of 14 November 2007 regarding the duties of issuers of financial instruments which have been admitted for trading on a regulated market.

Brussels, 3 March 2011 – 2 / 22
Total volumes (thousand hls) 398 918 408 603 391 070 2.1%
Total beer volumes 352 932 364 540 347 007 1.9%
Of which AB InBev own beer 347 811 358 781 341 375 2.1%
Non-beer volumes 45 986 44 063 44 063 3.8%
Revenue 36 297 36 758 33 862 4.4%
Gross profit 20 146 19 560 18 330 7.2%
Normalized EBITDA 13 869 13 037 12 109 10.6%
Normalized EBIT 11 165 10 248 9 600 13.6%Normalized profit attributable to equity
holders of AB InBev 5 040 3 927Profit attributable to equity holders of
AB InBev 4 026 4 613
Normalized earnings per share (USD) 3.17 2.48
Earnings per share (USD) 2.53 2.91
Margins
Gross margin 55.5% 53.2% 54.1% 145 bpNormalized EBITDA margin 38.2% 35.5% 35.8% 209 bpNormalized EBIT margin 30.8% 27.9% 28.4% 244 bp
Figure 1. Consolidated performance (million USD)
FY10 Organic
growth
FY09
Reference base
FY09
Reported
Total volumes (thousand hls) 99 776 101 720 100 123 1.4%
Total beer volumes 86 164 88 339 86 742 1.3%
Of which AB InBev own beer 84 953 87 014 85 422 1.4%
Non-beer volumes 13 612 13 381 13 381 2.0%
Revenue 9 473 9 297 9 026 5.9%
Gross profit 5 281 4 993 4 896 11.0%
Normalized EBITDA 3 895 3 105 3 054 21.9%
Normalized EBIT 3 057 2 384 2 359 28.5%Normalized profit attributable to equity
holders of AB InBev 1 219 877Profit attributable to equity holders of AB
InBev 968 1 280
Normalized earnings per share (USD) 0.77 0.55
Earnings per share (USD) 0.61 0.81
Margins
Gross margin 55.7% 53.7% 54.2% 263 bpNormalized EBITDA margin 41.1% 33.4% 33.8% 520 bpNormalized EBIT margin 32.3% 25.6% 26.1% 571 bp
4Q10 Organic
growth
4Q09
Reference base
4Q09
Reported
Anheuser-Busch InBev’s FY10 and FY09 reported numbers are based on audited consolidated financial statements prepared in accordance with IFRS. Unless otherwise indicated, amounts are presented in million USD. Given the transformational nature of the disposals we made during 2009 to refinance the debt we incurred to finance the Anheuser-Busch transaction, we present in this press release the 4Q09 and FY09 consolidated volumes and results down to normalized EBIT on a Reference Base, treating all divestitures as if they had closed as of 1 January 2009 and with certain intra-group transactions reported in Global Export and Holding Companies. To facilitate the understanding of Anheuser-Busch InBev’s underlying performance, the analyses of growth, including all comments in this press release, unless otherwise indicated, are based on organic and normalized numbers against the Reference Base. In other words, financials are analyzed eliminating the impact of changes in currencies on translation of foreign operations, and scope changes. Scope changes represent the impact of acquisitions and divestitures other than those eliminated from the Reference Base, the start up or termination of activities or the

Brussels, 3 March 2011 – 3 / 22 transfer of activities between segments, curtailment gains and losses and year over year changes in accounting estimates and other assumptions that management does not consider as part of the underlying performance of the business. All references per hectoliter (per hl) exclude US non-beer activities. To eliminate the effect of geography mix, i.e. the impact of stronger volume growth coming from countries with lower revenue per hl, and lower Cost of Sales per hl, we are also presenting, where specified, organic per hectoliter figures on a constant geographic basis. The constant geographic basis is calculated by assuming the same volume, revenue and cost of sales weighting of our businesses as in the same period of the previous year. Whenever presented in this document, all performance measures (EBITDA, EBIT, profit, tax rate, EPS) are presented on a “normalized” basis, which means they are presented before non-recurring items. Non-recurring items are either income or expenses which do not occur regularly as part of the normal activities of the company. They are presented separately because they are important for the understanding of the underlying sustainable performance of the company due to their size or nature. Normalized measures are additional measures used by management, and should not replace the measures determined in accordance with IFRS as an indicator of the company’s performance. Values in the figures and annexes may not add up, due to rounding. 4Q10 and FY10 EPS based upon weighted average of 1 592 million shares compared to 1 584 million shares for 4Q09 and FY09.
MANAGEMENT COMMENTS
Much has been accomplished since the combination of Anheuser-Busch and InBev two years
ago. Through the hard work and commitment of our people, we divested non-core operations,
generated significant synergies, strengthened the balance sheet, and shared best practices
across our organization, while delivering solid topline growth. With our integration now
complete, we have a solid platform in place – consisting of a talented and committed team, an
industry-leading position, the right brands, strong presence in the most attractive markets and
financial discipline – to take advantage of the exciting opportunities we see for sustainable
profitable growth in a global marketplace. We are proud of our team for their great work in
integrating Anheuser-Busch and InBev to form AB InBev.
Our full attention has now turned to the business of building on this platform to create a world-
class consumer products company for the 21st century. Toward that end, we made very good
progress during 2010. Some highlights include:
• We extended the reach of our brands worldwide through our sponsorship of the 2010 FIFA
World Cup. With Budweiser as the global sponsor, and brands including Brahma, Harbin,
Jupiler, Hasseröder and Quilmes as local sponsors, the FIFA World Cup offered an
unmatched opportunity to connect our brands with consumers in over 80 countries
• Solid steps were taken in establishing Budweiser as the first truly global beer brand, based
on its iconic American values of celebration and optimism. This year, we completed the
work on our global Budweiser brand strategy, launched Bud in Russia, and increased
volumes and market share in markets ranging from China to the United Kingdom
• Innovation in products, packaging and marketing practices enabled us to tap into the
growth potential of markets as diverse as Brazil, China and Russia. In Brazil, innovations
accelerated topline and volume growth to unprecedented levels and record market share
• We generated solid growth in key measures, including Focus Brand volumes, total revenue,
EBITDA and EBITDA margin

Brussels, 3 March 2011 – 4 / 22 • We expanded our efforts to attract, retain and develop the talented people we will need to
grow our business in the future, with initiatives such as our Global Management Trainee
Program and AB InBev University classes in each of our Zones
• And, we continued to work toward our dream to be the Best Beer Company in a Better
World, sharing best practices and increasing our support of responsible drinking,
environmental and community programs
Our financial results for 2010 showed very good progress in spite of the persistent challenging
economic environment in several of our markets. Topline grew by 4.4%, EBITDA increased by
10.6%, we improved EBITDA margin by 209 bps and generated 9 905 million USD in cash flow
from operating activities. This creates a solid platform for future growth.
However, our culture is one of continuous improvement and there are several areas where we
know we can still make progress, including:
• Leading the growth of the beer category and category captainship
• Continued premiumization of our portfolio
• Revenue management initiatives and growing value share in our markets
• The size and quality of our packaging and new product innovation pipeline, and faster
global deployment of proven ideas
• Fully integrated commercial planning and flawless execution in the field
Our management teams have plans in place to bridge these gaps and optimize the
opportunities in each of their markets.
It is important to emphasize that brand health and topline growth are, and will remain, our top
priorities. In our two largest markets of the United States and Brazil our commercial agenda
for 2011 will include:
In the United States:
• Growing Bud Light. The Bud Light mega brand enjoyed another year of growth in both
brand health and market share. We will build on this momentum by continuing national
activation of existing platforms fully integrated into our commercial plans which are
designed to further improve brand health and market share. These platforms include Port
Paradise, UFC and Super Bowl as well as new ones such as the NFL
• Continuing to stabilize and improve the performance of Budweiser. The decline of the brand
in the United States decelerated towards the end of 2010 and we will build from this
platform in 2011
• Capitalizing on growing consumer demand for high-end brands, taking full advantage of our
import and craft portfolio, brand marketing and route to market capabilities
• Continuing to refine our pricing to achieve our long-term brand strategies. In 2010 we
increased the price of our sub-premium portfolio to narrow the gap to the premium
segment. In 2011, we will continue to look for opportunities to improve our price
segmentation throughout our portfolio in line with our brand strategies
In Brazil:
• Continuing to build on the strength of our three mainstream brands - Skol, Brahma and
Antarctica
• Building on our strong innovation pipeline, coupled with the deployment of new initiatives

Brussels, 3 March 2011 – 5 / 22 • Actively developing the premium segment, including the launch of Budweiser, while
strengthening Stella Artois
• Growing in regions of the country where we are under-represented
In all of our key markets we will continue to invest behind our Focus Brands, improve our
sharing of revenue management best practices, further enhance the quality of our sales and
supply chain execution, and maintain our cost and risk management discipline.
OUTLOOK
The global economy is still in recovery at a pace that varies by country. We see Latin America
and Asia as regions with good economic growth prospects, whereas for some economies the
outlook is still unclear. In our largest market of the United States there are early signs of a
reduction in unemployment levels. If sustained, we believe this would improve consumer
confidence, positively impacting the beer industry.
Meanwhile, we will leverage our leadership positions in the key markets by increasing our sales
and marketing investments by mid to high single digits in 2011, putting us in an even stronger
position to fully benefit from economic recovery, market by market.
Continuous investments behind our brands, coupled with revenue management discipline and
improved brand mix, should allow us to deliver revenue per hl growth ahead of inflation.
We expect first quarter volumes to be soft, still impacted primarily by high unemployment
rates among our core consumers in the United States and heavy rains in Brazil, with
momentum building from 2Q11 into the second half.
We are expecting Cost of Sales per hl to increase by low single digits in 2011 on a constant
geographic basis. Global commodity cost increases should be mitigated through the company’s
hedging strategy, procurement savings and further efficiency gains in our operations.
In terms of Anheuser-Busch integration synergies, in 2011, we are expecting to deliver at least
the additional 270 million USD bringing total synergies to our commitment of 2.25 billion USD.
We see potential upside from sharing best practices and fully exploring topline opportunities,
taking us beyond the 2.25 billion USD. However, we will not disclose these amounts separately
in the future, as integration is essentially completed.
For the full year 2011, we expect the average coupon on net debt to be between 6.0-6.5% and
a normalized effective tax rate in the 25-27% range.
We will continue to invest in building capacity to meet demand in key growth markets and to
drive our commercial innovation pipeline. Consequently, we expect 2011 net capital
expenditures to be between 2.7 and 2.9 billion USD, from 2.1 billion USD in 2010.
We remain fully committed to deleveraging and expect to reach our net debt/EBITDA target
ratio of 2.0 by 2012.

Brussels, 3 March 2011 – 6 / 22
FOCUS BRANDS AND INNOVATION
Our ability to build and grow strong, healthy brands was a key contributor to our performance
in 2010. For the fourth straight year, our strategy of investing behind our Focus Brands, those
with the greatest growth potential, drove volume and market share. Volumes of our Focus
Brands rose 4.8% in FY10, outpacing our overall volume increase of 2.1%. Furthermore, Focus
Brands grew as a percentage of our own beer volumes to 68.8% in FY10.
Highlights include:
• Budweiser grew volume by 1.7% globally for the first time in two decades and expanded
market share in the UK, China and Canada. Double-digit volume growth outside the United
States more than offset the decline in the home market
• We saw positive market share trends for our Focus Brands in the United States. The Bud
Light mega brand, Stella Artois and Michelob Ultra gained market share, and the Budweiser
share decline decelerated during the year
• Other areas of strength included Antarctica, Skol and Brahma in Brazil; Harbin and Sedrin
in China; and Klinskoye in Russia
• AB InBev has four of its Focus Brands in the Top 10 in Millward Brown’s BrandZ Most
Valuable Global Brands Report: Bud Light, Budweiser, Stella Artois and Skol. Bud Light and
Budweiser lead the ranking with the number 1 and number 2 positions, respectively
• In addition to the momentum created by our sponsorship of the FIFA World Cup, our
brands benefited from investments in innovation, such as Budweiser Lime in China, Stella
Artois Black in the UK, Skol 360° and Antarctica Sub Zero in Brazil, Quilmes Bajo Zero in
Argentina and Klinskoye Fresh in Russia
• As part of our continuing commitment to innovation, we also announced the launch of
Stella Artois Cidre in the UK and Jupiler Force in Belgium in February 2011
OPERATING PERFORMANCE
Detailed segment information for the FY10 and 4Q10 financial performance are provided in Annex 1 and Annex 2 of the press release. Figure 2. Volumes (thousand hls)
FY09 Scope Organic FY10
Reference base growth Total
volume
Own beer
volume
North America 133 593 - -4 117 129 476 -3.1% -3.0%
Latin America - North 109 794 -269 10 531 120 056 9.6% 10.5%
Latin America - South 33 319 305 230 33 854 0.7% 3.9%
Western Europe 32 333 316 -816 31 833 -2.5% -1.6%
Central and Eastern Europe 27 454 -455 -249 26 750 -0.9% -0.9%
Asia Pacific 48 914 -1 439 2 793 50 268 5.9% 5.9%
Global Export and Holding Companies 5 663 1 041 -23 6 681 -0.3% -0.3%
AB InBev Worldwide 391 070 -501 8 349 398 918 2.1% 2.1%
Organic growth
4Q09 Scope Organic 4Q10
Reference base growth Total
volume
Own beer
volume
North America 29 927 - - 382 29 545 -1.3% -1.1%
Latin America - North 34 032 -269 1 157 34 920 3.4% 3.5%
Latin America - South 10 269 0 264 10 533 2.6% 5.0%
Western Europe 8 098 - 31 -292 7 775 -3.6% -3.3%
Central and Eastern Europe 5 792 0 -44 5 748 -0.8% -0.7%
Asia Pacific 10 465 -1 589 743 9 619 8.4% 8.4%
Global Export and Holding Companies 1 539 179 -82 1 636 -4.8% -4.8%
AB InBev Worldwide 100 123 -1710 1 364 99 776 1.4% 1.4%
Organic growth

Brussels, 3 March 2011 – 7 / 22
North America (NA)
North American total volumes decreased 3.1% in FY10 and 1.3% in 4Q10.
In the United States, the high levels of unemployment continued to be the main driver of
industry volume decline, affecting the sub-premium and premium segments in particular. This
was coupled with a narrowing of the price gap between beer and wine/spirits during the end of
year holiday season.
Shipment volumes in the United States declined 3.0% in FY10 and 0.9% in 4Q10, with
domestic US beer selling-day adjusted sales-to-retailers (STRs) decreasing 3.2% in FY10 and
3.1% in 4Q10. Our price increase in September led to a loss of volume in our sub-premium
brands as a consequence of our decision to narrow the price gap between our sub-premium
and premium portfolios. Normalized beer-only revenue per hl grew 3.0% in FY10 and 4.1% in
4Q10. The 4Q10 result includes the benefit of the price increase as well as mix improvements.
We estimate that brand mix benefited our net revenue per hl result by 122 bp in 4Q10.
We saw improvements in the market share of all four of our premium and super-premium
Focus Brands: Bud Light, the Bud Light mega brand and Michelob Ultra gained share for the
year; Budweiser’s share decline decelerated; and Stella Artois gained share on the back of full
year volume growth of 20.6%.
FY10 market share fell by half a percentage point from last year driven mainly by losses in our
sub-premium and non-Focus brands where we made a decision to rebalance our brand
portfolio. Our key premium brands gained or maintained share with the exception of
Budweiser.
In Canada, beer volumes fell 3.9% in FY10 and 5.0% in 4Q10. Demand across the industry
continued to be weak, leading to a second straight year of industry decline, down 1.0% in
2010, after 10 years of growth. Market share fell by approximately 120 bp in the year as we
continued to focus on balancing volume with profitability, leading to an improved EBITDA
performance.
North American gross profit improved 2.0% in FY10, driven by revenue growth of 1.9% per hl
and lower CoS per hl of 2.9%. The improvement in CoS reflects synergy savings and efficiency
gains in our breweries. FY10 operating expenses decreased due to savings in overhead costs
and lower fuel costs.
FY10 EBITDA increased 6.5% to 6 444 million USD with margin expansion of 320 bp to 42.1%.
4Q10 EBITDA grew 18.0% to 1 542 million USD with margin improvement of 618 bp to 43.3%.
Latin America North (LAN)
LAN delivered strong volume growth of 9.6% in FY10, with beer volume growth of 10.5% and
soft drinks up 7.3%. In 4Q10, total volumes grew 3.4%, as beer volumes rose 3.5% and soft
drinks grew 3.4%.
In Brazil, beer volume grew 10.7% in FY10 driven by strong industry growth as well as
market share gains driven by product and packaging innovations, such as Antarctica Sub Zero,

Brussels, 3 March 2011 – 8 / 22 the roll-out of 1 liter packaging and Skol 360. For FY10, our average beer market share
reached 70.1%, an increase of 140 bp versus the average for FY09. In 4Q10, as a
consequence of our 4Q10 price increase and lower industry growth, beer volume growth
decelerated to 3.4%. Market share in 4Q10 was 20 bp below last year, as we opened a price
gap to our competitors following our 4Q10 price increases.
LAN revenue per hl grew 6.8% in FY10 and 9.9% in 4Q10, driven by price increases
throughout the Zone that were implemented by year-end. CoS per hl increased 9.4% in FY10
and 7.5% in 4Q10, largely due to higher can mix and packaging costs reflecting the higher
cost of imported cans and higher sugar prices, partially offset by lower aluminum prices.
EBITDA rose 16.4% to 4 780 million USD with a small margin decline of 25 bp to 47.7%, as
higher input costs related to less favorable sugar hedges and more expensive imported cans,
and higher distribution expenses offset revenue growth and savings in administrative
expenses. 4Q10 EBITDA reached 1 655 million USD, an improvement of 18.6%, with margin
expansion of 201 bp to 52.4% primarily due to revenue growth and lower overhead costs.
Latin America South (LAS)
FY10 volumes in LAS increased 0.7% as solid growth of our beer operations of 3.9% was
partly offset by a 4.2% decline in our non-beer activities as a consequence of industry
weakness in Argentina. In 4Q10, total volumes grew 2.6%. Beer volumes grew 5.0% reflecting
a better performance in most of our markets, while volumes of non-beer activities decreased
1.3%.
Beer volumes in Argentina grew 1.7% in FY10 and 5.4% in 4Q10, reflecting a weak industry
performance during the first half of the year and improvements in the second half. Effective
marketing activities supporting the 120th anniversary of the Quilmes brand, and continued
growth of Stella Artois led to market share gains in FY10. Volumes of Stella Artois grew 7.7%
in FY10, and Argentina has now become the brand’s third largest market after the United
Kingdom and the United States.
LAS delivered EBITDA growth of 15.9% to 1 009 million USD in FY10. EBITDA margin was
essentially flat, as both higher Cost of Sales and sales and marketing expenses to support our
brands offset revenue per hl growth in line with inflation. 4Q10 EBITDA rose to 358 million
USD, an increase of 21.5% with margin expansion of 45 bp to 49.6%.
Western Europe (WE)
Own beer volumes in FY10 declined 1.6%, while total volumes, including subcontracted
volumes, declined 2.5%. Volume growth in the United Kingdom was offset by volume declines
in Germany and Belgium. In 4Q10, own beer volumes decreased 3.3%, with total Zone
volumes down 3.6%, driven in part by bad weather in December in most countries.
Own beer volumes in Belgium fell 4.9% in FY10 due to social actions in January, increased
competition in the off-trade and the impact of the severe weather on transport and
consumption in the fourth quarter leading to a volume decline of 10% in 4Q10. Despite tough
competitive conditions in the off-trade channel, Jupiler and Leffe still delivered share growth in
this channel.

Brussels, 3 March 2011 – 9 / 22
In Germany, own beer volumes fell 9.0% in FY10 and 10.3% in 4Q10, driven by a weak
industry performance and a very competitive, price driven off-trade environment, resulting in
market share loss. Under these difficult competitive conditions we elected to focus on value
rather than volume.
In the United Kingdom, own beer volumes grew 3.4% in FY10 driven by strong performance
by Budweiser with growth in the year of 36.1%. Volumes in 4Q10 grew by 2.4% despite poor
December weather. Our United Kingdom business achieved market share gains in both the on-
trade and off-trade channels, driven by Budweiser’s FIFA World Cup sponsorship in addition to
continued growth of Beck’s Vier in the on-trade.
EBITDA improved 6.6% to 1 099 million USD in FY10 with margin improvement of 255 bp to
27.9%. 4Q10 EBITDA grew 30.3% to 251 million USD as a consequence of the timing of brand
investment and administrative expenses.
Central and Eastern Europe (CEE)
CEE volumes decreased 0.9% in FY10 and 0.8% in 4Q10.
In Russia, volumes fell 1.7% in FY10 driven by a weak 1Q10 performance following the 200%
excise tax increase in January 2010 as well as a 3.3% decline in 4Q10 with tough comparisons
due to the inventory build up in 2009 in anticipation of the excise tax increase. Market share
gains in FY10 and 4Q10 were achieved behind the launch of Bud in May, and the strong
performance of our Focus Brand Klinskoye with growth of 5.3% in FY10. Bud has performed
well since its launch and we are optimistic about its future prospects.
In Ukraine, beer volumes grew 0.4% in FY10 and 4.4% in 4Q10. Although market share
declined in FY10, trends improved in the last two months of the quarter following the launch of
new national campaigns for our brands Chernigivske and Rogan.
EBITDA declined 17.8% to 323 million USD in FY10 mainly due to delayed price increases to
compensate the excise tax increase and higher transport tariffs which led to higher distribution
expenses. Sales and marketing expenses increased 12.7% which includes support for the
launch of Bud in Russia. In 4Q10, EBITDA grew 25.5% to 72 million USD with margin
expansion of 449 bp to 20.3%.
Asia Pacific (APAC)
Asia Pacific volumes grew 5.9% in FY10, and 8.4% in 4Q10.
China delivered volume growth of 6.0% in FY10 with a strong growth of 8.6% in 4Q10. Our
Focus Brands grew by 16.7% in FY10 and 24.6% in 4Q10. Budweiser Lime was launched in
major cities across China during the year and has been well received.
Asia Pacific achieved FY10 EBITDA growth of 18.3% to 292 million USD, driven by gross profit
expansion and operational efficiencies partially offset by higher investments behind the growth
of our brands. Revenue per hl grew 5.4% from sales mix improvements with our Focus Brands
now contributing 67.8% of total volumes. EBITDA margin improved 94 bp to 16.5% in FY10.

Brussels, 3 March 2011 – 10 / 22 4Q10 EBITDA growth of 156.8% to 52 million USD was driven by strong revenue per hl growth
as our higher margin Focus Brands grew 24.6%. EBITDA margin improved 686 bp to 13.9% in
4Q10.
Global Export and Holding Companies (GEHC)
GEHC reported EBITDA of -77 million USD in FY10, an improvement of 107 million USD
compared to FY09, due to lower corporate expenses and revenue growth of US packaging
activities. EBITDA in 4Q10 was -34 million USD, an improvement of 32 million USD compared
with 4Q09.
CONSOLIDATED INCOME STATEMENT
FY09
Reported
FY09
Reference base
Scope Currency
translation
Organic
growth
FY10 Organic
growthRevenue 36 758 33 862 -305 1 255 1 485 36 297 4.4%
Cost of sales -17 198 -15 532 -68 -377 -175 -16 151 -1.1%
Gross profit 19 560 18 330 -373 879 1 310 20 146 7.2%
Distribution expenses -2 671 -2 533 11 -140 -250 -2 913 -9.9%
Sales and marketing expenses -4 992 -4 618 129 -133 -90 -4 712 -2.0%
Administrative expenses -2 310 -2 227 29 -49 287 -1 960 12.8%
Other operating income/expenses 661 649 -89 32 12 604 2.4%Normalized profit from operations
(normalized EBIT) 10 248 9 600 -292 588 1 269 11 165 13.6%
Non-recurring items above EBIT 1 321 -268
Net finance cost -3 790 -2 811
Non-recurring net finance cost -629 -925
Share of results of associates 513 521
Income tax expense -1 786 -1 920
Profit 5 877 5 762attributable to equity holders of
AB InBev 4 613 4 026
attributable to non-controlling interests 1 264 1 736
Normalized EBITDA 13 037 12 109 -140 645 1 256 13 869 10.6%Normalized profit attributable to equity
holders of AB InBev 3 927 5 040
Figure 3. Consolidated Income Statement (million USD)
4Q09
Reported
4Q09
Reference base
Scope Currency
translation
Organic
growth
4Q10 Organic
growth
Revenue 9 297 9 026 -197 127 518 9 473 5.9%
Cost of sales -4 304 -4 130 -40 -31 9 -4 192 0.2%
Gross profit 4 993 4 896 -238 96 527 5 281 11.0%
Distribution expenses -702 -687 12 -13 -96 -785 -14.2%
Sales and marketing expenses -1 410 -1 359 55 -3 125 -1 181 9.8%
Administrative expenses -692 -682 49 - 148 -486 22.0%
Other operating income/expenses 194 191 68 1 -32 228 -17.2%Normalized profit from operations
(normalized EBIT) 2 384 2 359 -54 81 672 3 057 28.5%
Non-recurring items above EBIT 1 003 -76
Net finance cost -827 -798
Non-recurring net finance cost -634 -204
Share of results of associates 128 126
Income tax expense -365 -548
Profit 1 690 1 557attributable to equity holders of
AB InBev 1 280 968
attributable to non-controlling interests 410 589
Normalized EBITDA 3 105 3 054 98 80 664 3 895 21.9%Normalized profit attributable to equity
holders of AB InBev 877 1 219

Brussels, 3 March 2011 – 11 / 22
Revenue
FY10 consolidated revenue grew 4.4% to 36 297 million USD. FY10 revenue per hl grew 2.3%.
4Q10 consolidated revenue improved 5.9% to 9 473 million USD, or 5.0% per hl. On a
constant geographic basis (i.e. eliminating the impact of faster growth in countries with lower
revenue per hl), revenue growth per hl improved 3.6% in FY10 and 6.0% in 4Q10 reflecting
selective price increases in the latter part of the year.
Cost of Sales (CoS)
Cost of Sales (CoS) increased 1.1% in FY10, and decreased 1.2% per hl. On a constant
geographic basis, CoS per hl increased 0.6% in FY10 with higher raw material and packaging
costs in Latin America North and South offsetting procurement savings and the implementation
of best practices programs in North America and Western Europe. In 4Q10, CoS decreased
0.2%, and decreased 0.5% per hl. However, on a constant geographic basis, 4Q10 CoS per hl
increased 0.5%.
Operating expenses
Total operating expenses increased 0.5% in FY10 and decreased 5.9% in 4Q10:
• Distribution expenses increased 9.9% in FY10 and 14.2% in 4Q10, driven by higher
transport tariffs in Russia and Ukraine, and higher transportation costs in Brazil and China
related to geographic expansion
• Sales and marketing expenses increased 2.0% in FY10, with higher investments in the
first half of the year due to the timing of activities compared to the previous year. These
higher investments were partially offset by reductions of non-working money, especially in
the United States. In line with previous guidance, 4Q10, sales and marketing expenses
decreased 9.8%, due to the timing of our commercial activities
• Administrative expenses decreased 12.8% in FY10 and 22.0% for 4Q10 with continued
fixed cost savings across our business, and lower accruals for variable compensation
compared to FY09
• Other operating income was 604 million USD in FY10 compared to 649 million USD in
FY09, and 228 million USD in 4Q10 compared to 191 million USD in 4Q09. A summary
table of all other operating income and expense items in FY10 compared to FY09 is
available in Note 7 of the 2010 Annual Report
Non-recurring items above EBIT
Normalized profit from operations excludes negative non-recurring items of -268 million USD
in FY10 and -76 million USD in 4Q10, primarily due to restructuring activities and asset
disposals. This compares to positive non-recurring items of 1 321 million USD in FY09 and
1 003 million USD in 4Q09, which included capital gains from the disposals of our Central
European and South Korean businesses. A breakdown of the non-recurring items is provided
below, in Figure 4:
Figure 4. Non-recurring items above EBIT (million USD)
4Q09
Reported
4Q10 FY09
Reported
FY10
Restructuring (including impairment losses) - -34 -153 -252
Fair value adjustments -67 - -67 -
Business and asset disposal (including impairment losses) 1 070 -42 1 541 -16
Impact on profit from operations 1 003 -76 1 321 -268

Brussels, 3 March 2011 – 12 / 22
Net finance costs
• Net finance costs (excluding non-recurring finance costs) were 2 811 million USD in FY10
as compared with 3 790 million USD in FY09 as reported, and 798 million USD in 4Q10 as
compared with 827 million USD in 4Q09 as reported. This decrease is mainly due to lower
net interest charges as a result of reduced net debt levels and lower accretion expenses as
bank borrowings are being reduced as a percentage of total debt, favorable foreign
exchange variances arising from EUR/USD currency fluctuations and gains from derivative
contracts entered into to hedge risks associated with different share based compensation
programs. For 4Q10, the -87 million USD in other financial results is primarily due to
unrealized losses from derivative contracts related to our share based compensation
programs, unfavorable variances arising from currency translation fluctuations and
payment of bank fees and taxes on financial transactions in the normal course of business
• Non-recurring net financing costs: FY10 non-recurring net finance costs consisted of
incremental accretion expenses of 192 million USD in 2010, and a one-time mark-to-
market adjustment of 733 million USD in FY10, of which 202 million USD occurred in 4Q10,
as certain interest rate swaps hedging borrowings under our 2008 and 2010 senior bank
facilities are no longer effective as a result of the repayment and refinancing of these
facilities. While the accretion expense is a non-cash item, the cash equivalent of the
negative mark-to-market adjustment is spread over the period 2010 to 2014
Figure 5. Net finance costs (million usd)
4Q09
Reported
4Q10 FY09
Reported
FY10
Net interest expense - 823 - 665 -3 369 -2 714
Accretion expense - 42 - 46 - 381 - 159
Other financial results 38 - 87 - 40 62
Net finance costs - 827 - 798 -3 790 -2 811
Mark-to-market adjustment - 489 - 202 - 484 - 733
Accelerated accretion expense - 145 - 2 - 145 - 192
Non-recurring net finance costs - 634 - 204 - 629 - 925
-1 461 -1 002 -4 419 -3 736
Share of results of associates
FY10 recorded a share of results of associates of 521 million USD compared to 513 million USD
in FY09 as reported, and 126 million USD in 4Q10 compared with 128 million USD in 4Q09 as
reported, attributable to the results of Grupo Modelo in Mexico.
Income tax expense
FY10 income tax expense of 1 920 million USD compared with 1 786 million USD in 2009. The
effective tax rate increased from 25.0% in 2009 to 26.8% in 2010 primarily due to the non-
deductibility of certain non-recurring charges associated with the refinancing and repayment of
our senior facilities. Excluding the effect of non-recurring items, the normalized effective tax
rate was 24.8% in 2010 versus 28.1% in 2009. The company continues to benefit at the
AmBev level from the impact of interest on equity payments and tax deductible goodwill from
the merger between InBev Holding Brazil and AmBev in 2005 and the acquisition of Quinsa in
2006. 4Q10 income tax expense was 548 million USD with an effective tax rate of 27.7% as
compared to 365 million USD with an effective rate of 18.9% in 4Q09. Excluding the effect of
non-recurring items, the normalized effective tax rate was 24.9% in 4Q10 versus 25.6% in
4Q09.

Brussels, 3 March 2011 – 13 / 22
Profit attributable to non-controlling interest
FY10 profit attributable to non-controlling interest was 1 736 million USD in FY10, an increase
from 1 264 million USD in FY09 as reported, as a result of the strong performance of AmBev
and currency translation effects. 4Q10 profit attributable to non-controlling interest was 589
million USD, an increase from 410 million USD in 4Q09 as reported.
FY10 and 4Q10 profit
Normalized profit attributable to equity holders of Anheuser-Busch InBev was 5 040 million
USD in FY10, compared to 3 927 million USD in FY09 on a reported basis, and 1 219 million
USD in 4Q10, compared to 877 million USD in 4Q09 on a reported basis.
FY10 and 4Q10 EPS
Normalized EPS for FY10 was 3.17 USD, compared to 2.48 USD in FY09 on a reported basis,
representing an increase of 27.8%. 4Q10 normalized EPS was 0.77 USD, compared to 0.55
USD in 4Q09, an increase of 40%. Figure 6 provides a reconciliation between normalized EPS
and basic EPS.
Figure 6. Earnings per share
Normalized earnings per share (usd) 0.55 0.77 2.48 3.17
Non-recurring items, after taxes, attributable to equity
holders of AB InBev, per share 0.64 -0.03 0.81 -0.09
Non-recurring finance cost, after taxes, attributable to
equity holders of AB InBev, per share -0.38 -0.13 -0.38 -0.55
Basic earnings per share (usd) 0.81 0.61 2.91 2.53
4Q09
Reported
4Q10 FY09
Reported
FY10
Reconciliation between normalized EBITDA and profit attributable to equity holders
Normalized EBITDA and normalized EBIT are measures utilized by Anheuser-Busch InBev to
demonstrate the company’s underlying performance.
Normalized EBITDA is calculated excluding the following effects from profit attributable to
equity holders of Anheuser-Busch InBev: (i) non-controlling interest; (ii) income tax expense;
(iii) share of results of associates; (iv) net finance cost; (v) non-recurring net finance cost; (vi)
non-recurring items above EBIT (including non-recurring impairment); and (vii) depreciation,
amortization and impairment.
Normalized EBITDA and normalized EBIT are not accounting measures under IFRS accounting
and should not be considered as an alternative to profit attributable to equity holders as a
measure of operational performance, or an alternative to cash flow as a measure of liquidity.
Normalized EBITDA and normalized EBIT do not have a standard calculation method and
Anheuser-Busch InBev’s definition of normalized EBITDA and normalized EBIT may not be
comparable to that of other companies.

Brussels, 3 March 2011 – 14 / 22
4Q09
Reported 4Q10
FY09
Reported FY10
Profit attributable to equity holders of AB InBev 1 280 968 4 613 4 026
Non-controlling interests 410 589 1 264 1 736
Profit 1 690 1 557 5 877 5 762
Income tax expense 365 548 1 786 1 920
Share of results of associates - 128 - 126 - 513 - 521
Non-recurring net finance cost 634 204 629 925
Net finance cost 827 798 3 790 2 811
Non-recurring items (including non-recurring impairment) -1 003 76 -1 321 268
Normalized EBIT 2 384 3 057 10 248 11 165
Depreciation, amortization, and impairment 721 838 2 789 2 704
Normalized EBITDA 3 105 3 895 13 037 13 869
Figure 7. Reconciliation of normalized EBITDA to profit attributable to equity holders of AB InBev
FINANCIAL POSITION
Figure 8. Cash Flow Statement (million USD)
FY09 FY10Reported
Operating activities
Profit 5 877 5 762
Interest, taxes and non-cash items included in profit 7 353 8 503
Cash flow from operating activities before changes in working capital
and use of provisions 13 230 14 265
Change in working capital 787 226
Pension contributions and use of provisions -548 -519
Interest and taxes (paid)/received -4 345 -4 450
Dividends received - 383
Cash flow from operating activities 9 124 9 905
Investing activities
Net capex -1 386 -2 123
Acquisition and sale of subsidiaries and associates, net of cash
acquired/disposed of, and purchase of non-controlling interest 4 586 -62
Proceeds from the sale of associates and assets held for sale 1 813 146
Investment in short term debt securities - -604
Other 256 97
Cash flow from investing activities 5 269 -2 546
Financing activities
Dividends paid -1 313 -1 924
Net (payments) on/proceeds from borrowings -11 793 -4 290
Net proceeds from the issue of share capital 76 215
Other (including net financing cost other than interest) -66 -758
Cash flow from financing activities -13 096 -6 757
Net increase/(decrease) in cash and cash equivalents 1 297 602

Brussels, 3 March 2011 – 15 / 22 FY10 cash flow from operating activities of 9 905 million USD, compares to 9 124 million USD
in FY09 on a reported basis.
The company devotes substantial efforts to the efficient use of its working capital, especially
those elements of working capital that are perceived as ‘core’ (including trade receivables,
inventories and trade payables). Changes in working capital contributed 226 million USD to
operational cash flow in 2010. This change includes 143 million USD cash outflow from
derivatives. Excluding the impact of derivatives, working capital management would have
delivered 369 million USD.
Net capital expenditures increased from 1 386 million USD in FY09 to 2 123 million USD in
FY10, mainly due to higher investments in the growth regions of Brazil and China.
During FY10, the company invested 604 million USD in BRL-denominated government debt
securities in order to facilitate liquidity and capital preservation. These investments are of a
highly liquid nature.
Net debt as of 31 December 2010 was 39.7 billion USD, a reduction of 5.5 billion USD during
2010, driven by strong cash flow generation. Net debt to EBITDA as of 31 December 2010 was
2.9, a reduction from 3.7 last year, on the Reference Base.
In FY10, AB InBev repaid or refinanced 12.8 billion USD of the existing senior facilities. During
the last two years, we have significantly enhanced our maturity profile, as illustrated in Figure
9, and our current cash flow generation is more than sufficient to cover debt maturing in the
next 12 months.
The company’s cash, cash equivalents and short-term investments in debt securities less bank
overdrafts as at 31 December 2010 amounted to 5 138 million USD. As of the same date, the
company had an aggregate of 568 million USD and 8 587 million USD available under
committed short-term and long-term credit facilities, respectively.
Figure 9. Terms and debt repayment schedule as of 31 December 2010 (billion USD)
11.312.1
15.1 15.7
5.2
2.0
6.6
4.2
19.1
17.1
2.9
7.9 8.0 8.5
17.6
1 year or less 1-2 years 2-3 years 3-5 years More than 5 years
31 December 2008 31 December 2009 31 December 2010

Brussels, 3 March 2011 – 16 / 22
RECENT EVENTS
On 24 January 2011, Anheuser-Busch InBev announced that it completed the pricing of 1.65
billion USD aggregate principal amount of notes, consisting of 650 million USD aggregate
principal amount of floating rate notes due 2014, 500 million USD aggregate principal amount
of fixed rate notes due 2016 and 500 million USD aggregate principal amount of fixed rate
notes due 2021. The notes will bear interest at an annual rate of 55 basis points above three-
month LIBOR for the floating rate notes, 2.875% for the 2016 notes, and 4.375% for the 2021
notes. The notes will mature on 27 January 2014 in the case of the floating rate notes, 15
February 2016 in the case of the 2016 notes and 15 February 2021 in the case of the 2021
notes. The issuance closed on 27 January 2011.
As a result of this transaction, non-recurring finance costs in 1Q11 will include a one-time
accretion expense and negative mark-to-market adjustment estimated at approximately 75
million USD, as a portion of the interest rates swaps, hedging borrowings under the 2010
Senior Facilities, will no longer be effective. The cash equivalent of the negative mark-to-
market adjustment will be spread from 2011 to 2014.
On 11 February 2011, our subsidiary, Anheuser-Busch InBev Worldwide Inc., launched an
exchange offer for up to 8.0 billion USD of its outstanding unregistered notes, for freely
tradable notes registered under the Securities Act of 1933 with otherwise substantially the
same terms and conditions. The unregistered notes were issued during the first half of 2009
before we became an SEC reporting company. The exchange offer will close on 14 March 2011.
The statutory auditor, PricewaterhouseCoopers Bedrijfsrevisoren bcvba, represented by Yves
Vandenplas, has issued an unmodified report dated 2 March 2011 on the company’s
consolidated accounts as of and for the year ended 31 December 2010, and has confirmed that
the accounting information reported in this press release in figures 3 to 8 is consistent, in all
material respects, with the accounts from which it has been derived.

Brussels, 3 March 2011 – 17 / 22 Annexes
• Annex 1: Full Year 2010 (FY10) segment information
• Annex 2: Fourth Quarter 2010 (4Q10) segment information
Agenda for 3 March 2011
• Press conference at 10:30 am CET at AB InBev's Global Headquarters in Leuven
• Conference call 4Q10 results for investors
2.00 p.m. CET / 1.00 p.m. GMT / 8.00 a.m. EST - full registration details are available at
http://www.ab-inbev.com/go/investors/events_calendar/4Q10_results.cfm
Disclaimer:
This release contains certain forward-looking statements reflecting the current views of the management of AB InBev with respect to, among other things, AB InBev’s strategic objectives, business prospects, future financial condition, budgets, projected levels of production, projected costs and projected levels of revenues and profits, and the synergies it is able to achieve. These statements involve risks and uncertainties. The ability of AB InBev to achieve these objectives and targets is dependent on many factors some of which may be outside of management’s control. In some cases, words such as “believe”, “intend”, “expect”, “anticipate”, “plan”, “target”, “will” and similar expressions to identify forward-looking statements are used. All statements other than statements of historical facts are forward-looking statements. You should not place undue reliance on these forward-looking statements. By their nature, forward-looking statements involve risk and uncertainty because they reflect AB InBev’s current expectations and assumptions as to future events and circumstances that may not prove accurate. The actual results could differ materially from those anticipated in the forward-looking statements for many reasons including the risks described under Item 3.D of AB InBev's annual report on Form 20-F filed with the US Securities and Exchange Commission on 15 April 2010. AB InBev cannot assure you that the future results, level of activity, performance or achievements of AB InBev will meet the expectations reflected in the forward-looking statements. Moreover, neither AB InBev nor any other person assumes responsibility for the accuracy or completeness of the forward-looking statements. Unless AB InBev is required by law to update these statements, AB InBev will not necessarily update any of these statements after the date of this release, either to confirm the actual results or to report a change in its expectations.

Brussels, 3 March 2011 – 18 / 22 About Anheuser-Busch InBev Anheuser-Busch InBev is a publicly traded company (Euronext: ABI) based in Leuven, Belgium, with an American Depositary Receipt secondary listing on the New York Stock Exchange (NYSE: BUD). It is the leading global brewer and one of the world's top five consumer products companies. A true consumer-centric, sales driven organization, AB InBev manages a portfolio of well over 200 beer brands that includes global flagship brands Budweiser®, Stella Artois® and Beck’s®, fast growing multi-country brands like Leffe® and Hoegaarden®, and strong “local champions” such as Bud Light®, Skol®, Brahma®, Quilmes®, Michelob®, Harbin®, Sedrin®, Klinskoye®, Sibirskaya Korona®, Chernigivske®, and Jupiler®, among others. In addition, the company owns a 50 percent equity interest in the operating subsidiary of Grupo Modelo, Mexico's leading brewer and owner of the global Corona® brand. AB InBev’s dedication to heritage and quality is rooted in brewing traditions that originate from the Den Hoorn brewery in Leuven, Belgium, dating back to 1366 and the pioneering spirit of the Anheuser & Co brewery, which traces its origins back to 1852 in St. Louis, USA. Geographically diversified with a balanced exposure to developed and developing markets, AB InBev leverages the collective strengths of its approximately 114 000 employees based in operations in 23 countries across the world. The company strives to be the Best Beer Company in a Better World. In 2010, AB InBev realized 36.3 billion US dollar revenue. For more information, please visit: www.ab-inbev.com.
Anheuser-Busch InBev Contacts:
Media Investors
Marianne Amssoms
Tel: +1-212-573-9281
E-mail: [email protected]
Graham Staley
Tel: +1-212-573-4365
E-mail: [email protected]
Karen Couck
Tel: +32-16-27-69-65
E-mail: [email protected]
Thelke Gerdes
Tel: +32-16-27-68-88
E-mail: [email protected]
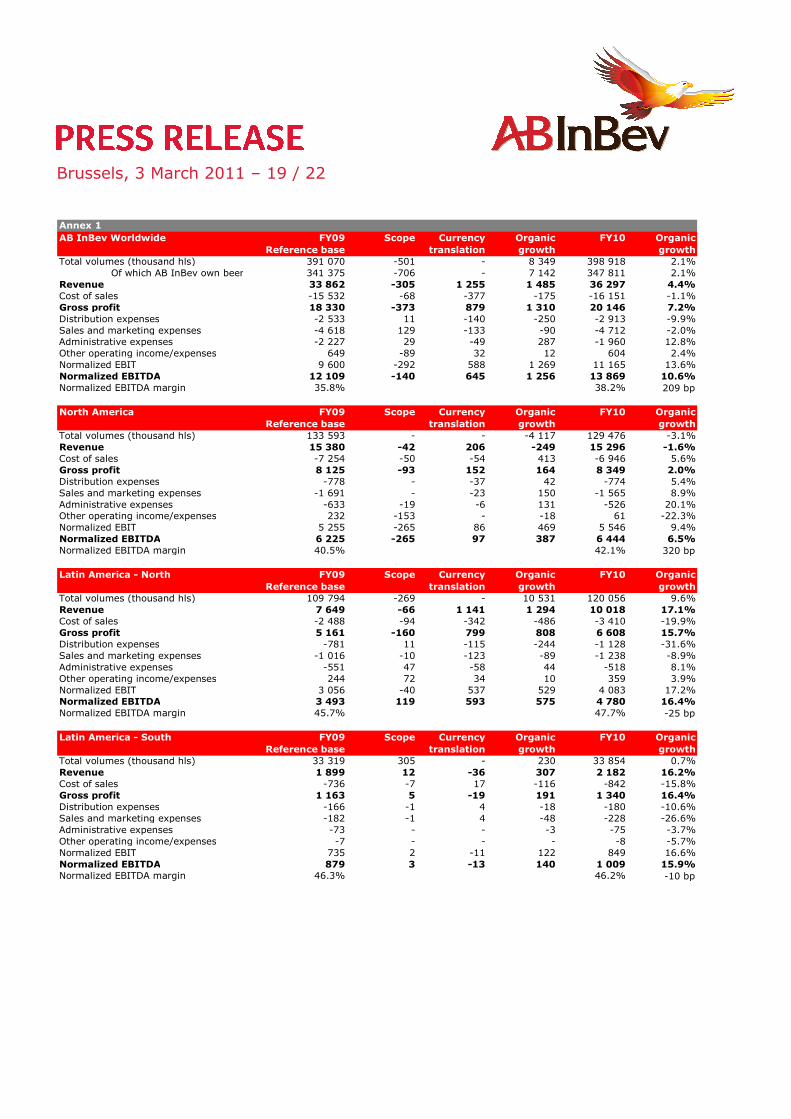
Brussels, 3 March 2011 – 19 / 22
AB InBev Worldwide FY09
Reference base
Scope Currency
translation
Organic
growth
FY10 Organic
growth
Total volumes (thousand hls) 391 070 -501 - 8 349 398 918 2.1%
Of which AB InBev own beer 341 375 -706 - 7 142 347 811 2.1%
Revenue 33 862 -305 1 255 1 485 36 297 4.4%
Cost of sales -15 532 -68 -377 -175 -16 151 -1.1%
Gross profit 18 330 -373 879 1 310 20 146 7.2%
Distribution expenses -2 533 11 -140 -250 -2 913 -9.9%
Sales and marketing expenses -4 618 129 -133 -90 -4 712 -2.0%
Administrative expenses -2 227 29 -49 287 -1 960 12.8%
Other operating income/expenses 649 -89 32 12 604 2.4%
Normalized EBIT 9 600 -292 588 1 269 11 165 13.6%
Normalized EBITDA 12 109 -140 645 1 256 13 869 10.6%
Normalized EBITDA margin 35.8% 38.2% 209 bp
North America FY09
Reference base
Scope Currency
translation
Organic
growth
FY10 Organic
growth
Total volumes (thousand hls) 133 593 - - -4 117 129 476 -3.1%
Revenue 15 380 -42 206 -249 15 296 -1.6%
Cost of sales -7 254 -50 -54 413 -6 946 5.6%
Gross profit 8 125 -93 152 164 8 349 2.0%
Distribution expenses -778 - -37 42 -774 5.4%
Sales and marketing expenses -1 691 - -23 150 -1 565 8.9%
Administrative expenses -633 -19 -6 131 -526 20.1%
Other operating income/expenses 232 -153 - -18 61 -22.3%
Normalized EBIT 5 255 -265 86 469 5 546 9.4%
Normalized EBITDA 6 225 -265 97 387 6 444 6.5%
Normalized EBITDA margin 40.5% 42.1% 320 bp
Latin America - North FY09
Reference base
Scope Currency
translation
Organic
growth
FY10 Organic
growth
Total volumes (thousand hls) 109 794 -269 - 10 531 120 056 9.6%
Revenue 7 649 -66 1 141 1 294 10 018 17.1%
Cost of sales -2 488 -94 -342 -486 -3 410 -19.9%
Gross profit 5 161 -160 799 808 6 608 15.7%
Distribution expenses -781 11 -115 -244 -1 128 -31.6%
Sales and marketing expenses -1 016 -10 -123 -89 -1 238 -8.9%
Administrative expenses -551 47 -58 44 -518 8.1%
Other operating income/expenses 244 72 34 10 359 3.9%
Normalized EBIT 3 056 -40 537 529 4 083 17.2%
Normalized EBITDA 3 493 119 593 575 4 780 16.4%
Normalized EBITDA margin 45.7% 47.7% -25 bp
Latin America - South FY09
Reference base
Scope Currency
translation
Organic
growth
FY10 Organic
growth
Total volumes (thousand hls) 33 319 305 - 230 33 854 0.7%
Revenue 1 899 12 -36 307 2 182 16.2%
Cost of sales -736 -7 17 -116 -842 -15.8%
Gross profit 1 163 5 -19 191 1 340 16.4%
Distribution expenses -166 -1 4 -18 -180 -10.6%
Sales and marketing expenses -182 -1 4 -48 -228 -26.6%
Administrative expenses -73 - - -3 -75 -3.7%
Other operating income/expenses -7 - - - -8 -5.7%
Normalized EBIT 735 2 -11 122 849 16.6%
Normalized EBITDA 879 3 -13 140 1 009 15.9%
Normalized EBITDA margin 46.3% 46.2% -10 bp
Annex 1

Brussels, 3 March 2011 – 20 / 22
Western Europe FY09
Reference base
Scope Currency
translation
Organic
growth
FY10 Organic
growth
Total volumes (thousand hls) 32 333 316 - -816 31 833 -2.5%
Of which AB InBev own beer 28 874 316 - -453 28 737 -1.6%
Revenue 4 221 -20 -133 -130 3 937 -3.1%
Cost of sales -2 037 - 53 101 -1 883 5.0%
Gross profit 2 184 -21 -80 -29 2 054 -1.3%
Distribution expenses -418 - 14 10 -393 2.4%
Sales and marketing expenses -775 20 28 11 -716 1.5%
Administrative expenses -389 - 11 86 -291 22.3%
Other operating income/expenses 87 - -2 -2 83 -2.8%
Normalized EBIT 690 - -29 76 737 11.0%
Normalized EBITDA 1 072 - -43 70 1 099 6.6%
Normalized EBITDA margin 25.4% 27.9% 255 bp
Central and Eastern Europe FY09
Reference base
Scope Currency
translation
Organic
growth
FY10 Organic
growth
Total volumes (thousand hls) 27 454 -455 - -249 26 750 -0.9%Revenue 1 571 - 57 -8 1 619 -0.5%Cost of sales -822 -1 -27 -7 -857 -0.8%Gross profit 749 -1 29 -15 762 -2.0%Distribution expenses -157 - -8 -26 -191 -16.9%Sales and marketing expenses -297 -4 -14 -38 -353 -12.7%Administrative expenses -126 - -3 21 -109 16.4%Other operating income/expenses 4 - - 3 7 86.5%Normalized EBIT 174 -5 4 -55 117 -32.8%Normalized EBITDA 385 -5 11 -68 323 -17.8%Normalized EBITDA margin 24.5% 20.0% -420 bp
Asia Pacific FY09
Reference base
Scope Currency
translation
Organic
growth
FY10 Organic
growth
Total volumes (thousand hls) 48 914 -1 439 - 2 793 50 268 5.9%Revenue 1 720 -162 28 181 1 767 11.6%Cost of sales -947 27 -16 -73 -1 008 -7.9%Gross profit 773 -134 12 108 759 16.9%Distribution expenses -120 - -2 -19 -140 -15.9%Sales and marketing expenses -493 119 -7 -58 -439 -15.6%Administrative expenses -132 1 -1 -16 -148 -12.2%Other operating income/expenses 37 - 1 10 47 26.8%Normalized EBIT 65 -13 2 25 79 47.7%Normalized EBITDA 259 -16 5 44 292 18.3%Normalized EBITDA margin 15.0% 16.5% 94 bp
Global Export and Holding
Companies
FY09
Reference base
Scope Currency
translation
Organic
growth
FY10 Organic
growth
Total volumes (thousand hls) 5 663 1 041 - -23 6 681 -0.3%Revenue 1 423 -26 -8 90 1 479 6.4%Cost of sales -1 249 57 -7 -7 -1 206 -0.6%Gross profit 174 31 -15 83 273 40.3%Distribution expenses -114 - 3 5 -106 4.0%Sales and marketing expenses - 164 4 3 -17 -174 -10.4%Administrative expenses -324 - 8 23 -292 7.1%Other operating income/expenses 53 -7 -1 9 54 20.4%Normalized EBIT -375 29 -1 103 -245 29.7%Normalized EBITDA -204 25 -5 107 -77 59.7%
Annex 1

Brussels, 3 March 2011 – 21 / 22
AB InBev Worldwide 4Q09
Reference base
Scope Currency
translation
Organic
growth
4Q10 Organic
growthTotal volumes (thousand hls) 100 123 -1 710 - 1 364 99 776 1.4%
Of which AB InBev own beer 85 422 -1 679 - 1 210 84 953 1.4%
Revenue 9 026 -197 127 518 9 473 5.9%
Cost of sales -4 130 -40 -31 9 -4 192 0.2%
Gross profit 4 896 -238 96 527 5 281 11.0%
Distribution expenses -687 12 -13 -96 -785 -14.2%
Sales and marketing expenses -1 359 55 -3 125 -1 181 9.8%
Administrative expenses -682 49 - 148 -486 22.0%
Other operating income/expenses 191 68 1 -32 228 -17.2%
Normalized EBIT 2 359 -54 81 672 3 057 28.5%
Normalized EBITDA 3 054 98 80 664 3 895 21.9%
Normalized EBITDA margin 33.8% 41.1% 520 bp
North America 4Q09
Reference base
Scope Currency
translation
Organic
growth
4Q10 Organic
growthTotal volumes (thousand hls) 29 927 - - -382 29 545 -1.3%
Revenue 3 497 -3 24 39 3 558 1.1%
Cost of sales -1 708 2 -6 106 -1 606 6.2%
Gross profit 1 789 -1 18 145 1 952 8.1%
Distribution expenses -178 - -5 3 -179 1.9%
Sales and marketing expenses -439 - -1 81 -359 18.5%
Administrative expenses -182 - - 64 -118 35.0%
Other operating income/expenses 27 1 - -8 20 -27.9%
Normalized EBIT 1 017 - 13 286 1 315 28.1%
Normalized EBITDA 1 295 - 14 233 1 542 18.0%
Normalized EBITDA margin 37.0% 43.3% 618 bp
Latin America - North 4Q09
Reference base
Scope Currency
translation
Organic
growth
4Q10 Organic
growthTotal volumes (thousand hls) 34 032 -269 - 1 157 34 920 3.4%
Revenue 2 699 -66 165 361 3 158 13.7%
Cost of sales -887 -94 -47 -94 -1 122 -11.2%
Gross profit 1 812 -160 118 266 2 036 14.9%
Distribution expenses -264 11 -17 -74 -344 -29.2%
Sales and marketing expenses -362 -10 -15 14 -374 4.0%
Administrative expenses -188 47 -8 26 -122 14.4%
Other operating income/expenses 91 72 3 -17 148 -18.3%
Normalized EBIT 1 089 -40 80 215 1 345 19.5%
Normalized EBITDA 1 222 119 86 228 1 655 18.6%
Normalized EBITDA margin 45.3% 52.4% 201 bp
Latin America - South 4Q09
Reference base
Scope Currency
translation
Organic
growth
4Q10 Organic
growthTotal volumes (thousand hls) 10 269 - - 264 10 533 2.6%
Revenue 597 - 3 122 722 20.4%
Cost of sales -215 - -1 -42 -258 -19.5%
Gross profit 382 - 2 80 463 20.8%
Distribution expenses -51 - - -10 -61 -20.1%
Sales and marketing expenses -53 - -1 -9 -62 -16.4%
Administrative expenses -19 - - -3 -22 -17.2%
Other operating income/expenses -3 - - 1 -3 17.5%
Normalized EBIT 257 - 1 58 315 22.6%
Normalized EBITDA 294 - 1 63 358 21.5%
Normalized EBITDA margin 49.2% 49.6% 45 bp
Annex 2

Brussels, 3 March 2011 – 22 / 22
Western Europe 4Q09
Reference base
Scope Currency
translation
Organic
growth
4Q10 Organic
growthTotal volumes (thousand hls) 8 098 -31 - -292 7 775 -3.6%
Of which AB InBev own beer 7 268 -31 - -237 7 000 -3.3%
Revenue 1 076 -6 -62 -46 962 -4.3%
Cost of sales -546 - 26 27 -493 4.9%
Gross profit 530 -7 -35 -19 469 -3.6%
Distribution expenses -103 - 6 3 -94 2.5%
Sales and marketing expenses -218 6 13 22 -177 10.5%
Administrative expenses -128 - 5 56 -68 43.3%
Other operating income/expenses 27 - -1 -1 25 -2.6%
Normalized EBIT 107 - -12 61 156 57.3%
Normalized EBITDA 208 - -19 63 251 30.3%
Normalized EBITDA margin 19.3% 26.1% 699 bp
Central and Eastern Europe 4Q09
Reference base
Scope Currency
translation
Organic
growth
4Q10 Organic
growthTotal volumes (thousand hls) 5 792 - - -44 5 748 -0.8%
Revenue 374 - -12 -7 355 -1.8%
Cost of sales -209 -1 6 16 -189 7.6%
Gross profit 164 -1 -7 9 166 5.7%
Distribution expenses -35 - 1 -12 -46 -32.9%
Sales and marketing expenses -87 -4 3 8 -80 8.4%
Administrative expenses -37 - -1 5 -33 13.3%
Other operating income/expenses 2 - - 3 5 178.1%
Normalized EBIT 7 -5 -3 14 12 977.5%
Normalized EBITDA 66 -5 -4 15 72 25.5%
Normalized EBITDA margin 17.5% 20.3% 449 bp
Asia Pacific 4Q09
Reference base
Scope Currency
translation
Organic
growth
4Q10 Organic
growthTotal volumes (thousand hls) 10 465 -1 589 - 743 9 619 8.4%
Revenue 395 -114 12 79 373 28.3%
Cost of sales -222 43 -7 -46 -233 -25.9%
Gross profit 173 -71 5 33 140 32.4%
Distribution expenses -30 1 -1 -3 -34 -10.2%
Sales and marketing expenses -151 61 -3 6 -86 6.9%
Administrative expenses -35 1 -1 -9 -44 -28.0%
Other operating income/expenses 24 - - -7 17 -28.4%
Normalized EBIT -19 -9 1 20 -7 72.3%
Normalized EBITDA 34 -14 2 30 52 156.8%
Normalized EBITDA margin 8.5% 13.9% 686 bp
Global Export and Holding
Companies
4Q09
Reference base
Scope Currency
translation
Organic
growth
4Q10 Organic
growthTotal volumes (thousand hls) 1 539 179 - -82 1 636 -4.8%
Revenue 388 -8 -3 -31 346 -8.1%
Cost of sales -343 11 -2 43 -291 12.9%
Gross profit 45 3 -5 12 55 26.3%
Distribution expenses -24 - 1 -3 -26 -12.6%
Sales and marketing expenses -50 1 1 3 -44 6.8%
Administrative expenses -92 - 4 10 -78 11.2%
Other operating income/expenses 24 -4 - -5 15 -23.1%
Normalized EBIT -98 - 1 18 -78 18.7%
Normalized EBITDA -65 -1 -1 32 -34 48.7%
Annex 2