AnExperimentalStudyonGearDiagnosisbyUsing … · AnExperimentalStudyonGearDiagnosisbyUsing Acoustic...
9
An Experimental Study on Gear Diagnosis by Using Acoustic Emission Technique S ¸ aban Ulus and Selc ¸uk Erkaya Erciyes University, Engineering Faculty, Mechatronic Engineering Department, 38039, Kayseri, Turkey (Received 24 June 2014; accepted 1 January 2015) Acoustic Emission (AE) is one of the condition monitoring and diagnosing techniques of rotating machine elements such as gears, bearings, etc. So far, many studies about fault diagnosis on gearboxes have been implemented for vibration monitoring. In addition, a great deal of research on spur gears has been done for understanding the possible gear faults by considering their acoustic characteristics. In this study, possible faults in gears were analysed by the AE technique. A single-stage gearbox system comprising both helical and spur gears was used to identify the existence of possible gear faults, such as pitting and cracking at the tooth root. Noise signal in time-domain is converted to frequency-domain by using Fast Fourier Transform (FFT). In the experimental stage, artificial faults were implemented, and some mathematical parameters such as Root Mean Square error (RMS), Crest Factor (CF), and maximum value of noise level were considered to identify the fault occurrence at the meshing gear. The results show that the AE technique is very effective in diagnosing the defects in a gear system by a contactless measurement. Also, compared to the other diagnostic approaches, it is clear that the gear defects can be determined at an earlier stage by the AE technique. NOMENCLATURE AE Acoustic emission FFT Fast Fourier transform RMS Root mean square CF Crest factor FCM Fault condition monitoring EI Energy Index f R1 Rotation frequency of 300 rpm f R2 Rotation frequency of 500 rpm f R3 Rotation frequency of 700 rpm dB Decibel SPL Sound pressure level BPF Band pass filter P (t) Instantaneous sound pressure T Time interval averaging x peak Maximum peak value of the signal P RMS Root mean square value of the sound pressure level CF0 Crest factor for no loaded condition CF1 Crest factor for 1 Nm loaded condition CF3 Crest factor for 3 Nm loaded condition RMS0 Root mean square value for no loaded condition RMS1 Root mean square value for 1 Nm loaded condition RMS3 Root mean square value for 3 Nm loaded condition 1. INTRODUCTION In the industry today, in order to meet consumer needs, con- tinuity of the production and safety of the processes are of crucial importance. Continuous Fault Condition Monitoring (FCM) can reduce downtime and the total cost of products. In spite of the fact that the initial capital investment cost is high for setting the FCM system, monitoring the health of the struc- tures has a great importance, and FCM requirements in the in- dustry are increasing day by day. Providing a method of early detection of structural, mechanical, or electrical problems al- lows operators to predict where faults occurred and suggest an approximate time that the system will break down. Unex- pected machine failure causes both hitches of the production schedule and increases in cost with financial loss. For this rea- son, Predictive Maintenance methods are very important. One of them is the Acoustic Emission (AE) technique. It requires a contactless measurement, which is an advantage for mechani- cal systems and their parts. Any abnormalities or defects in the machinery or equipment must be detected and analysed at an early stage to avoid major problems. Therefore, FCM of rotat- ing machinery, such as at gears and bearings, has a crucial role in the industry, as it keeps the system in a healthy condition for maximum productivity, while detecting and diagnosing faults at an early stage. As a result, it is possible to prevent serious problems, damages, and more cost. 1 It is difficult to diagnose possible gear faults such as micro- cracks and pitting because of their minimal effect on the sys- tem, and these kinds of faults can lead to a rapid destruction of the teeth in meshing gears. Micro-cracks and pitting in gear teeth can be a catastrophic problem resulting in tooth break- age while the system is running. Nowadays, fault diagnosis techniques for rotating machinery, such as vibration monitor- ing and temperature detection analysis, need a measurement technique with contact. Although vibration monitoring tech- niques are quite common for detecting and diagnosing faulty conditions of rotating machinery, the AE technique provides early detection of faults. 2 In the last two decades, a new method for early fault diag- nosis, the AE technique, has been researched and gained in- creasing attention. AE is defined as a matter that results in the generation of structure- or fluid-borne waves due to the rapid release of energy from localised sources within or on the surface of a material. The application of the AE technique is International Journal of Acoustics and Vibration, Vol. 21, No. 1, 2016 (pp. 103111) http://dx.doi.org/10.20855/ijav.2016.21.1400 103
Transcript of AnExperimentalStudyonGearDiagnosisbyUsing … · AnExperimentalStudyonGearDiagnosisbyUsing Acoustic...

An Experimental Study on Gear Diagnosis by UsingAcoustic Emission TechniqueSaban Ulus and Selcuk ErkayaErciyes University, Engineering Faculty, Mechatronic Engineering Department, 38039, Kayseri, Turkey
(Received 24 June 2014; accepted 1 January 2015)
Acoustic Emission (AE) is one of the condition monitoring and diagnosing techniques of rotating machine elementssuch as gears, bearings, etc. So far, many studies about fault diagnosis on gearboxes have been implementedfor vibration monitoring. In addition, a great deal of research on spur gears has been done for understandingthe possible gear faults by considering their acoustic characteristics. In this study, possible faults in gears wereanalysed by the AE technique. A single-stage gearbox system comprising both helical and spur gears was usedto identify the existence of possible gear faults, such as pitting and cracking at the tooth root. Noise signal intime-domain is converted to frequency-domain by using Fast Fourier Transform (FFT). In the experimental stage,artificial faults were implemented, and some mathematical parameters such as Root Mean Square error (RMS),Crest Factor (CF), and maximum value of noise level were considered to identify the fault occurrence at themeshing gear. The results show that the AE technique is very effective in diagnosing the defects in a gear systemby a contactless measurement. Also, compared to the other diagnostic approaches, it is clear that the gear defectscan be determined at an earlier stage by the AE technique.
NOMENCLATUREAE Acoustic emissionFFT Fast Fourier transformRMS Root mean squareCF Crest factorFCM Fault condition monitoringEI Energy IndexfR1 Rotation frequency of 300 rpmfR2 Rotation frequency of 500 rpmfR3 Rotation frequency of 700 rpmdB DecibelSPL Sound pressure levelBPF Band pass filterP (t) Instantaneous sound pressureT Time interval averagingxpeak Maximum peak value of the signalPRMS Root mean square value of the sound pressure levelCF0 Crest factor for no loaded conditionCF1 Crest factor for 1 Nm loaded conditionCF3 Crest factor for 3 Nm loaded conditionRMS0 Root mean square value for no loaded conditionRMS1 Root mean square value for 1 Nm loaded conditionRMS3 Root mean square value for 3 Nm loaded condition
1. INTRODUCTION
In the industry today, in order to meet consumer needs, con-tinuity of the production and safety of the processes are ofcrucial importance. Continuous Fault Condition Monitoring(FCM) can reduce downtime and the total cost of products. Inspite of the fact that the initial capital investment cost is highfor setting the FCM system, monitoring the health of the struc-tures has a great importance, and FCM requirements in the in-dustry are increasing day by day. Providing a method of early
detection of structural, mechanical, or electrical problems al-lows operators to predict where faults occurred and suggestan approximate time that the system will break down. Unex-pected machine failure causes both hitches of the productionschedule and increases in cost with financial loss. For this rea-son, Predictive Maintenance methods are very important. Oneof them is the Acoustic Emission (AE) technique. It requires acontactless measurement, which is an advantage for mechani-cal systems and their parts. Any abnormalities or defects in themachinery or equipment must be detected and analysed at anearly stage to avoid major problems. Therefore, FCM of rotat-ing machinery, such as at gears and bearings, has a crucial rolein the industry, as it keeps the system in a healthy condition formaximum productivity, while detecting and diagnosing faultsat an early stage. As a result, it is possible to prevent seriousproblems, damages, and more cost.1
It is difficult to diagnose possible gear faults such as micro-cracks and pitting because of their minimal effect on the sys-tem, and these kinds of faults can lead to a rapid destructionof the teeth in meshing gears. Micro-cracks and pitting in gearteeth can be a catastrophic problem resulting in tooth break-age while the system is running. Nowadays, fault diagnosistechniques for rotating machinery, such as vibration monitor-ing and temperature detection analysis, need a measurementtechnique with contact. Although vibration monitoring tech-niques are quite common for detecting and diagnosing faultyconditions of rotating machinery, the AE technique providesearly detection of faults.2
In the last two decades, a new method for early fault diag-nosis, the AE technique, has been researched and gained in-creasing attention. AE is defined as a matter that results inthe generation of structure- or fluid-borne waves due to therapid release of energy from localised sources within or on thesurface of a material. The application of the AE technique is
International Journal of Acoustics and Vibration, Vol. 21, No. 1, 2016 (pp. 103–111) http://dx.doi.org/10.20855/ijav.2016.21.1400 103

S. Ulus, et al.: AN EXPERIMENTAL STUDY ON GEAR DIAGNOSIS BY USING ACOUSTIC EMISSION TECHNIQUE
well documented in recent research, and investigators have ob-served some advantages over classical monitoring techniques.In gearboxes, some investigators have studied the applicationof AE technology for diagnostic and prognostic purposes.3, 4
Other investigators analysed AE in detecting bending fatigueon spur gears, and noted that AE was more sensitive to crackpropagation than vibration and stiffness measurements, andAE was also found to be more sensitive to surface damage thanother fault condition monitoring techniques.5 Husin, et al.1 in-vestigated the online fault condition monitoring techniques andnoted that AE was a complimentary tool for proactive mainte-nance. Loutas, et al.6 employed some experimental researchon fault diagnosis of gearboxes by using the AE technique.They generated some artificial defects on gears and obtainedsatisfactory results from AE measurements. Tan and Mba7, 8
investigated the relations between the surface roughness, con-tact resistance, and AE levels of spur gears under partial elasto-hydrodynamic lubrication. These observations showed thatrotation speed was more efficient than loading conditions onAE levels. They emphasized the surface roughness, rotationspeed, and oil temperature for AE measurements. Energy lev-els of the acquired signal in the analysed time-domain and theEnergy Index (EI) for statistical measurements were noted inAl-Balushi and Samanta’s work.9 They also studied one he-licopter gearbox by using the AE technique, and comparisonsbetween AE and vibration measurements were implemented.They indicated that AE was more sensitive on early fault di-agnosis than the vibration method. In their work, spur gearswere used, and relations between oil film thickness, temper-ature, and AE activity were analysed. It was shown that AEactivity was affected by surface asperity contacts more thanloading condition.10
Belsak and Flasker11 investigated the crack at the tooth rootof the gear, which was a common fault for gearboxes, and theyused time- and frequency-domain for damaged and defect-freeconditions on crack propagation. The same group12 investi-gated the crack size and sideband occurrence by comparingdefect-free conditions by using short time frequency spectrumanalysis. Fault diagnosis on a single-stage gearbox test rig withonly spur gears, similar to vehicle gearboxes, was studied byusing FFT and RMS for obtaining the fault characteristics ofthe gear.5 It was proved that the early fault detection on crackpropagation was possible by AE. Combet, et al.13 studied twodifferent waveform methods to obtain local and instantaneousaverages of the signals. Local faults were recognized, and theyfound a diagnosing method dependent on the angle at a spe-cial frequency range. Raja Hamzah and Mba14 noted that AEresults for spur gears were more sensitive than those for heli-cal gears. Surface roughness and contact length was also im-portant for the acoustic characteristics of gears. Baydar andBall15 used an instantenous power spectrum instead of time-frequency distribution for helical gears, and they noted thatthis method had an advantage not only for fixed loading con-ditions, but also for variable loading conditions. The same re-search group16 investigated the AE and vibration techniques ona cracked gear tooth, a broken gear tooth, and local cracks byusing Wigner-Ville distribution, and they obtained results indi-cating that AE has some advantages on early fault diagnosis.
Some diagnosing techniques17–19 were implemented by usingstatistical measurements for helicopter gearbox transmissionsystems, and these methods were found to be reliable, but someof the experiments were not repeated.
In spite of the common use of vibration monitoring methodin rotating machinery, up to now, classical vibration monitor-ing analysis techniques have not been enough for detecting in-cipient failures such as pitting, micro-cracks, and surface wearin gears. Machine conditions and faults such as gear failures,unbalance, shaft missallignment, and bearing defects can bemonitored by using acoustic emission signals at machines’ op-erating conditions. These signals can be used not only forgrowing failures, but also for incipient failures of the rotatingmachineries, to reduce or eleminate catastrophic damages. Inthis study, the AE technique was used to analyse and evaluatethe gear defects on both spur and helical gears. This study wasemployed as an experimental research and is organized as fol-lows: Section 2 shows the materials and methods used in thisexperimental study. Results obtained from the test system byusing the AE technique are outlined in Section 3. And Section4 gives a conclusion about the experimental study on the gearfault condition monitoring.
2. MATERIALS AND METHODS
In order to observe and analyse AE in gears, a gearbox testrig was designed. Experiments were performed on a single-stage gearbox test rig; that is, as a vehicles’ transmission sys-tem. A 3 KW electric motor was used for both spur and helicalgears. A three-phase frequency inverter, Delta VFD-E, wasused for the case of different working speeds. A pinion gearhas 51 teeth and the driven gear has 70 teeth. The pinion gearhas fR1 = 5 Hz, fR2 = 8.3 Hz, and fR3 = 11.67 Hz rota-tion frequencies for 300 rpm, 500 rpm, and 700 rpm rotationspeeds, respectively. Also, the meshing frequencies for bothpinion and driven gears are 255 Hz, 425 Hz, and 595 Hz for300 rpm, 500 rpm, and 700 rpm rotation speeds, respectively.In the experimental measurements, AE data was recorded af-ter the following processes: (i) the gearbox system was runfor about 2 hours to satisfy a working condition stability ofthe system, and (ii) an acoustic emission sensor was located tocollect the signal for data processing.
A tool for acoustic measuring, a Bruel-Kjaer (B&K)portable and multi-channel pulse 3560-B-X05 analyser and4189-A021 microphone with a pre-amplifier, were used to ob-tain and analyse the results. An analysis programme was ableto evaluate the time- and frequency-domain analysis of the ob-tained signals from the gearbox test rig. The analyser is ableto give necessary information about AE signals by measuringSound Pressure Level (SPL), which is a logarithmic measureof the effective sound pressure of a sound relative to a refer-ence value. It is measured in decibels (dB) above a standardreference level. The commonly used ”zero” reference soundpressure in air is 20 µPa.20 Sound pressure produces a signal inthe microphone of the sound level meter, and the output of thesignal is sent to the frequency analyser to get the character ofthe noise. For all that, before all of the measurements, the testenvironment and compatibility of the devices were checked.
104 International Journal of Acoustics and Vibration, Vol. 21, No. 1, 2016

S. Ulus, et al.: AN EXPERIMENTAL STUDY ON GEAR DIAGNOSIS BY USING ACOUSTIC EMISSION TECHNIQUE
Table 1. Specification of spur and helical gears.
SPUR GEAR SPECIFICATIONParameters Pinion DrivenNo. of Teeth 51 70Module 3 3Shaft Angle 90◦ 90◦
Addendum 3 mm 3 mmDedendum 3.5 mm 3.5 mmPitch Circle Diameter 153 mm 210 mmFace Width 25.1 mm 25.1 mm
HELICAL GEAR SPECIFICATIONParameters Pinion DrivenNo. of Teeth 51 70Module 3 mm 3 mmShaft Angle 90◦ 90◦
Addendum 3 mm 3 mmDedendum 3.5 mm 3.5 mmPitch Circle Diameter 162.819 mm 223.477 mmFace Width 25.1 mm 25.1 mmDirection Right LeftPressure Angle 20◦ 20◦
Helix Angle 20◦ 20◦
Figure 2. Gearbox Test System.
The AE signal was amplified and filtered using 20/40/60 dB,AE PREAMP/100–1200 KHz with a band pass filter (BPF).The PAC AE5A amplifier is a high performance AE systemthat amplifies and filters received AE signals from the pream-plifier. A block diagram of the measuring system is given inFig. 1.
Both spur and helical gears have a module of 3 mm. Dis-tances for the shaft center of spur gears and the shaft center ofhelical gears are 181.5 mm and 193.15 mm, respectively. De-tailed information for the gears are given in Table 1. A slidingmechanism was added to the system for setting the differentdistances between the shaft centers. A loading disc was at-tached to end of the driven gear shaft to load and break thegear system. The test rig used to measure acoustic signals isshown in Fig. 2.
Figure 3. (a) Gearbox test system with AE sensor; (b) Cracked tooth root; (c)Pitting fault.
2.1. Acoustic Emission Technology
Acoustic emission is defined as the generation of transientelastic waves by the rapid release of energy within or on thesurface of a material. According to Kaiser,21 crystalline solidscould propagate sound under a mechanical load. Kaiser usedhigh frequency sensors and electrical amplifiers to hear soundsin a wide range of materials under loading conditions. AE sen-sors are one of the most important tools for obtaining acousticsound, and they are usually made of piezocrystalls. AE sen-sors detect mechanical movements or stress waves, and convertthem into an electrical signal.
The main advantage of AE is its high sensitivity. The AEmethod is the most sensitive monitoring technique for earlyfault detection in rotating machine elements, especially in to-day’s industry. AE sensors can detect sound beyond the humanhearing frequency range, between 100 kHz to 1 MHz. AE de-tection may not be enough for fault condition monitoring itself.The important thing with the application of the AE technique isthe attenuation of the signal, and the AE sensor has to be closeto source of the noise generation. Therefore, in this study, theAE sensor was placed close to the source of the noise gen-eration; that is, at a 15 cm distance from the left side of themeshing point, without any contact with the gears (Fig. 3).
Signals obtained from the AE sensor are transferred to aB&K multi-channel pulse analyser and data acquisiton sys-tem, passing through the pre-amplifier, which has a range 40to 60 dB.
The traditional techniques for damage detection are basedon some statistical parameters of the vibration or acoustic en-ergy. For defect-free conditions of gears, Stewart22 indicatedthat the regular meshing component of the signal is dominatedby the mesh frequency and its harmonics. It is also observedthat the sidebands about the meshing components at the rota-tional frequency of the gear.
Signal processing techniques (such as time and frequencyanalysis) and some statistical-mathematical parameters (suchas RMS, CF, and average fault) were used to evaluate the faultyconditions of a material. Sound pressure generally can be ex-pressed as the effective sound pressure for a given period oftime. The effective value of sound pressure is the RMS valueof the instantaneous sound pressure taken at a point over a pe-
International Journal of Acoustics and Vibration, Vol. 21, No. 1, 2016 105
S. Ulus, et al.: AN EXPERIMENTAL STUDY ON GEAR DIAGNOSIS BY USING ACOUSTIC EMISSION TECHNIQUE
Figure 1. Block diagram of experimental measurement.
riod of time, as
PRMS =
√1
T
∫ T
0
P 2(t) dt; (1)
where P (t) is instantaneous sound pressure, and T is the av-erage time interval.20 The CF is defined as the maximum peakvalue of the sound pressure signal x, over a period of time (T )divided by the RMS value of sound pressure, and is expressedby
CF =xpeak
PRMS; (2)
where PRMS is the RMS value of the sound pressure, and xpeak
is the maximum peak value of the signal. CF values are usableto understand the presence of a small amount of maximum lo-cal defects over a signal.
3. RESULTS
In this study, gear faults were investigated by the AE tech-nique. Some artificial faults were formed on gears for ex-perimental investigations. The SPL of the AE signals weremeasured at 300 rpm, 500 rpm, and 700 rpm shaft rotationspeeds, and both helical and spur gear faults were outlined ina frequency spectrum under different loading conditions. Dryfriction conditions were considered for all measurements. Byconsidering the used running speeds, it was seen that the mesh-ing frequency and its harmonics/sidebands were dominant be-tween 0 and 1200 Hz. For this reason, the frequency range ofthe signal in all measurements is arranged as 0 Hz–1200 Hz. Inorder to eleminate the environmental noise effects, an isolatedcondition from other noise sources, such as room and motornoise, was implemented for the test system.
As seen in Fig. 4, AE peaks were due to the cracked toothroot that appeared in the meshing harmonics of the gear, andsidebands were also observed near the maximum fault fre-quency; that is, 765 Hz gives the third harmonic of the gear.
As shown in Fig. 4, at 300 rpm, the crest factor for the no-loaded condition (CF0) was 22.07, 1 Nm for the loaded con-dition (CF1) was 21.02, and 3 Nm for the loaded condition(CF3) was 20.97. When the gears are in an undamaged state,
Figure 4. Cracked tooth root fault for helical gear at 300 rpm rotation speedunder (a) no loaded condition, (b) 1 Nm loaded condition, and (c) 3 Nm loadedcondition.
the crest factor values were relatively lower than those of gearsin a faulty state because of the short peaks of the undamagedstate of the gear. As seen in the results, very high CF valuesresulted from high peaks. The root mean square for the no-loaded condition (RMS0) was 0.043 Pa, the root mean squarefor 1 Nm for the loaded condition (RMS1) was 0.0067 Pa, theroot mean square for 3 Nm for the loaded condition (RMS3)was 0.0069 Pa, and those RMS values show the efficient valueof faults. It can be clearly seen that there is an increase of RMSvalues by loading condition.
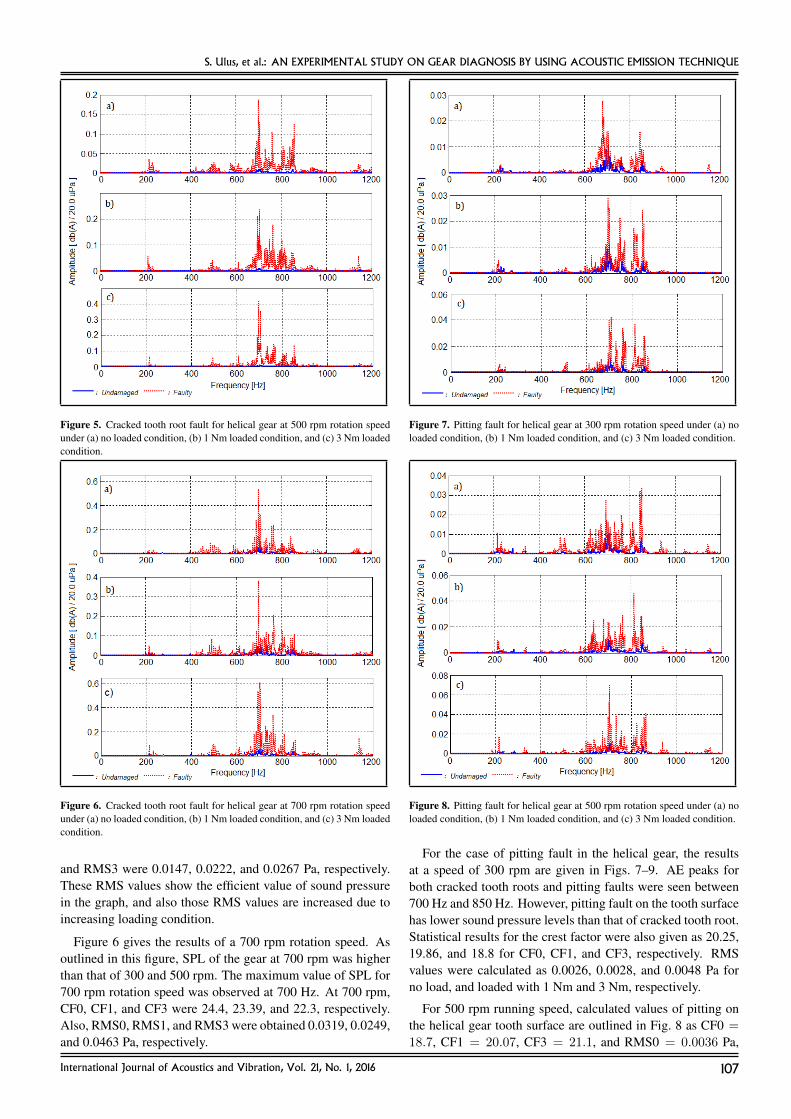
Results for 500 rpm rotation speed are shown in Fig. 5. Theobtained SPL of the gear was higher than that of 300 rpm run-ning speed’s results. Sidebands observed near the meshing har-monics related to gear tooth cracks were observed at 700 Hz.In this running speed, CF0, CF1, and CF3 were obtained as21.98, 20.36 and 23.77, respectively. Also, RMS0, RMS1,
106 International Journal of Acoustics and Vibration, Vol. 21, No. 1, 2016
S. Ulus, et al.: AN EXPERIMENTAL STUDY ON GEAR DIAGNOSIS BY USING ACOUSTIC EMISSION TECHNIQUE
Figure 5. Cracked tooth root fault for helical gear at 500 rpm rotation speedunder (a) no loaded condition, (b) 1 Nm loaded condition, and (c) 3 Nm loadedcondition.
Figure 6. Cracked tooth root fault for helical gear at 700 rpm rotation speedunder (a) no loaded condition, (b) 1 Nm loaded condition, and (c) 3 Nm loadedcondition.
and RMS3 were 0.0147, 0.0222, and 0.0267 Pa, respectively.These RMS values show the efficient value of sound pressurein the graph, and also those RMS values are increased due toincreasing loading condition.
Figure 6 gives the results of a 700 rpm rotation speed. Asoutlined in this figure, SPL of the gear at 700 rpm was higherthan that of 300 and 500 rpm. The maximum value of SPL for700 rpm rotation speed was observed at 700 Hz. At 700 rpm,CF0, CF1, and CF3 were 24.4, 23.39, and 22.3, respectively.Also, RMS0, RMS1, and RMS3 were obtained 0.0319, 0.0249,and 0.0463 Pa, respectively.
Figure 7. Pitting fault for helical gear at 300 rpm rotation speed under (a) noloaded condition, (b) 1 Nm loaded condition, and (c) 3 Nm loaded condition.
Figure 8. Pitting fault for helical gear at 500 rpm rotation speed under (a) noloaded condition, (b) 1 Nm loaded condition, and (c) 3 Nm loaded condition.
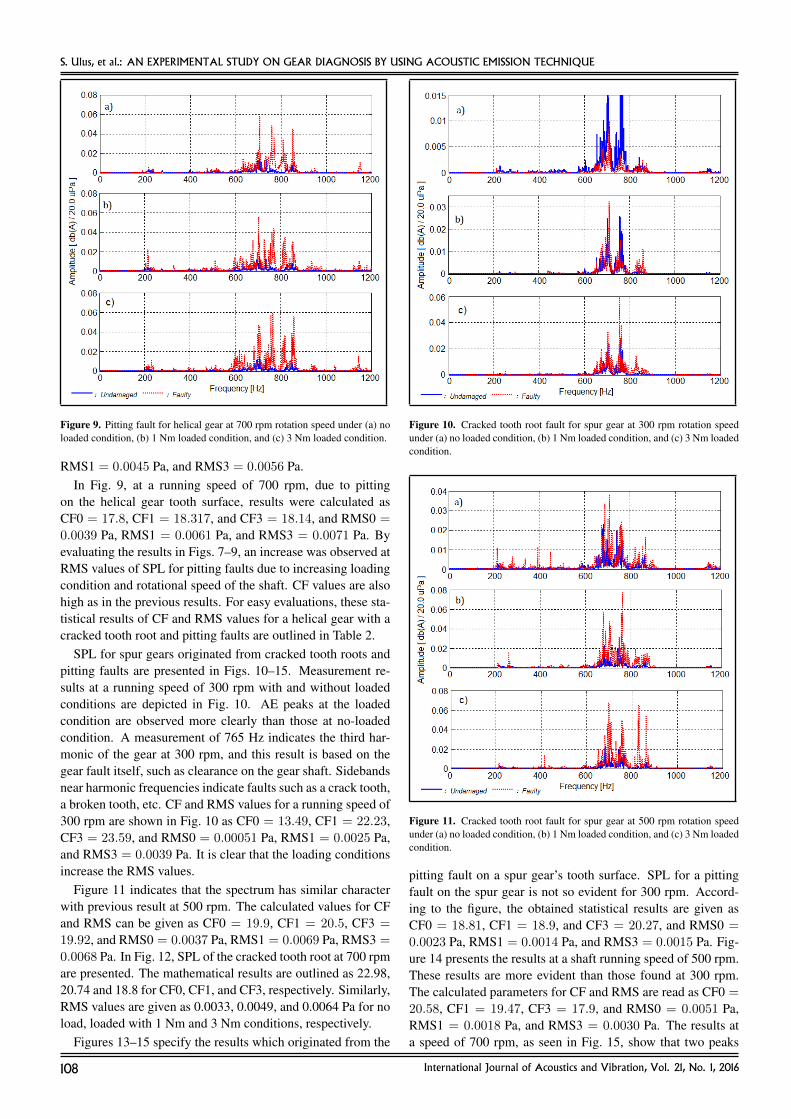
For the case of pitting fault in the helical gear, the resultsat a speed of 300 rpm are given in Figs. 7–9. AE peaks forboth cracked tooth roots and pitting faults were seen between700 Hz and 850 Hz. However, pitting fault on the tooth surfacehas lower sound pressure levels than that of cracked tooth root.Statistical results for the crest factor were also given as 20.25,19.86, and 18.8 for CF0, CF1, and CF3, respectively. RMSvalues were calculated as 0.0026, 0.0028, and 0.0048 Pa forno load, and loaded with 1 Nm and 3 Nm, respectively.
For 500 rpm running speed, calculated values of pitting onthe helical gear tooth surface are outlined in Fig. 8 as CF0 =
18.7, CF1 = 20.07, CF3 = 21.1, and RMS0 = 0.0036 Pa,
International Journal of Acoustics and Vibration, Vol. 21, No. 1, 2016 107
S. Ulus, et al.: AN EXPERIMENTAL STUDY ON GEAR DIAGNOSIS BY USING ACOUSTIC EMISSION TECHNIQUE
Figure 9. Pitting fault for helical gear at 700 rpm rotation speed under (a) noloaded condition, (b) 1 Nm loaded condition, and (c) 3 Nm loaded condition.
RMS1 = 0.0045 Pa, and RMS3 = 0.0056 Pa.In Fig. 9, at a running speed of 700 rpm, due to pitting
on the helical gear tooth surface, results were calculated asCF0 = 17.8, CF1 = 18.317, and CF3 = 18.14, and RMS0 =
0.0039 Pa, RMS1 = 0.0061 Pa, and RMS3 = 0.0071 Pa. Byevaluating the results in Figs. 7–9, an increase was observed atRMS values of SPL for pitting faults due to increasing loadingcondition and rotational speed of the shaft. CF values are alsohigh as in the previous results. For easy evaluations, these sta-tistical results of CF and RMS values for a helical gear with acracked tooth root and pitting faults are outlined in Table 2.
SPL for spur gears originated from cracked tooth roots andpitting faults are presented in Figs. 10–15. Measurement re-sults at a running speed of 300 rpm with and without loadedconditions are depicted in Fig. 10. AE peaks at the loadedcondition are observed more clearly than those at no-loadedcondition. A measurement of 765 Hz indicates the third har-monic of the gear at 300 rpm, and this result is based on thegear fault itself, such as clearance on the gear shaft. Sidebandsnear harmonic frequencies indicate faults such as a crack tooth,a broken tooth, etc. CF and RMS values for a running speed of300 rpm are shown in Fig. 10 as CF0 = 13.49, CF1 = 22.23,CF3 = 23.59, and RMS0 = 0.00051 Pa, RMS1 = 0.0025 Pa,and RMS3 = 0.0039 Pa. It is clear that the loading conditionsincrease the RMS values.
Figure 11 indicates that the spectrum has similar characterwith previous result at 500 rpm. The calculated values for CFand RMS can be given as CF0 = 19.9, CF1 = 20.5, CF3 =
19.92, and RMS0 = 0.0037 Pa, RMS1 = 0.0069 Pa, RMS3 =
0.0068 Pa. In Fig. 12, SPL of the cracked tooth root at 700 rpmare presented. The mathematical results are outlined as 22.98,20.74 and 18.8 for CF0, CF1, and CF3, respectively. Similarly,RMS values are given as 0.0033, 0.0049, and 0.0064 Pa for noload, loaded with 1 Nm and 3 Nm conditions, respectively.
Figures 13–15 specify the results which originated from the
Figure 10. Cracked tooth root fault for spur gear at 300 rpm rotation speedunder (a) no loaded condition, (b) 1 Nm loaded condition, and (c) 3 Nm loadedcondition.
Figure 11. Cracked tooth root fault for spur gear at 500 rpm rotation speedunder (a) no loaded condition, (b) 1 Nm loaded condition, and (c) 3 Nm loadedcondition.
pitting fault on a spur gear’s tooth surface. SPL for a pittingfault on the spur gear is not so evident for 300 rpm. Accord-ing to the figure, the obtained statistical results are given asCF0 = 18.81, CF1 = 18.9, and CF3 = 20.27, and RMS0 =
0.0023 Pa, RMS1 = 0.0014 Pa, and RMS3 = 0.0015 Pa. Fig-ure 14 presents the results at a shaft running speed of 500 rpm.These results are more evident than those found at 300 rpm.The calculated parameters for CF and RMS are read as CF0 =
20.58, CF1 = 19.47, CF3 = 17.9, and RMS0 = 0.0051 Pa,RMS1 = 0.0018 Pa, and RMS3 = 0.0030 Pa. The results ata speed of 700 rpm, as seen in Fig. 15, show that two peaks
108 International Journal of Acoustics and Vibration, Vol. 21, No. 1, 2016

S. Ulus, et al.: AN EXPERIMENTAL STUDY ON GEAR DIAGNOSIS BY USING ACOUSTIC EMISSION TECHNIQUE
Table 2. RMS and CF results of helical gears.
HELICAL GEAR RESULTS for HELICAL GEAR RESULTS forCRACKED TOOTH ROOT FAULT PITTING FAULT300 rpm 500 rpm 700 rpm 300 rpm 500 rpm 700 rpm
RMS0 0.043 0.0147 0.0319 0.0026 0.0036 0.0039RMS1 0.0067 0.0222 0.0249 0.0028 0.0045 0.0061RMS3 0.0069 0.0267 0.0463 0.0048 0.0056 0.0071CF0 22.07 21.98 24.4 20.25 18.7 17.8CF1 21.02 20.36 23.39 19.86 20.07 18.317CF3 20.97 23.77 22.3 18.8 21.1 18.14
Figure 12. Cracked tooth root fault for spur gear at 700 rpm rotation speedunder (a) no loaded condition, (b) 1 Nm loaded condition, and (c) 3 Nm loadedcondition.
are observed as sidebands of the meshing harmonics, and areevident without any loading. As confirmed from the figure, CFand RMS values are calculated as CF0 = 27.93, CF1 = 22.6,CF3 = 20.8, and RMS0 = 0.0275 Pa, RMS1 = 0.0019 Pa,and RMS3 = 0.0039 Pa. CF values indicate the peak levelof the fault signal. A load at the gear wheel plate increasesRMS values. For easy evaluations, the statistical results of CFand RMS values for a spur gear with a cracked tooth root andpitting faults are outlined in Table 3.
When analysing the results, it can be seen that CF and RMSvalues are related to damage severity in the gear unit. All CFvalues indicate the damage with regard to its high value, asdiscussed in work by Tan and Mba.8 RMS values show the ef-ficient value of the signal between undamaged and faulty con-ditions. From the results at the given operating time, it canbe seen that the greater the applied running speed, the greaterthe AE RMS value. Higher running speeds and loading condi-tions affect the RMS level of the signal increasingly. Besidesall these measurements, the maximum and average values ofthe signals are increased. In addition, the measurements werecarried out after the assembly of different gear types with dif-ferent faults in the experimental test rig. Measurements wererepeated five times for every gear type and condition. As seenfrom Fig. 10 — that is, a cracked tooth root fault for a spur gearat a rotation speed of 300 rpm — the dominant effect arises
Figure 13. Pitting fault for spur gear at 300 rpm rotation speed under (a) noloaded condition, (b) 1 Nm loaded condition, and (c) 3 Nm loaded condition.
from the undamaged condition of spur gear. This problem isprobably due primarily to sensitivity losses of assembly con-ditions, such as gear meshing characteristics, looseness, im-perfect alignments of the shaft, etc.8, 10, 16 By comparison withthe RMS results, CF values have an irregular change in case ofloading and running speed changes of the system. As shownin Eq. (2), the reason for this irregularity can arise from thehighest AE peak taken into account in the signal relative toRMS.23, 24 In detecting and diagnosing fault signals, RMS re-sults have been more indicative than CF values.
4. CONCLUSION
In this study, AE results obtained from the gearbox test sys-tem were analysed under different running speeds and loadingconditions for both spur and helical gears. AE data was takenin time domain and converted to frequency domain by usingFFT in order to clearly understand the occurrence of the faultlocation and its source.
Measurements were implemented by using an acoustic sen-sor near the meshing points of the gears without any contact tothe test system. The artificially created gear damages, such aspitting and cracks at the tooth roots, were apparent in the AEgraphs. At the meshing frequencies, AE peaks indicate the nor-mal condition of the gear. AE peaks observed near the mesh-ing harmonics, which are called sidebands, indicate the gear
International Journal of Acoustics and Vibration, Vol. 21, No. 1, 2016 109

S. Ulus, et al.: AN EXPERIMENTAL STUDY ON GEAR DIAGNOSIS BY USING ACOUSTIC EMISSION TECHNIQUE
Table 3. RMS and CF results of spur gears.
SPUR GEAR RESULTS for SPUR GEAR RESULTS forCRACKED TOOTH ROOT FAULT PITTING FAULT300 rpm 500 rpm 700 rpm 300 rpm 500 rpm 700 rpm
RMS0 0.00051 0.0037 0.0033 0.0023 0.0051 0.0275RMS1 0.0025 0.0069 0.0049 0.0014 0.0018 0.0019RMS3 0.0039 0.0068 0.0064 0.0015 0.0030 0.0039CF0 13.49 19.9 22.98 18.81 20.58 27.93CF1 22.23 20.5 20.74 18.9 19.47 22.59CF3 23.59 19.92 18.8 20.27 17.9 20.8
Figure 14. Pitting fault for spur gear at 500 rpm rotation speed under (a) noloaded condition, (b) 1 Nm loaded condition, and (c) 3 Nm loaded condition.
tooth damage, such as cracks and pitting faults. One of the sig-nificant observations was the direct relation between AE leveland loading conditions. From the statistical values, RMS ofthe SPL for both helical and spur gears is more consistent andsensitive. Increasing loading and running speed conditions forboth gear types caused a change in RMS levels. Also, CF wasmeasured at more than 6, and indicated the damage with itshigh value in all cases. CF shows the damage severity in com-parison with the changing RMS value of the signal. The RMSvalue of the sound signal changed with the loading conditionsat the given frequency range. The loading condition affectedthe SPL of the gear, and AE peaks were observed at a highersound level. For this reason, the increasing peak level/RMSratio indicates a bigger CF value, which shows the severity ofthe local fault. Corresponding to the running speed of the gear,in general cases, an increasing speed increases the SPL of thesignal. Gear defects, loading, and running speed increasinglyaffect the maximum and average values of the signal. All thesestatistical measurements confirm the existence of a fault in thegear system by comparing their reference value. Consideringthe gear types used in the measurements, it can be concludedthat sound levels at helical gear meshing points are clearer, andmaximum and average values of the fault signal are more ap-parent than that of spur gears.
Figure 15. Pitting fault for spur gear at 700 rpm rotation speed under (a) noloaded condition, (b) 1 Nm loaded condition, and (c) 3 Nm loaded condition.
ACKNOWLEDGEMENTS
This study is a part of the research project FBA-12-4111.The authors wish to express their thanks for financial supportprovided by the Scientific Research Projects Coordination Unitof Erciyes University, in carrying out this study.
REFERENCES1 Husin, S., Mba, D., and Raja Hamzah, R. I. Viability of
application of the acoustic emission (AE) technology forthe process and management of maintenance in industries:defect detection, on-line condition monitoring, diagnosticand prognostic tool, Proceedings of the International MultiConference of Engineers and Computer Scientists, 3, 978–988, (2010).
2 Singh, A., Houser, D. R., and Vijayakar, S. Detecting geartooth breakage using acoustic emission: a feasibility andsensor placement study, Journal of Mechanical Design, 21,587–593, (1999). http://dx.doi.org/10.1115/1.2829503.
3 Eftekharnejad, B. and Mba, D. Seeded faultdetection on helical gears with acoustic emis-sion, Applied Acoustics, 70, 547–555, (2009).http://dx.doi.org/10.1016/j.apacoust.2008.07.006.
110 International Journal of Acoustics and Vibration, Vol. 21, No. 1, 2016
S. Ulus, et al.: AN EXPERIMENTAL STUDY ON GEAR DIAGNOSIS BY USING ACOUSTIC EMISSION TECHNIQUE
4 Mba, D., Cooke, A., Roby, D., and Hewitt, G. De-tection of shaft-seal rubbing in large-scale power genera-tion turbines with acoustic emissions; case study, Pro-ceedings of Instution of Mechanical Engineers, Part A:Journal of Power and Energy, 218 (2), 71–81, (2004).http://dx.doi.org/10.1243/095765004773644076.
5 Metwalley, S. M., Hammad, N., and Abouel-Seoud, S. A.Vehicle gearbox fault diagnosis using noise measurements,International Journal of Energy and Environment, 2 (2),357–366, (2011).
6 Loutas, T. H., Kalaitzoglou, J., Sotiriades, G., Kayias,E., and Kostopoulos, V. Diagnosis of artificial geardefects on single stage gearbox using acoustic emission,Advanced Material Research, 13–14, 415–420, (2006).http://dx.doi.org/10.4028/www.scientific.net/amr.13-14.415.
7 Tan, C. K. and Mba, D. Correlation betweenacoustic emission activity and asperity contact dur-ing meshing of spur gears under partial elastohydrody-namic lubrication, Tribology Letters, 20 (1), (2005).http://dx.doi.org/10.1007/s11249-005-7793-1.
8 Tan, C. K. and Mba, D. Limitation of acousticemission for identifying seeded defects in gearboxes,Journal of Nondestructive Evaluation, 24 (1), (2005).http://dx.doi.org/10.1007/s10921-005-6657-9.
9 Al-Balushi, K. R. and Samanta, B. Gear fault diagnosis us-ing energy-based features of acoustic emission signals, Pro-ceedings of the Institution of Mechanical Engineers, PartI: Journal of Systems and Control Engineering, 216–249,(2002). http://dx.doi.org/10.1243/095965102320005418.
10 Tan, C. K. and Mba, D. Identification of acoustic emissionsource during a comparative study on diagnosis of a spurgearbox, Tribology International, 38, 469–480, (2005).http://dx.doi.org/10.1016/j.triboint.2004.10.007.
11 Belsak, A. and Flasker, J. Method for detect-ing fatigue cracks in gears, Theoretical and Ap-plied Fracture Mechanics, 46, 105–113, (2006).http://dx.doi.org/10.1016/j.tafmec.2006.07.002.
12 Belsak, A. and Flasker, J. Detecting cracksin the tooth root of the gears, EngineeringFailure Analysis, 14, 1466–1475, (2007).http://dx.doi.org/10.1016/j.engfailanal.2007.01.013.
13 Combet, F., Gelman, L., and La Payne, G. Novel detectionof local tooth damage in gears by the wavelet bicoherence,Mechanical Systems and Signal Processing, 26, 218–228,(2012). http://dx.doi.org/10.1016/j.ymssp.2011.07.002.
14 Raja Hamzah, R. I. and Mba, D. The influenceof operating condition on acoustic emission (AE)generation during meshing of helical and spurgear, Tribology International, 42, 3–14, (2009).http://dx.doi.org/10.1016/j.triboint.2008.06.003.
15 Baydar, N. and Ball, A. Detection of gear de-terioration under varying load conditions by usingthe instantaneous power spectrum, Mechanical Sys-tems and Signal Processing, 14 (6), 907–921, (2000).http://dx.doi.org/10.1006/mssp.1999.1281.
16 Baydar, N. and Ball, A. A comparative study of acous-tic emission and vibration signals in detection of gear fail-ures using Wigner Ville distribution, Mechanical Sys-tems and Signal Processing, 15 (6), 1091–1107, (2001).http://dx.doi.org/10.1006/mssp.2000.1338.
17 Dempsey, P. J. A comparison of vibration and oil debrisgear damage detection methods applied to pitting damage,NASA/TM-2000-210371, NASA Glenn Research Center,(2000).
18 Decker, H. J. Crack detection for aerospace quality spurgears, NASA/TM-2002-211492, NASA Glenn ResearchCenter, (2002).
19 Blunt, D. M. and Keller, J. A. Detection of fatigue crack ina UH-60A planet gear carrier using vibration analysis, Me-chanical Systems and Signal Processing, 20, 2095–2111,(2006). http://dx.doi.org/10.1016/j.ymssp.2006.05.010.
20 Guangzhong, C. Acoustical measurement and fan fault di-agnosis system based on LabVIEW, Practical Applicationsand Solutions Using LabVIEW Software, Folea S., Ed., In-Tech, (2011), 11, 229–252.
21 Miller, R. K. and Intire, P. Nondestructive Testing Hand-book, Vol. 5: Acoustic Emission Testing, American Societyfor Nondestructive Testing, (1987), 2nd edition.
22 Stewart, R. M. Some useful analysis techniques for gearboxdiagnostics, Technical Report MHM/R/10/77, Institute ofSound and Vibration Research, University of Southampton,(1977).
23 Dron J. P., Bolaers, F., and Rasolofondraibe, I. Improve-ment of the sensitivity of the scalar indicators (crest fac-tor, kurtosis) using a de-noising method by spectral sub-traction: application to the detection of defects in ball bear-ings, Journal of Sound and Vibration, 270, 61–73, (2004).http://dx.doi.org/10.1016/s0022-460x(03)00483-8.
24 Tandon, N. A comparison of some vibration pa-rameters for the condition monitoring of rolling ele-ment bearings, Measurement, 12, 285–289, (1994).http://dx.doi.org/10.1016/0263-2241(94)90033-7.
International Journal of Acoustics and Vibration, Vol. 21, No. 1, 2016 111