
AnElectronSpinResonanceStudyofNeoplasms*cancerres.aacrjournals.org/content/23/6_Part_1/833.full.pdf ·...
9
An Electron Spin Resonance Study of Neoplasms* D. W. NEBERTANDH. S. MASON (Deparimeni of BiOChemistry,University of OregonMediCa' &hool, Portland, Oregon) SUMMARY Twenty-nine types of mouse tumor and two normal mouse tissues were examined in the frozen state by electron spin resonance spectroscopy, and the redox states of some components were characterized. Intracellular organelles of mouse hepatoma and of normal mouse liver were separated by differential centrifugation and examined by elec tron spin resonance spectroscopy. The major difference between the subcellular com ponents of the normal and neoplastic cells detectable by this method involved a newly observedmicrosomal electrontransportsubstanceinsmooth- and rough-surfacedhepa toma microsomes. Important differences in respiratory biochem istry exist between cancers and the corresponding normal tissues. The differences must originate in the control of the oxidation-reduction state of cells, and any technic which can give new information about this state in normal and neoplastic cells may provide valuable insight into the problem. Elec tron spin resonance (ESR) spectroscopy is such a technic. ESR detects unpaired electrons such as exist in free radicals and paramagnetic states of the transition elements (13); consequently, it is a means of characterizing the kinds and concentra tions of substances containing unpaired electrons in tumors and normal tissues. Commoner and Ternberg have already ex amined neoplastic tissues with ESR spectroscopy (5). They found a â€oeremarkable absence of de tectable ESR signals in tumor tissue―which is also distinguished by â€oerelatively low or wholly unde tectable free radical contents― in contrast to normal tissues. These observations were made on tissues at room temperature, a technic having the advantage of direct observation of surviving cells but having the disadvantage of relatively low sensitivity compared with spectroscopy at low temperatures (13). In the present study we have examined 929types of mouse cancer with ESR spectroscopy at —160° C., in an attempt to characterize the oxida tion-reduction states of the tumors after rapid freezing. Only liver and cardiac muscle could be * This study was supported by grants from the American Cancer Society and the United States Public Health Service (A-971), to whom we are indebted. Received for publication December 17, 1962. used as a basis for comparison because of the size of homogeneous tissue sample required for ESR spectroscopy. In the case of liver and hepatoma we compared the properties of corresponding sub cellular organelles prepared by differential centrif ugation. MATERIALS AND METHODS The theory and practice of ESR spectroscopy and its application to biological systems have been described in detail elsewhere (6, 13). In brief, the sample is placed between the poles of an electro magnet and exposed to microwave radiation. Ab sorption of energy takes place when the resonance condition, hv = g@9H,is met, where h is Planck's constant, p is radiation frequency, @ is the Bohr magneton, H is the strength of the magnetic field in gauss, and g is a dimension-less constant which measures the effects of the molecular environment upon unpaired electrons in magnetic fields. In gen eral, g= 92.00928for a free electron and is close to 92.00for free radicals, but may extend from below 92to above 6for transition elements in paramagnet ic states. Absorption measurements are usually made at fixed radiation wavelengths by varying the magnetic field strength; the absorption â€oesig nals―are therefore presented as energy absorption as a function of magnetic field strength. The in strument used in the present study recorded the derivative of energy absorption with respect to field strength. We used a Varian V-4500 ESR spectrometer with 100-kc. field modulation, at modulation amplitudes between 8 and 16 gauss. Klystron fre quencies were determined with a Hewlett-Packard 833 on July 11, 2018. © 1963 American Association for Cancer Research. cancerres.aacrjournals.org Downloaded from
Transcript of AnElectronSpinResonanceStudyofNeoplasms*cancerres.aacrjournals.org/content/23/6_Part_1/833.full.pdf ·...
An Electron Spin Resonance Study of Neoplasms*
D. W. NEBERTANDH. S. MASON
(Deparimeni of BiOChemistry,University of OregonMediCa' &hool, Portland, Oregon)
SUMMARY
Twenty-nine types of mouse tumor and two normal mouse tissues were examined inthe frozen state by electron spin resonance spectroscopy, and the redox states of somecomponents were characterized. Intracellular organelles of mouse hepatoma and ofnormal mouse liver were separated by differential centrifugation and examined by electron spin resonance spectroscopy. The major difference between the subcellular components of the normal and neoplastic cells detectable by this method involved a newlyobserved microsomal electrontransportsubstanceinsmooth- and rough-surfacedhepatoma microsomes.
Important differences in respiratory biochemistry exist between cancers and the correspondingnormal tissues. The differences must originate inthe control of the oxidation-reduction state of cells,and any technic which can give new informationabout this state in normal and neoplastic cells mayprovide valuable insight into the problem. Electron spin resonance (ESR) spectroscopy is such a
technic. ESR detects unpaired electrons such asexist in free radicals and paramagnetic states ofthe transition elements (13); consequently, it is ameans of characterizing the kinds and concentrations of substances containing unpaired electronsin tumors and normal tissues.
Commoner and Ternberg have already examined neoplastic tissues with ESR spectroscopy(5). They found a “remarkable absence of de
tectable ESR signals in tumor tissue―which is alsodistinguished by “relatively low or wholly undetectable free radical contents― in contrast tonormal tissues. These observations were made ontissues at room temperature, a technic having theadvantage of direct observation of surviving cellsbut having the disadvantage of relatively lowsensitivity compared with spectroscopy at lowtemperatures (13).
In the present study we have examined 929typesof mouse cancer with ESR spectroscopy at—160°C., in an attempt to characterize the oxidation-reduction states of the tumors after rapidfreezing. Only liver and cardiac muscle could be
* This study was supported by grants from the American
Cancer Society and the United States Public Health Service(A-971), to whom we are indebted.
Received for publication December 17, 1962.
used as a basis for comparison because of the sizeof homogeneous tissue sample required for ESRspectroscopy. In the case of liver and hepatoma wecompared the properties of corresponding subcellular organelles prepared by differential centrifugation.
MATERIALS AND METHODS
The theory and practice of ESR spectroscopyand its application to biological systems have beendescribed in detail elsewhere (6, 13). In brief, thesample is placed between the poles of an electromagnet and exposed to microwave radiation. Absorption of energy takes place when the resonancecondition, hv = g@9H,is met, where h is Planck'sconstant, p is radiation frequency,@ is the Bohrmagneton, H is the strength of the magnetic fieldin gauss, and g is a dimension-less constant whichmeasures the effects of the molecular environmentupon unpaired electrons in magnetic fields. In general, g = 92.00928for a free electron and is close to92.00for free radicals, but may extend from below92to above 6 for transition elements in paramagnetic states. Absorption measurements are usuallymade at fixed radiation wavelengths by varyingthe magnetic field strength; the absorption “signals―are therefore presented as energy absorptionas a function of magnetic field strength. The instrument used in the present study recorded thederivative of energy absorption with respect tofield strength.
We used a Varian V-4500 ESR spectrometerwith 100-kc. field modulation, at modulationamplitudes between 8 and 16 gauss. Klystron frequencies were determined with a Hewlett-Packard
833
on July 11, 2018. © 1963 American Association for Cancer Research. cancerres.aacrjournals.org Downloaded from
834 Cancer Research Vol. 923, July 1963
K5392Bfrequency meter, and field strengths weremonitored with a Hewlett-Packard 5924C electronic frequency counter coupled to a protonresonance meter. The spectra shown in the figuresare derivative curves of the actual absorption,with magnetic field H always increasing from leftto right. The maximum and minimum slope positions of some of the spectra are reversed in phase,but this is unimportant. Instrumental responsetimes were set at 0.3 or 1.0 second, and the fieldwas scanned from 1000 to 4000 gauss. Purifiednitrogen passed through a heat-exchanger inliquid nitrogen kept the cavity temperature atabout —160°C. Quartz sample tubes were testedprior to use, to eliminate those giving ESRsignals in the absence of biological material.
The 929mouse tumors were obtained from theRoscoe B. Jackson Laboratories, Bar Harbor,Maine. Each type of cancer was freshly inoculatedsubcutaneously into three mice at Bar Harborwhich were then shipped by air on a schedule convenient to this laboratory. The tumors were allowed to mature, and when the mass was clearlyvisible the animal was sacrificed and the tumor dissected free and kept on ice. As much blood aspossible was removed, and the firmest, mostviable regions were dropped directly into liquidnitrogen. After being frozen the samples wererapidly weighed, then placed in a cold quartz ESRsample tube, which was kept immersed in liquidnitrogen to avoid any thawing of the sample. Theprocedure from decapitation of the mouse to immersion of the sample in liquid nitrogen took 3—S
minutes. The average weight of the tumor sampleswas 170 mg. This provided a very rough, qualitative comparison of the frozen tissues. Quantitativetechnics were employed for cellular subfractionsand are described below. The list of tumors andnormal tissues which were studied appears inTable 1.
Hepatoma BW 7756 in the C57/LJ mouse wasused for the preparation of cell particulates. Cellorganelles were prepared from the pooled tissuesof six to ten animals. Mitochondria were preparedby a modification of the method of Schneider (17)and examined in 0.925 M sucrose after repeatedcentrifugal washings. Rough- and smooth-surfacedmicrosomes (ribosome-containing and ribosomefree endoplasmic reticulum, respectively) were prepared by a modification of the method of Fouts(9),whichwasshownto produceessentiallyhomogeneous fractions by electron microscopy (192).Thevarious fractions were analyzed for protein (11),for total iron content (7), for pyridine hemochromogen (15), and for cytochrome b5 (10).
RESULTS AND DISCUSSION
Many substances of biological interest havebeen studied with ESR spectroscopy; for purposesof comparison, their characteristics are summarized here. Melanins have a narrow absorptionaround g = 92.00 (4, 14). Mitochondria from beefheart and other tissues have absorptions at g =1.94 and 92.00,probably due to non-heme iron associated with flavin or flavin semiquinone (92,3);absorption at g = 4.8, probably due to ferric iron(16) ; and absorption at g = 2.03 and 92.17,probably due to cupric copper in cytochrome oxidase(1). Smooth and rough microsomeshave beenfound to absorb at g = 1.91, 92.925,and 92.41,owingto the presence of an otherwise unidentified heme,microsomal Fee, and at g = 92.00owing either to aflavin or to another semiquinone (192). Hematincompounds have complex absorptions dependentupon their (high or low) spin states and may givesignals in the region of g = 6, 4, or 92(8). All theresonances cited here have been observed at temperatures of —100°C. or lower, with the exceptionof the melanin and free radical signals.
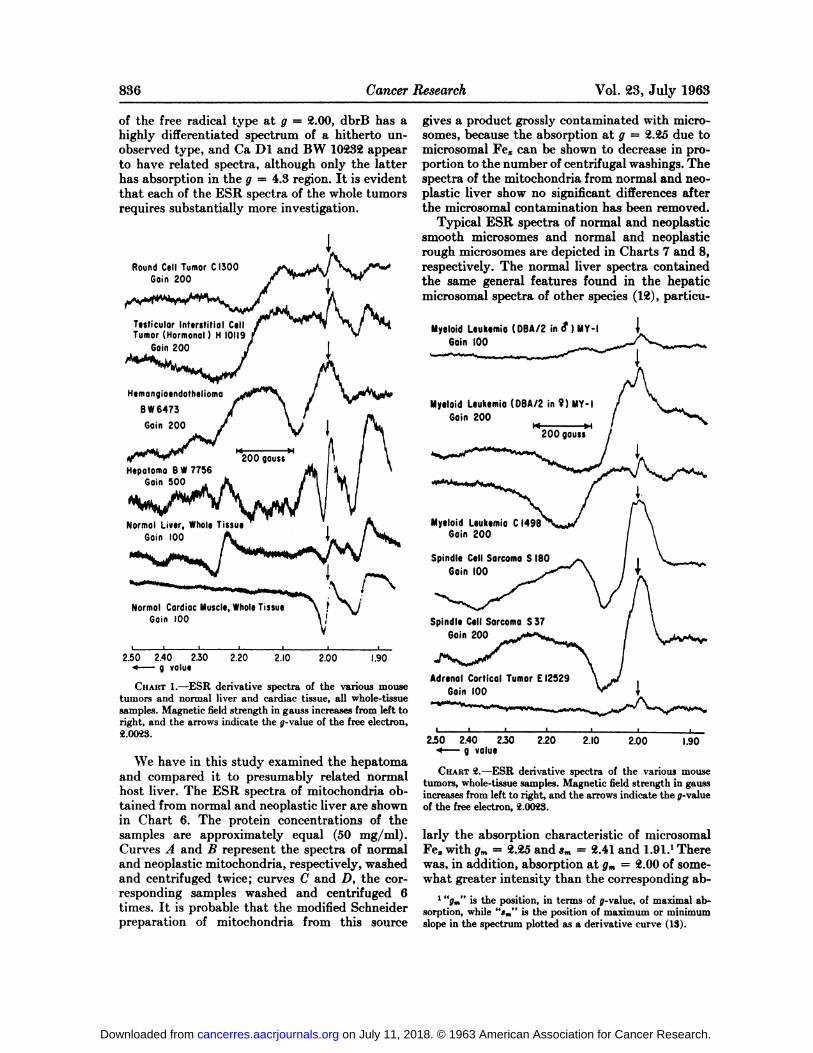
The ESR spectra of various whole tumor andwhole normal tissues are depicted in Charts 1—S.The comparison signals from normal liver andcardiac muscle are shown in Chart 1. The mousecardiac muscle has an ESR signal typical of hearttissue from other species and is primarily made upof absorptions from the components of mitochondria (92). Normal mouse liver gives a signalwhich is a summation of absorptions from mitochondria and microsomes, but in the hepatomaBW 7756 a weak mitochondrial absorption predominates, indicating a loss of paramagnetic substances, relatively greater for microsomes thanmitochondria. Without normal tissue with whichto compare the other tumors, it is difficult to generalize about characteristic differences between theESR spectra of normal and neoplastic wholetissue. However, certain observations can bemade: (a) all tissues, normal and neoplastic, haveabsorption in the region of g = 92at @@@16S0C., incontrast to their properties at room temperature(5) ; (b) the hemangioendothelioma (Chart 1), thespindle-cell sarcomas (Charts 92, 4), and theosteogenic sarcoma (Chart 4) are all characterizedby a fairly narrow, intense absorption in theregion of g = 92.03 possibly owing to cupric copper; (c) the melanomas (Charts 3, 4) show strongnarrow absorption at g = 92.00, almost certainlybecause of the presence of melanin ; (d) the mammary adenocarcinomas show markedly differentspectra (Chart 5). Mammary adenocarcinomaH 927192has a remarkably strong signal probably
on July 11, 2018. © 1963 American Association for Cancer Research. cancerres.aacrjournals.org Downloaded from
Cardiac muscleA/J, BALB/cJ,andC57/LJLiver
tissueA/J, C57BL/1OJ,129/J, andC57/LJ
TABLE 1
NoRMAL AND NEOPLASTIC WHOLE TIssuE STUDIED BY ESR SPECTROSCOPY
Name Bar Harbor classification Mouse strain
Neoplastic tissue
Mammary adenocarcinoma H 2712 C8H/HeJdbrB DBA/1JBW 11301 A/JBW 10232 C57BL/6JCa D 1 DBA/1JCa D 2 DBA/2JC3HBA C8H/HeJ
Melanoma 5-91 DBA/1JH-P BALB/CJB/16 C57BL/6J
Myeloid leukemia (DBA/2 in d') MY-i DBA/2(DBA/2 in @)MY-i DBA/2C 1498 C57BL/6J
Spindle-cell sarcoma 5-37 DBA/1JS-i80 BALB/cJSI A/J
Lymphatic leukemia P 1534 DBA/2J
Rhabdomyosarcoma BW 10139 CE/J
Osteogenic sarcoma T 283 AKR/J
Induced lymphosarcoma 6C3HED C8H/HeJ
Anaplastic carcinoma 15091A A/I
Ovarian granulosa-cell tumor E 1i731 A/HeJ
Ovarian granulosa-cell tumor (hormonal) H 4929 DBA/1J
Preputial gland tumor ESR 586 C57BL/6J
Round-cell tumor C 1300 A/J
Hemangioendothelioma BW 6473 129/J
Testicular interstitial-cell tumor (hormonal) H 10119 BALB/cJ
Adrenal cortical tumor E 12529 Co7BL/loJ
Hepatoma BW 7756 C57/LJ
Normal Tissues
on July 11, 2018. © 1963 American Association for Cancer Research. cancerres.aacrjournals.org Downloaded from
836 Cancer Research Vol. 923, July 1963
of the free radical type at g = 92.00, dbrB has ahighly differentiated spectrum of a hitherto unobserved type, and Ca Dl and BW 1092392appearto have related spectra, although only the latterhas absorption in the g = 4.3 region. It is evidentthat each of the ESR spectra of the whole tumorsrequires substantially more investigation.
2.50 2.40 2.30 2.204— 9 value
gives a product grossly contaminated with micro
somes, because the absorption at g = 92.925due tomicrosomal Fe@ can be shown to decrease in proportion to the number of centrifugal washings. Thespectra of the mitochondria from normal and neoplastic liver show no significant differences afterthe microsomal contamination has been removed.
Typical ESR spectra of normal and neoplasticsmooth microsomes and normal and neoplasticrough microsomes are depicted in Charts 7 and 8,respectively. The normal liver spectra containedthe same general features found in the hepaticmicrosomal spectra of other species (192), particu
2.50 2.40 2.30 2.204— g value
Round Cell Tumor C 300Gain200
NyeloidLeukemio(DBA/2 ind' ) NY-IGain 100
Normal CardiacMuscle,WholeTissueGain 00
2.10 200 .90
CHART i.—ESR derivative spectra of the various mouse
tumors and normal liver and cardiac tissue, all whole-tissuesamples. Magnetic field strength in gauss increases from left toright, and the arrows indicate the g-value of the free electron,2.0023.
We have in this study examined the hepatomaand compared it to presumably related normalhost liver. The ESR spectra of mitochondria obtamed from normal and neoplastic liver are shownin Chart 6. The protein concentrations of thesamples are approximately equal (SO mg/mi).Curves A and B represent the spectra of normaland neoplastic mitochondria, respectively, washedand centrifuged twice; curves C and D, the corresponding samples washed and centrifuged 6times. It is probable that the modified Schneiderpreparation of mitochondria from this source
AdrenalCorticalTumorE12529Gain 100
2.10 2.00 1.90
CHART 2.—ESR derivative spectra of the various mouse
tumors, whole-tissue samples. Magnetic field strength in gaussincreases from left to right, and the arrows indicate the g-valueof the free electron, 2.009.3.
larly the absorption characteristic of microsomalFe@with g,,@= 92.925and 3m 92.41and 1.91.' Therewas, in addition, absorption at gm 92.00of somewhat greater intensity than the corresponding ab
1 “ge―@ the position, in terms of g-value, of maximal ab
sorption, while “8@―is the position of maximum or minimumslope in the spectrum plotted as a derivative curve (18).
on July 11, 2018. © 1963 American Association for Cancer Research. cancerres.aacrjournals.org Downloaded from

2.10 2.00 1.90
CHART 3.—ESR derivative spectra of the various mousetumors, whole-tissue samples. Magnetic field strength in gaussincreases from left to right, and the arrows indicate theg-value of the free electron, 2.0028.
rough fraction, compared with the correspondingvalues for normal liver microsomes. In the neoplastic rough microsomes, the microsomal gm4.3 signal is l@ times greater, while the free radical
signal at gre 92.00is twice as large. The Sm 1.91signal of smooth hepatoma microsomes is one-thirdthat of the corresponding signal from smooth
NEBERT AND MASON—An ESR Study of Neoplasms 837
sorption observed with purified rabbit liver microsomes (192). Absorption at gm 4.8 is seen in therough microsomes, known to be associated withhigh-spin (ionic) iron (16).
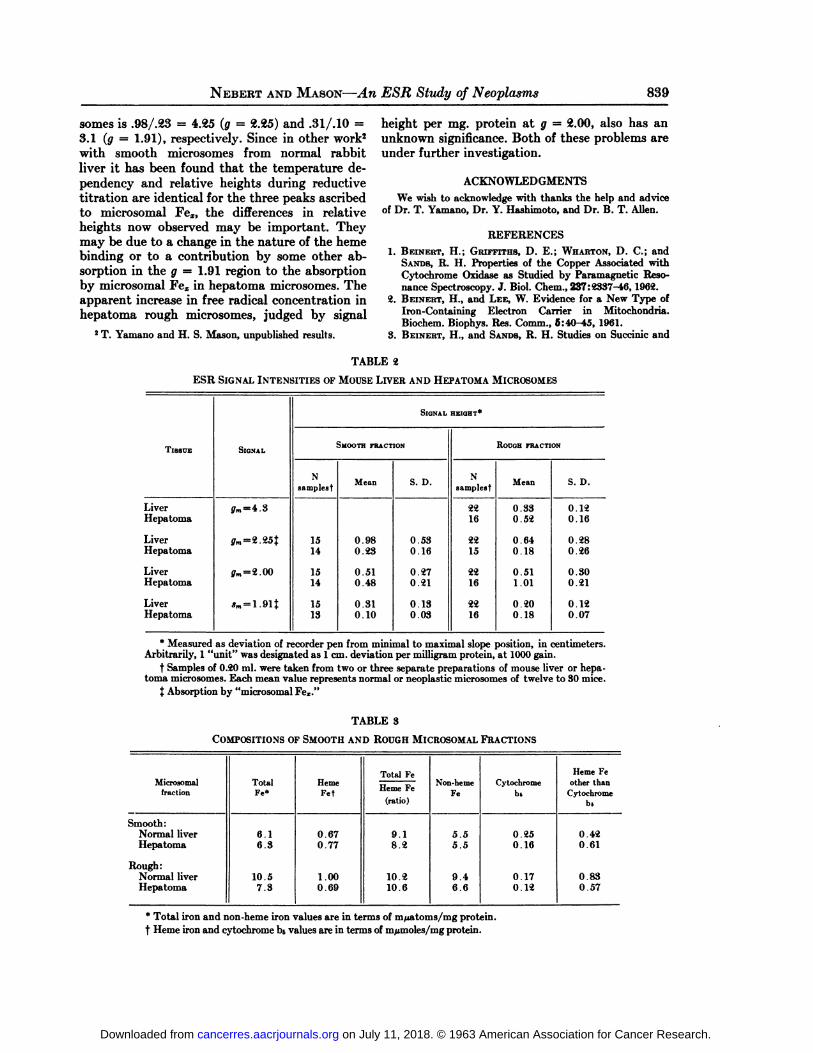
The changes of signal height per milligrammicrosomal protein at the various g values aregiven in Table 92.One “unit―of signal height wasarbitrarily chosen as 1 cm. of recorder pen deviation at 1000 gain. Protein concentration of thesamples ranged between 35 and 70 mg/mi.
The hepatoma microsomal Fe@as measured bythe g = 92.925signal is 4@ times decreased in thesmooth microsomes, and 3@times decreased in the
PreputialGlandTumorESR586
OvarianGronulosaCellTumor(Hormonal)H4929
Gain 200
microsomes of normal liver. Other differences arenot significant at the P = .01 level of confidence.
The concentrations of several microsomal components determined by analysis are given inTable 8. The differences between the ESR signalsof microsomes from normal and neoplastic livercannot be correlated with analytical differences for
MelanomaH-P
SpindleCell SarcomaSI
@ tJ@
ticLeukemiaPl53@@@Gain200
RhobdomyosarcomoBW10139Gain200
11
430 4.004— 9 value
OsteogenicSarcomaT283Gain200 500 gauss
OvarianGronulosa—CellTumorE11731Gain200
I I I I I I I I
3.00 2.50 2.30 2.lO2.00 1.90
CHART 4.—ESR derivative spectra of the various mousetumors, whole-tissue samples. Magnetic field strength in gaussincreases from left to right, and the arrows indicate theg-value of the free electron, 2.009.3.
total iron, non-heme iron, pyridine hemochromogen, or cytochrome b5, per milligram particle protein. Cytochrome b5 concentration is depressed inhepatoma microsomes, but cytochrome b5 doesnot give an ESR signal under the conditions of ourexperiments. Heme iron other than that in cytochrome b5 has a variable concentration in normaland neoplastic smooth microsomes and normaland neoplastic rough microsomes, and this unaccounted-for heme iron does not correspond tothe large concentration decrease seen at g,,, =92.925in the hepatoma microsomes. In addition, theproportional change of signal at g = 1.91 and atg = 92.925in normal and hepatoma smooth micro
2.50 2.40 2.30 2.204— 9 value
on July 11, 2018. © 1963 American Association for Cancer Research. cancerres.aacrjournals.org Downloaded from

MammaryAdenocarcinomaH2712Gain 100
MammaryAdenocarcinomaCaDl
MammaryAdenocarcinomaBW11301
Mammary Adenocarcinoma C 3 HBA
Gain 200
I I I I I I I I
3.00 2.50 2.30 2.102.00 1.90
CHART 5.—ESR derivative spectra of the various mouse
tumors, whole-tissue samples. Magnetic field strength in gaussincreases from left to right, and the arrows indicate theg-value of the free electron, 2.009.8.
gm:2.25 gm:2.OOSm1.91
@Ir
CHART 7.—ESR derivative spectra of normal (A) and neo
plastic (B) mouse liver smooth microsomes. Protein concentration in these two samples is about equal, around 50 mg/ml.Magnetic field strength increases from left to right, andg-values of importance are designated by arrows.
MammaryAdenocarcinomaBW10232Gain200
II
4.304.004— g value
9m4.3
B4
A
gauss
g@ :2.25 gm:2.00
CHART 6.—ESR derivative spectra of mitochondrial fractions, of normal mouse liver (A) and of hepatoma (B) washedtwice with isotonic sucrose; ESRderivative spectra of the samenormal liver mitochondria (C) and hepatoma mitochondria(D) after six such washings. Magnetic field strength increasesfrom left to right, and the g-values of importance are designated by arrows. Protein concentrations of the four samples areall about 50 mg/mi.
CHART 8.—ESR derivative spectra of normal (A) and neoplastic (B) mouse liver rough microsomes. Protein concentration in these two samples is about equal, around 55 mg/mi.Magnetic field strength increases from left to right, andg-values of importance are designated by arrows.
gm'2.0O @m:1.91
@IP'Ir
on July 11, 2018. © 1963 American Association for Cancer Research. cancerres.aacrjournals.org Downloaded from
TISSUESIGNALSIGNAL
HEIGHT*SMOOTh
FRACTIONROUGHFRACTIONN
samplestMeanS.D.NsamplestMeanS.D.Liver
Hepatoma
LiverHepatoma
LiverHepatoma
LiverHepatomag,,=4.3
gm=2.25@
gm=2.00
8m=1.9i@15
14
1514
15130.98
0.23
0.510.48
0.310.100.53
0.16
0.270.21
0.130.0322
16
29.15
29.16
22160.33
0.52
0.640.18
0.511.01
0.200.180.12
0.16
0.280.26
0.300.21
0.120.07
MicrosomalfractionTotal FeHeme FetTotal
Fe
Heme Fe
(ratio)Non-hemeFeCytochrome b@Heme
Feother than
Cytochromeb@Smooth:
NormalliverHepatoma
Rough:NormalliverHepatoma6.1
6.3
10.57.30.67
0.77
1.000.699.1
8.2
10.210.65.5
5.5
9.46.60.25
0.16
0.170.120.42
0.61
0.830.57
NEBERT AND MASON—An ESR Study of Neoplasms 839
somes is .98/.923 = 4.925 (g = 92.925)and .31/.lO =3.1 (g = 1.91), respectively. Since in other work2with smooth microsomes from normal rabbitliver it has been found that the temperature dependency and relative heights during reductivetitration are identical for the three peaks ascribedto microsomal Few, the differences in relativeheights now observed may be important. Theymay be due to a change in the nature of the hemebinding or to a contribution by some other absorption in the g = 1.91 region to the absorptionby microsomal Fe@in hepatoma microsomes. Theapparent increase in free radical concentration inhepatoma rough microsomes, judged by signal
2 T. Yamano and H. S. Mason, unpublished results.
height per mg. protein at g = 92.00, also has anunknown significance. Both of these problems areunder further investigation.
ACKNOWLEDGMENTS
We wish to acknowledge with thanks the help and adviceof Dr. T. Yamano, Dr. Y. Hashimoto, and Dr. B. T. Allen.
REFERENCES
1. BEINERT, H. ; Giuirs'rrns, D. E.; WHARTON, D. C.; andSANDS, R. H. Properties of the Copper AssOciated with
Cytochrome Oxidase as Studied by Paramagnetic Resonance Spectroscopy. J. BioL Chem., 237:9.837-46, 1962.
2. BEINERT,H., and LEE, W. Evidence for a New Type ofIron-Containing Electron Carrier in Mitochondria.Biochem. Biophys. Res. Comm., 5:40—45, 1961.
3. BELNERT,H., and S@rws, R. H. Studies on Succinic and
TABLE 9.
ESR [email protected] OF MOUSE LIVER AND HEPATOMA MIcRosoMEs
* Measured as deviation of recorder pen from minimal to maximal slope position, in centimeters.
Arbitrarily, 1 “unit―was designated as 1 cm. deviation per milligram protein, at 1000 gain.t Samplesof0.20ml.weretakenfromtwoorthreeseparatepreparationsofmouseliverorhepa.
toma microsomes. Each mean value represents normal or neoplastic microsomes of twelve to SO mice.@ Absorption by “microsomalFee.―
TABLE 3
COMPoSITIoNS OF SMOOTH AND ROUGH MICROSOMALFRACTIONS
* Total iron and non-heme iron values are in terms of mpatoms/mg protein.
t Hemeironandcytochromeb5valuesareintermsofm@smoles/mgprotein.
on July 11, 2018. © 1963 American Association for Cancer Research. cancerres.aacrjournals.org Downloaded from

840 Cancer Research
DPNH Dehydrogenase Preparations by ParamagneticResonance (ESR) Spectroscopy. Biochem. Biophys. Res.Com.,3:41—46,1960.
4. COMMONER,B.; HEIsir.,J. I.; Lxppzr'@co@n@,B. B.; Noasnaa,R. E.; PASSONNEAF,J. V.; and TOwNSEND,J. BiologicalActivity of Free Radicals. Science, 126:57—68, 1957.
5. COMMONER,B., and TERNBERG,J. L Free Radicals inSurviving Tissues. Proc. NatL Acad. Sci. (U.S.), 47:1374—84, 1961.
6. Co@saioNna,B.; TOWNSEND,J.; and@ G. E. FreeRadicals in Biological Materials. Nature, 174:689—91,1954.
7. Dozo, K. A., and ZIEGLER, D. M. Simplified Methods forthe Estimation of Iron in Mitochondria and SubmitochondrialFractions.Arch.Biochem. Biophys.,97:87—40,1962.
8. EHRENBERG, A. Electron Spin Resonance Absorption bySome Hemoproteins. Arkiv. Kemi, 19:119—28, 1962.
9. Fou'rs, J. R. The Metabolism of Drugs by Subfractions ofHepatic Microsomes. Biochem. Biophys. Res. Comm.,6:873—78,1961.
10.GARFINKEL,D. Studieson Pig LiverMicrosomes.I.
Enzymic and Pigment Composition of Different Microsomal Fractions. Arch. Biochem. Biophys., 77:498—509,1958.
11. GORNALL,A. G.; BARDAWILL,C. J.; and DAvm, M. M.Determination of Serum Proteins by Means of the BiuretReaction. J. Biol. Chem., 177:751—66, 1949.
12. HASHIMOTO,Y.; YAMANO,T.; and MAtsoN, H. S. An ESRStudy of Microsomal Electron Transport. J. Biol. Chem.,237:PC8848—44,1969..
13. INGRAM,D. W. E. Free Radicals as Studied by ElectronParamagnetic Resonance. London: Butterworths, 1958.
14. MASON,H. S.; INGRAM,D. W. E.; and ALLEN,B. T. TheFree Radical Property of Melanins. Arch. Biochem.Biophys., 88:29.5—30,1960.
15. PAUL,K. G.; THEORELL,H.; and AKnaoN,A. The MolarLight Absorption of Pyridine Ferroprotoporphyrin (Pyridine Haemochromogen). Acta Chem. Scand., 7:1264-87,1958.
16.SANDS,R. H. ParamagneticResonanceAbsorptioninGlass. Phys. Res., 99:1222—26, 1955.
17. SCHNEIDER, W. C. Intracellular Distribution of Enzymes.III. The Oxidation of Octanoic Acid by Rat Liver Fractions. J. Biol. Chem., 176:259—06,1948.
Vol. 923, July 1963
on July 11, 2018. © 1963 American Association for Cancer Research. cancerres.aacrjournals.org Downloaded from
1963;23:833-840. Cancer Res D. W. Nebert and H. S. Mason An Electron Spin Resonance Study of Neoplasms
Updated version
http://cancerres.aacrjournals.org/content/23/6_Part_1/833
Access the most recent version of this article at:
E-mail alerts related to this article or journal.Sign up to receive free email-alerts
Subscriptions
Reprints and
To order reprints of this article or to subscribe to the journal, contact the AACR Publications
Permissions
Rightslink site. Click on "Request Permissions" which will take you to the Copyright Clearance Center's (CCC)
.http://cancerres.aacrjournals.org/content/23/6_Part_1/833To request permission to re-use all or part of this article, use this link
on July 11, 2018. © 1963 American Association for Cancer Research. cancerres.aacrjournals.org Downloaded from


![The Destructive Effect of Radiation on Lymphatic Tissue1cancerres.aacrjournals.org/content/canres/26/6_Part_1/1211.full.pdf · [CANCER RESEARCH 26 Part 1, 1211-1220,June 1966] The](https://static.fdocuments.in/doc/165x107/5b5b6be87f8b9ab8578e024a/the-destructive-effect-of-radiation-on-lymphatic-cancer-research-26-part-1.jpg)


![VirologieStudiesinHumanLeukemiaandLymphoma:The …cancerres.aacrjournals.org/content/28/7/1311.full.pdf · [CANCERRESEARCH28,1311-1318,July1968] VirologieStudiesinHumanLeukemiaandLymphoma:The](https://static.fdocuments.in/doc/165x107/5b98f37b09d3f219118d06a7/virologiestudiesinhumanleukemiaandlymphomathe-cancerresearch281311-1318july1968.jpg)