Andrew Applegate NEFMC Staff Whiting PDT ChairWhiting PDT prepares Draft SAFE Report and recommends...
18
Andrew Applegate NEFMC Staff Whiting PDT Chair Scientific and Statistical Committee August 26, 2014
Transcript of Andrew Applegate NEFMC Staff Whiting PDT ChairWhiting PDT prepares Draft SAFE Report and recommends...

Andrew Applegate
NEFMC Staff
Whiting PDT Chair
Scientific and
Statistical Committee
August 26, 2014

Specifications Package
ABC/ACL adjustments for 2015-2017
NEFSC prepares update/operational assessment using previously approved methods from benchmark: Jul 2014
GARFO prepares report on ACL accounting and fishery performance: Jul 2014
Whiting PDT prepares Draft SAFE Report and recommends specifications: Aug 2014
2

Specifications Package
ABC/ACL adjustments for 2015-2017
SSC review and approval of ABC recommendations
Aug 25-26
Committee and advisors identify management adjustment options’
Sep 2014
Council approval of proposed management adjustments
Sep 30 – Oct 2
3

Specifications Package
ABC/ACL adjustments for 2015-2017
Staff and PDT prepares draft specifications document
Council approves final measures and specifications document
Nov 18-20
Council submits final document for NMFS review
Early January 2015
Adjustments become effective
May 1, 2015
4

Small-mesh Multispecies
ACL Framework
5

Draft SAFE Report Fishery Performance Report
Document Chapters
Summary of recommended ABC specifications
ABC accounting for FY 2012 and 2013
Fishery trends and performance
Stock assessment results
Stock assessment input data and assumptions
FW22 Initiation, Council Meeting 6/24/2010 6

Fishery Performance
Southern Stock Catch Composition
Silver and Red Hake catches are substantially less than the ACLs
Silver and offshore hake: 89% Landings; 11% Discards
2013 catch declined 12%
Small mesh fishery accounts for 79% of discards
Red Hake: 45% Landings; 55% Discards
2013 catch declined 5%
Small mesh fishery accounts for 85% of discards
7

Fishery Performance
Southern Stock Catch Composition
8

Fishery Performance
Southern Stock Catch Composition
FY 2012
FY 2013
9
Pounds Metric tons Percentage of ACL (32,295 mt)
Southern whiting landings 11,113,309 5,041 15.6%
Southern whiting research landings 39,257 18 0.1%
Southern whiting state-permitted only vessel landings 911,212 413 1.3%
Southern whiting estimated discard 2,256,994 1,024 3.2%
Southern whiting recreational landings (MRIP) 0 0 n/a
Southern whiting catch* 14,320,773 6,496 20.1%
* Total catch does not include recreational landings as the Annual Catch Limit does not include recreational landings.
Pounds Metric tons Percentage of ACL (32,295 mt)
Southern whiting landings 11,264,810 5,110 15.8%
Southern whiting state-permitted only vessel landings 30,927 14 0.0%
Southern whiting estimated discard 1,371,754 622 1.9%
Southern whiting recreational landings (MRIP) 650 0 n/a
Southern whiting catch* 12,623,590 5,726 17.7%
* Total catch does not include recreational landings as the Annual Catch Limit does not include recreational landings.

Fishery Performance
Southern Stock Catch Composition
FY 2012
FY 2013
10
Pounds Metric tons Percent of ACL (3,096 mt)
Southern red hake landings 1,280,755 581 18.8%
Southern red hake research landings 7,562 3 0.1%
Southern red hake state-permitted only vessel landings 88,211 40 1.3%
Southern red hake estimated discard 1,163,991 528 17.1%
Southern red hake recreational catch (MRIP) 85,779 39 n/a
Southern red hake catch* 2,540,519 1,152 37.2%
* Total catch does not include recreational landings as the Annual Catch Limit does not include recreational landings.
Pounds Metric tons Percent of ACL (3,096 mt)
Southern red hake landings 1,079,335 490 15.8%
Southern red hake state-permitted only vessel landings 4,644 2 0.1%
Southern red hake estimated discard 1,338,767 607 19.6%
Southern red hake recreational catch (MRIP) 163,837 74 n/a
Southern red hake catch* 2,422,746 1,099 35.5%
* Total catch does not include recreational landings as the Annual Catch Limit does not include recreational landings.

Fishery Performance
Southern Stock Sources of Discards
FY 2013 discards
11
Whiting Red hake
Discards, mt Ave D/Kall Discards, mt Ave D/Kall
Otter Trawl 572 3.3% 540 2.9%
lg 78 0.8% 21 0.2%
sm 494 2.5% 519 2.7%
Scallop Dredge 23 0.1% 43 0.2%
na 23 0.1% 43 0.2%
Shrimp Trawl 23 2.5% 25 2.7%
na 23 2.5% 25 2.7%
Sink, Anchor, Drift Gillnet 2 0.1% 0 0.0%
lg 2 0.1% 0 0.0%
xlg 0 0.0% 0 0.0%
Scallop Trawl 1 0.4% 0 0.1%
na 1 0.4% 0 0.1%
Otter Trawl, Haddock Separator 0 0.4% 0 0.0%
lg 0 0.4% 0 0.0%
Mid-water Trawl, Paired and Single 0 0.0% 0 0.0%
na 0 0.0% 0 0.0%
Total 621 6.9% 608 5.9%

Fishery Performance
Northern Stock Catch Composition
Silver hake
Catches are substantially less than ACL
2013 catch declined 21%
84% Landings; 16% Discards
Small mesh fishery accounts for 17% of discards
Red hake
Catches are higher than the ACL and ABC.
Danger of overfishing
Narrow buffer for scientific uncertainty
2013 catch declined 6%
32% Landings; 68% Discards
Small mesh fishery accounts for 65% of discards
12

Fishery Performance
Northern Stock Catch Composition
13

Fishery Performance
Northern Stock Catch Composition
FY 2012
FY 2013
14
Pounds Metric tons Percentage of ACL (12,518 mt)
Northern silver hake commercial landings 4,200,989 1,906 15.2%
Northern silver hake research landings 1 0 0.0%
Northern silver hake state-permitted only vessel landings 31,547 14 0.1%
Northern silver hake estimated discard 615,554 279 2.2%
Northern silver hake recreational landings (MRIP) 15,774 7 n/a
Northern silver hake catch* 4,848,091 2,199 17.6%
Pounds Metric tons Percentage of ACL (12,518 mt)
Northern silver hake commercial landings 3,160,615 1,434 11.5%
Northern silver hake state-permitted only vessel landings 63,863 29 0.2%
Northern silver hake estimated discard 599,370 272 2.2%
Northern silver hake recreational landings (MRIP) 99,099 45 n/a
Northern silver hake catch* 3,823,848 1,734 13.9%
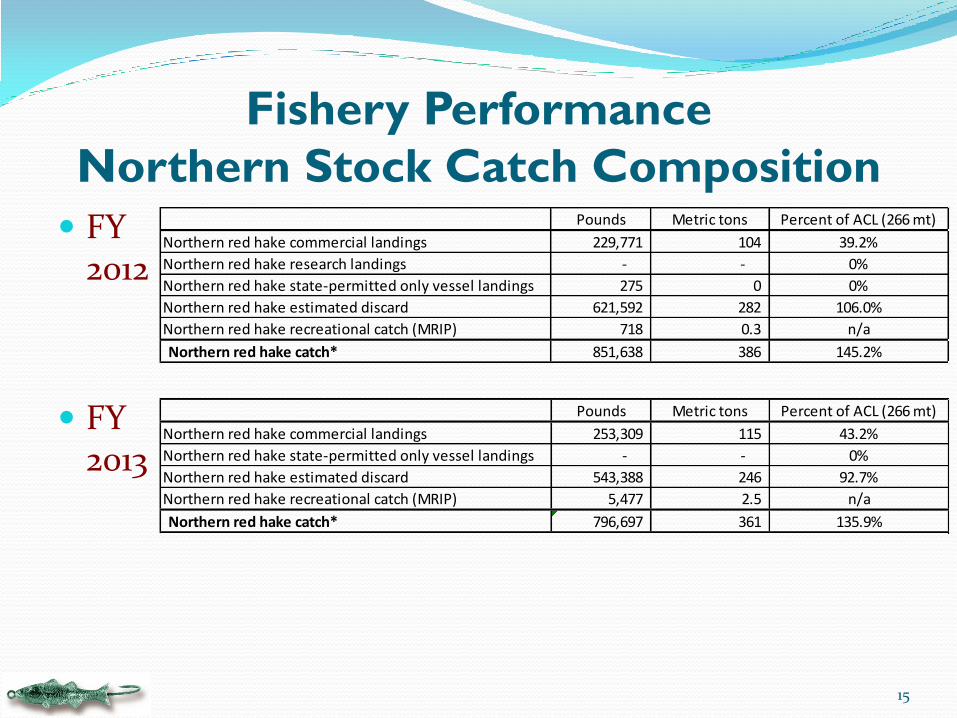
Fishery Performance
Northern Stock Catch Composition
FY 2012
FY 2013
15
Pounds Metric tons Percent of ACL (266 mt)
Northern red hake commercial landings 229,771 104 39.2%
Northern red hake research landings - - 0%
Northern red hake state-permitted only vessel landings 275 0 0%
Northern red hake estimated discard 621,592 282 106.0%
Northern red hake recreational catch (MRIP) 718 0.3 n/a
Northern red hake catch* 851,638 386 145.2%
Pounds Metric tons Percent of ACL (266 mt)
Northern red hake commercial landings 253,309 115 43.2%
Northern red hake state-permitted only vessel landings - - 0%
Northern red hake estimated discard 543,388 246 92.7%
Northern red hake recreational catch (MRIP) 5,477 2.5 n/a
Northern red hake catch* 796,697 361 135.9%
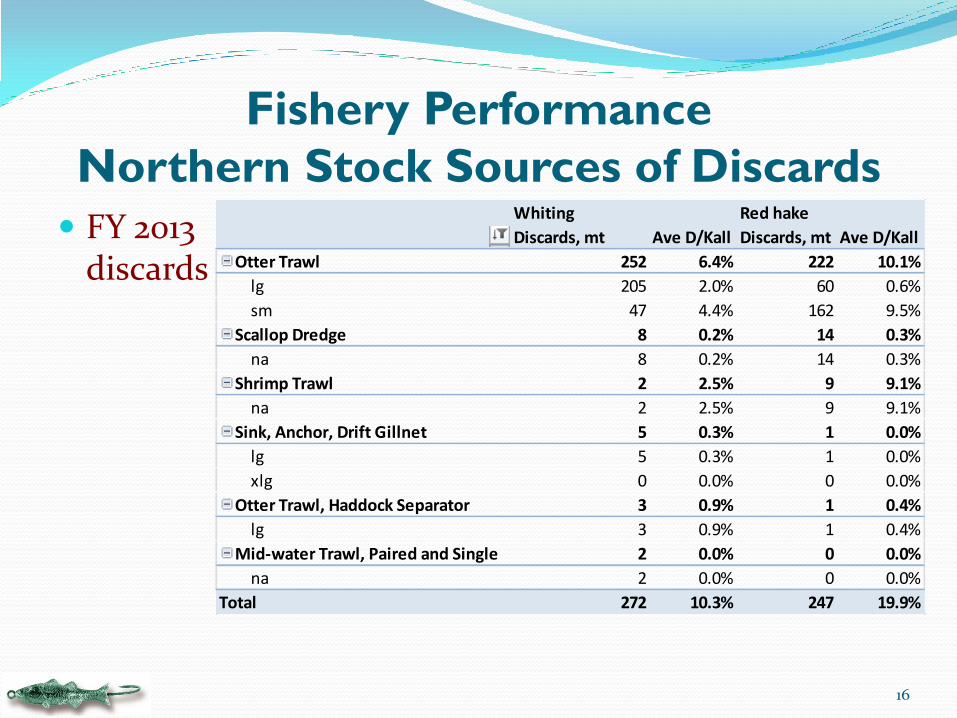
Fishery Performance
Northern Stock Sources of Discards
FY 2013 discards
16
Whiting Red hake
Discards, mt Ave D/Kall Discards, mt Ave D/Kall
Otter Trawl 252 6.4% 222 10.1%
lg 205 2.0% 60 0.6%
sm 47 4.4% 162 9.5%
Scallop Dredge 8 0.2% 14 0.3%
na 8 0.2% 14 0.3%
Shrimp Trawl 2 2.5% 9 9.1%
na 2 2.5% 9 9.1%
Sink, Anchor, Drift Gillnet 5 0.3% 1 0.0%
lg 5 0.3% 1 0.0%
xlg 0 0.0% 0 0.0%
Otter Trawl, Haddock Separator 3 0.9% 1 0.4%
lg 3 0.9% 1 0.4%
Mid-water Trawl, Paired and Single 2 0.0% 0 0.0%
na 2 0.0% 0 0.0%
Total 272 10.3% 247 19.9%

Operational assessment Update existing model with new data
Northern and Southern silver hake
Survey data through Fall 2013
Catches through CY 2013
Not overfished; overfishing not occurring
Southern red hake
Survey data through Spring 2013
Catches through CY 2013
Not overfished; overfishing not occurring
Northern red hake
Survey data through Spring 2014
Catches through CY 2013
Not overfished; overfishing IS occurring
17

Operational assessment
Issues addressed
Stock status in 2013
Estimate OFL
Estimate scientific uncertainty profile
Estimate ABCs at various levels of estimated scientific uncertainty and probabilities of overfishing
Silver hake: 25th percentile
Southern silver hake ABC adjusted to account for mixed catch of offshore hake
Red hake: 40th percentile
Red hake stock structure
Potential survey bias for red hake due to fixed gear in the Gulf of Maine.
18