ander vitreus Coregonus clupeaformis - …ion.uwinnipeg.ca/~moodie/Theses/Watchorn2004.pdf · 1...
35
Which mothers make the best eggs? Fatty acid profiles in the ova of walleye, Sander vitreus, and lake whitefish, Coregonus clupeaformis. Kristen Elise Watchorn Supervisor: Dr Murray Wiegand A thesis submitted in partial fulfillment of the Honours Thesis 05.4111/6 Course Department of Biology The University of Winnipeg 2004
Transcript of ander vitreus Coregonus clupeaformis - …ion.uwinnipeg.ca/~moodie/Theses/Watchorn2004.pdf · 1...

Which mothers make the best eggs?
Fatty acid profiles in the ova of
walleye, Sander vitreus,
and
lake whitefish, Coregonus clupeaformis.
Kristen Elise Watchorn
Supervisor: Dr Murray Wiegand
A thesis submitted in partial fulfillment of
the Honours Thesis 05.4111/6 Course
Department of Biology
The University of Winnipeg
2004
Abstract
Evidence from aquaculture shows that the size of the lipid reserve and the
profile of fatty acids in teleost fish eggs both play roles in determining
whether embryos survive and how they develop. Previous studies have
found correlations in some teleosts between maternal characteristics and
the relative proportions of certain structurally important fatty acids,
especially the essential fatty acids (EFAs) which embryos cannot
synthesise de novo. Walleye and lake whitefish are important food fishes,
so knowledge of whether females of a particular age or size are optimal
for producing viable eggs has implications in fishery and ecosystem
management. This study compared the age, mass, fork length and
condition factor of female whitefish and walleye to the mass, lipid mass,
and profile of fatty acids of the eggs they lay. Lipids were isolated from
homogenised roe, and the methyl esters of their fatty acids analysed by
gas chromatography. It was determined that EFAs within walleye eggs
are influenced by maternal length and mass. No correlation was seen
with respect to maternal age or egg mass. Whitefish eggs, however, were
not greatly influenced by maternal characteristics. The only noted
correlation was that docosahexænoic acid, one particular EFA, tends to
be more abundant in eggs of older females.
ii

Acknowledgements
Many individuals were instrumental in the production of this thesis, and
deserve recognition.
Firstly, I want to thank Dr Johnston for supplying me with my walleye and
whitefish egg samples and much of the data I required.
Dr Moodie deserves many thanks for always making sure I had the right
information, and for continually making himself available for all sorts of
panicky thesis related concerns.
I want to thank my advisory committee members, Dr Vanderwel and
Nancy Loadman, for their help, insight, and suggestions along the way.
I also need to thank my Gene for being an impartial critic and for his role
in keeping my stress levels manageable.
And most of all I owe a huge debt of gratitude to Dr Wiegand for his
guidance, for his direction, for his patience, for his bad jokes, and
especially for his optimism and faith in me.
Thank you all.
iii

Table of Contents
Abstract ................................................................................................................... ii
Acknowledgements.............................................................................................. iii
Table of Contents .................................................................................................. iv
List of Tables.............................................................................................................v
List of Figures...........................................................................................................vi
Introduction .............................................................................................................1
Methods ...................................................................................................................5
Field Sampling...................................................................................5
Extraction...........................................................................................6
Saponification and Methylation ....................................................7
Chromatography .............................................................................9
Determination of Egg Lipid Mass .................................................11
Statistical Analyses .........................................................................12
Results .....................................................................................................................13
Interspecies Comparison ..............................................................13
Walleye ............................................................................................13
Whitefish...........................................................................................21
Hatching ..........................................................................................21
Discussion...............................................................................................................23
Conclusions ...........................................................................................................27
References ............................................................................................................28
iv

List of Tables
Table 1: Comparing Bay of Quinte walleye and whitefish mean values for
the relative amounts of several major fatty acids in ova, ±
standard deviation. The most important structurally important
fatty acids are shown in bold type. ..................................................14
Table 2: Results of regression of proportions for individual fatty acids and
fatty acid ratios in ova against the maternal fork length, total
maternal mass, maternal somatic mass, and maternal condition
factor of Bay of Quinte walleye. Statistically significant
correlations (those where p < 0.05) are shown in bold type. .......20
v

List of Figures
Figure 1: Chromatogram obtained from the lipids of a sample of walleye
eggs. The large first peak is a result of the solvent, and BHT, the
antioxidant, accounts for the smaller peak at 5.765 min. Other
peaks correspond to fatty acids, as labelled. ................................15
Figure 2: Chromatogram obtained from the lipids of a sample of whitefish
eggs. The large first peak is a result of the solvent, and BHT, the
antioxidant, accounts for the smaller peak at 3.677 min. Other
peaks correspond to fatty acids, as labelled. ................................16
Figure 3: Walleye egg lipid content versus egg dry mass. The trend line
was fitted by least squares regression. Summarised statistics are
shown.....................................................................................................17
Figure 4: Arcsine transformed percentage of walleye fatty acids as
arachidonic acid (AA) versus maternal fork length. The trend line
was fitted by least squares regression. Summarised statistics are
shown.....................................................................................................19
Figure 5: Arcsine transformed percentage of whitefish egg fatty acids as
docosahexænoic acid (DHA) versus maternal age. The trend
line was fitted by least squares regression. Summarised statistics
are shown..............................................................................................22
vi

1
Introduction
Teleost fish embryos receive their nutrition from the protein and lipid
reserves in the egg. This lipid is both catabolised for energy production
and incorporated into cell membranes in the developing fish. All fatty
acids are used for fuel, but certain fatty acids are especially important
structurally. Five fatty acids in particular have been described as having
key structural functions in fish: arachidonic acid [20:4(n-6) - AA],
eicosapentænoic acid [20:5(n-3) - EPA], docosahexænoic acid [22:6(n-3)
- DHA], palmitic acid [16:0], and oleic acid [18:1(n-9)]† (Wiegand, 1996).
AA, EPA, and DHA are termed essential fatty acids: Fish cannot synthesise
these polyunsaturates de novo, so they must be provided to the embryos
in the egg lipid reserves (Henderson et al, 1995). AA and EPA are
quantitatively important components in phospholipids. They are also the
precursors of the eicosanoids, a group of intra- and extracellular chemical
messengers that include the prostaglandins and thromboxane (Tocher,
2003). In mammals, prostaglandins are known to modulate blood
pressure, contraction of smooth muscle and inflammation, while
thromboxane stimulates the aggregation of platelets and the constriction
of blood vessels, and is therefore instrumental in hæmostasis (Soberman
† Fatty acids are designated a:b(n-x), where a is the number of carbon atoms, b is the number of methylene-interrupted double bonds, and (n-x) indicates the position of the first double bond relative to the methyl end of the molecule.
2
and Christmas, 2003). Fish prostaglandins may have similar functions
(Tocher 2003); they also play a role in reproduction, in the production of
steroid hormones and the development of the gonads (Izquierdo et al,
2001).
DHA is also an important component of phospholipids, especially in neural
tissue in the retina and brain (Wiegand, 1996; Tocher, 2003). Deficiencies
of DHA have been shown to cause behavioural abnormalities which
negatively affect survival of the larvæ (Henderson et al, 1995; Sargent,
1995).
Palmitic and oleic acids can be synthesised by the developing fish from
other carbon sources; though they are typically abundant in eggs, it is not
necessary that they be provided in the lipid reserve. Both have important
structural roles, and therefore are of interest in terms of egg quality.
Palmitic acid is most commonly found in the sn-1† position of
phospholipids. The double bond of oleic acid is at the ideal point in the
chain to add maximum fluidity to membranes, and is very effective when
inserted into the sn-1 position during acclimation to cold (Wiegand, 1996).
Evidence from aquaculture research shows that the profile of fatty acids
in fish eggs play a role in determining whether the embryos survive and
† In glycerophospholipids, the phosphate group is on stereospecifically numbered (sn) carbon 3, while fatty acids fill the sn-1 and sn-2 positions.

3
how they develop (Moodie et al, 1989; Henderson et al, 1995; Sargent,
1995; Wiegand, 1996; Czesny et al, 1999). It also seems reasonable that a
larger store of lipid food in the egg would increase the chances of
survival. There may be, however, a trade-off for the female. A greater
amount of lipid or more superior fatty acid profile invested in the roe may
mean greater survival for the embryos, but might come at a greater cost
to her own well being. Schwalme (1994) determined there is a trade-off
faced by female pike between their essential fatty acids requirements for
over-wintering, and the ideal essential fatty acid content of the egg. It is
conceivable that females of a greater size or with greater lipid reserves
may be better equipped to produce eggs that are larger, or contain
more lipid, or have superior fatty acid profiles. It is worth investigating,
then, which maternal characteristics influence egg quality.
Correlations between maternal characteristics and fatty acid profiles
have been studied in the eggs of fish such as the walleye, Sander vitreus.
Wiegand et al (2004) showed, for example, that larger females tend to
produce eggs with a more desirable profile of essential fatty acids. It is
unknown whether other species show this trend.
The lake whitefish, Coregonus clupeaformis, has not been as well studied
in this regard. This is the first study in which relationships between egg fatty
acids and maternal characteristics have been investigated. The whitefish

4
is an important food fish, so knowledge of whether whitefish females of a
certain age or size are optimal for producing viable eggs has implications
in fishery management and ecosystem management. As well, there exists
a small Manitoban caviar industry utilising whitefish roe, so egg lipid
profiles are of interest from a human nutrition perspective.
This study expands on the work of Wiegand et al (2004) in searching for
correlations between walleye maternal characteristics and the
abundance in the egg of some structurally important fatty acids.
Additional maternal parameters are available for this sample of walleye
than had been available for previous studies. A preliminary investigation
into whether whitefish follow any of the same trends has also been
conducted, and a comparison made between the fatty acid profiles of
the two fishes. Finally, an attempt was made to determine whether any
combination of egg or maternal traits influence egg hatching success in
walleye.
5
Methods
Field Sampling:
Whitefish and walleye eggs used in this study were obtained by Dr T.A.
Johnston, of Fisheries and Oceans Canada, Burlington. Eggs were held at
-70°C until shipped on dry ice to the University of Winnipeg, where they
were again stored at -70°C until use.
The spawning whitefish females were captured from the Bay of Quinte on
Lake Ontario in November 2002. A sample of eggs was obtained, and
maternal characteristics, including fork length, total body mass and
somatic mass (total body mass less gonad mass) were measured.
Condition factor (the ratio of somatic mass in grams to the cube of fork
length in centimetres) was calculated. Age at capture was determined
by opercles. Mass per egg was also determined after oven drying by
Fisheries and Oceans.
Twenty-five whitefish were originally sampled; however, during shipping to
Manitoba, the dry ice had completely sublimed, although eggs were
apparently still frozen on arrival. Difficulties were experienced in obtaining
the proper alkalinity for saponification, and large quantities of unidentified
high molecular weight peaks were found in gas chromatograms of
6
several samples. As a result, data from the eggs of only 13 whitefish could
be utilised in this study.
Nineteen walleye were sampled from the same location on Lake Ontario
in summer 2003. Similar maternal characteristics were measured and a
sample of eggs obtained. Subsamples of these eggs were fertilised with
sperm from males of the same population, and eggs were allowed to
hatch in Heath trays at the Fisheries and Oceans facility. The proportion of
eggs that hatched was then calculated.
Extraction:
The procedure of Folch et al (1957) was used to extract the lipids from the
eggs. A subsample of approximately 0.5g of frozen eggs was weighed,
then immediately placed into a 15mL Ten Broeck homogenising tube
containing 10mL 2:1 chloroform:methanol†. Eggs were homogenised with
20 strokes of the homogeniser, then the suspension was poured through
chloroform-rinsed filter paper into a 60mL separatory funnel. The
homogeniser was rinsed with another 10mL of the chloroform:methanol
extraction solvent, which was also poured through the filter into the
separatory funnel. The filtrate was washed with 5mL 0.88% potassium
chloride solution. The separatory funnel was shaken vigourously, covered
with aluminium foil, and left overnight to facilitate separation into two
† All solvents described were of HPLC grade from EM Science.

7
phases. The lower phase contained the lipid extract, and the next
morning it was collected into a labelled 15mL test tube. Approximately
1.5mL of a 0.2% solution of butylated hydroxytoluene (BHT – an
antioxidant) in chloroform was added before the tube was filled with
nitrogen and capped.
Saponification and Methylation:
Three millilitres of lipid extract, containing roughly 6mg lipid, was dried
under nitrogen in a 37°C water bath, and the lipids were then redissolved
in about six drops of toluene and 2.5mL ethanol. After vortexing,
potassium hydroxide was added. To saponify walleye lipids, 130μL 33%
KOH was used. It was determined that whitefish required more base, so
0.66mL 50% KOH was used instead. The tube was flushed with nitrogen,
capped, and set in the bath to saponify at 37°C overnight.
The next morning, after removal from the water bath, 2.5mL distilled water
was added (1.8mL in the case of whitefish), and the pH tested with
indicator paper to ensure alkalinity. To remove non-saponifiable lipids, the
samples were washed four times with petroleum ether, each time having
the ether phase removed after one minute of vortexing. Then, 0.4mL 6M
hydrochloric acid was added. The pH was again tested, this time to
ensure acidity. Four more petroleum ether extractions were performed.
8
The petroleum ether extracts containing the fatty acids were combined in
a new, labeled 15mL tube.
To methylate the fatty acids, the solvent was evaporated completely
under nitrogen, and 3mL of 14% borontrifluoride in methanol (Pierce
Chemicals) was immediately injected into the tube. The sample was then
vortexed, filled with nitrogen and capped, before being placed in a 60°C
water bath. After exactly nine minutes it was removed to cool.
Next, the sample was pipetted into a 125mL separatory funnel. The 15mL
tube from whence the sample came was rinsed with 30mL hexanes,
which was also added to the separatory funnel. Two washes of 20mL
saturated sodium chloride solution were performed. After each salt wash,
the lower aqueous phase was discarded. The upper organic phase was
then collected into a 40mL tube. Any aqueous phase accidentally
transferred to the new tube was removed by pipette, and the sample was
further dried by vortexing with anhydrous sodium sulphate. Finally, the
fatty acid methyl esters in hexanes were transferred to a new 15mL tube
and concentrated somewhat under nitrogen. The tube was topped up
with chloroform and stored under nitrogen in the freezer until such time as
it could be analysed by gas chromatography.
9
Chromatography:
Prior to gas chromatography, authenticity of fatty acid methyl ester
preparations were verified by thin layer chromatography (TLC). TLC was
also used to confirm that no free fatty acids, the result of lipolytic
processes, were to be found in the original lipid extracts, and to ensure
that no desirable lipids were extracted with the non-saponifiables in the
saponification procedure. Between 100μL and 200μL of those solutions in
question were spotted onto a 10cm•10cm•200μm Whatman LHPKF Silica
gel 60A thin layer plate, and run with a solvent solution composed of an
80:20:1 ratio of hexanes:ether:acetic acid. Once dry, the plates were
placed in a tank with iodine to visualise the lipid bands (Moodie et al,
1989).
For analysis by gas chromatography, the fatty acid methyl ester sample
was concentrated under nitrogen, and transferred into a 0.3mL amber
Reactivial. The remaining liquid was evaporated under a stream of
nitrogen, and the fatty acid methyl esters were redissolved in 300μL 3:1
hexane:ethanol. The Reactivial was filled with nitrogen and capped.
Dr M.D. Wiegand conducted the gas chromatography using the
procedure first developed by Moodie et al (1989). A Varian 3300 flame
ionization gas chromatography system, linked to a personal computer
equipped with the Varian Star Chromatography version 5.5 data system,

10
was used to separate fatty acid methyl esters on a 30m, 0.25mm bore
capillary column coated with a 0.25μm film of Durabond 225. The
temperature programme for the analysis of walleye samples consisted of
a hold at 150°C for 5 minutes, a climb from 150 to 215°C at a rate of
2.5°C/min, and finally a hold at 215°C for 17 minutes. For whitefish, the
temperature programme was modified to begin with a hold at 170°C for 5
minutes. The hydrogen carrier flow was 35cm/s, and the injector split ratio
was 40:1.
Walleye egg lipid fatty acids have previously been identified using
authentic primary standards and other techniques (Moodie et al, 1989;
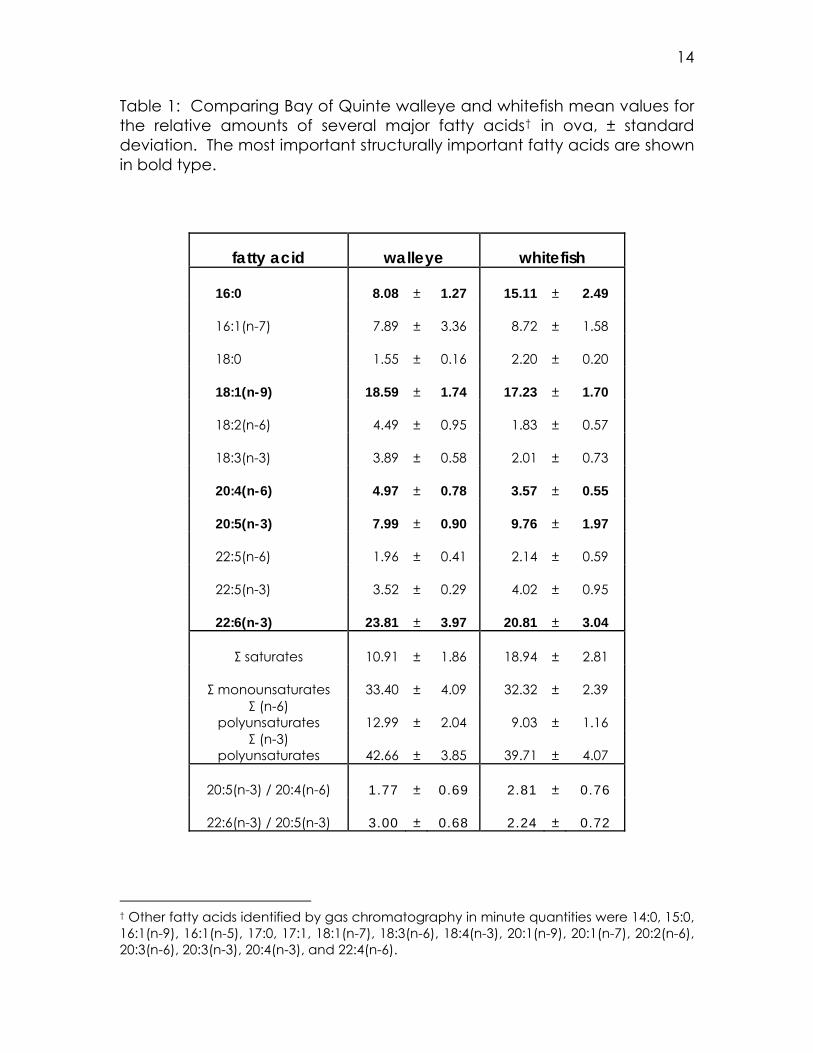
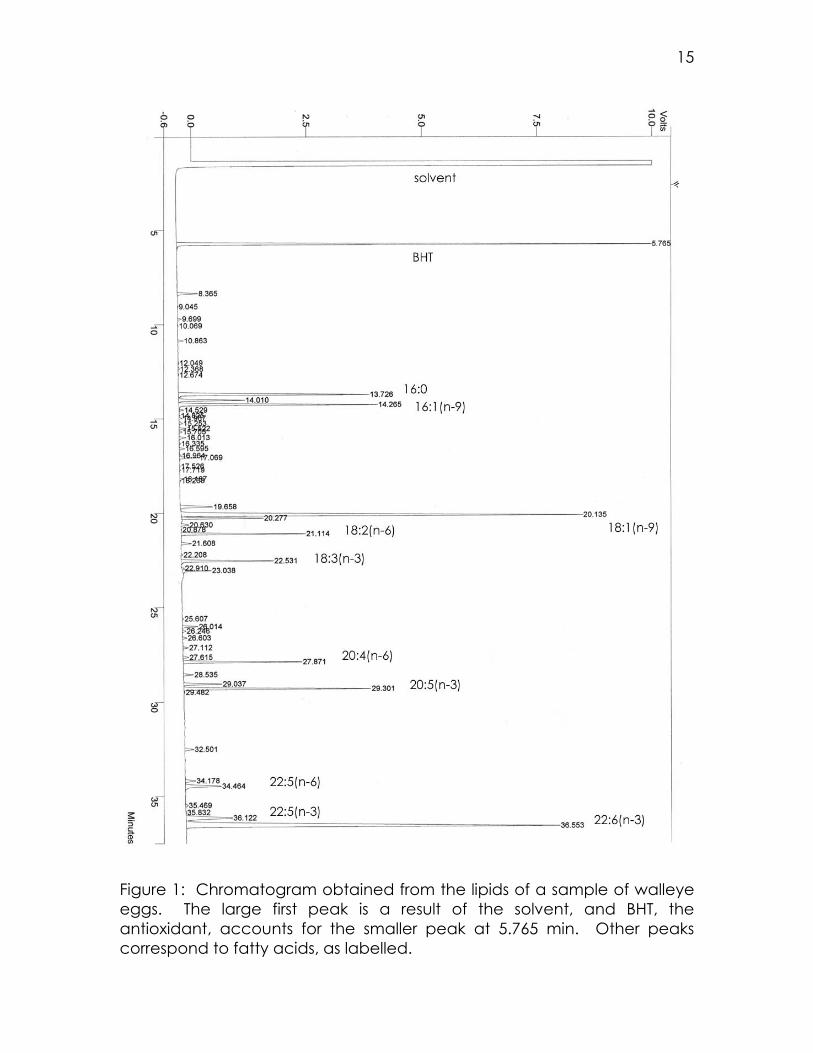
Wiegand et al, 2004). Peaks on the chromatograms were identified as
corresponding to a particular fatty acid by matching retention times. The
area under the curve of a fatty acid’s peak is proportional to the amount
of that fatty acid present. Figures 1 and 2 show representative whitefish
and walleye fatty acid chromatograms. The relative proportion of each
fatty acid was calculated by the data system, and the proportions of the
identified fatty acids normalised to 100% before further analysis. Two to
four chromatograms were obtained from each sample, so the mean and
standard deviation of the relative proportion of each fatty acid was
calculated.
11
Determination of Egg Lipid Mass:
To calculate the mass of lipid per egg, subsamples of about one gram of
frozen walleye eggs were placed into 50mL beakers, and covered with
perforated Parafilm. The beakers were placed into a desiccator and the
eggs were then lyophilised in a vacuum of 25 μmHg at -50°C in a
Labconco freeze-drier for 25 hours. For each fish, thirty intact eggs
(selected under a dissecting microscope) were homogenised using the
procedure previously described, with the exception that no BHT solution
was added. The solvents were evaporated completely under nitrogen,
and redissolved in 10mL chloroform. Two hundred microlitres were
pipetted into each of two replicate 15mL tubes. The charring assay
procedure of Marsh and Weinstein (1966) was performed to estimate lipid
mass. Two millilitres concentrated sulphuric acid was added to each
tube. Tubes were capped with marbles and heated at 180°C for exactly
15 minutes, after which the acid was diluted twice with 3mL of distilled
water. After a slow but thorough mixing, they were analysed
spectrophotometrically at 375nm. A standard curve was plotted using
tripalmitin solutions of known concentration, and a conversion factor of
0.92682 was used to convert from the tripalmitin to walleye lipid mass
equivalents (Wiegand et al, 2004).
12
Statistical Analyses:
Egg lipid masses, and arcsine transformed means of the relative
proportions of fatty acids of interest, were regressed against the known
maternal characteristics using Microsoft Excel. The arcsine transformation
is commonly used for the means of percentages and proportions: it
compresses values in the middle of the range while stretching values at
the extremes (Sokal and Rohlf, 1995). A backward elimination regression,
with hatching frequency as a dependent variable and 10 of the other
measured or calculated maternal or egg parameters as independent
variables, was obtained using the Statistical Package for the Social
Sciences software.
13
Results
Interspecies Comparison:
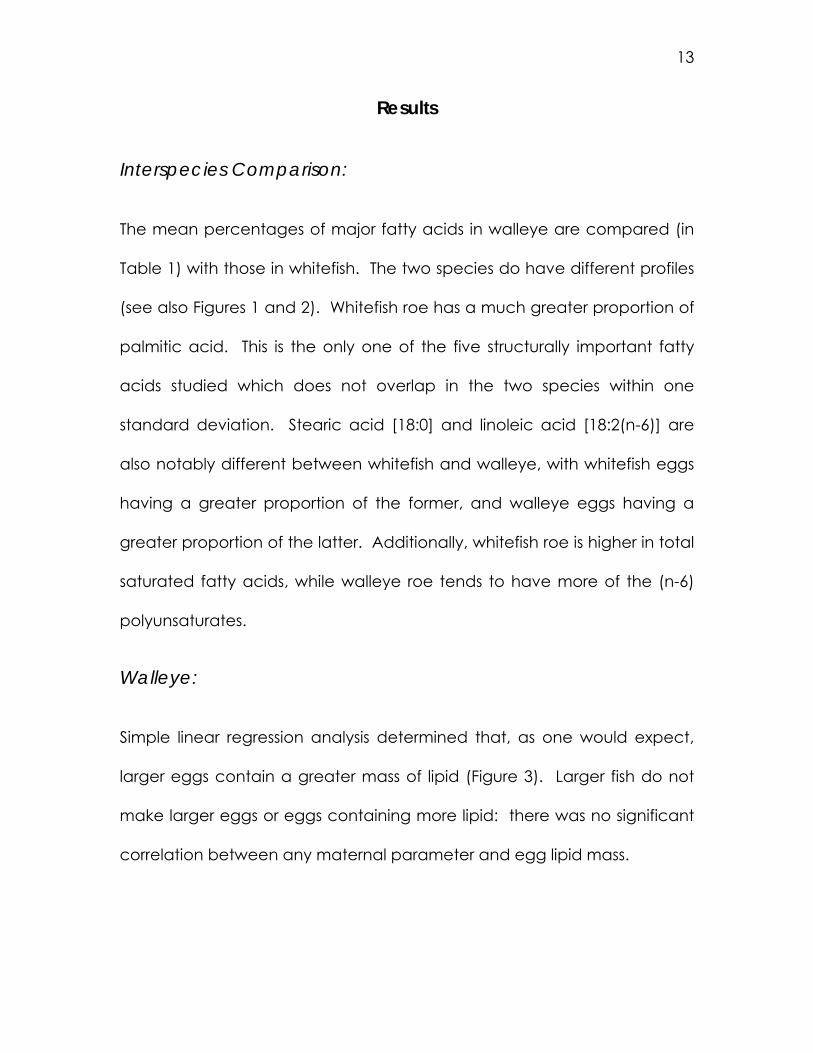
The mean percentages of major fatty acids in walleye are compared (in
Table 1) with those in whitefish. The two species do have different profiles
(see also Figures 1 and 2). Whitefish roe has a much greater proportion of
palmitic acid. This is the only one of the five structurally important fatty
acids studied which does not overlap in the two species within one
standard deviation. Stearic acid [18:0] and linoleic acid [18:2(n-6)] are
also notably different between whitefish and walleye, with whitefish eggs
having a greater proportion of the former, and walleye eggs having a
greater proportion of the latter. Additionally, whitefish roe is higher in total
saturated fatty acids, while walleye roe tends to have more of the (n-6)
polyunsaturates.
Walleye:
Simple linear regression analysis determined that, as one would expect,
larger eggs contain a greater mass of lipid (Figure 3). Larger fish do not
make larger eggs or eggs containing more lipid: there was no significant
correlation between any maternal parameter and egg lipid mass.
14
Table 1: Comparing Bay of Quinte walleye and whitefish mean values for the relative amounts of several major fatty acids† in ova, ± standard deviation. The most important structurally important fatty acids are shown in bold type.
fatty acid walleye whitefish
16:0 8.08 ± 1.27 15.11 ± 2.49
16:1(n-7) 7.89 ± 3.36 8.72 ± 1.58
18:0 1.55 ± 0.16 2.20 ± 0.20
18:1(n-9) 18.59 ± 1.74 17.23 ± 1.70
18:2(n-6) 4.49 ± 0.95 1.83 ± 0.57
18:3(n-3) 3.89 ± 0.58 2.01 ± 0.73
20:4(n-6) 4.97 ± 0.78 3.57 ± 0.55
20:5(n-3) 7.99 ± 0.90 9.76 ± 1.97
22:5(n-6) 1.96 ± 0.41 2.14 ± 0.59
22:5(n-3) 3.52 ± 0.29 4.02 ± 0.95
22:6(n-3) 23.81 ± 3.97 20.81 ± 3.04
Σ saturates 10.91 ± 1.86 18.94 ± 2.81
Σ monounsaturates 33.40 ± 4.09 32.32 ± 2.39 Σ (n-6)
polyunsaturates 12.99 ± 2.04 9.03 ± 1.16 Σ (n-3)
polyunsaturates 42.66 ± 3.85 39.71 ± 4.07
20:5(n-3) / 20:4(n-6) 1.77 ± 0.69 2.81 ± 0.76
22:6(n-3) / 20:5(n-3) 3.00 ± 0.68 2.24 ± 0.72
† Other fatty acids identified by gas chromatography in minute quantities were 14:0, 15:0, 16:1(n-9), 16:1(n-5), 17:0, 17:1, 18:1(n-7), 18:3(n-6), 18:4(n-3), 20:1(n-9), 20:1(n-7), 20:2(n-6), 20:3(n-6), 20:3(n-3), 20:4(n-3), and 22:4(n-6).
15
Figure 1: Chromatogram obtained from the lipids of a sample of walleye eggs. The large first peak is a result of the solvent, and BHT, the antioxidant, accounts for the smaller peak at 5.765 min. Other peaks correspond to fatty acids, as labelled.
16
Figure 2: Chromatogram obtained from the lipids of a sample of whitefish eggs. The large first peak is a result of the solvent, and BHT, the antioxidant, accounts for the smaller peak at 3.677 min. Other peaks correspond to fatty acids, as labelled.

17
F = 15.41p = 0.0011
y = 227.58x + 66.721R2 = 0.4755
150
200
250
300
350
400
0.70 0.80 0.90 1.00 1.10 1.20
egg dry mass (mg)
egg
lipid
con
tent
(ug)
Figure 3: Walleye egg lipid content versus egg dry mass. The trend line was fitted by least squares regression. Summarised statistics are shown.

18
Significant relationships were found between the fork length of walleye
and the relative abundances of essential fatty acids. The proportions of
AA (Figure 4) and DHA both increase with fork length. The DHA:EPA ratio
increases, while the EPA:AA ratio decreases, with fork length. The same
trends observed with regard to fork length can also be seen with regard
to mass (both total and somatic). The percentages of AA and DHA
increase with mass, as does the DHA:EPA ratio, while the EPA:AA ratio
decreases (Table 2).
Because the abundance of essential fatty acids in eggs was related to
both maternal length and mass, it would be expected that similar trends
would be seen between essential fatty acids and condition factor. Not
surprisingly, the abundance of AA increased, the ratio of DHA to EPA
increased, and the ratio of EPA to AA decreased with an increase in
condition factor. In addition, it was found that the abundance of EPA
decreased significantly with an increase in condition factor (Table 2).
Although the highly unsaturated, essential fatty acids showed trends in
relation to maternal mass, length and condition, the same was not true for
the other fatty acids studied. Relative abundance of palmitic acid and
oleic acid did not correlate to any maternal parameter measured. In
addition, there was no statistically significant relationship found between
maternal age and the abundance of any fatty acid studied.

19
F = 8.67p = 0.0091
y = 0.0119x + 4.9388R2 = 0.3377
8
9
10
11
12
13
14
15
500 550 600 650 700 750 800
fork length (mm)
arcs
ine
trans
form
ed p
erce
ntag
e A
A_
Figure 4: Arcsine transformed percentage of walleye fatty acids as arachidonic acid (AA) versus maternal fork length. The trend line was fitted by least squares regression. Summarised statistics are shown.
20
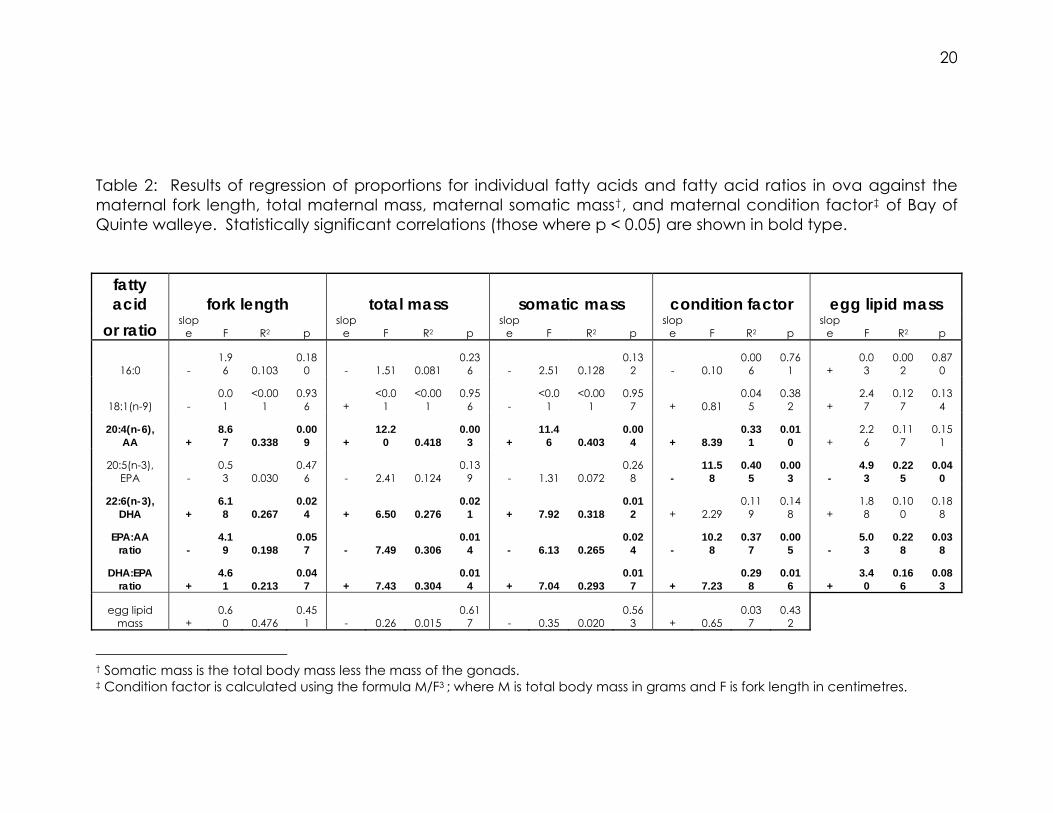
Table 2: Results of regression of proportions for individual fatty acids and fatty acid ratios in ova against the maternal fork length, total maternal mass, maternal somatic mass†, and maternal condition factor‡ of Bay of Quinte walleye. Statistically significant correlations (those where p < 0.05) are shown in bold type.
fatty acid fork length total mass somatic mass condition factor egg lipid mass
or ratio slop
e F R2 p slop
e F R2 p slop
e F R2 p slop
e F R2 p slop
e F R2 p
16:0 - 1.96 0.103
0.180 - 1.51 0.081
0.236 - 2.51 0.128
0.132 - 0.10
0.006
0.761 +
0.03
0.002
0.870
18:1(n-9) - 0.01
<0.001
0.936 +
<0.01
<0.001
0.956 -
<0.01
<0.001
0.957 + 0.81
0.045
0.382 +
2.47
0.127
0.134
20:4(n-6), AA +
8.67 0.338
0.009 +
12.20 0.418
0.003 +
11.46 0.403
0.004 + 8.39
0.331
0.010 +
2.26
0.117
0.151
20:5(n-3), EPA -
0.53 0.030
0.476 - 2.41 0.124
0.139 - 1.31 0.072
0.268 -
11.58
0.405
0.003 -
4.93
0.225
0.040
22:6(n-3), DHA +
6.18 0.267
0.024 + 6.50 0.276
0.021 + 7.92 0.318
0.012 + 2.29
0.119
0.148 +
1.88
0.100
0.188
EPA:AA ratio -
4.19 0.198
0.057 - 7.49 0.306
0.014 - 6.13 0.265
0.024 -
10.28
0.377
0.005 -
5.03
0.228
0.038
DHA:EPA ratio +
4.61 0.213
0.047 + 7.43 0.304
0.014 + 7.04 0.293
0.017 + 7.23
0.298
0.016 +
3.40
0.166
0.083
egg lipid mass +
0.60 0.476
0.451 - 0.26 0.015
0.617 - 0.35 0.020
0.563 + 0.65
0.037
0.432
† Somatic mass is the total body mass less the mass of the gonads. ‡ Condition factor is calculated using the formula M/F3 ; where M is total body mass in grams and F is fork length in centimetres.
21
The abundance of most fatty acids studied was not influenced
significantly by the mass of the lipid in the walleye egg. EPA, however,
was found to decrease as egg lipid mass increased. The EPA:AA ratio was
also determined to have a negative relationship with egg lipid mass. The
statistics from these regressions are summarised in Table 2.
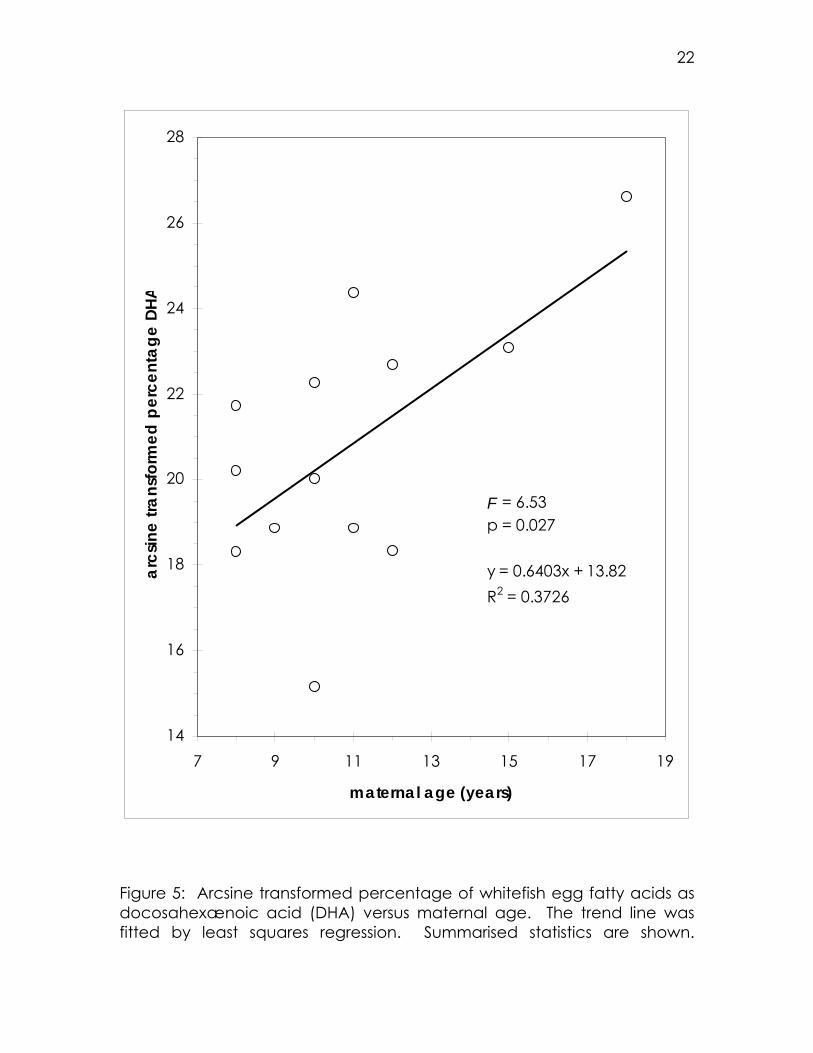
Whitefish:
As with walleye, the dry mass of the whitefish egg was not correlated with
size of the female. Unlike in walleye, the percentages of most fatty acids
in whitefish were not found to correspond to maternal characteristics with
any statistical significance. The one exception was DHA: a positive
relationship was found between the percentage of egg fatty acids as
DHA and the mother’s age (Figure 5).
Hatching:
The backward elimination regression found no correlation between the
fraction of walleye eggs which hatched and any maternal or egg
characteristics measured or calculated in this study.
22
F = 6.53p = 0.027
y = 0.6403x + 13.82R2 = 0.3726
14
16
18
20
22
24
26
28
7 9 11 13 15 17 19
maternal age (years)
arcs
ine
trans
form
ed p
erce
ntag
e DH
A
Figure 5: Arcsine transformed percentage of whitefish egg fatty acids as docosahexænoic acid (DHA) versus maternal age. The trend line was fitted by least squares regression. Summarised statistics are shown.
23
Discussion
In walleye eggs, it was consistently observed that with an increase in
maternal size†, the relative abundance of AA and DHA increased, and
the relative abundance of EPA decreased. Similarly, the ratio of EPA:AA
decreased, while the DHA:EPA ratio increased in the eggs of larger
mothers. The increase in DHA can be explained by the fact that embryos
require this essential fatty acid to develop neural tissue (Wiegand, 1996;
Tocher, 2003), and larger mothers must have sufficient amounts of DHA to
provide their offspring with greater proportions of the fatty acid, while
retaining enough for their own use.
Insight into the relationships seen between AA and EPA is given by Tocher
(2003). While either AA or EPA can serve as the precursor for eicosanoids,
fish will use AA preferentially, and eicosanoids produced from AA are
more potent. Larger mothers must have enough AA that they can
provide their eggs with generous proportions of this fatty acid, which
Czesny et al (1999) determined is beneficial to larval survival, without
compromising their own AA stores. Smaller mothers may not have enough
AA, in relation to EPA, to provide as much for their offspring, because an
inappropriate ratio of EPA:AA can be damaging to an adult (Tocher,
† The findings of this study with regard to fork length confirm the results of Wiegand et al (2004). This study went beyond, however, in that it also examined size in terms of mass and condition factor.

24
2003). Optimal ratios of EPA:AA differ among species, and are the subject
of extensive investigations related to broodstock management in
aquaculture (Sargent, 1995; Tocher 2003).
It is surprising that whitefish eggs were not much influenced by maternal
characteristics, while several maternal parameters, especially those
pertaining to size, so consistently influenced the eggs of walleye. The
sample size of this whitefish experiment (n=13) was both smaller than the
anticipated size (n=25) and smaller than the sample size of the walleye
experiment (n=19). Had the sample size been larger, perhaps other
observed fatty acid trends with respect to maternal characteristics would
have statistically significant. Or it may simply be that maternal somatic
characteristics have no effect on whitefish egg lipid composition in wild
populations. Because of this uncertainty, the findings of this study with
respect to whitefish eggs are preliminary at best.
Although the fatty acid profiles of whitefish were in many respects similar
to those of walleye, there were a few notable differences. The larvæ of
the two fishes do enter the same ecosystem at approximately the same
time. However, it is to be expected that the fatty acid profiles of the two
fishes would be somewhat different, due to phylogenetic divergence, or
to differences in their respective trophic levels. Walleye are mainly
piscivorous, but will also feed on crayfish, snails, insects, frogs,
25
mudpuppies, and small mammals (Robins et al, 1991), whereas whitefish
feed on insect larvae, small molluscs, and amphipods (Scott and
Crossman, 1973). Studies on wild and domesticated fish have shown that
a female’s diet can affect lipid content in her eggs (Czesny and
Dabrowski, 1998; Izquierdo et al, 2001).
There was no correlation found between hatching success and egg or
maternal traits. Therefore, although it was determined that larger mothers
put greater proportions of certain desirable fatty acids into their eggs, this
study did not establish that these eggs were “better” in terms of producing
eggs which hatched at a greater rate. However, hatching is only one
measure of fitness or success. Egg lipid or maternal characteristics may
influence the production of eggs which fulfill a different definition of
success, such as larval growth or survival. Indeed, Sargent (1995) suggests
that greater concentrations of essential fatty acids might decrease the
frequency of morphological and behavioural abnormalities in fish larvæ.
In addition, eggs from every female were fertilised with sperm from a
different male. Hatchability depends on embryonic development, which
is not solely influenced by an egg’s fatty acid profile. A plethora of other
factors come into play, including the genetic information received from
the father. It is possible that hatchability trends caused by maternal

26
characteristics may exist, but were not seen in this study because the
embryos did not have a common father.
Finally, the profile of fatty acids in a fish egg is by no means the only factor
determining the quality of that egg. Variation between eggs in the profile
of yolk proteins has not been found to influence hatching success (Pronyk,
2001), but vitamins and other micronutrients ought also to be investigated
for their role in the hatching success and survival of walleye eggs.
One important point to note is that this study looked at the variability of
fatty acid profiles in the total lipid extract. Previous studies, including
Wiegand et al (2004), have generally separated the neutral lipids from the
polar lipid prior to fatty acid analysis. It has been shown that, in walleye
eggs, there is very little fatty acid variability in the polar fraction, which is
more important structurally in membranes. There is extensive variability in
the neutral fraction, which is used mainly as fuel (Wiegand et al, 2004).
The same study also determined that the ratio of neutral to polar lipids
does not change from fish to fish. Therefore it is appropriate, for walleye
at least, to examine the total lipid only. This study operates under the
assumption that the same pattern holds for whitefish. Kaitaranta (1980)
determined for Coregonus albula, a species closely related to C.
clupeaformis, variation in the profile of fatty acids is essentially in the polar
fraction only. However, whether the amount of neutral lipid relative to
polar lipid stays constant in lake whitefish remains to be investigated.
27
Conclusions
1. The relative abundance of AA and DHA increases, and the relative
abundance of EPA decreases, in walleye eggs with increased
maternal size.
2. The EPA:AA ratio decreases, and the DHA:EPA ratio increases, as the
size of the mother increases.
3. In walleye eggs, neither the relative abundance of palmitic acid nor
that of oleic acid is attributable to maternal size.
4. The profile of walleye egg fatty acid does not correlate to the age of
the mother.
5. Walleye eggs containing more lipid tend to have a lower proportion of
EPA, and the EPA:AA ratio decreases with increased egg lipid mass.
6. No correlation was found between the proportion of walleye eggs
which hatched, and egg fatty acid profile, egg lipid mass, or maternal
size or age.
7. The relative abundance of essential fatty acids in whitefish eggs, and
the relative abundance of palmitic and oleic acid in whitefish eggs, is
not related to maternal size.
8. The proportion of DHA in whitefish eggs increases with increased
maternal age.
28
References
Czesny S and K Dabrowski. 1998. The effect of fatty acid concentrations on embryo viability in wild and domesticated walleye, Stizostedion vitreum. Aquatic Living Resources 11(6): 371-378.
Czesny S., Kolkovski S., Dabrowski K., and D. Culver. 1999. Growth, survival and quality of juvenile walleye Stizostedion vitreum as influenced by n-3 HUFA enriched Artemia nauplii. Aquaculture 178: 103-115.
Folch J., Lees M., and G.H.S. Stanley. 1957. A simple method for the isolation and purification of total lipides from animal tissues. Journal of Biological Chemistry 226: 497-509.
Henderson J.R., Park M.T., and J.R. Sargent. 1995. The desaturation and elongation of C14-labelled polyunsaturated fatty acids by pike, Esox lucius L. in vivo. Fish Physiology and Biochemistry 14(3): 223-225.
Izquierdo M.S., Fernańdez-Palacios H., and A.G.J. Tacon. Effect of broodstock nutrition on reproductive performance of fish. Aquaculture 197: 25-42.
Kaitaranta J.K. 1980. Lipids and fatty acids of a whitefish Coregonus albula flesh and roe. Journal of the Science of Food and Agriculture 30: 1303-1308.
Marsh J.B., and D.B. Weinstein. 1966. Simple charring method for determination of lipids. Journal of Lipid Research 7: 574-576.
Moodie G.E.E., Loadman N.L., Wiegand M.D., and J.A. Mathias. 1989. Influence of egg characteristics on survival, growth and feeding in larval walleye (Stizostedion vitreum). Canadian Journal of Fisheries and Aquatic Sciences 46: 516-521.
Pronyk, R.J. 2001. What makes a good egg? B.Sc. Honours Thesis, Department of Biology, Univeristy of Winnipeg.
Robins, C.R., Bailey R.M., Bond C.E., Brooker J.R., Lachner E.A., Lea R.N. and W.B. Scott. 1991. Common and scientific names of fishes from the United States and Canada. American Fisheries Society Special Publication. 183 p.
29
Sargent J.R. 1995. Origins and functions of egg lipids: Nutritional implications. In: Broodstock Management and Egg and Larval Quality. N.R. Bromage and R.J. Roberts, eds.
Scott W.B., and E.J. Crossman. 1973. Freshwater fishes of Canada. Fisheries Research Board of Canada Bulletin 184. 966 p.
Soberman R.J., and P. Christmas. 2003. The organisation and consequences of eicosanoid signalling. Journal of Clinical Investigation 111(8): 1107-113.
Sokal R.R., and F.J. Rohlf. 1995. Biometry: the principles and practice of statistics in biological research. 3rd ed. W.H. Freeman & Co, New York. 887 p.
Tocher D.R. 2003. Metabolism and functions of lipids and fatty acids in teleost fish. Reviews in Fisheries Science 11(2): 107-184.
Wiegand M.D. 1996. Composition, accumulation and utilisation of yolk lipids in teleost fish. Reviews in Fish Biology and Fisheries 6: 259-286.
Wiegand M.D., Johnston T.A., and J. Brooks. 2000. Egg neutral and polar lipid fatty acid compositions from seven reproductively isolated populations of walleye (Stizostedion vitreum). Proceedings from the Sixth International Symposium on the Reproductive Physiology of Fish: Bergen, Norway; 1999. B. Norberg, O.S. Kjesbu, G.L. Taranger, E. Andersson and S.O. Stefansson, eds. Institute of Marine Research and Univerisity of Bergen: 88-91.
Wiegand M.D., Johnston T.A., Brooks J., and W.C. Leggett. 2004. Variation in neutral and polar lipid compositions of ova in ten reproductively isolated populations of walleye (Sander vitreus). Canadian Journal of Fisheries and Aquatic Sciences 61: 110-121.


![ophtalmos - users.atw.huusers.atw.hu/aokszote/download.php?fname=./01] ALAPOZO MODUL... · - humor vitreus - stroma vitreum fossa hyaloidea ... Müller sejtek végtalpai és a corpus](https://static.fdocuments.in/doc/165x107/5ba0303209d3f242318c6628/ophtalmos-usersatw-alapozo-modul-humor-vitreus-stroma-vitreum-fossa.jpg)