and Liquidity Requirements
40
November, 2020 West Africa Webinar Series: Banks’ Stress Testing: Linking Credit Risk Capital and Liquidity Requirements
Transcript of and Liquidity Requirements
November, 2020
West Africa Webinar Series:
Banks’ Stress Testing: Linking Credit Risk Capital
and Liquidity Requirements
2Linking Credit Risk Capital and Liquidity Requirements
1. Introduction: RIMAN
2. Enterprise Stress Testing Framework
• Recent regulatory guidance on the adequacy of capital and liquidity resources
• Best practices in modelling for stressed credit risk losses, capital impact and liquidity risks
3. Managing Liquidity Risk Under Regulatory Constraints
• Daily liquidity management
• Solving reporting issues for CFMR (Cash Flow Mismatch Report)
• Optimizing your balance sheet in a stressed environment
4. Leveraging Existing Tools and Technologies for Compliance and
Management
Agenda

3Linking Credit Risk Capital and Liquidity Requirements
» Dr Biodun Adedipe - Chief Consultant, BAA Consult
» Nicholas Kunghehian, Director, Moody’s Analytics
» Wasim Karim, Director, Moody’s Analytics
» Metin Epozdemir, CFA – Director, Moody’s Analytics
Speakers

1 Introduction by RIMAN
BA
A C
on
su
ltStress Testing of Banks’ Assets and LiquidityUnderlying Issues and Imperatives

BA
A C
on
su
ltDimensions to COVID-19 DisruptionsFrom Complicated to Complex to Chaos
Source: Torsten Pistor: Decision Making in a Crisis (June 2020)

BA
A C
on
su
lt
Dimensions to COVID-19 Disruptions (contd.)
Acronym Element Characteristics
V Volatility❑ Unexpected, unstable events/issues❑ Unknown duration
U Uncertainty❑ Lack of critical information❑ Knowledge of cause and effect
C Complexity❑ Some information is available❑ Interconnected variables and parts
A Ambiguity❑ Vague issues❑ Unclear relationships❑ Unknowns
From complicatedto complexto chaos!
Welcome to the new normal.
But get ready for the next normal.
❑ “When
everything is no longer what it used to be, its time to rethink everything.”
BA
A C
on
su
lt
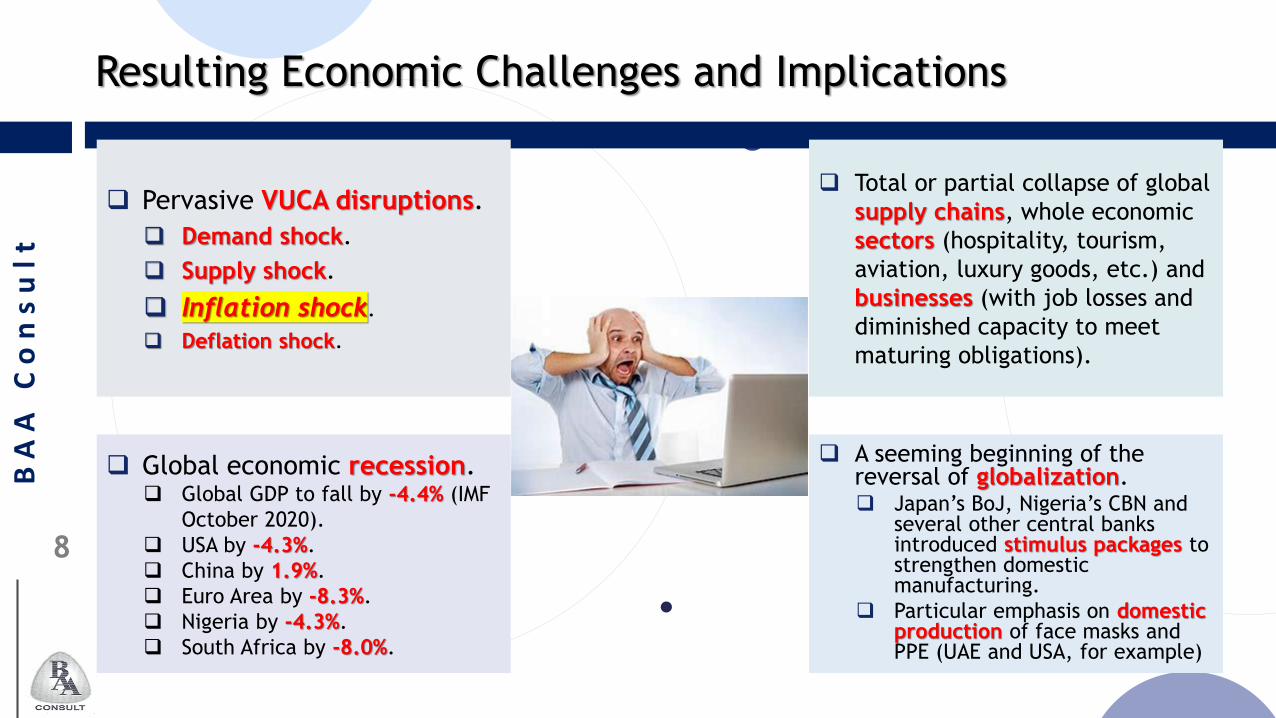
Resulting Economic Challenges and Implications
❑ A seeming beginning of the reversal of globalization.❑ Japan’s BoJ, Nigeria’s CBN and
several other central banks introduced stimulus packages to strengthen domestic manufacturing.
❑ Particular emphasis on domestic production of face masks and PPE (UAE and USA, for example)
❑ Total or partial collapse of global
supply chains, whole economic
sectors (hospitality, tourism,
aviation, luxury goods, etc.) and
businesses (with job losses and
diminished capacity to meet
maturing obligations).
❑ Global economic recession.❑ Global GDP to fall by -4.4% (IMF
October 2020).
❑ USA by -4.3%.
❑ China by 1.9%.
❑ Euro Area by -8.3%.
❑ Nigeria by -4.3%.
❑ South Africa by -8.0%.
❑ Pervasive VUCA disruptions.
❑ Demand shock.
❑ Supply shock.
❑ Inflation shock.
❑ Deflation shock.
BA
A C
on
su
lt
ccv
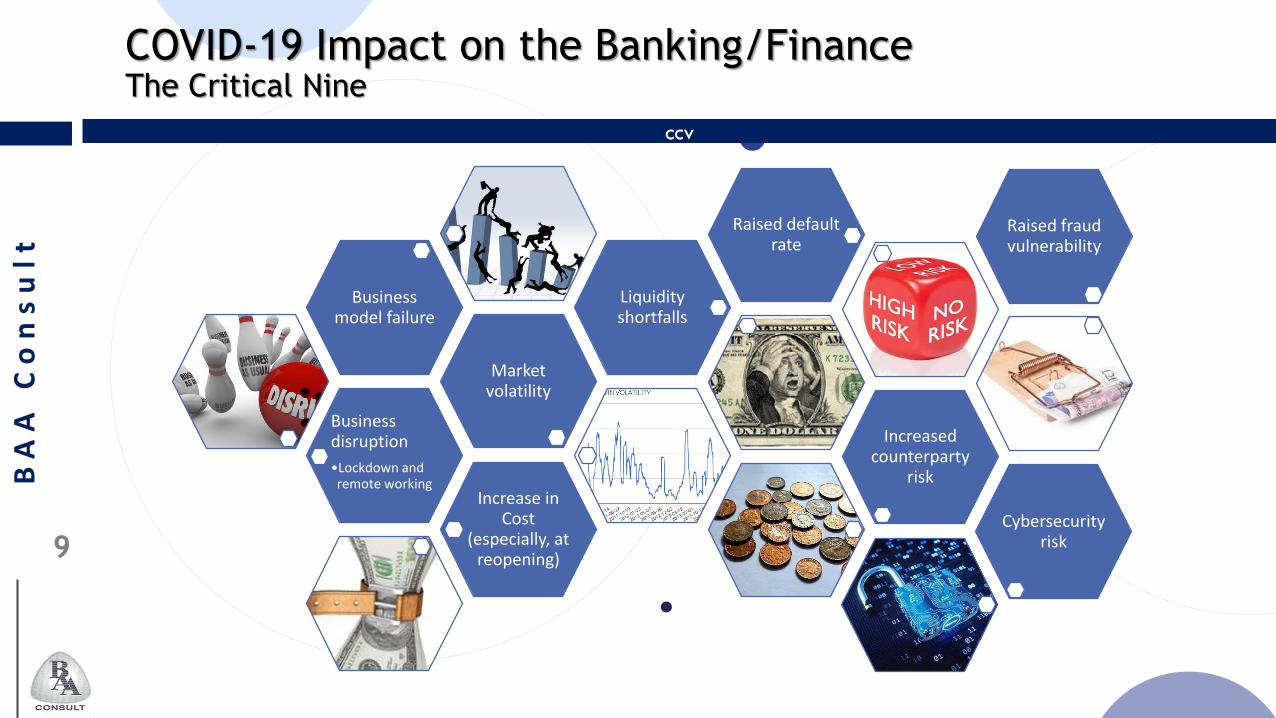
Business disruption
•Lockdown and remote working
Market volatility
Business model failure
Liquidity shortfalls
Raised default rate
Increased counterparty
riskIncrease in
Cost (especially, at
reopening)
Cybersecurity risk
Raised fraud vulnerability
COVID-19 Impact on the Banking/FinanceThe Critical Nine

BA
A C
on
su
lt
Inferences
Stress Scenarios(Minor; Moderate; Major)
Credit risk capital
Liquidity

BA
A C
on
su
lt
Thank for listening
God bless you
B. Adedipe Associates Limited
Lateef Jakande House (3rd Floor), 3/5 Adeyemo Alakija Street,
PO Box 73983, Victoria Island, Lagos.
+234-9021150255, 90217371000
‘Biodun Adedipe, Ph.D., FCIB, MIoD
+234-8023061981

2 Enterprise Stress Testing
Framework

13Linking Credit Risk Capital and Liquidity Requirements
Regulatory Guidance from CBNGuideline on Stress Testing for The Nigerian Banks – Effective 03/2019
Framework, Governance, ProcedureDocumented procedures, stress adequacy of internal capital and expected credit
losses. Assess vulnerability to different risks and external shocks. Report to regulator
and to board within ICAAP report at least annually. Project the impact on NII and P&L.
Independent assessment of components, benchmarking, regular maintenance and
update of the framework. Model inventory and its management. Link to Risk Appetite.
Scope and CoverageCover a range of risks. Appropriate level of granularity. Interaction
among risk factors. Identify, monitor and control concentration risk.
Impact on asset values, P&L, RWA, Internal Capital and Liquidity.
Reverse Stress Testing. Consider capital Supply and Demand.
ScenariosPlausible yet a serious challenge to profitability and capital.
Bank wide and comprehensive. Consider sharp decrease in global
oil price. Assess impact on the rest of the economy e.g. GDP, FX,
IR, inflation, corporate income, real estate prices etc.
Robust InfrastructureSufficiently flexible to accommodate different types of ST and granularity. Ensure
data quality and appropriate granularity. Ease of modification of methodology and
scenarios. Aggregation and Reporting of outcome.
Bank Stress
Testing

14Linking Credit Risk Capital and Liquidity Requirements
Confidential and proprietary – Not to be distributed without the prior written consent of Moody’s Analytics
Simplified Process Overview
Results
Pro Forma
Scenarios
Data
Internal
External
+
Balance Sheet
Forecast(s)
Budget
Models
+
Scenarios
Moody’s
Bank
=
15Linking Credit Risk Capital and Liquidity Requirements
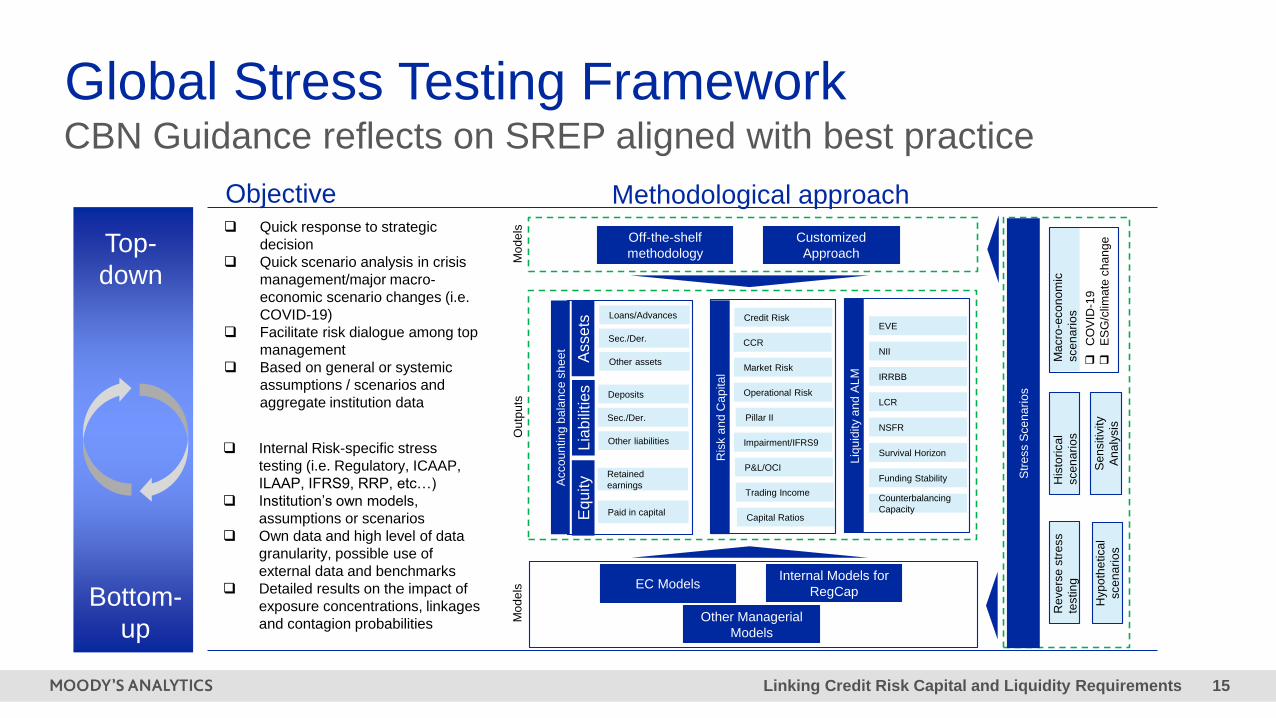
Global Stress Testing FrameworkCBN Guidance reflects on SREP aligned with best practice
Top-
down
Bottom-
up
Objective❑ Quick response to strategic
decision
❑ Quick scenario analysis in crisis
management/major macro-
economic scenario changes (i.e.
COVID-19)
❑ Facilitate risk dialogue among top
management
❑ Based on general or systemic
assumptions / scenarios and
aggregate institution data
❑ Internal Risk-specific stress
testing (i.e. Regulatory, ICAAP,
ILAAP, IFRS9, RRP, etc…)
❑ Institution’s own models,
assumptions or scenarios
❑ Own data and high level of data
granularity, possible use of
external data and benchmarks
❑ Detailed results on the impact of
exposure concentrations, linkages
and contagion probabilities
Methodological approach
Off-the-shelf
methodology
Customized
Approach
EC ModelsInternal Models for
RegCap
Other Managerial
Models
Acco
un
tin
g b
ala
nce
sh
ee
t
Loans/Advances
Sec./Der.
Other assetsAsse
tsL
iab
ilities
Equ
ity
Deposits
Sec./Der.
Other liabilities
Retained
earnings
Paid in capital
Ris
k a
nd
Cap
ita
l
Credit Risk
CCR
Market Risk
Operational Risk
Pillar II
Impairment/IFRS9
P&L/OCI
Trading Income
Liq
uid
ity a
nd
AL
M
EVE
NII
IRRBB
LCR
NSFR
Survival Horizon
Funding Stability
Counterbalancing
CapacityCapital Ratios
Mo
de
lsO
utp
uts
Str
ess S
ce
na
rio
s
Ma
cro
-eco
no
mic
sce
na
rio
s
❑C
OV
ID-1
9
❑E
SG
/clim
ate
ch
an
ge
His
tori
ca
l
sce
na
rio
s
Se
nsitiv
ity
An
aly
sis
Reve
rse
str
ess
testin
g
Hyp
oth
etica
l
sce
na
rio
s
Mo
de
ls

16Linking Credit Risk Capital and Liquidity Requirements
Typical Effort for Setting Up Stress Testing Framework
Planning a Tailored Approach for Bank’s Requirements
Context and Target
Solution
Data model and modelling
assumptions
Tool configuration, testing
and analysis
Documentation and
training
Key Activities
Indicative Effort
» Assessment of industry data
and market data availability
» Assessment of internal data and
internal forecasting/modelling
capabilities
» Feasibility analysis and
identification of Target Solution
(Off-the-shelf solution or
customized approach)
10% 30% 40% 20%
» Data mapping and data
collection
» Agreement on modelling and
data assumptions (e.g. new
business, pass-through
projections from the Bank or tool
parametrization)
» Output definition (e.g. capital
metric, Balance Sheet and
Income Statement Forecasts)
» Customization of financial
statement and regulatory
reporting in Stress Testing tool.
» Run of Bank’s portfolio under
stress scenarios and testing
» Impact analysis and sensitivity
analysis on Key Financial
Metrics and Ratios
» Documentation on tool and
methodologies deployed (Off-
the-shelf solution or customized
approach)
» Training to users on
methodology, tool use, settings
and key assumptions
» Training to executive
stakeholders on interpreting
output for business decision
making purposes

17Linking Credit Risk Capital and Liquidity Requirements
Example: Top Down Forecasting
Bank Level
Data
Industry
Aggregate
Market
Share
Industry
Projection
Market Share
Projection
ModelBank Level
Projection
Market Share is determined by
interplay between the target
bank and its competitors
Industry Projection is
determined by a separate
macro model of credit
18Linking Credit Risk Capital and Liquidity Requirements
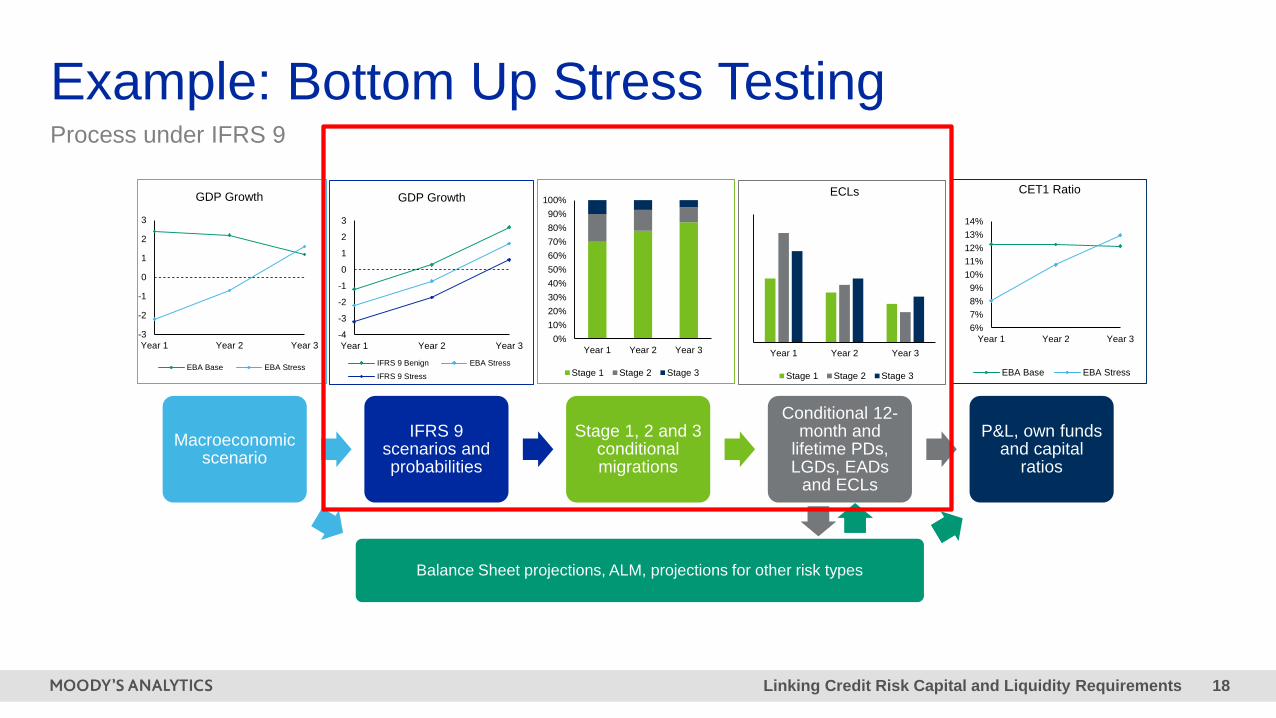
Example: Bottom Up Stress TestingProcess under IFRS 9
Key Sales Market Initiatives – 2H17/2018
Macroeconomic scenario
IFRS 9 scenarios and probabilities
Stage 1, 2 and 3 conditional migrations
Conditional 12-month and
lifetime PDs, LGDs, EADs
and ECLs
P&L, own funds and capital
ratios
Balance Sheet projections, ALM, projections for other risk types
-3
-2
-1
0
1
2
3
Year 1 Year 2 Year 3
GDP Growth
EBA Base EBA Stress
-4
-3
-2
-1
0
1
2
3
Year 1 Year 2 Year 3
GDP Growth
IFRS 9 Benign EBA Stress
IFRS 9 Stress
0%
10%
20%
30%
40%
50%
60%
70%
80%
90%
100%
Year 1 Year 2 Year 3
Stage 1 Stage 2 Stage 3
Year 1 Year 2 Year 3
ECLs
Stage 1 Stage 2 Stage 3
6%
7%
8%
9%
10%
11%
12%
13%
14%
Year 1 Year 2 Year 3
CET1 Ratio
EBA Base EBA Stress

19Linking Credit Risk Capital and Liquidity Requirements
Bottom Up Stress Testing Challenges
Only possible if the bank can backfill
staging
Direct modelling of stage
migrations
Forecasting transition matrices for
wholesale exposures and days past-due for
retail exposures
Transition matrices
Computationally demanding to forecast
lifetime PDs and difficult to forecast
qualitative judgement
Lifetime PDs and qualitative
criteria
Best estimate complicates scenario
generation and ECL calculations
Perfect foresight
Single scenario reduces calculation time,
multiple scenario capture better the non-
linearities
Number of IFRS 9 scenarios
Assumptions post stress/planning scenario
horizon
Horizon of scenario
Replicating the full IFRS 9 calculations at
each point of the stress scenario very
computationally intensive
Aggregation
Simplified PD, LGD and EAD modelling or
approximations might be needed
Approximation
Single scenario or perfect foresight
bypassing the need for computationally
demanding calculations
Simplification
Replacing loans during the forecast horizon
would increase the stock of stage 1 assets
Static/new lending
Transitional vs fully loaded: The former
treatment can help smooth out the effects of
IFRS 9, but the market might focus on the
latter
Capital Treatment
Fo
reca
stin
g S
tag
e 2
Asse
ts
Co
mp
lexity
Sce
na
rio
De
sig
n
Tre
atm
en
t of IF
RS
9

20Linking Credit Risk Capital and Liquidity Requirements
Economic ScenariosNigerian Banks to determine expected PD under stressed conditions
Brent crude oil 1-month forward [fob]
(USD per bbl, NSA) Real GDP, 2019Q4 = 100
80
88
96
104
112
12 13 14 15 16 17 18 19 20E 21F 22F 23F 24F 25F
Stress Downside
Low Oil Price Baseline
Sources: SIX Financial Information; European Central Bank (ECB); The World Bank; United Nations Statistics Division (UNSD); Moody's Analytics Estimated and Forecasted
08
1624324048566472808896
104112120128
12 13 14 15 16 17 18 19 20E 21F 22F 23F 24F 25F
Stress Downside
Low Oil Price Baseline

21Linking Credit Risk Capital and Liquidity Requirements
Leveraging Existing Models and Tools
“Banks should also, where applicable, consider making use of their other internally developed and validated risk
quantification models in their stress testing exercise and should be able to provide a description of and justification for the
methodology used to generate risk parameters including the relevant estimated parameters for all the credit portfolios.”
Central Bank of Nigeria
Obligor characteristics
IRB PD/LGD/
EAD
Stress PDLGD-
EAD
IFRS 9 PD/LGD/
EAD
Dynamic PD/LGD/EAD analysis
ICAAPRegulatory
ExcercisesPillar I Capital
Origination
Pricing Provisions

3Managing Liquidity Risk
Under Regulatory
Constraints?
Daily liquidity modelling

24Linking Credit Risk Capital and Liquidity Requirements
» Identify unencumbered positions including long, short positions and repos
» Simulating outright sale modeled with Time Series e.g. 20% of the position in one
day, 50% in one week
Sale Sale
Defined through a time series
With haircut
Maturity date of
the bond
Reporting
date
Counterbalancing capacity: bonds sell-off
( ) ( )hcpriceTSecuritiesAvailableStCF −= 1

» Consistency: single set of data
to produce all analytics
» Regulatory mapping: phase
that affect regulatory categories
according to a supervisor and
slice deposits balance
» New business: multiple
scenarios (including stress
testing) to produce the set of
cash flows required by analytics
» Reporting: regroup regulatory
and management analytics for
ALM (IRRBB and Liquidity)
Bank’s Data Data enriched and
tranched
Contractual, MCO, Name Specific, Market Wide,
Combined
NSFR, LCR, CFMR,
ALMM, FSB
Survival horizon, MCO,
concentration
FTPIRRBB, Liq FTP
Cost of LCR, NSFR
IRRBBEVE, NII
STDF
Data Calculation AnalyticsEnrichment
New generation of regulatory reports
Dynamic enrichment
Enrichment

26Linking Credit Risk Capital and Liquidity Requirements
» Regulatory dimensions part of the reports, a mix between
operational ALM and regulatory compliance
» What-if scenarios, i.e. not only regulatory scenario
» Behaviors needs to be incorporated
CFMR reports

27Linking Credit Risk Capital and Liquidity Requirements
Components
» Same data to produce all analytics
– BS Management: Liquidity and IRRBB
– Regulatory: LCR and NSFR
» Instrument modeling for contractual cash flows
» Behavioral models for maturing and non-maturing contracts
» Regulatory classification enrichment
» What-if and Stress Testing scenarios
» Granular results
» Business reports
Liquidity ManagementExample of reports
Regulatory
classification
Internal Risk
classification

» Analyze the impact of all
assumptions on the different
regulatory analytics
» Consistency: use the same
engine to compare “spot”
results and “forecast” results
» Mitigating actions: what are
the good hedging strategies
» Performance: launch multiple
scenarios on a daily basis at a
granular level
Optimizing your balance sheet
LCR forecast objectives

Liquidity
Ratios
Analyze the
LCR & NSFR
and its evolution

30Linking Credit Risk Capital and Liquidity Requirements
Sell-off impact on LCR forecastLCR optimized by sell-off of Bonds to boost earnings
LCR
200%
LCR
160%
Sell-off
HQLA 1
sold

31Linking Credit Risk Capital and Liquidity Requirements
Benefits of an integrated platform
Regulatory
Compliance
Banks need to be
prepared for new
regulatory requirements
and must be able to
forecast accurately the
regulatory analytics.
Optimization
Regulatory constraints in
business simulations is
key to forecast and
optimize your balance
sheet
True Risk-adjusted
pricing
Models need to be
shared by the Bank and
be consistent for all
risks. The price of each
transaction must reflect
the variety of these risks.

4Tools and Technologies for
Compliance and
Management

33Linking Credit Risk Capital and Liquidity Requirements
Capital Risk Analyzer
Stress
Testing &
Scenario
AnalysisCECL\ ECL
Forecasting
Capital
Planning
Forward-
looking
Profitability
Peer Group
Analysis
What if and
Strategic
Analysis
Strategic Capital Planning and Forecasting Tool

34Linking Credit Risk Capital and Liquidity Requirements
Credit stress-testing product of the year
Enterprise-wide stress-testing product of the year
Awards

35Linking Credit Risk Capital and Liquidity Requirements
» Published on the MA website
» Published in the American Banker
Stress Testing Under COVID-19
White Paper

36Linking Credit Risk Capital and Liquidity Requirements
Our Solution: Capital Risk Analyzer (CRA)
Balance Sheet &
Income Statements
Capital Ratios
Simple Results Dashboard
Intuitive Data Visualizations
Forecast ECL Impairments
(ImpairmentStudio recommended as well)
Forecast PPNR
(using CS Call Report Forecast results)
Forecast RWA
(basic standardized approach built in)
Forecast Credit Losses
(top-down and bottom-up)
User-provided Forecasts
(combined with calculations seamlessly)
Forecast Net Income
(forecasts used consistently)
Analytics are embedded to support critical management outputs

37Linking Credit Risk Capital and Liquidity Requirements
Capital Risk Analyzer Highlights
Stress testing,
benchmarking
and strategic
capital planning
all in one easy-
to-use tool
One analysis will
populate multiple
reports for
regulatory and
client-specific
financial
statements
Designed
to produce
results
quickly
Easy to use
interface works
on tablets
Forecast CECL
impairments,
capital ratios and
profitability
metrics
Hosted on
the Cloud
Interactive
reports
and user
interface
Credit and
PPNR
models
embedded

Stress testing is a significant undertaking
Requires data, analytics and technology infrastructure
…and upskilling specialist resources

West Africa Autumn Webinar Series
Episode 2
Wednesday, 2December
09:00 GMT | 10:00 WAT
Implementing an Effective
Model Validation
Framework

Linking Credit Risk Capital and Liquidity Requirements 40
© 2020 Moody’s Corporation, Moody’s Investors Service, Inc., Moody’s Analytics, Inc. and/or their licensors and affiliates (collectively, “MOODY’S”). All
rights reserved.
CREDIT RATINGS ISSUED BY MOODY'S INVESTORS SERVICE, INC. AND ITS RATINGS AFFILIATES (“MIS”) ARE MOODY’S CURRENT OPINIONS
OF THE RELATIVE FUTURE CREDIT RISK OF ENTITIES, CREDIT COMMITMENTS, OR DEBT OR DEBT-LIKE SECURITIES, AND MOODY’S
PUBLICATIONS MAY INCLUDE MOODY’S CURRENT OPINIONS OF THE RELATIVE FUTURE CREDIT RISK OF ENTITIES, CREDIT COMMITMENTS,
OR DEBT OR DEBT-LIKE SECURITIES. MOODY’S DEFINES CREDIT RISK AS THE RISK THAT AN ENTITY MAY NOT MEET ITS CONTRACTUAL
FINANCIAL OBLIGATIONS AS THEY COME DUE AND ANY ESTIMATED FINANCIAL LOSS IN THE EVENT OF DEFAULT OR IMPAIRMENT. SEE
MOODY’S RATING SYMBOLS AND DEFINITIONS PUBLICATION FOR INFORMATION ON THE TYPES OF CONTRACTUAL FINANCIAL
OBLIGATIONS ADDRESSED BY MOODY’S RATINGS. CREDIT RATINGS DO NOT ADDRESS ANY OTHER RISK, INCLUDING BUT NOT LIMITED TO:
LIQUIDITY RISK, MARKET VALUE RISK, OR PRICE VOLATILITY. CREDIT RATINGS AND MOODY’S OPINIONS INCLUDED IN MOODY’S
PUBLICATIONS ARE NOT STATEMENTS OF CURRENT OR HISTORICAL FACT. MOODY’S PUBLICATIONS MAY ALSO INCLUDE QUANTITATIVE
MODEL-BASED ESTIMATES OF CREDIT RISK AND RELATED OPINIONS OR COMMENTARY PUBLISHED BY MOODY’S ANALYTICS, INC. CREDIT
RATINGS AND MOODY’S PUBLICATIONS DO NOT CONSTITUTE OR PROVIDE INVESTMENT OR FINANCIAL ADVICE, AND CREDIT RATINGS AND
MOODY’S PUBLICATIONS ARE NOT AND DO NOT PROVIDE RECOMMENDATIONS TO PURCHASE, SELL, OR HOLD PARTICULAR SECURITIES.
NEITHER CREDIT RATINGS NOR MOODY’S PUBLICATIONS COMMENT ON THE SUITABILITY OF AN INVESTMENT FOR ANY PARTICULAR
INVESTOR. MOODY’S ISSUES ITS CREDIT RATINGS AND PUBLISHES MOODY’S PUBLICATIONS WITH THE EXPECTATION AND
UNDERSTANDING THAT EACH INVESTOR WILL, WITH DUE CARE, MAKE ITS OWN STUDY AND EVALUATION OF EACH SECURITY THAT IS
UNDER CONSIDERATION FOR PURCHASE, HOLDING, OR SALE.
MOODY’S CREDIT RATINGS AND MOODY’S PUBLICATIONS ARE NOT INTENDED FOR USE BY RETAIL INVESTORS AND IT WOULD BE RECKLESS
AND INAPPROPRIATE FOR RETAIL INVESTORS TO USE MOODY’S CREDIT RATINGS OR MOODY’S PUBLICATIONS WHEN MAKING AN
INVESTMENT DECISION. IF IN DOUBT YOU SHOULD CONTACT YOUR FINANCIAL OR OTHER PROFESSIONAL ADVISER.
ALL INFORMATION CONTAINED HEREIN IS PROTECTED BY LAW, INCLUDING BUT NOT LIMITED TO, COPYRIGHT LAW, AND NONE OF SUCH
INFORMATION MAY BE COPIED OR OTHERWISE REPRODUCED, REPACKAGED, FURTHER TRANSMITTED, TRANSFERRED, DISSEMINATED,
REDISTRIBUTED OR RESOLD, OR STORED FOR SUBSEQUENT USE FOR ANY SUCH PURPOSE, IN WHOLE OR IN PART, IN ANY FORM OR
MANNER OR BY ANY MEANS WHATSOEVER, BY ANY PERSON WITHOUT MOODY’S PRIOR WRITTEN CONSENT.
CREDIT RATINGS AND MOODY’S PUBLICATIONS ARE NOT INTENDED FOR USE BY ANY PERSON AS A BENCHMARK AS THAT TERM IS DEFINED
FOR REGULATORY PURPOSES AND MUST NOT BE USED IN ANY WAY THAT COULD RESULT IN THEM BEING CONSIDERED A BENCHMARK.
All information contained herein is obtained by MOODY’S from sources believed by it to be accurate and reliable. Because of the possibility of human or
mechanical error as well as other factors, however, all information contained herein is provided “AS IS” without warranty of any kind. MOODY'S adopts all
necessary measures so that the information it uses in assigning a credit rating is of sufficient quality and from sources MOODY'S considers to be reliable
including, when appropriate, independent third-party sources. However, MOODY’S is not an auditor and cannot in every instance independently verify or
validate information received in the rating process or in preparing the Moody’s publications.
To the extent permitted by law, MOODY’S and its directors, officers, employees, agents, representatives, licensors and suppliers disclaim liability to any
person or entity for any indirect, special, consequential, or incidental losses or damages whatsoever arising from or in connection with the information
contained herein or the use of or inability to use any such information, even if MOODY’S or any of its directors, officers, employees, agents, representatives,
licensors or suppliers is advised in advance of the possibility of such losses or damages, including but not limited to: (a) any loss of present or prospective
profits or (b) any loss or
damage arising where the relevant financial instrument is not the subject of a particular credit rating assigned
by MOODY’S.
To the extent permitted by law, MOODY’S and its directors, officers, employees, agents, representatives, licensors and suppliers disclaim liability for any
direct or compensatory losses or damages caused to any person or entity, including but not limited to by any negligence (but excluding fraud, willful
misconduct or any other type of liability that, for the avoidance of doubt, by law cannot be excluded) on the part of, or any contingency within or beyond the
control of, MOODY’S or any of its directors, officers, employees, agents, representatives, licensors or suppliers, arising from or in connection with the
information contained herein or the use of or inability to use any such information.
NO WARRANTY, EXPRESS OR IMPLIED, AS TO THE ACCURACY, TIMELINESS, COMPLETENESS, MERCHANTABILITY OR FITNESS FOR ANY
PARTICULAR PURPOSE OF ANY CREDIT RATING OR
OTHER OPINION OR INFORMATION IS GIVEN OR MADE BY MOODY’S IN ANY FORM OR
MANNER WHATSOEVER.
Moody’s Investors Service, Inc., a wholly-owned credit rating agency subsidiary of Moody’s Corporation (“MCO”), hereby discloses that most issuers of debt
securities (including corporate and municipal bonds, debentures, notes and commercial paper) and preferred stock rated by Moody’s Investors Service, Inc.
have, prior to assignment of any rating, agreed to pay to Moody’s Investors Service, Inc. for ratings opinions and services rendered by it fees ranging from
$1,000 to approximately $2,700,000. MCO and MIS also maintain policies and procedures to address the independence of MIS’s ratings and rating
processes. Information regarding certain affiliations that may exist between directors of MCO and rated entities, and between entities who hold ratings from
MIS and have also publicly reported to the SEC an ownership interest in MCO of more than 5%, is posted annually at www.moodys.com under the heading
“Investor Relations — Corporate Governance — Director and Shareholder Affiliation Policy.”
Additional terms for Australia only: Any publication into Australia of this document is pursuant to the Australian Financial Services License of MOODY’S
affiliate, Moody’s Investors Service Pty Limited ABN 61 003 399 657AFSL 336969 and/or Moody’s Analytics Australia Pty Ltd ABN 94 105 136 972 AFSL
383569 (as applicable). This document is intended to be provided only to “wholesale clients” within the meaning of section 761G of the Corporations Act
2001. By continuing to access this document from within Australia, you represent to MOODY’S that you are, or are accessing the document as a
representative of, a “wholesale client” and that neither you nor the entity you represent will directly or indirectly disseminate this document or its contents to
“retail clients” within the meaning of section 761G of the Corporations Act 2001. MOODY’S credit rating is an opinion as to the creditworthiness of a debt
obligation of the issuer, not on the equity securities of the issuer or any form of security that is available to retail investors.
Additional terms for Japan only: Moody's Japan K.K. (“MJKK”) is a wholly-owned credit rating agency subsidiary of Moody's Group Japan G.K., which is
wholly-owned by Moody’s Overseas Holdings Inc., a wholly-owned subsidiary of MCO. Moody’s SF Japan K.K. (“MSFJ”) is a wholly-owned credit rating
agency subsidiary of MJKK. MSFJ is not a Nationally Recognized Statistical Rating Organization (“NRSRO”). Therefore, credit ratings assigned by MSFJ
are Non-NRSRO Credit Ratings. Non-NRSRO Credit Ratings are assigned by an entity that is not a NRSRO and, consequently, the rated obligation will not
qualify for certain types of treatment under U.S. laws. MJKK and MSFJ are credit rating agencies registered with the Japan Financial Services Agency and
their registration numbers are FSA Commissioner (Ratings) No. 2 and 3 respectively.
MJKK or MSFJ (as applicable) hereby disclose that most issuers of debt securities (including corporate and municipal bonds, debentures, notes and
commercial paper) and preferred stock rated by MJKK or MSFJ (as applicable) have, prior to assignment of any rating, agreed to pay to MJKK or MSFJ (as
applicable) for ratings opinions and services rendered by it fees ranging from JPY125,000 to approximately JPY250,000,000.
MJKK and MSFJ also maintain policies and procedures to address Japanese regulatory requirements.