
and Financial Performance - CAPI-ICPA Farm Profitability and Financial Performance CONTENTS ... to...
74
Measuring Farm Profitability and Financial Performance March 2009
Transcript of and Financial Performance - CAPI-ICPA Farm Profitability and Financial Performance CONTENTS ... to...
Measuring Farm Profitability and Financial Performance
March 2009
0
2
4
6
8
10
12

Canadian Agri-Food Policy Institute (CAPI)960 Carling Avenue, CEFBuilding 49, Room 318Ottawa, ON K1A 0C6
T: 613-232-8008 F: [email protected]
Canadian Agri-food Policy Institute Farm Profitability Report
3
Measuring Farm Profitability and Financial Performance
CONTENTS 1.0 Executive Summary 4 2.0 Introduction 7 3.0 Moving Forward on Selected issues 10 4.0 Suggestions and Proposed Next Steps 19 Annex A: Consultation Document on Farm Income 24 Annex B: Stakeholder Feedback on Profitability Measures 38 Annex C: Recent Initiatives Relating to Farm Income 72

Canadian Agri-food Policy Institute Farm Profitability Report
4
Measuring Farm Profitability and Financial Performance
1.0 Executive Summary In recent years, the Canadian Agri-Food Policy Institute (CAPI) has conducted research which suggests the current measure of aggregate farm income is not an adequate determinant of the profitability of the farm sector. An aggregate farm income measure masks many of the ongoing transformations in agriculture, such as the trend toward fewer but larger farms. For example, the aggregate farm income measure could indicate a sideways movement in profitability, with profitability and financial performance increasing for the commercial farms that account for the bulk of farm production. From a policy point of view, one must look beyond the aggregate data to assess the performance of the sector. Statistics Canada is now capable of providing measures of farm profitability and financial performance realized by distinct business segments of the farm sector. Agriculture and Agri-Food Canada (AAFC) can use this information – along with other databases it has access to – to project farm income by segmentation of farm businesses, such as various farm types. Furthermore, AAFC could use this platform to forecast other measures of farm profitability and financial performance based on projected (simulated) income statements and balance sheets of distinct farm business types. These realized values and forecast values of farm profitability and financial performance by farm type – and the size of operation within a farm type – can benefit the farm sector, individual farm operations, and suppliers of credit to the farm sector. Information on how a particular farm operation is performing in relation to others in that business segment can focus management efforts on those aspects of the operation that require attention to improve profitability. As well, lenders and farm management specialists will be able to help individual operations improve the profitability of the farm business. CAPI research has focused largely on improving the competitiveness of the agri-food sector. For this project: “Our goal is to develop measures of farm profitability that will benefit producers by allowing them to gauge their performance; as well, these performance indicators can benefit government officials and suppliers of credit by providing them with a more accurate measure to assess the current status of farm operations in Canada.” – Consultation Document on Farm Income This report was originally presented to the CAPI Steering Committee in June of 2008, in order to provide an indication of activities that occurred since the Committee had previously met in Ottawa, eight months earlier in October, 2007. In the interim, CAPI developed a list of performance indicators, and held consultations with over 120 stakeholders in five separate workshop locations to obtain feedback on the importance of specific measures of farm level profitability and performance. The feedback received has implications for the next steps associated with this initiative, and raised several potential areas of investigation, including determining:

Canadian Agri-food Policy Institute Farm Profitability Report
5
what additional performance measures should be reported; how distinct farm types should be defined; what databases should be used to most accurately calculate the indicators of
performance; how the resulting measures should be reported and made available to the users; what synergies exist between this initiative and other initiatives in the federal
government; what the short-run and long-run resource implications are for AAFC and Statistics
Canada, the federal departments actively collaborating with CAPI on this project. These issues are identified in this report, along with proposed suggestions and a process to address them. Below are suggestions that can likely be implemented without further study: A number of other issues warrant future consideration. Working groups could be created to address these issues more fully:
A – Suggestions that can likely be implemented without further study Primary Reporting by Farm Type
1. Reporting on Business Segments 2. Reporting on a Provincial Basis 3. Reporting More than the Median or Average Values 4. Reporting on Trends
Indicators Calculated and Published 1. Measures of Farm Profitability and Performance 2. A Staged Approach to the Release of Performance Measures 3. Data Sources to Calculate Profitability and Performance Measures 4. Consistency with other Statistics Canada Reports on Performance Indicators
B – Suggestions that may require further study What is Reported
1. Defining Farm Types or Business Segments 2. Defining Size Ranges by Farm Type 3. Level of Aggregation by Farm Type 4. Including other Financial Indicators 5. Data Sources to Calculate Profitability and Performance Measures 6. Reporting of Realized Values and Projected Values of Indicators
Linking with Existing Initiatives 1. Linking with Existing Initiatives
Approach Used to Report Indicators 1. Timing of First Release of Farm Profitability and Financial Performance Measures 2. Highlighting of Top 5 Indicators and Providing Access to Remaining Indicators 3. Developing the List of the Top 5 Indicators 4. Using Web-Based Technologies 5. Reporting of History Along with Projections 6. Reporting Frequency and Coordination
Infrastructure to Support Calculation and Reporting of Measures 1. Development of an infrastructure and implementation plan
Supporting Educational Activities 1. Educational Approaches and Tools By Primary Audience

Canadian Agri-food Policy Institute Farm Profitability Report
6
The rationale for moving forward on this project is straightforward and based on more than one consideration. The stakeholders CAPI consulted were very supportive of the proposed action of providing timely information on profitability and financial performance by distinct type of farm operation in each region. This type of information can lead to better decisions in the farm sector, thereby improving the competitiveness of the sector. On the public policy front, this project will lead to superior policy decisions as policy makers gain access to better insights on profitability in the farm sector. Profitability measures will no longer rely on one aggregate value of farm income, but rather on how distinct segments of the farm sector are faring. Performance measures drive behaviour, and publishing farm level performance measures will shape behaviour and decisions in the farm sector, on individual farms, in the farm input supply community, and in the public policy arena.

Canadian Agri-food Policy Institute Farm Profitability Report
7
2.0 Introduction This report highlights findings from workshops held by CAPI in April of 2008 on farm profitability. To recap, in its report of November, 2005, CAPI noted that “aggregate net farm income is not a measure of profitability for business focused farms” (Factors Affecting Current and Future Farm Income Prospects: A Synthesis Report). This shortcoming arises from the dichotomy that exists between the level and trends in “aggregate” farm income and the level and trends in farm income for many individual farm operations and for distinct segments of the agricultural production sector, such as for commercially oriented farms. This dichotomy can be partially explained by the ongoing transformations that are occurring in agriculture: the substitution of capital for labour, the resulting decrease in farm numbers, the number of farms that are either part-time operations or are secondary income operations, and the expansion in size of the average farm. In other words, one must look beyond the aggregate data to fully assess the performance of the sector. Better Information on Sector Performance Can Lead to Better Policy Decisions The aggregate measure of farm income appears to be a driver of agricultural policy and a driver of changes to specific policies and programs. Decision-makers would have more precise information on farm-level profitability and farm sector performance if they had figures on net farm income and related financial and performance measures for the commercial farm sector, or for segments such as grains and oilseed operations or poultry operations with gross sales of more than $500 thousand. Policy decisions could then be refocused. Since performance measures drive behaviour, better information on performance in the sector can alter behaviour and decision-making by government and by producers. AAFC and Statistics Canada have been working together to coordinate the development of disaggregated farm income measures (e.g., developing farm income forecast by sales class and for major commodity sectors) and more comprehensive value added (GDP) measures in the farm sector. In February of 2008, AAFC released farm income projections for 2007 and 2008. These projections included aggregate farm income forecasts, as well as projections for the per farm average for farms classified as grains and oilseeds, horticulture, cattle, dairy, hogs, and for the average of all farm types1. In collaboration with AAFC and Statistics Canada2, this CAPI project is designed to go further than the above initiative; it is designed to see specific performance measures developed and reported for distinct segments of the commercial farm sector.
1 These forecasts at the Canada level can be viewed in Annex A (see tables 1 and 2 in Annex A). 2 Statistics Canada and AAFC have been actively participating in this project by providing guidance, data, and supporting analysis.

Canadian Agri-food Policy Institute Farm Profitability Report
8
The guiding objective for this project, as established at project inception (from the project charter), was as follows:
“The purpose of this project is to work with senior representatives of Statistics Canada, Agriculture and Agri-Food Canada, and some major farm organizations to develop and ultimately have published measures of performance for the commercial farm sector, which can be used for policy purposes rather than the aggregate net farm income and net cash income being used today.”
Following the October, 2007 Steering Committee meeting, CAPI noted that:
“the focus of this CAPI led project, in collaboration with AAFC and Statistics Canada, will be to move further on the continuum that has started and to have specific performance measures developed and reported for the commercial farm sector (on a disaggregated basis).”
Feedback from some Steering Committee members suggested that a sharper project focus might help the process. The project objective was clarified to highlight the fact that the farm profitability and financial performance measures are for two audiences: the farm sector and policy makers, with a primary focus on the farm sector. The invitation sent to stakeholders (from invitation to CAPI Workshops) to participate in the workshops stated that:
“Our objective is to determine which performance measures the government should develop and publish on a regular basis for these groupings of farm businesses. These measures can be used for public policy purposes – instead of the aggregate net farm income used today with its known weaknesses – and they can be used by farm businesses and input suppliers to provide an indication of relative financial position.”
This dual focus of farm sector and policy makers was also noted in background documentation supplied to workshop participants (from the Consultation Document on Farm Profitability):
“Our (CAPI) goal is to develop measures of farm profitability that will benefit producers by allowing them to gauge their performance; as well, these performance indicators can benefit government officials and suppliers of credit by providing them with a more accurate measure to assess the current status of farm operations in Canada.”
Following input and advice received from the Steering Committee, CAPI developed a potential list of farm profitability and financial performance measures. This process had input from some selected Steering Committee members. This potential set of performance measures, although longer than originally anticipated, became the basis for receiving feedback from stakeholders at the regional consultations.

Canadian Agri-food Policy Institute Farm Profitability Report
9
In April, 2008, CAPI held consultations with stakeholders in separate workshops in Abbottsford, B.C., Guelph, Ontario, Saint-Hyacinthe, Quebec, Regina, Sask., and Winnipeg, Manitoba3. The primary purpose of these workshops was to obtain feedback from stakeholders on which performance measures should be reported on an ongoing basis. These measures, along with their definitions, were provided to stakeholders prior to the workshop as part of the consultation document (See Annex A). The feedback received from these consultations is provided in Annex B. The consultations indicated that strong agreement existed on a number of measures and concepts introduced at the workshops. These measures are discussed in the following section (3.0), including: measurement by business segment; data sources; performance measures which were strongly supported; unresolved issues that require more consideration and discussion (how the results of this initiative could be reported); synergies and linkages of this initiative with ongoing initiatives at AAFC and Statistics Canada; and educational activities that may be required to increase the use of these performance measures by various audiences (e.g., farmers, policy makers, media). This report concludes in section 4.0 with a summary of suggestions and proposed next steps.
3 John Groenewegen facilitated these workshops, except in Saint-Hyacinthe, where Pierre Rheaume provided the facilitation services. Representatives from Statistics Canada and AAFC participated in each of these workshops as observers.

Canadian Agri-food Policy Institute Farm Profitability Report
10
3.0 Moving Forward on Selected Issues The findings arising from our five consultations are provided in Annex B. Based on these workshops, CAPI recommends that the federal government provide performance measures for a number of issues. For other issues, CAPI recommends the government explore ways to provide the performance measures in the future. This section provides a brief discussion of selected issues. At the conclusion of the discussion on each issue, this section includes a set of suggestions/recommendations. These suggestions are also listed in Section 4 of this report. 3.1 Primary Reporting by Farm Type A universal finding from the workshops is that the reporting of farm profitability and financial performance should be based on farm type. More specifically, the reporting should be provincial, with information provided by type of farm enterprise, including a few size ranges for each farm type. Workshop participants suggested that basing “farm type” on the enterprise that contributes more than 50% of gross sales may not be an appropriate definition. Gross margins in selected enterprises can vary, such that a given farm could be defined as a hog operation one year and a grain operation the next. Moreover, participants suggested the threshold for defining a farm type should be more than 50% of gross sales; it should be 80% or even 90 percent. As well, participants thought a number of “mixed” farm types could be defined for each province or region, such as a corn/hog operation in Ontario or grains/oilseeds in western Canada. Below, CAPI provides suggestions for primary reporting, categorized by those CAPI recommends the government provide in the short-term, and those that the government should consider providing in the future: Suggestions that can likey be implemented without further study
1. Reporting on Business Segments – The primary unit of reporting of farm profitability and financial performance is on a farm type basis, with 2 or 3 different farm sizes for each farm type.
2. Reporting on a Provincial Basis – The performance measures by farm type are
provided on a provincial basis, with the understanding that this reporting may need to include multiple provinces for some farm types due to the limited number of specific farm type operations in a province.
3. Reporting More than the Median or Average Values – For each performance
measure a median (or average) is provided as well as measures such as specific percentile rankings (e.g., 25% and 75%) or quartiles.
4. Reporting on Trends – For each performance measure for any farm type, trend
data on the reported measures are provided.

Canadian Agri-food Policy Institute Farm Profitability Report
11
Suggestions that may require further study
1. Defining Farm Types or Business Segments – A farm type can be based on at least 50% of gross revenue attributable to a specific type of farming activity, at least 50% of the gross margin from a specific type of activity, or having a higher threshold such as 80% or 90 percent. As well, it should be determined whether an egg laying, broiler, hatching egg operations, or a turkey production operation should be defined as poultry, or whether each of these activities is a separate farm type. At the same time, a number of mixed farm types representing the uniqueness of agriculture in a province should be considered as distinct farm types. A working committee should further address this issue.
2. Defining Size Ranges by Farm Type – Once the farm types are defined, the
appropriate size ranges for each farm type should be established. The CAPI consultations suggested that up to three sizes for any farm type are sufficient for comparative purposes. The size ranges need not be the same across farm types, with size range possibly based on structural considerations. For comparability purposes, the size ranges should be constant across regions for any farm type. A working committee can be used to further address this issue.
3. Level of Aggregation by Farm Type – For some defined farm types, an
insufficient number of operations may exist in a province for reporting purposes (e.g., grain and oilseed operations in the Maritimes or hatching egg operations in the prairies. In such cases, the basic region used for reporting must become an aggregation of provinces. This issue can be addressed by the proposed farm type working committee after the farm type and size ranges have been finalized.
3.2 Profitability and Performance Indicators Calculated and Published Participants expressed strong support for calculating and reporting the majority of the performance measures proposed to stakeholders. As noted in Figure 1 of Annex B, the majority of producers agreed that the following list of indicators (13 of 20 proposed in total) should be developed and published:
Gross margin and gross margin efficiency – without program payments EBITDA/sales (contribution margin) Operating profit margin (EBIT/sales) Net income – without program payments Operating expense ratio Interest coverage Return on assets (EBIT/assets) – without program payments Return on equity Current ratio Working capital ratio Debt structure Leverage (debt to equity), and Equity position

Canadian Agri-food Policy Institute Farm Profitability Report
12
As shown in Annex B (Figure 2 and Figure 3), the non-producer participants showed a strong preference for publishing all 20 of the proposed indicators; more than 50% felt that all of the measures should be published, the lowest support being for “return on assets with program payments.” Even when they were made aware that some of the data were not suitably available for a reliable computation, respondents – producers and non-producers alike – were nevertheless supportive of reporting on certain selected profitability measures (e.g., operating expense ratio, and gross margin efficiency without influence of government programs). These results are published in Figures 4 and 5 in Annex B. Stakeholders supported the idea of developing these measures using data from incorporated operations. Some proposed using other databases to supplement missing information. They did not want any new surveys to increase their compliance costs (time), but agreed that some data capture instruments may need fine-tuning to access the necessary data (for these computations). Participants proposed tracking additional profitability and financial measures, such as:
Debt serviceability, which can be calculated as EBT+interest/Current portion of long-term debt, to capture the ability repay debt; or
Debt carrying capacity, which can be measured as or EBITDA/current portion of long term debt plus interest;
Having some performance measures for each farm type based on costs, expenses, and margins on a per unit of production basis (either input such an acre, square foot or square meter in a greenhouse or chicken barn; or output such as per tonne of grain output or per hog marketed);
Include an allowance of risk in some of the measures (such as possibly the Sharpe ratio);
Unexpended balance, which captures earnings (including interest charges), excludes depreciation and accounts for principal payments on debt plus withdrawals by the operator;
Changes in earned equity; Have some measures reflect the equity position and/or age profile of the principal
operator. The difficulty of using book values of land was acknowledged as some operations rent most of their land, while others may have acquisition costs 30 years ago versus 5 years ago as part of the book value of land, and other operations may hold land in a separate legal entity. Some stakeholders thought that computing some return on assets and return on equity measures without including the land asset may allow for better comparability among operations. Stakeholders also acknowledged that using market values for land would also bias the indicators in a way that did not measure the health of the business (or sector). A few participants raised the issue of using common definitions and terminology.

Canadian Agri-food Policy Institute Farm Profitability Report
13
Reporting of the proposed performance measures is on a farm type basis. With AAFC now providing farm income forecasts by farm type, and on a per farm basis, the reporting of these measures could be directly linked with the AAFC per farm income reporting initiative. As well, Statistics Canada could report on these measures once the computations have been made, which could be two years after the fact. The following are suggestions on how to proceed with these issues, with some requiring extra consideration, and others possibly not requiring extra consideration. Suggestions that can likely be implemented without further study
1. Measures of Farm Profitability and Performance – The following performance measures are calculated and made available to the agricultural sector:
a. Gross margin and gross margin efficiency – w/o program payments b. EBITDA/sales (contribution margin) c. Operating profit margin (EBIT/sales) d. Net income – w/o program payments e. Operating expense ratio f. Interest coverage g. Return on assets (EBIT/assets) – w/o program payments h. Return on equity i. Current ratio j. Working capital ratio k. Debt structure l. Leverage (debt to equity) m. Equity position
2. A Staged Approach to the Release of Performance Measures – In some cases,
the source of data may not be robust enough to generate meaningful statistics for all farm types, while existing databases can be used to generate the majority of the suggested farm profitability and performance measures. The performance measures that can be calculated will be published as soon as possible, with the other performance measures published at a later date once the necessary data linkages and/or modifications of data capture instruments are completed.
3. Data Sources to Calculate Profitability and Performance Measures – Existing
databases can be used to calculate the measures to minimize any additional compliance burden on the farm sector and to minimize data collection costs. A starting source can be the tax filer data for incorporated farm operations. Linking databases (e.g., CAIS, FFS) and modifying survey instruments should be investigated where necessary to generate the performance measures.
4. Consistency with other Statistics Canada Reports on Financial Performance
Indicators – The financial indicators used are defined in a similar manner to those used by Statistics Canada (e.g., “Financial Performance Indicators for Canadian Business”).

Canadian Agri-food Policy Institute Farm Profitability Report
14
Suggestions that may require further study
1. Including other Financial Indicators – Other financial indicators were suggested, such as debt repayment capacity, and cash flow of the business. These potential indicators should be explored by a working committee.
2. Data Sources to Calculate Profitability and Performance Measures – Existing
databases can be used to calculate the measures to minimize any additional compliance burden on the farm sector and to minimize data collection costs. A starting source can be the tax filer data for incorporated farm operations. Linking databases (e.g., CAIS, FFS) and modifying survey instruments should be investigated where necessary to generate the performance measures. A working committee, with lead input from Statistics Canada, should address this issue, once a determination has been made on the farm profitability and financial indicators that will be calculated and reported.
3. Reporting of Realized Values and Projected Values of Indicators - Statistics
Canada provides annual (or semi-annual) reporting of the performance measures based on captured data, with AAFC providing forecasts of farm income and associated farm profitability and financial performance measures on an annual (semi-annual basis). Discussions between CAPI, Statistics Canada and AAFC may help resolve any issues arising from this suggestion.
3.3 Linkages with Existing Initiatives AAFC and Statistics Canada have existing initiatives that may have significant synergies with the proposed nature and scope of this project. Some performance measures are directly provided to producers that participate in the CAIS program4. These measures are reported for the operation for the current year, and the 5 year average, and are compared to industry benchmarks. These are based only on the income statement items and include:
Production margin ratio, which is the production margin/sales; Operating expense (cost ratio), which is expense before depreciation/sales; Interest and lease expense ratio, which is interest and lease expenses/sales; Machinery expense ratio for fuel and for repairs and other direct expenses (which
are each divided by sales); Livestock expenses, which is livestock purchases divided by sales and other
livestock expenses (excluding feed) divided by sales, and crop expenses, which are crop protection and fertilizer expenses divided by sales.
As well, AAFC has a “benchmark for success” website and CD-ROM that can be used to compare an operation with five years of benchmark information. Benchmark data is provided for the 25th, 50th and 75th quartiles. Financial tools enable users to compare
4 In Ontario for example, this is called the TIP (Towards Increased Profits) Report

Canadian Agri-food Policy Institute Farm Profitability Report
15
their firm's performance to that of their sector and to address issues such as profitability, efficiency and business risk. The product incorporates graphics for trend analysis as well as a financial tutorial. In June of 2008, the 2004 data was to have become available, with the 2005 and 2006 data being added over subsequent months. Information sources used to create the benchmark data in the application include Statistics Canada's Tax filer database and the Farm Financial Survey. Comparative data is suppressed when the sample size is too small. Balance sheet information derived from the Farm Financial Survey reports balance sheet information on a market value basis as opposed to book value. This user-driven tool calculates 9 financial ratios:
total operating expenses to gross revenue ratio; total operating expenses less interest to gross revenue ratio; capital turnover ratio; return on assets; return on equity; current ratio; debt structure ratio; debt to equity ratio; and net worth ratio.
In addition, a set of 14 expense ratios based on market revenues can be computed, such as the crop expense of fertilizer divided by market revenues. These reports can be generated for farm types, such as for grain and oilseed, potato, fruit and tree nut, vegetable and melon, dairy, beef cattle, hogs, poultry and eggs, and sheep and goats. This user tool can be applied to a number of size categories and regions/provinces. While somewhat different, a number of synergies and linkages can be explored between this current initiative and the “benchmark for success” tool created by AAFC. Annex C summarizes the initiatives undertaken at Statistics Canada in support of farm and financial performance measures. The recent AAFC initiative of providing farm income projections for an average farm, by farm type, is also an initiative where potential synergies with this CAPI led initiative exist. Suggestions that may require further study
1. Linking with Existing Initiatives – The potential outcome of this project has some linkages with existing initiatives, such as AAFC’s “benchmark for success” web initiative and CD products, reporting of performance as part of the CAIS program, and the recent launch of net farm income projections by farm type. A committee should explore the synergies between the concepts, and propose how these initiatives can be combined, or whether they should be combined.

Canadian Agri-food Policy Institute Farm Profitability Report
16
3.4 Approaches Used to Report Indicators A number of considerations should be addressed regarding the publication of the performance measures. For example, some of the proposed performance measures could be reported before others, since the data to compute some of the measures are already available. Another consideration is the timing of publishing the first set of measures. Given the volume of data, this information must be released in a simple way, though without eliminating the richness of the measures being provided. A simple release can be achieved by producing a summary report of some of the most important measures. The report should highlight the performance of a sector and provide insight to producers. These key measures could include:
a measure of cash flow, such as EBITDA minus interest payment divided by sales revenues;
gross margin efficiency (or contribution margin) without including program payments; profitability measures such as net profit per farm and/or operating profit margin; and ability to carry or repay debt.
Consideration must also be given as to how this information is provided to producers and the farm press. A summary document could be prepared with these key measures for major sectors in each province or region of Canada. A linkage could be included to the farm income forecasts released by AAFC, so that interested parties can access the comparative data for any farm type (and size of farm type) in a region through a web-based application. This web-based technology could allow interested parties to review any analyze the performance measures for any type and size of farm. As well, the website could be interactive, allowing producers (or lenders) to key in their own data for benchmark purposes. The program should be flexible enough to allow producers or lenders to store their entry and be able to access it in a subsequent period, and enter updated information. Suggestions that may require further study
1. Timing of First Release of Farm Profitability and Financial Performance Measures – Some of the indicators can most likely be calculated (historic and projected) and published within the next year, while reporting of other measures may require database linkages and further data analyses. The measures that can be produced with existing databases could be calculated and published within the next nine months.
2. Highlighting of Top 5 Indicators and Providing Access to Remaining
Indicators – The number of indicators for any farm type can be rather large, after considering reporting of the median and for some percentile rankings over a period of time. (The development of this list is covered in the following point). This summary list of indicators would be highlighted in reports releasing the results, and would provide linkages to the other indicators. These indicators should be useful to the commercial farm sector, to policy makers, and easily understood and reported on by the farm press and general media.

Canadian Agri-food Policy Institute Farm Profitability Report
17
3. Developing the List of the Top 5 Indicators – Over 12 measures of farm profitability and financial performance were ranked as useful and important by stakeholders. For reporting purposes, this list must be reduced to the top 4 or 5 indicators. Stakeholders suggested that, at a minimum, this list should include measures of cash flow and gross margin efficiency (or contribution margin), but without including program payments, profitability measures such as net profit per farm and/or operating profit margin, and ability to carry or repay debt. A working committee can be used to develop this list of 5 top indicators.
4. Using Web-Based Technologies – Web-based technologies should be used given
the large amount of data that can be generated by this initiative. The information should be based on specific farm types in each region, with a few sizes by farm type, and having historic data to illustrate trends. As well, a primary use of the data is intended to be farm businesses. This suggests that a web-based application be considered for producers to access the results for their farm type in any region. With easy to use GUI (graphical user interface), producers can click on their farm type and region within seconds to access the comparative data from which they can compare their farm operation. A working group can be developed to oversee the building of this web-based approach.
5. Reporting of History Along with Projections – An Analysis of trends in the
performance measures is a key value to stakeholders. Historic measures of the indicators could be provided, along with the forecasts and projections of these indicators by farm type.
6. Reporting Frequency and Coordination – Reporting frequency could be annual
for historic data and also annual for projections/forecasts, with the timing between these releases being close to 6 month apart. A working committee can be used to address this issue of reporting frequency, taking into account release dates for historic data (e.g., via STC) and forecasts (via AAFC).
3.5 Infrastructure to Support Calculation and Reporting of Measures Once a number of the above issues have been resolved, a plan should be developed that addresses the infrastructure and resource requirements to successfully implement the plan. This plan could address the databases that should be utilized, how they should be integrated, revisions to surveys, linkages with existing initiatives, processes used to tabulate the measures and then store them on a website, technology requirements, and infrastructure and resource requirements to execute the plan in a low-cost and efficient manner. Suggestions that may require further study
1. Development of an infrastructure and implementation plan – Once all of the parameters and issues associated with this concept are finalized, an infrastructure and implementation plan is required. Statistics Canada could lead this process, with input from AAFC and CAIS program (and/or its successor program)

Canadian Agri-food Policy Institute Farm Profitability Report
18
administrators. This report should be shared with CAPI and the project Steering Committee members.
3.6 Supporting Educational Activities Several primary audiences will utilize this information. They include producers, input suppliers to agriculture, government, and the farm media. An educational effort may be required with a few of these audiences, such as the farm press, so that the media properly interpret the state of a business sector. For example, many distinct business segments in a given sector may show improvements in profitability and financial performance, even as a sideways movement in earnings is occurring on a total sector basis. This potential dichotomy needs to be explained in simple terms to the media and policy makers. As well, the information released to the media in summaries will consist of the top four or five indicators for farm business financial performance. Suggestions that may require further study
1. Educational Approaches and Tools By Primary Audience – These indicators will be released for four primary audiences: producers, input suppliers to agriculture, government, and the farm media. An educational effort may be required with a few of these audiences, such as the farm press. As well, a different approach may be required with each audience, such as hosting a conference with farm writers, and using the services of extension and/or farm management services in provincial departments of agriculture and/or the Canadian Farm Business Advisory Service. A working committee can be used to develop and recommend approaches to address these needs.
Canadian Agri-food Policy Institute Farm Profitability Report
19
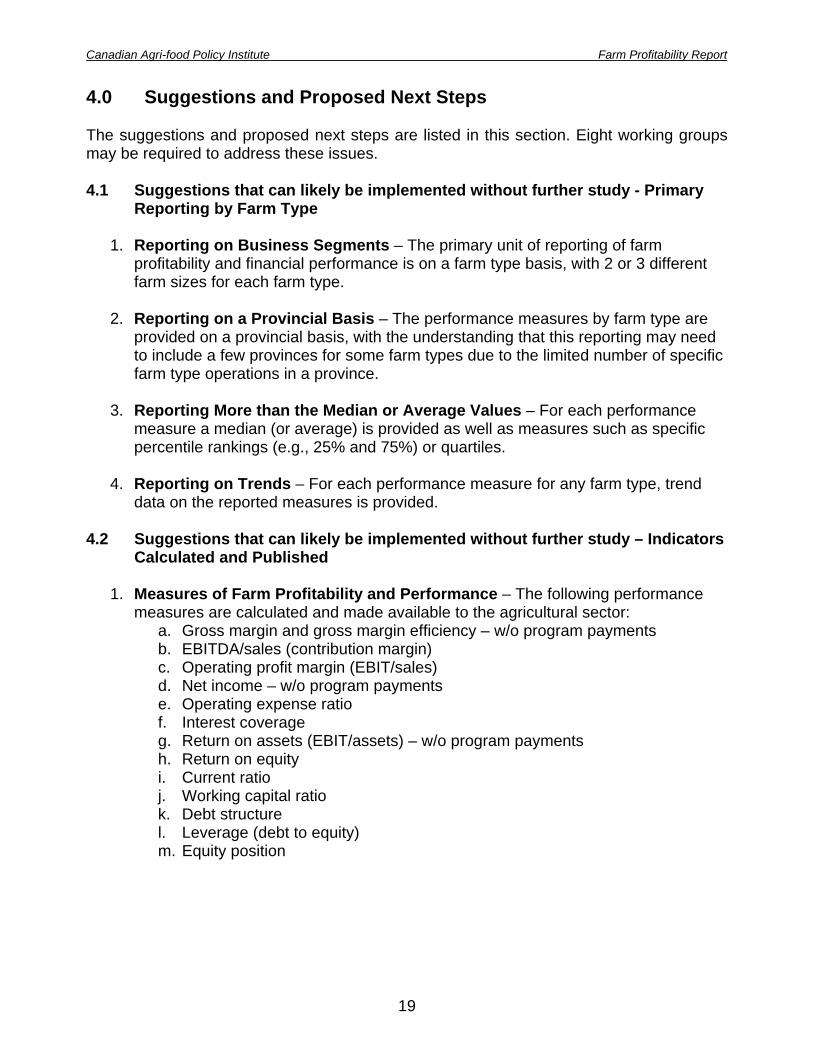
4.0 Suggestions and Proposed Next Steps The suggestions and proposed next steps are listed in this section. Eight working groups may be required to address these issues. 4.1 Suggestions that can likely be implemented without further study - Primary
Reporting by Farm Type
1. Reporting on Business Segments – The primary unit of reporting of farm profitability and financial performance is on a farm type basis, with 2 or 3 different farm sizes for each farm type.
2. Reporting on a Provincial Basis – The performance measures by farm type are
provided on a provincial basis, with the understanding that this reporting may need to include a few provinces for some farm types due to the limited number of specific farm type operations in a province.
3. Reporting More than the Median or Average Values – For each performance
measure a median (or average) is provided as well as measures such as specific percentile rankings (e.g., 25% and 75%) or quartiles.
4. Reporting on Trends – For each performance measure for any farm type, trend
data on the reported measures is provided. 4.2 Suggestions that can likely be implemented without further study – Indicators
Calculated and Published
1. Measures of Farm Profitability and Performance – The following performance measures are calculated and made available to the agricultural sector:
a. Gross margin and gross margin efficiency – w/o program payments b. EBITDA/sales (contribution margin) c. Operating profit margin (EBIT/sales) d. Net income – w/o program payments e. Operating expense ratio f. Interest coverage g. Return on assets (EBIT/assets) – w/o program payments h. Return on equity i. Current ratio j. Working capital ratio k. Debt structure l. Leverage (debt to equity) m. Equity position

Canadian Agri-food Policy Institute Farm Profitability Report
20
2. A Staged Approach to Releasing Performance Measures – In some cases, the source of data may not be robust enough to generate meaningful statistics for all farm types, while existing databases can be used to generate the majority of the suggested farm profitability and performance measures. The performance measures that can be calculated will be published as soon as possible, with the other performance measures published at a later date (e.g., a year later) after the necessary data linkages and/or modifications of data capture instruments are made.
3. Data Sources to Calculate Profitability and Performance Measures – Existing
databases can be used to calculate the measures to minimize any additional compliance burden on the farm sector and to minimize data collection costs. A starting source can be the tax filer data for incorporated farm operations. Linking databases (e.g., CAIS, FFS) and modifying survey instruments should be investigated where necessary to generate the performance measures.
4. Consistency with other Statistics Canada Reports on Financial Performance
Indicators – The financial indicators used are defined in a similar manner to those used by Statistics Canada (e.g., in “Financial Performance Indicators for Canadian Business”).
4.3 Suggestions that may require further study – What is Reported
1. Defining Farm Types or Business Segments – A ‘farm type’ can be based on: at least 50% of gross revenue being attributable to a specific type of farming activity or at least 50% of the gross margin being from a specific type of activity (or having a higher threshold such as 80% or 90 percent). As well, it should be determined whether an egg laying, broiler, hatching egg operations, or a turkey production operation should be defined as poultry, or whether each of these activities is a separate farm type. At the same time, a number of mixed farm types representing the uniqueness of agriculture in a province should be considered as distinct farm types. A working committee should further address this issue.
2. Defining Size Ranges by Farm Type – Once the farm types are defined, the
appropriate size ranges for each of these farm types should be established. The CAPI stakeholder consultations suggested that up to three sizes for any farm type is sufficient for comparative purposes. The size ranges need not be the same across farm types, with size range possibly based on structural considerations. For comparability purposes, the size ranges should be constant across regions for any farm type. A working committee can further address this issue.
3. Level of Aggregation by Farm Type – For some defined farm types, an
insufficient number of operations may exist in a province for reporting purposes (e.g., grain and oilseed operations in the Maritimes or hatching egg operations in the prairies). In such cases, the basic region used for reporting must become an aggregation of provinces. This issue can be addressed by the proposed farm type working committee after the farm type and size ranges have been finalized.

Canadian Agri-food Policy Institute Farm Profitability Report
21
4. Including other Financial Indicators – In the consultations, stakeholders
suggested using other financial indicators, such as debt repayment capacity and cash flow of the business. A working committee can explore whether these other potential indicators should be calculated and published.
5. Data Sources to Calculate Profitability and Performance Measures – Existing
databases can be used to calculate the measures to minimize any additional compliance burden on the farm sector and to minimize data collection costs. A starting source can be the tax filer data for incorporated farm operations. Linking databases (e.g., CAIS, FFS) and modifying survey instruments should be investigated where necessary to generate the performance measures. A working committee, with lead input from Statistics Canada, should address this issue, once a determination has been made on the farm profitability and financial indicators that will be calculated and reported.
6. Reporting of Realized Values and Projected Values of Indicators - Statistics
Canada provides annual (or semi-annual) reporting of the performance measures based on captured data, with AAFC providing forecasts of farm income and associated farm profitability and financial performance measures on an annual (or semi-annual) basis. Discussions between CAPI, Statistics Canada and AAFC may help resolve any issues arising from this suggestion.
4.4 Suggestions that may require further study – Linking with Existing Initiatives
1. Linking with Existing Initiatives – The potential outcome of this project has some linkages with existing initiatives, such as AAFC’s “benchmark for success” web initiatives and CD products, reporting of performance as part of the CAIS program, and the recent launch of net farm income projections by farm type. A committee should explore the synergies between the concepts, and propose how these initiatives can be combined, or whether they should be combined.
4.5 Suggestions that may require further study – Approach Used to Report
Indicators
1. Timing of First Release of Farm Profitability and Financial Performance Measures – Some of the indicators can most likely be calculated (historic and projected) and published within the next year, while reporting of other measures may require database linkages and further data analyses. The measures that could be produced with existing databases could be calculated and published within the next 9 months.
2. Highlighting of Top 5 Indicators and Providing Access to Remaining
Indicators – The number of indicators for any farm type can be rather large, especially when one considers reporting the median and some percentile rankings over a period of time. (The development of this list in covered in the following point). This summary list of indicators would be highlighted in reports releasing the results, and allow linkages to the other indicators. These indicators should be useful

Canadian Agri-food Policy Institute Farm Profitability Report
22
to the commercial farm sector and policy-makers, and should be easily understood and reported on by the farm press and general media.
3. Developing the List of the Top 5 Indicators - Over 12 measures of farm
profitability and financial performance were ranked as useful and important by stakeholders. For reporting purposes, this list must be reduced to the top 4 or 5 indicators. Stakeholders suggested that, at a minimum, this list should include measures of cash flow and gross margin efficiency or contribution margin (but without including program payments), profitability measures such as net profit per farm and/or operating profit margin, and ability to carry or repay debt. A working committee can be used to develop this list of 5 top indicators.
4. Using Web-Based Technologies – Web-based technologies should be used given
the large amount of data that can be generated by this initiative. The information produced should be based on specific farm types in each region, with a few sizes by farm type, and should include historic data to illustrate trends. As well, a primary use of the data is intended to be farm businesses. This suggests that a web-based application be considered for producers to access the results for their farm type in any region. With easy to use GUI (graphical user interface), producers can click on their farm type and region within seconds to access the comparative data from which they can compare their farm operations. A working group can be developed to oversee the building of this web-based approach.
5. Reporting of History Along with Projections – Analyses of trends in the
performance measures is a key value to stakeholders. Historic measures of the indicators could be provided, along with the forecasts and projections of these indicators by farm type.
6. Reporting Frequency and Coordination – Reporting frequency could be annual
for historic data and also annual for projections/forecasts, with the timing between these releases being close to 6 month apart. A working committee can be used to address this issue of reporting frequency, taking into account release dates for historic data (e.g., via Statistics Canada) and forecasts (via AAFC).
4.6 Suggestions that may require further study – Infrastructure to Support
Calculation and Reporting of Measures
1. Development of an infrastructure and implementation plan – Once all of the parameters and issues associated with this concept are finalized, an infrastructure and implementation plan is required. Statistics Canada could lead this process, with input from AAFC and CAIS program (and/or its successor program) administrators. This report should be shared with CAPI and the project Steering Committee members.

Canadian Agri-food Policy Institute Farm Profitability Report
23
4.7 Suggestions that may require further study – Supporting Educational Activities
1. Educational Approaches and Tools By Primary Audience – These indicators will
be released for four primary audiences: producers, input suppliers to agriculture, government, and the farm media. An educational component may be required with a few of these audiences, such as the farm press. As well, a different approach may be required with each audience, such as hosting a conference with farm writers, and using the services of extension and/or farm management services in provincial departments of agriculture and/or the Canadian Farm Business Advisory Service. A working committee can be used to develop and recommend approaches to address these needs.
Canadian Agri-food Policy Institute Farm Profitability Report
24
Annex A
Consultation Document on Farm Income By Dr. John Groenewegen
March 26, 2008 1.0 Introduction
2.0 Performance Indicators 3.0 Applying the Indicators 4.0 Questions for Workshop Participants
• Annex I - Indicators of Profitability and Financial Performance
• Annex II - Simulated Balance Sheet
• Annex III - Simulated Income Statement
• Annex IV - How the farm sector performs
• Annex V - Farm Sector Financial Performance Measures Currently Calculated by the Federal Government

Canadian Agri-food Policy Institute Farm Profitability Report
25
1.0 Introduction The Canadian Agri-Food Policy Institute (CAPI) is examining ways to measure and report the profitability of farm businesses. CAPI is a non-profit corporation that studies issues important to farmers and the agri-food sector. Our goal is to develop measures of farm profitability that will benefit producers by allowing them to gauge their performance; as well, these performance indicators can benefit government officials and suppliers of credit by providing them with a more accurate measure to assess the current status of farm operations in Canada. This spring, CAPI is inviting farmers to a special series of workshops to discuss farm income issues. Bank representatives, input suppliers and farm business specialists will also be attending. John Groenewegen, an agricultural economist and project manager for CAPI, will moderate the session. He will ask participants to give suggestions on the types of farm profitability information they’d like to see published annually. Currently, the federal government measures farm income at the aggregate level. But this measurement doesn’t provide enough detail to truly measure the profitability of Canada’s distinct business segments in the farm sector. This is particularly true as the sector has fewer farmers, and farm operations become larger in size; one must look beyond the aggregate data to fully assess the performance of the sector. Recently, the federal government published farm income projections by size and type of farm business. The two tables below provide some of these figures: Table 1 Per Farm Income by Farm Size, All Canada – 2007
Farm size Under $0.1 M
$0.1 M to $0.25 M
$0.25 M to $0.5 M
$0.5 M to $1.0 M
$1.0 M and over
All Farms
Net income per farm $2,236 $29,710 $71,733 $125,268 $259,439 $35,314 No. of Farms 105,149 38,360 23,753 12,648 7,907 187,818 Distribution of net income 4% 17% 26% 24% 31% Distribution of farms 56% 20% 13% 7% 4%
Source: AAFC
Table 1 and Table 2 show diversity in net income by farm size and by farm type. Table 1 shows that the larger farms account for a larger percent of net income. Table 2 shows a breakdown of data by farm type. Table 2 Per Farm Income by Farm Type, All Canada – 2007
Grain & Oilseed
Horticulture Dairy Cattle Hogs Other All Farms
Net income per farm $54,186 $71,387 $99,156 $2,393 $638 $15,475 $35,314 No. of Farms 69,767 12,012 14,133 57,900 4,816 29,190 187,818 Distribution of net income 57% 13% 21% 2% 0% 7% Distribution of farms 37% 6% 8% 31% 3% 16%
Source: AAFC

Canadian Agri-food Policy Institute Farm Profitability Report
26
2.0 Performance Indicators The farm income information noted in the preceding tables by farm size and type is a base from which one can develop performance measures that indicate the financial performance and profitability of various types of farm businesses. Below is a set of performance measures that may be considered as part of an ongoing reporting series on farm profitability and performance. Definitions of these performance measure indicators are also provided. We wish to know which of these performance indicators you would like to see reported on an annual basis. Indicators Capital turnover is defined as fixed assets/operating revenues, with revenues including revenues from government programs. Fixed assets are used to measure the invested capital, which excludes current assets such as inventory and savings, and includes any quota value. This measure indicates how efficiently fixed assets are used to generate revenues, and the ratio can be interpreted as the number of years of revenue required to equal the value of fixed assets. Contribution margin is defined as earnings before interest, taxes and depreciation (or amortization) (EBITA)/operating revenues. This ratio also measures the financial efficiency of the operation through funds generated from operations, and compares it to gross margin efficiency. It includes more expense areas, such as property taxes, labour employed, repair and maintenance, and custom work expenses.
Income Gross margin/farm – w/ program payments Gross margin/ farm – w/o program payments Net income/farm – w/ program payments Net income/farm – w/o program payments Profitability ratios Operating profit margin Return on assets – w/ program payments Return on assets – w/o program payments Return on equity Productive efficiency ratios Capital turnover Labour intensity
Financial efficiency ratios Gross margin efficiency – w/ program payments Gross margin efficiency – w/o program payments Operating expense ratio Contribution margin Interest coverage Liquidity ratios Current ratio Working capital ratio Debt structure Solvency ratios: Leverage (debt to equity) Equity position

Canadian Agri-food Policy Institute Farm Profitability Report
27
Current ratio5 is defined as current assets/current liabilities x 100%, with current assets excluding bonds and LT savings for this measure. This ratio shows the ability to meet financial obligations as they become due. Debt/asset ratio is defined as total liabilities/total assets x 100%. This shows the portion of total assets financed through debt. Debt structure is defined as the ratio of current liabilities/total liabilities x 100%. This shows the portion of total debt that is payable within the year. Equity position is measured as total equity/total assets x 100%. This shows the extent of asset ownership by the owner. Gross margin is defined as operating revenues minus cost of goods sold, with cost of goods sold defined as total operating expenses excluding interest costs, labour costs, property taxes, general building and fencing repairs, miscellaneous farm expenses, and depreciation; with no extraordinary items in operating revenues (e.g., sale of quota). Cost of goods (COGS) includes production-related expenses such as fertilizer, seeds, crop protection materials, production insurance, feed, and cost of replacement animals. Gross margin measures returns above variable costs of production. Gross margin efficiency is defined as gross margin/total operating revenues, with this measure reported with and without government revenues. This ratio measures the financial efficiency of the operation through funds generated from operations. Interest coverage (also referred to as times-interest-earned ratio) is defined as net income before income taxes and interest expense (EBIT)/interest expense. This measures ability to pay interest resulting from debt. Labour intensity is defined as labour expense/operating revenues (including government revenues). It measures the share of labour (as a factor of production) required to generate revenues (or a dollar of revenue). Leverage6 or debt/equity is defined as total liabilities/equity. This shows the degree to which creditors are financing the business compared to the owner. Net income is defined to be equivalent to earnings before taxes (EBT), which by definition includes allowances for depreciation/capital cost charges. On a per farm bases, this shows the absolute net income realized by farm types and sizes. Operating expense ratio is defined as the cost of goods sold/operating income, with cost of goods sold as defined for gross margin above. This measures the efficiency of the business by showing how many cents of direct expenses are required to generate a dollar of sales revenue. 5 Statistics Canada (STC) currently reports this measure for incorporated businesses, with STC defining this as working capital versus the current ratio. 6 This measure is currently reported by STC for incorporated businesses.

Canadian Agri-food Policy Institute Farm Profitability Report
28
Operating profit margin7 is defined as net income before income taxes and interest expense (EBIT)/total operating revenue. This measures the net result of the business with profit as a percent of sales revenues. Return on assets (ROA) is defined as net income before income taxes and interest expense (EBIT)/average total assets. This is also defined by some as return on capital employed8. Return on assets measures returns on investments made in the farm business. Return on Equity9 (ROE) (and sometime referred to as return on owner’s equity) is defined as net income before tax, or earnings before tax (EBT)/equity (net worth). This measure shows the measure of profitability to the owner of the operation based on owner investment. Working capital ratio is defined as working capital/operating expenses (including interest), where working capital equals current assets minus current liabilities. This measure indicates the ability to meet short-term financial obligations.
7 This measure is currently reported by STC for incorporated businesses. 8 This measure is currently reported by STC for incorporated businesses. 9 This measure is currently reported by STC for incorporated businesses; however, it uses earnings after tax (EAT).

Canadian Agri-food Policy Institute Farm Profitability Report
29
3.0 Applying the Indicators The indicators described in Section 2.0 are applied in the appendices of this document at the farm level versus the aggregate level. Providing information on these farm level profitability measures should be an improvement over the current approach, where a subset of the financial performance measures is reported at an aggregate level. Providing information on farm level profitability and on the associated financial indicators by farm size and type can significantly improve the information flow on how farm businesses are faring.
• Annex I provides simulated values of farm profitability and financial performance measures for illustration of all of the performance measures listed in Section 2.0. It shows numbers for a hypothetical farm operation.
• Annex II is the associated simulated balance sheet.
• Annex III has the simulated income statement. These numbers don’t describe an
actual farm, but they do provide a useful example of the financial performance measures for a farm business.
• Annex IV provides preliminary information on a set of performance indicators for
incorporated farms in Canada. It shows indicators by the size of the farm, the type of farm, and trends. These figures refer to incorporated farms, which make up a significant share of agricultural production in Canada. The tables begin at a gross farm receipt level of $50 thousand. These performance indicators can be computed through the use of income statement and balance sheet information from tax filer data for incorporated businesses. These data can be accessed in a confidential manner by Statistics Canada for statistical purposes.
• Annex V provides the performance indicators currently reported by Statistics
Canada for the agriculture sector using aggregate farm income and aggregate farm sector balance sheets. As well, Statistics Canada currently computes a subset of these performance measures for corporations by a broad North American Industry Classification System (NAICS) code, where agriculture is part of fishing, hunting, and trapping (Also noted in Annex I).
Canadian Agri-food Policy Institute Farm Profitability Report
30
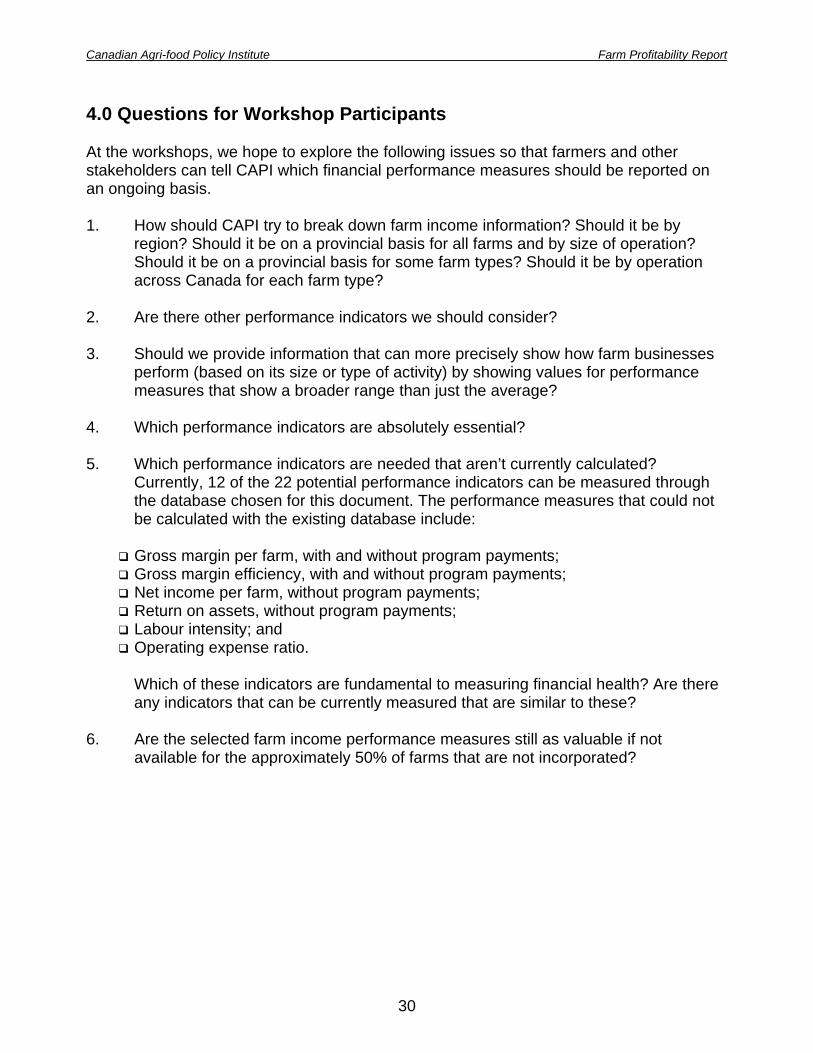
4.0 Questions for Workshop Participants At the workshops, we hope to explore the following issues so that farmers and other stakeholders can tell CAPI which financial performance measures should be reported on an ongoing basis. 1. How should CAPI try to break down farm income information? Should it be by
region? Should it be on a provincial basis for all farms and by size of operation? Should it be on a provincial basis for some farm types? Should it be by operation across Canada for each farm type?
2. Are there other performance indicators we should consider? 3. Should we provide information that can more precisely show how farm businesses
perform (based on its size or type of activity) by showing values for performance measures that show a broader range than just the average?
4. Which performance indicators are absolutely essential? 5. Which performance indicators are needed that aren’t currently calculated?
Currently, 12 of the 22 potential performance indicators can be measured through the database chosen for this document. The performance measures that could not be calculated with the existing database include:
Gross margin per farm, with and without program payments; Gross margin efficiency, with and without program payments; Net income per farm, without program payments; Return on assets, without program payments; Labour intensity; and Operating expense ratio.
Which of these indicators are fundamental to measuring financial health? Are there any indicators that can be currently measured that are similar to these?
6. Are the selected farm income performance measures still as valuable if not
available for the approximately 50% of farms that are not incorporated?

Canadian Agri-food Policy Institute Farm Profitability Report
31
Annex I: Indicators of Profitability and Financial Performance The table below shows a hypothetical farm operation with gross sales of $2.6 million, earnings before taxes of $505,400, using $6.0 million in assets. A balance sheet and income statement are appended in Annexes II and III. Example Performance Measures Based on Simulated Financial Statements Current Year Prior Year Income Gross margin - with program payments $1,260,400 $1,085,000 Gross margin - without program payments $1,160,400 $735,000 Net income - with program payments $505,400 $314,400 Net income - without program payments $405,400 ($35,600) Profitability ratios: Operating profit margin 24% 19% Return on assets - with program payments 10% 8% Return on assets - without program payments 9% 2% Return on equity 13% 9% Productive efficiency ratios: Capital turnover Labour intensity 2.1 2.3 0.09 0.09 Financial efficiency ratios: Gross margin efficiency – w program payments 48% 46% Gross margin efficiency-w/o program payments 45% 31% Operating expense ratio 52% 54% Contribution margin 29% 26% Interest coverage 5.2 3.4 Liquidity ratios: Current ratio 2.4 1.9 Working capital $365,000 $235,000 Working capital ratio 24% 16% Debt structure 12% 12% Solvency ratios: Leverage (debt to equity) 0.58 0.64 Equity position 63% 61% Note: These measures are based on the simulated set of financial statements in Annex II and III
Canadian Agri-food Policy Institute Farm Profitability Report
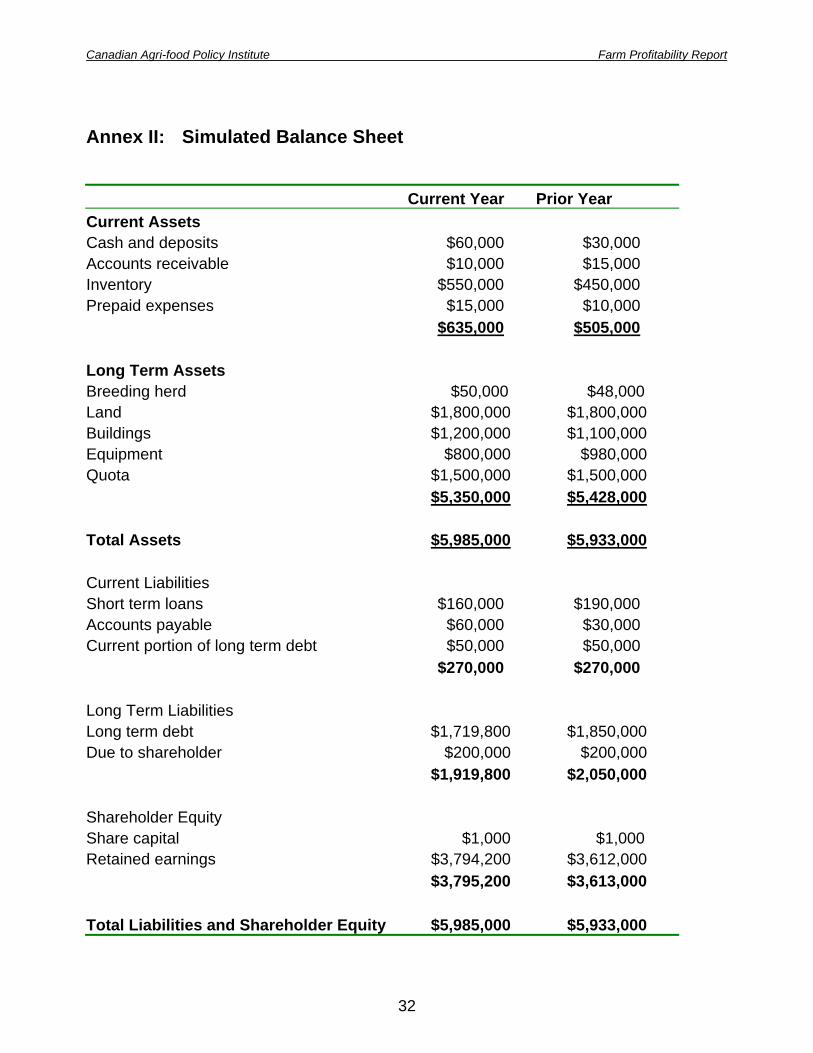
32
Annex II: Simulated Balance Sheet Current Year Prior Year Current Assets Cash and deposits $60,000 $30,000 Accounts receivable $10,000 $15,000 Inventory $550,000 $450,000 Prepaid expenses $15,000 $10,000 $635,000 $505,000 Long Term Assets Breeding herd $50,000 $48,000 Land $1,800,000 $1,800,000 Buildings $1,200,000 $1,100,000 Equipment $800,000 $980,000 Quota $1,500,000 $1,500,000 $5,350,000 $5,428,000 Total Assets $5,985,000 $5,933,000 Current Liabilities Short term loans $160,000 $190,000 Accounts payable $60,000 $30,000 Current portion of long term debt $50,000 $50,000 $270,000 $270,000 Long Term Liabilities Long term debt $1,719,800 $1,850,000 Due to shareholder $200,000 $200,000 $1,919,800 $2,050,000 Shareholder Equity Share capital $1,000 $1,000 Retained earnings $3,794,200 $3,612,000 $3,795,200 $3,613,000 Total Liabilities and Shareholder Equity $5,985,000 $5,933,000

Canadian Agri-food Policy Institute Farm Profitability Report
33
Annex III: Simulated Income Statement Current Year Prior Year Revenue Market Receipts $2,450,000 $1,950,000 Program Payments $100,000 $350,000 Custom Work $50,000 $50,000 $2,600,000 $2,350,000 Cost of Goods Sold Livestock purchases $160,000 $150,000 Feed $379,600 $350,000 Veterinary and related $25,000 $25,000 Seed $50,000 $50,000 Crop inputs $300,000 $280,000 Production insurance $80,000 $70,000 Hired labour $125,000 $120,000 Fuel and Utilities $200,000 $200,000 Other Material $20,000 $20,000 $1,339,600 $1,265,000 Gross Margin Other Expenses Land rent $50,000 $50,000 Interest cost $120,000 $132,600 Property tax and insurance $150,000 $150,000 Repair and Maintenance $120,000 $110,000 Office expenses $50,000 $50,000 Management salary $100,000 $100,000 Professional services $25,000 $25,000 Depreciation $140,000 $153,000 $755,000 $770,600 EBITDA $765,400 $600,000 EBIT $625,400 $447,000 EBT (Net Income) $505,400 $314,400 Income Taxes $123,200 $50,300 Earnings After Tax (EAT) $382,200 $264,100 Retained Earnings (beginning) $3,612,000 $3,547,900 Dividends $200,000 $200,000 Net Income $382,200 $264,100 Retained Earnings (ending) $3,794,200 $3,612,000

Canadian Agri-food Policy Institute Farm Profitability Report
34
Annex IV: How the farm sector performs Farm Size and Profitability The following is a “preliminary” set of performance measures for the farm sector using tax data from the 1997 to 2006 calendar year for incorporated farms.10 These performance measures are provided in the next three tables, with the measure being the median value for the groupings. Preliminary Performance Indicators by Farm Size (Per Farm Median), Canada, 2006
Performance Indicators $50,000 to $250,000
$250,000 to $500,000
$500,000 to $1.0 M
$1.0 M to $2.5 M
$2.5 M and Over
All Farms > $50,000
Income: Net income/farm $3,438 $27,035 $49,722 $99,542 $200,455 $22,904 Profitability ratios: Operating profit margin 8.6% 13.5% 13.3% 12.2% 7.7% 11.8% Return on assets 2.0% 5.0% 5.4% 5.9% 6.1% 4.5% Return on equity 2.5% 5.7% 7.5% 9.3% 9.7% 5.7% Productive efficiency ratios: Capital turnover 3.7 2.4 2.1 1.7 0.9 2.3 Financial efficiency ratios: Contribution margin 22.5% 25.6% 24.3% 20.7% 13.3% 23.3% Interest coverage 133.7% 232.1% 232.1% 234.3% 244.0% 209.6% Liquidity ratios: Current ratio 2.5 1.8 1.6 1.4 1.3 1.7 Working capital $49,077 $78,921 $116,840 $172,385 $396,453 $79,855 Debt structure 0.2 0.2 0.3 0.4 0.5 0.3 Solvency ratios: Leverage (debt to equity) 0.4 0.8 0.9 1.1 1.6 0.7 Equity position 47.0% 42.2% 40.9% 36.7% 31.9% 41.5% No. of Farms 8,572 8,174 6,638 3,412 1,193 27,989 Source: Computations of incorporated farm business tax filer data Incorporated farms make up a large share of agricultural production, particularly as the size of operations increase11.
10 The data of just under 28,000 agricultural corporations (those with gross farm receipts of over $50,000 averaged $770,000) on the T2 tax file for 2006 were used to calculate the “preliminary” performance indicators shown in this section. At the upper sales class ranges, incorporated farms accounted for 59% of the farms and sales volume of farms with sales of between $0.5 and $1.0 million, 73% of farms and sales with sales between $1.0 and $2.5 million, and 83% of farms and 88% of sales for farms with sales over $2.5 million (of which there were 1,366 incorporated farms). 11 Based on 2006 Census of Agriculture data, there were 229,373 farm operations in Canada, which defines a farm as an operation which produces at least one of a lengthy list of agricultural products intended for sale, with 36,617 incorporated farms accounting for 53.5% of cash receipts. Of these, 7,477 or 20.4% of farm corporations had gross farm receipts of less than $50,000. This means that 29,140 farm corporations, or

Canadian Agri-food Policy Institute Farm Profitability Report
35
How the farm sector performs Farm Type and Profitability This table provides similar measures as those in the above table, except it is based on farm type to indicate farm level profitability and financial performance. Preliminary Performance Measures by Farm Type (Per Farm Median), Canada, 2006
Performance Measure Grain & Oilseed
Potatoes Fruit & Veg
Green house
Beef Hogs Poultry Dairy All Farms
Income measures (per farm): Net income/farm $18,105 $39,284 $27,876 $24,470 $8,233 $5,186 $51,235 $37,591 $22,904 Profitability ratios: Operating profit margin 10.8% 10.6% 10.8% 6.3% 6.5% 6.6% 12.9% 18.0% 11.8% Return on assets 3.8% 4.5% 6.4% 5.6% 2.6% 3.4% 5.8% 5.7% 4.5% Return on equity 4.9% 7.9% 11.6% 10.5% 3.5% 4.9% 8.3% 6.6% 5.7% Productive efficiency ratios: Capital turnover 2.7 2.2 1.7 1.4 2.1 1.9 1.3 2.4 2.3 Financial efficiency ratios: Contribution margin 24.6% 21.3% 19.6% 13.4% 15.7% 14.5% 19.3% 29.5% 23.3% Interest coverage 218.3% 184.3% 312.4% 189.3% 151.4% 118.1% 294.0% 214.7% 209.6% Liquidity ratios: Current ratio 2.0 1.3 1.5 1.4 2.2 1.4 1.2 1.6 1.7 Working capital $100,443 $73,095 $38,379 $54,064 $157,960 $57,245 $16,279 $57,737 $79,855 Debt structure 0.3 0.4 0.3 0.4 0.4 0.3 0.2 0.2 0.3 Solvency ratios: Leverage (debt/equity) 0.7 0.8 0.6 0.7 0.7 1.1 0.8 1.0 0.7 Equity position 48.7% 38.6% 36.3% 30.3% 40.3% 25.4% 43.0% 34.9% 41.5% No. of Farms 6,428 487 1,117 768 2,145 1,732 1,558 5,976 27,989
Source: Computations of incorporated farm business tax filer data
79.6% of all incorporated farms, had gross farm receipts over $50,000, which is the starting point for a farm business in the following tables.

Canadian Agri-food Policy Institute Farm Profitability Report
36
How the farm sector performs Trends in Farm Business Profitability and Financial Performance This table shows trends over time for farms that had sales of more than $500,000 in any year since 2000. It shows that the operating profit margin has been fairly consistent. The number of farms in this category has increased from just under 8,000 in 2000 to over 11,000 in 2006. Return on assets and equity was highest in 2001 at 11.1% and 7.4% respectively, with these returns lowest in 2006 at 8.2% and 5.6%. Trends in Preliminary Performance Indicators for Farms with Annual Sales Greater
Than $500,000 (Per Farm Median), Canada, 2000 to 2006 Performance Indicator 2000 2001 2002 2003 2004 2005 2006
Income: Net income/farm $69,440 $76,787 $71,842 $57,632 $74,539 $69,873 $65,411 Profitability ratios: Operating profit margin 12.2% 12.9% 12.1% 10.9% 12.2% 11.9% 12.1% Return on assets 7.0% 7.4% 6.5% 5.7% 6.2% 5.8% 5.6% Return on equity 10.5% 11.1% 10.3% 8.7% 9.5% 9.0% 8.2% Productive efficiency ratios: Capital turnover 1.5 1.5 1.6 1.7 1.7 1.8 1.9 Financial efficiency ratios: Contribution margin 21.9% 22.7% 22.3% 20.7% 21.9% 21.7% 22.1% Interest coverage 256.4% 283.1% 293.0% 232.7% 276.8% 259.3% 233.8% Liquidity ratios: Current ratio 1.4 1.5 1.5 1.4 1.4 1.4 1.5 Working capital $118,101 $139,495 $141,947 $105,297 $119,778 $122,767 $140,423Debt structure 0.3 0.3 0.3 0.3 0.3 0.3 0.3 Solvency ratios: Leverage (debt to equity) 1.2 1.1 1.1 1.1 1.0 1.0 1.0 Equity position 37.6% 38.9% 39.0% 37.3% 37.8% 37.8% 38.3% No. of Farms 7,894 8,956 9,531 9,799 10,354 10,676 11,243 Source: Computations of incorporated farm business tax filer data

Canadian Agri-food Policy Institute Farm Profitability Report
37
Annex V Farm Sector Financial Performance Measures Currently Calculated by the Federal Government Statistics Canada in the Balance Sheet of the Agriculture Sector (Catalogue no. 21-016-XIE) computes and publishes for each province the following financial performance indicators based on aggregate farm income measures, and sector wide balance sheet (based on market value estimates for assets). The values in brackets are 2006 values for all of Canada.
Current ratio; (2.01) Acid test; (0.35) Debt structure; (0.21) Leverage; (0.25) Equity position; (0.80) Debt to asset ratio; (0.20) Capital Turnover; (5.21) Return on assets; (1.7%) Return on equity; (0.8%) Interest coverage. (1.54)
STC in Financial and Taxation Statistics for Enterprise (Catalogue no. 61-219-XIE) calculates the following indicators for the sector that includes agriculture, fishing, hunting and trapping. The first five are part of the set proposed in this document, and are currently measured (see Tables 4 to 6).
Operating profit margin; Return on capital employed, or return on assets; Return on equity; Debt to equity, or leverage; Current ratio, and quick ratio; Receivable turnover; Inventory turnover; Income taxes to profit.
STC in Financial Performance Indicators for Canadian Business (Catalogue no. 61-224-XCB) provides computations of the following measures by NAICS code.
Net profit margin; Operating profit margin, (before and after tax); Gross profit margin; Operating revenue to operating assets; Pre-tax profit to assets; Return on capital employed, or return on assets; Return on equity; Receivable turnover; Inventory turnover; Current ratio, and quick ratio; Debt to equity, or leverage; Debt to assets; Interest coverage; Income tax to profit.

Canadian Agri-food Policy Institute Farm Profitability Report
38
Annex B
Stakeholder Feedback on Profitability Measures
B.1 Agreement with Suggested Profitability and Financial Performance Measures B.2 Importance of Measures that Were Not Presented B.3 Other Potential Measures to Consider B.4 Reporting More than the Median or Average B.5 Reporting by Farm Type and Farm Size B.6 Reporting by Farm Type on a Regional Basis B.7 Source Data from Incorporated Farms B.8 Other Comments or Insights
• Annex I – Comments Received on Performance Measures
• Annex II – Comments Received on Listed Performance Measures not Calculated
• Annex III – Comments Received on Missed Performance Measures
• Annex IV – Comments Received on Reporting More than the Median
• Annex V – Comments Received on Measures by Sales Class
• Annex VI – Comments Received on Measures by Farm Type
• Annex VII Comments Received on Measures for Various Sizes by Farm Type
• Annex VIII – Comments Received on Measures for Farm Type by Region
• Annex IX – Comments Received on Using only Data from Incorporated Farms to calculate Profitability and Performance Measures
• Annex X – Other Comments or Insights Received
Canadian Agri-food Policy Institute Farm Profitability Report
39
Annex B Stakeholder Feedback on Profitability Measures
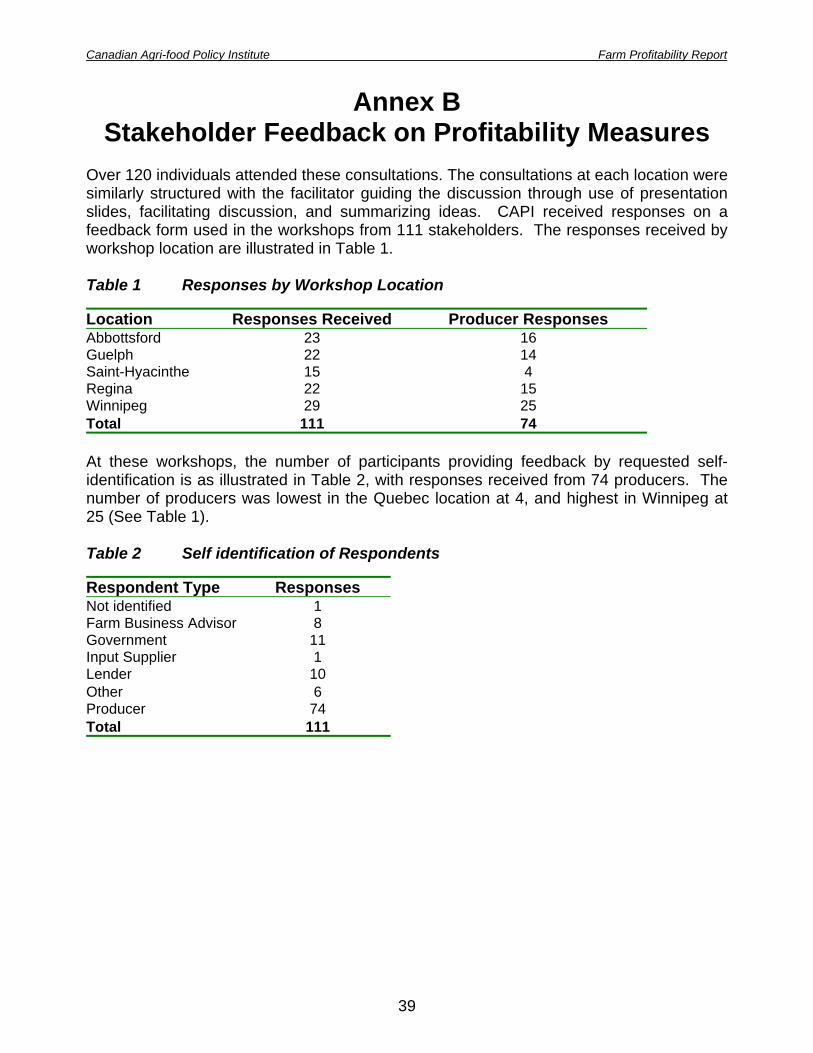
Over 120 individuals attended these consultations. The consultations at each location were similarly structured with the facilitator guiding the discussion through use of presentation slides, facilitating discussion, and summarizing ideas. CAPI received responses on a feedback form used in the workshops from 111 stakeholders. The responses received by workshop location are illustrated in Table 1. Table 1 Responses by Workshop Location Location Responses Received Producer Responses Abbottsford 23 16 Guelph 22 14 Saint-Hyacinthe 15 4 Regina 22 15 Winnipeg 29 25 Total 111 74 At these workshops, the number of participants providing feedback by requested self-identification is as illustrated in Table 2, with responses received from 74 producers. The number of producers was lowest in the Quebec location at 4, and highest in Winnipeg at 25 (See Table 1). Table 2 Self identification of Respondents Respondent Type Responses Not identified 1 Farm Business Advisor 8 Government 11 Input Supplier 1 Lender 10 Other 6 Producer 74 Total 111

Canadian Agri-food Policy Institute Farm Profitability Report
40
B.1 Agreement with Suggested Profitability and Financial Performance Measures
Prior to the workshops, participants were provided with a consultation document (See Annex A), which provided an overview of the initiative and the purpose of the consultations with stakeholders. In the documentation, the following performance indicators were presented with a brief discussion of what concept is measured by each indicator. Indicators These profitability and financial performance measures were discussed with stakeholders at the workshops12. Respondents were then asked to agree, neither agree nor disagree, or disagree to the following statement on a feedback form (Q 1): “The following performance measures are required to measure the financial health and profitability of farm businesses, and each of these performance measures should be published.” The responses of the 74 producers who provided feedback is provided in Figure 1, and the responses of the 37 other attendees is provided in Figure 2. There was more than 50% agreement with this statement for all measures by the other respondents (see Figure 2). The majority of producers did not agree with the statement for the measures when they included program payments (e.g., gross margin efficiency with program payments), while they supported the measure when program payments were excluded. The majority of producers also did not agree with the statement when applied to the productive efficiency measures (although there was a high percentage of those who neither agreed nor disagreed).
12 The list provided is as illustrated in Figure 1. These are also described in Annex I.
Income Gross margin/farm – w/ program payments Gross margin/ farm – w/o program payments Net income/farm – w/ program payments Net income/farm – w/o program payments Profitability ratios Operating profit margin Return on assets – w/ program payments Return on assets – w/o program payments Return on equity Productive efficiency ratios Capital turnover Labour intensity
Financial efficiency ratios Gross margin efficiency – w/ program payments Gross margin efficiency – w/o program payments Operating expense ratio Contribution margin Interest coverage Liquidity ratios Current ratio Working capital ratio Debt structure Solvency ratios: Leverage (debt to equity) Equity position

Canadian Agri-food Policy Institute Farm Profitability Report
41
Figure 1 Agreement with Suggested Profitability Measures - Producers
Producer Responses0% 10% 20% 30% 40% 50% 60% 70% 80% 90% 100%
Gross margin/farm – with program payments
Gross margin/ farm – without program payments
Net income/farm – with program payments
Net income/farm – without program payments
Operating profit margin
Return on assets – with program payments
Return on assets – without program payments
Return on equity
Capital turnover
Labour intensity
Gross margin efficiency – with program payments
Gross margin efficiency - without program payments
Operating expense ratio
Contribution margin
Interest coverage
Current ratio
Working capital ratio
Debt structure
Leverage (debt to equity)
Equity position
Agree Neither Agree Nor Disagree Disagree
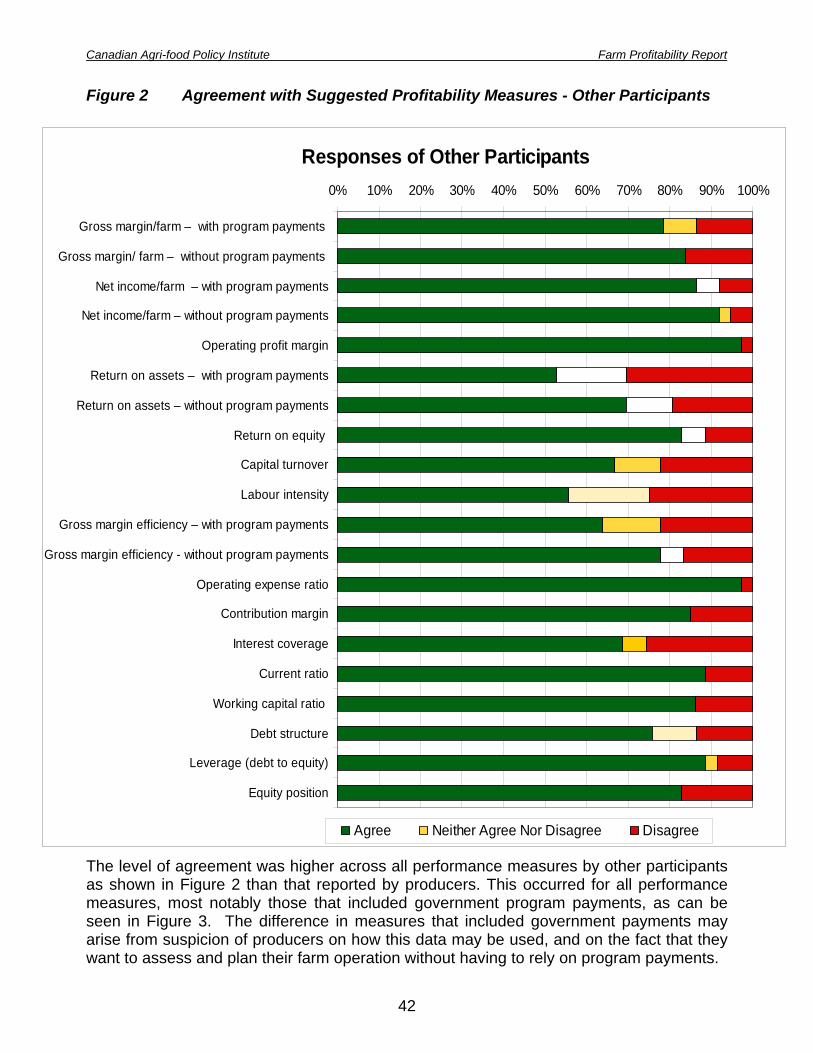
Canadian Agri-food Policy Institute Farm Profitability Report
42
Figure 2 Agreement with Suggested Profitability Measures - Other Participants The level of agreement was higher across all performance measures by other participants as shown in Figure 2 than that reported by producers. This occurred for all performance measures, most notably those that included government program payments, as can be seen in Figure 3. The difference in measures that included government payments may arise from suspicion of producers on how this data may be used, and on the fact that they want to assess and plan their farm operation without having to rely on program payments.
Responses of Other Participants0% 10% 20% 30% 40% 50% 60% 70% 80% 90% 100%
Gross margin/farm – with program payments
Gross margin/ farm – without program payments
Net income/farm – with program payments
Net income/farm – without program payments
Operating profit margin
Return on assets – with program payments
Return on assets – without program payments
Return on equity
Capital turnover
Labour intensity
Gross margin efficiency – with program payments
Gross margin efficiency - without program payments
Operating expense ratio
Contribution margin
Interest coverage
Current ratio
Working capital ratio
Debt structure
Leverage (debt to equity)
Equity position
Agree Neither Agree Nor Disagree Disagree
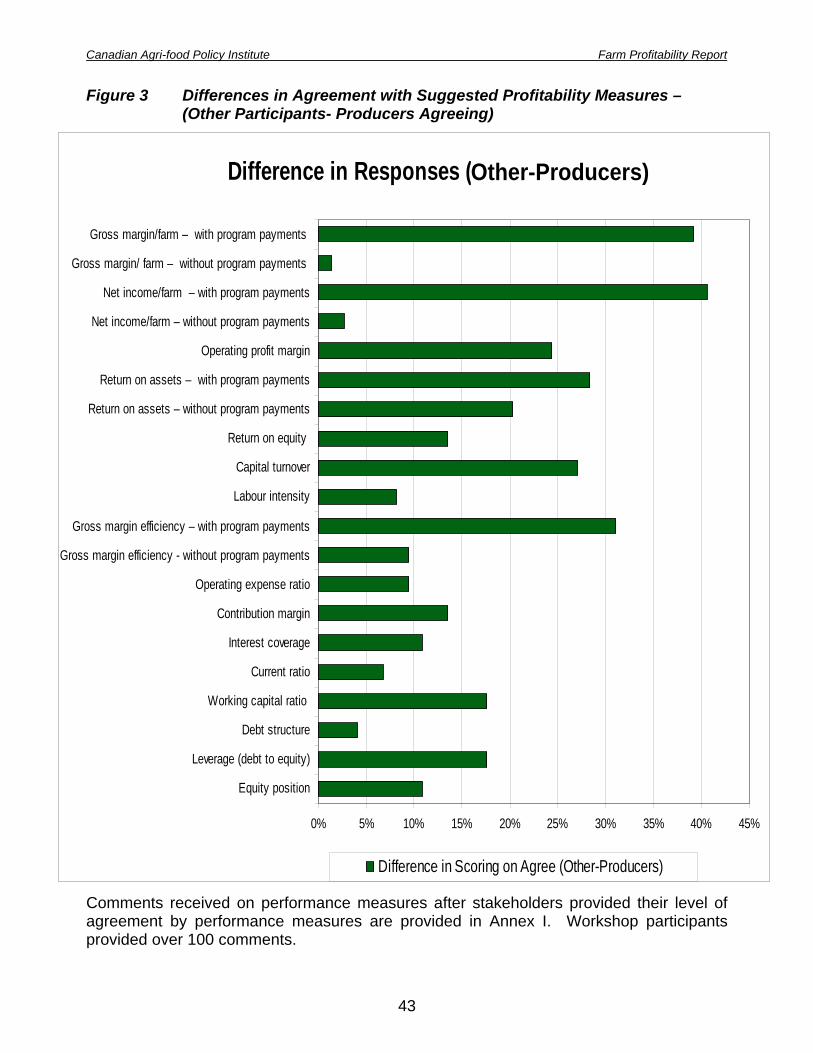
Canadian Agri-food Policy Institute Farm Profitability Report
43
Figure 3 Differences in Agreement with Suggested Profitability Measures – (Other Participants- Producers Agreeing)
Comments received on performance measures after stakeholders provided their level of agreement by performance measures are provided in Annex I. Workshop participants provided over 100 comments.
Difference in Responses (Producer - Other)
0% 5% 10% 15% 20% 25% 30% 35% 40% 45%
Gross margin/farm – with program payments
Gross margin/ farm – without program payments
Net income/farm – with program payments
Net income/farm – without program payments
Operating profit margin
Return on assets – with program payments
Return on assets – without program payments
Return on equity
Capital turnover
Labour intensity
Gross margin efficiency – with program payments
Gross margin efficiency - without program payments
Operating expense ratio
Contribution margin
Interest coverage
Current ratio
Working capital ratio
Debt structure
Leverage (debt to equity)
Equity position
Difference in Scoring on Agree (Other-Producers)
Other-Producers)

Canadian Agri-food Policy Institute Farm Profitability Report
44
B.2 Importance of Measures that Were Not Presented The database of incorporated farm operations used to illustrate actual performance measures by farm size and type did not allow for all of the measures discussed above to be measured and reported. In this context, the importance of these excluded measures (a numerical value could not be provided) was obtained through the following question (Q.4): “The following performance measures currently cannot be published based on existing data sources. Do you agree that effort should be made to publish these measures?” Responses received from producers are provided in Figure 4, and by the other respondents in Figure 5. The responses are not significantly different than those illustrated in Figures 1 and 2. The majority of producers support efforts being made to report on: (i) gross margin and gross margin efficiency (without program payments), (ii) net farm income (without program payments), (iii) return on assets without program payments), and (iv) the operating expense ratio. Comments provided by participants through the feedback forms are provided in Annex II. Figure 4 Agreement with Including Profitability Measures That Were Not
Measured - Producers
Producer Responses0% 10% 20% 30% 40% 50% 60% 70% 80% 90% 100%
Gross margin/farm – withprogram payments
Gross margin/ farm – without program payments
Net income/farm – withoutprogram payments
Return on assets – withoutprogram payments
Labour intensity
Gross margin efficiency –with program payments
Gross margin efficiency -without program payments
Operating expense ratio
Agree Neither Agree Nor Disagree Disagree
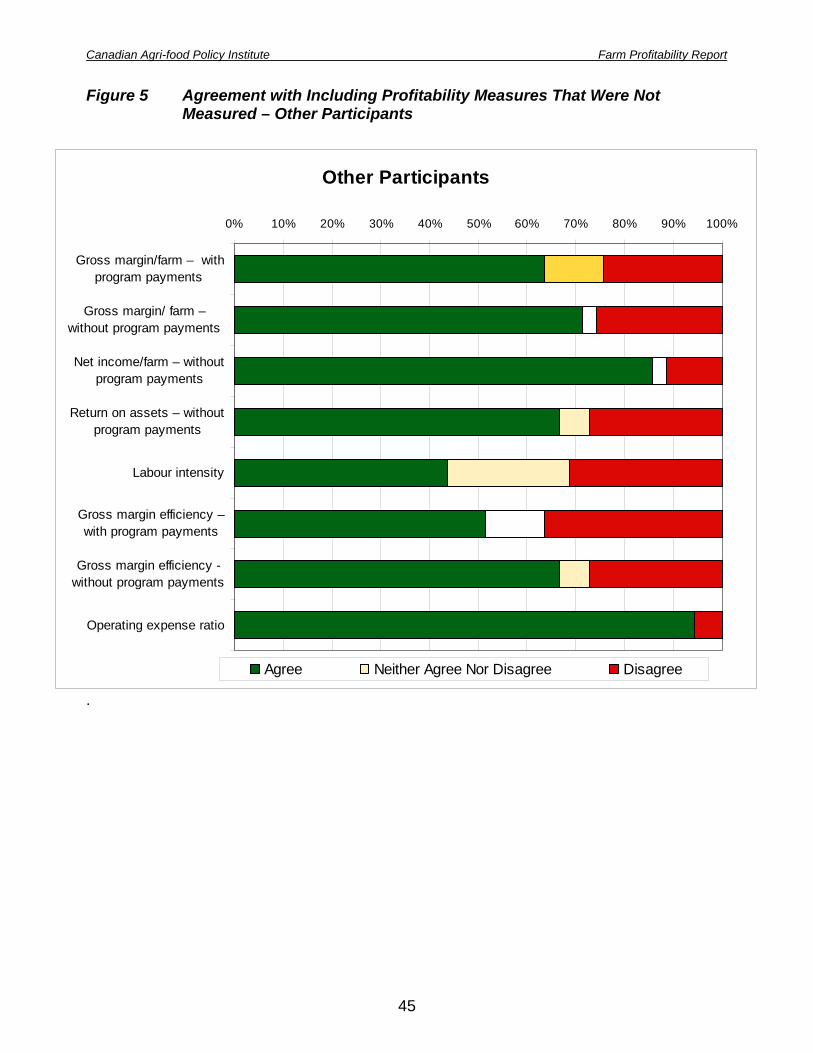
Canadian Agri-food Policy Institute Farm Profitability Report
45
Figure 5 Agreement with Including Profitability Measures That Were Not Measured – Other Participants
.
Other Participants
0% 10% 20% 30% 40% 50% 60% 70% 80% 90% 100%
Gross margin/farm – withprogram payments
Gross margin/ farm – without program payments
Net income/farm – withoutprogram payments
Return on assets – withoutprogram payments
Labour intensity
Gross margin efficiency –with program payments
Gross margin efficiency -without program payments
Operating expense ratio
Agree Neither Agree Nor Disagree Disagree

Canadian Agri-food Policy Institute Farm Profitability Report
46
B.3 Other Potential Measures to Consider After a discussion on the performance measures presented, stakeholders were then asked the question (Q. 2) “Are there any performance measures that were not presented that should be provided and published on a regular basis.” Fifty percent of respondents indicated that there are other measures that can be considered, as illustrated in Table 3. Table 3 Response to Performance Measures Not Presented
Response Percentages Blank (no Response) 10% No 14% Not Sure 27% Yes 50% Total 100% In discussions with stakeholders the general themes of performance measures that were not presented included measures that:
Capture the ability to repay debt, such as debt carrying capacity and payment coverage ratio;
Capture costs and margins on a per unit of production basis (either input or output); Have allowances for risk.
Specific comments received through the feedback form on this question are provided in Annex III. B.4 Reporting More than the Median or Average To obtain insight on whether more than the average or median should be reported, the following question (Q. 3) was asked: “In addition to the performance measures published for the average (or median) operation in a business segment, farm profitability performance measures should also be provided for operations that are above or below this mid-point to show the variability in the sector (e.g. for the average (or median at the 50% ranking) as well as for operations at the 30% ranking, and the 70% ranking).” Responses are provided in Table 4, with 84% agreeing with the statement. This indicates that more than just an average value or the median value for any business segment should be reported. Comments received from participants through the feedback form are provided in Annex IV. Table 4 Agreement with Need to Report More than the Median (average)
Response Producers Others Blank 4% 8% Agree 84% 84% Neither 1% 3% Disagree 11% 5% Total 100% 100%

Canadian Agri-food Policy Institute Farm Profitability Report
47
B.5 Reporting By Farm Type and Farm Size In a series of questions, respondents were asked whether these measures should be provided based on various sales classes for farm type, by farm type, by farm type with a few different sizes of operations, and by region (for a given farm size and type). The discussion and reported responses indicate that the information should be provided for:
various farm types, and with a few size ranges by farm type.
Stakeholders were asked if they agreed with the following statement (Q. 5): “Farm business performance measures should be provided and published based on various sizes of farm operation (e.g., by sales class such as under $250,000, between $250,000 and $500,000, $500,000 to $1 million, $1 million to $2.5 million, and over $2.5 million).” The level of agreement is shown in Figure 6 and 7 (the first bar). The written responses to the question on providing information by sales class (independent of farm types) is in Annex V. Participants were then asked whether these performance measures should be reported on a farm type basis. The statement they were asked their agreement on was: (Q. 6) “Farm business performance measures should be provided and published based on various types of farm operations (e.g., for grain and oilseed, beef and cattle, hogs, dairy, poultry, and horticultural operations.).” The response to agreement by farm type questions is illustrated in Figure 6 for producers and in Figure 7 for the other participants (the second bar). Written comments received on this area are provided in Annex VI. These comments indicate that how farm type is defined is an issue that needs further consideration. Stakeholders were then asked if they agreed that reporting should be for a few sizes of operation by farm type. There was agreement with the statement (Q. 7) “For each of these farm types (e.g., grain and oilseed), farm business performance measures should be provided and published based on various sizes of farm operation. (e.g., by sales class as noted above (Q1) for farm types such as for grain and oilseed, beef and cattle, hogs, dairy, poultry, and horticultural operations, when the data permit such calculations.)” The responses are shown in the third bar in Figures 6 and 7. Support was well over 90% for providing data for various sizes by farm type. Written comments received are provided in Annex VII.
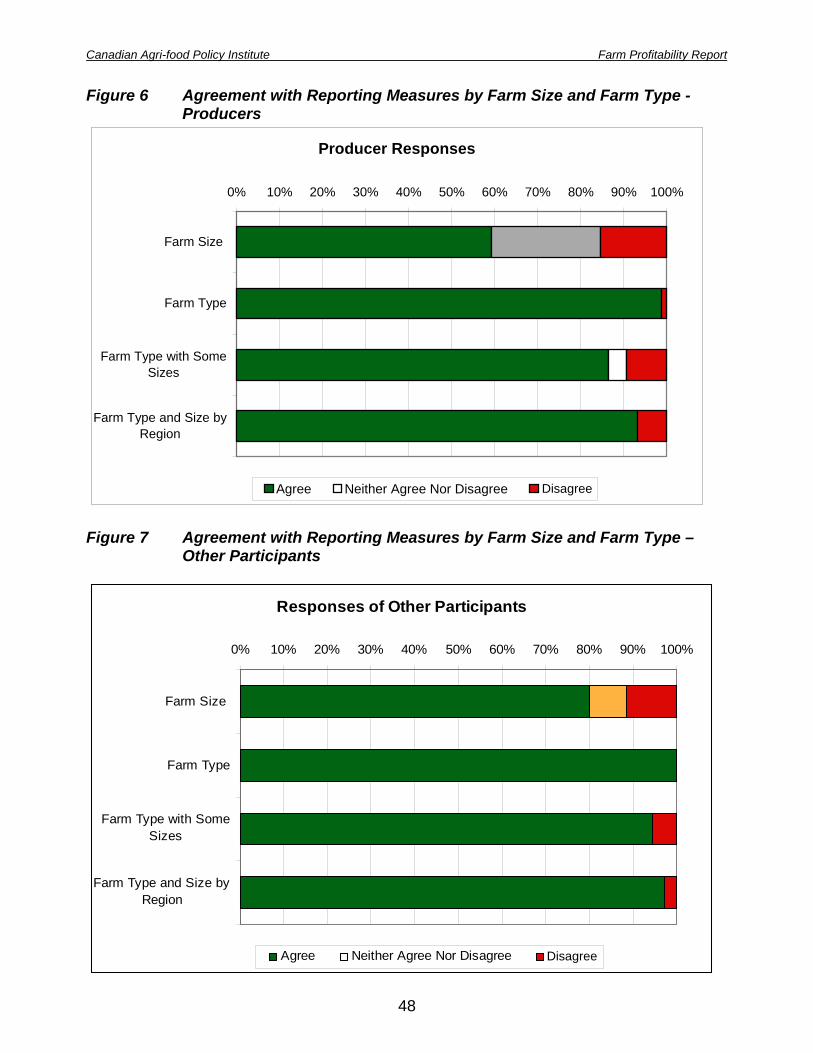
Canadian Agri-food Policy Institute Farm Profitability Report
48
Figure 6 Agreement with Reporting Measures by Farm Size and Farm Type - Producers
Producer Responses
0% 10% 20% 30% 40% 50% 60% 70% 80% 90% 100%
Farm Size
Farm Type
Farm Type with SomeSizes
Farm Type and Size byRegion
Agree Neither Agree Nor Disagree Diagree
Figure 7 Agreement with Reporting Measures by Farm Size and Farm Type –
Other Participants
Responses of Other Participants
0% 10% 20% 30% 40% 50% 60% 70% 80% 90% 100%
Farm Size
Farm Type
Farm Type with SomeSizes
Farm Type and Size byRegion
Agree Neither Agree Nor Disagree DiagreeDisagree
Disagree

Canadian Agri-food Policy Institute Farm Profitability Report
49
B.6 Reporting By Farm Type on a Regional Basis Respondents were asked if farm type data should be provided on a regional basis. Their agreement with the following statement: (Q. 8) “Where possible these performance measures by farm type and by farm size should be provided and published on a regional basis (e.g., for grain and oilseed farms by province or groupings of province, when the data permits such calculations).” These are shown in the lower portion of Figures 5 and 6. The discussion and written responses (see Annex VIII) indicate very strong support for having performance measures for a few sizes of each farm type reported on a regional basis.
B.7 Source Data from Incorporated Farms The last question (Q. 9) asked was whether: “The selected farm profitability performance measures are still valuable even if they are based on data for only incorporated farms, since some of the necessary data are currently not available for unincorporated farms (e.g., the measurement is based on data assembled from incorporated farms, and those farms, for example, that account for 59% of farms with revenues between $0.5 and $1.0 million, and for 73% of farms with revenues between $1.0 and $2.5 million.)”. The responses to this statement are provided in Table 5, with more than two-thirds of producers agreeing with the use of data from incorporated farms. Comments provided on this question are provided in Annex IX. Table 5 Agreement with Using Data Based on Incorporated Farms Response Producers Others Blank 3% 8% Agree 68% 81% Neither 5% 0% Disagree 24% 11% Total 100% 100% B.8 Other Comments or Insights Participants were asked to provide any other comments or insights. The following written comments are reflective of some of the comments received from stakeholders. The complete listing of written comments provided by 24 participants is provided in Annex X.
It’s important to compile farm information so farm businesses can compare their operation to others to see areas of opportunity - i.e. profit maximization.
Very important for farm business operators to be able to compare “apples to apples”. Will be important to be able to sort farm size, type & by region. Would be useful to report profitability by demographic (age bracket)
Keep going, this is a step in the right direction. Farmers need to have confidence & intelligence in their policy-makers, this is a step... keep going!

Canadian Agri-food Policy Institute Farm Profitability Report
50
It would be great to continue to get communication on future progress that CAPI makes on this with Statistics Canada and AAFC.
This type of information is very important in providing a “snap shot” of how the sector is progressing which in turn provides a guide to public policy development. Program development and delivery arms often do not focus on relative measures to assess progress within the sector - this addresses this issue to a degree.
Need to address the cost of labour - how do you calculate this and compare to other agri-businesses?
Presenting information back is key. This was a useful exercise - the real challenge is providing data that producers will use
- this is part of farm business management and extension which needs more attention and focus in APF programming and “Growing Forward”
Could US information be used as a comparative? International benchmarks to measure against the above. Example: US, Europe & UK,
Brazil, Australia. This would help in developing a bigger picture view - particularly when it comes to government program & support payments.
Today’s discussion provided good insights - in addition, many of the comments provided a good reminder of the balance required in providing information which will be used in both farm business management and in farm policy considerations.

Canadian Agri-food Policy Institute Farm Profitability Report
51
Annex I – Comments Received on Performance Measures The following comments were received following the scoring (agree, neither agree nor disagree, or disagree) on the question: The following performance measures are required to measure the financial health and profitability of farm businesses, and each of these performance measures should be published.” (These comments are listed alphabetically).
And industry specific productivity ratios - e.g. revenue/m2; revenue/kg quota. Area & region would play a definite part in gross & net. As far as publishing these figures - I never look at the published figures. It is a waste of time
to compare my operation to anyone else’s. Both need to be published/with & without programs payments. Cannot publish one without
the other. Capital turnover for expansion. Capital turnover with gross profit. Comments: In some it is not necessary to use all the presented ratios. A single one could do
the job. Example: In the Liquidity Ratios using only the ratio of working capital. Concern with assets around profitability ratios is how they are valued - cost basis vs. market
value. Labour intensify - not sure how that would be determined when we know there is a labour shortage in the industry.
Contribution margin (perhaps rent should be factored in). Cost equity = level playing field. Current ratio & working capital ratio: do not capture true liquidity or cash flow needs - need to
be modified. Does the relative difference between with program payments and without program payments
change if you keep them in the calculation as opposed to keeping them out. EBIT - corresponds (almost) to “pre-rent surplus” which is Gross Margin less labour,
mechanisation and administration costs. EBIT could be EBITR where R=rent. Rent is an alternative ownership (and therefore finance costs) and should not distort EBIT.
Equity - how do you define? CLD? Est. FMU? Equity and net worth --> are all of the production assets included in the equity? Equity is also valuable in terms of assessing investments but not an accurate portrayal of
profitability or performance. Equity Position - financial independence. Financial Efficiency Ratios - Item 5: debt coverage. For Financial Efficiency: by operation. For Liquidity, Item 3: it’s very different from one operation to another. For liquidity: by operation, item 2: equity. For Profitability ratios Items 2 and 3: Depends on the sectors. For Profitability, Items 2,4: it depends on which measurements are used, and whether it is
efficiency of a sector without programs or efficiency of an enterprise with programs. For Profitability: by sector. Give a detailed statement of finances and I can calculate the ratios. Gross Margin is still poorly understood and calculated in multiple ways - there is only one
right way - the definition therefore is intrinsic to the value & the measurement. I underscore comments on “profitability ratios” - return on assets with program payments -
without program payments - should not be included “impossible” especially across Canada (i.e. land values). Land values are impossible to include.
If publishing these measures and others are acceptable. However, the real challenge is to explain these measures adequately to avoid misinterpretation of results by producers, advisors, government and general public.
Canadian Agri-food Policy Institute Farm Profitability Report
52
In the future, if public presentation of these ratios is to be meaningful to my farm, then a further breakout by equity classification (quota/farm land/buildings/livestock herd(s)) within an income field would be more helpful.
Income measures (per farm): Since government policy is influenced and based on these measures are important.
Income measures without program payments are more meaningful/relevant than with program payments.
Income Measures: Items 3&4 - % of work ratio revenue. Interest coverage - EBITDA/Interest. Interest coverage is not just operating - all (after land rent). Interest paid should be included in operating profit margin. Labour intensity - include owner’s drawings and dividends to make this more helpful.
Otherwise labour is covered adequately in margins (& by sector). Labour intensity changes as cash cropping is much more capital intensive - for us a more
meaningful measure - but I must agree that division by revenue is distorting. Labour & capital are tied and somewhat interchangeable. Labour intensity - depends on segment. Labour intensity - Too hard to measure accurately - i.e. family labour not being accounted
for. Labour intensity is very hard to measure. Leverage calculation - which is more easily understood by producers. Leverage: for individual operators. Liquidity ratio --> answer would change if I am confident inventory was being included. Liquidity Ratios - Item 1: ? it depends Liquidity ratios more useful to specific operation than across the sector. Liquidity ratios: all need to be considered together/not in isolation. Liquidity Ratios: Items 1&2 - pool ratio numbers = active/debt Machinery investment/Productive Value. EBIT + RENT - terminology in the industry needs to
be consistent. Market equity = opportunity cost. My situation involves no hired labour so not relative for me. Operating Expense ration (do you what it estimated without program payments). Operating Profit Margin - #1 year over year. Operating profit margin (EBIT/Total rev), capital Turn Over (fixed asset/revenue). Operation expense ratio calculated here included administrative expenses, etc. It is not
variable costs entirely. Isn’t gross margin ratio = total expense ratio. Operation profit margin - includes depreciation? Operation profit margin (with program payment). Overall: By operation, by region. Problem when calculating program payments (as opposed to production insurance) is that
they are after the event and can distort what is really going on. Excluding land takes out the “skew” that comes for situations where land is held outside companies (very common) and/or situations where land has been owned a long time and is a “cost” not FMV.
Productive efficiency prefer capital/investment. Productive Efficiency Ratios - Gross Margin per $1000 machinery capital. Gm/C/Profit per
FTE (full time equivalent) - survey of industry may reveal how many man hours = FTE (hypothesis is that it MAY be higher than other industries).
Productive efficiency ratios - I look at volume of product handled. Productive Efficiency Ratios: Item 2 - % of cost of living. Productive efficiency: Gross profit - better place to start. Productivity efficiency is relative to synergy within business unit and across business.

Canadian Agri-food Policy Institute Farm Profitability Report
53
Profitability Ratio - shouldn’t include property/quota etc., but should include depreciation of machines. Industry needs/sector needs/undivided needs vary greatly from gov’t needs. Labour - need to discern between GRMS length and non-arms length (i.e. profit). Also needs to consider how shareholders take money out of the operation (as salary, rent, dividends, loans, etc.)
Profitability Ratios - Item 1 : For operation efficiency. Profitability Ratios: Items 2-4 - % of net revenue. Program payments are helpful, but distort the measurement of profitability/health/perform. Program payments are as such a “survival” crutch, not long term. Program payments should only be reported if the occur in the same year as the trigger
occurred (i.e. CAIS payments come 1-2 years after the trigger). Program placements have no place in margin calculation. Remove land & quota. Only include PMach x Equip x Build. Excluding land rent x interest. Return on asset or equity profitability ratios should be calculated o ‘fair book value.’ Return on assets - Strongly disagree - land values across Canada are appreciating at very
different rates. Return on assets (with/without program payments): concern expressed about variability and
would not provide meaningful information for individual based decisions. Return on assets is method we use to compare our different divisions (production and feed
mill & hatching). The farms have a poor showing when we use this method because of the high cost of land & quota. However, there is an interdependence of the farms to feed mill & hatching.
Return on assets not a good measure across farm groups - good on an individual basis. No one ratio is totally effective - an aggregate of all or most should be considered.
Return on assets with or without would be interesting for the public sector knowledge. Return on assets without program payments - for expansion. Return on equity - as a trend not as a comparative. Return on equity - cannot measure equity side of the calculation. Return on equity - long term planning (i.e. getting out of business - where is the land). Return on equity - would we want 2 measures, one to compare to other industries and
another that takes into account capital gains. Return on equity (with program payment). Return on equity/assets needs to be adjusted to exclude quota equity growth. Capital and
labour ratio are a management decision that can cause a wide variation. Cash cost vs. cash receipts is the only real measurement. The other ratios are feel good or a reason to justify a decision.
Return on operating profit is the only reliable measure. ROE is due to land equity rising. Labour is a very important cost for outside access & more
hired labour for certified organic. Smaller unincorporated farms - labour intensity would not be as useful. Solvency ratios - Funded debt: EBITDA. Some of the above are more interesting than useful for individual farmers. May be more
meaningful for someone seeking an overview of entire industry or sector. IE - solvency ratios. The challenge in all of this is providing information that is useful to individual producers,
recognizing that all information is used by decision makers for policy purposes. Benchmarking is important.
The published information will need to be relevant to farmers. When published by Statistics Canada or Agriculture and Agri-Food Canada the national and provincial level is appropriate. But if done by CAPI it would need to be by crop type or animal to be of value to farmers.
There are various productivity measurements for each segment (i.e. pigs/sow, yields, feed cost, etc.).

Canadian Agri-food Policy Institute Farm Profitability Report
54
These measures with program payments add analytical capacity for policy & risk management. Need primary data to accurately reflect situation.
Very few farmers think in terms of EBT/EBIT/EBITA. There is a shift in knowledge required by farmers. We need ways to measure labour in farming. Interest coverage ratio - could also include cash rent.
We use some of these measures in program and policy development as well as in support of federal/provincial program development out funding - all useful but not all used in depth.
What gets published this year may be very unrepresentative in 2-5 years when producers are forced to pay back CAIS/AgriStability.
With program payments” - very hard to calculate & look at long-term trends when government is clawing back program payments (i.e. CAIS).
Working capital ratio is only helpful if you are categorized properly. You are putting a lot of weight on these (program payments). Neither my neighbours nor I
are receiving these levels of payments, so program payments are not a factor in my operation.
You would be able compute “with program payments” if needed once you have gross margin with and without program payments. Gross margin = revenue - cost of goods (direct costs of production).
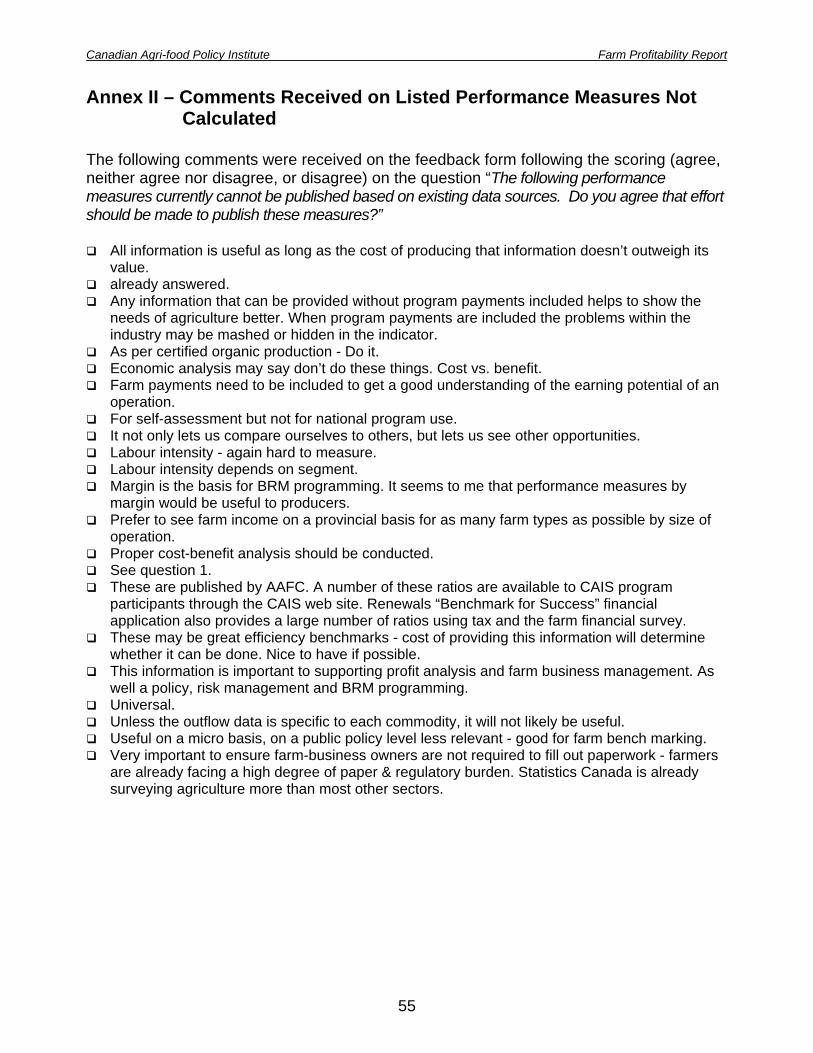
Canadian Agri-food Policy Institute Farm Profitability Report
55
Annex II – Comments Received on Listed Performance Measures Not Calculated
The following comments were received on the feedback form following the scoring (agree, neither agree nor disagree, or disagree) on the question “The following performance measures currently cannot be published based on existing data sources. Do you agree that effort should be made to publish these measures?”
All information is useful as long as the cost of producing that information doesn’t outweigh its value.
already answered. Any information that can be provided without program payments included helps to show the
needs of agriculture better. When program payments are included the problems within the industry may be mashed or hidden in the indicator.
As per certified organic production - Do it. Economic analysis may say don’t do these things. Cost vs. benefit. Farm payments need to be included to get a good understanding of the earning potential of an
operation. For self-assessment but not for national program use. It not only lets us compare ourselves to others, but lets us see other opportunities. Labour intensity - again hard to measure. Labour intensity depends on segment. Margin is the basis for BRM programming. It seems to me that performance measures by
margin would be useful to producers. Prefer to see farm income on a provincial basis for as many farm types as possible by size of
operation. Proper cost-benefit analysis should be conducted. See question 1. These are published by AAFC. A number of these ratios are available to CAIS program
participants through the CAIS web site. Renewals “Benchmark for Success” financial application also provides a large number of ratios using tax and the farm financial survey.
These may be great efficiency benchmarks - cost of providing this information will determine whether it can be done. Nice to have if possible.
This information is important to supporting profit analysis and farm business management. As well a policy, risk management and BRM programming.
Universal. Unless the outflow data is specific to each commodity, it will not likely be useful. Useful on a micro basis, on a public policy level less relevant - good for farm bench marking. Very important to ensure farm-business owners are not required to fill out paperwork - farmers
are already facing a high degree of paper & regulatory burden. Statistics Canada is already surveying agriculture more than most other sectors.
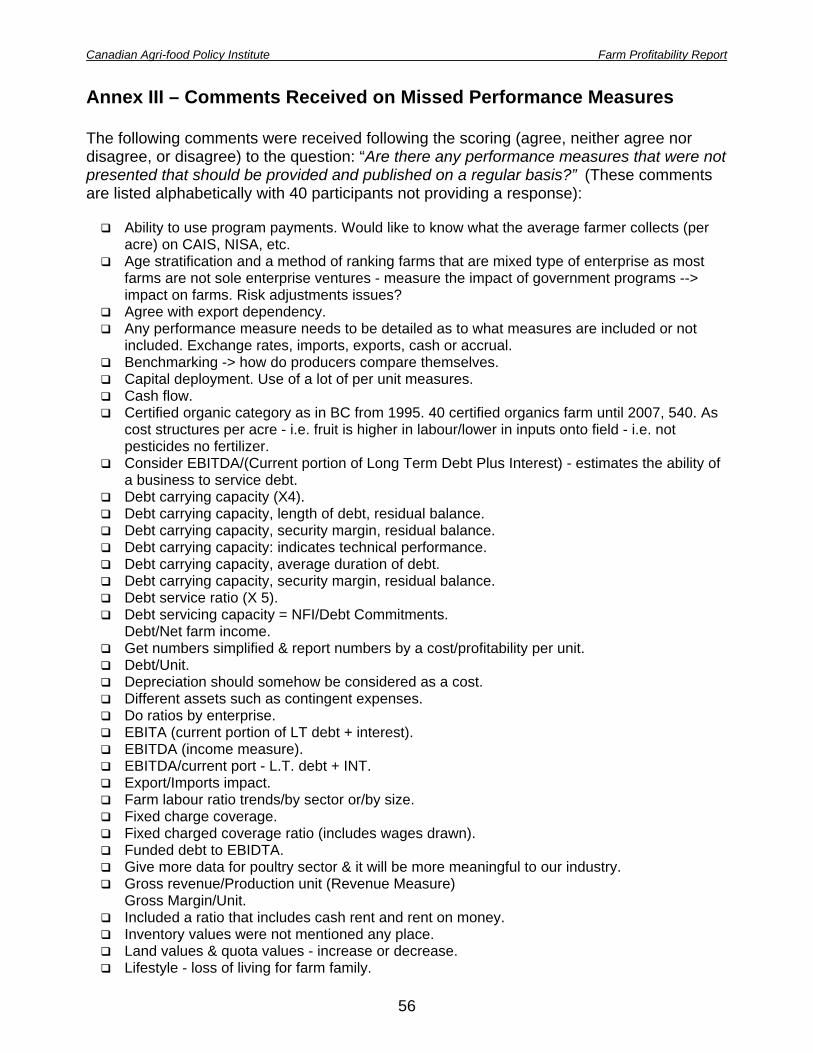
Canadian Agri-food Policy Institute Farm Profitability Report
56
Annex III – Comments Received on Missed Performance Measures The following comments were received following the scoring (agree, neither agree nor disagree, or disagree) to the question: “Are there any performance measures that were not presented that should be provided and published on a regular basis?” (These comments are listed alphabetically with 40 participants not providing a response):
Ability to use program payments. Would like to know what the average farmer collects (per acre) on CAIS, NISA, etc.
Age stratification and a method of ranking farms that are mixed type of enterprise as most farms are not sole enterprise ventures - measure the impact of government programs --> impact on farms. Risk adjustments issues?
Agree with export dependency. Any performance measure needs to be detailed as to what measures are included or not
included. Exchange rates, imports, exports, cash or accrual. Benchmarking -> how do producers compare themselves. Capital deployment. Use of a lot of per unit measures. Cash flow. Certified organic category as in BC from 1995. 40 certified organics farm until 2007, 540. As
cost structures per acre - i.e. fruit is higher in labour/lower in inputs onto field - i.e. not pesticides no fertilizer.
Consider EBITDA/(Current portion of Long Term Debt Plus Interest) - estimates the ability of a business to service debt.
Debt carrying capacity (X4). Debt carrying capacity, length of debt, residual balance. Debt carrying capacity, security margin, residual balance. Debt carrying capacity: indicates technical performance. Debt carrying capacity, average duration of debt. Debt carrying capacity, security margin, residual balance. Debt service ratio (X 5). Debt servicing capacity = NFI/Debt Commitments.
Debt/Net farm income. Get numbers simplified & report numbers by a cost/profitability per unit. Debt/Unit. Depreciation should somehow be considered as a cost. Different assets such as contingent expenses. Do ratios by enterprise. EBITA (current portion of LT debt + interest). EBITDA (income measure). EBITDA/current port - L.T. debt + INT. Export/Imports impact. Farm labour ratio trends/by sector or/by size. Fixed charge coverage. Fixed charged coverage ratio (includes wages drawn). Funded debt to EBIDTA. Give more data for poultry sector & it will be more meaningful to our industry. Gross revenue/Production unit (Revenue Measure)
Gross Margin/Unit. Included a ratio that includes cash rent and rent on money. Inventory values were not mentioned any place. Land values & quota values - increase or decrease. Lifestyle - loss of living for farm family.

Canadian Agri-food Policy Institute Farm Profitability Report
57
Long term average income per enterprise or sector. Machinery investment/acre. Make sure land is excluded. Market dependency. Much heavier emphasis on viable input ratios. How about security analysis? Need most on a per unit basis. Need to divide the $0-$100,000 scale perhaps $0-$49,000 and $50,000-$899,999. Net worth. Off farm income to farm income. Pay all operation costs as they occur - this applies to capital costs also. My farm operation is
debt free. Payment coverage ratio = EBITDA/CpLTD + interest exp. Ability to cover debt payments is
critical to a farm’s financial health. Per unit measure. Performance measure based on per physical unit (per acre, per kg quota, per bird, per
square foot of production, etc.) will be good to be able to measure profitability. Principal payments/income. Principle payments/net farm income. Production (actual yields - bu, lbs, litres), assisted input + crop insurance could play a key
role - for individual producers, knowing where you stand production wise is the single most building block to a successful farm.
Production per unit whatever the sector. (Agriculture sector). Whatever unit measure works for particular farming sector.
Profit before interest & rent. Publish all balance sheet info. This would allow for other performance measures to be
calculated. Ratio of principle payments divided by total debt. Recording of principle payments needed to service farm debt. Residual balance, debt carrying capacity, security margin. Reporting COGS per cycle rather than unit. Retained Earnings. Revenue/Cost per production unit. Risk adjustment. Risk adjustments - government payments for diversified farms, which can be very different
from straight grain farms. Risk factors, off farm income vs. farm to the overall business, equity vs. age of farm Security margin = residual balance/production
regulate net benefit % and workers compensation. Specific productivity ratios.
Ensure entire enterprise assets. Total cash outflow vs. total cash inflow. included rent/repairs etc. Total farm debt vs. equity. Use numbers on a per unit basis (acre or unit basis). Volume. We need a consistently defined set of measures not a larger number of measures. What about “Equipment Intensity”, Depreciation, Repairs, tools, fuel, divided by operating
revenues (exclude programs). What impact of spending in the local community does each sector of farming contribute (i.e.
4 horse farm could spend 410,000/year or 4100,000 farm might only spend $6000). Whether industry is dependent or affected by imports or exports. Wide variations of interests/needs. Debt load/unit of production.

Canadian Agri-food Policy Institute Farm Profitability Report
58
Annex IV – Comments Received on Reporting More than the Median The following comments were received following the scoring (agree, neither agree nor disagree, or disagree) on the question “In addition to the performance measures published for the average (or median) operation in a business segment, farm profitability performance measures should also be provided for operations that are above or below this mid-point to show the variability in the sector. (e.g., for the average (or median at the 50% ranking) as well as for operations at the 30% ranking, and the 70% ranking)”. Requested comments included:
Averages can be misleading --> the greater degree of analysis will be more useful to producers to determine where they fit in the sector - comparison to the norm.
Benchmarks maybe useful. Perhaps more useful than straight average. But specify what type & percentage of farm it is. Define EQUITY (i.e. land, quotas or other long term asset which appreciation in value). How
would money opportunity costs be shown? i.e. land rent as a cost vs. return on equity. Do I want to be just ‘average’?
How variable are the numbers? Do not just want to use averages. Top 1/3 bottom 1/3 mid 1/3 - I can see where I sit. Especially important in areas with a wide window or ranking. Every farm operation is different when making comparisons, adjustments have to be made.
Reporting by farm types is more important. Expanding this measure will help assess particular business in a more precise way. For these, would be useful to see for comparison purposes - there is also a need to do some
education on interpretation and trends. Give producers a glimpse of what top producers are doing - therefore gives them a goal. Gives an individual operation an idea where it fits in the total agriculture sector. Have it further broken down by farm sector. I agree, but the information has to be sector pure (i.e. >90% from the sector). I do think having one common base measure that these hinge on - e.g. operating profit margin -
is more useful. In addition, information needs to be sector specific + these farms analyzed need to be as pure
as possible for their enterprise sector (i.e. >60% or 70% of gross income needs to come from the sector they are classified in).
Information would be useful if easily accessed and interpreted. Key aspect of this is we are seeking the characteristics of the most productive businesses.
Variant might be to exclude program payments (but not production insurance). Likely more relevant in underrepresented sectors. Make sure you pick 1 number and have all others for the same farms (i.e., if the 30% rank farm
for net income, what is the same farms equity position, etc.). Maybe separate certain commodities. Measures: on best - med - low
on size of same operation. Need to look at measures according to farm sector. Or farm type - by sector much more valuable. Presented by click down on computer. Window. Provide ratio & range for each measure.
Do not create an overall whole farm ratio. Drill down ability to find issues.

Canadian Agri-food Policy Institute Farm Profitability Report
59
Provided above and below. Purify data between different types of farms. Quartile analysis is best. 25%, 50%, 75% and would match best analysis practices. Quartiles. Ranges in variability are very important. Segregate at least 40% of commodity in a class. Strongly agree for our own performance in relation to other farms. The ranking of type of farm is important as to compare enterprises - 1 may subsidize the other. There are too many “one offs” units to allow only the average or median to be the only figure
presented! This information does not need to be published but it should be available when requested. It
would be information overload depending on how many indicators are published. If published it would be better to have more annexes of information.
Up to 30%: 30-50%: 50-70%:70%+ Very difficult to isolate one form of or type of measurement to use as a general benchmark due
to the variability of management styles and structures. The more information available the better, as long as it’s clearly organized.
Very important. Why pick 30% 70% as opposed to quartiles or quintiles. Would rather look at fewer measurements that come with greater detail. Yes so you are not working in the ‘dark’. But as always many variables.
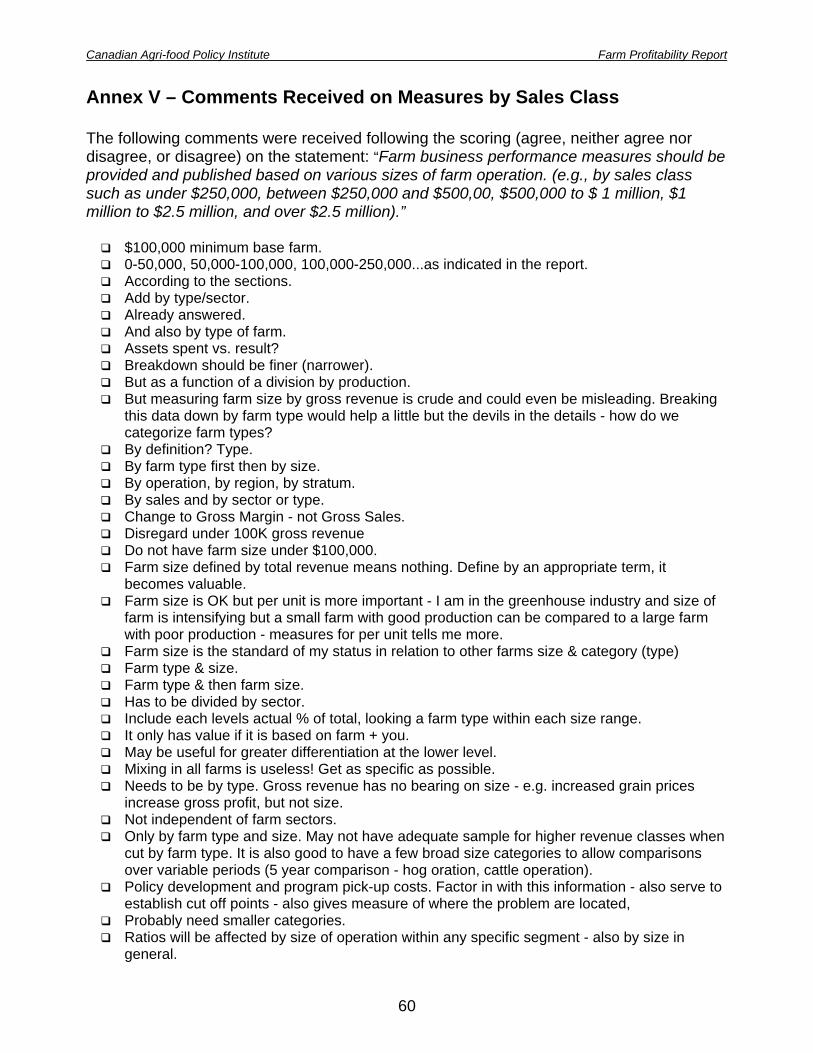
Canadian Agri-food Policy Institute Farm Profitability Report
60
Annex V – Comments Received on Measures by Sales Class The following comments were received following the scoring (agree, neither agree nor disagree, or disagree) on the statement: “Farm business performance measures should be provided and published based on various sizes of farm operation. (e.g., by sales class such as under $250,000, between $250,000 and $500,00, $500,000 to $ 1 million, $1 million to $2.5 million, and over $2.5 million).”
$100,000 minimum base farm. 0-50,000, 50,000-100,000, 100,000-250,000...as indicated in the report. According to the sections. Add by type/sector. Already answered. And also by type of farm. Assets spent vs. result? Breakdown should be finer (narrower). But as a function of a division by production. But measuring farm size by gross revenue is crude and could even be misleading. Breaking
this data down by farm type would help a little but the devils in the details - how do we categorize farm types?
By definition? Type. By farm type first then by size. By operation, by region, by stratum. By sales and by sector or type. Change to Gross Margin - not Gross Sales. Disregard under 100K gross revenue Do not have farm size under $100,000. Farm size defined by total revenue means nothing. Define by an appropriate term, it
becomes valuable. Farm size is OK but per unit is more important - I am in the greenhouse industry and size of
farm is intensifying but a small farm with good production can be compared to a large farm with poor production - measures for per unit tells me more.
Farm size is the standard of my status in relation to other farms size & category (type) Farm type & size. Farm type & then farm size. Has to be divided by sector. Include each levels actual % of total, looking a farm type within each size range. It only has value if it is based on farm + you. May be useful for greater differentiation at the lower level. Mixing in all farms is useless! Get as specific as possible. Needs to be by type. Gross revenue has no bearing on size - e.g. increased grain prices
increase gross profit, but not size. Not independent of farm sectors. Only by farm type and size. May not have adequate sample for higher revenue classes when
cut by farm type. It is also good to have a few broad size categories to allow comparisons over variable periods (5 year comparison - hog oration, cattle operation).
Policy development and program pick-up costs. Factor in with this information - also serve to establish cut off points - also gives measure of where the problem are located,
Probably need smaller categories. Ratios will be affected by size of operation within any specific segment - also by size in
general.

Canadian Agri-food Policy Institute Farm Profitability Report
61
Sales size is irrelevant as a measure of profitability. Should be by sector. This would be more helpful when combined within #6. Too generic not useful. Type first then size. Very hard to compare “apples to apples”.
Farms will be so variable by farm type. Would be most meaningful as farm type & be related to units of output. Or square foot of
production unit or number of acres or whatever is relative to the commodity.

Canadian Agri-food Policy Institute Farm Profitability Report
62
Annex VI – Comments Received on Measures by Farm Type The following comments were received following the scoring (agree, neither agree nor disagree, or disagree) on the statement: “Farm business performance measures should be provided and published based on various types of farm operations (e.g., for grain and oilseed, beef and cattle, hogs, dairy, poultry, and horticultural operations).”
% of revenue to determine category should be 75% vs. mixed. As above - sales/sector type. As many farm types as you can realistically do. E.g. break out swine into more than one farm
type (farrow to finish, sow to wean, finisher); beef - cow calf/feedlot. Because how do you define farm type - establish type first. Breakout potato/greenhouse vegetables/greenhouse flowers is recommended by group. By province & category conventional versus certified organic. Diversified category - other? Diversify. Farm type may need to be broken down to more specific size - e.g. # units for cattle/beef
operations. For comparisons to be helpful - must compare like products and segments - difficulty might
arise when using different size operations within farming segments. For most of reasons presented in #5. Formula needs to be included for mixed farms with several operations (i.e. beef, grain, hay, etc) Horticulture group should be broken down between veg. and tree fruit. It is hard to change from
tree fruit to any other product in 1 year/veg can change from year to year. However clear definition of type. If you’re measuring by type, most farms are a combination & unless you can separate that out it
won’t mean much. In addition to >50%, definition of farm type, also use a >75% definition of farm type. Increase the number of farm types (i.e. totally diversified, forage seeds). Industry threshold >/= 75%. It is important but some definition has to be made for diversified operations. It is not possible to identify cow-calf/feeder/feedlot operations using just cattle revenues. It would even be better if broken down to individual crop/enterprise. More farm enterprises (e.g. forage seed). More farm types (diversified farm). More farm types. (X2) Need another category - fully diversified (i.e. perhaps 3 types with non greater than 50% of
total). Need more breakdown but also need aggregate to see sectoral impact. Need more breakdown within type - threshold level - i.e. lifestyle left out.
Enterprise analysis with carrot should be investigated. Need to split beef into feedlot/on calf. See comment 5. Also there should be a differentiation if beef = steer or calf, and if pork =
breeders, finishers, breeders/finishers. See comments above about ho farm types are defined. if it is to be a “passive” categorization
(i.e. driven from data in the statements) - there is too much variance in the way statements are provided.
Separate mixed farms from grains only. Should be more farm types - e.g. forage seed (alfalfa & grass). Should look at diversified and integrated farms as being categories. Strongly!

Canadian Agri-food Policy Institute Farm Profitability Report
63
The more breakdown the better - BC is a very diverse industry - for performance measures assessing profitability --> need to recognize make-up of the industry regionally & provincially.
This should also be segregated by farm size. Other farm types should be included. To be meaningful I would want to compare to greenhouse vegetables no all of horticulture or
flower growers. Type & size - need to include other farm types. i.e. seed industry. Type & size. Type then size $$. Very important farm type first. Lead type to be identified. very imprint. We already report on number of cattle, sheep, and pigs - use this information. What about using NAICS code to split out enterprises? Yes, but the more subdivisions - the more meaningful - IE poultry - could it be 1) layer, 2)
broilers, 3) turkey, 4) hatching egg.

Canadian Agri-food Policy Institute Farm Profitability Report
64
Annex VII – Comments Received on Measures for Various sizes by Farm Type
The following comments were received following the scoring (agree, neither agree nor disagree, or disagree) on the statement: “For each of these farm types (e.g., grain and oilseed), farm business performance measures should be provided and published based on various sizes of farm operation (e.g., by sales class as noted above for farm types such as for grain and oilseed, beef and cattle, hogs, dairy, poultry, and horticultural operations, when the data permits such calculations.)”
< 30%>70%> - 3 sizes 25 percentile; average; 75 percentile 3 only categories Absolutely! Again, useful for the same reasons as in #5. Also by region (more resolution the better) Also by units produced - are/head Also farm size/assets, etc. As above. Farm size (dollar sales) may need to be different/commodity. At least 3 different categories. Based on annual revenue. Beef needs to be split between cow-calf and feedlot. Better yet, over 6 - based on amount of revenue, 0-250K, 250-500K, 500-1M, etc. But a limited number. But there wouldn’t need to be as many size classifications per farm type. By sales & units. By sales or units. Should investigate to see if they are different. By type of production: example for pork: breeder, finisher, breeder/finisher Cattle would seem to require 0-50,000, 50,000-100,000, 100,000-250,000...as indicated. Challenge as above is how we measure size and how we define farm type without asking for
more data. Thinking about this - are there other “indicators” of farm size? Possible indicators of farm size would be things that don’t change rapidly - as labour costs? Fuel costs? Fixed capital/machine capital?
Cost per unit in relation to size category, more individual farm density. Definition of farm size is issue. Use 30%, medium, 70%. Efficiencies of scale impact profitability of various sizes of farms within each farm type. Gross margin/units/size. Grouped by lifestyle or real farm operation. i.e. small, medium & large In time! Is only way to make reasonable assessment of each farm unit. Also maybe need to look at it by
unit of revenue (cow/hog/acre). Lots of farms are diversified with 50/50 income split - how is that reported? Maybe size by dollar value? Sold? (Areas in the country vary - Red River vs. Sask). Mix needs to be defined by something other than dollars of sales, etc. More farm types. More granularity on the farm type. Performance or sq. foot and efficiency play an important factor. Perhaps only 3 categories. Same as #5 ad 6. See 5 & 6.
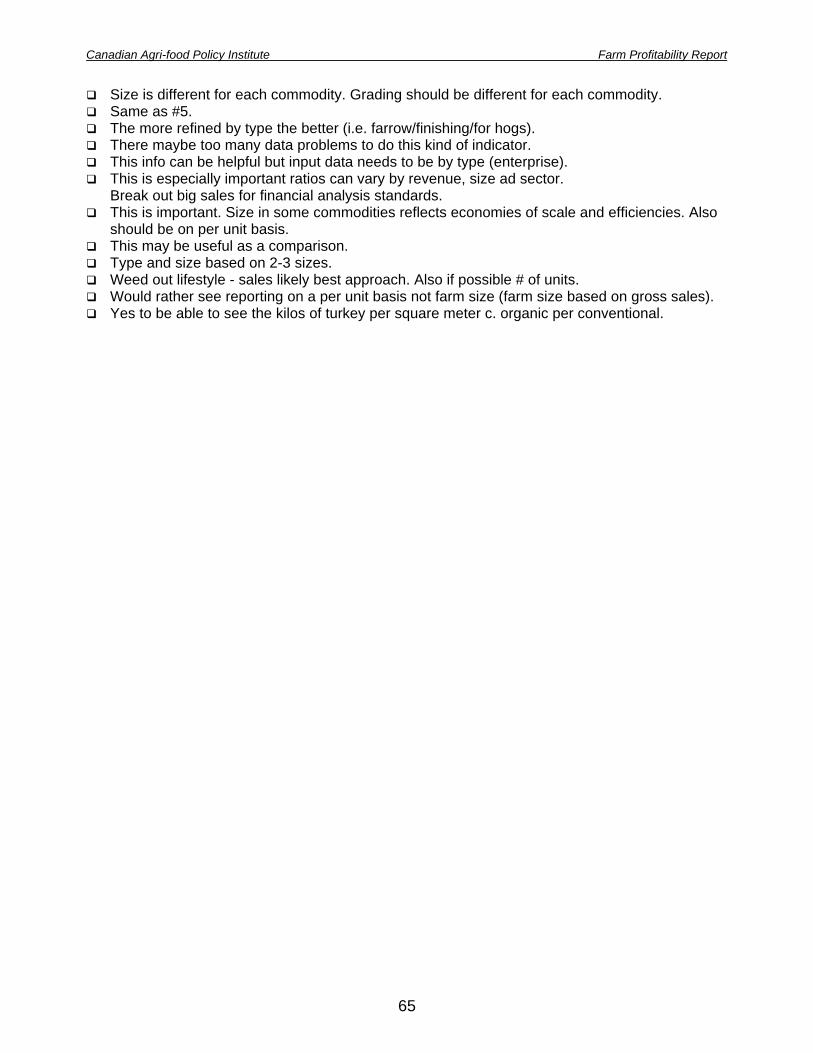
Canadian Agri-food Policy Institute Farm Profitability Report
65
Size is different for each commodity. Grading should be different for each commodity. Same as #5. The more refined by type the better (i.e. farrow/finishing/for hogs). There maybe too many data problems to do this kind of indicator. This info can be helpful but input data needs to be by type (enterprise). This is especially important ratios can vary by revenue, size ad sector.
Break out big sales for financial analysis standards. This is important. Size in some commodities reflects economies of scale and efficiencies. Also
should be on per unit basis. This may be useful as a comparison. Type and size based on 2-3 sizes. Weed out lifestyle - sales likely best approach. Also if possible # of units. Would rather see reporting on a per unit basis not farm size (farm size based on gross sales). Yes to be able to see the kilos of turkey per square meter c. organic per conventional.

Canadian Agri-food Policy Institute Farm Profitability Report
66
Annex VIII – Comments Received on Measures for Farm Type by Region The following comments were received following the scoring (agree, neither agree nor disagree, or disagree) on the statement: “Where possible these performance measures by farm type and by farm size should be provided and published on a regional basis (e.g., for grain and oilseed farms by province or groupings of province, when the data permits such calculations.)”
3 to 4 Canadian regions would be beneficial Regional, climatic, provincial.
5 regions for Canada - Maritimes, Ont, Que, Prairies, Alberta/BC. Absolute necessity. Absolutely - even would see sub region within province. Address may not be farm’s location, may be accountants address or farmer’s city residence. All the above need to be combined to make meaningful or useful information. Maybe region
could be province. And province. As an example: land cost factors significantly differ across the country. At least provincial. Atlantic, Quebec, Ontario, Prairies, BC (5). Brown soil, dark brown soil, black soil in Saskatchewan. But “regions” are necessarily provinces. There can be a lot of difference between say
Mankota and Melville or Gronn and Grand Prairie. But it should be by province not group of provinces. By 5 regions - Atlantic/Ontario/Quebec/Prairies/BC. By province (X 6). By province, at least - possible within province. By region in province/by commodity. By region, not province, but portion of provinces could be put together. Canada is large and diverse. Different grains are produced in each province plus different growing conditions. Grouping of provinces -- BC/Prairies/Central Can (Q & O)/Atlantic. In time! Maybe by region rather than by province. Minimal by province. Most important – regional. Must be province. Needs to be done provincially. No smaller than provincial size. Not only by province also by regions either SARM divisions or a picture of province
breakdown. Ontario should be published on basis of regions within Ontario. Perhaps 4 or 5 sub-regions. Or higher resolution if possible. Run, Crop Ins district, soil zone, crop reporting district, some
price real makes the data relevant to my operation. Par province, by NRC. Per region per province & national.
Especially provincial is very important. Political and economic climates differ from province to province so the data should be
representative. Provincial at least. Maybe finer. Regions may be different for different farm types.

Canadian Agri-food Policy Institute Farm Profitability Report
67
Provincial basis. If possible, it would be beneficial if we could classify even within the province by distinct regions - if any - lows, mainland, in BC vs. Ontario.
Provincial, Regional. Provincial. Plus others that have geographical differences. Provincial/Regional differences can be significant and so this would provide more useful info
for comparative analysis. Provincially for livestock but even smaller regions for grains if sample size is large enough. Regional basis. Regional differences are important to know. Not sure if doing it by province is too difficult or
whether going Atlantic, Que, Ont, Prairies, BC is more doable. See 5 & 6, it’s regional. Should be provincial. Should be regional. specialized farm ~80% Support regional information – to the provincial level. The grouping has to be by province. 1) For provincial policies and receiving use of the data
the provinces either verify or support in collating. 2) Farmers may think the provinces are similar in a region but they vary greatly.
The regional basis should be defined or divided differently for each farm type (i.e. poultry may be divided by provinces but grain by growing regions).
There is too much variability in Canada to make national numbers useful. This is general info on sector direction - useful for regional assessment of where the
problems are greatest but programs likely would not be this specific - regional is important on a province by province basis.
Use either individual provinces or better yet divide country into 5 regions. Very important for comparison purposes.
Province-province data important. If you could go by rural municipality or postal code - may be helpful?
Very important* We need to make sure provincial and federal governments have sufficient info to make
proper policy decisions.

Canadian Agri-food Policy Institute Farm Profitability Report
68
Annex IX – Comments Received on Using Only Data from Incorporated Farms to Calculate Profitability and Performance Measures
The following comments were received following the scoring (agree, neither agree nor disagree, or disagree) on the statement: “The selected farm profitability performance measures are still valuable even if they are based on data for only incorporated farms, since some of the necessary data is currently not available for unincorporated farms (e.g., the measurement is made based on data assembled from incorporated farms, and these farms for example account for 59% of farms with revenues between $0.5 and $1.0 million, and for 73% of farms with saes between $1.0 and $2.5 million.)”.
Although would be better if all are included. As long as the limitations of data are clearly stated, this is useful. Using this as representative
of “all” farms in Canada would not be appropriate. As long as the sample size is statistically significant given total number including
unincorporated operations. Because the future of farming is likely very large & very small farms, I think we are missing out
if we don’t measure enough of the small farms. Better than nothing. Would be better to have full data set. Consistency of data handling is a plus.
Labour is the big differentiator between corp. vs. sole prop. Go big or go home. Has to be accurate. It is reasonable snapshot but would be interesting to see how accurate the numbers are. It is the only way to get reliable data. It’s the <illegible> that influences many data sets (benefits, profitability, debt carrying capacity) Long term all data should be used to determine strategies: therefore use data from non-
incorporated as well. Make an effort to have unincorporated farm data also. Not convinced that is a valid observation. Not relevant. Ratios such as current assets/liability won’t be affected but some that require equity numbers
may be (i.e. non-incorporated farmers will need to know that asset values were calculated at cost on the account statement if they want to accurately compare the data provided with that of their farm).
Should be representative from 50% of incorporated farms. Small farms not included would be left out as to info for their operations. Something is better than nothing. Standardized way of keeping track of accounting: ex. net revenue. Still of value, but would need to put in context with regards to crop structure for tax (estate
planning). Crop based data also likely weak for building profit. Performance measures for smaller farms.
The data obtained from incorporated farms would be “cleaner.” The incorporated data set will be dominated by smaller, lifestyle, non-business farms. However
from a government point of view they may be disproportionate recipients of program payments. Meaning the % of net-income represented by program payments by farm size and/or type may be enlightening (but not very welcome).
The published data would need a note included that says it only includes incorporated farms, but the data is still valuable.
There are lost of innovative & profitable farm operations that are unincorporated.

Canadian Agri-food Policy Institute Farm Profitability Report
69
Too many variables - corporate structures, diversified corporate designs. Would like non-incorporated farms included as long as 3rd party preparation of management
develop book for robust data set. Minimum threshold identified.
Would need more information on how many unincorporated farms would be excluded. As discussed, certain sectors may have a higher number of unincorporated farms.
Yes - while recognizing the limitations that exist.

Canadian Agri-food Policy Institute Farm Profitability Report
70
Annex X – Other Comments or Insights Received Participants were asked if they had: “any other comments or insights you would like to share”. Responses from 24 participants were received:
This was a useful exercise - the real challenge is providing data that producers will use --> This is part of farm business management and extensions which needs more attention and focus in APF programming and “Growing Forward.”
Although I appreciate the technical differences between gross & contribution margins, I struggle with the policy decisions to ignore expenses such as property tax and repairs in measure of “health” of the industry. I would see great value in a more directed effort/commitment to provide these numbers to interested individuals on an ongoing basis and according to either sectors or by region (municipality, crop district, soil element zone) i.e. something with enough resolution that individuals can make a detailed critical evaluation of their performance to that of there peers/competitors.
Could US information be used as a comparative? Data can be collected from anyplace and manipulated to show whatever you want it to show.
Numbers do lie! Beware that this is not a make work project! Extract the data based on the needs of the sector. General info useful to those seeking overview. I applaud all farming industry and the people involved for what they put in and give up to
produce food for people. Without them a country goes backwards instead of forward. A healthy farm industry makes for a prosperous country.
I believe farm size categories should be reduced to three: 1) Hobby 2) Family 3) Commercial corporate.
International benchmarks to measure the above against. Example: US, Europe & UK, Brazil, Australia. This would help in developing a bigger picture view - particularly when it comes to government program & support payments.
Investing more money into government bureaucracy is not the answer to solving current farming woes. Information is useful as long as it is easily accessed and interpreted.
It would be great to continue to get communication on future progress that CAPI makes on this with Statistics Canada and Agriculture and Agri-Food Canada.
It would be useful to pursue with all stakeholders on accounting side in terms of how info/data is provided to tax filing.
It’s important to compile farm information so farm businesses can compare their operation to others to see areas of opportunity - i.e. profit maximization.
Keep going, this is a step in the right direction. Farmers need to have confidence & intelligence in their policy-makers. This is a step... keep going!
More accurate reports are necessary. Be cautious not to publish too much information. Not all reports should be published, but they should be available (online) for producers.
Need to address the cost of labour - how do you calculate this and compare to other agri-businesses?
Presenting information back is key. Provinces, and the total industry, need this information in a way that is representative of the
type and scale of farms. If it is hard to move forward, then the scale of the industry at the provincial level should be the criteria for which crop/oilseed/specialty crop or livestock group to focus on.
Regional differences have to be allowed. Since I am hard of hearing, I was at a disadvantage. I would suggest having a microphone for
future sessions.
Canadian Agri-food Policy Institute Farm Profitability Report
71
Specific information, useful to producers. Start to concentrate on certified organic farms because they are growing in size. This information collected and presented if intended for “business management” will become
public information, which can or cannot be used to benefit our industry. This information will be public!
This type of information is very important in providing a “snap shot” of how the sector is progressing, which in turn provides a guide to public policy development, program development.,and delivery arms. We often do not focus on relative measures to assess progress within the sector - this addresses this issue to a degree.
Today’s discussion provided good insights - in addition, many of the comments provided a good reminder of the balance required in providing information which will be used in both farm business management and in farm policy considerations.
Use of computer online with database format. Very important for farm business operators to be able to compare “apples to apples”. Will be
important to be able to sort farm size, type & by region. Would be useful to report profitability by demographic (age bracket).
We mix terminology - even in these workshops and we need to start using the same terms or we can never trust our data.
Well moderated. A bit too slow, but everyone got a say. You need to understand that while ratios are good actual cash profits is what leads to viable
farm for the future.
Canadian Agri-food Policy Institute Farm Profitability Report
72
Annex C
Recent Initiatives at Statistics Canada relating to farm income and financial performance measures
Canadian Agri-food Policy Institute Farm Profitability Report
73
ANNEX C Recent initiatives at Statistics Canada relating to farm
income and financial performance measures
The Agriculture Division of Statistics Canada (STC) has been working with Agriculture and Agri-Food Canada (AAFC) and provincial agricultural statistical representatives to incorporate the recommendations made at the Workshop on Farm Income Measures that was organized jointly by the two departments. The goal of this technical workshop, held on March 5 and 6, 2007 in Ottawa, was to provide an opportunity for experts in the farm income area to discuss issues related to current farm income measures and identify options that better describe the economic situation and performance of the agriculture sector and its people. Among several key recommendations relating to Statistics Canada that emerged from the workshop was that STC should develop and produce an integrated broadly-based set of farm income and other performance measures that are released at the same time and ideally based on the same time period. This has led to strategies to guide related work in the Agriculture Division as resources permitted. The Agency is currently investing in system infrastructure to modernize processing and make it possible to integrate data efficiently while reducing costs. Potentially, this new system could facilitate the production of various agricultural economic accounts simultaneously. In addition, research pertaining to concepts, methods and data gaps is being strengthened to maintain high data quality. An update on STC’s dissemination plans for 2008-09 for its aggregate and farm-level farm income data was presented at the Federal-Provincial-Territorial (FPT) Meeting on Agriculture Statistics in October 2007. The goal for the aggregate releases is to include more disaggregated data by type of production, as well as including other aggregate measures – such as the value added account – with the net income release. An important step was taken with the May 26, 2008 release in The Daily of farm income information to include the simultaneous release of the value added account. It provided key data on the net value-added distributed among the factors of production such as farm wage expenses paid to family and to non-family members, as well as the total value of Canadian production for a more comprehensive picture of the industry. The May 26 release also incorporated the strategy of moving the quarterly farm cash receipts series to the category of “other release,” as this data series does not present a balanced picture in the sense that expenditure data are not available at the same time. The semi-annual dissemination of the annual net farm income and value-added accounts will continue as major releases in The Daily. This was in response to recommendations received from various key stakeholders. A similar presentation on STC’s farm income dissemination strategy was made to its Advisory Committee on Agriculture Statistics in November 2007. The Committee supported the plan and, as recommended – in order to better balance the revenue-only farm cash receipts release – indications of input costs were incorporated into recent releases by including a brief discussion of published feed grain costs and fertilizer prices. The Committee also supported the collaboration with AAFC and other key stakeholders as the dissemination plan moves forward. The Whole Farm Data Project Section, which publishes farm level data on farm operations and farm families, will be expanding its dissemination of sales/revenue classes to include more breakdowns at higher levels, in keeping with the lead taken with 2006 Census of Agriculture data. A review of the optimal classes is also being conducted on the STC-AAFC farm typology, developed by AAFC in 1998. It currently categorizes homogenous groups based on age

Canadian Agri-food Policy Institute Farm Profitability Report
74
(retirement farms), dependence on off-farm income (lifestyle), total farm family income (low-income), revenue class and farm organization structure (non-family farms). In addition, the Section’s Extraction System of Agricultural Statistics (ESAS) – an interactive, easy-to-query database – was implemented as a free web application. As of May 2008, it is available to users on STC’s website. ESAS allows access to an extensive series of tables featuring the most commonly requested disaggregated physical and financial farm data. The database offers detailed operating revenues and expenses; sources and levels of farm and off-farm income for operators and farm families; assets, liabilities and capital investment for farms; and information on land use and livestock inventories by region, farm type and revenue class. This will provide more flexibility to industry and government users.
As a result of the release of data from the 2006 Census of Agriculture on May 16, 2007, estimates of farm cash receipts, operating expenses, net income, other economic accounts, capital value and other data contained in the Agriculture Economic Statistics series are being revisited as part of the planned intercensal revision process. The data series will be revised where necessary. The complete set of revisions was tentatively planned to be released in the November 24, 2008 version of STC’s The Daily.
In addition to actions being taken as a result of the Workshop on Farm Income, AAFC and STC have also been working closely with the Canadian Agri-food Policy Institute (CAPI) to examine and refine measures of farm income and industry performance in Canada to better illuminate the current situation and new possibilities for the industry.


