Anchorage Water & Wastewater Utility · First, the John M. Asplund Wastewater Treatment Facility...
79
Treatment Operations and Maintenance Engineering Anchorage Water & Wastewater Utility AWWU Board of Directors Information Technology Employee Services Customer Service Finance Mayor Assistant General Manager Municipal Manager General Manager 2013 Proposed Operating and Capital Budgets AWWU - 1
Transcript of Anchorage Water & Wastewater Utility · First, the John M. Asplund Wastewater Treatment Facility...

TreatmentOperations and
MaintenanceEngineering
Anchorage Water & Wastewater Utility
AWWUBoard of Directors
Information Technology
Employee Services Customer Service Finance
Mayor
Assistant General Manager
Municipal Manager
General Manager
2013 Proposed Operating and Capital Budgets
AWWU - 1

Anchorage Water and Wastewater Organizational Overview
Overview The Anchorage Water and Wastewater Utility (AWWU) is the largest water and wastewater utility in Alaska. AWWU currently serves the Municipality of Anchorage extending from Eklutna to as far south as Girdwood. Although they share one workforce, AWWU operates as two separate economic and regulated entities: the Anchorage Water Utility (AWU) and the Anchorage Wastewater Utility (ASU). System Description To provide water and sewer services, AWWU owns and operates five Treatment Facilities (2 water and 3 wastewater), over 1,600 miles of pipe, and over 325,000 square feet of facility space distributed throughout the Municipality. The certificated water service area covers 130.4 square miles in three distinct geographic areas, Northern Communities, the Anchorage Bowl and Girdwood Valley. Estimates place the water service population at approximately 240,000 people via nearly 55,000 customer accounts. The certificated sewer service area is larger, encompassing virtually all of the Municipality, or 1,850.9 square miles. ASU currently provides sewer service to approximately 250,000 people via nearly 56,000 customer accounts. AWU’s three sources of water are Eklutna Lake, Ship Creek and groundwater accessed through a system of wells in the Northern Communities, the Anchorage Bowl and Girdwood Valley. Eklutna Water Treatment Facility (WTF) and the wells which supply Girdwood are operated year-round and serve as the primary supply sources for the Anchorage and Girdwood water systems. The Ship Creek Water Treatment Facility and the remainder of the water wells are used to augment the primary water supply, mainly in times of peak demand, as well as provide redundancy to the Eklutna source for Eagle River and the Anchorage Bowl. Of these sources, the Eklutna Water Treatment Facility now provides approximately 90% of total water production for the Northern Communities/Eagle River and the Anchorage Bowl. In Girdwood, where system demand constitutes less than 2 percent of AWWU’s total water production, all water produced and distributed is from two municipally-owned and managed wells. ASU operates three wastewater treatment facilities to treat wastewater collected in three geographically separate but commonly managed sewer systems. First, the John M. Asplund Wastewater Treatment Facility (WWTF) located at Point Woronzof was constructed in the early 1970’s when Anchorage eliminated direct ocean discharges. It services the wastewater treatment needs of the Anchorage Bowl. The Asplund facility has received numerous upgrades including improved handling of sludge solids, new headworks and process equipment to replace aged infrastructure. The Asplund facility provides primary treatment and operates with an expired, administratively extended National Pollution Discharge Elimination (NPDES) permit administered by the Environmental Protection Agency (EPA) with provision provided under section 301(h) of the Clean Water Act. Second, the Eagle River WWTF was originally built in the 1960’s and upgraded several times. It services the public wastewater treatment and disposal needs within Eagle River and Chugiak. The Eagle River facility provides biological secondary treatment and discharges treated effluent to Eagle River under an expired NPDES permit which has
2013 Proposed Operating and Capital Budgets
AWWU - 2

been administratively extended by the Alaska Department of Environmental Conservation (ADEC), which has assumed primacy over wastewater discharge permits from the EPA. Third, the Girdwood WWTF was originally constructed in the 1970’s and also has undergone several process modifications and upgrades. The core facility is now at the end of its useful life. The Girdwood facility provides biological secondary treatment and discharges treated effluent to Glacier Creek under an administratively extended NPDES permit administered by the ADEC. Over the past two decades, investments in physical infrastructure have resulted in an increase in the value of AWU. From 1990 to present, plant in service has increased by 108% from $355.2 million to $737.6 million. This growth is primarily a result of an increasing amount of investment in transmission and distribution assets (pipelines), with lesser investments in general plant assets (e.g., structures and intangible assets). From 1990 to present, ASU’s plant in service has increased by 87% from $301.5 million to $564.9 million. This growth is primarily a result of an increasing investment in sewer collection pipeline network, followed by upgrades in sewer treatment facilities, and modest investment in pumping plant (sewage lift or pump stations), general plant (structures), and intangible assets. Organization AWWU is organized into 7 divisions. The General Manager’s office is responsible for overall operation of AWWU. The Engineering Division is responsible for development and execution of AWWU’s capital program and for system planning. The Treatment Division is responsible for day to day operation of the treatment facilities and water distribution system and for maintaining compliance with all state and federal regulations. The Operations and Maintenance (O&M) Division maintains the treatment facilities, repairs all water and sewer piping and lift stations. The O&M Division also operates the wastewater collection system and is responsible for AWWU’s SCADA system. The Customer Service Division is responsible for responding to customer inquiries, billing & collections for both utilities, billing & collection of special assessments, issuing of permits and field service functions. The Information Technology Division provides support for all of AWWU’s computers, network and software systems. The Employee Services (ES) Division handles all employee actions and inquiries. AWWU’s training and safety officers are part of the ES Division. The Finance Division is responsible for all general ledger and plant accounting and preparation of utility budgets and financial statements.
2013 Proposed Operating and Capital Budgets
AWWU - 3
Anchorage Water and Wastewater Utility Business Plan
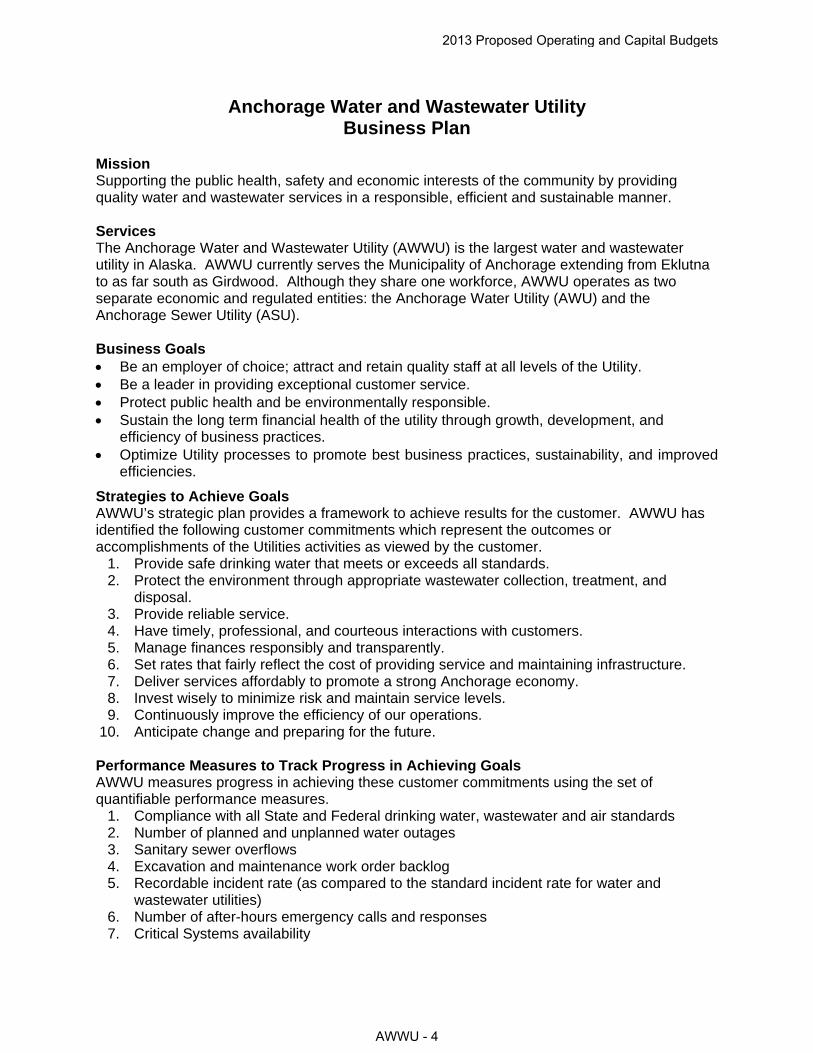
Mission Supporting the public health, safety and economic interests of the community by providing quality water and wastewater services in a responsible, efficient and sustainable manner. Services The Anchorage Water and Wastewater Utility (AWWU) is the largest water and wastewater utility in Alaska. AWWU currently serves the Municipality of Anchorage extending from Eklutna to as far south as Girdwood. Although they share one workforce, AWWU operates as two separate economic and regulated entities: the Anchorage Water Utility (AWU) and the Anchorage Sewer Utility (ASU). Business Goals Be an employer of choice; attract and retain quality staff at all levels of the Utility. Be a leader in providing exceptional customer service. Protect public health and be environmentally responsible. Sustain the long term financial health of the utility through growth, development, and
efficiency of business practices. Optimize Utility processes to promote best business practices, sustainability, and improved
efficiencies.
Strategies to Achieve Goals AWWU’s strategic plan provides a framework to achieve results for the customer. AWWU has identified the following customer commitments which represent the outcomes or accomplishments of the Utilities activities as viewed by the customer.
1. Provide safe drinking water that meets or exceeds all standards. 2. Protect the environment through appropriate wastewater collection, treatment, and
disposal. 3. Provide reliable service. 4. Have timely, professional, and courteous interactions with customers. 5. Manage finances responsibly and transparently. 6. Set rates that fairly reflect the cost of providing service and maintaining infrastructure. 7. Deliver services affordably to promote a strong Anchorage economy. 8. Invest wisely to minimize risk and maintain service levels. 9. Continuously improve the efficiency of our operations.
10. Anticipate change and preparing for the future.
Performance Measures to Track Progress in Achieving Goals AWWU measures progress in achieving these customer commitments using the set of quantifiable performance measures.
1. Compliance with all State and Federal drinking water, wastewater and air standards 2. Number of planned and unplanned water outages 3. Sanitary sewer overflows 4. Excavation and maintenance work order backlog 5. Recordable incident rate (as compared to the standard incident rate for water and
wastewater utilities) 6. Number of after-hours emergency calls and responses 7. Critical Systems availability
2013 Proposed Operating and Capital Budgets
AWWU - 4
8. Execution of capital improvement budget 9. Debt to equity ratio
10. Service affordability
2013 Proposed Operating and Capital Budgets
AWWU - 5

Anchorage Water and Wastewater Utility Anchorage: Performance. Value. Results.
Mission
Supporting the public health, safety, and economic interests of the community by providing quality water and wastewater services in a responsible, efficient, and sustainable manner.
Core Services
Reliably treat and distribute potable water for domestic, commercial, and firefighting uses throughout the certificated service area.
Reliably collect, treat and dispose of wastewater in accordance with laws and regulations that protect public health and the environment.
Accomplishment Goals
Provide reliable service
Provide safe drinking water that meets or exceeds all standards
Protect the environment through appropriate wastewater collection, treatment, and disposal.
Fiscal responsibility and transparency with utility finances.
Timely, professional, and courteous interactions with customers.
Rates that fairly reflect the cost of providing service and maintaining infrastructure
Continuous improvement in the efficiency of our operations
Anticipate change and be prepared for the future. Performance Measures
Progress in achieving goals shall be measured by:
1. Compliance with all State and Federal drinking water standards
/wastewater standards
/Clean Air Act standards
2. Number of planned and unplanned water outages
3. Sanitary sewer overflows
4. Excavation and maintenance work order backlog
5. Recordable incident rate (as compared to the standard incident rate for water and wastewater utilities)
6. Number of after-hours emergency calls and responses
7. Critical Systems availability
8. Execution of capital improvement budget
9. Debt to equity ratio
10. Service affordability
2013 Proposed Operating and Capital Budgets
AWWU - 6

Measure #1: Compliance with all State and Federal drinking water, wastewater, and clean air standards.
Historical Information Compliance with all State and Federal drinking water, wastewater, and clean air standards Goal
Second Quarter
2012
First Quarter
2012 2011
Annual 2010
Annual
Safe Drinking Water Act Compliance 100% 100% 100% 100% 100% Clean Water Act (NPDES permit) Compliance -Asplund -Eagle River -Girdwood
100%
100% 100% 100%
100%
99.73% 100%
100% 99.99%
Clean Air Act Compliance (Asplund Incinerator) 100% 100% 99.98% 99.99% 99.99%
Measure #2: Number of planned and unplanned water outages (customers per month).
Historical monthly
average Number of planned and unplanned water outages (customers per month)
Goal (Affected
customers per month)
2nd Q 2012
(monthly average)
1st Q 2012
(monthly average) 2011 2010 2009
Planned Outages
<4 hours <20 10 8 12 12 107
4-12 hours <20 31 48 23 28 96
>12 hours 0 0 0 0.1 0.2 27
Unplanned Outages
<4 hours <20 17 94 23 30 27
4-12 hours <50 43 45 51 50 59
>12 hours 0 2 0 9 3 15
2013 Proposed Operating and Capital Budgets
AWWU - 7
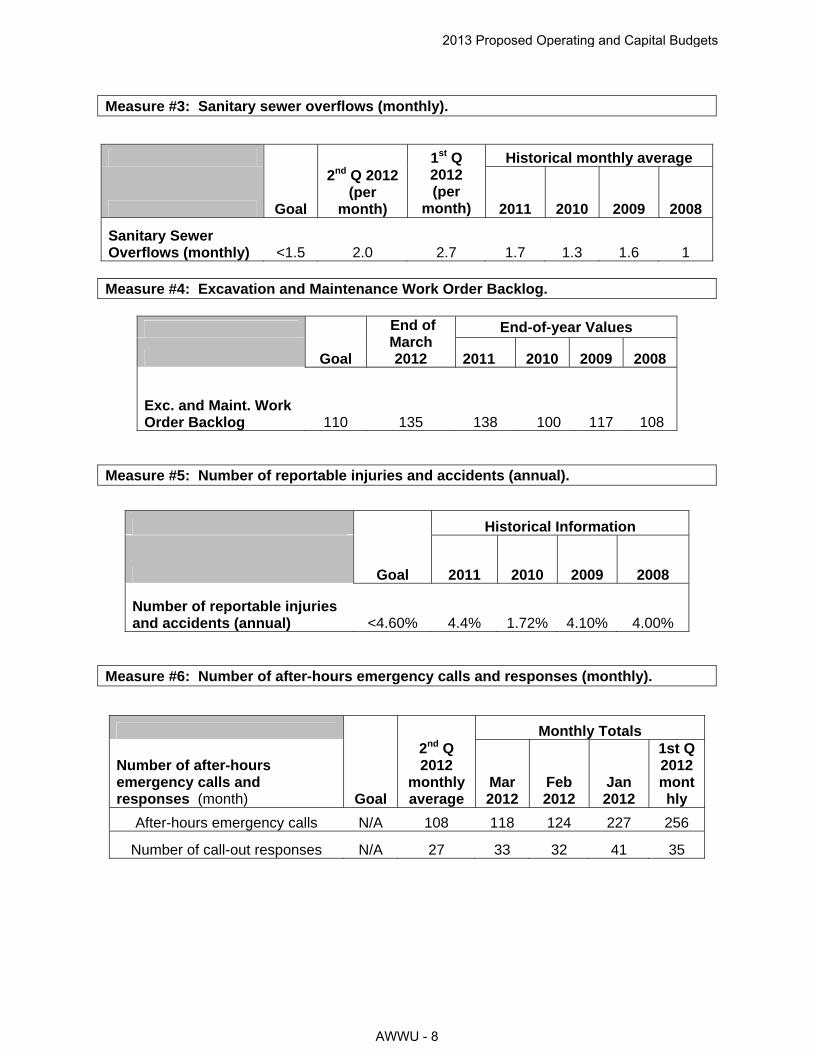
Measure #3: Sanitary sewer overflows (monthly).
Historical monthly average
Goal
2nd Q 2012 (per
month)
1st Q 2012 (per
month) 2011 2010 2009 2008
Sanitary Sewer Overflows (monthly) <1.5 2.0 2.7 1.7 1.3 1.6 1
Measure #4: Excavation and Maintenance Work Order Backlog.
End-of-year Values
Goal
End of March 2012 2011 2010 2009 2008
Exc. and Maint. Work Order Backlog 110 135 138 100 117 108
Measure #5: Number of reportable injuries and accidents (annual).
Historical Information
Goal 2011 2010 2009 2008
Number of reportable injuries and accidents (annual) <4.60% 4.4% 1.72% 4.10% 4.00%
Measure #6: Number of after-hours emergency calls and responses (monthly).
Monthly Totals
Number of after-hours emergency calls and responses (month) Goal
2nd Q 2012
monthly average
Mar 2012
Feb 2012
Jan 2012
1st Q 2012 monthly
After-hours emergency calls N/A 108 118 124 227 256
Number of call-out responses N/A 27 33 32 41 35
2013 Proposed Operating and Capital Budgets
AWWU - 8

Measure #7: Critical IT systems availability (outage per month).
Historical Information
Goal
2nd Quarter
2012
1st Quarter
2012 Dec 2011 2010 2009 2008
Critical IT systems availability (outages per month) 2 1.0 0 0
New metric – no historic data
Measure #8: Execution of Capital Improve Budget (annual).
Historical Information
Goal 2011 2010 2009 2008 Execution of Capital Improvement Budget (annual)
75% (Long term
trend) 60%* 75% annual average
since 1999
*2011 CIB includes nearly $15 Million for Girdwood WWTF which has been delayed by permitting considerations. Phase I of that work is currently out to bid (February, 2012). The attached figure shows the planned expenditure for 2012.
2013 Proposed Operating and Capital Budgets
AWWU - 9

Measure #9: Debt to equity ratio (annual).
Historical Information
Debt to Equity Ratio (annual) Goal 2011 2010 2009 2008
Water Utility (2010) 75/25 70/30 70/30 71/29 72/28 Wastewater Utility
(2010) 75/25 68/32 69/31 68/32 66/34 Measure #10: Service affordability (annual).
Historical data
Service Affordability (annual) Goal 2012 2011 2010 2009 2008
Water Utility - 0.8 0.7 0.7 0.7 0.6 Wastewater Utility - 0.6 0.6 0.5 0.5 0.5
Combined <2.0 1.4 1.3 1.2 1.2 1.1
2013 Proposed Operating and Capital Budgets
AWWU - 10

PVR Measure WC: Managing Workers' Compensation Claims
Reducing job-related injuries is a priority for the Administration by ensuring safe work conditions and safe practices. By instilling safe work practices we ensure not only the safety of our employees but reduce the potential for injuries and property damage to the public. The Municipality is self-insured and every injury poses a financial burden on the public and the injured worker's family. It just makes good sense to WORK SAFE.
Results are tracked by monitoring monthly reports issued by the Risk Management Division.
Workers' Compensation Claims
Anchorage Water & Wastewater
0
50000
100000
150000
200000
250000
300000
350000
400000
450000
500000
12/31/2011 3/31/2012 6/30/2012
2013 Proposed Operating and Capital Budgets
AWWU - 11

Anchorage Water and Wastewater Highlights and Future Events
Aging Infrastructure At the current time, AWWU provides best-in-class service as measured against industry benchmarks such as drinking water compliance rate, water quality complaints, water pipeline breaks, unplanned service disruptions, compliance with discharge permits, collection system failures, and sewer overflows. However, the infrastructure required to provide water and sewer service is aging and will require significant annual capital investments to maintain service levels. In aggregate, AWU’s physical assets are considered to have about one-half of their useful lives consumed. The water transmission and distribution system pipe network, which now consists of 828.5 miles of pipe, has a weighted average age of over 33 years. Other AWU assets including treatment facilities, reservoirs, wells, booster stations and major valve vaults are of varying age, but in aggregate, have reached just over one-half of their useful lives and have undergone or have been scheduled for major re-investment over the next 5-10 years. The weighted average age of ASU’s sewer assets is 32 years old, again reflecting just over one-half of the estimated useful lives of pipe and approximately three-fifths of the estimated useful lives of other sewer plant. Unlike the water system however, some treatment facility assets are new. Within the Anchorage Bowl, more than $40 million of treatment plant investment occurred over the past decade, much of that for new assets (e.g., new headworks, solids handling, building improvements and liquid process improvements) at the Asplund WWTF. In Eagle River, new process improvements and support systems (UV disinfection, mechanical and HVAC systems) worth over $3 million were built over the last five years. The exception is the Girdwood WWTF, which is now over 30 years old and reaching the end of its useful life as documented by multiple studies performed since 2006. AWWU has implemented a state of the art asset management program to manage the Utility’s aging infrastructure. The primary components of AWWU’s asset management program include:
o Risk based approach that categorizes AWWU’s assets and evaluates each asset’s class on the basis of consequence and likelihood of failure.
o Robust analysis of system performance and maintenance data to predict service lives of different asset classes.
o Business case analysis of major projects to determine lowest overall life cycle costs.
o Use of state of the art repair and rehabilitation technologies to reduce service disruption and reduce costs.
o Condition assessment monitoring and evaluation using both AWWU staff and specialized contractors.
Limited Customer Growth The Anchorage economy and land use development patterns and restrictions are such that AWWU does not anticipate significant customer growth rate for the foreseeable future. AWWU’s water master plan projects a customer growth rate of approximately
2013 Proposed Operating and Capital Budgets
AWWU - 12

0.3% per year for the next 25 years. Limited customer growth represents a significant challenge for AWWU because there are few new customers to help cover the cost of maintaining infrastructure. Exacerbating the lack of customer growth is the repair and replacement of contributed plant. In the 1990’s, over 70% of the plant in-service was contributed (i.e., given to AWWU or paid for by grants). Today that percentage is about 50% and decreasing steadily. Contributed plant is not included in rates for calculating depreciation costs and earning a return. However, repair and replacement of this considerable portion of our plant-in-service must be borne wholly by customers. With a very slow growth of the customer base, cost of this repair and replacement will increase over time for each customer. There is very little AWWU can do to encourage significant customer growth without major changes in policy and community desires. Most of AWWU's customer growth will come from redevelopment of existing properties in the MOA and limited infill. Redevelopment and infill must comply with current codes and utility tariffs, which may require upgrades to existing utility service. Aging Workforce AWWU is typical of the industry in that we have an aging workforce. 11% of AWWU’s workforce has over 25 years of experience with the Utility. These individuals can be expected to retire in the next few years. Many of these individuals are the experienced and licensed professionals required to operate AWWU’s facilities in compliance with Alaska regulations. Alaska’s oil industry and the boom in oil and gas development in the lower 48 represents a significant threat to retaining water and wastewater professionals. The oil industry typically pays significantly higher wages than AWWU. AWWU is working with Plumbers & Pipefitters Union Local 367 to develop an apprentice program to provide more workers. AWWU also has a long standing intern program with the Alaska Job Corp and various universities. And while these programs will help, AWWU expects to be under severe pressure for the next several years as senior staff retire. AWWU has no realistic option to fill these vacancies except primarily through in house training programs. Debt At the end of 2011, AWWU was carrying approximately $361 million in total net debt. AWWU can easily service this debt and the Utility maintains healthy operating margins and debt service coverage ratios. However, compared to peer utilities, AWWU has a significant amount of debt and finances much less of its capital program with equity. Two major factors have contributed to AWWU’s current debt/equity position. First, during the 1990’s, AWWU did not have rate increases and had a very modest capital improvement budget (CIB). During these years, reductions in workforce levels and improvements in worker productivity as a result of investments in appropriate technology allowed the Utility to operate effectively, but not accumulate equity.
2013 Proposed Operating and Capital Budgets
AWWU - 13
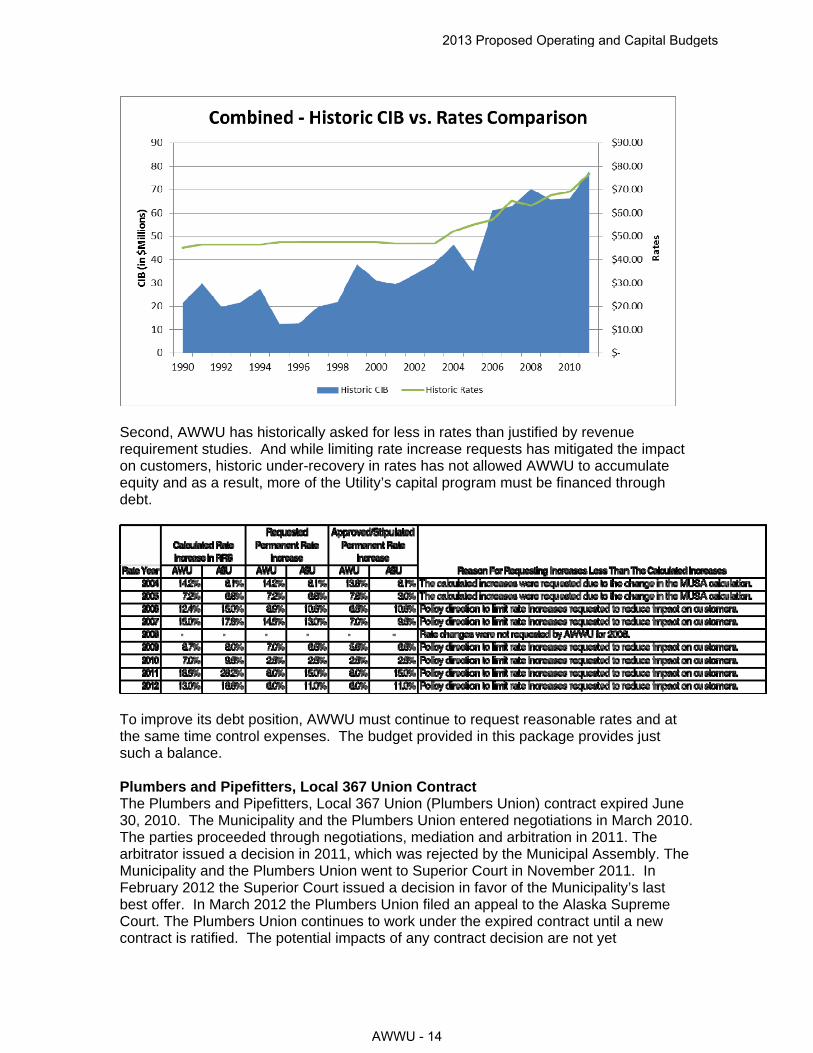
Second, AWWU has historically asked for less in rates than justified by revenue requirement studies. And while limiting rate increase requests has mitigated the impact on customers, historic under-recovery in rates has not allowed AWWU to accumulate equity and as a result, more of the Utility’s capital program must be financed through debt.
To improve its debt position, AWWU must continue to request reasonable rates and at the same time control expenses. The budget provided in this package provides just such a balance. Plumbers and Pipefitters, Local 367 Union Contract The Plumbers and Pipefitters, Local 367 Union (Plumbers Union) contract expired June 30, 2010. The Municipality and the Plumbers Union entered negotiations in March 2010. The parties proceeded through negotiations, mediation and arbitration in 2011. The arbitrator issued a decision in 2011, which was rejected by the Municipal Assembly. The Municipality and the Plumbers Union went to Superior Court in November 2011. In February 2012 the Superior Court issued a decision in favor of the Municipality’s last best offer. In March 2012 the Plumbers Union filed an appeal to the Alaska Supreme Court. The Plumbers Union continues to work under the expired contract until a new contract is ratified. The potential impacts of any contract decision are not yet
2013 Proposed Operating and Capital Budgets
AWWU - 14

measurable, and therefore no budget has been included for any potential retro-active payments related to the expired contract. The Plumbers Union will be able to strike in July 2013 and the potential for a strike is a business risk that should be considered in 2013. Environmental Issues Beginning in 1993, in accordance with State of Alaska Department of Environmental Conservation (ADEC) regulations, the Utility commenced activities to remove three leaking, underground fuel storage tanks and the surrounding contaminated soils. Additional contamination was identified on the affected property (unrelated to the tank leakage) requiring additional removal of soils. In 2010, the Utility completed additional site characterization. In 2011, AWWU submitted work plans and received approval from ADEC for continued groundwater monitoring while working towards closure of the case on this site. Budgeted remediation for those sites with continued monitoring and approved work plans was postponed in 2012 in response to direction from the Assembly to reduce operating expenditures. However, remediation has been re-programmed in 2013 to address the business risk to the Utility from further migration of contamination from Utility property. The Utility used the expected cash flow technique to measure the liability. The Utility estimated a reasonable range of potential outlays of $180,000 to $245,000 and multiplied those outlays by their probability of occurring to estimate a pollution remediation obligation of $186,500. The potential for a material change in the estimate is possible depending upon the response received from ADEC. Wastewater Treatment Facilities Discharge Permits The State of Alaska Department of Environmental Conservation (ADEC) assumed authority for permitting wastewater discharges for the Girdwood and Eagle River Wastewater Treatment Facilities (WWTF) in November 2008. The Eagle River WWTF permit is administratively extended pending reissuance by ADEC. ADEC is working on the renewal and expects to issue a draft permit for the Utility to review in 2012. The Girdwood WWTF permit is also administratively extended pending reissuance by ADEC. The Utility is working closely with ADEC to ensure that a proposed upgrade to the Girdwood WWTF is consistent with terms and conditions of the new permit, when it is reissued. Authorization of discharge into marine waters from the Asplund WWTF under the provisions of Section 301(h) of the Clean Water Act remains under the auspices of the U.S. Environmental Protection Agency (EPA). EPA is currently evaluating the Utility’s application for reauthorization of the permit. The renewal process includes an evaluation by EPA to determine whether Asplund continues to meet the Clean Water Act criteria necessary to reissue a permit with a 301(h) modification allowing only primary treatment. Subsequent to a positive determination, EPA is required to consult with the National Marine Fisheries Service (NMFS) on the effects of the permit reauthorization on endangered species (i.e., the Cook Inlet beluga whale). If NMFS finds that the discharge reauthorization is likely to jeopardize continued existence of the species or adversely modify critical habitat, NMFS may impose conditions on the permit to mitigate the effects on the species. Discussions with federal agencies to date suggest that such a finding is unlikely. AWWU expects this issuance of the Asplund WWTF permit to be controversial and has budgeted approximately $500,000 in 2013 for anticipated legal and professional services.
2013 Proposed Operating and Capital Budgets
AWWU - 15

Anchorage Water and Wastewater External Impacts
Wastewater Treatment Facilities Discharge Permits The State of Alaska Department of Environmental Conservation (ADEC) assumed authority for permitting wastewater discharges for the Girdwood and Eagle River Wastewater Treatment Facilities (WWTF) in November 2008. The Eagle River WWTF permit is administratively extended pending reissuance by ADEC. ADEC is working on the renewal and expects to issue a draft permit for the Utility to review in 2012. The Girdwood WWTF permit is also administratively extended pending reissuance by ADEC. The Utility is working closely with ADEC to ensure that a proposed upgrade to the Girdwood WWTF is consistent with terms and conditions of the new permit, when it is reissued. Authorization of discharge into marine waters from the Asplund WWTF remains under the auspices of the U.S. Environmental Protection Agency (EPA). EPA is currently evaluating the Utility’s application for reauthorization of the permit allowing only primary treatment, in accordance with criteria set out in Section 301(h) of the Clean Water Act. Subsequent to the agency’s determination that the Asplund discharge meets the 301(h) criteria, EPA will consult with the National Marine Fisheries Service (NMFS) on the effects of the permit reauthorization on endangered species (i.e., the Cook Inlet beluga whale). If NMFS finds that the discharge reauthorization is likely to jeopardize continued existence of the species or adversely modify critical habitat, NMFS may impose conditions on the permit to mitigate the effects on the species. Discussions with federal agencies to date suggest that such a finding is unlikely. AWWU expects this re-authorization of Asplund's permit to be controversial and has budgeted approximately $600,000 in 2013 for anticipated legal and professional services. Plumbers and Pipefitters, Local 367 Union Contract The Plumbers and Pipefitters, Local 367 Union (Plumbers Union) contract expired June 30, 2010. The Plumbers Union continues to work under the expired contract until a new contract is ratified. The potential impacts of any contract decision are not yet measurable, and therefore no potential retroactive payments have been included in the budget related to the expired contract. The Plumbers Union will be able to strike in July 2013 and the potential for a strike is a business risk that should be considered in 2013. Aging Infrastructure At the current time, AWWU provides best-in-class service as measured against industry benchmarks. However, the infrastructure required to provide water and sewer service is aging and will require significant annual capital investments to maintain service levels. AWWU has implemented a state-of-the-art asset management program to optimize spending on the Utility’s aging infrastructure. We are performing business case analyses of major projects to determine lowest overall life cycle costs, as well as extensive condition assessment monitoring and evaluation using both AWWU staff and specialized contractors. This work is expected to continue to provide reduced costs to ratepayers in the long term.
2013 Proposed Operating and Capital Budgets
AWWU - 16

Division 2011 2012 2013 2014 2015 2016 2017 2018
General Manager 4.0 4.0 4.0 4.0 4.0 4.0 4.0 4.0
Information Technology 19.0 19.0 19.0 19.0 19.0 19.0 19.0 19.0
Operations and Maintenance 86.0 86.0 86.0 86.0 86.0 86.0 86.0 86.0
Treatment 63.0 62.0 62.0 62.0 62.0 62.0 62.0 62.0
Finance 25.0 22.0 22.0 22.0 22.0 22.0 22.0 22.0
Employee Services 8.0 6.5 5.0 5.0 5.0 5.0 5.0 5.0
Customer Service 40.5 39.0 39.0 39.0 39.0 39.0 39.0 39.0
Engineering 39.5 40.5 40.5 40.5 40.5 40.5 40.5 40.5
Total full time 285.0 279.0 277.5 277.5 277.5 277.5 277.5 277.5
Temporary 3.5 2.0 2.0 2.0 2.0 2.0 2.0 2.0
Total FTE 288.5 281.0 279.5 279.5 279.5 279.5 279.5 279.5
Interns 10.0 7.0 7.0 7.0 7.0 7.0 7.0 7.0
Total positions in the Department Summary, Division Summary, or Detail reports are different as the allocation between the utilities varies.
Anchorage Water and Wastewater UtilityWorkforce Projections
2013 Proposed Operating and Capital Budgets
AWWU - 17
This page intentionally left blank.
2013 Proposed Operating and Capital Budgets
AWWU - 18

2011 2012 2013 2014 2015 2016 2017 2018
Financial Overview Actuals Proforma Budget
Revenues 52,239 55,464 58,719 62,329 66,319 70,289 74,619 79,089
Expenses and Transfers 45,958 52,264 53,767 57,403 59,103 60,543 63,593 66,673
Net Income (Loss) - Regulatory 6,280 3,200 4,952 4,926 7,216 9,746 11,026 12,416
Dividend to General Government - - - - - - - -
Increase in Net Assets 6,280 3,200 4,952 4,926 7,216 9,746 11,026 12,416
Workforce Authorized per Budget* 288.5 279.0 277.5 277.5 277.5 277.5 277.5 277.5
Capital Improvement Program 38,281 38,760 33,240 33,399 31,700 32,226 33,080 32,218
New Debt 22,002 20,000 68,000 10,000 9,500 9,700 67,000 9,700
Net Plant (12/31) 497,497 521,945 541,173 558,838 574,403 589,490 604,702 618,619
Net Assets (12/31) 95,123 98,323 103,276 105,982 112,288 121,074 131,100 142,776
Operating Cash 18,188 15,597 15,820 14,181 16,201 17,705 19,449 19,855
Construction Cash Pool 10,457 5,215 44,147 25,772 10,317 - 42,918 32,271
Restricted Cash 5,334 - - - - - - -
Total Cash 33,979 20,812 59,967 39,952 26,518 17,705 62,367 52,126
IGCs - General Government 858 1,137 1,104 1,104 1,104 1,104 1,104 1,104
MUSA 7,148 7,368 7,670 7,960 8,210 8,440 8,670 8,890
CCP Borrowings from Gen'l Govt. - - - - - 2,130 - -
Total Outstanding LT Debt 222,176 231,761 287,783 282,850 280,166 276,717 329,841 323,309
Total Annual Debt Service 16,846 18,053 19,646 25,109 22,149 22,603 24,386 27,788
Debt Service Coverage (Bond) 1.99 1.82 1.96 1.60 2.23 2.44 2.44 2.22
Debt Service Coverage (Total) 1.29 1.18 1.19 1.07 1.33 1.42 1.44 1.37
Debt/Equity Ratio 70 / 30 70 / 30 74 / 26 72 / 28 71 / 29 69 / 31 71 / 29 69 / 31
Rate Change Percent 8.00% 6.00% 6.00% 6.00% 6.00% 6.00% 6.00% 5.60%
Single Family Rate 43.25 45.85 48.60 51.52 54.61 57.88 61.36 64.79
Statistical/Performance Trends
Number of Accounts 55,202 55,340 55,478 55,617 55,756 55,895 56,035 56,175
Average Treatment (GPD) (000) 22,700 22,757 22,814 22,871 22,928 22,985 23,043 23,100
Miles of Water Lines 836 838 840 842 844 847 849 851
Number of Hydrants 7,254 7,272 7,290 7,309 7,327 7,345 7,363 7,382
* Workforce Authorized per Budget is for both Water and Wastewater utilities.
($ in thousands)
Anchorage Water Utility8 Year Summary
Forecast
2013 Proposed Operating and Capital Budgets
AWWU - 19

2011Actuals
2012Proforma
2012Revised
2013Proposed
13 v 12% Chg
Operating RevenueCharges for services 49,797,000 53,095,000 53,800,000 57,550,000 7.0%
Miscellaneous 1,374,000 1,619,000 1,250,000 894,000 -28.5%
Total Operating Revenue 51,171,000 54,714,000 55,050,000 58,444,000 6.2%
Non Operating RevenueInvestment Income 952,000 670,000 550,000 240,000 -56.4%
Other Income 115,000 80,000 30,000 35,000 16.7%
Total Non Operating Revenue 1,067,000 750,000 580,000 275,000 -52.6%
Total Revenue 52,238,000 55,464,000 55,630,000 58,719,000 5.6%
Operating ExpensesLabor
Straight time 8,402,000 9,513,800 10,175,000 9,526,980 -6.4%
Overtime 377,000 422,500 342,000 362,500 6.0%
Benefits and Leave 5,734,000 6,502,000 6,903,000 6,886,590 -0.2%
Vacancy - - (596,000) (456,790) -23.4%
Total Labor 14,513,000 16,438,300 16,824,000 16,319,280 -3.0%
Non Labor
Non Labor 8,223,895 9,269,250 9,535,150 9,282,000 -2.7%
Travel 68,105 62,750 104,850 68,000 -35.1%
Transfers (MUSA and gross receipts) 7,148,000 7,367,800 7,500,000 7,670,000 2.3%
Depreciation and Amortization 8,348,000 10,000,000 10,180,000 10,623,000 4.4%
Total Non Labor 23,788,000 26,699,800 27,320,000 27,643,000 1.2%
Total Direct Cost 38,301,000 43,138,100 44,144,000 43,962,280 -0.4%
Charges from other departments 858,000 1,136,000 1,137,000 1,104,500 -2.9%
Total Operating Expense 39,159,000 44,274,100 45,281,000 45,066,780 -0.5%
Non Operating ExpenseInterest on bonded debt 6,184,000 6,040,000 6,391,000 6,430,000 0.6%
Amortization of debt expense 380,000 700,000 650,000 375,000 -42.3%
Other interest expense 1,031,000 1,750,000 1,489,000 2,185,000 46.7%
Interest during construction (796,000) (500,000) (510,000) (290,000) -43.1%
Total Non Operating Expense 6,799,000 7,990,000 8,020,000 8,700,000 8.5%
Total Expenses (Function Cost) 45,958,000 52,264,100 53,301,000 53,766,780 0.9%
Net Income 6,280,000 3,199,900 2,329,000 4,952,220 112.6%
Appropriation:Total Expenses 53,766,780
Less: Non Cash items
Depreciation and amortization 10,623,000
Amortization of debt expense 375,000
Interest during construction (290,000)
Total Non-Cash 10,708,000
Amount to be Appropriated (cash expenses) 43,058,780
Anchorage Water Utility2013 Statement of Revenues and Expenses
2013 Proposed Operating and Capital Budgets
AWWU - 20
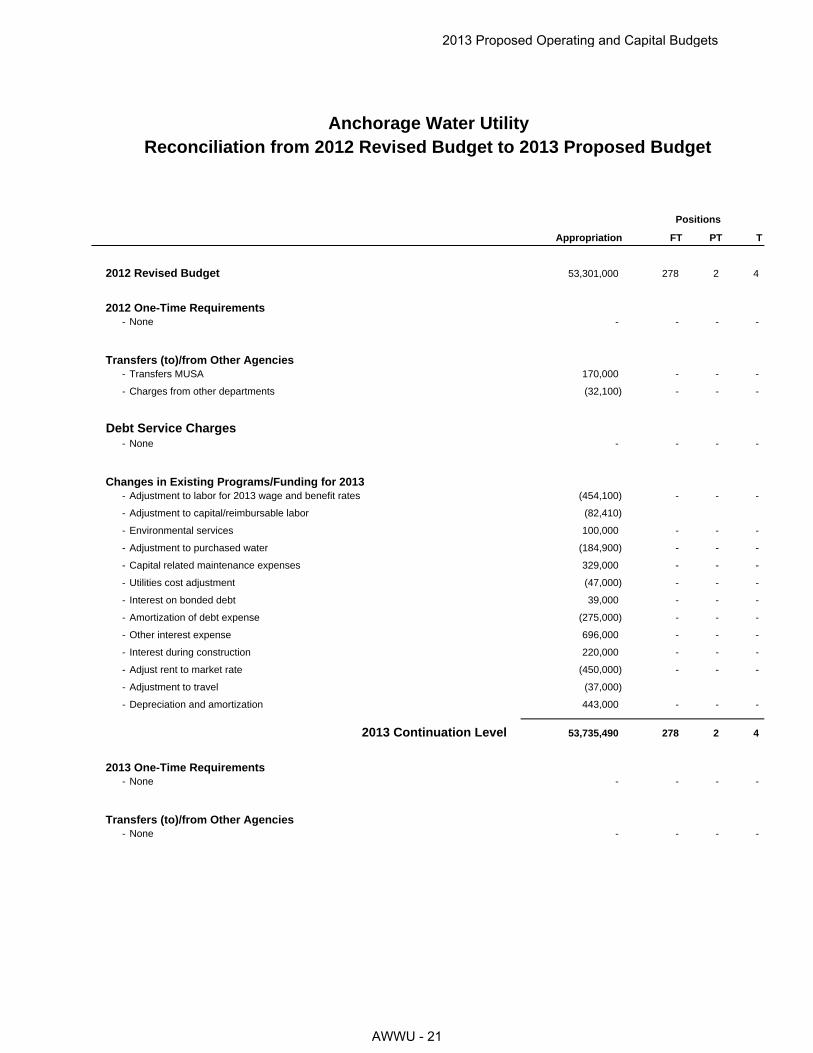
Appropriation FT PT T
53,301,000 278 2 4
- None - - - -
- Transfers MUSA 170,000 - - -
- Charges from other departments (32,100) - - -
Debt Service Charges- None - - - -
- Adjustment to labor for 2013 wage and benefit rates (454,100) - - -
- Adjustment to capital/reimbursable labor (82,410)
- Environmental services 100,000 - - -
- Adjustment to purchased water (184,900) - - -
- Capital related maintenance expenses 329,000 - - -
- Utilities cost adjustment (47,000) - - -
- Interest on bonded debt 39,000 - - -
- Amortization of debt expense (275,000) - - -
- Other interest expense 696,000 - - -
- Interest during construction 220,000 - - -
- Adjust rent to market rate (450,000) - - -
- Adjustment to travel (37,000)
- Depreciation and amortization 443,000 - - -
53,735,490 278 2 4
- None - - - -
- None - - - -
Changes in Existing Programs/Funding for 2013
Transfers (to)/from Other Agencies
2013 Continuation Level
Transfers (to)/from Other Agencies
2013 One-Time Requirements
2012 Revised Budget
2012 One-Time Requirements
Positions
Anchorage Water UtilityReconciliation from 2012 Revised Budget to 2013 Proposed Budget
2013 Proposed Operating and Capital Budgets
AWWU - 21

Appropriation FT PT T
Positions
Anchorage Water UtilityReconciliation from 2012 Revised Budget to 2013 Proposed Budget
- In 2013, in-line with best practice, MOA will no longer include accounting entry transactions for items previously appropriated.
- - - -
- Depreciation and amortization (10,623,000) - - -
- Interest during construction 290,000 - - -
- Amortization of debt expense (375,000) - - -
- Add back funding for 2012 frozen positions 97,290 - - -
- Eliminate 1.5 FTEs from Employee Services (66,000) (1) (1) -
2013 Proposed Budget 43,058,780 277 1 4
2013 Proposed Budget Changes
2013 Budget Adjustment for Accounting Transactions
2013 Proposed Operating and Capital Budgets
AWWU - 22

Direct Cost by DivisionAWU Board 59,583 59,200 26,200 <55.74%>
AWU Customer Service 2,874,117 3,143,695 3,227,732 2.67%
AWU Employee Services 379,978 435,640 372,577 <14.48%>
AWU Engineering 1,418,735 1,628,100 1,670,967 2.63%
AWU Finance 660,129 1,328,885 1,180,113 <11.20%>
AWU General Manager 426,578 480,420 571,410 18.94%
AWU IT 2,244,740 2,042,620 2,029,734 <0.63%>
AWU Operations & Maintenance 7,906,625 9,074,400 8,738,723 <3.70%>
AWU Revenues & Non Operating Expenses 22,295,373 25,700,000 26,993,000 5.03%
AWU Treatment 6,834,160 8,271,500 7,851,824 <5.07%>
Direct Cost Total 45,100,018 52,164,460 52,662,280 0.95%
Intragovernmental ChargesCharges by Other Departments 858,356 1,136,540 1,104,500 <2.82%>
Function Cost Total 45,958,374 53,301,000 53,766,780 0.87%
Program Generated Revenue (52,238,591) (55,630,000) (58,719,000) 5.55%
Net Cost Total (6,280,217) (2,329,000) (4,952,220) 112.63%
Direct Cost by Category
Personnel 14,513,120 16,811,600 16,319,280 <2.93%>
Supplies 2,208,089 2,220,585 2,243,985 1.05%
Travel 68,106 104,850 68,000 <35.15%>
Contractual/OtherServices 13,163,535 14,827,425 14,708,015 <0.81%>
Debt Service/Depreciation 15,147,168 18,200,000 19,323,000 6.17%
Direct Cost Total 45,100,018 52,164,460 52,662,280 0.95%
Position Summary as Budgeted
Full-Time - - 243
Part-Time - - 9
Position Total - - 252
Anchorage Water UtilityDepartment Summary
2012Revised
2013Proposed
2011Actuals
13 v 12% Chg
2013 Proposed Operating and Capital Budgets
AWWU - 23
2011Actuals
2012Revised
2013Proposed
13 v 12% Chg
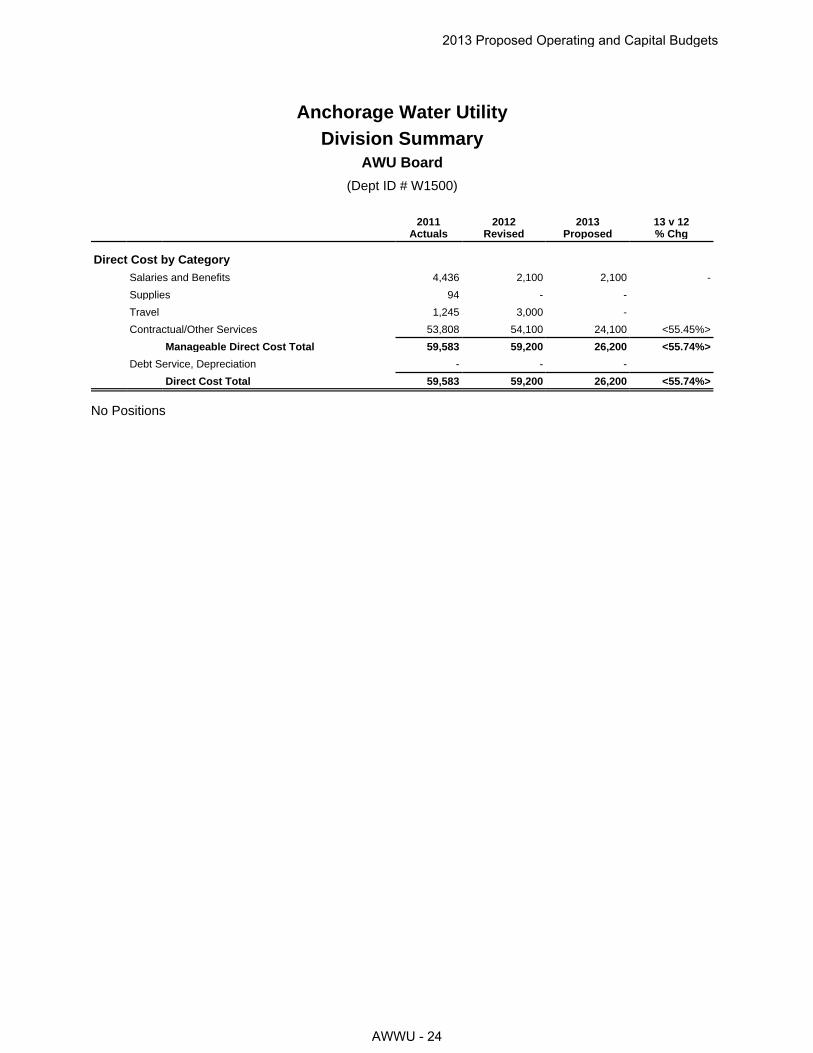
Direct Cost by CategorySalaries and Benefits 4,436 2,100 2,100 -
Supplies 94 - -
Travel 1,245 3,000 -
Contractual/Other Services 53,808 54,100 24,100 <55.45%>
Manageable Direct Cost Total 59,583 59,200 26,200 <55.74%>
Debt Service, Depreciation - - -
Direct Cost Total 59,583 59,200 26,200 <55.74%>
No Positions
Anchorage Water UtilityDivision Summary
(Dept ID # W1500)
AWU Board
2013 Proposed Operating and Capital Budgets
AWWU - 24

Net Cost
Manageable Direct Cost 59,583 59,200 26,200 <55.74%>
Debt Service, Depreciation - - - -
Net Cost Total 59,583 59,200 26,200 <55.74%>
Direct Cost by CategorySalaries and Benefits
1101 - Straight Time Labor 1,473 - - -
1401 - Benefits 2,963 2,100 2,100 -
Salaries and Benefits Total 4,436 2,100 2,100 -
Supplies 94 - - -
Travel 1,245 3,000 - -
Contractual/Other Services 53,808 54,100 24,100 <55.45%>
Manageable Direct Cost Total 59,583 59,200 26,200 <55.74%>
Debt Service, Depreciation - - - -
Direct Cost Total 59,583 59,200 26,200 <55.74%>
Anchorage Water UtilityDivision Detail
(Dept ID # W1500)
AWU Board
2012Revised
2013Proposed
2011Actuals
13 v 12% Chg
2013 Proposed Operating and Capital Budgets
AWWU - 25

2011Actuals
2012Revised
2013Proposed
13 v 12% Chg
Direct Cost by CategorySalaries and Benefits 3,311,119 3,655,500 3,565,209 <2.47%>
Supplies 668,206 726,730 726,730 -
Travel 12,745 18,500 12,650 <31.62%>
Contractual/Other Services 2,842,090 3,870,770 3,547,235 <8.36%>
Manageable Direct Cost Total 6,834,160 8,271,500 7,851,824 <5.07%>
Debt Service, Depreciation - - -
Direct Cost Total 6,834,160 8,271,500 7,851,824 <5.07%>
Positions as Budgeted2011 Revised 2012 Revised 2013 Proposed
Full Time Part Time Full Time Part Time Full Time Part Time
Junior Admin Officer - - - - 1 -
Laboratory Analyst I - - - - 3 -
Laboratory Analyst II - - - - 1 -
Laboratory Supervisor - - - - 1 -
Treatment Plant Operator II - - - - 9 1
Treatment Plant Operator IV - - - - 9 -
Treatment Plant Ops Foreman - - - - 2 -
Treatment Supt W/W - - - - 2 -
Utility Director II - - - - 1 -
Utility Management Assistant - - - - 1 -
Positions as Budgeted Total - - - - 30 1
Anchorage Water UtilityDivision Summary
(Dept ID # W4000, W4210, W4310, W4320, W4340)
AWU Treatment
2013 Proposed Operating and Capital Budgets
AWWU - 26

Net Cost
Manageable Direct Cost 6,834,160 8,271,500 7,851,824 <5.07%>
Debt Service, Depreciation - - - -
Net Cost Total 6,834,160 8,271,500 7,851,824 <5.07%>
Direct Cost by CategorySalaries and Benefits
1101 - Straight Time Labor 2,041,281 3,655,500 2,045,789 <44.04%>
1201 - Overtime - - 128,000 -
1301 - Leave/Holiday Accruals - - 219,713 -
1401 - Benefits 1,269,838 - 1,225,960 -
1501 - Allow Differentials/Premiums - - 43,900 -
1601 - Vacancy Factor - - (98,152) -
Salaries and Benefits Total 3,311,119 3,655,500 3,565,209 <2.47%>
Supplies 668,206 726,730 726,730 -
Travel 12,745 18,500 12,650 <31.62%>
Contractual/Other Services 2,842,090 3,870,770 3,547,235 <8.36%>
Manageable Direct Cost Total 6,834,160 8,271,500 7,851,824 <5.07%>
Debt Service, Depreciation - - - -
Direct Cost Total 6,834,160 8,271,500 7,851,824 <5.07%>
Anchorage Water UtilityDivision Detail
(Dept ID # W4000, W4210, W4310, W4320, W4340)
AWU Treatment
2012Revised
2013Proposed
2011Actuals
13 v 12% Chg
2013 Proposed Operating and Capital Budgets
AWWU - 27

2011Actuals
2012Revised
2013Proposed
13 v 12% Chg
Direct Cost by CategorySalaries and Benefits 2,254,102 2,498,200 2,491,012 <0.29%>
Supplies 232,113 250,550 235,550 <5.99%>
Travel 2,133 5,700 5,750 0.88%
Contractual/Other Services 385,769 389,245 495,420 27.28%
Manageable Direct Cost Total 2,874,117 3,143,695 3,227,732 2.67%
Debt Service, Depreciation - - -
Direct Cost Total 2,874,117 3,143,695 3,227,732 2.67%
Positions as Budgeted2011 Revised 2012 Revised 2013 Proposed
Full Time Part Time Full Time Part Time Full Time Part Time
Account Representative I - - - - 1 -
Account Representative II - - - - 1 -
Account Representative III - - - - 10 -
Administrative Officer - - - - 3 -
Engineering Technician I - - - - 1 -
Engineering Technician II - - - - 3 -
Field Service Journeyman A - - - - 2 1
Field Service Journeyman B - - - - 6 -
Junior Admin Officer - - - - 3 -
Lead Meter Reader - - - - 1 -
Maintenance Supervisor - - - - 1 -
Meter Reader - - - - 1 -
Meter/InstallReprmn Journeyman - - - - 1 -
Principal Admin Officer - - - - 1 -
Senior Admin Officer - - - - 2 -
Treatment Supt W/W - - - - 1 -
Utility Division Director II - - - - 1 -
Positions as Budgeted Total - - - - 39 1
Anchorage Water UtilityDivision Summary
(Dept ID # W7000)
AWU Customer Service
2013 Proposed Operating and Capital Budgets
AWWU - 28
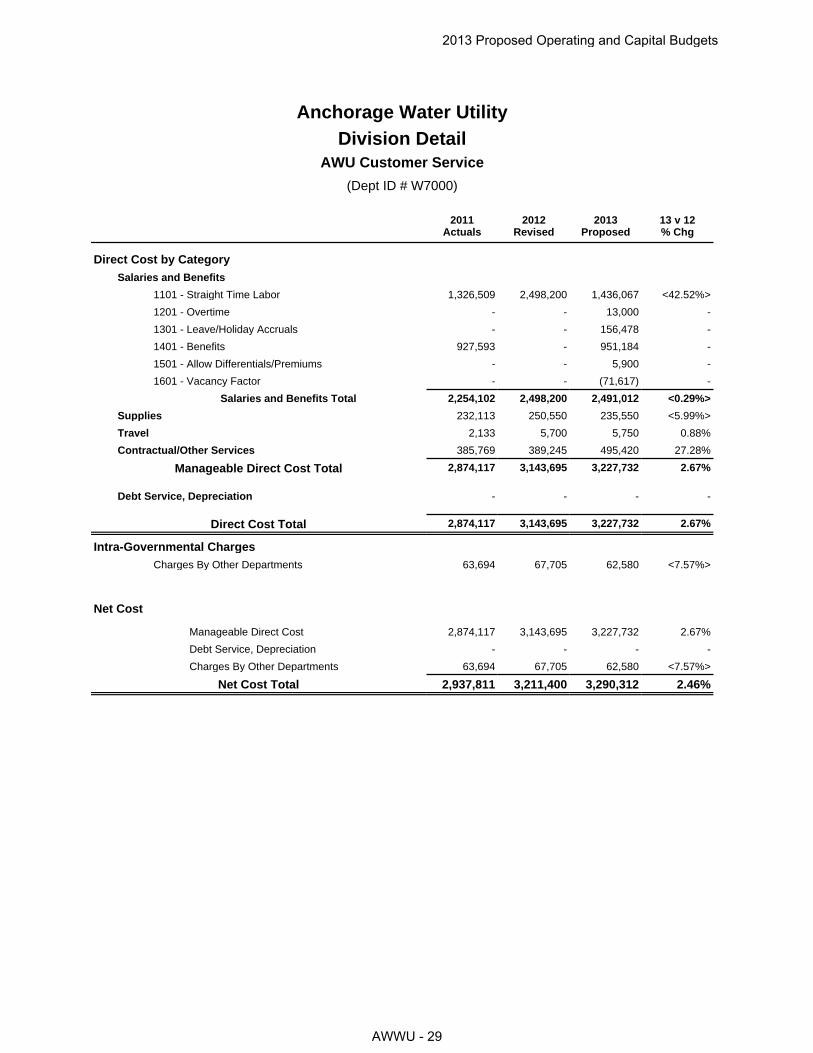
Net Cost
Manageable Direct Cost 2,874,117 3,143,695 3,227,732 2.67%
Debt Service, Depreciation - - - -
Charges By Other Departments 63,694 67,705 62,580 <7.57%>
Net Cost Total 2,937,811 3,211,400 3,290,312 2.46%
Direct Cost by CategorySalaries and Benefits
1101 - Straight Time Labor 1,326,509 2,498,200 1,436,067 <42.52%>
1201 - Overtime - - 13,000 -
1301 - Leave/Holiday Accruals - - 156,478 -
1401 - Benefits 927,593 - 951,184 -
1501 - Allow Differentials/Premiums - - 5,900 -
1601 - Vacancy Factor - - (71,617) -
Salaries and Benefits Total 2,254,102 2,498,200 2,491,012 <0.29%>
Supplies 232,113 250,550 235,550 <5.99%>
Travel 2,133 5,700 5,750 0.88%
Contractual/Other Services 385,769 389,245 495,420 27.28%
Manageable Direct Cost Total 2,874,117 3,143,695 3,227,732 2.67%
Debt Service, Depreciation - - - -
Direct Cost Total 2,874,117 3,143,695 3,227,732 2.67%
Intra-Governmental ChargesCharges By Other Departments 63,694 67,705 62,580 <7.57%>
Anchorage Water UtilityDivision Detail
(Dept ID # W7000)
AWU Customer Service
2012Revised
2013Proposed
2011Actuals
13 v 12% Chg
2013 Proposed Operating and Capital Budgets
AWWU - 29

2011Actuals
2012Revised
2013Proposed
13 v 12% Chg
Direct Cost by CategorySalaries and Benefits 343,424 406,000 336,397 <17.14%>
Supplies 8,148 11,575 11,075 <4.32%>
Travel 1,051 2,500 2,250 <10.00%>
Contractual/Other Services 27,355 15,565 22,855 46.84%
Manageable Direct Cost Total 379,978 435,640 372,577 <14.48%>
Debt Service, Depreciation - - -
Direct Cost Total 379,978 435,640 372,577 <14.48%>
Positions as Budgeted2011 Revised 2012 Revised 2013 Proposed
Full Time Part Time Full Time Part Time Full Time Part Time
Personnel Analyst III - - - - 1 -
Principal Office Associate - - - - 1 -
Senior Admin Officer - - - - 1 -
Treatment Supt W/W - - - - 1 -
Utility Division Director II - - - - 1 -
Positions as Budgeted Total - - - - 5 -
Anchorage Water UtilityDivision Summary
(Dept ID # W6000)
AWU Employee Services
2013 Proposed Operating and Capital Budgets
AWWU - 30

Net Cost
Manageable Direct Cost 379,978 435,640 372,577 <14.48%>
Debt Service, Depreciation - - - -
Charges By Other Departments 100,115 111,760 105,820 <5.31%>
Net Cost Total 480,093 547,400 478,397 <12.61%>
Direct Cost by CategorySalaries and Benefits
1101 - Straight Time Labor 198,863 406,000 204,777 <49.56%>
1301 - Leave/Holiday Accruals - - 23,753 -
1401 - Benefits 144,561 - 117,536 -
1601 - Vacancy Factor - - (9,669) -
Salaries and Benefits Total 343,424 406,000 336,397 <17.14%>
Supplies 8,148 11,575 11,075 <4.32%>
Travel 1,051 2,500 2,250 <10.00%>
Contractual/Other Services 27,355 15,565 22,855 46.84%
Manageable Direct Cost Total 379,978 435,640 372,577 <14.48%>
Debt Service, Depreciation - - - -
Direct Cost Total 379,978 435,640 372,577 <14.48%>
Intra-Governmental ChargesCharges By Other Departments 100,115 111,760 105,820 <5.31%>
Anchorage Water UtilityDivision Detail
(Dept ID # W6000)
AWU Employee Services
2012Revised
2013Proposed
2011Actuals
13 v 12% Chg
2013 Proposed Operating and Capital Budgets
AWWU - 31

2011Actuals
2012Revised
2013Proposed
13 v 12% Chg
Direct Cost by CategorySalaries and Benefits 1,046,954 1,402,200 1,302,167 <7.13%>
Supplies 23,569 29,045 26,500 <8.76%>
Travel 25,954 20,100 11,000 <45.27%>
Contractual/Other Services 322,258 176,755 331,300 87.43%
Manageable Direct Cost Total 1,418,735 1,628,100 1,670,967 2.63%
Debt Service, Depreciation - - -
Direct Cost Total 1,418,735 1,628,100 1,670,967 2.63%
Positions as Budgeted2011 Revised 2012 Revised 2013 Proposed
Full Time Part Time Full Time Part Time Full Time Part Time
Administrative Officer - - - - 2 -
Civil Engineer I - - - - 2 -
Civil Engineer II - - - - 8 -
Civil Engineer III - - - - 7 -
Civil Engineer IV - - - - 3 -
Engineering Technician III - - - - 9 -
Engineering Technician IV - - - - 1 -
GIS Technician II - - - - 1 -
GIS Technician III - - - - 1 -
Junior Admin Officer - - - - 1 -
Office Associate - - - - 1 -
Principal Admin Officer - - - - 1 -
Public Service Intern I - - - - - 5
Senior Admin Officer - - - - 1 -
Senior Staff Accountant - - - - 1 -
Utility Division Director II - - - - 1 -
Positions as Budgeted Total - - - - 40 5
Anchorage Water UtilityDivision Summary
(Dept ID # W8000)
AWU Engineering
2013 Proposed Operating and Capital Budgets
AWWU - 32

Net Cost
Manageable Direct Cost 1,418,735 1,628,100 1,670,967 2.63%
Debt Service, Depreciation - - - -
Net Cost Total 1,418,735 1,628,100 1,670,967 2.63%
Direct Cost by CategorySalaries and Benefits
1101 - Straight Time Labor 577,590 1,402,200 732,103 <47.79%>
1201 - Overtime - - 8,500 -
1301 - Leave/Holiday Accruals - - 187,242 -
1401 - Benefits 469,364 - 408,543 -
1601 - Vacancy Factor - - (34,221) -
Salaries and Benefits Total 1,046,954 1,402,200 1,302,167 <7.13%>
Supplies 23,569 29,045 26,500 <8.76%>
Travel 25,954 20,100 11,000 <45.27%>
Contractual/Other Services 322,258 176,755 331,300 87.43%
Manageable Direct Cost Total 1,418,735 1,628,100 1,670,967 2.63%
Debt Service, Depreciation - - - -
Direct Cost Total 1,418,735 1,628,100 1,670,967 2.63%
Anchorage Water UtilityDivision Detail
(Dept ID # W8000)
AWU Engineering
2012Revised
2013Proposed
2011Actuals
13 v 12% Chg
2013 Proposed Operating and Capital Budgets
AWWU - 33

2011Actuals
2012Revised
2013Proposed
13 v 12% Chg
Direct Cost by CategorySalaries and Benefits 1,303,556 1,386,200 1,396,913 0.77%
Supplies 16,906 21,270 18,550 <12.79%>
Travel 5,905 17,575 12,800 <27.17%>
Contractual/Other Services (666,238) (96,160) (248,150) 158.06%
Manageable Direct Cost Total 660,129 1,328,885 1,180,113 <11.20%>
Debt Service, Depreciation - - -
Direct Cost Total 660,129 1,328,885 1,180,113 <11.20%>
Positions as Budgeted2011 Revised 2012 Revised 2013 Proposed
Full Time Part Time Full Time Part Time Full Time Part Time
Accountant - - - - 2 -
Junior Accountant - - - - 1 -
Junior Admin Officer - - - - 3 -
Office Associate - - - - 1 -
Principal Accountant - - - - 2 -
Principal Admin Officer - - - - 2 -
Senior Accountant - - - - 1 -
Senior Admin Officer - - - - 3 -
Senior Staff Accountant - - - - 2 -
Utility Division Director II - - - - 1 -
Utility Management Assistant - - - - 3 -
Utility Tariff Analyst - - - - 1 -
Positions as Budgeted Total - - - - 22 -
Anchorage Water UtilityDivision Summary
(Dept ID # W5000)
AWU Finance
2013 Proposed Operating and Capital Budgets
AWWU - 34

Net Cost
Manageable Direct Cost 660,129 1,328,885 1,180,113 <11.20%>
Debt Service, Depreciation - - - -
Charges By Other Departments 227,964 423,715 563,200 32.92%
Net Cost Total 888,093 1,752,600 1,743,313 <0.53%>
Direct Cost by CategorySalaries and Benefits
1101 - Straight Time Labor 793,532 1,386,200 843,311 <39.16%>
1201 - Overtime - - 15,500 -
1301 - Leave/Holiday Accruals - - 78,493 -
1401 - Benefits 510,024 - 499,905 -
1601 - Vacancy Factor - - (40,296) -
Salaries and Benefits Total 1,303,556 1,386,200 1,396,913 0.77%
Supplies 16,906 21,270 18,550 <12.79%>
Travel 5,905 17,575 12,800 <27.17%>
Contractual/Other Services (666,238) (96,160) (248,150) 158.06%
Manageable Direct Cost Total 660,129 1,328,885 1,180,113 <11.20%>
Debt Service, Depreciation - - - -
Direct Cost Total 660,129 1,328,885 1,180,113 <11.20%>
Intra-Governmental ChargesCharges By Other Departments 227,964 423,715 563,200 32.92%
Anchorage Water UtilityDivision Detail
(Dept ID # W5000)
AWU Finance
2012Revised
2013Proposed
2011Actuals
13 v 12% Chg
2013 Proposed Operating and Capital Budgets
AWWU - 35

2011Actuals
2012Revised
2013Proposed
13 v 12% Chg
Direct Cost by CategorySalaries and Benefits 273,300 309,800 295,925 <4.48%>
Supplies 18,541 10,445 20,900 100.10%
Travel 9,496 23,225 6,450 <72.23%>
Contractual/Other Services 125,241 136,950 248,135 81.19%
Manageable Direct Cost Total 426,578 480,420 571,410 18.94%
Debt Service, Depreciation - - -
Direct Cost Total 426,578 480,420 571,410 18.94%
Positions as Budgeted2011 Revised 2012 Revised 2013 Proposed
Full Time Part Time Full Time Part Time Full Time Part Time
Administrative Officer - - - - 1 -
Assistant General Manager - - - - 1 -
General Manager - - - - 1 -
Senior Admin Officer - - - - 1 -
Positions as Budgeted Total - - - - 4 -
Anchorage Water UtilityDivision Summary
(Dept ID # W1100)
AWU General Manager
2013 Proposed Operating and Capital Budgets
AWWU - 36

Net Cost
Manageable Direct Cost 426,578 480,420 571,410 18.94%
Debt Service, Depreciation - - - -
Charges By Other Departments 282,661 318,780 293,800 <7.84%>
Net Cost Total 709,239 799,200 865,210 8.26%
Direct Cost by CategorySalaries and Benefits
1101 - Straight Time Labor 172,865 309,800 184,815 <40.34%>
1301 - Leave/Holiday Accruals - - 19,368 -
1401 - Benefits 100,435 - 100,296 -
1601 - Vacancy Factor - - (8,553) -
Salaries and Benefits Total 273,300 309,800 295,925 <4.48%>
Supplies 18,541 10,445 20,900 100.10%
Travel 9,496 23,225 6,450 <72.23%>
Contractual/Other Services 125,241 136,950 248,135 81.19%
Manageable Direct Cost Total 426,578 480,420 571,410 18.94%
Debt Service, Depreciation - - - -
Direct Cost Total 426,578 480,420 571,410 18.94%
Intra-Governmental ChargesCharges By Other Departments 282,661 318,780 293,800 <7.84%>
Anchorage Water UtilityDivision Detail
(Dept ID # W1100)
AWU General Manager
2012Revised
2013Proposed
2011Actuals
13 v 12% Chg
2013 Proposed Operating and Capital Budgets
AWWU - 37

2011Actuals
2012Revised
2013Proposed
13 v 12% Chg
Direct Cost by CategorySalaries and Benefits 1,179,620 1,242,500 1,324,134 6.57%
Supplies 344,061 127,740 161,450 26.39%
Travel 6,250 11,100 11,100 -
Contractual/Other Services 714,809 661,280 533,050 <19.39%>
Manageable Direct Cost Total 2,244,740 2,042,620 2,029,734 <0.63%>
Debt Service, Depreciation - - -
Direct Cost Total 2,244,740 2,042,620 2,029,734 <0.63%>
Positions as Budgeted2011 Revised 2012 Revised 2013 Proposed
Full Time Part Time Full Time Part Time Full Time Part Time
Administrative Officer - - - - 1 -
Application Services Supvr - - - - 2 -
Database Admin II - - - - 1 -
Database Admin Supervisor - - - - 1 -
Info Center Consultant II - - - - 1 -
Network Analyst - - - - 1 -
Systems Analyst - - - - 9 -
Technical Support Manager - - - - 1 -
Utility Division Director II - - - - 1 -
Positions as Budgeted Total - - - - 18 -
Anchorage Water UtilityDivision Summary
(Dept ID # W2000)
AWU IT
2013 Proposed Operating and Capital Budgets
AWWU - 38

Net Cost
Manageable Direct Cost 2,244,740 2,042,620 2,029,734 <0.63%>
Debt Service, Depreciation - - - -
Charges By Other Departments 183,922 214,580 79,100 <63.14%>
Net Cost Total 2,428,662 2,257,200 2,108,834 <6.57%>
Direct Cost by CategorySalaries and Benefits
1101 - Straight Time Labor 741,623 1,242,500 818,862 <34.10%>
1201 - Overtime - - 7,500 -
1301 - Leave/Holiday Accruals - - 88,279 -
1401 - Benefits 437,997 - 447,484 -
1601 - Vacancy Factor - - (37,990) -
Salaries and Benefits Total 1,179,620 1,242,500 1,324,134 6.57%
Supplies 344,061 127,740 161,450 26.39%
Travel 6,250 11,100 11,100 -
Contractual/Other Services 714,809 661,280 533,050 <19.39%>
Manageable Direct Cost Total 2,244,740 2,042,620 2,029,734 <0.63%>
Debt Service, Depreciation - - - -
Direct Cost Total 2,244,740 2,042,620 2,029,734 <0.63%>
Intra-Governmental ChargesCharges By Other Departments 183,922 214,580 79,100 <63.14%>
Anchorage Water UtilityDivision Detail
(Dept ID # W2000)
AWU IT
2012Revised
2013Proposed
2011Actuals
13 v 12% Chg
2013 Proposed Operating and Capital Budgets
AWWU - 39

2011Actuals
2012Revised
2013Proposed
13 v 12% Chg
Direct Cost by CategorySalaries and Benefits 4,796,609 5,909,100 5,605,423 <5.14%>
Supplies 896,451 1,043,230 1,043,230 -
Travel 3,327 3,150 6,000 90.48%
Contractual/Other Services 2,210,238 2,118,920 2,084,070 <1.64%>
Manageable Direct Cost Total 7,906,625 9,074,400 8,738,723 <3.70%>
Debt Service, Depreciation - - -
Direct Cost Total 7,906,625 9,074,400 8,738,723 <3.70%>
Positions as Budgeted2011 Revised 2012 Revised 2013 Proposed
Full Time Part Time Full Time Part Time Full Time Part Time
Assistant Parts Warehouseman - - - - 1 -
Engineering Technician III - - - - 1 -
Equipment Serviceman II - - - - 1 -
Expeditor - - - - 2 -
Heavy Equipment Opr Journeyman A - - - - 1 -
Heavy Equipment Opr Journeyman B - - - - 1 -
Journeyman Craftsman A - - - - 3 -
Journeyman Craftsman B - - - - 2 -
Journeyman Mechanic A - - - - 4 -
Journeyman Mechanic B - - - - 3 -
Journeyman Utilityman A - - - - 3 -
Journeyman Utilityman B - - - - 16 -
Junior Admin Officer - - - - 1 -
Maintenance Foreman B - - - - 9 -
Mechanic Foreman - - - - 1 -
Mechanic Leadman B - - - - 3 -
Office Associate - - - - 1 -
Principal Admin Officer - - - - 1 -
Treatment Instrument/System Foreman - - - - 2 -
Treatment Instrument/System Tech - - - - 12 -
Treatment Supt W/W - - - - 3 -
Utility Division Director II - - - - 1 -
Utility Management Assistant - - - - 1 -
Utilityman I - - - - - 1
Utilityman II - - - - 7 1
Utilityman III A - - - - 2 -
Utilityman III B - - - - 2 -
Warehouse Journeyman - - - - 1 -
Positions as Budgeted Total - - - - 85 2
Anchorage Water UtilityDivision Summary
(Dept ID # W3000, W3600, W3640, W3100)
AWU Operations & Maintenance
2013 Proposed Operating and Capital Budgets
AWWU - 40

Net Cost
Manageable Direct Cost 7,906,625 9,074,400 8,738,723 <3.70%>
Debt Service, Depreciation - - - -
Net Cost Total 7,906,625 9,074,400 8,738,723 <3.70%>
Direct Cost by CategorySalaries and Benefits
1101 - Straight Time Labor 2,925,154 5,909,100 3,200,753 <45.83%>
1201 - Overtime - - 190,000 -
1301 - Leave/Holiday Accruals - - 351,570 -
1401 - Benefits 1,871,455 - 2,008,683 -
1501 - Allow Differentials/Premiums - - 10,700 -
1601 - Vacancy Factor - - (156,283) -
Salaries and Benefits Total 4,796,609 5,909,100 5,605,423 <5.14%>
Supplies 896,451 1,043,230 1,043,230 -
Travel 3,327 3,150 6,000 90.48%
Contractual/Other Services 2,210,238 2,118,920 2,084,070 <1.64%>
Manageable Direct Cost Total 7,906,625 9,074,400 8,738,723 <3.70%>
Debt Service, Depreciation - - - -
Direct Cost Total 7,906,625 9,074,400 8,738,723 <3.70%>
Anchorage Water UtilityDivision Detail
(Dept ID # W3000, W3600, W3640, W3100)
AWU Operations & Maintenance
2012Revised
2013Proposed
2011Actuals
13 v 12% Chg
2013 Proposed Operating and Capital Budgets
AWWU - 41

2011Actuals
2012Revised
2013Proposed
13 v 12% Chg
Direct Cost by CategoryTravel - - -
Contractual/Other Services 7,148,205 7,500,000 7,670,000 2.27%
Manageable Direct Cost Total 7,148,205 7,500,000 7,670,000 2.27%
Debt Service, Depreciation 15,147,168 18,200,000 19,323,000 6.17%
Direct Cost Total 22,295,373 25,700,000 26,993,000 5.03%
Revenue by FundFund 540 - Water Utility 52,238,591 55,630,000 58,719,000 5.55%
Revenue Total 52,238,591 55,630,000 58,719,000 5.55%
No Positions
Anchorage Water UtilityDivision Summary
(Dept ID # W11000)
AWU Revenues & Non Operating Expenses
2013 Proposed Operating and Capital Budgets
AWWU - 42

Net Cost
Manageable Direct Cost 7,148,205 7,500,000 7,670,000 2.27%
Debt Service, Depreciation 15,147,168 18,200,000 19,323,000 6.17%
Program Generated Revenue (52,238,591) (55,630,000) (58,719,000) 5.55%
Net Cost Total (29,943,218)
(29,930,000)
(31,726,000)
6.00%
Direct Cost by CategoryTravel - - - -
Contractual/Other Services 7,148,205 7,500,000 7,670,000 2.27%
Manageable Direct Cost Total 7,148,205 7,500,000 7,670,000 2.27%
Debt Service, Depreciation 15,147,168 18,200,000 19,323,000 6.17%
Direct Cost Total 22,295,373 25,700,000 26,993,000 5.03%
Program Generated Revenue9400 - Charges for Services 51,171,381 55,050,000 57,550,000 4.54%
9760 - Investment Revenues 952,475 550,000 240,000 <56.36%>
9798 - Miscellaneous Revenues 114,735 30,000 929,000 2996.67%
Program Generated Revenue Total 52,238,591 55,630,000 58,719,000 5.55%
Anchorage Water UtilityDivision Detail
(Dept ID # W11000)
AWU Revenues & Non Operating Expenses
2012Revised
2013Proposed
2011Actuals
13 v 12% Chg
2013 Proposed Operating and Capital Budgets
AWWU - 43

Project Category 2013 2014 2015 2016 2017 2018 TotalEquipment 2,824 2,935 3,397 3,288 2,720 2,551 17,715 Plant 14,432 9,183 3,425 2,020 5,026 4,660 38,746 Pipe 15,984 21,281 24,878 26,918 25,334 25,007 139,402
Total 33,240 33,399 31,700 32,226 33,080 32,218 195,863
Funding Source 2013 2014 2015 2016 2017 2018 TotalDebt 28,240 28,399 24,700 22,226 22,080 20,218 145,863 State/Fed Grant 2,000 2,000 2,000 2,000 2,000 2,000 12,000 Equity/Operations 3,000 3,000 5,000 8,000 9,000 10,000 38,000
Total 33,240 33,399 31,700 32,226 33,080 32,218 195,863
2013 - 2018 Capital Improvement ProgramAnchorage Water Utility
(in thousands)
2013 Proposed Operating and Capital Budgets
AWWU - 44
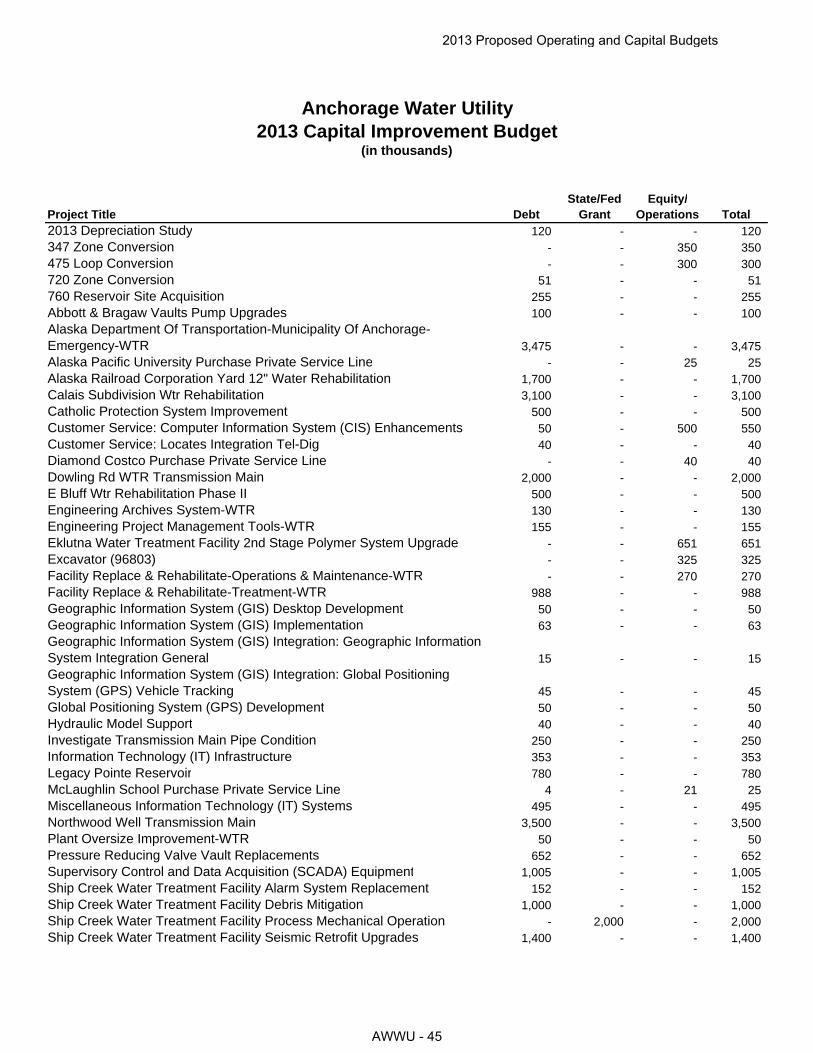
Project Title DebtState/Fed
GrantEquity/
Operations Total2013 Depreciation Study 120 - - 120 347 Zone Conversion - - 350 350 475 Loop Conversion - - 300 300 720 Zone Conversion 51 - - 51 760 Reservoir Site Acquisition 255 - - 255 Abbott & Bragaw Vaults Pump Upgrades 100 - - 100 Alaska Department Of Transportation-Municipality Of Anchorage-Emergency-WTR 3,475 - - 3,475 Alaska Pacific University Purchase Private Service Line - - 25 25 Alaska Railroad Corporation Yard 12" Water Rehabilitation 1,700 - - 1,700 Calais Subdivision Wtr Rehabilitation 3,100 - - 3,100 Catholic Protection System Improvement 500 - - 500 Customer Service: Computer Information System (CIS) Enhancements 50 - 500 550 Customer Service: Locates Integration Tel-Dig 40 - - 40 Diamond Costco Purchase Private Service Line - - 40 40 Dowling Rd WTR Transmission Main 2,000 - - 2,000 E Bluff Wtr Rehabilitation Phase II 500 - - 500 Engineering Archives System-WTR 130 - - 130 Engineering Project Management Tools-WTR 155 - - 155 Eklutna Water Treatment Facility 2nd Stage Polymer System Upgrade - - 651 651 Excavator (96803) - - 325 325 Facility Replace & Rehabilitate-Operations & Maintenance-WTR - - 270 270 Facility Replace & Rehabilitate-Treatment-WTR 988 - - 988 Geographic Information System (GIS) Desktop Development 50 - - 50 Geographic Information System (GIS) Implementation 63 - - 63 Geographic Information System (GIS) Integration: Geographic Information System Integration General 15 - - 15 Geographic Information System (GIS) Integration: Global Positioning System (GPS) Vehicle Tracking 45 - - 45 Global Positioning System (GPS) Development 50 - - 50 Hydraulic Model Support 40 - - 40 Investigate Transmission Main Pipe Condition 250 - - 250 Information Technology (IT) Infrastructure 353 - - 353 Legacy Pointe Reservoir 780 - - 780 McLaughlin School Purchase Private Service Line 4 - 21 25 Miscellaneous Information Technology (IT) Systems 495 - - 495 Northwood Well Transmission Main 3,500 - - 3,500 Plant Oversize Improvement-WTR 50 - - 50 Pressure Reducing Valve Vault Replacements 652 - - 652 Supervisory Control and Data Acquisition (SCADA) Equipment 1,005 - - 1,005 Ship Creek Water Treatment Facility Alarm System Replacement 152 - - 152 Ship Creek Water Treatment Facility Debris Mitigation 1,000 - - 1,000 Ship Creek Water Treatment Facility Process Mechanical Operation - 2,000 - 2,000 Ship Creek Water Treatment Facility Seismic Retrofit Upgrades 1,400 - - 1,400
2013 Capital Improvement BudgetAnchorage Water Utility
(in thousands)
2013 Proposed Operating and Capital Budgets
AWWU - 45

Project Title DebtState/Fed
GrantEquity/
Operations Total
2013 Capital Improvement BudgetAnchorage Water Utility
(in thousands)
Ship Creek Water Treatment Facility Worker Safety/Code Compliance 2,311 - - 2,311 Service High School Purchase Private Service System - - 250 250 Transmission Main Access Manholes 500 - - 500 Transmission Main Leak Repair 500 - - 500 Vehicles-WTR - - 268 268 Water Quality Management: Environmental Compliance Monitoring Reporting 45 - - 45 Work Management Systems 200 - - 200 Wonder Park Wtr Phase II 1,377 - - 1,377 Wtr Upgrade Preliminary Engineering 239 - - 239
Total 28,240 2,000 3,000 33,240
2013 Proposed Operating and Capital Budgets
AWWU - 46

2011 2012 2013
Actual Proforma Budget
Sources of Cash FundsOperating Income 19,160,003 17,807,750 21,047,720
Depreciation, net of amortization 8,348,377 10,000,000 10,623,000
Transfer from Escrow Account 2,455,479 - -
Grant Proceeds 2,796,898 2,000,000 2,000,000
Special Assessment Proceeds 351,036 250,000 250,000
State of Alaska Loan Proceeds 22,001,505 20,000,000 10,000,000
Bond/Commercial Paper Proceeds - - 58,000,000
Miscellaneous Non-Operating Revenues 114,735 30,000 35,000
Interest Received 921,740 720,000 240,000
Changes in Assets and Liabilities (919,680) 1,069,460 (755,720)
Total Sources of Cash Funds 55,230,093 51,877,210 101,440,000
Uses of Cash FundsCapital Construction 24,908,342 40,750,000 36,168,000
Debt Principal Payment 9,673,260 10,790,000 12,352,000
Debt Interest Payments 7,172,611 7,263,000 7,294,000
Interfund Loan to Wastewater Utility 6,445,734 (6,446,000) -
MUSA 7,148,205 7,368,000 7,670,000
Total Uses of Cash Funds 55,348,152 59,725,000 63,484,000
Net Increase (Decrease) in Cash Funds (118,059) (7,847,790) 37,956,000
Cash Balance, January 1 29,077,849 28,959,790 21,112,000
Cash Balance, December 31 28,959,790 21,112,000 59,068,000
Detail of Cash and Investment FundsGeneral Cash Less Customer Deposits 18,187,725 15,597,000 14,621,000
Construction Cash 10,457,352 5,215,000 44,147,000
Operating Fund Investment & Customer Deposits 314,713 300,000 300,000
Cash Balance, December 31 28,959,790 21,112,000 59,068,000
Anchorage Water UtilityStatement of Cash Sources and Uses
2013 Proposed Operating and Capital Budgets
AWWU - 47

This page intentionally left blank.
2013 Proposed Operating and Capital Budgets
AWWU - 48

2012 2013 2014 2015 2016 2017 2018
Financial Overview Actuals Proforma Budget
Revenues 42,524 46,871 48,766 53,596 55,866 60,056 63,976 69,726
Expenses and Transfers 38,654 44,384 45,240 48,158 52,688 56,558 58,998 63,968
Net Income (Loss) - Regulatory 3,869 2,487 3,526 5,438 3,178 3,498 4,978 5,758
Dividend to General Government - - - - - - - -
Increase in Net Assets 3,869 2,487 3,526 5,438 3,178 3,498 4,978 5,758
Workforce Authorized per Budget* 288.5 279.0 277.5 277.5 277.5 277.5 277.5 277.5
Capital Improvement Program 37,948 30,381 31,863 31,863 33,345 34,200 35,150 36,000
New Debt 3,896 5,000 46,000 5,000 96,000 15,000 5,000 92,000
Net Plant (12/31) 350,456 357,814 377,846 389,768 408,727 425,474 485,470 507,495
Net Assets (12/31) 62,932 65,420 68,945 74,383 77,561 81,059 86,037 91,795
Operating Cash 9,010 9,699 12,607 14,379 15,899 16,172 17,193 17,942
Construction Cash Pool - - 10,369 966 59,891 24,589 511 60,039
Restricted Cash 386 - - - - - - -
Total Cash 9,396 9,699 22,976 15,344 75,789 40,761 17,704 77,981
IGCs - General Government 838 1,116 1,088 1,088 1,088 1,088 1,088 1,088
MUSA 5,255 5,342 5,370 5,670 5,850 6,130 6,380 7,280
CCP Borrowings from Gen'l Govt. 6,446 27,958 - - - - - -
Total Outstanding LT Debt 136,394 135,896 176,360 174,356 263,160 267,787 261,543 342,016
Total Annual Debt Service 9,543 9,744 10,264 13,058 15,029 20,085 20,862 22,805
Debt Service Coverage (Bond) 3.70 3.81 3.90 2.89 2.36 1.82 2.04 2.03
Debt Service Coverage (Total) 1.47 1.49 1.62 1.52 1.36 1.16 1.23 1.29
Debt/Equity Ratio 68 / 32 67 / 33 72 / 28 70 / 30 77 / 23 77 / 23 75 / 25 79 / 21
Rate Change Percent 15.00% 11.00% 4.50% 9.50% 3.60% 7.10% 6.50% 9.00%
Single Family Rate 33.65 37.36 39.04 42.75 44.28 47.43 50.56 55.11
Statistical/Performance Trends
Number of Accounts 56,107 56,247 56,388 56,529 56,670 56,812 56,954 57,096
Average Treatment (GPD) (000) 26,800 29,173 29,246 29,319 29,392 29,466 29,539 29,613
Miles of Wastewater Lines 752 754 756 758 760 761 763 765
* Workforce Authorized per Budget is for both Water and Wastewater utilities.
Anchorage Wastewater Utility8 Year Summary
($ in thousands)
Forecast
2011
2013 Proposed Operating and Capital Budgets
AWWU - 49

2011Actuals
2012Proforma
2012Revised
2013Proposed
13 v 12% Chg
Operating RevenueCharges for Services 40,966,000 45,368,000 45,500,000 47,700,000 4.8%
Miscellaneous 1,377,000 1,443,000 1,479,000 1,021,000 -31.0%
Total Operating Revenue 42,343,000 46,811,000 46,979,000 48,721,000 3.7%
Non Operating RevenueInvestment Income 162,000 41,400 120,000 30,000 -75.0%
Other Income 19,000 18,600 - 15,000 100.0%
Total Non Operating Revenue 181,000 60,000 120,000 45,000 -62.5%
Total Revenue 42,524,000 46,871,000 47,099,000 48,766,000 3.5%
Operating ExpensesLabor
Straight time 8,146,000 9,569,000 10,105,000 9,421,470 -6.8%
Overtime 372,000 350,000 322,000 378,000 17.4%
Benefits and Leave 5,490,000 6,459,500 6,855,000 6,844,050 -0.2%
Vacancy - - (592,000) (454,220) -23.3%
Total Labor 14,008,000 16,378,500 16,690,000 16,189,300 -3.0%
Non Labor
Non Labor 8,645,099 9,775,060 9,942,450 9,677,000 -2.7%
Travel 44,901 72,240 102,150 68,000 -33.4%
Transfers (MUSA and gross receipts) 5,255,000 5,342,400 5,500,000 5,370,000 -2.4%
Depreciation and Amortization 6,154,000 7,250,000 7,600,000 7,968,000 4.8%
Total Non Labor 20,099,000 22,439,700 23,144,600 23,083,000 -0.3%
Total Direct Cost 34,107,000 38,818,200 39,834,600 39,272,300 -1.4%
Charges from other departments 838,000 1,115,800 1,117,000 1,087,970 -2.6%
Total Operating Expense 34,945,000 39,934,000 40,951,600 40,360,270 -1.4%
Non Operating ExpenseInterest on bonded debt 3,149,000 3,111,800 3,607,000 3,568,000 -1.1%
Amortization of debt expense 43,000 150,000 100,000 50,000 -50.0%
Other interest expense 1,052,000 1,532,000 1,223,000 1,612,000 31.8%
Interest during construction (533,000) (343,800) (380,000) (350,000) -7.9%
Total Non Operating Expense 3,711,000 4,450,000 4,550,000 4,880,000 7.3%
Total Expenses (Function Cost) 38,656,000 44,384,000 45,501,600 45,240,270 -0.6%
Net Income 3,868,000 2,487,000 1,597,400 3,525,730 120.7%
AppropriationTotal Expenses 45,240,270
Less: Non Cash items
Depreciation and amortization 7,968,000
Amortization of debt expense 50,000
Interest during construction (350,000)
Total Non-Cash 7,668,000
Amount to be Appropriated (cash expenses) 37,572,270
Anchorage Wastewater Utility2013 Statement of Revenues and Expenses
2013 Proposed Operating and Capital Budgets
AWWU - 50

Appropriation FT PT
45,503,000 278 2
- None - - -
- Transfers MUSA (130,000) - -
- Charges from other departments (28,630) - -
Debt Service Charges- None - - -
- Adjustment to labor for 2013 wage and benefit rates (527,050) - -
- Adjustment to capital/reimbursable labor (156,800)
- Capital related maintenance expenses 247,000 - -
- Utilities cost adjustment (20,500) - -
- Adjust rent to market rate (406,000) - -
- Interest on bonded debt (39,000) - -
- Amortization of debt expense (50,000) - -
- Other interest expense 389,000 - -
- Interest during construction 30,000 - -
- Purchased water at Asplund (87,400) - -
- Adjustment to travel (34,000) - -
- Depreciation and amortization 368,000 - -
45,057,620 278 2
- None - - -
- None - - -
2012 One-Time Requirements
2013 One-Time Requirements
Transfers (to)/from Other Agencies
Changes in Existing Programs/Funding for 2013
2013 Continuation Level
Transfers (to)/from Other Agencies
Anchorage Wastewater UtilityReconciliation from 2012 Revised Budget to 2013 Proposed Budget
Positions
2012 Revised Budget
`
2013 Proposed Operating and Capital Budgets
AWWU - 51

Appropriation FT PT
Anchorage Wastewater UtilityReconciliation from 2012 Revised Budget to 2013 Proposed Budget
Positions
- In 2013, in-line with best practice, MOA will no longer include accounting entry transactions for items previously appropriated.
- - -
- Depreciation and amortization (7,968,000) - -
- Interest during construction 350,000 - -
- Amortization of debt expense (50,000) - -
- Add back funding for 2012 frozen positions 248,650 - -
- Eliminate 1.5 FTEs from Employee Services (66,000) (1) (1)
2013 Proposed Budget 37,572,270 277 1
2013 Proposed Budget Changes
2013 Budget Adjustment for Accounting Transactions
2013 Proposed Operating and Capital Budgets
AWWU - 52

Direct Cost by DivisionASU Board 53,038 59,200 26,200 <55.74%>
ASU Customer Service 2,048,907 2,338,095 2,380,747 1.82%
ASU Employee Services 374,523 434,555 371,507 <14.51%>
ASU Engineering 1,164,303 1,522,100 1,691,602 11.14%
ASU Finance 360,385 1,260,675 1,130,683 <10.31%>
ASU General Manager 402,380 582,265 560,070 <3.81%>
ASU IT 2,246,000 2,042,610 2,041,284 <0.06%>
ASU Operations & Maintenance 8,075,603 8,174,900 7,733,826 <5.40%>
ASU Revenues & Non Operating Expenses 15,118,783 17,650,000 18,218,000 3.22%
ASU Treatment 7,972,690 10,322,000 9,998,381 <3.14%>
Direct Cost Total 37,816,612 44,386,400 44,152,300 <0.53%>
Intragovernmental ChargesCharges by Other Departments 837,820 1,116,600 1,087,970 <2.56%>
Function Cost Total 38,654,432 45,503,000 45,240,270 <0.58%>
Program Generated Revenue (42,523,838) (47,099,000) (48,766,000) 3.54%
Net Cost Total (3,869,406) (1,596,000) (3,525,730) 120.91%
Direct Cost by Category
Personnel 14,008,033 16,677,600 16,189,300 <2.93%>
Supplies 2,804,275 2,491,300 2,514,500 0.93%
Travel 44,901 102,150 68,000 <33.43%>
Contractual/OtherServices 11,095,288 12,965,350 12,532,500 <3.34%>
Debt Service/Depreciation 9,864,115 12,150,000 12,848,000 5.74%
Direct Cost Total 37,816,612 44,386,400 44,152,300 <0.53%>
Position Summary as Budgeted
Full-Time - - 252
Part-Time - - 8
Position Total - - 260
Anchorage Wastewater UtilityDepartment Summary
2012Revised
2013Proposed
2011Actuals
13 v 12% Chg
2013 Proposed Operating and Capital Budgets
AWWU - 53

2011Actuals
2012Revised
2013Proposed
13 v 12% Chg
Direct Cost by CategorySalaries and Benefits 3,491 2,100 2,100 -
Supplies 94 - -
Travel 1,245 3,000 -
Contractual/Other Services 48,208 54,100 24,100 <55.45%>
Manageable Direct Cost Total 53,038 59,200 26,200 <55.74%>
Debt Service, Depreciation - - -
Direct Cost Total 53,038 59,200 26,200 <55.74%>
No Positions
Anchorage Wastewater UtilityDivision Summary
(Dept ID # S1500)
ASU Board
2013 Proposed Operating and Capital Budgets
AWWU - 54

Net Cost
Manageable Direct Cost 53,038 59,200 26,200 <55.74%>
Debt Service, Depreciation - - - -
Net Cost Total 53,038 59,200 26,200 <55.74%>
Direct Cost by CategorySalaries and Benefits
1101 - Straight Time Labor 1,482 - - -
1401 - Benefits 2,009 2,100 2,100 -
Salaries and Benefits Total 3,491 2,100 2,100 -
Supplies 94 - - -
Travel 1,245 3,000 - -
Contractual/Other Services 48,208 54,100 24,100 <55.45%>
Manageable Direct Cost Total 53,038 59,200 26,200 <55.74%>
Debt Service, Depreciation - - - -
Direct Cost Total 53,038 59,200 26,200 <55.74%>
Anchorage Wastewater UtilityDivision Detail
(Dept ID # S1500)
ASU Board
2012Revised
2013Proposed
2011Actuals
13 v 12% Chg
2013 Proposed Operating and Capital Budgets
AWWU - 55
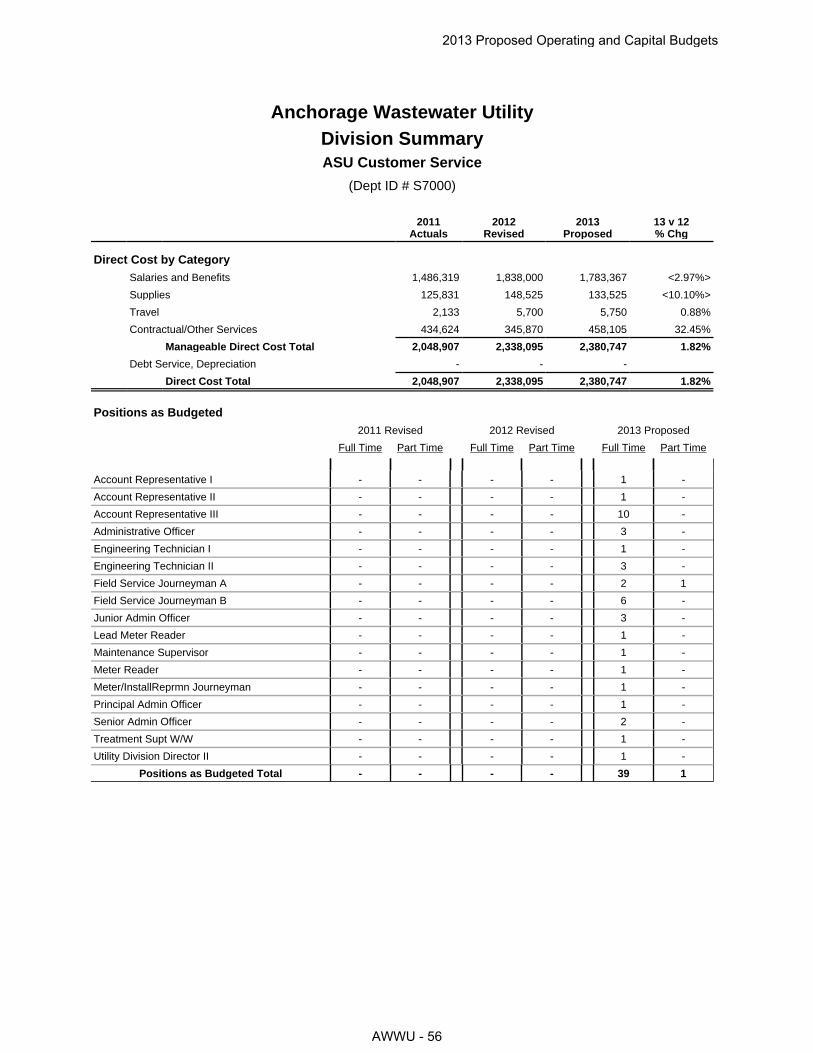
2011Actuals
2012Revised
2013Proposed
13 v 12% Chg
Direct Cost by CategorySalaries and Benefits 1,486,319 1,838,000 1,783,367 <2.97%>
Supplies 125,831 148,525 133,525 <10.10%>
Travel 2,133 5,700 5,750 0.88%
Contractual/Other Services 434,624 345,870 458,105 32.45%
Manageable Direct Cost Total 2,048,907 2,338,095 2,380,747 1.82%
Debt Service, Depreciation - - -
Direct Cost Total 2,048,907 2,338,095 2,380,747 1.82%
Positions as Budgeted2011 Revised 2012 Revised 2013 Proposed
Full Time Part Time Full Time Part Time Full Time Part Time
Account Representative I - - - - 1 -
Account Representative II - - - - 1 -
Account Representative III - - - - 10 -
Administrative Officer - - - - 3 -
Engineering Technician I - - - - 1 -
Engineering Technician II - - - - 3 -
Field Service Journeyman A - - - - 2 1
Field Service Journeyman B - - - - 6 -
Junior Admin Officer - - - - 3 -
Lead Meter Reader - - - - 1 -
Maintenance Supervisor - - - - 1 -
Meter Reader - - - - 1 -
Meter/InstallReprmn Journeyman - - - - 1 -
Principal Admin Officer - - - - 1 -
Senior Admin Officer - - - - 2 -
Treatment Supt W/W - - - - 1 -
Utility Division Director II - - - - 1 -
Positions as Budgeted Total - - - - 39 1
Anchorage Wastewater UtilityDivision Summary
(Dept ID # S7000)
ASU Customer Service
2013 Proposed Operating and Capital Budgets
AWWU - 56

Net Cost
Manageable Direct Cost 2,048,907 2,338,095 2,380,747 1.82%
Debt Service, Depreciation - - - -
Charges By Other Departments 63,718 67,705 62,580 <7.57%>
Net Cost Total 2,112,625 2,405,800 2,443,327 1.56%
Direct Cost by CategorySalaries and Benefits
1101 - Straight Time Labor 871,903 1,838,000 1,029,326 <44.00%>
1201 - Overtime - - 6,000 -
1301 - Leave/Holiday Accruals - - 112,266 -
1401 - Benefits 614,416 - 683,355 -
1501 - Allow Differentials/Premiums - - 3,800 -
1601 - Vacancy Factor - - (51,380) -
Salaries and Benefits Total 1,486,319 1,838,000 1,783,367 <2.97%>
Supplies 125,831 148,525 133,525 <10.10%>
Travel 2,133 5,700 5,750 0.88%
Contractual/Other Services 434,624 345,870 458,105 32.45%
Manageable Direct Cost Total 2,048,907 2,338,095 2,380,747 1.82%
Debt Service, Depreciation - - - -
Direct Cost Total 2,048,907 2,338,095 2,380,747 1.82%
Intra-Governmental ChargesCharges By Other Departments 63,718 67,705 62,580 <7.57%>
Anchorage Wastewater UtilityDivision Detail
(Dept ID # S7000)
ASU Customer Service
2012Revised
2013Proposed
2011Actuals
13 v 12% Chg
2013 Proposed Operating and Capital Budgets
AWWU - 57

2011Actuals
2012Revised
2013Proposed
13 v 12% Chg
Direct Cost by CategorySalaries and Benefits 339,358 406,000 336,397 <17.14%>
Supplies 6,805 10,575 10,075 <4.73%>
Travel 1,051 2,500 2,250 <10.00%>
Contractual/Other Services 27,309 15,480 22,785 47.19%
Manageable Direct Cost Total 374,523 434,555 371,507 <14.51%>
Debt Service, Depreciation - - -
Direct Cost Total 374,523 434,555 371,507 <14.51%>
Positions as Budgeted2011 Revised 2012 Revised 2013 Proposed
Full Time Part Time Full Time Part Time Full Time Part Time
Personnel Analyst III - - - - 1 -
Principal Office Associate - - - - 1 -
Senior Admin Officer - - - - 1 -
Treatment Supt W/W - - - - 1 -
Utility Division Director II - - - - 1 -
Positions as Budgeted Total - - - - 5 -
Anchorage Wastewater UtilityDivision Summary
(Dept ID # S6000)
ASU Employee Services
2013 Proposed Operating and Capital Budgets
AWWU - 58

Net Cost
Manageable Direct Cost 374,523 434,555 371,507 <14.51%>
Debt Service, Depreciation - - - -
Charges By Other Departments 99,118 110,645 104,990 <5.11%>
Net Cost Total 473,641 545,200 476,497 <12.60%>
Direct Cost by CategorySalaries and Benefits
1101 - Straight Time Labor 197,973 406,000 204,777 <49.56%>
1301 - Leave/Holiday Accruals - - 23,753 -
1401 - Benefits 141,385 - 117,536 -
1601 - Vacancy Factor - - (9,669) -
Salaries and Benefits Total 339,358 406,000 336,397 <17.14%>
Supplies 6,805 10,575 10,075 <4.73%>
Travel 1,051 2,500 2,250 <10.00%>
Contractual/Other Services 27,309 15,480 22,785 47.19%
Manageable Direct Cost Total 374,523 434,555 371,507 <14.51%>
Debt Service, Depreciation - - - -
Direct Cost Total 374,523 434,555 371,507 <14.51%>
Intra-Governmental ChargesCharges By Other Departments 99,118 110,645 104,990 <5.11%>
Anchorage Wastewater UtilityDivision Detail
(Dept ID # S6000)
ASU Employee Services
2012Revised
2013Proposed
2011Actuals
13 v 12% Chg
2013 Proposed Operating and Capital Budgets
AWWU - 59

2011Actuals
2012Revised
2013Proposed
13 v 12% Chg
Direct Cost by CategorySalaries and Benefits 978,516 1,402,200 1,435,262 2.36%
Supplies 22,411 28,565 26,020 <8.91%>
Travel 8,639 14,900 11,000 <26.17%>
Contractual/Other Services 154,737 76,435 219,320 186.94%
Manageable Direct Cost Total 1,164,303 1,522,100 1,691,602 11.14%
Debt Service, Depreciation - - -
Direct Cost Total 1,164,303 1,522,100 1,691,602 11.14%
Positions as Budgeted2011 Revised 2012 Revised 2013 Proposed
Full Time Part Time Full Time Part Time Full Time Part Time
Administrative Officer - - - - 2 -
Civil Engineer I - - - - 2 -
Civil Engineer II - - - - 8 -
Civil Engineer III - - - - 7 -
Civil Engineer IV - - - - 3 -
Engineering Technician III - - - - 9 -
Engineering Technician IV - - - - 1 -
GIS Technician II - - - - 1 -
GIS Technician III - - - - 1 -
Junior Admin Officer - - - - 1 -
Office Associate - - - - 1 -
Principal Admin Officer - - - - 1 -
Public Service Intern I - - - - - 5
Senior Admin Officer - - - - 1 -
Senior Staff Accountant - - - - 1 -
Utility Division Director II - - - - 1 -
Positions as Budgeted Total - - - - 40 5
Anchorage Wastewater UtilityDivision Summary
(Dept ID # S8000)
ASU Engineering
2013 Proposed Operating and Capital Budgets
AWWU - 60

Net Cost
Manageable Direct Cost 1,164,303 1,522,100 1,691,602 11.14%
Debt Service, Depreciation - - - -
Net Cost Total 1,164,303 1,522,100 1,691,602 11.14%
Direct Cost by CategorySalaries and Benefits
1101 - Straight Time Labor 548,255 1,402,200 708,282 <49.49%>
1201 - Overtime - - 8,500 -
1301 - Leave/Holiday Accruals - - 192,233 -
1401 - Benefits 430,261 - 564,428 -
1601 - Vacancy Factor - - (38,181) -
Salaries and Benefits Total 978,516 1,402,200 1,435,262 2.36%
Supplies 22,411 28,565 26,020 <8.91%>
Travel 8,639 14,900 11,000 <26.17%>
Contractual/Other Services 154,737 76,435 219,320 186.94%
Manageable Direct Cost Total 1,164,303 1,522,100 1,691,602 11.14%
Debt Service, Depreciation - - - -
Direct Cost Total 1,164,303 1,522,100 1,691,602 11.14%
Anchorage Wastewater UtilityDivision Detail
(Dept ID # S8000)
ASU Engineering
2012Revised
2013Proposed
2011Actuals
13 v 12% Chg
2013 Proposed Operating and Capital Budgets
AWWU - 61

2011Actuals
2012Revised
2013Proposed
13 v 12% Chg
Direct Cost by CategorySalaries and Benefits 1,296,544 1,386,200 1,396,913 0.77%
Supplies 16,057 20,970 18,550 <11.54%>
Travel 5,905 17,575 12,800 <27.17%>
Contractual/Other Services (958,121) (164,070) (297,580) 81.37%
Manageable Direct Cost Total 360,385 1,260,675 1,130,683 <10.31%>
Debt Service, Depreciation - - -
Direct Cost Total 360,385 1,260,675 1,130,683 <10.31%>
Positions as Budgeted2011 Revised 2012 Revised 2013 Proposed
Full Time Part Time Full Time Part Time Full Time Part Time
Accountant - - - - 2 -
Junior Accountant - - - - 1 -
Junior Admin Officer - - - - 3 -
Office Associate - - - - 1 -
Principal Accountant - - - - 2 -
Principal Admin Officer - - - - 2 -
Senior Accountant - - - - 1 -
Senior Admin Officer - - - - 3 -
Senior Staff Accountant - - - - 2 -
Utility Division Director II - - - - 1 -
Utility Management Assistant - - - - 3 -
Utility Tariff Analyst - - - - 1 -
Positions as Budgeted Total - - - - 22 -
Anchorage Wastewater UtilityDivision Summary
(Dept ID # S5000)
ASU Finance
2013 Proposed Operating and Capital Budgets
AWWU - 62
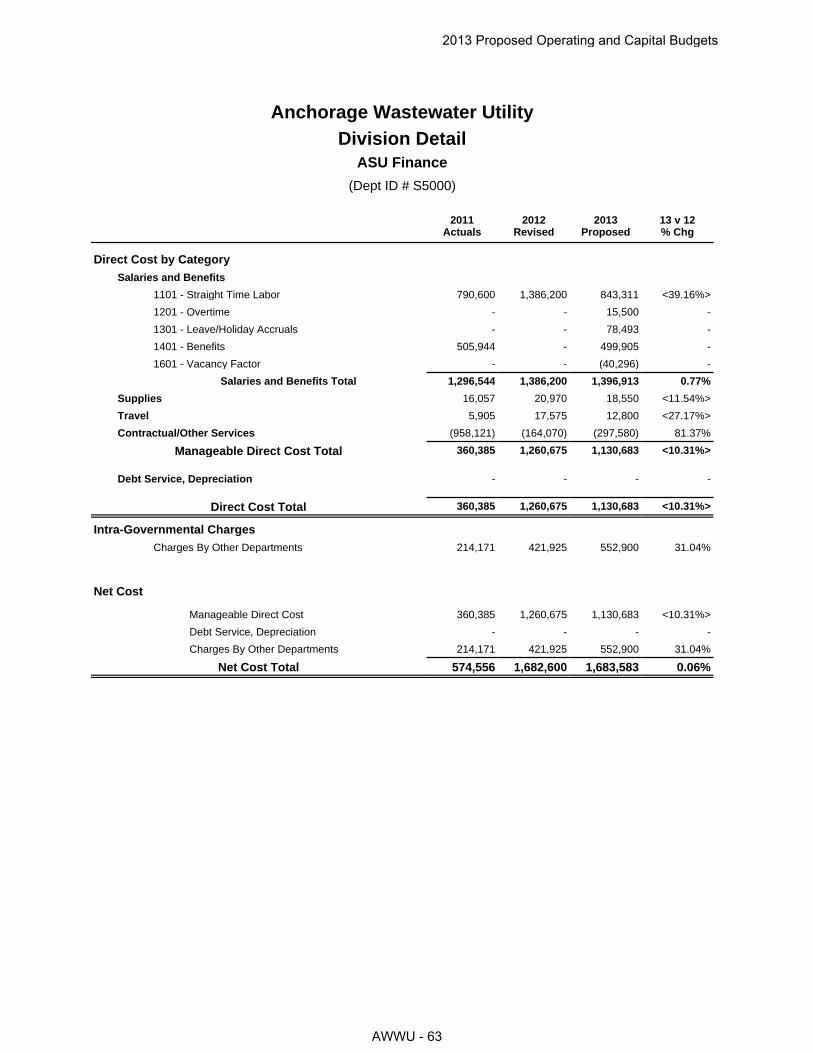
Net Cost
Manageable Direct Cost 360,385 1,260,675 1,130,683 <10.31%>
Debt Service, Depreciation - - - -
Charges By Other Departments 214,171 421,925 552,900 31.04%
Net Cost Total 574,556 1,682,600 1,683,583 0.06%
Direct Cost by CategorySalaries and Benefits
1101 - Straight Time Labor 790,600 1,386,200 843,311 <39.16%>
1201 - Overtime - - 15,500 -
1301 - Leave/Holiday Accruals - - 78,493 -
1401 - Benefits 505,944 - 499,905 -
1601 - Vacancy Factor - - (40,296) -
Salaries and Benefits Total 1,296,544 1,386,200 1,396,913 0.77%
Supplies 16,057 20,970 18,550 <11.54%>
Travel 5,905 17,575 12,800 <27.17%>
Contractual/Other Services (958,121) (164,070) (297,580) 81.37%
Manageable Direct Cost Total 360,385 1,260,675 1,130,683 <10.31%>
Debt Service, Depreciation - - - -
Direct Cost Total 360,385 1,260,675 1,130,683 <10.31%>
Intra-Governmental ChargesCharges By Other Departments 214,171 421,925 552,900 31.04%
Anchorage Wastewater UtilityDivision Detail
(Dept ID # S5000)
ASU Finance
2012Revised
2013Proposed
2011Actuals
13 v 12% Chg
2013 Proposed Operating and Capital Budgets
AWWU - 63

2011Actuals
2012Revised
2013Proposed
13 v 12% Chg
Direct Cost by CategorySalaries and Benefits 273,380 309,800 295,925 <4.48%>
Supplies 7,556 10,445 10,400 <0.43%>
Travel 6,143 26,025 6,450 <75.22%>
Contractual/Other Services 115,301 235,995 247,295 4.79%
Manageable Direct Cost Total 402,380 582,265 560,070 <3.81%>
Debt Service, Depreciation - - -
Direct Cost Total 402,380 582,265 560,070 <3.81%>
Positions as Budgeted2011 Revised 2012 Revised 2013 Proposed
Full Time Part Time Full Time Part Time Full Time Part Time
Administrative Officer - - - - 1 -
Assistant General Manager - - - - 1 -
General Manager - - - - 1 -
Senior Admin Officer - - - - 1 -
Positions as Budgeted Total - - - - 4 -
Anchorage Wastewater UtilityDivision Summary
(Dept ID # S1100)
ASU General Manager
2013 Proposed Operating and Capital Budgets
AWWU - 64

Net Cost
Manageable Direct Cost 402,380 582,265 560,070 <3.81%>
Debt Service, Depreciation - - - -
Charges By Other Departments 277,055 302,035 288,500 <4.48%>
Net Cost Total 679,435 884,300 848,570 <4.04%>
Direct Cost by CategorySalaries and Benefits
1101 - Straight Time Labor 172,930 309,800 184,815 <40.34%>
1301 - Leave/Holiday Accruals - - 19,368 -
1401 - Benefits 100,450 - 100,296 -
1601 - Vacancy Factor - - (8,553) -
Salaries and Benefits Total 273,380 309,800 295,925 <4.48%>
Supplies 7,556 10,445 10,400 <0.43%>
Travel 6,143 26,025 6,450 <75.22%>
Contractual/Other Services 115,301 235,995 247,295 4.79%
Manageable Direct Cost Total 402,380 582,265 560,070 <3.81%>
Debt Service, Depreciation - - - -
Direct Cost Total 402,380 582,265 560,070 <3.81%>
Intra-Governmental ChargesCharges By Other Departments 277,055 302,035 288,500 <4.48%>
Anchorage Wastewater UtilityDivision Detail
(Dept ID # S1100)
ASU General Manager
2012Revised
2013Proposed
2011Actuals
13 v 12% Chg
2013 Proposed Operating and Capital Budgets
AWWU - 65

2011Actuals
2012Revised
2013Proposed
13 v 12% Chg
Direct Cost by CategorySalaries and Benefits 1,180,438 1,242,500 1,324,134 6.57%
Supplies 344,518 127,745 161,455 26.39%
Travel 6,250 11,100 11,100 -
Contractual/Other Services 714,794 661,265 544,595 <17.64%>
Manageable Direct Cost Total 2,246,000 2,042,610 2,041,284 <0.06%>
Debt Service, Depreciation - - -
Direct Cost Total 2,246,000 2,042,610 2,041,284 <0.06%>
Positions as Budgeted2011 Revised 2012 Revised 2013 Proposed
Full Time Part Time Full Time Part Time Full Time Part Time
Administrative Officer - - - - 1 -
Application Services Supvr - - - - 2 -
Database Admin II - - - - 1 -
Database Admin Supervisor - - - - 1 -
Info Center Consultant II - - - - 1 -
Network Analyst - - - - 1 -
Systems Analyst - - - - 9 -
Technical Support Manager - - - - 1 -
Utility Division Director II - - - - 1 -
Positions as Budgeted Total - - - - 18 -
Anchorage Wastewater UtilityDivision Summary
(Dept ID # S2000)
ASU IT
2013 Proposed Operating and Capital Budgets
AWWU - 66

Net Cost
Manageable Direct Cost 2,246,000 2,042,610 2,041,284 <0.06%>
Debt Service, Depreciation - - - -
Charges By Other Departments 183,758 214,290 79,000 <63.13%>
Net Cost Total 2,429,758 2,256,900 2,120,284 <6.05%>
Direct Cost by CategorySalaries and Benefits
1101 - Straight Time Labor 742,000 1,242,500 818,862 <34.10%>
1201 - Overtime - - 7,500 -
1301 - Leave/Holiday Accruals - - 88,279 -
1401 - Benefits 438,438 - 447,484 -
1601 - Vacancy Factor - - (37,990) -
Salaries and Benefits Total 1,180,438 1,242,500 1,324,134 6.57%
Supplies 344,518 127,745 161,455 26.39%
Travel 6,250 11,100 11,100 -
Contractual/Other Services 714,794 661,265 544,595 <17.64%>
Manageable Direct Cost Total 2,246,000 2,042,610 2,041,284 <0.06%>
Debt Service, Depreciation - - - -
Direct Cost Total 2,246,000 2,042,610 2,041,284 <0.06%>
Intra-Governmental ChargesCharges By Other Departments 183,758 214,290 79,000 <63.13%>
Anchorage Wastewater UtilityDivision Detail
(Dept ID # S2000)
ASU IT
2012Revised
2013Proposed
2011Actuals
13 v 12% Chg
2013 Proposed Operating and Capital Budgets
AWWU - 67

2011Actuals
2012Revised
2013Proposed
13 v 12% Chg
Direct Cost by CategorySalaries and Benefits 4,140,205 5,116,100 4,818,076 <5.83%>
Supplies 1,020,483 960,000 960,000 -
Travel 5,964 9,350 6,000 <35.83%>
Contractual/Other Services 2,908,951 2,089,450 1,949,750 <6.69%>
Manageable Direct Cost Total 8,075,603 8,174,900 7,733,826 <5.40%>
Debt Service, Depreciation - - -
Direct Cost Total 8,075,603 8,174,900 7,733,826 <5.40%>
Positions as Budgeted2011 Revised 2012 Revised 2013 Proposed
Full Time Part Time Full Time Part Time Full Time Part Time
Assistant Parts Warehouseman - - - - 1 -
Engineering Technician III - - - - 1 -
Equipment Serviceman II - - - - 1 -
Expeditor - - - - 2 -
Heavy Equipment Opr Journeyman A - - - - 1 -
Heavy Equipment Opr Journeyman B - - - - 1 -
Journeyman Craftsman A - - - - 3 -
Journeyman Craftsman B - - - - 2 -
Journeyman Mechanic A - - - - 4 -
Journeyman Mechanic B - - - - 3 -
Journeyman Utilityman A - - - - 3 -
Journeyman Utilityman B - - - - 16 -
Junior Admin Officer - - - - 1 -
Maintenance Foreman B - - - - 9 -
Mechanic Foreman - - - - 1 -
Mechanic Leadman B - - - - 3 -
Office Associate - - - - 1 -
Principal Admin Officer - - - - 1 -
Treatment Instrument/System Foreman - - - - 2 -
Treatment Instrument/System Tech - - - - 12 -
Treatment Supt W/W - - - - 3 -
Utility Division Director II - - - - 1 -
Utility Management Assistant - - - - 1 -
Utilityman I - - - - - 1
Utilityman II - - - - 7 1
Utilityman III A - - - - 2 -
Utilityman III B - - - - 2 -
Warehouse Journeyman - - - - 1 -
Positions as Budgeted Total - - - - 85 2
Anchorage Wastewater UtilityDivision Summary
(Dept ID # S3000, S3100, S3600, S3640)
ASU Operations & Maintenance
2013 Proposed Operating and Capital Budgets
AWWU - 68
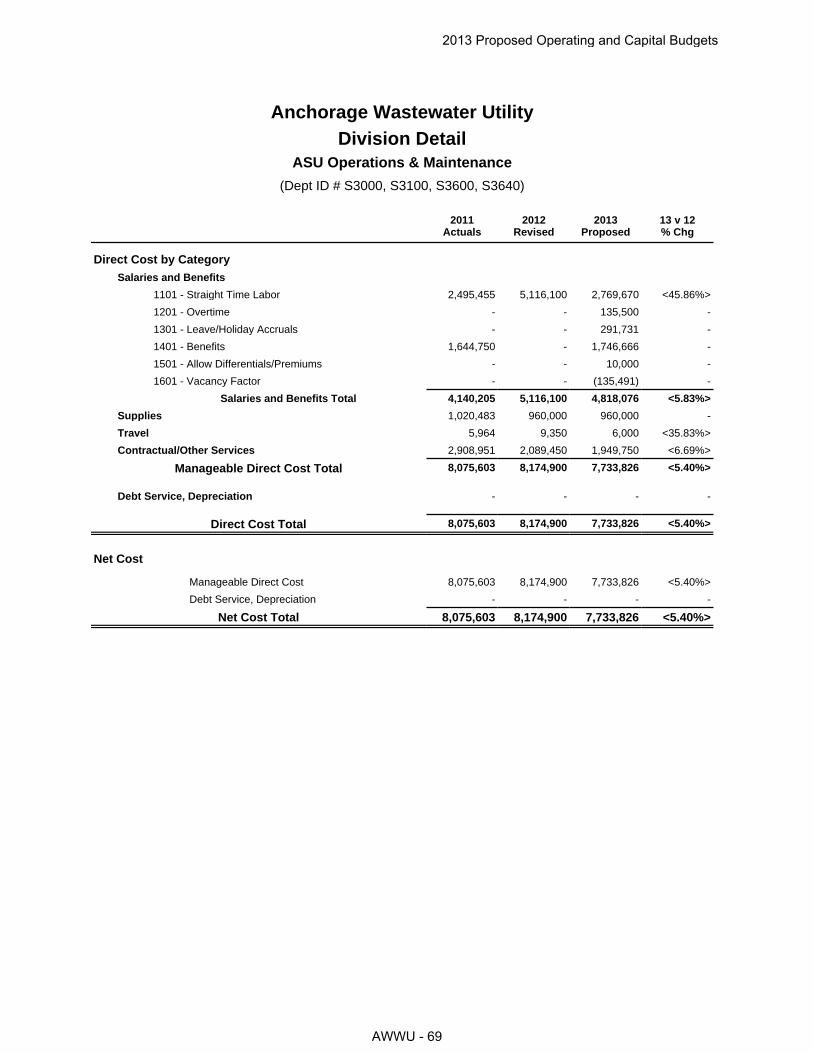
Net Cost
Manageable Direct Cost 8,075,603 8,174,900 7,733,826 <5.40%>
Debt Service, Depreciation - - - -
Net Cost Total 8,075,603 8,174,900 7,733,826 <5.40%>
Direct Cost by CategorySalaries and Benefits
1101 - Straight Time Labor 2,495,455 5,116,100 2,769,670 <45.86%>
1201 - Overtime - - 135,500 -
1301 - Leave/Holiday Accruals - - 291,731 -
1401 - Benefits 1,644,750 - 1,746,666 -
1501 - Allow Differentials/Premiums - - 10,000 -
1601 - Vacancy Factor - - (135,491) -
Salaries and Benefits Total 4,140,205 5,116,100 4,818,076 <5.83%>
Supplies 1,020,483 960,000 960,000 -
Travel 5,964 9,350 6,000 <35.83%>
Contractual/Other Services 2,908,951 2,089,450 1,949,750 <6.69%>
Manageable Direct Cost Total 8,075,603 8,174,900 7,733,826 <5.40%>
Debt Service, Depreciation - - - -
Direct Cost Total 8,075,603 8,174,900 7,733,826 <5.40%>
Anchorage Wastewater UtilityDivision Detail
(Dept ID # S3000, S3100, S3600, S3640)
ASU Operations & Maintenance
2012Revised
2013Proposed
2011Actuals
13 v 12% Chg
2013 Proposed Operating and Capital Budgets
AWWU - 69

2011Actuals
2012Revised
2013Proposed
13 v 12% Chg
Direct Cost by CategoryTravel - - -
Contractual/Other Services 5,254,668 5,500,000 5,370,000 <2.36%>
Manageable Direct Cost Total 5,254,668 5,500,000 5,370,000 <2.36%>
Debt Service, Depreciation 9,864,115 12,150,000 12,848,000 5.74%
Direct Cost Total 15,118,783 17,650,000 18,218,000 3.22%
Revenue by FundFund 550 - Sewer Utility 42,523,838 47,099,000 48,766,000 3.54%
Revenue Total 42,523,838 47,099,000 48,766,000 3.54%
No Positions
Anchorage Wastewater UtilityDivision Summary
(Dept ID # S11000)
ASU Revenues & Non Operating Expenses
2013 Proposed Operating and Capital Budgets
AWWU - 70

Net Cost
Manageable Direct Cost 5,254,668 5,500,000 5,370,000 <2.36%>
Debt Service, Depreciation 9,864,115 12,150,000 12,848,000 5.74%
Program Generated Revenue (42,523,838) (47,099,000) (48,766,000) 3.54%
Net Cost Total (27,405,055)
(29,449,000)
(30,548,000)
3.73%
Direct Cost by CategoryTravel - - - -
Contractual/Other Services 5,254,668 5,500,000 5,370,000 <2.36%>
Manageable Direct Cost Total 5,254,668 5,500,000 5,370,000 <2.36%>
Debt Service, Depreciation 9,864,115 12,150,000 12,848,000 5.74%
Direct Cost Total 15,118,783 17,650,000 18,218,000 3.22%
Program Generated Revenue9400 - Charges for Services 42,342,860 46,979,000 47,700,000 1.53%
9760 - Investment Revenues 162,308 120,000 30,000 <75.00%>
9798 - Miscellaneous Revenues 18,670 - 1,036,000 -
Program Generated Revenue Total 42,523,838 47,099,000 48,766,000 3.54%
Anchorage Wastewater UtilityDivision Detail
(Dept ID # S11000)
ASU Revenues & Non Operating Expenses
2012Revised
2013Proposed
2011Actuals
13 v 12% Chg
2013 Proposed Operating and Capital Budgets
AWWU - 71

2011Actuals
2012Revised
2013Proposed
13 v 12% Chg
Direct Cost by CategorySalaries and Benefits 4,309,782 4,974,700 4,797,126 <3.57%>
Supplies 1,260,520 1,184,475 1,194,475 0.84%
Travel 7,571 12,000 12,650 5.42%
Contractual/Other Services 2,394,817 4,150,825 3,994,130 <3.78%>
Manageable Direct Cost Total 7,972,690 10,322,000 9,998,381 <3.14%>
Debt Service, Depreciation - - -
Direct Cost Total 7,972,690 10,322,000 9,998,381 <3.14%>
Positions as Budgeted2011 Revised 2012 Revised 2013 Proposed
Full Time Part Time Full Time Part Time Full Time Part Time
Engineering Technician II - - - - 1 -
Junior Admin Officer - - - - 1 -
Laboratory Analyst I - - - - 3 -
Laboratory Analyst II - - - - 2 -
Laboratory Supervisor - - - - 1 -
Senior Office Associate - - - - 1 -
Treatment Plant Operator I - - - - 2 -
Treatment Plant Operator II - - - - 8 -
Treatment Plant Operator III - - - - 5 -
Treatment Plant Operator IV - - - - 7 -
Treatment Plant Ops Foreman - - - - 3 -
Treatment Supt W/W - - - - 3 -
Utility Director II - - - - 1 -
Utility Management Assistant - - - - 1 -
Positions as Budgeted Total - - - - 39 -
Anchorage Wastewater UtilityDivision Summary
(Dept ID # S4000, S4210, S4220, S4230)
ASU Treatment
2013 Proposed Operating and Capital Budgets
AWWU - 72

Net Cost
Manageable Direct Cost 7,972,690 10,322,000 9,998,381 <3.14%>
Debt Service, Depreciation - - - -
Net Cost Total 7,972,690 10,322,000 9,998,381 <3.14%>
Direct Cost by CategorySalaries and Benefits
1101 - Straight Time Labor 2,697,503 4,974,700 2,803,322 <43.65%>
1201 - Overtime - - 205,000 -
1301 - Leave/Holiday Accruals - - 211,990 -
1401 - Benefits 1,612,279 - 1,664,170 -
1501 - Allow Differentials/Premiums - - 45,300 -
1601 - Vacancy Factor - - (132,656) -
Salaries and Benefits Total 4,309,782 4,974,700 4,797,126 <3.57%>
Supplies 1,260,520 1,184,475 1,194,475 0.84%
Travel 7,571 12,000 12,650 5.42%
Contractual/Other Services 2,394,817 4,150,825 3,994,130 <3.78%>
Manageable Direct Cost Total 7,972,690 10,322,000 9,998,381 <3.14%>
Debt Service, Depreciation - - - -
Direct Cost Total 7,972,690 10,322,000 9,998,381 <3.14%>
Anchorage Wastewater UtilityDivision Detail
(Dept ID # S4000, S4210, S4220, S4230)
ASU Treatment
2012Revised
2013Proposed
2011Actuals
13 v 12% Chg
2013 Proposed Operating and Capital Budgets
AWWU - 73

Project Category 2013 2014 2015 2016 2017 2018 TotalEquipment 2,757 2,971 3,207 3,313 2,720 2,591 17,559 Plant 22,491 18,711 17,249 14,539 7,756 4,521 85,267 Pipe 6,615 10,181 12,889 16,348 24,674 28,888 99,595
Total 31,863 31,863 33,345 34,200 35,150 36,000 202,421
Funding Source 2013 2014 2015 2016 2017 2018 TotalDebt 22,863 20,863 27,345 29,200 29,150 28,000 157,421 State/Fed Grant 6,000 6,000 2,000 2,000 2,000 2,000 20,000 Equity/Operations 3,000 5,000 4,000 3,000 4,000 6,000 25,000
Total 31,863 31,863 33,345 34,200 35,150 36,000 202,421
2013 - 2018 Capital Improvement ProgramAnchorage Wastewater Utility
(in thousands)
2013 Proposed Operating and Capital Budgets
AWWU - 74

Project Title DebtState/Fed
GrantEquity/
Operations Total2013 Depreciation Study - - 120 120 Alaska Department Of Transportation-Municipality Of Anchorage-Emergency-SWR 1,340 - - 1,340 Alley, G-H Street and 4th and 5th Avenues Rehabilitation 496 - 304 800
Customer Service: Computer Information System (CIS) Enhancements 50 - 500 550 Customer Service: Locates Integration Tel-Dig 40 - - 40 Engineering Archives System-Swr 130 - - 130 Engineering Project Management Tools-SWR 155 - - 155 ER Excavator-SWR (96802) - - 325 325 Eagle River Wastewater Treatment Facility Blower Upgrade 500 - - 500 Facility Replace & Rehabilitate-Operations & Maintenance-SWR - - 270 270 Facility Replace & Rehabilitate-Treatment-SWR - - 488 488 Fish Creek Gravity Interceptor 2,100 - 400 2,500 Girdwood I & I - - 325 325 Girdwood Outfall 1,000 - - 1,000 Girdwood Wastewater Treatment Facility Upgrade & Replacement 13,479 6,000 - 19,479 Geographic Information System (GIS) Desktop Development 50 - - 50 Geographic Information System (GIS) Implementation 63 - - 63 Geographic Information System (GIS) Integration: Global Positioning System (GPS) Vehicle Tracking 45 - - 45 Hydraulic Model Support 38 - - 38 Information Technology (IT) Infrastructure 353 - - 353 Miscellaneous Information Technology (IT) Systems 495 - - 495 Plant Oversize Improvement-SWR 50 - - 50 Supervisory Control and Data Acquisition (SCADA) Equipment 634 - - 634 Vehicles-SWR - - 268 268 Water Quality Management: Environmental Compliance Monitoring Reporting 45 - - 45 Work Management Systems 200 - - 200 Wonder Park Swr Phase II 1,600 - - 1,600
Total 22,863 6,000 3,000 31,863
2013 Capital Improvement BudgetAnchorage Wastewater Utility
(in thousands)
2013 Proposed Operating and Capital Budgets
AWWU - 75

2011 2012 2013
Actual Proforma Budget
Sources of Cash FundsOperating Income 12,653,684 12,219,460 13,730,700
Depreciation, net of amortization 6,153,527 7,250,000 7,968,000
Transfer from Escrow Account 1,619,691 - -
Grant Proceeds 1,064,506 1,000,000 5,000,000
Special Assessment Proceeds 344,946 300,000 300,000
State of Alaska Loan Proceeds 3,895,599 5,000,000 5,000,000
Interfund Loan from Water Utility 6,445,734 21,512,000 (27,957,734)
Bond/Commercial Paper Proceeds - - 41,000,000
Miscellaneous Non-Operating Revenues 18,670 15,000 15,000
Interest Received 195,692 45,000 30,000
Changes in Assets and Liabilities (1,007,852) (589,858) 496,234
Total Sources of Cash Funds 31,384,197 46,751,602 45,582,200
Uses of Cash FundsCapital Construction 16,686,462 31,012,650 16,672,200
Debt Principal Payment 5,357,646 5,548,073 5,585,000
Debt Interest Payments 4,185,777 4,195,475 4,678,000
MUSA 5,254,668 5,342,400 5,370,000
Total Uses of Cash Funds 31,484,553 46,098,598 32,305,200
Net Increase (Decrease) in Cash Funds (100,356) 653,004 13,277,000
Cash Balance, January 1 9,496,352 9,395,996 10,049,000
Cash Balance, December 31 9,395,996 10,049,000 23,326,000
Detail of Cash and Investment FundsGeneral Cash Less Customer Deposits 9,009,753 9,699,000 12,607,000
Construction Cash - - 10,369,000
Operating Fund Investment & Customer Deposits 386,243 350,000 350,000
Cash Balance, December 31 9,395,996 10,049,000 23,326,000
Anchorage Wastewater UtilityStatement of Cash Sources and Uses
2013 Proposed Operating and Capital Budgets
AWWU - 76

About Anchorage Water and Wastewater Anchorage Water Utility History From the first intake of water at Lower Ship Creek, and a few miles of woodstave water lines downtown more than 75 years ago, Anchorage's public water utility has grown into an enterprise with a net plant in service of approximately $497 million that delivers nearly 27 million gallons of water to customers each day, for a little more than $1.40 per household per day. The original water system for Anchorage was installed by the Alaska Railroad in 1917. In 1921, the City purchased the water system and associated water rights from the Alaska Engineering Commission. As the City expanded by annexation, the water system was extended into new areas and independent water systems previously serving the annexed areas were acquired by the City. The entire service area is now governed by the Municipality of Anchorage as a result of unification of the City of Anchorage and the Greater Anchorage Area Borough (GAAB) on September 15, 1975. Anchorage Wastewater Utility History The Alaska Engineering Commission first installed sewers in downtown Anchorage in 1916 along the lower bluff near the Alaska Railroad Depot. As Anchorage grew, construction of sewers continued and by the end of World War II, sewers were available to much of the area between Ship Creek and Chester Creek, west of Cordova Street. GAAB was created in 1964, and was granted area wide sewer authority. The last major private sewer utility was acquired by the GAAB in 1972. The Utility is now owned and governed by the Municipality of Anchorage as a result of unification of the City of Anchorage and the GAAB on September 15, 1975. Anchorage’s public wastewater utility has grown into an enterprise with a net plant in service of approximately $345 million. Service Anchorage's enjoyment of drinking water is just one part of the AWWU system. After the day's water is used, it must be treated before it is returned to the environment. The creeks and inlets downstream from Anchorage's wastewater treatment facilities are not adversely impacted by treated effluent, which is AWWU’s principal measure of success. The Anchorage community benefits from the superior operation of the three wastewater treatment plants that serve its growing population. Governance Effective in November 2011 the Utility changed from a Board-governed utility to a municipal department. The Board of Directors for the Utility was retained by the new legislation, as codified in Anchorage Municipal Code section 4.80.020. The Board is appointed by the Mayor to staggered 3-year terms, with nominees subject to Assembly approval. The Board by code makes recommendations to the Mayor, establishes procedures for customer complaints, and recommends changes in code to the Assembly that the Board deems necessary or desirable for the efficient operation of the Utility or for the benefit of its customers. The authority for operation and management of the Utility is under the control of the Mayor. The current Board members are very experienced professionals in the fields of law, accounting, and public health. As of September 2012, no appointment has been made for the board seat representing engineering expertise. Regular meetings are held monthly and are open to the public. Board meetings focus on Utility operations and highlights. Economic Regulation and Accounting Since 1970, both the Anchorage Water Utility (AWU) and the Anchorage Wastewater Utility (ASU) have been regulated by the Alaska Public Utilities Commission (APUC), which was renamed the Regulatory Commission of Alaska (RCA) on July 1, 1999. AWU and ASU each hold a Certificate
2013 Proposed Operating and Capital Budgets
AWWU - 77

of Public Convenience and Necessity for serving portions of the Anchorage Bowl, Eagle River and Girdwood. This commission must approve all rates and tariffs prior to implementation. They also regulate service areas and service quality. The RCA is composed of five members appointed to six-year staggered terms by the Governor of the State of Alaska and confirmed by the State Legislature. AWWU is an Enterprise Fund. Enterprise Funds are used to account for operations where the intent is that costs of providing services to the general public on a continuing basis be financed or recovered primarily through user charges or where the governing body has decided that periodic determination of revenues earned, expenses incurred, and/or change in net assets is appropriate for capital maintenance, public policy, management control, accountability or other purposes. AWWU applies all applicable provisions of the Governmental Accounting Standards Board (GASB) which has authority for setting accounting standards for governmental entities. The accounting records of the Utility conform to the Uniform System of Accounts prescribed by the National Association of Regulatory Utility Commissioners (NARUC). The accrual basis of accounting is used for Enterprise Funds. Revenues are recognized in the accounting period in which they are earned and become measurable. Expenses are recognized in the period incurred, if measurable. Environmental Regulation AWU’s activities are dictated by a wide variety of environmental regulations administered by the EPA and the ADEC. Potable water produced by AWU must comply with the regulations promulgated under the Safe Drinking Water Act (SDWA). The SDWA is the main federal law governing the quality of drinking water in the United States. The ADEC has authority (primacy) to administer the SDWA regulations for the EPA. The SDWA sets standards for the chemical and microbial quality of drinking water and establishes requirements for informing the public. ASU’s activities are also dictated by a wide variety of environmental regulations administered by the EPA and the ADEC. All wastewater discharges must comply with the regulations promulgated under the Clean Water Act (CWA). The CWA is the main federal law governing discharges into the waters of the United States. The CWA requires that each treatment facility have a unique National Pollution Discharge Elimination Systems (NPDES) permit that specifies the discharge limits from each facility for a wide variety of chemical and biological constituents. The ADEC has authority (primacy) to issue and administer the NPDES permits for ASU’s Eagle River and Girdwood WWTF’s. Authority to issue and administer the 301(h) permit for the Asplund WWTF has been retained by EPA, due to the special conditions of this discharge as outlined in section 301(h) of the CWA. In addition to the SDWA and CWA laws, ASU’s sewage sludge incinerator must also comply with the provisions specified in Title V of the Clean Air Act (CAA). ADEC has primacy for the CAA and administers the permit for EPA. Failure to comply with the regulations promulgated under the SDWA, CWA and CAA can result in fines and/or compliance orders and criminal charges. Physical Plant The John M. Asplund Wastewater Treatment Facility is one of the few facilities in the nation operating as a primary treatment facility under Section 301(h) of the Clean Water Act. The primary treatment provided by this facility removes up to 45% of the BOD and 80% of the solids from the influent wastewater meeting the criteria necessary for discharge to the marine waters of Cook Inlet. The smaller Eagle River and Girdwood Wastewater Treatment facilities provide advanced secondary treatment prior to discharge to Eagle River and Glacier Creek respectively. These facilities remove up to 99% of the pollutants from the incoming wastewater prior to discharge.
2013 Proposed Operating and Capital Budgets
AWWU - 78

In 2008, the Asplund Wastewater Treatment Facility treated an average of 29.2 million gallons per day (mgd). The Eagle River Wastewater Treatment Facility treated an average 1.5 mgd and the Girdwood Wastewater Treatment Facility treated 0.5 mgd. The three facilities have a design capacity of 61.1 mgd. The collection system has approximately 750 miles of pipes. The Asplund Facility, built in 1972, is Alaska's largest wastewater treatment plant. As wastewater treatment technology and the demands of community growth have developed over the last two decades, utility operators and engineers have kept pace. The Asplund plant was upgraded in 1982, and expanded and upgraded again in 1989. In conjunction with the permit renewal process, a facilities plan update was prepared in 1999. The facilities plan evaluated the existing condition of the Asplund facility and identified improvements necessary to meet the future needs of the community. The facilities plan identified a cumulative $40 million worth of improvements to the solids handling, headworks, administration, laboratory, incineration, and thickening processes and control and power systems. Construction of new solids handling improvements including sludge dewatering, storage and load out facilities was completed in 2001. Design of headworks improvements began in September 2002. Construction was completed in 2005. Other process and building improvements were undertaken circa 2006 which extend the life of the sludge incinerator and other treatment process equipment, as well as the building and laboratory facilities. Control and power systems upgrades were completed in 2010. These projects, along with careful operation, have made Asplund a modern, state of the art treatment facility.
2013 Proposed Operating and Capital Budgets
AWWU - 79