Analyzing the Flow Field in the Oil Chamber of a ...
17
Analyzing the Flow Field in the Oil Chamber of a Hydrostatic Guide Rail Used for Ultra-Precision Machining: Numerical Simulation and Performance Optimization Youxin Li * Department of Mechanical and Electrical Engineering, QingHai Higher Vocational & Technical Institute, Haidong, 810799, China Corresponding Author: Youxin Li. Email: [email protected] Received: 14 December 2019; Accepted: 24 August 2020 Abstract: In order to explore the impact of different structural design parameters and environmental factors on the performance of the hydrostatic guide rail, the flow field inside its oil chamber is simulated, which provides direction and gui- dance for the design and optimization of the guide rail system. Based on the the- ory of fluid lubrication and the Reynolds equation, numerical simulations are performed through a mathematical model. The results suggest that the bearing capacity of the oil film increases with the oil supply pressure. The film thickness and the film stiffness share a positive correlation. Different oil film thickness and different input pressure parameters can have a significant impact on bearing capa- city and oil film stiffness. The correlations identified in the present analysis can be used as a basis to optimize the guide rail design. Keywords: Guide rail oil chamber; simulation; hydrostatic pressure; guide rail performance 1 Introduction In recent years, with the rapid development of modern industry and high-tech technology, ultra-precision machining technology has become an essential direction of the equipment manufacturing industry [1]. The ultra-precision machining technology and micro nanomachine tools are researched and developed in combination with the significant developing needs of the manufacturing industry at this stage, aiming to achieve industrialization by developing critical components and equipment prototype with independent intellectual property rights [2]. The Micro-nano machine tool is the general term of machine tools for micro-nano-ultra precision machining, which represents the highest level of industrial technology in a nation. It is an essential cornerstone of the high-end manufacturing industry, determines the core competitiveness of a nation’ s overall manufacturing industry, and directly affects the national economy and people’ s livelihood [3]. The performance of the micro-nano-ultra precision machine tool mainly depends on the performance of its key components. As a crucial component of the machine tool system, the guide rails can directly affect the position and motion accuracy of the moving components of the machine tool [4]. The hydrostatic guide rail is common in micro-nano-ultra precision machine tools due to its advantages of high rigidity, high precision, This work is licensed under a Creative Commons Attribution 4.0 International License, which permits unrestricted use, distribution, and reproduction in any medium, provided the original work is properly cited. Fluid Dynamics & Materials Processing DOI:10.32604/fdmp.2020.09437 Article ech T Press Science
Transcript of Analyzing the Flow Field in the Oil Chamber of a ...

Analyzing the Flow Field in the Oil Chamber of a Hydrostatic Guide Rail Usedfor Ultra-Precision Machining: Numerical Simulation and Performance
Optimization
Youxin Li*
Department of Mechanical and Electrical Engineering, QingHai Higher Vocational & Technical Institute, Haidong, 810799, China�Corresponding Author: Youxin Li. Email: [email protected]: 14 December 2019; Accepted: 24 August 2020
Abstract: In order to explore the impact of different structural design parametersand environmental factors on the performance of the hydrostatic guide rail, theflow field inside its oil chamber is simulated, which provides direction and gui-dance for the design and optimization of the guide rail system. Based on the the-ory of fluid lubrication and the Reynolds equation, numerical simulations areperformed through a mathematical model. The results suggest that the bearingcapacity of the oil film increases with the oil supply pressure. The film thicknessand the film stiffness share a positive correlation. Different oil film thickness anddifferent input pressure parameters can have a significant impact on bearing capa-city and oil film stiffness. The correlations identified in the present analysis can beused as a basis to optimize the guide rail design.
Keywords: Guide rail oil chamber; simulation; hydrostatic pressure; guide railperformance
1 Introduction
In recent years, with the rapid development of modern industry and high-tech technology, ultra-precisionmachining technology has become an essential direction of the equipment manufacturing industry [1]. Theultra-precision machining technology and micro nanomachine tools are researched and developed incombination with the significant developing needs of the manufacturing industry at this stage, aiming toachieve industrialization by developing critical components and equipment prototype with independentintellectual property rights [2]. The Micro-nano machine tool is the general term of machine tools formicro-nano-ultra precision machining, which represents the highest level of industrial technology in anation. It is an essential cornerstone of the high-end manufacturing industry, determines the corecompetitiveness of a nation’s overall manufacturing industry, and directly affects the national economyand people’s livelihood [3].
The performance of the micro-nano-ultra precision machine tool mainly depends on the performance ofits key components. As a crucial component of the machine tool system, the guide rails can directly affect theposition and motion accuracy of the moving components of the machine tool [4]. The hydrostatic guide rail iscommon in micro-nano-ultra precision machine tools due to its advantages of high rigidity, high precision,
This work is licensed under a Creative Commons Attribution 4.0 International License, whichpermits unrestricted use, distribution, and reproduction in any medium, provided the originalwork is properly cited.
Fluid Dynamics & Materials ProcessingDOI:10.32604/fdmp.2020.09437
Article
echT PressScience
low wear, and long service life. The design of hydrostatic guide rail shall meet the requirements of highspeed, high efficiency, and high precision. On the one hand, the guide rail must have enough staticstiffness and excellent dynamic characteristics [5]; on the other hand, the oil film between guide railsshall have excellent oil film rigidity and bearing capacity [6]. Research on hydrostatic guide railtechnology starts later in China, but it develops rapidly. Notably, of late years, with the joint efforts ofuniversities, research institutes, and factories, the hydrostatic guide rail technology has made significantprogress, and its application scope has been rapidly expanded to the manufacturing industry, civil andmilitary equipment [7]. Hydrostatic guide rail technology has the advantages of excellent earthquakeresistance, fast linear running speed, and significant stiffness, which can solve the creeping problemcaused by the heavyweight of the transmission component in heavy machine tools. In China, hydrostaticguide rail has been applied in various numerical control machines. For example, the forming geargrinding machine, computer numerical control (CNC) gantry key milling machine, and the cutting linedouble-side shearing equipment in the leading equipment of China Baosteel’s full and heavy plate alladopt the hydrostatic guide rail technology on the main guide rail movement [8]. At present, in thetheoretical research on hydrostatic guide rail technology, many Chinese researchers use the finite elementmethod to study and analyze the oil film between the guide rail, as well as the dynamic and staticperformances of the guide rail. Also, research on solving the calculation model and method of bearingcapacity and stiffness of oil film is done, and some fruitful results are achieved.
In order to provide reference and guidance for the optimization design of hydrostatic guide rail, theimpact on the performance of hydrostatic guide rail is analyzed by simulating the internal flow field ofthe guide rail oil chamber. Based on the theory of fluid lubrication and Reynolds equation, a 3Dmathematical model of the oil film is established through the finite element method of fluid dynamics.This model is based on the assumption of conditions and the calculation of specific values. Through thecalculation, the distribution of the static pressure of the oil film between the guide rails, as well as thedistribution law of the flow velocity of the hydraulic oil flow field, can be clarified. The flow field insidethe guide oil chamber is simulated. The simulation results are compared with the theoretical calculationresults of the traditional equations. Then, the impacts of different oil film thickness and different inputpressure parameters of oil inlet on the performance of guide rail are discussed, and the specific rulesbetween them are analyzed. For example, in oil films, the higher its thickness is, the smaller its bearingcapacity. Besides, its bearing capacity will increase with the increase in oil supply pressure. Simulationexperiments reveal how parameters affect the performance of guide rail. The results can direct theoptimization of guide rail design, which is of considerable significance to improve the stability andrigidity of the guide rails.
2 Method
2.1 Text LayoutThe hydrostatic guide rail uses the special oil supply equipment to deliver the lubricating oil with an
absolute pressure to the hydrostatic oil cavity between two relative moving guide rails, thus forming alubricating oil layer with absolute pressure between the guide rails. Moreover, the pressure differencebetween the upper and lower hydrostatic oil cavities can balance the external load on the hydrostaticguide rail. The positioning platform system of the X-axis static pressure guide of the five-axis free surfaceNC machine is taken as the research object, and the static pressure guide system is designed andcalculated. According to the fluid lubrication theory and the Reynolds equation, the oil film in therectangular oil cavity of the guide rail is analyzed through the finite element method. Meanwhile, the oilfilm of the guide rail is calculated and simulated by the finite element software FLUENT to obtain theoil-film pressure distribution and oil velocity distribution of the hydrostatic guide rails. According to thetheory of fluid lubrication and Reynolds equation, first, the mathematical model of the hydrostatic guide
1130 FDMP, 2020, vol.16, no.6

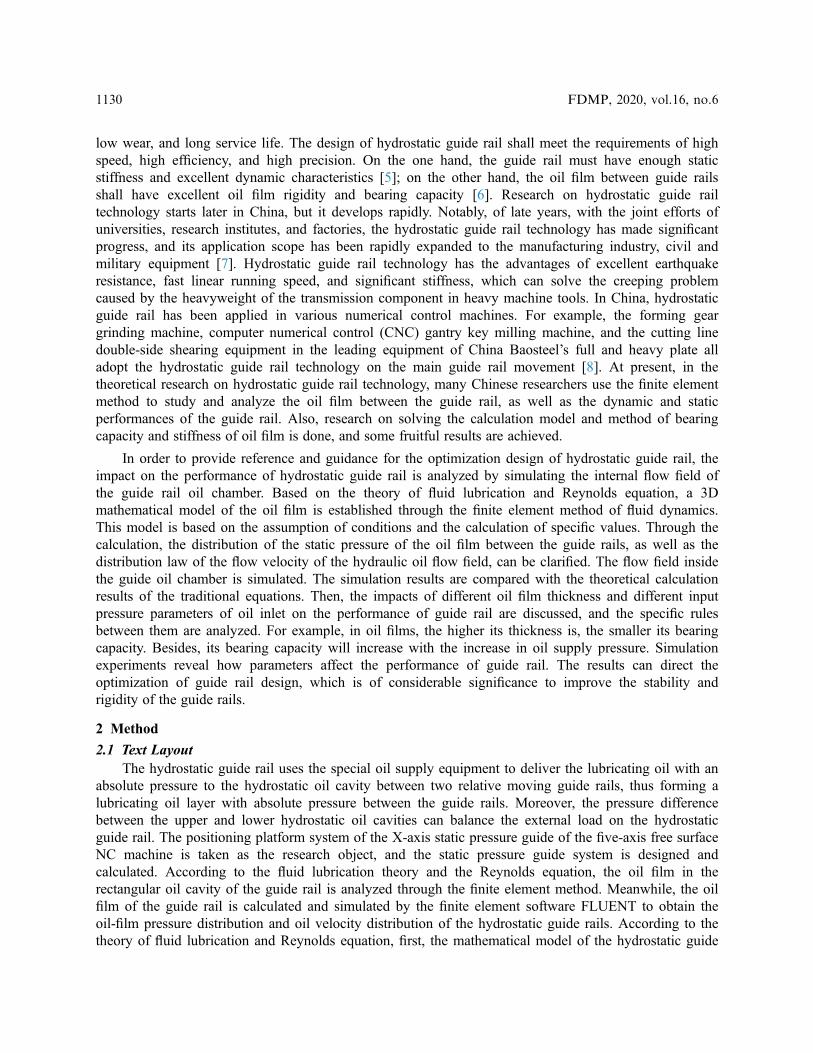
rail is established. The flow of hydrostatic guide rail hydraulic oil can be regarded as the flow of plate gap.The flow diagram of the plate gap is shown in Fig. 1 below, where 1 is a static block, and 2 is a moving block.According to this flow pattern, the Hagen-P0siseuille equation between the oil pads of the hydrostatic guiderail can be calculated. L is the length of two parallel plates, and the unit is m; b is the width, and the unit is m;h is the height of the gap, and the unit is m, that is, the thickness of the oil film. When the thickness of the oilfilm is far less than the width, the flow along the width direction can be ignored. The flow is due to thepressure difference between P1 and P0 because there is no relative motion between the two plates.
A numerical method based on ANSYS Workbench is proposed. First, the Geometry module is used tobuild the geometry model of the fluid domain, and the Meshing module is used to divide the fluid domainmesh and define the boundary conditions. Through the FLUENTmodule, the flow field is analyzed. Also, thepressure distribution of the oil film surface in the pressure cavity, the throttle hole, and the micro clearance isobtained. The bearing capacity of the oil film is obtained through integration, and the stiffness of thehydrostatic guide rail is calculated by the method of digit by digit. The impacts of oil supply pressure,orifice diameter, and oil film clearance on the stiffness characteristics and bearing capacity aresummarized. The optimum working range of oil film clearance is determined. The pressure distribution ofthe oil film surface in the fluid domain is coupled to the moving slide in the solid domain. The staticcharacteristics of the moving slide under the flow field pressure and external load are obtained throughthe fluid-solid coupling analysis. Thus, the strength check of the static pressure guide is completed.
First, the flow in the hydrostatic guide rail is modeled by mathematics and calculated by numericalmethod. If the flow in the guide rail can be regarded as a 3D steady and incompressible flow, theReynolds number Re is calculated. Reynolds number is a dimensionless number that can be used todescribe the flow of fluid. Re = ρvd/μ, where v, ρ, and μ are the velocity, density, and viscositycoefficient of the fluid, respectively, and d is a characteristic length. For example, if the fluid flowsthrough a circular pipe, d is the equivalent diameter of the pipe. Reynolds number can be used todistinguish whether the flow of fluid is laminar or turbulent, and also to determine the resistance of theflow of objects in the fluid [9]. The coordinate system indicates that the hydraulic oil and its boundary arestatic; hence, its speed is zero. For steady flow, the relative velocity is adopted. If the operatingenvironment is under standard atmospheric pressure, the continuity equation and momentum conservationequation can be derived as Eqs. (1)–(3):
L
P1 P0V
1
2
W
Figure 1: Plate gap flow diagram
FDMP, 2020, vol.16, no.6 1131
fx � 1
q@p
@xþ tr2u ¼ du
dt¼ @u
@tþ u
@u
@xþ v
@u
@yþ w
@u
@z(1)
fy � 1
q@p
@yþ tr2v ¼ dv
dt¼ @v
@tþ u
@v
@xþ v
@v
@yþ w
@v
@z(2)
fz � 1
q@p
@yþ tr2w ¼ dw
dt¼ @w
@tþ u
@w
@xþ v
@w
@yþ w
@w
@z(3)
In (1–3), v represents the kinematic viscosity of hydraulic oil; u, v, and w respectively represent thevelocity components of velocity vector in different directions, i.e., the x, y, and z directions; f is the massforce; p is the pressure, and d is the density. If fx, fy, u, and w are zero, the simplified N–S equation canbe obtained as Eqs. (4)–(6):
� 1
q@p
@x¼ 0
1
2(4)
� 1
q@p
@yþ t
@2t@z2
¼ 0 (5)
� 1
q@p
@z¼ 0 (6)
The above equations are analyzed and resolved. According to the boundary conditions of z = 0 and z = h,the velocity equation in the Y-direction can be deduced as Eq. (7):
t ¼ Dp
2ul� z2 þ Dp
2ul� hz (7)
Furthermore, the volume flow of the plate gap can be calculated by Eq. (8).
Qs ¼ZA
tðzÞdA ¼ b
Z h
0tðzÞdz ¼ Dph3b
12ul(8)
Through the above Eq. (8), the pressure Eq. (9) of the entire oil film surface can be obtained as follows:
W0 ¼ZA
ðp1 � p0ÞdA (9)
Dh means the increment increases to the oil film thickness. According to the above equation, thecorresponding bearing capacity can be calculated and expressed with W2. The static stiffness equation ofhydrostatic guide rail at h = h1 can be deduced as Eq. (10):
k0 ¼ W1 �W2
h1 � h2(10)
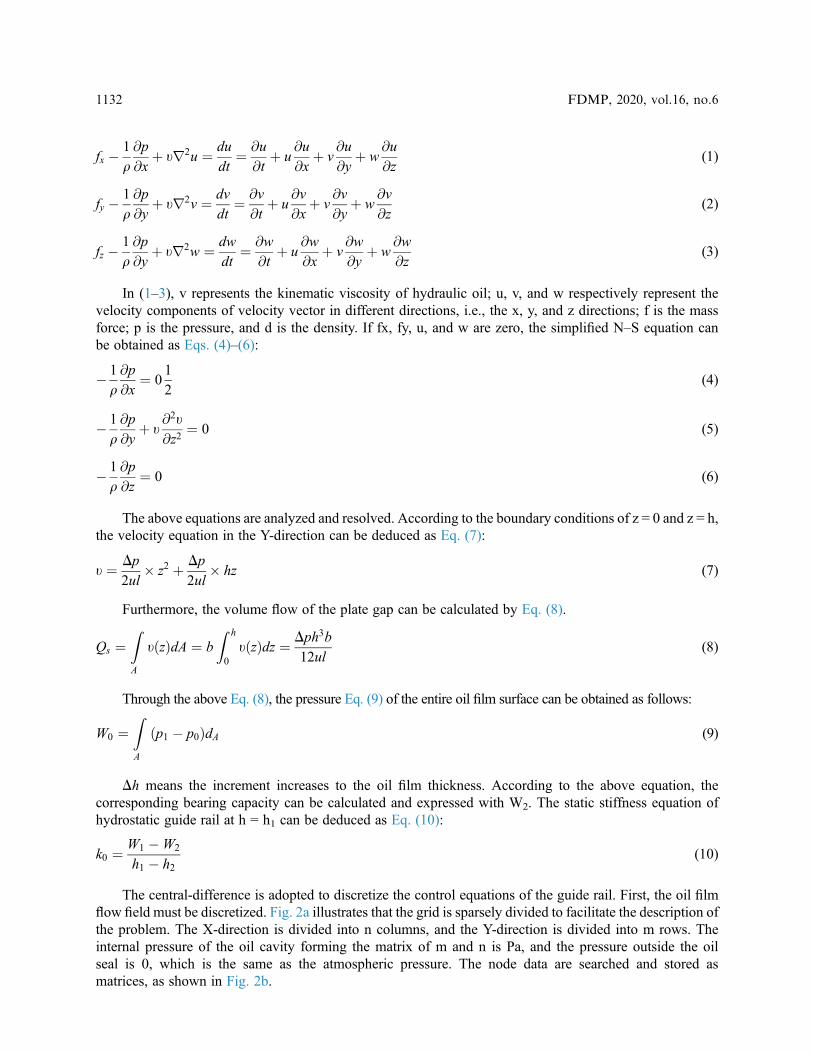
The central-difference is adopted to discretize the control equations of the guide rail. First, the oil filmflow field must be discretized. Fig. 2a illustrates that the grid is sparsely divided to facilitate the description ofthe problem. The X-direction is divided into n columns, and the Y-direction is divided into m rows. Theinternal pressure of the oil cavity forming the matrix of m and n is Pa, and the pressure outside the oilseal is 0, which is the same as the atmospheric pressure. The node data are searched and stored asmatrices, as shown in Fig. 2b.
1132 FDMP, 2020, vol.16, no.6
The control equation of the oil seal in the flow field is obtained through the Reynolds equation. It is anelliptical second-order partial differential equation. There are many ways to solve this equation. The finitedifference method is easy to program due to its simple format, while the central-difference scheme hastwo order accuracy; hence, they are widely used. The central finite difference discretizes the oil filmcontrol equation, and the finite difference mathematical expression is shown in Eq. (7). Thedimensionless processing of (7) can obtain the following equation:
@
@x� h3
@p
@x
� �þ @
@yh3
@p
@y
� �¼ 0 (11)
The following equation can be obtained by expanding (11):
@h3
@x� @p@x
þ h3 � @2p
@x2þ @h3
@y� @p@y
þ h3 � @2p
@x2¼ 0 (12)
According to the central-difference scheme, the first-order and second-order partial derivatives inEq. (12) are discretized on the grid nodes, and the following equations can be obtained:
@h3
@x
!i;j
¼ h3i;jþ1 � h3i;j�1
2 � Dx (13)
@h3
@y
!i;j
¼ h3i;jþ1 � h3i;j�1
2 � Dy (14)
@p
@x
� �i;j
¼ pi;jþ1 � pi;j�1
2 � Dx (15)
@p
@y
� �i;j
¼ piþ1;j � pi�1;j
2 � Dy (16)
@2p
@y2
� �i;j
¼ piþ1;j � 2pi;j þ pi�1;j
Dyð Þ2 (17)
The obtained discrete Eqs. (13)–(17) are brought into (12), and the following equations can be obtained:
n
m
1
x
y
(a)
x
y
(i,j)
(b)
Figure 2: Finite difference discrete grid of a rectangular oil film. a) Discrete grid. b) Node data search
FDMP, 2020, vol.16, no.6 1133

ai;j �pi;jþ1 � pi;j�1
2 � Dx þ hi;j �pi;jþ1 � 2pi;j þ pi;j�1
Dxð Þ2 þ bi;j �piþ1;j � pi�1;j
2 � Dy þ hi;j �pi;jþ1 � 2pi;j þ pi�1;j
Dyð Þ2 ¼ 0 (18)
ai;j ¼ @h3
@x
!i;j
(19)
bi;j ¼ @h3
@y
!i;j
(20)
Further arranging the above equations:
Ai;j � pi�1;j þ Bi;j � piþ1;j þ Ci;j � pi;j þ Di;j � pi;j�1 þ Ei;j � pi;jþ1 ¼ 0 (21)
The parameters are respectively represented as:
Ai;j ¼ h3i;j
Dyð Þ2 �bi;j
2 � Dy (22)
Bi;j ¼ h3i;j
Dyð Þ2 þbi;j
2 � Dy (23)
Ci;j ¼ �2 � h3i;jDxð Þ2 þ�2 � h3i;j
Dyð Þ2 (24)
Di;j ¼ h3i;j
Dxð Þ2 �ai;j
2 � Dx (25)
Ei;j ¼ h3i;j
Dxð Þ2 þai;j
2 � Dx (26)
The algebraic equations of Eq. (21) are solved. After the pressure of the flow field is initialized, and theboundary conditions and geometric parameters are brought into the equations; thus, the entire pressure fieldcan be calculated, thereby the bearing capacity of a single oil film.
2.2 Numerical Calculation of Oil Film2.2.1 Condition Assumption
FLUENT software is used to calculate and analyze the convection field. Before the mathematicalmodeling and numerical calculation of the internal fluid in hydrostatic guide rail, several assumptionsneed to be determined. First, the pressure in different parts of the guide rail oil chamber is the same.Second, there is no relative sliding correlation between lubricating oil and solid. Third, the inertial forcecannot be calculated. Fourth, the boundary pressure value of the guide oil film is zero. Fifth, whilecalculating the lubricating oil inside the guide rail, the Reynolds number is not more than 2,300.Afterward, the laminar flow model is used to calculate the internal flow field in the oil chamber. Sixth,the thermal deformation of the worktable and the base will not be considered.
1134 FDMP, 2020, vol.16, no.6
2.2.2 Generate GridThe upper and lower oil chambers are relative so that only one of them is analyzed. The structure of the
oil cavity is simple; thus, the application of a structured network can be constructed into a high-quality grid.The Integrated Computer Engineering and Manufacturing code for Computational Fluid Dynamics (ICEMCFD) is a professional CAE pre-processing software, which has strong CADmodel repairability, grid editingtechnology, automatic midplane extraction, and rich geometry interface [10]. The core idea of the gridgeneration is topology. The quality of the block strategy determines the quality and speed of the gridgeneration. Here, the ICEM CFD software is used to complete grid optimization. In ProE, a robust 3Dmodel of hydrostatic pressure is generated. Then, it is transformed into an intermediate format file, whichis imported into ICEM CFD for mesh division. Through multiple attempts, the appropriate blockingstrategy is chosen, a regular grid is used for transition, and the O-grid is used to divide the throttle holes,thereby obtaining a high-quality structured grid.
2.2.3 Numerical CalculationFLUENT is a special hydrodynamics software used to simulate and analyze the heat exchange and flow
of fluid in complex areas. Its principal function is to calculate, analyze, and predict the flow field andtemperature field [11]. Through CFD simulation, the state of the fluid flow process can be analyzed anddisplayed; the flow performance of the fluid in the simulation area can be accurately predicted; byadjusting various parameters, the optimal parameters of the corresponding process can be obtained [12].In essence, as a solver, the functions provided by FLUENT mainly include: pre-processing (importingmesh model, providing physical model, and applying boundary conditions and material characteristics),solution, and post-processing [13]. Before using FLUENT, first, the detailed solution scheme is analyzedaccording to the required physical problems. After importing the grid file into FLUENT, the grid qualityand the unit will be rechecked, and the solution parameters will be set after confirming that there is noerror. The parameters include material properties, model, solver, boundary conditions, under-relaxationfactor, residual setting, and initial flow field. For flow field analysis, only the physical properties of fluidmaterials need to be set. Whether the liquid flow is laminar or turbulent is a principal concern of modelselection. The flow pattern is judged through the Reynolds number: if the number is less than 2,000, theflow will be laminar; if the number is more than 4,000, the flow will be turbulent. The calculation ofReynolds number Re is shown in Eq. (27). The parameters are calculated to obtain the Reynolds numberof each part of the flow field of the supporting element.
Re ¼ 4qQlY
(27)
where ρ is the oil density, Q is the oil flow, μ is the dynamic viscosity, and Y is the wet cycle.
According to the calculation results, only the gravity in the Z-direction is considered. Then, the Laminarturbulence solution model is chosen; the hydraulic oil dynamic viscosity is set to 0:027 Pas and expressedwith l. Its density q is set to 900 kg/m3. Then, the boundary conditions are set, and the oil inlet is pressure-inlet. The pressure is 167803 Pa, which is evenly distributed in the inlet section. The inlet height and diameterare 100 mm and 6 mm, respectively. H is height, and D is the diameter. The position of the oil outlet ispressure-outlet, the pressure is 0 Pa, and the velocity on the solid wall meets the condition of no sliding.Then, the rectangular coordinate system, which coincides with the axis, is established and expressed by(x, y, z). The rectangular coordinate system is further fixed at the position of the centerline. Then, it isinitialized to solve the problem.
FLUENT provides two types of solvers: pressure-based solvers and density-based solvers. The 3Dimplicit steady-state solvers based on pressure are selected [14]. For the solution algorithm, the simplealgorithm is selected considering the application range, convergence speed, and calculation accuracy [15].
FDMP, 2020, vol.16, no.6 1135

The under-relaxation factors of pressure, density, body forces, momentum, and energy are set to 0.3, 1, 1, 0.7,and 0.8, respectively. Meantime, the continuity residuals are set as 10−5, speed residuals as 10−4, and energyresiduals as 10−6, and the residuals monitoring chart is opened. In order to accelerate the convergence, thevelocity and temperature of the flow field are initialized to 0 and 293.15 K, respectively. Afterinitialization, the number of iteration steps is set to 3,000. When all residuals are nearly stable afteriteration to 2,000 steps, the (inlet flow-outlet flow)/inlet flow is found to be −8.25 × 10⁻⁷ throughmonitoring. Therefore, the iteration is completed, and the equation has converged.
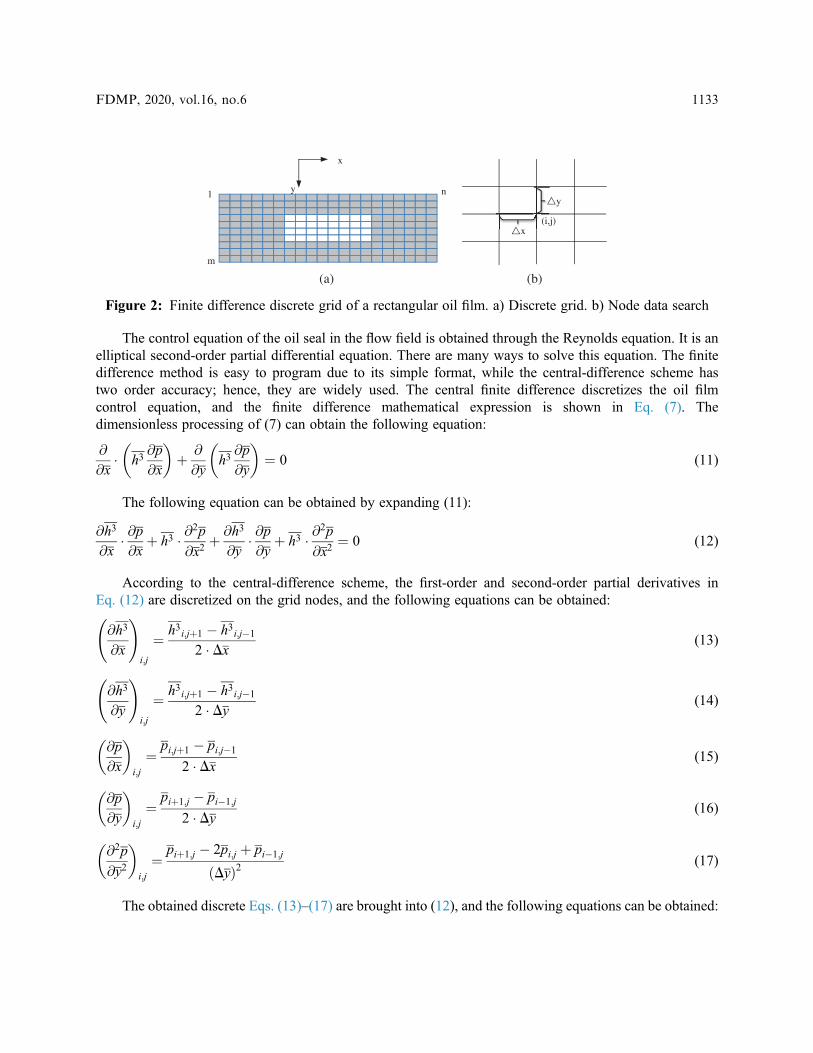
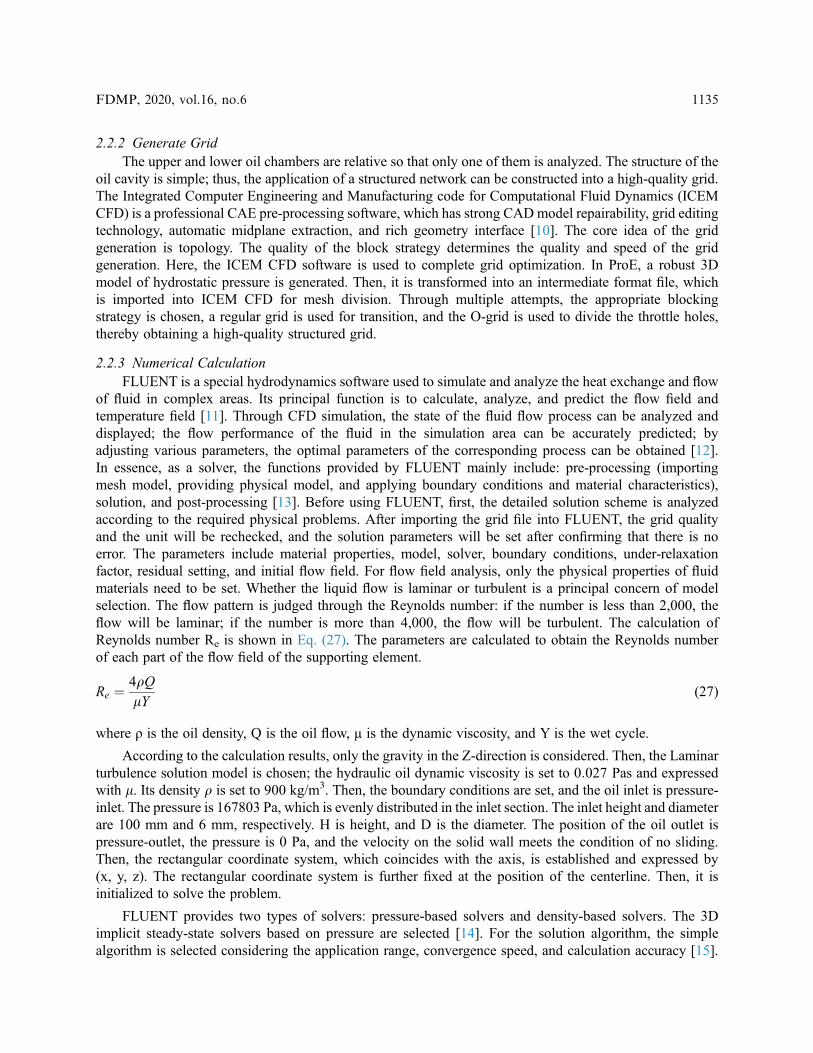
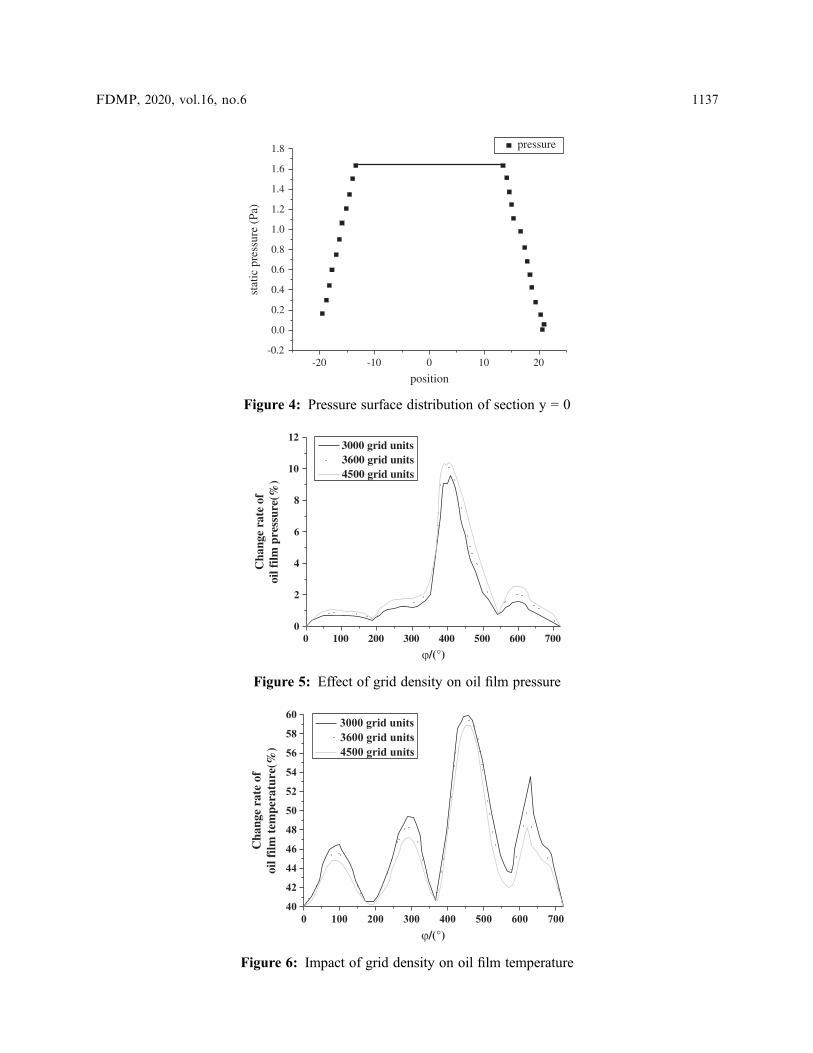
According to the final results, the 3D distribution of oil film pressure in hydrostatic guide rail is in the formof a continuous inverted pyramid. From the inner ring of the oil return groove and sealing surface to the outerring, the pressure of the oil film gradually decreases from the maximum value to zero. The pressure distributiondiagram at the section with x = 0 and y = 0 of the rectangular oil chamber is shown in Figs. 3 and 4, respectively.When x = 0, the pressure in each region of the cavity is the same. The pressure from the oil seal to the oil cavityedge is nonlinear, and the pressure increases gradually from low to high. When y = 0, the pressure in each areaof the oil chamber is the same. The pressure from the oil seal to the oil cavity edge is also nonlinear, and thepressure increases gradually from low to high. Also, the flow rate of liquid from the orifice to the oil chamber ismore significant than that from other places. From the oil film to the outside, the flow rate decreases gradually,and there will be vortex near the oil inlet of the throttle. At the junction of the oil pad and the four corners of theoil chamber, the flow rate is the fastest.
3 Simulation Results
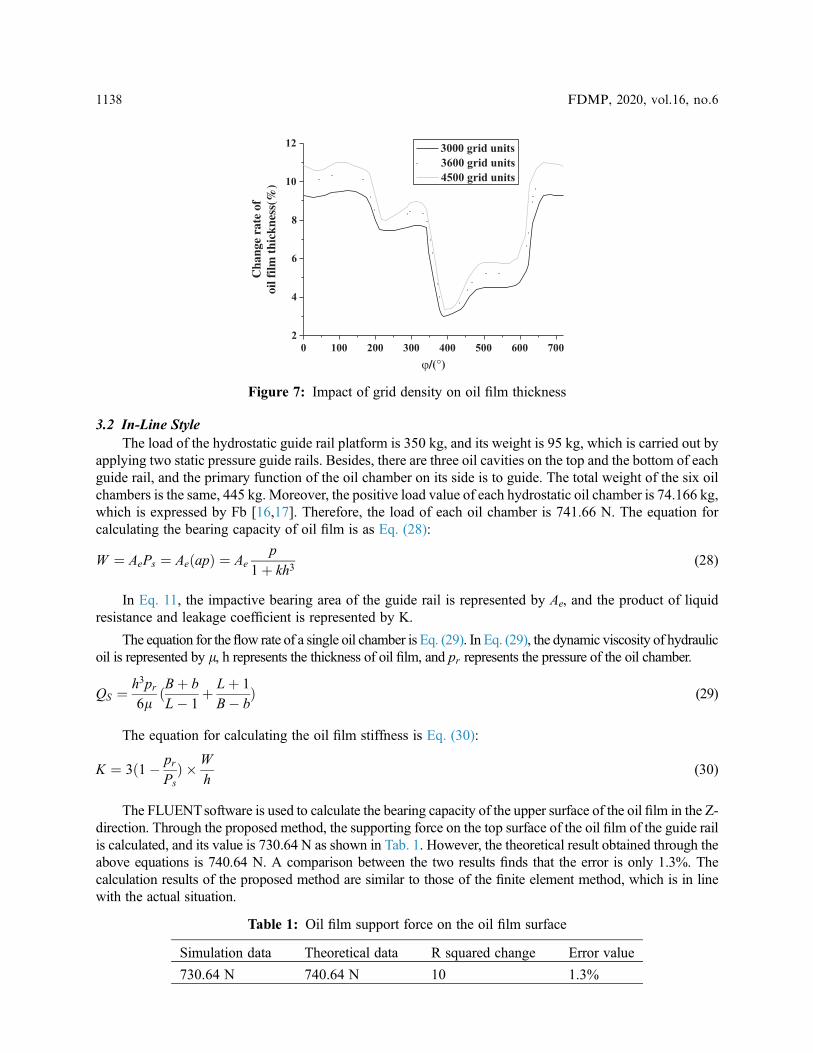
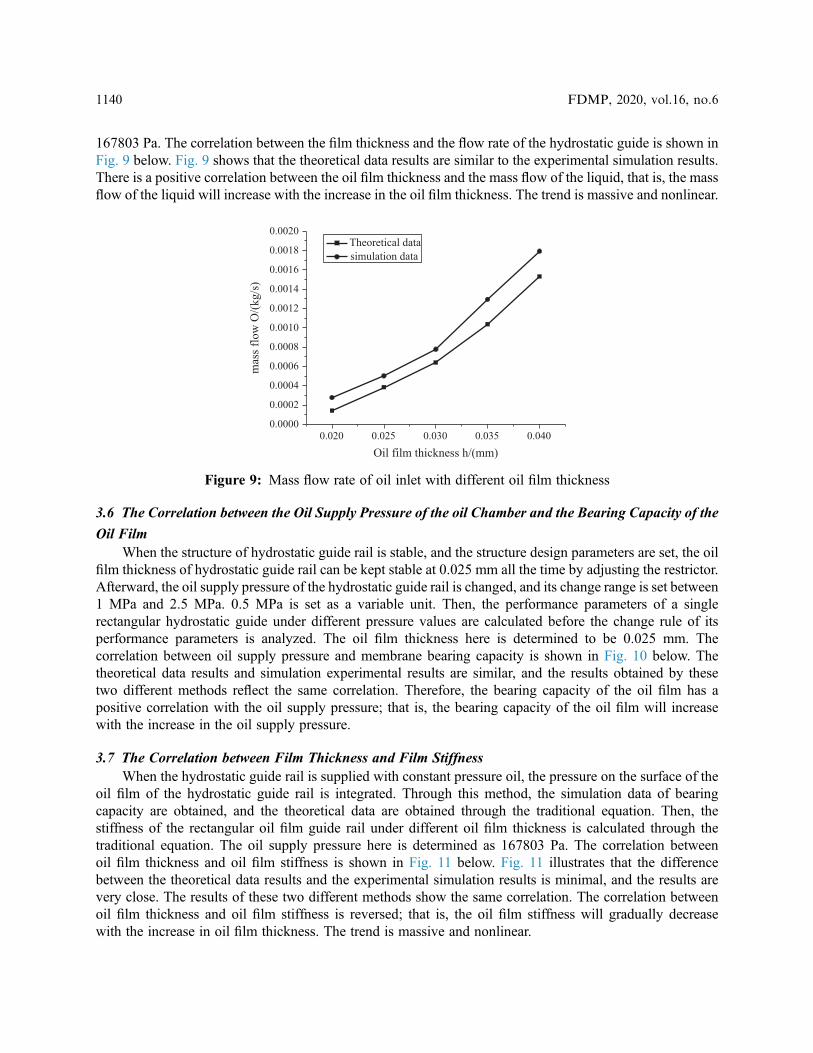
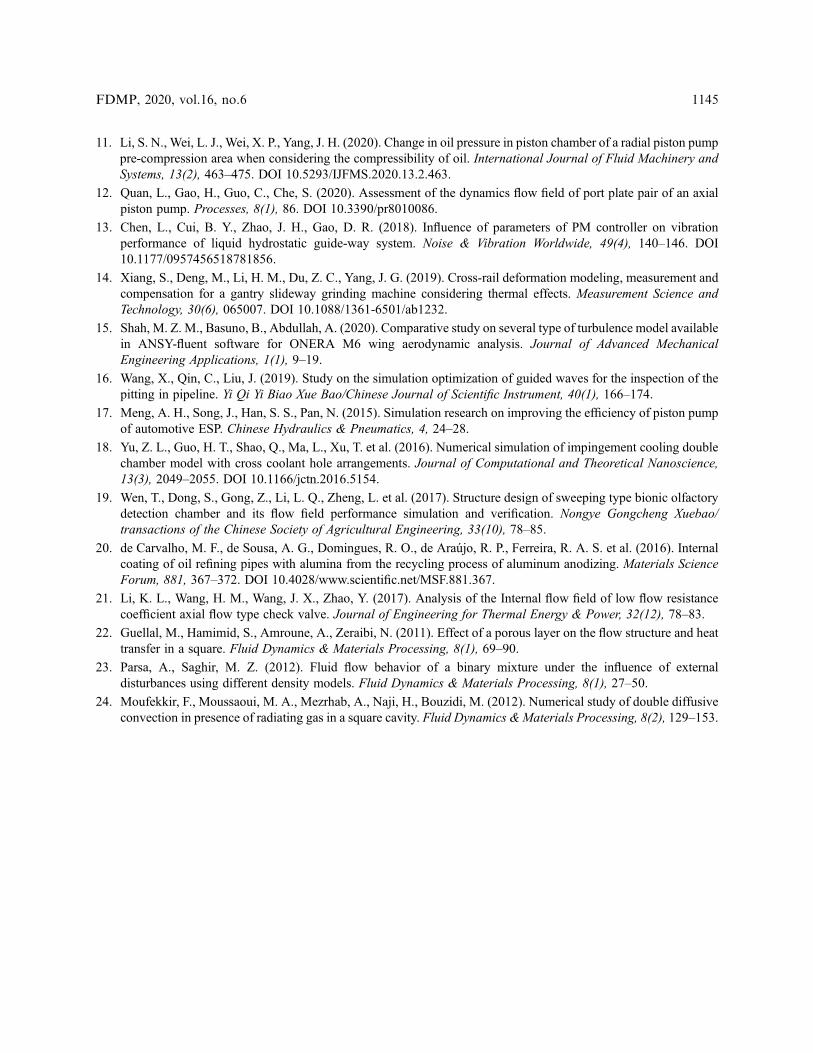
3.1 Impact of Grid Density on Oil Film Pressure, Temperature, and ThicknessThe impacts of grid density on oil film pressure, temperature, and thickness are shown in Figs. 5–7,
respectively. The grid density has no essential impact on the changing trend of oil film pressure,temperature, and thickness, but makes its value change to some extent. With the increase in grid density,the pressure of the oil film increases, the temperature of the oil film decreases slightly, the thickness ofthe oil film increases, and the maximum temperature is about 60°C.
-80 -60 -40 -20 0 20 40 60 80 100-0.2
0.0
0.2
0.4
0.6
0.8
1.0
1.2
1.4
1.6
1.8pressure
stat
ic p
ress
ure
(Pa)
position(mm)
Figure 3: Pressure surface distribution of section x = 0
1136 FDMP, 2020, vol.16, no.6
-20 -10 0 10 20-0.2
0.0
0.2
0.4
0.6
0.8
1.0
1.2
1.4
1.6
1.8 pressure
stat
ic p
ress
ure
(Pa)
position
Figure 4: Pressure surface distribution of section y = 0
0 100 200 300 400
ϕ/(°)500 600 700
0
2
4
6
8
10
12
Cha
nge
rate
of
oil f
ilm p
ress
ure(
%)
3000 grid units 3600 grid units 4500 grid units
Figure 5: Effect of grid density on oil film pressure
0 100 200 300 400 500 600 70040
42
44
46
48
50
52
54
56
58
60
Cha
nge
rate
of
oil f
ilm t
empe
ratu
re(%
)
3000 grid units 3600 grid units 4500 grid units
ϕ/(°)
Figure 6: Impact of grid density on oil film temperature
FDMP, 2020, vol.16, no.6 1137
3.2 In-Line StyleThe load of the hydrostatic guide rail platform is 350 kg, and its weight is 95 kg, which is carried out by
applying two static pressure guide rails. Besides, there are three oil cavities on the top and the bottom of eachguide rail, and the primary function of the oil chamber on its side is to guide. The total weight of the six oilchambers is the same, 445 kg. Moreover, the positive load value of each hydrostatic oil chamber is 74.166 kg,which is expressed by Fb [16,17]. Therefore, the load of each oil chamber is 741.66 N. The equation forcalculating the bearing capacity of oil film is as Eq. (28):
W ¼ AePs ¼ AeðapÞ ¼ Aep
1þ kh3(28)
In Eq. 11, the impactive bearing area of the guide rail is represented by Ae, and the product of liquidresistance and leakage coefficient is represented by K.
The equation for the flow rate of a single oil chamber is Eq. (29). In Eq. (29), the dynamic viscosity of hydraulicoil is represented by l, h represents the thickness of oil film, and pr represents the pressure of the oil chamber.
QS ¼ h3pr6l
ðBþ b
L� 1þ Lþ 1
B� bÞ (29)
The equation for calculating the oil film stiffness is Eq. (30):
K ¼ 3ð1� prPsÞ �W
h(30)
The FLUENTsoftware is used to calculate the bearing capacity of the upper surface of the oil film in the Z-direction. Through the proposed method, the supporting force on the top surface of the oil film of the guide railis calculated, and its value is 730.64 N as shown in Tab. 1. However, the theoretical result obtained through theabove equations is 740.64 N. A comparison between the two results finds that the error is only 1.3%. Thecalculation results of the proposed method are similar to those of the finite element method, which is in linewith the actual situation.
0 100 200 300 400 500 600 7002
4
6
8
10
12
Cha
nge
rate
of
oil f
ilm t
hick
ness
(%)
3000 grid units 3600 grid units 4500 grid units
ϕ/(°)
Figure 7: Impact of grid density on oil film thickness
Table 1: Oil film support force on the oil film surface
Simulation data Theoretical data R squared change Error value
730.64 N 740.64 N 10 1.3%
1138 FDMP, 2020, vol.16, no.6

3.3 Comparison and Verification of Design Scheme before and after OptimizationAccording to the previous optimization results, through the ANSYSWorkbench finite element software,
the numerical simulation is verified. The comparison and verification of the design scheme before and afteroptimization are shown in Tab. 2. The overall scores of the design scheme before and after the optimizationare 57.2356 and 67.3425, respectively, which increases by 10.1069.
3.4 Correlation between Oil Film Thickness and Oil Film Bearing CapacityBy integrating the pressure on the surface of the oil film of the hydrostatic guide rail, the bearing capacity
simulation data of the hydrostatic guide rail can be obtained, and the theoretical data results of the bearingcapacity can be calculated. When the hydrostatic guide rail is under constant oil supply pressure, the oilsupply pressure here is determined as 167803 Pa. The correlation between the oil film thickness and thebearing capacity is shown in Fig. 8. Fig. 8 illustrates that the theoretical data results are similar tothe experimental simulation results. There is a reverse correlation between the oil film thickness and thebearing capacity, that is, the higher the oil film thickness is, the smaller the bearing capacity of the oilfilm is. The trend is nonlinear.
3.5 The Correlation between the Thickness of Oil Film and the Mass Flow at the Inlet of the Oil ChamberBecause the flow rate of hydrostatic guide rail can show the consumption of hydraulic oil when the
hydrostatic guide rail is working, it is calculated here. There are two calculation methods. The firstmethod is to integrate the flow rate in the boundary area of fluid inlet or outlet. The second way isthrough the traditional theoretical calculation equation. The oil supply pressure here is determined as
Table 2: Comparison of schemes before and after optimization
Numerical value Design schemebefore optimization
Design schemeafter optimization
Overall weight (Kg) 416.75 390.53
Maximum deformation (um) 0.4926 0.4773
Maximum stress (Mpa) 1.2046 0.9975
Comprehensive score 57.2356 67.3425
0.020 0.025 0.030 0.035 0.040660
680
700
720
740
760
780
800
Oil
film
bea
ring
cap
acity
w/(
N)
Oil film thickness h/(mm)
Theoretical data simulation data
Figure 8: Bearing capacity at different film thicknesses
FDMP, 2020, vol.16, no.6 1139
167803 Pa. The correlation between the film thickness and the flow rate of the hydrostatic guide is shown inFig. 9 below. Fig. 9 shows that the theoretical data results are similar to the experimental simulation results.There is a positive correlation between the oil film thickness and the mass flow of the liquid, that is, the massflow of the liquid will increase with the increase in the oil film thickness. The trend is massive and nonlinear.
3.6 The Correlation between the Oil Supply Pressure of the oil Chamber and the Bearing Capacity of the
Oil FilmWhen the structure of hydrostatic guide rail is stable, and the structure design parameters are set, the oil
film thickness of hydrostatic guide rail can be kept stable at 0.025 mm all the time by adjusting the restrictor.Afterward, the oil supply pressure of the hydrostatic guide rail is changed, and its change range is set between1 MPa and 2.5 MPa. 0.5 MPa is set as a variable unit. Then, the performance parameters of a singlerectangular hydrostatic guide under different pressure values are calculated before the change rule of itsperformance parameters is analyzed. The oil film thickness here is determined to be 0.025 mm. Thecorrelation between oil supply pressure and membrane bearing capacity is shown in Fig. 10 below. Thetheoretical data results and simulation experimental results are similar, and the results obtained by thesetwo different methods reflect the same correlation. Therefore, the bearing capacity of the oil film has apositive correlation with the oil supply pressure; that is, the bearing capacity of the oil film will increasewith the increase in the oil supply pressure.
3.7 The Correlation between Film Thickness and Film StiffnessWhen the hydrostatic guide rail is supplied with constant pressure oil, the pressure on the surface of the
oil film of the hydrostatic guide rail is integrated. Through this method, the simulation data of bearingcapacity are obtained, and the theoretical data are obtained through the traditional equation. Then, thestiffness of the rectangular oil film guide rail under different oil film thickness is calculated through thetraditional equation. The oil supply pressure here is determined as 167803 Pa. The correlation betweenoil film thickness and oil film stiffness is shown in Fig. 11 below. Fig. 11 illustrates that the differencebetween the theoretical data results and the experimental simulation results is minimal, and the results arevery close. The results of these two different methods show the same correlation. The correlation betweenoil film thickness and oil film stiffness is reversed; that is, the oil film stiffness will gradually decreasewith the increase in oil film thickness. The trend is massive and nonlinear.
0.020 0.025 0.030 0.035 0.0400.0000
0.0002
0.0004
0.0006
0.0008
0.0010
0.0012
0.0014
0.0016
0.0018
0.0020
mas
s flo
w O
/(kg/
s)
Oil film thickness h/(mm)
Theoretical data simulation data
Figure 9: Mass flow rate of oil inlet with different oil film thickness
1140 FDMP, 2020, vol.16, no.6

3.8 Correlation Between Oil Supply Pressure and Oil Film StiffnessIf the oil supply pressure is different, the rectangular oil chamber of the hydrostatic guide rail is different.
Therefore, the range of change is set between 1 MPa and 2.5 MPa. Then, the bearing capacity is calculatedwhen the oil film thickness is 0.02 mm. Afterward, the bearing capacity is calculated when the oil filmthickness is 0.025 mm. The traditional calculation equation is applied to calculate the rigidity of the oilfilm of the rectangular oil cavity guide rail under different oil supply pressures. The correlation betweenoil supply pressure and oil film stiffness is shown in Fig. 10 below. The figure suggests that thetheoretical data results and simulation experiment results are similar, and the results obtained by the twodifferent methods indicate the same correlation. There is a positive correlation between the film thicknessand the film stiffness; in other words, the film stiffness will increase with the increase in the oil supplypressure. The trend is massive and nonlinear.
100000 110000 120000 130000 140000
420
440
460
480
500
520
540
560
580
600
620
640
Bea
ring
cap
acity
W/(
N)
Oil supply pressure P/(Pa)
Theoretical data simulation data
Figure 10: Correlation between oil supply pressure and oil film bearing capacity
0.020 0.025 0.030 0.035 0.04015000
20000
25000
30000
35000
40000
Oil
film
stif
fnes
s k/
(N/m
m)
Oil film thickness h/(mm)
Theoretical data simulation data
Figure 11: Oil film stiffness curve with different oil film thickness
FDMP, 2020, vol.16, no.6 1141

3.9 Comparison between Theoretical and Experimental Data of Dimensionless Bearing Capacity
CoefficientThe above measurement data are transformed and fitted to plot the experimental bearing capacity curve.
The comparison of the dimensionless bearing-capacity coefficient and experimental data is shown in Fig. 13.The connection between the two experimental curves can reveal the approximate experimental bearing-capacity coefficient curve. There is an absolute deviation between the experimental curve and thetheoretical curve, which is caused by the impact of internal forces. Meanwhile, many error items, such asmeasurement error of measuring equipment, manufacturing error of guide rail, uncertainty error of oilsupply pressure of oil pump, are also coupled in the experimental curve. However, these errors aresmaller than the above experimental principle errors and have less impact on the data. The trend of theexperimental curve suggests that the measurement results are consistent with the numerical trend of thetheoretical curve, which has a particular reference value.
100000 110000 120000 130000 140000
17000
18000
19000
20000
21000
22000
23000
24000
25000
Oil
film
stif
fnes
s k/
(N/m
m)
Oil supply pressure p/(pa)
Theoretical data simulation data
Figure 12: Correlation between oil supply pressure and oil film stiffness of the hydrostatic guide
0.0 0.1 0.2 0.3 0.4 0.5 0.6 0.70.0
0.2
0.4
0.6
0.8
1.0
Loa
d ca
paci
ty c
oeff
icie
nt
Displacement rate
Theoretical load curve Supply pressure 1.45 MPa Supply pressure 0.6 MPa
Figure 13: Experimental curve and theoretical curve of the dimensionless bearing capacity coefficient
1142 FDMP, 2020, vol.16, no.6

4 Discussion
With the continuous progress of science and technology, ultra-precision machining technology becomesmore common and widespread, playing a vital role in China’s industry and national defense. This technologyis valued globally; many experts and scholars have researched it deeply, and some fruitful results areachieved. The guide rail components with high precision play a decisive role in the precision of ultra-precision machine tools. A high-precision guide rail component can also improve the accuracy of thelinear motion platform and relative position of the machine tool [18–20]. Hydrostatic guide rail has manyadvantages, such as high precision, high stiffness, and long life; therefore, it has an extensive range ofapplications. For factories, the fundamental problem of the hydrostatic guide rail technology is thesupporting force and the rigidity of the guide rail oil film [21]. In order to improve the stability of oilfilms, the load-carrying capacity and the rigidity of resisting the external load must be optimized.Besides, the cyclic alternating stress in the bearing area of hydrostatic guide rail will also affect theperformance of guide rail. Guellal et al. solved the problem in the framework of the velocity-pressureequation of the finite volume method based on the standard SIMPLER algorithm, who also studied theimpact of control parameters (geometry, hydrodynamics, and heat) on fluid flow and heat transfer [22].Many researchers also investigated the impacts of different parameters (Rayleigh number, buoyancynumber, optical thickness, and Lewis number) on fluid flow, heat, and mass transfer [23,24].
Therefore, by simulating the flow field inside the guide oil chamber, the impact of the method on theperformance of hydrostatic guide is studied, and the pressure oil film finite element model of the axishydrostatic guide of ultra-precision machine tool is established. According to the theory of fluid lubricationand the Reynolds equation, the model is assumed to be conditional and calculated with a specific numericalvalue. The calculations help analyze the oil film pressure and flow field between guide rails. Afterward, theflow field inside the guide oil chamber is simulated. Through the traditional empirical equation, thecorrectness of the simulation results is verified; thus, the impacts of different structural design parametersand environmental factors on the performance of hydrostatic guide rail are determined. Besides, the impactsof different oil film thickness and different input pressure parameters of the oil inlet on the performance ofguide rail are discussed and analyzed. There are specific rules between them.
Through the proposed method, the supporting force on the top surface of the oil film of the guide rail iscalculated, and its value is 930.64 N. However, the theoretical result is 740.64 N. A comparison between thetwo results finds that the error rate is only 1.3%. Hence, the calculation results of the proposed method andthe finite element method are not much different, which is in line with the actual situation. The simulationresults are similar to the traditional theoretical calculation results, the pressure of the rectangular oil cavitychanges little, and the streamline distribution is proper. However, at the throttle, there is a flow of pressureenergy. A greater thickness of the oil film indicates a smaller bearing capacity. The oil film thickness and themass flow of the liquid share a positive correlation. The mass flow of the liquid will increase with the increasein the oil film thickness. The bearing capacity of oil film shares a positive correlation with oil supply pressure;that is, the bearing capacity of oil film will increase with the increase in oil supply pressure. Besides, there is apositive correlation between the film thickness and the film stiffness; in other words, the film stiffness willincrease with the increase in the oil supply pressure.
The impacts of oil film thickness and other parameters on the performance of the guide rail are analyzed,and the rules between them are clarified, which can provide a positive reference for the follow-upoptimization design of machine tools and guide rails. The results have specific innovations. According tothe actual working condition of the hydrostatic guide rail, the hydrostatic guide rail system is designedand calculated. Based on the theory of fluid lubrication and Reynolds equation, the oil film in therectangular oil cavity of the guide rail is analyzed by the finite element method. In the meantime, withthe aid of the finite element software, the oil film pressure distribution and oil velocity distribution of thehydrostatic guide are obtained. In the above experiment, only the finite element method is used to get
FDMP, 2020, vol.16, no.6 1143

the simulation results of the hydrostatic guide rail. Due to the limited conditions, it is impossible to manufacturethe actual ultra-precision machine tools for experimental verification, which will be perfected later.
5 Conclusion
The results of the oil film support force calculated by the simulation analysis method and the traditionalformula are almost the same. The result of the traditional algorithm is 740.63 N, and the simulation result is730.64 N, showing that the model simulation method applied has absolute accuracy. The experimental resultsshow that the bearing capacity of oil film is affected by the thickness of oil film and the pressure of oil supply.In addition, the oil supply pressure will also affect the oil film stiffness, and there are a specific correlationand laws between them. The above results can provide theoretical guidance for the optimization of machinetools and guide rails in the future. However, this study only obtains the simulation results of the hydrostaticguide rail by establishing the finite element model, which has not been verified by the ultra-precision machinetool in practical application and lacks certain experimental conditions. In future experiments, the model willbe analyzed in the actual application of machine tools to enhance the depth and reliability of the results.
Acknowledgement: Acknowledgements and Reference heading should be left justified, bold, with the firstletter capitalized but have no numbers. Text below continues as normal.
Funding Statement: The author(s) received no specific funding for this study.
Conflicts of Interest: The authors declare that they have no conflicts of interest to report regarding thepresent study.
References1. Ghassemi, M., Chen, Q., Yang, C. (2017). The influence magnitude and rise time of applied voltage and the type of oil
on streamer growth in a wet-mate DC connector. IEEE Transactions on Dielectrics and Electrical Insulation, 24(3),1646–1656. DOI 10.1109/TDEI.2017.006448.
2. Huang, H., Liu, J., Liu, X., Xiao, J., Zhong, S. et al. (2016). Physical simulation of the interlayer effect on SAGDproduction in mackay river oil sands. Fuel, 183, 373–385. DOI 10.1016/j.fuel.2016.05.120.
3. Jun, Z., Dun, L. V., Qian, J., Chen, Y. L. (2015). Motion straightness of hydrostatic guideways considering the ratioof pad center spacing to guide rail profile error wavelength. International Journal of Advanced ManufacturingTechnology, 82(9), 1–9. DOI 10.1007/s00170-014-6601-1.
4. Jakub, T., Pavel, B., Lucie, V., Slouka, Z. (2016). Electric field driven addressing of oil-in-water droplets in thepresence of gradients of ionic and nonionic surfactants. IEEE Transactions on Industry Applications, 52(6),C1–4524. DOI 10.1109/TIA.2016.2619619.
5. Nattan, R. C., Cataluña, H. A., Vielmo, H. A. (2015). Analysis of the effect on the mechanical injection engineusing doped diesel fuel by ethanol and bio-oil. International Review of Mechanical Engineering, 9(2), 124.J.
6. Zhu, Y. M., Yi, J. Y., Xu, M., Chen, Z., Yang, S. H. et al. (2019). Quantum chemical simulation and laboratorytesting of the curing mechanism and performance of resin bio-oil. International Journal of PavementEngineering, 17, 1–20.
7. Xiao, C., Huang, K., Liu, H. (2017). Effect of change in aqueous-to-oil phase ratio on the performance of mixer-settler in extraction processes. Chinese Journal of Process Engineering, 17(5), 885–892.
8. Deng, M. R., Guo, H. X., Xiong, S. Y. (2017). Influence of building chambers on internal ventilation andcorresponding simulation analysis. Journal of South China University of Technology, 45(5), 74–81.
9. Kong, X., Chen, L., Li, Y. (2015). Numerical analysis of acoustic and resistance performance of muffler inrefrigeration compressor’s discharge pipe. Transactions of the Chinese Society of Agricultural Engineering,31(5), 59–64.
10. Dong, W. J., Li, B. Z., Guo, W. C., Zhou, Q. Z. (2019). Deformation analysis of hydrostatic guideways based onthe cantilever plate bending calculation method. Tribology Transactions, 62(6), 1142–1154. DOI 10.1080/10402004.2019.1669755.
1144 FDMP, 2020, vol.16, no.6
11. Li, S. N., Wei, L. J., Wei, X. P., Yang, J. H. (2020). Change in oil pressure in piston chamber of a radial piston pumppre-compression area when considering the compressibility of oil. International Journal of Fluid Machinery andSystems, 13(2), 463–475. DOI 10.5293/IJFMS.2020.13.2.463.
12. Quan, L., Gao, H., Guo, C., Che, S. (2020). Assessment of the dynamics flow field of port plate pair of an axialpiston pump. Processes, 8(1), 86. DOI 10.3390/pr8010086.
13. Chen, L., Cui, B. Y., Zhao, J. H., Gao, D. R. (2018). Influence of parameters of PM controller on vibrationperformance of liquid hydrostatic guide-way system. Noise & Vibration Worldwide, 49(4), 140–146. DOI10.1177/0957456518781856.
14. Xiang, S., Deng, M., Li, H. M., Du, Z. C., Yang, J. G. (2019). Cross-rail deformation modeling, measurement andcompensation for a gantry slideway grinding machine considering thermal effects. Measurement Science andTechnology, 30(6), 065007. DOI 10.1088/1361-6501/ab1232.
15. Shah, M. Z. M., Basuno, B., Abdullah, A. (2020). Comparative study on several type of turbulence model availablein ANSY-fluent software for ONERA M6 wing aerodynamic analysis. Journal of Advanced MechanicalEngineering Applications, 1(1), 9–19.
16. Wang, X., Qin, C., Liu, J. (2019). Study on the simulation optimization of guided waves for the inspection of thepitting in pipeline. Yi Qi Yi Biao Xue Bao/Chinese Journal of Scientific Instrument, 40(1), 166–174.
17. Meng, A. H., Song, J., Han, S. S., Pan, N. (2015). Simulation research on improving the efficiency of piston pumpof automotive ESP. Chinese Hydraulics & Pneumatics, 4, 24–28.
18. Yu, Z. L., Guo, H. T., Shao, Q., Ma, L., Xu, T. et al. (2016). Numerical simulation of impingement cooling doublechamber model with cross coolant hole arrangements. Journal of Computational and Theoretical Nanoscience,13(3), 2049–2055. DOI 10.1166/jctn.2016.5154.
19. Wen, T., Dong, S., Gong, Z., Li, L. Q., Zheng, L. et al. (2017). Structure design of sweeping type bionic olfactorydetection chamber and its flow field performance simulation and verification. Nongye Gongcheng Xuebao/transactions of the Chinese Society of Agricultural Engineering, 33(10), 78–85.
20. de Carvalho, M. F., de Sousa, A. G., Domingues, R. O., de Araújo, R. P., Ferreira, R. A. S. et al. (2016). Internalcoating of oil refining pipes with alumina from the recycling process of aluminum anodizing. Materials ScienceForum, 881, 367–372. DOI 10.4028/www.scientific.net/MSF.881.367.
21. Li, K. L., Wang, H. M., Wang, J. X., Zhao, Y. (2017). Analysis of the Internal flow field of low flow resistancecoefficient axial flow type check valve. Journal of Engineering for Thermal Energy & Power, 32(12), 78–83.
22. Guellal, M., Hamimid, S., Amroune, A., Zeraibi, N. (2011). Effect of a porous layer on the flow structure and heattransfer in a square. Fluid Dynamics & Materials Processing, 8(1), 69–90.
23. Parsa, A., Saghir, M. Z. (2012). Fluid flow behavior of a binary mixture under the influence of externaldisturbances using different density models. Fluid Dynamics & Materials Processing, 8(1), 27–50.
24. Moufekkir, F., Moussaoui, M. A., Mezrhab, A., Naji, H., Bouzidi, M. (2012). Numerical study of double diffusiveconvection in presence of radiating gas in a square cavity. Fluid Dynamics & Materials Processing, 8(2), 129–153.
FDMP, 2020, vol.16, no.6 1145