Analyzing Stem Cell Populations Using Flow Cytometry · Analyzing Stem Cell Populations Using Flow...
43
Analyzing Stem Cell Populations Using Flow Cytometry For Research Use Only. Not for use in diagnostic or therapeutic procedures. Class I (1) Laser Products 23-9889-00 Robert Balderas VP, Research & Development BD Biosciences March 27, 2008
-
Upload
hoanghuong -
Category
Documents
-
view
229 -
download
0
Transcript of Analyzing Stem Cell Populations Using Flow Cytometry · Analyzing Stem Cell Populations Using Flow...
Analyzing Stem Cell Populations Using Flow Cytometry
For Research Use Only. Not for use in diagnostic or therapeutic procedures.Class I (1) Laser Products23-9889-00
Robert BalderasVP, Research & DevelopmentBD Biosciences
March 27, 2008
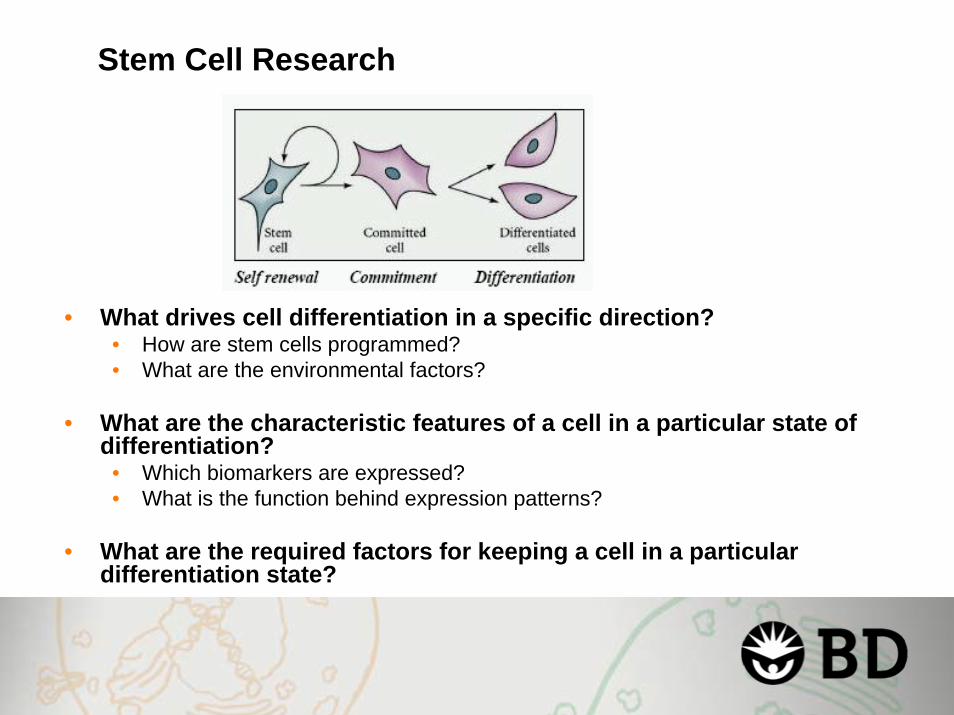
Stem Cell Research
• What drives cell differentiation in a specific direction?• How are stem cells programmed?• What are the environmental factors?
• What are the characteristic features of a cell in a particular state of differentiation?
• Which biomarkers are expressed?• What is the function behind expression patterns?
• What are the required factors for keeping a cell in a particulardifferentiation state?
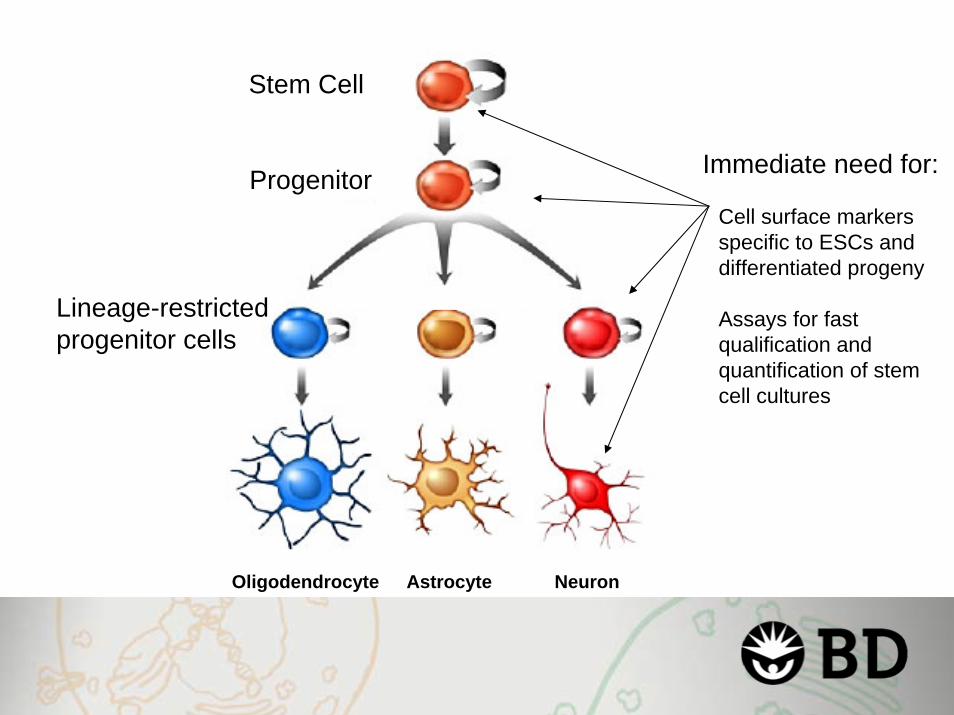
Stem Cell
Lineage-restricted progenitor cells
Oligodendrocyte Astrocyte Neuron
Progenitor Immediate need for:
Cell surface markers specific to ESCs and differentiated progeny
Assays for fast qualification and quantification of stem cell cultures

• Cells are computational devices• Their inner workings (algorithms)
cannot be determined by reading their steady-state values
• Cells must be interrogated to determine relationships of signaling components
Stem Cell Subpopulations Determining How Stem Cells Differentiate
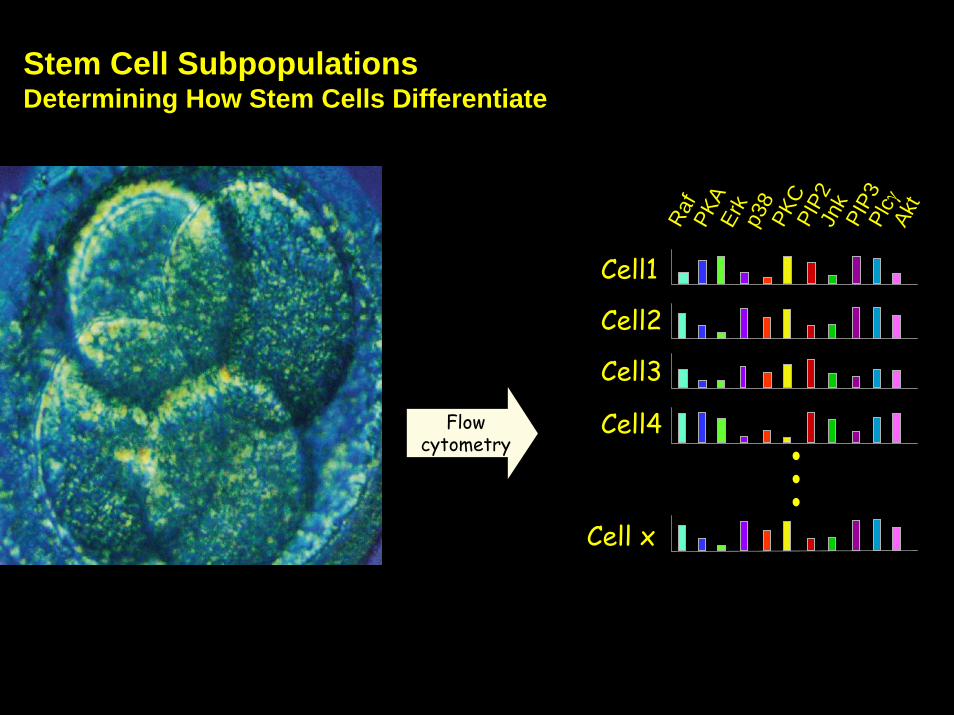
Raf
Erk
p38
PKA
PKC
Jnk
PIP2
PIP3
Plcγ
Akt
...
Cell x
Cell1
Cell2
Cell3
Cell4Flow cytometry
Stem Cell Subpopulations Determining How Stem Cells Differentiate
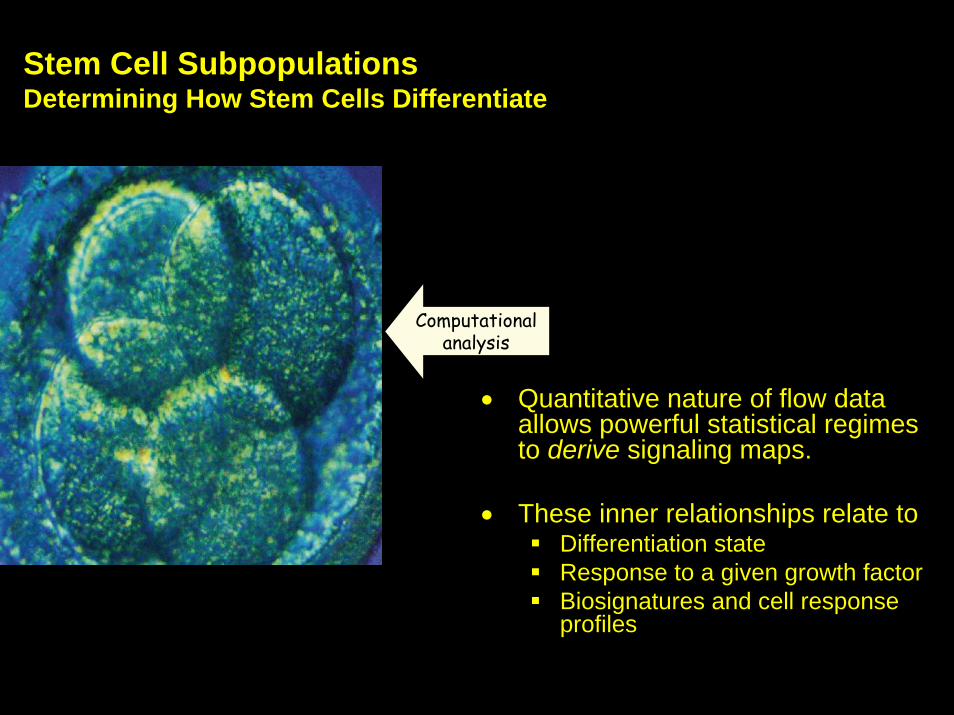
Computational analysis
• Quantitative nature of flow data allows powerful statistical regimes to derive signaling maps.
• These inner relationships relate toDifferentiation stateResponse to a given growth factorBiosignatures and cell response profiles
Stem Cell Subpopulations Determining How Stem Cells Differentiate
Program Overview
• Gating strategies for analyzing stem cell populations
• Pluripotent cell analysis
• Neuronal progenitor cells
• Phosphorylation analysis

Gating Strategies for Stem Cell Populations Using Flow Cytometry
For Research Use Only. Not for use in diagnostic or therapeutic procedures.Class I (1) Laser Products

Gating Strategies for Analyzing Stem Cell Flow Data
• mES and mEB E14 cell populations were stained and analyzed with:• FITC-conjugated SSEA-1• PE GATA4
• Populations were gated in different areas of the scatter plot to determine if size and granularity could be used to provide additional information
• Gating strategies can be created for sorting of homogeneous subpopulations

Gating Strategies for Analyzing Stem Cell Flow Data
FITC SSEA-1
PE G
ATA
4
ES EB
Can we find sub-populations of cells within each cell profile?
(Forward and side scatter patterns are different)
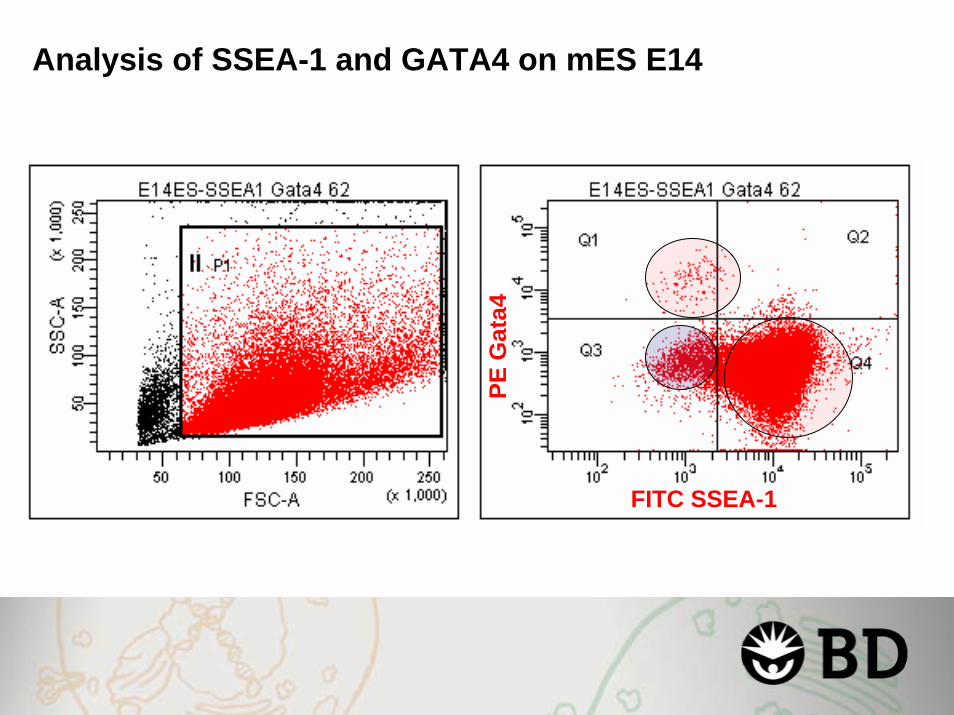
Analysis of SSEA-1 and GATA4 on mES E14
FITC SSEA-1PE
Gat
a4

Analysis of SSEA-1 and GATA4 on mES E14
PE G
ata4
FITC SSEA-1
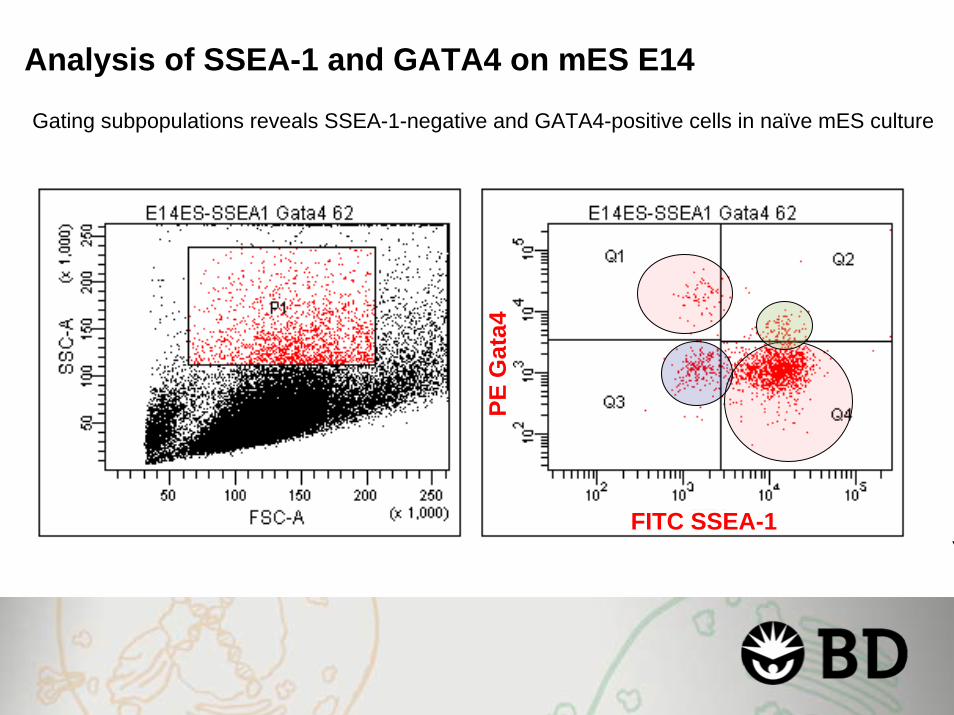
Analysis of SSEA-1 and GATA4 on mES E14
Gating subpopulations reveals SSEA-1-negative and GATA4-positive cells in naïve mES culture
PE G
ata4
FITC SSEA-1
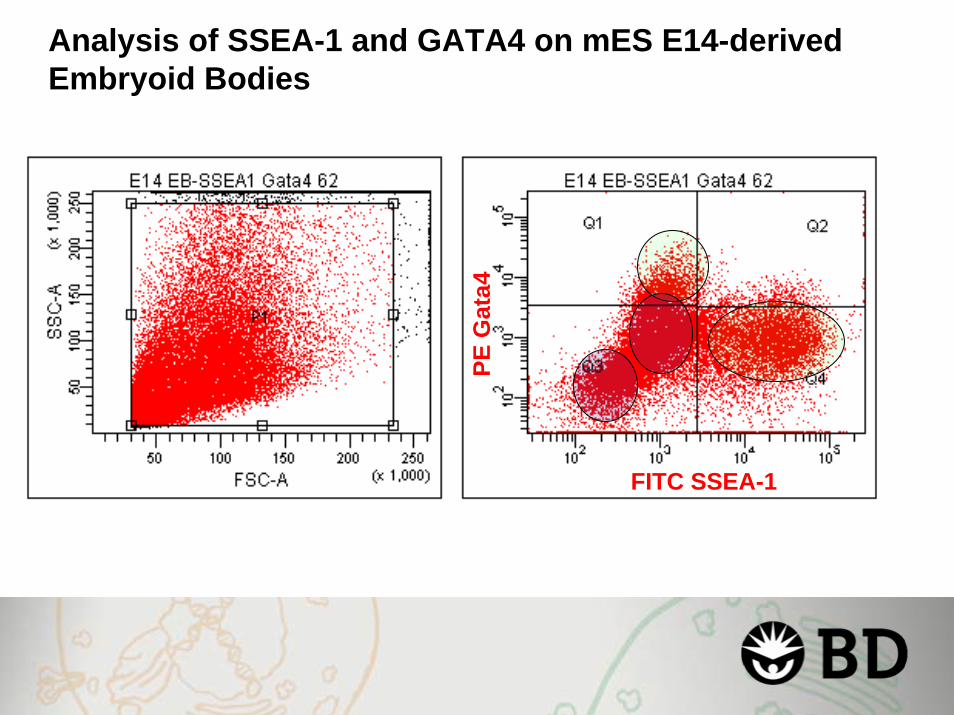
Analysis of SSEA-1 and GATA4 on mES E14-derived Embryoid Bodies
FITC SSEA-1PE
Gat
a4

Analysis of SSEA-1 and GATA4 on mES E14-derived Embryoid Bodies
FITC SSEA-1PE
Gat
a4

Analysis of SSEA-1 and GATA4 on mES E14-derived Embryoid BodiesGating reveals subpopulations of GATA4-positive cells in embryoid bodies
FITC SSEA-1PE
Gat
a4

Pluripotent Cell Analysis
For Research Use Only. Not for use in diagnostic or therapeutic procedures.Class I (1) Laser Products
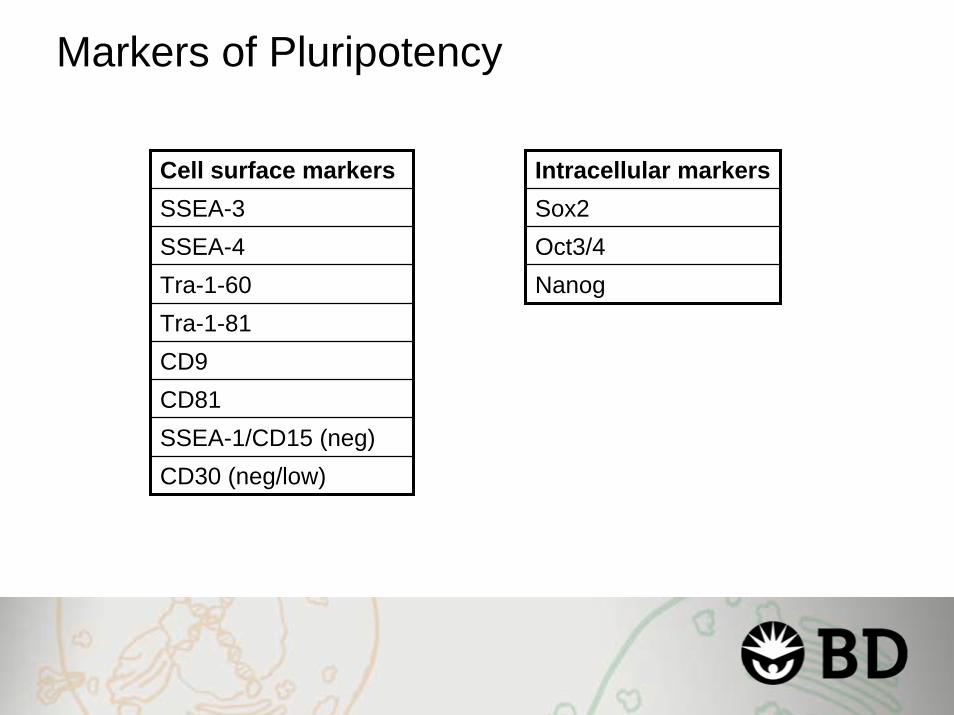
Markers of Pluripotency
Intracellular markersSox2Oct3/4Nanog
Cell surface markersSSEA-3SSEA-4Tra-1-60Tra-1-81CD9CD81SSEA-1/CD15 (neg)CD30 (neg/low)

Three-color flow-cytometric analysis of human embryonic stem cells using fluorochrome-conjugated antibodies to pluripotent stem cell markers
SSEA-4 FITC
Oct
3/4
PE
hESC H9
Cou
nt
BA
2.3% 88.7%
4.1%3.9%
Oct3/4 +, SSEA-4 + Oct3/4 -, SSEA-4 + Oct3/4 -, SSEA-4-
Tra-1-81 Alexa 647 Tra-1-81 Alexa 647 Tra-1-81 Alexa 647
Cou
nt
Cou
nt
Cou
nt
99.4% 64.8% 11.3%
-Human ESC H9 grown on mouse embryonic fibroblast feeder layer
-Cells dissociated into a single cell suspension Differentiated Cells
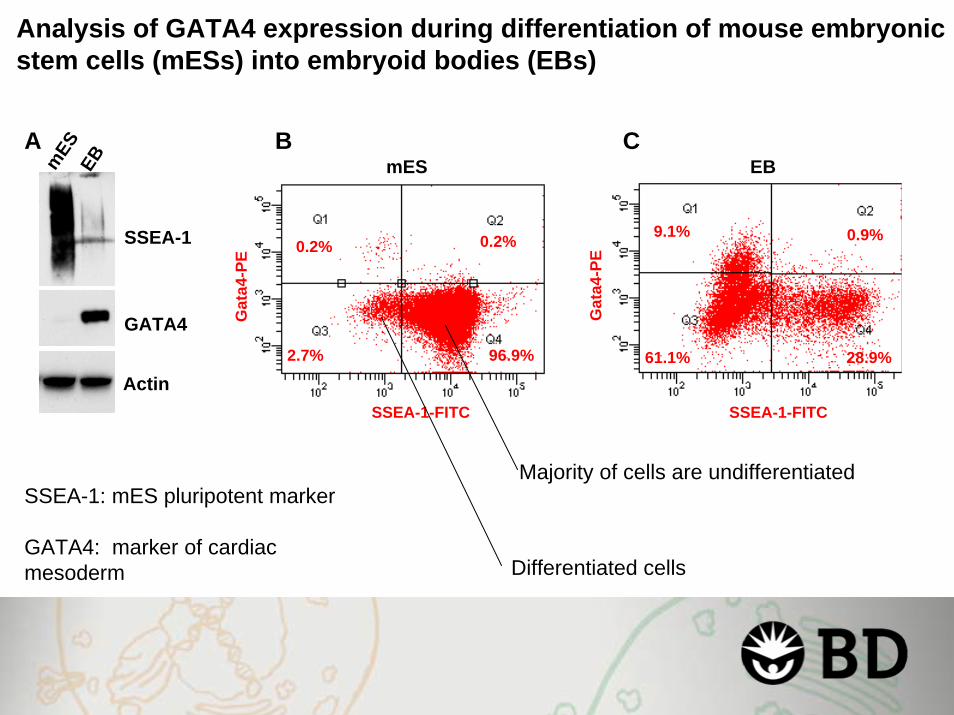
Analysis of GATA4 expression during differentiation of mouse embryonic stem cells (mESs) into embryoid bodies (EBs)
SSEA-1
GATA4
Actin
mES
EB
A B CmES
Gat
a4-P
E
SSEA-1-FITC
0.2% 0.2%
2.7% 96.9%
EB
Gat
a4-P
E
SSEA-1-FITC
9.1% 0.9%
28.9%61.1%
SSEA-1: mES pluripotent marker
GATA4: marker of cardiac mesoderm
Majority of cells are undifferentiated
Differentiated cells

Neuronal Progenitor Cells
For Research Use Only. Not for use in diagnostic or therapeutic procedures.Class I (1) Laser Products
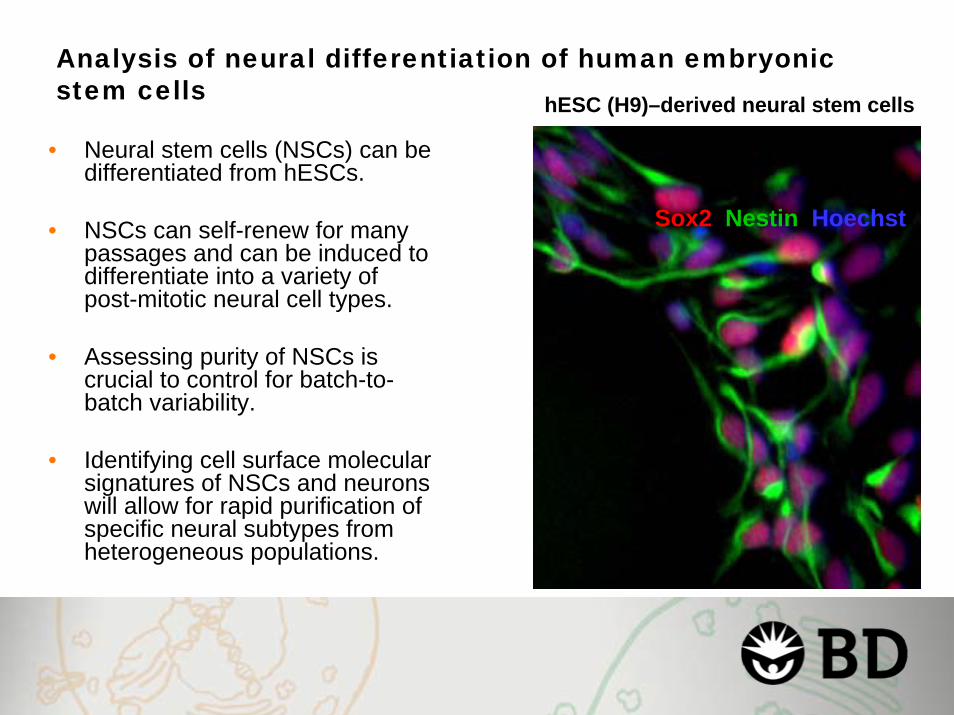
Analysis of neural differentiation of human embryonic stem cells
• Neural stem cells (NSCs) can be differentiated from hESCs.
• NSCs can self-renew for many passages and can be induced to differentiate into a variety of post-mitotic neural cell types.
• Assessing purity of NSCs is crucial to control for batch-to-batch variability.
• Identifying cell surface molecular signatures of NSCs and neurons will allow for rapid purification of specific neural subtypes from heterogeneous populations.
Sox2 Nestin Hoechst
hESC (H9)–derived neural stem cells

hESC H9
Remove cells from plate and differentiate into EBs
Media w/o FGF, 7 days EBs Plate EBs on gelatin coated plate, 2 days
Change media into a neural stem cell growth promoting media (N2, transferin and selenium, w/o FGF)
Isolate the neuro ectotderm cells with a pipet and transfer
Dissociate cells with acutase
Transfer cells to media with N2, B27, and FGF. Plate coated with poly-l-ornithine
Neuronal Stem Cells
Transfer to plate coated with laminin/polyorn., w/o FGF and add different factors
2 weeks

Nestin Alexa 647 OCT3/4 Alexa 488
Sox2
PE
Sox2
PE
Flow cytometric quantification of hESC-derived neural stem cells
We are able to generate a near-pure population of neural stem cells expressing Sox2 and Nestin
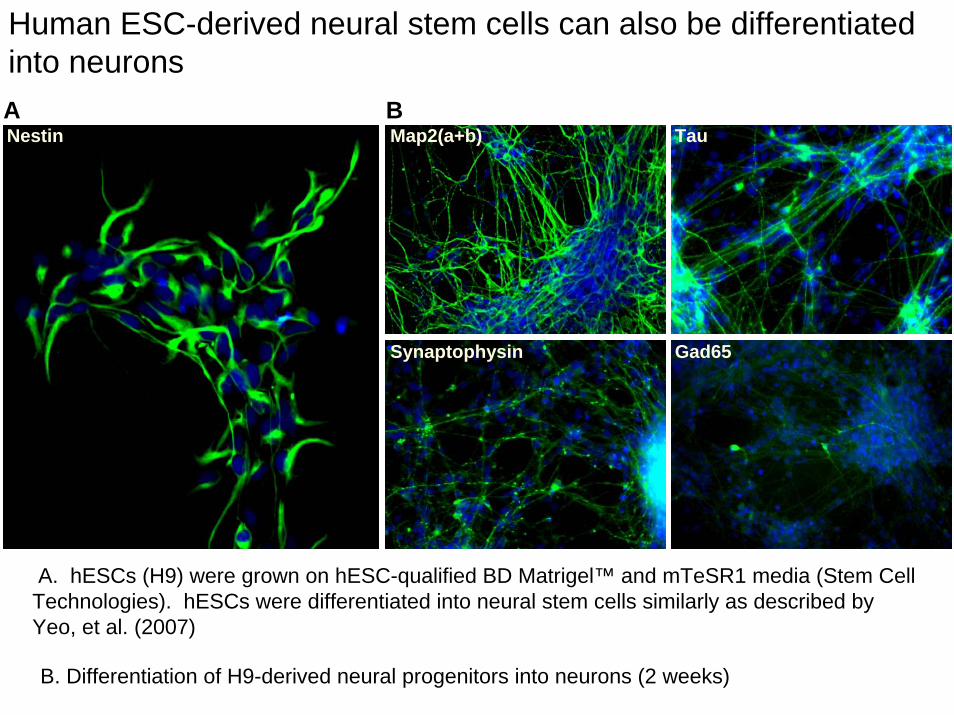
Human ESC-derived neural stem cells can also be differentiated into neuronsA B
Map2(a+b) TauNestin
Synaptophysin Gad65
A. hESCs (H9) were grown on hESC-qualified BD Matrigel™ and mTeSR1 media (Stem Cell Technologies). hESCs were differentiated into neural stem cells similarly as described by Yeo, et al. (2007)
B. Differentiation of H9-derived neural progenitors into neurons (2 weeks)

Finding New Stem Cell Markers using Flow Cytometry
For Research Use Only. Not for use in diagnostic or therapeutic procedures.Class I (1) Laser Products
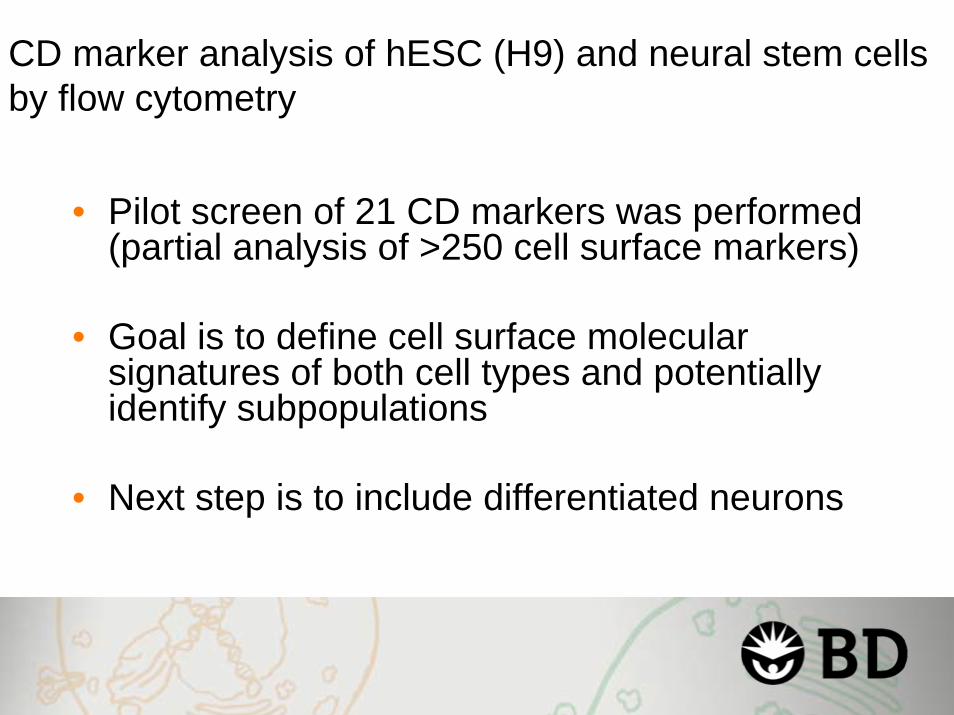
CD marker analysis of hESC (H9) and neural stem cells by flow cytometry
• Pilot screen of 21 CD markers was performed (partial analysis of >250 cell surface markers)
• Goal is to define cell surface molecular signatures of both cell types and potentially identify subpopulations
• Next step is to include differentiated neurons

ABCG2
NSCH9
Signal to Noise over Isotype control
Hu ESC (H9)NSC
0.05.0
10.015.020.025.030.035.0
CD184
ABCG2MDREGFRCD15NGFR
S/N
0.050
150
250
350
450
CD56
Representative data Significance
0.020.040.060.080.0
100.0
CD9CD81
S/N
CD81
Potential markers of pluripotency
Potential markers of neuroectoderm,NSC or of adult SCbut not of pluripotentstem cells
High in hESC, negative in NSC
High in NSC, negative to low in hESC
CD marker analysis of hESC (H9) and neural stem cells by flow cytometry

Phosphorylation Studies
For Research Use Only. Not for use in diagnostic or therapeutic procedures.Class I (1) Laser Products

Cell Surface and Intracellular Staining for Flow Cytometry
Fix Permeabilize Stain(primary conjugatedAbs in PBS, 1%BSA)
Analyze
Treatments
Thorough development of fixation protocols for cell lines and whole blood (immediately out of fresh samples).
Verified
p38 MAPKJNK, cJunAKT, PIP2, PIP3,PKCα/β/θ/δ, RskRaf, Mek, ERK, ELKRsk, Creb,STATs, SRCCREB, cJUN, IKKαp53 s15, s20 s37, s392Pyk2, Shc, Fak, SrcSlp76, Zap70, Syk, Lat, Vav,Lck, PLCγBeta-integrins
>80 specificities
‘working’
EGFRPDGFRcKitVEGFRPKARBNFATNF-κB p65CaveolinPaxillinFLT3MEKS

p-Stat6
p-St
at1
Cell Surface and Intracellular Staining for Flow Cytometry
Fix Permeabilize Stain(primary conjugatedAbs in PBS, 1%BSA)
Analyze
Analysis Steps:1. Identify live cells2. Identify cell type3. Evaluate cell signal
Treatments
1. State-specific antibodies: phospho-specific antibodies and others
2. Adopting entirely new fluorophores
3. Generation of efficient conjugation, purification, and testing protocols

Activation of STAT3 is Essential for Self-Renewal of Mouse Embryonic Stem Cells
- NiwaH. et al. Gene & Dev. 12, 2048, 1998- Raz R. et al. PNAS, 96, 2846, 1999- Matsuda T. et al. EMBO J. 18, 4261, 1999
© 2001 Terese Winslow, Lydia Kibiuk
http://stemcells.nih.gov/staticresources/info/scireport/PDFs/appendixb.pdf
• Mouse ES cells can be maintained in a proliferativeundifferentiated state in vitro with the addition of LIF into the culture medium
• LIF binds to a two-part receptor complex composed of the LIF receptor and the gp130 receptor
• The binding of LIF triggers the activation of STAT3

LIF-Dependent STAT3 Signaling Can Be Measured Using BD™ Phosflow Technology
STAT3 (pY705)
Total STAT3
- + LIF
Mouse ES + LIF
Starve 12h - LIF
-/+ LIF 30 min
PhosflowWesternBlot
No LIF+ LIF
1 10 100 1000 10000Stat3 (pY705)-PE
0
20
40
60
80
100
% o
f Max
PE Stat3 (pY705)
Intrathymic T-cell Development
For Research Use Only. Not for use in diagnostic or therapeutic procedures.Class I (1) Laser Products
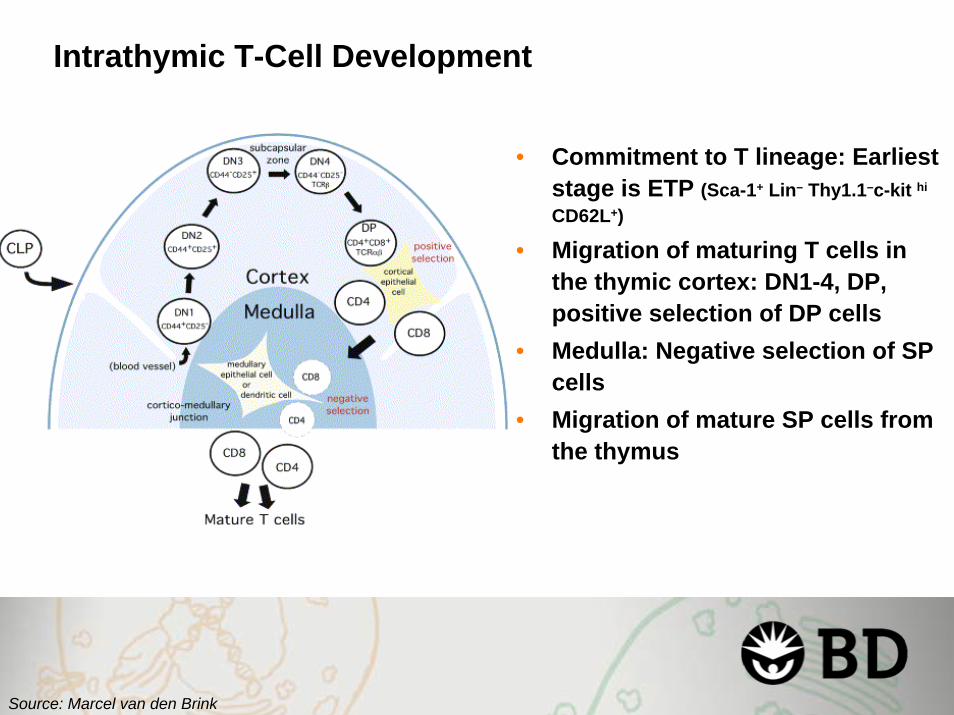
Intrathymic T-Cell Development
• Commitment to T lineage: Earliest stage is ETP (Sca-1+ Lin– Thy1.1–c-kit hi
CD62L+)
• Migration of maturing T cells in the thymic cortex: DN1-4, DP, positive selection of DP cells
• Medulla: Negative selection of SP cells
• Migration of mature SP cells from the thymus
Source: Marcel van den Brink

MA
PK P
athw
ayST
ATs
Apo
ptos
is
Normal B6 Thymus

T-Cell Development on OP9-DL1 Cells
• OP9-DL1: Murine BM stromal cell line that has been retrovirallytransduced to express the Notch 1 receptor ligand Delta-like 1 (DL1)
• Culture of HSC on OP9-DL1 cells in the presence of IL-7 and FLT3L induces T-cell differentiation
Adoptive transfer into allogeneic HSCT recipients
In vitro analysis
Zúñiga-Pflücker JC.Nat Rev Immunol 2004;4:67-72.Marcel van der Brink, Sydney Lu

T-Cell Development from Adult Murine BM Derived HSC In Vitro Using OP9-DL1 Cells Generates Primarily DN2-DN3 Precursors
Marcel van der Brink, Sydney Lu

OP9-DL1 Derived T-Cell Precursors

Summary of Findings for the Thymus
• DP thymocytes: Low signaling profile• DN1/DN2 thymocytes: Increased Raf,
Jnk, p38, Akt, and STAT-4 and -5 signaling
• DN and SP thymocytes phosphorylateSTAT-5A in response to challenge with IL-7

1
2
3
Acknowledgments
BD Biosciences• Christian Carson• Frederick Princen• Guo-Jian Gao• Li Li• Chad Sisouvanthong• Jerome Zawadski• Anissa Agadir
Memorial Sloan Kettering Cancer Center• Sydney Lu• Onder Alpdogan• Marcel van den Brink
Stanford University• Peter Krutzik• Garry Nolan

Technical Support (US)e-mail: [email protected]
Phone: 877-232-8995prompts #3, then #2
Please visit our Stem Cell Source web page:www.bdbiosciences.com/stemcellsource/