Analyzing the Factors that Lead to Housing and ...
119
Western Kentucky University TopSCHOLAR® Masters eses & Specialist Projects Graduate School 5-2013 Analyzing the Factors that Lead to Housing and Construction Cost Escalation: A Case Study Focused on Riyadh, Saudi Arabia Abdulaziz Saleh Alfouzan Western Kentucky University, [email protected] Follow this and additional works at: hp://digitalcommons.wku.edu/theses Part of the Construction Engineering Commons , and the Urban, Community and Regional Planning Commons is esis is brought to you for free and open access by TopSCHOLAR®. It has been accepted for inclusion in Masters eses & Specialist Projects by an authorized administrator of TopSCHOLAR®. For more information, please contact [email protected]. Recommended Citation Alfouzan, Abdulaziz Saleh, "Analyzing the Factors that Lead to Housing and Construction Cost Escalation: A Case Study Focused on Riyadh, Saudi Arabia" (2013). Masters eses & Specialist Projects. Paper 1231. hp://digitalcommons.wku.edu/theses/1231
Transcript of Analyzing the Factors that Lead to Housing and ...

Western Kentucky UniversityTopSCHOLAR®
Masters Theses & Specialist Projects Graduate School
5-2013
Analyzing the Factors that Lead to Housing andConstruction Cost Escalation: A Case StudyFocused on Riyadh, Saudi ArabiaAbdulaziz Saleh AlfouzanWestern Kentucky University, [email protected]
Follow this and additional works at: http://digitalcommons.wku.edu/theses
Part of the Construction Engineering Commons, and the Urban, Community and RegionalPlanning Commons
This Thesis is brought to you for free and open access by TopSCHOLAR®. It has been accepted for inclusion in Masters Theses & Specialist Projects byan authorized administrator of TopSCHOLAR®. For more information, please contact [email protected].
Recommended CitationAlfouzan, Abdulaziz Saleh, "Analyzing the Factors that Lead to Housing and Construction Cost Escalation: A Case Study Focused onRiyadh, Saudi Arabia" (2013). Masters Theses & Specialist Projects. Paper 1231.http://digitalcommons.wku.edu/theses/1231


ANALYZING THE FACTORS THAT LEAD TO HOUSING AND CONSTRUCTION
COST ESCALATION: A CASE STUDY FOCUSED ON RIYADH, SAUDI ARABIA
A Thesis
Presented to
The Faculty of the Department of Architectural and Manufacturing Sciences
Western Kentucky University
Bowling Green, Kentucky
In Partial Fulfillment
Of the Requirements for the Degree
Master of Science
By
Abdulaziz Saleh Abdulaziz Alfouzan
May 2013


I dedicate this thesis to my parents who are a great inspiration to me. Also, I dedicate this
thesis to my sisters, brothers, my wife, and my son.

iv
ACKNOWLEDGEMENTS
First, I thank Allah for His guidance and the completion of this work. I want to
thank and express my gratitude to my committee chair, Dr. Ahmed Khalafallah, for his
personal and academic guidance. Thank you to my other committee members, Dr. Daniel
Jackson and Dr. Bryan Reaka. Special thanks to my father, Mngr. Saleh Alfouzan, my
uncle, Mngr. Abdurrahman Alsolaim, Dr. Ahmed Alsolaim, Eng. Abdulmajeed Alsolaim,
and my brother Bader for their valuable help toward the collection of data for this thesis.

v
TABLE OF CONTENTS
CHAPTER 1: INTRODUCTION ........................................................................................1
1.1 PROBLEM STATEMENT .......................................................................................3
1.2 PURPOSE OF THE STUDY ....................................................................................4
1.3 HYPOTHESES .........................................................................................................6
1.4 LIMITATIONS .........................................................................................................7
1.5 DELIMITATIONS ...................................................................................................7
1.6 ASSUMPTIONS .......................................................................................................7
1.7 RESEARCH ORGANIZATION ..............................................................................8
CHAPTER 2: LITERATURE REVIEW .............................................................................9
2.1 INTRODUCTION ....................................................................................................9
2.2 OVERVIEW OF THE GCC INDUSTRY ..............................................................10
2.3 OVERVIEW OF THE INDUSTRY OF SAUDI ARABIA ...................................13
2.3.1. OVERVIEW OF THE INDUSTRY .................................................................................13
2.3.2. PESTLE ANALYSIS OF SAUDI ARABIAN INDUSTRY ...................................................14
2.3.3. MARKET SIZE AND SHARES .....................................................................................16
2.3.4. MARKET FORECASTS .............................................................................................17
2.4 COMPARISON BETWEEN SAUDI ARABIA AND GCC COUNTRIES ..........21
2.4.1. COMPARISON BETWEEN THE ECONOMIC CONDITIONS OF SAUDI ARABIA AND GCC
COUNTRIES ...........................................................................................................................21
2.4.2. COMPARISON OF CONSTRUCTION COSTS BETWEEN SAUDI ARABIA AND OTHER GCC
COUNTRIES ............................................................................................................................23
2.4.3. PROFIT MARGIN OF SAUDI ARABIA AND OTHER GCC COUNTRIES ............................24

vi
2.5 FACTORS THAT LED TO THE ESCALATION OF HOUSING AND
CONSTRUCTION COSTS ...............................................................................................27
2.5.1. ECONOMIC FACTORS .............................................................................................28
2.5.2. GEOGRAPHIC, DEMOGRAPHIC AND SOCIAL FACTORS .............................................29
2.5.3. FINANCE AND FUNDING FACTORS ..........................................................................32
2.5.4. ENVIRONMENTAL FACTORS ....................................................................................33
2.5.5. OTHER FACTORS ..................................................................................................34
2.6 STRATEGIES TO MINIMIZE COSTS .................................................................37
CHAPTER 3: METHODOLOGY .....................................................................................39
3.1 INTRODUCTION ..................................................................................................39
3.2 PARTICIPANTS ....................................................................................................40
3.3 SURVEY FACTORS AND THE METHOD OF ANALYZING DATA ..............41
CHAPTER 4: DATA COLLECTION AND ANALYSIS.................................................43
4.1 SAMPLE SIZE .......................................................................................................43
4.2 DATA ANALYSIS OF THE FACTORS ...............................................................44
CHAPTER 5: RESULTS AND RECOMMENDATIONS................................................70
5.1 THE GOAL OF RESULTS ....................................................................................70
5.2 RESULTS OF THE SURVEY ...............................................................................71
5.3 MOST INFLUENTIAL FACTORS AND RECOMMENDATIONS TO
ADDRESS THEIR EFFECTS ...........................................................................................74
5.4 ADDITIONAL THOUGHTS FROM THE SURVEY/EXPERTS ........................80
CHAPTER 6: SUMMARY AND CONCLUSION ...........................................................81
6.1 SUMMARY ............................................................................................................81

vii
6.2 CONCLUSION .......................................................................................................83
6.3 RECOMMENDATIONS FOR FUTURE WORK .................................................85
APPENDIX - A = TEST SURVEY ...................................................................................86
APPENDIX - B: COLLECTED DATA ............................................................................88
REFERENCES ..................................................................................................................98

viii
LIST OF FIGURES
Figure 1. GCC Construction Contract Awards ................................................................ 10
Figure 2. Construction Sector as % of GDP .................................................................... 11
Figure 3. Top 100 Project Value: US $ 1,206 bn.............................................................. 12
Figure 4. Top 100 Project Value: US $ 625 bn................................................................. 13
Figure 5. Saudi Construction Industry Budget Totals by Sector ...................................... 16
Figure 6. Total Contracts Awards Across Major Focus Sectors ...................................... 17
Figure 7. Oil & Gas Construction Contract Awards (US $ Million) ................................ 18
Figure 8. Power and Water Construction Contract Awards ............................................. 19
Figure 9. Building Construction Sector Contract Awards (US$ Million) ........................ 20
Figure 10. Infrastructure Construction Contract Awards (US$ Million) .......................... 20
Figure 11. Total Real GDP Growth, 2008-2011 ............................................................... 22
Figure 12. Non- oil Real GDP Growth, 2008-2011 .......................................................... 22
Figure 13. GCC Cement Construction Share ................................................................... 25
Figure 14. Cement Cost per Tonne (US $ per tonne) ....................................................... 26
Figure 15. GCC Cement Industries Gross Margins ......................................................... 26
Figure 16. Impact of oil prices on construction costs’ increase ........................................ 45
Figure 17. Impact of increasing demand of construction’s materials on housing costs ... 46
Figure 18. Effect of increasing demand of engineering services of public work on housing
costs................................................................................................................................... 48
Figure 19. Impact of high demand of housing on construction’s costs ............................ 49
Figure 20. Impact of poor construction’s productivity on housing costs ......................... 51
Figure 21. Effect of rapid rise in the rate of population’s growth on construction costs.. 52

ix
Figure 22. Impact of monopoly and other unethical practices of suppliers on housing’s
costs................................................................................................................................... 54
Figure 23. Impact of lack of trained labor on construction’s costs ................................... 55
Figure 24. Effect of government’s poor role in monitoring material’s prices on housing
costs................................................................................................................................... 57
Figure 25. Effect of poor inspection and monitoring system of government projects on
housing costs ..................................................................................................................... 58
Figure 26. Effect of existence black market on construction and housing’s costs. .......... 60
Figure 27. Effect of high inflation rate on housing and construction’s costs ................... 61
Figure 28. Impact of contractors who undertake projects beyond their capacity on
housing’s costs .................................................................................................................. 63
Figure 29. Effect of speculative purchase of undeveloped lands on housing and
construction’s costs ........................................................................................................... 64
Figure 30. Influence of corruption in assigning/selling undeveloped lands on housing
cost. ................................................................................................................................... 66
Figure 31. Impact of exporting construction’s materials on housing costs ...................... 67
Figure 32. Modes of factors (Ascending order) ................................................................ 71
Figure 33. Means of factors (Ascending order) ................................................................ 72

x
LIST OF TABLES
Table 1. Oil price escalation ..............................................................................................45
Table 2. Statstical analysis of responses to question 1 ......................................................45
Table 3. Increasing demand for construction materials .....................................................47
Table 4. Statstical analysis of responses to question 2 ......................................................47
Table 5. Increasinf demand for engineering services ........................................................48
Table 6. Statstical analysis of responses to question 3 ......................................................48
Table 7. High demand for housing ....................................................................................50
Table 8. Statstical analysis of responses to question 4 ......................................................50
Table 9. Poor construction productivity.............................................................................51
Table 10. Statstical analysis of responses to question 5 ....................................................51
Table 11. Rapid rise in the rate of population growth .......................................................53
Table 12. Statstical analysis of responses to question 6 ....................................................53
Table 13. Monopoly and unethical practices of suppliers .................................................54
Table 14. Statstical analysis of responses to question 7 ....................................................54
Table 15. Lack of trained labor ..........................................................................................56
Table 16. Statstical analysis of responses to question 8 ....................................................56
Table 17. Governmant’s poor role in materials prices .......................................................57
Table 18. Statstical analysis of responses to question 9 ....................................................57
Table 19. Poor inspection and monitoring of government projects ...................................59
Table 20. Statstical analysis of responses to question 10 ..................................................59
Table 21. Existance of a black market ...............................................................................60
Table 22. Statstical analysis of responses to question 11 ..................................................60

xi
Table 23. High inflation rate ..............................................................................................62
Table 24. Statstical analysis of responses to question 12 ..................................................62
Table 25. Contractors undertaking projects beyond their capacity ....................................63
Table 26. Statstical analysis of responses to question 13. .................................................63
Table 27. Speculative purchase of undeveloped lands ......................................................65
Table 28. Statstical analysis of responses to question 14 ..................................................65
Table 29. Corruption in selling/assigning of undevloped lands ........................................66
Table 30. Statstical analysis of responses to question 15. .................................................66
Table 31. Exporting construction materials ......................................................................68
Table 32. Statstical analysis of responses to question 16 ..................................................68
Table 33. Summary of frequencies, mean, mode, and standard deviations for factors .....69
Table 34. Ranks of factors .................................................................................................73

xii
ANALYZING THE FACTORS THAT LEAD TO HOUSING AND CONSTRUCTION
COST ESCALATION: A CASE STUDY FOCUSED ON RIYADH, SAUDI ARABIA
Abdulaziz Saleh Alfouzan May 2013 103 Pages
Directed by: Dr. Ahmed Khalafallah, Dr. Daniel Jackson, and Dr. Bryan Reaka
Department of Architectural & Manufacturing Sciences Western Kentucky University
Riyadh city suffers from high housing and construction costs, which have
increased by more than 200% over the last 7 years. This problem led to a significant
interest from the government and the citizens of the city in understanding the causes of
housing and construction cost escalation and the best strategies to address this problem in
the short and long-terms, in order to find solutions for affordable housing.
In response to the absence of research regarding this problem, the researcher has
decided to conduct a scientific survey about the factors that might have led to this
problem in Riyadh. While conducting the literature review, the researcher identified 16
possible factors that were mentioned as possible causes for this problem. Thus, the main
objective of this study is to identify the main factors that affect housing cost escalation.
All of the survey samples were collected from construction industry professionals
and experts working in Riyadh. The sample size required was calculated using the
statistical equation mentioned in Chapter 4, and based on an estimated level of
confidence of 90%, standard error of 10%, and a standard deviation calculated from 30
random samples collected initially. The required sample size was estimated to be at least
215 surveys, and the researcher was able to collect a total of 237 surveys.
After collecting the data, the researcher analyzed the data through Microsoft
Excel software by applying descriptive statistics, means, modes, and standard deviations.
Tables and figures have been used to show the results of the survey. After analyzing the

xiii
data, the researcher identified the main factors based on the mode and mean averages.
The researcher has identified four major impacting factors that affected housing and
construction costs.
The most impacting factors on housing and construction cost are the corruption in
selling land, speculative purchases of land, high demand for housing, and the high
population growth rate in Riyadh. The main recommendations that should help the
government to solve this problem are: to apply an annual tax on large plots, prevent
speculative purchases in housing areas, monitor the prices of construction materials, and
revive small cities around Riyadh to reduce congestion and crowding.

1
CHAPTER 1
INTRODUCTION
The dream of each Saudi citizen is to own his own house. However, economic
problems began to arise in Saudi Arabia six years ago that have made this dream very
difficult to achieve. These problems are complicated, so each specialist in the field of
housing and construction holds a unique opinion regarding the main causes of the
problems. The main obstacle that consumers face at present is the drastic increase in
housing and construction prices in the mega cities of Saudi Arabia. The present study
focuses specifically on housing and construction in Riyadh, Saudi Arabia.
Saudi Arabia’s main industry is the production of oil. Now that Saudi Arabia’s
mega cities of Riyadh, Jeddah and Dammam are receiving a great influx of residents,
construction and housing has become the country’s second largest field after the oil field.
The growth of this field has come with a sudden rise in the prices of construction and
housing, especially in Riyadh. This increase has been so problematic that “The prices of
construction materials are the next crisis of the Saudi real estate market” (Alhwish,
2010). The causes of these high prices have yet to be investigated, and they could be
numerous and intertwined. The primary objective of this thesis is to investigate the
critical factors that led to a drastic increase in housing and construction prices in such a
short time. In the past, on average, anyone who aspired to own a house in Riyadh needed
more than ten years to complete the payments to own a house. For example, in 2006, a
Saudi citizen could buy a house with 4305 square feet for about 155,000 USD, but the
same house now costs at least 320,000 USD. This increase has surprised all citizens,
because it has occurred over the course of a mere five years. The houses are much more

2
expensive because the construction workers, construction materials, land and other
components of housing have become very expensive to hire/purchase. One of the many
unfortunate knock-on effects of this increase is that many new houses are of abysmally
poor quality. Some companies are offering cheaper prices, but they cannot afford to
purchase decent materials or to hire skilled workers while relying on this marketing
strategy.
One of the main problems of the construction and housing industry may be
attributed to the influence of the country’s main industry, oil. Badran (2012) observed,
“Expectations of rising prices of building materials are in line with the rise of oil.” As the
oil price increases it creates more problems, and these problems, in turn, increase the
construction and housing prices even more. Therefore, the relationship between high oil
prices and problems in the housing and construction industry is positive (directly
proportional). The crisis needs to be resolved soon, as it is making itself more
complicated as time progresses. Moreover, these problems make it difficult for
economists to apply any method for decreasing the prices. For example, the persistent
immigration from small cities to the mega cities with the high population growth will
only continue to intensify demand. Now that the problem is complicated and out of
control, finding the solution can not be easy or quick. Taking more time to apply the right
solution will allow the problem to get even more difficult, so accurate research is
preferable to the slower process of blind trial and error in this situation.

3
1.1 Problem Statement
The aim of this study is to define and identify the causes of the increase in
construction cost in Riyadh. In light of these findings, this thesis has recommended ways
to keep the prices under control, which will, on return, increase the quality of future
buildings (output). In addition, the study has offered ideas for making the construction
processes more professional. Overall, the study aims to find out how to stabilize the
housing market with the impacted factors.
The thesis has focused on evaluating the factors that are expected to impact the
construction cost by gathering data from surveys with construction companies. The
factors that the surveys have investigated are, 1) the increase in oil prices (Badran, 2012
and Alsafhan, 2011), 2) the large demand for construction materials and labor due to
government projects for housing (thus far, the government has subsidized 500,000
houses) (Alhwish, 2010, Arabian business, 2012), 3) the high demand for development of
public works projects, such as schools, hospitals, and infrastructure (Aljaliedy, 2011 and
Albaqamy, 2012), 4) the high demand for housing and construction by Saudi citizens
(Saudieconomicsurvey, 2012, Aljaliedy, 2011, and Arabian business, 2012), 5) the Low
supply of housing (Saudieconomicsurvey, 2012), 6) A rapid rise in the rate of population
growth (Arabian business, 2012), 7) the manipulation and monopoly of suppliers of
cement, steel and other construction materials (Alhwish, 2010), 8) the lack of trained
labor (Albaqamy, 2012), 9) the absence of the government in monitoring prices
(Alhwish, 2010), 10) corruption in monitoring government projects, 11) the existence of
a black market (Althunian, 2012), 12) the high inflation rate, 13) contractors who are
taking projects beyond their capacity (Alfawzan, 2012), 14) the Speculative purchase of

4
undeveloped lands (Aleqtesadya, 2012), 15) corruption in selling undeveloped lands, and
16) the exportation of construction materials outside of Saudi Arabia (Alhwish,2010).
1.2 Purpose of the Study
Saudi Arabia suffers from deep problems that underlie housing and construction
companies, so this thesis aspires to reveal the main hidden factors of these problems. One
of the reasons is population growth. Specifically, the average age in Riyadh is a mere 18
years. Moreover, Saudi Arabia’s population growth rate is 2.90 % (Central Department of
Statistics and Information, 2012). Oil prices also seem to be an enormous factor, because
a higher oil price will make everything else cost more, such as transportation of
personnel, shipping of materials, manufacturing and so on. Another factor is the
underlying economic problems, such as inflation. In addition, government projects, such
as subsidized schools and hospitals that help to cover the high population growth, seem to
be contributing to higher prices. Likewise, a greater number of projects for public works
might be another factor. The aforementioned factors, among others, have led to a 200%
increase in the prices of construction and materials in only three years. Ten to fifteen
years ago, an individual who owned a house in Saudi Arabia was considered a member of
the middle income class, but not even middle income class members can buy a house
these days. A brief overview of the population in Riyadh revealed that most people do not
have enough money to build a house because of the increase in construction costs.
Moreover, the rental prices have also skyrocketed in the three mega cities. More and
more people are turning to apartments when they find that they cannot acquire a house,
thus increasing the demand for apartments and making the real estate prices worse all
across the board. The researcher believes that real estate’s problem can be fixed in a few

5
years, whereas the construction companies and housing’s problems will take more time.
A quick solution is needed now because the situation is currently out of control. Thus, the
purpose of the study is to find accessible solutions to the issues mentioned above,
because “Prices of construction materials are going into the unknown…and the citizens
wonder about the role of the government” (Aljaliedy, 2011). Moreover, attempting to
eliminate the problem without looking at its causes will only make it worse and will
entail a disaster to the Saudi people, because staying in rental apartments is not
acceptable socially on the long term. The Saudi government has tried to solve this issue
without doing research. The government simply built 500,000 housing units for Saudi
citizens, but this solution obviously costs a lot of money, and, even worse, contributes to
the problem. The Saudi government needs to know the real factors and how to address
them in order to rectify the problem. Also, the thesis has investigated the key factors that
led to this escalation, how to decrease the construction prices, and how to support the
Saudi government in solving the problem.
The rationale of the thesis is to find the main factors and reasons for the
skyrocketing housing and construction prices. The methodology has utilized quantitative
research, and the researcher used a survey to conduct interviews with construction
companies. The survey asked experts from construction companies to evaluate a list of
probable factors on a scale of 1 to 5. The researcher adapted a list from the literature
review regarding the potential causes and effects of the increased prices. In addition, the
experts themselves had the opportunity to report additional factors, if deemed necessary.
This methodology is expected to reveal the main factors that led to the construction and
housing problems.

6
1.3 Hypotheses
By examining the literature, the researcher has extracted the factors that could be
behind the escalation of housing and construction prices. The analysis of these factors has
been conducted using a survey. The following factors have been identified and the main
hypothesis is that they all contribute to the escalation of costs.
1) Escalation of Oil Prices: The increase in world oil demand in the past ten years, nearly
50 percent increase, led to the escalation of oil prices.
2) High Demand for Housing and Construction: This category includes high demand
from, a) Saudi citizens, b) government housing projects, c) government public
projects.
3) Low Housing Supply: This category includes the increase of annual demand for
housing units and the low supply of housing units.
4) Rapid Rise in Population Growth: This category includes the high growth rate of Saudi
population with more than 3% in the past 10 years.
5) Shortage of Construction Resources: This category includes, a) manipulation and
monopoly of the suppliers of cement, steel and other construction materials, b)
lack of trained labor, c) black Market, d) export of construction materials outside
of Saudi Arabia.
6) Speculative Purchase of Undeveloped Lands: This category includes corruption in the
selling process of undeveloped lands.
7) High Inflation Rate: This category includes the continuous increase in construction
materials regarding the inflation factor.

7
8) Other Factors, such as: the absence of government’s role in monitoring prices,
corruption in monitoring government projects, and contractors who take projects
beyond their capacity.
1.4 Limitations
The factors that the researcher included in the survey come solely from the
literature review, so the survey could be overlooking some other factors. However, these
factors can be identified through surveying the experts. Also, this survey has solicited the
opinion of a limited number of experts (companies, specialists and engineers), so it may
not capture the opinion of all experts in Saudi Arabia.
1.5 Delimitations
The researcher relied on the literature review of the survey, assuming that the
literature is up to date, and the present study is about the current situation in Riyadh,
Saudi Arabia. In addition, the study is only about residential buildings (houses and
apartments), which are the focus of the literature.
1.6 Assumptions
This study comes mainly from the information in the literature, which means that
the researcher assumed that a literature review has revealed the reasons and factors of
high housing prices. Also, people who have received the survey are assumed to be
knowledgeable of the situation and would be unbiased in their opinion.

8
1.7 Research Organization
Chapter 2:
This chapter presents a literature review regarding the current situation of
construction and housing market in Saudi Arabia. The literature review focuses on
identifying the factors that contribute to construction cost escalation. Also, it includes a
review of literature on inflation and its effect on cost escalation.
Chapter 3:
This chapter presents the methodology that has been utilized to analyze the data
of the survey. It includes:
1) The methodology of identifying the factors.
2) How to identify the experts who could help complete the survey.
3) The appropriate methods to analyze the data.
Chapter 4:
This chapter presents the collected data and the responses received from the
experts regarding the questions in the survey.
Chapter 5:
This chapter presents the analysis of the collected data. The data has been
analyzed through appropriate methods to determine the importance and relative
significance of the factors.
Chapter 6:
This chapter summarizes the thesis, shows the results of the analysis, and
discusses the future research directions on this subject.

9
CHAPTER 2
LITERATURE REVIEW
2.1 Introduction
This chapter is focused on providing information gained from different sources
and authors in order to gain insights regarding the housing and construction cost
escalation in Saudi Arabia.
This literature review section focuses on providing information regarding the Gulf
Cooperating Council (GCC) countries. The aim is to identify the importance of the
position of Saudi Arabia in GCC. To do so, an overview of the GCC construction
industry is provided along with PESTLE analysis of Saudi Arabia. Furthermore, Saudi
Arabia’s construction industry is compared to the rest of the GCC countries to identify
the country that has the most potential growth. This comparison provides information
regarding the construction cost in Saudi Arabia and the rest of GCC countries along with
the level of profits earned by these countries.
In addition, certain factors were evaluated and analyzed to identify the key factors
of cost escalations in housing and construction industry in Saudi Arabia. The factors that
were analyzed include economic, geographic, demographic, social, and other
environmental factors to provide accurate and reliable information regarding the cost
escalations in Saudi Arabia’s construction industry. In the end, some strategies are
proposed to help Saudi Arabia’s construction industry reduce its construction and
housing costs.

10
2.2 Overview of the GCC Industry
With Saudi Arabia, United Arab Emirates, Qatar, Oman, Bahrain and Kuwait
being a part of GCC, construction contracts worth USD 50 billion were awarded to
contractors in the first quarter of 2011 (Deloitte, 2012a). The breakup of these contracts is
shown in figure 1:
Figure 1. GCC Construction Contract Awards (data from Deloitte, 2012a)
The GCC flourished from the year 2003-2008 due to the spectacular increase in
the oil prices. With an increase in oil prices, the cost of construction also increased to
about 60 percent particularly in Dubai (Meed Cost Indices, 2012a). In order to stabilize
the economy to create a more balanced state, several projects were initiated with
construction being the major priority of GCC. The major hurdles for these projects were
observed during the global economic crisis of 2008 where most of these initiated projects
had to be cancelled or kept on hold. However, with the recovery of the economy it was
predicted that the construction sector would be provided with outstanding growth
opportunities in the forthcoming years (Meed Cost Indices, 2012a).

11
With the passage of time, the construction sector has shifted its focus from small and
simple projects to more sophisticated and complex projects that require investments of
billions of dollars. Such projects involve complex civil work, electromechanical systems
and vital infrastructure to attract foreign and local investors. Construction companies rely
on specialized and experienced sub-contractors to conduct these mega projects. Such
projects have attracted many businessmen who are interested in investing in these
projects. During the year 2006-2010, it was observed that UAE the percentage of
construction sector in GDP increased from 8.9 percent to 11.5 percent in the year 2010
(Alpen Capital, 2012), this is reflected in figure 2:
Figure 2. Construction Sector as % of GDP (data from Alpen Capital, 2012)
With the investment of USD 9 billion, UAE is now the second largest market of
construction sector in GCC. On the other hand, Qatar has shown tremendous
improvements on its economy. “Qatar has the fastest growing economy in GCC region
with about 8 percent share of the total value of projects.” (USD 500 billion (Deloitte,
2012)).

12
In the year 2011, it was observed that complex construction projects were still top
priority of GCC even after double-dip recession and challenging economic environment.
The GCC was able to remain stable at USD 1.8 trillion (Alpen Capital, 2012). It is also
worth mentioning that the construction and real estate projects occupied around 51.8
percent share in the overall value of the top 100 projects in the GCC region (Alpen
Capital, 2012), as shown in figure 3:
Figure 3. Top 100 Project Value: US $ 1,206 bn (data from Alpen Capital, 2012)
In 2011, UAE was ranked the highest country in with total worth of projects in
USD 319.1 billion followed by Saudi Arabia with USD 218.9 billion (Alpen Capital,
2012), as shown in figure 4:
Infrastructure,
1.80% Others, 3.40%
Real Estates
and
Construction,
51.80%
Oil & Gas,
15.80%
Transport,
11.80%
Industry, 5.20%
Petrochemicals,
5.40% Power, 4.80%

13
Figure 4. Top 100 Project Value: US $ 625 bn (data from Alpen Capital, 2012)
2.3 Overview of the Industry of Saudi Arabia
2.3.1. Overview of the industry
Saudi Arabia has the largest economy of GCC industry and has been taking the
lead in investing in the construction sector followed by UAE. The construction sector in
Saudi Arabia accounts for almost 8 percent of the GDP. The major construction activities
are taking place in the cities of Riyadh, Jeddah and Dammam. These three major cities
account for almost three-fourths (75) percent of construction activities in Saudi Arabia
(Al-Nagadi, 2010).
Oman, 3.20%
UAE, 51.10% Saudi Arabia,
35.00%
Qatar,
8.90%
Kuwait, 1.80%

14
2.3.2. PESTLE Analysis of Saudi Arabian industry
In order to gain insights regarding the Saudi Arabian industry, it is essential to
conduct PESTLE analysis. PESTLE is an acronym for Political, Economic, Socio-
cultural, Technological, Legal and Environmental. The PESTLE analysis of Saudi
Arabian industry is as follows:
Political
The government’s commitment is one of the most crucial factors that
contributed to the success of Saudi Arabian construction industry. It was clear that
during the economic crisis, the government of Saudi Arabia remained committed
to supporting and enhancing the construction sector by providing the sector with
investments of USD 80 billion. The aim behind such investments was to tune up
the growth of the development and diversification programs in Saudi Arabia
(Ventures, 2011).
Economical
The stabilized economy of Saudi Arabia is another major positive factor
for Saudi Arabian construction industry. Lower inflation costs and raw material
costs are some of the major elements for such stable economy. With the
government’s commitment and financial backing, the Saudi Arabian construction
sector is sure to grow (Asad, 2012).
Socio-cultural
The Saudi Arabian construction industry embraces socio-cultural factors. This can
be observed as younger workers are entering the construction business. The

15
growth in population is another factor as such population demands the
construction industry to develop in the long-run (Ventures, 2011).
Technological
With latest technology available in Saudi Arabian construction industry,
the growth of this particular sector is inevitable. With the availability of such
technology, Saudi Arabia was able to attract several investors who are particularly
interested in the growth of the construction industry in the forthcoming years
(Ventures, 2011).
Legal
In order to promote the construction sector, laws and regulations at Saudi
Arabia were simplified to enable businesses to start construction without any
delay due to complex laws and regulations. The Saudi Arabian government also
allowed businesses to open new businesses with 100 percent of foreign
investment. Mortgage law has been made more lenient to boost the demand of
residential segment along with home financing (Ventures, 2011).
Environmental
With an intention to take the environmental factor into consideration, the Saudi
Arabian government is planning on spending about USD 39.9 billion on the
construction of smart buildings that could promote long-term sustainability and
reduce dioxide emission. Through the construction of such smart buildings, the
Saudi Arabian government aims to reduce the amount of waste and the water
usage (Ventures, 2011).

16
2.3.3. Market Size and shares
As per January 2011, the market size of Saudi Arabian construction industry
based on budget total is reflected in figure 5:
Figure 5. Saudi Construction Industry Budget Totals by Sector (US $ Million), January
2010, (data from Ventures, 2011)
It was observed that 50 percent of the total budget of Saudi Arabia was allocated
to the construction sector. The budget allocation for oil and gas construction was only 17
percent followed by industrial construction with an allocation of 13 percent. It was also
noted that the budget allocation for infrastructure; power and water, pipeline and marine
had a single digit i.e. 9 percent, 8 percent, 2 percent and 1 percent respectively (Ventures,
2011).
Infrastructure
9%
Oil and Gas
17%
Pipe Line
2%
Industrial
13%
Buildings
50%
Power and
Water
8%
Marine
1%

17
Regarding the market share, it was observed that the market share was declined to
a great extent from USD 110784 million in 2011 to USD 99546 million in 2012. It was
also observed that the year 2011 was the most positive year for the Saudi Arabian
construction industry in terms of market share. The market share continuously increased
for about four consecutive years but somehow was declined in 2012 (Ventures, 2011), as
reflected in figure 6:
Figure 6. Total Contracts Awards Across Major Focus Sectors (US $ Million) (data from
Ventures, 2011)
2.3.4. Market Forecasts
It has been forecasted that Saudi Arabian construction sector, being the major
industry, will be awarded with about USD 102,069 million worth contracts for the growth
of this particular sector. (Ventures, 2011)
It has been also forecasted that the oil and gas construction sector will receive
around USD 15.4 million worth awards in the year 2013; being the last year for the
79927 84601
97780
110784
99546 102069
0
20000
40000
60000
80000
100000
120000
2008 2009 2010 2011 2012 2013
Co
ntr
acts
Aw
ard
s (U
S$
Mil
lio
n)

18
completion of construction projects, the market size will be reduced from 17.5 million in
2012 to 15.4 million in 2013 (Ventures, 2011), as shown in figure 7:
Figure 7. Oil & Gas Construction Contract Awards (US $ Million), 2008-2013 (data from
Ventures, 2011)
Regarding the market size and forecast for Saudi Arabian power and water
desalination construction, it has been forecasted that this particular construction sector
will receive an increase in contract awards from USD 15.09 million in 2012 to USD 16.3
million in 2013 (Ventures, 2011), as shown in figure 8:
16094
18586 19688
20936
17509 15438
0
5000
10000
15000
20000
25000
2008 2009 2010 2011 2012 2013
Co
ntr
acts
Aw
ard
s (U
S$
Mil
lio
n)

19
Figure 8. Power and Water Construction Contract Awards (US $ Million), 2008-2013
(data from Ventures, 2011)
For the construction of Saudi buildings, it is forecasted that the buildings’ sector
will be of high importance along with continuous increase in contract awards. It was
observed that the buildings’ sector rose from USD 30.6 million in 2008 to USD 47.1
million in 2012. It is expected that the contract awards would further increase to a great
extent i.e. USD 49.9 million in 2013, (Ventures, 2011) as shown in figure 9:
16246 14389
17825 19966
15098 16259
0
5000
10000
15000
20000
25000
2008 2009 2010 2011 2012 2013
Co
ntr
acts
Aw
ard
s (
US
$ M
iili
on
)

20
Figure 9. Building Construction Sector Contract Awards (US$ Million), 2008-2013 (data
from Ventures, 2011)
The last construction industry sector: infrastructure sector, received USD 16.5
million in the year 2012 and it is estimated that the contract award will increase to USD
17.3 million by 2013 (Ventures, 2011), as shown in figure 10:
Figure 10. Infrastructure Construction Contract Awards (US$ Million), 2008-2013 (data
from Ventures, 2011)
30675
34840
41989
46819 47195 49948
0
10000
20000
30000
40000
50000
60000
2008 2009 2010 2011 2012 2013
Co
ntr
acts
Aw
ard
s (U
S $
Mil
lio
n)
8509
13160 14948
19578
16538 17387
0
5000
10000
15000
20000
25000
2008 2009 2010 2011 2012 2013
Co
ntr
act
s A
wa
rds
( U
S $
Mil
lio
n)

21
2.4 Comparison between Saudi Arabia and GCC Countries
To compare between Saudi Arabia and other GCC countries a few key factors
should be evaluated. These factors will highlight how and why Saudi Arabia significantly
differs from Oman, Qatar, Kuwait, Bahrain and U.A.E in GCC.
2.4.1. Comparison between the Economic conditions of Saudi Arabia and
GCC Countries
With the increase in oil prices in the past years and stabilized economy, the GCC
countries have shown greater development over the years. Due to such conditions, GCC
countries have low interest rates with greater fiscal and external surpluses, moderate
consumer prices inflation, and greater and positive opportunities for growth in the
forthcoming years.
With the passage of time, the real GDP growth in 2011 outdid previous year’s
GDP growth rate. In 2011, the real GDP growth rate went high up at 7.5 percent – the
greatest real GDP growth since 2003 (IMF, 2012).
In 2009, the total real GDP of the GCC countries witnessed a decline but this
situation was soon stabilized in the year 2010 with around 6 percent. In addition, the year
2011 remained prosperous for GCC countries as the real GDP rose to 7.5 percent (IMF,
2012), as shown in figure 11:

22
Figure 11. Total Real GDP Growth, 2008-2011 (data from IMF, 2012)
The non-oil real GDP growth of the GCC countries i.e. Bahrain, Kuwait, Oman,
Qatar, Saudi Arabia and UAE shows extra-ordinary results. In the year 2011, Qatar was
the leading GCC country with the highest growth rate followed by Saudi Arabia, Oman,
Kuwait, Bahrain, and UAE, as illustrated in figure 12:
Figure 12. Non- oil Real GDP Growth, 2008-2011 (data from IMF, 2012)

23
Qatar has been taking the lead among all GCC countries in terms of non-oil sector
real GDP growth since 2008, and only in 2010 the real GDP growth rate of non-oil sector
declined to single digit but still remained the leading country among the GCC countries
(IMF, 2012).
2.4.2. Comparison of construction costs between Saudi Arabia and other
GCC countries
According to EC Harris (2012), the construction costs in Saudi Arabia are the
cheapest compared to other countries in the Middle East. On the other hand, it was also
observed that Bahrain’s construction costs are the highest compared to any country in
Middle East. It was indicated in the research that the difference in the construction cost
between Saudi Arabia and Bahrain is almost half.
In the research presented by EC Harris (2012), it was mentioned that the
construction costs in the Gulf region were quite similar to the construction costs in
Europe. In addition, Saudi Arabia was considered a cheap country in terms of
construction cost. According to EC Harris Regional Head of Cost and Commercial
Management in Middle East, Nick Smith: “As compared to other countries in GCC,
Saudi Arabia has the most competitive market in terms of construction costs, this is due
to high profit and low overheads With steel factories available in Saudi Arabia along
with abundance of raw material, Saudi Arabia’s government is able to keep the
construction costs lower than 10 percent as compared to other GCC countries in the
region.”
The research conducted by EC Harris (2012) presented an overview of the
construction costs in Bahrain which are quite similar to those in UK whereas, the

24
construction costs in Qatar are almost equal to those in Bahrain with only difference of 6
percent. It was an interesting finding that the construction costs in Qatar are even greater
than larger and more developed nations including China, U.S.A and Russia.
According to this research, U.A.E is only 9 percent behind Bahrain and only 3
percent less than Qatar in terms of construction costs. The United Arab Emirates is
ranked as the third most expensive country in Middle East while Saudi Arabia is ranked
the cheapest in terms of construction costs. However, Oman is ranked fourth after
Bahrain, Qatar and U.A.E with only 11 percent difference between the construction cost
of Bahrain and UK (EC Harris, 2012).
2.4.3. Profit margin of Saudi Arabia and other GCC countries
Cement is the major element of the construction industry and is the main reason
behind the growth of the construction industry. It was observed that after the economic
crisis, the revenues of the GCC countries declined but with the passage of time the
economy gradually recovered. The revenues of the GCC countries increased to about
USD 4.6 billion in 2011 (14.2 percent). After the stabilization of economy, Saudi Arabia
led the cement industry followed by the rest of the GCC countries except for Qatar and
Bahrain. The other countries that followed Saudi Arabia were Oman, U.A.E and Kuwait
respectively (Ventures, 2012).
For the first time since 2008, UAE had an increase in its sales revenue after the
total collapse of the cement industry due to the economic crisis. Even after the increase in
sales with the current economic conditions, the sales revenue of U.A.E’s cement industry
shows negative net profit. With Saudi Arabia’s ability to produce cement with low fuel

25
and raw-material costs, the country is able to gain an edge over other cement markets
(Ventures, 2012). This is due to the increasing cement consumption in Saudi Arabia, as
shown in figure 13:
Figure 13. GCC Cement Construction Share (data from Al Jazira Capital, 2011)
With the availability of natural resources, Saudi Arabia is capable of producing
cement comparatively cheaper than other GCC countries (Al Sheikh, 2012). The low
costs of production contribute to the increase in profit margin. The costs of cement’s
production per ton in Saudi Arabia were USD 30.9 in the year 2011. This was the lowest
cost of production of cement compared to other countries. With such low cost, the profit
ratio of Saudi Arabia is comparably higher than others in the market. The costs of
production of cement in other countries were USD 37; slightly higher than they were in
Saudi Arabia, followed by U.A.E and Kuwait with production costs of cement USD 47.8
and USD 59.2 respectively (Ventures, 2012), this is shown in figure 14:
Saudi Arabia,
42.1%
UAE, 26.0%
Kuwait, 5.5%
Qatar, 5.2% Oman, 4.5% Million Tonnes

26
Figure 14. Cement Cost per Tonne (US $ per tonne) (data from Ventures, 2012)
As we can see here, the gross margin of Saudi Arabia was the highest with USD
30.9. The country’s gross margin was around 51.80 percent in December 2011 followed
by Oman, Kuwait and U.A.E with gross margin 45.70 percent, 26.00 percent and 15.50
percent respectively (Ventures, 2012), as shown in figure 15:
Figure 15. GCC Cement Industries Gross Margins (%) (data from Ventures, 2012)
30.9
37
47.8
59.2
0
10
20
30
40
50
60
70
Saudi Arabia Oman UAE Kuwait
Co
st (
US
$ p
er T
on
ne)
51.80%
45.70%
26%
15.50%
0.00% 10.00% 20.00% 30.00% 40.00% 50.00% 60.00%
Saudi Arabia
Oman
Kuwait
UAE
Gross Margin (%)

27
2.5 Factors that led to the escalation of housing and
construction costs
There are certain factors that affected the cost to escalate in the housing and
construction industry. With the increase in complexity of the building, there lies a
probability of increase in the construction cost. There can be different economic factors
responsible for the increasing housing and construction costs. For instance, the increasing
oil prices serve as the major cause behind the rising housing and construction costs. Apart
from this the increasing construction cost are also because of the increasing prices of
other resources like labor and other construction resources. Hence, shortage of labor and
other construction resources also tend to increase the overall construction cost
(Omoreigie and Radford, 2005). Apart from this the low supply of housing also directly
influenced the construction and housing costs. This is further supported by the increase of
inflation rate. Aibinu and Jagboro (2002) revealed that the government’s policies and
regulations also directly influence the construction and housing costs. Apart from this,
according to TELL (2002) the corruption and some fraudulent practices on the part of the
government, suppliers, and contractors also directly affect the housing and construction
costs. This was further supported by the research studies of Husseini (1991) and
Frimpong, Oluwoye and Crawford (2003). On the demographic level, the increase of
population’s level results in the increase of costs of construction and this leads to increase
the demand on housing.
Some of the factors that led to costs’ escalation in housing and construction
industry in Saudi Arabia are as follows:

28
2.5.1. Economic Factors
Oil is the major commodity of the GCC countries and this indicated that the non-
oil real growth rate would decline to some extent. According to a forecast, it was
expected that the non-oil real GDP would remain strong but would slightly fall below 7
percent in 2011 to 6 percent in 2012 and would further decrease to 5.5 percent in 2013
(IMF, 2012). This decline in the growth rate indicates lower levels of spending from the
government along with weaker external conditions.
The oil sale revenue looks unpromising due to uncertain economic environment
and long-term challenges. It was predicted that the crude-oil price per barrel would fall
below USD 100 per barrel by 2015. It was also forecasted that the increase in government
spending along with fiscal and external surpluses would turn to deficit, if the policies of
GCC countries remain the same.
Labor costs were another major reason for the escalation in construction
industry’s costs. The increase in labor costs would directly affect construction costs to
boom upwards resulting in greater cost requirements for the completion of projects.
According to a research conducted by MEED (Middle East news, data and analysis);
business service intelligence, Saudi Arabia has the highest labor construction costs in the
Gulf region (Meed Cost Indices, 2012b), this research further indicated that the labor
construction costs in Saudi Arabia are average (Mesbah, 2012).
The increase in government expenditure is another major reason for the costs
escalation in the construction industry. Along with such increase, the breakeven price of
oil has continued to grow which eventually led the costs of construction industry to

29
escalate even higher. The increase in costs reduces the profit margin to a great extent in
GCC countries especially that oil makes most of the country’s revenue.
In order to enhance Saudi Arabia’s position in the market, the government of
Saudi Arabia has decided to provide its citizens with employment opportunities by
building four economic cities namely King Abdullah economic city, Prince AbdulAziz
bin Mousaed Economic City, Knowledge Economic City, and Jazan Economic City. By
constructing such economic cities, the government of Saudi Arabia aims to enhance the
GDP as these cities once are completed would provide the Saudi nationals with
employees to work on reducing the construction costs (Alpen Capital, 2012).
2.5.2. Geographic, Demographic and Social Factors
Demographic:
Within the last decade, the construction industry in the GCC countries has
witnessed an increase in the population. It was observed that the population of the GCC
countries witnessed a great boom during 2003-2009. The population within these years
grew to 3.5 percent as compared to global growth of 1.3 percent within the same time-
frame. Saudi Arabian population growth rate is 2.90 (central department of statistics and
information). Urbanization was another factor that was witnessed in the GCC countries.
According to a research conducted last year, it was observed that GCC countries such as
Kuwait and Qatar have 90 percent of their population living in urban areas whereas; only
10 percent of the population lives in rural areas. This indicates that there is still room for
growth in GCC countries and more growth opportunities for countries like U.A.E and
Saudi Arabia that have higher population as compared to other GCC countries (Alpen
Capital, 2012).

30
With 50 percent of the population between the ages of 15 to 65 years, it was
observed that in the forthcoming years the GCC countries would have higher number of
young and energetic workforce. It was also observed that changing lifestyle and shift
from single to nuclear families is on rise and with such shifts; the housing demand would
eventually increase. This shift in the demographics has major contribution in the cost
escalation of construction industry (Alpen Capital, 2012).
Geographic:
Most of the GCC countries are located in hot environment but at the same time
enjoy quite advantages over other countries. The GCC countries are provided with
abundance of oil reserves that makes the most of the country’s GDP and revenue. Along
with such abundance of oil reserves, the GCC countries are blesses with natural resources
such as gold, copper, limestone etc. Due to such abundant availability of natural
resources, the construction costs in such countries are quite less compared to other
countries like USA and UK.
With Saudi Arabia being the least expensive country in terms of construction’s
costs, the profit margin is quite high compared to other GCC countries. With comparable
higher profit margin, Saudi Arabia is able to reduce its construction’s costs to a great
extent whereas; the construction’s costs in U.A.E., Kuwait and Qatar are quite high as
these countries have higher raw material’s costs.
Due to favorable geography of GCC countries, the member countries enjoy favorable
policies from government and strong attraction of foreign companies in the construction
industry. This attraction has allowed the GCC countries to handle large and complex

31
construction projects by either entering into partnership with foreign companies or joint
ventures.
Social Factors:
To successfully meet the high and complex demands, it is essential to have skilled
labor. In the case of Saudi Arabia, the situation is quite opposite. Saudi Arabia has
constantly attracted diversified workforce in construction’s industry, the number of
skilled and qualified labor has gradually decreased making it comparably difficult for the
Saudi Arabian government to meet the never ending demands of complex structures. Due
to skills shortage, the construction cost is expected to grow in the forthcoming years
(Deloitte, 2012b).
Saudi Arabia and Abu Dhabi being a social hub has provided an opportunity for
the government. By using such diversified labor, there is wider opportunity available for
the Saudi Arabian government to turn the country into a major social and economic hub.
By doing so, the construction’s costs would gradually decrease to a great extent (Deloitte,
2012b).
In 2010, to narrow the gap that was created and to develop human resources by
providing vast opportunities, the Saudi Arabian government approved five year
development plan worth (USD 384 billion). This development plan was aimed to enhance
and develop human resources, education and skills to labor. This plan has gradually
decreased the costs escalation in the construction’s industry as this development plan
would create a large number of job opportunities in the industry. The greater availability
of jobs, the greater there is a chance to reduce costs escalation (Deloitte, 2012b).

32
2.5.3. Finance and Funding factors
Construction depends on quality of planning for complex and large projects but
due to shortage in skilled labor in Saudi Arabia in the construction industry, there is a
great chance for costs escalation. Planning is the most crucial stage that could gradually
reduce costs of construction. To do so, contractors must be aware of current happenings
and events along with the resources that would be needed for the project. In order to
reduce costs of construction, the contractors should be provided with only resources they
require. By doing so, the resources would be used in an efficient manner. Planning and
scheduling both are crucial to reduce costs of construction. When done properly and
accurately, the project costs can be reduced to a great extent.
Poor financing control is another factor that could gradually increase the costs of
construction projects in Saudi Arabia. With lack of skills, controlling the entire project
financially is another major problem for the Saudi Arabian construction industry. If the
projects are not financially controlled, the costs of the construction projects can increase
to a great extent. To eliminating this problem, the Saudi Arabian government should use
proper and quality management tools and proper resources planning aimed to minimize
the costs escalation.
With greater restrictions in Saudi Arabia the construction’s companies are
struggling to funds to complete their projects. The source of these restrictions is the
tighter control of the government on the monetary supply. In order to acquire funds, the
construction’s companies are taking loans in order to fulfill the needs and requirements of
their projects. This is a major reason for costs’ escalation.

33
Bonds and payments are another source to acquire funds in Saudi Arabia. These
financial sources in Saudi Arabia are issued by banks and are considered as additional
support for contractors. The biggest hurdle for the construction’s companies in Saudi
Arabia is that the government requires bank guarantees from contractors even though the
companies have the ability to complete the project timely with cash. The loans provided
by banks for the completion of projects are backed by high interest’s rate which makes it
quite difficult for contractors to acquire loans in order to complete their projects.
Changes in the material costs are another factor that could gradually increase or
decrease the costs of construction in Saudi Arabia. With the abundance of natural
resources, the Saudi Arabian government is able to meet the demands of construction’s
sector, but the economic recession in the past few years had created several problems for
such companies. Due to the economic recessionary period, the material’s costs have
increased which caused a great change in construction’s costs. In the forthcoming years,
it is expected that the Saudi Arabian government will be able to reduce the material’s
costs so that the construction’s companies can take full advantage of the abundance of
natural resources that are available in Saudi Arabia.
2.5.4. Environmental factors
Weather is a primary environmental factor that can lead to the costs’ escalation in
Saudi Arabia. Saudi Arabia has one of the most extreme climatic situations due to which
there is a constant loss of productivity and inefficient use of resources. Furthermore, the
maintenance costs in such extreme climatic situation have gradually increased due to
constant maintenance. Contractors avoid working in such climatic situation because the

34
summer in this particular region is extremely hot and working in such situation has
always been difficult for contractors and workers as well.
Corporate social responsibility is another major environmental factor that could
enhance the costs of construction industry. Being blessed with natural resources and oil
reserves, the Saudi Arabian government is focusing on preserving the natural resources
so that the future generations can also benefit from such resources. In order to provide the
construction industry with these natural resources, the Saudi Arabian government
purchases the resources required from vendors at comparably high costs. Due to such
factor, the costs of construction industry have gone quite high in the recent years.
2.5.5. Other Factors
The literature review reveals various factors that the researcher expects to be the
reason for the increase in housing and construction’s prices in Riyadh, Saudi Arabia.
The review established that most economists consider high oil prices to be the initial
powerful contributor to the increase in prices of construction materials. As Alhayat
(2009) observed, “The expectations indicate that the prices of oil will be increased more
due to high global demand especially in the winter season.” As a result, “Expectations of
rising prices of building materials are in line with the rise of oil” (Badran, 2012). Some
construction material’s companies incurred enormous losses due to the increase in
petroleum material’s process. Moreover, oil is currently in short supply so many
companies have limited access to this vital resource. The high oil prices increased the
prices for shipping materials overseas, which has resulted in the high prices that
consumers have to encounter. Oil prices increase will be especially detrimental to small
projects, because the modest budgets of small projects might not be enough to cover the

35
expensive construction materials. Thus, small-project contractors often slow their
projects. The political limitations and revolutions in the Middle East also create scarcity
in oil, because transportation companies do not want to transport oil across unstable
regions. Alsafhan (2011) specified that “Contractors of construction have confirmed that
the political revolution contributed to increased prices by 10%.”
The Saudi government made a decision to build 500,000 houses to increase
supply as a result to the high demand. However, some experts believe that this decision
has not helped solving the problem; in fact, they claim it made the problem even worse.
They explain it is because the renewed demand of construction materials will drive up the
prices. Arabian Business (2012) mentioned: “A specialist warned that the multiplicity of
government housing projects in 2012 will increase the constructions materials’ prices and
then increase the prices of housing units built by construction companies.”
Likewise, other government projects are the reason for the increase of prices.
“Saudi government is the major consumer for constructions materials due to building
schools, hospitals, government buildings, and infrastructure” (Aljaliedy, 2011). These
projects create a second source of demand, so both the Saudi citizens and government are
competing over limited supplies.
Saudi Arabia has a high rate of population growth, which is also contributing to
increased prices. The Saudi Economic Survey (2012) projects that property prices will
only raise as demand in the country’s growth. In fact, the growth is so high that the
supply of housing might not catch up anytime soon. Saudi Arabia already suffers from a
shortage in houses, as LaSalle (2010) remarks, “Saudi Arabia, the biggest Arab economy,
is facing a massive housing problem due to rapid population growth.” LaSalle (2010)

36
specified that this high demand requires 150,000 additional residential housing units per
annum.
Some of the contractors and traders of construction’s materials have been
manipulating prices by creating an artificial shortage. Alhwish (2011) observed that the
increased prices of construction’s materials occurred because of the shortage in their
supply, and the main reason behind this shortage is that some traders and contactors
bought a huge amount of materials to store them and thirst the market. They resorted to
this process because they knew that companies and consumers would buy from them due
to the high demand of new housing units. The other cause of construction material’s
shortage according to Alhwish (2011) is that some traders export construction’s materials
to other countries because they want to increase the prices in Saudi Arabia. Moreover,
these traders exploit the other countries to which they sell. These other countries have a
great need for construction materials, so the traders can get away with selling the
materials to them at very high prices.
The role of labor in housing is very important, because building houses is labor
intensive. Unfortunately, Albaqamay (2012) notes that labor wages have increased by
30% in the market of housing and construction. Companies also have limited trained
laborers at their disposal. Companies have to pay more to attract skilled laborers or
projects will be delayed due to a shortage in skilled laborers. as a result the overall cost of
building a house will raise even more.
The current prices trend in Saudi Arabia is so strong that it will not change course
without the government acting as a moderator. As long as the government does not
classify construction’s quality or monitor the qualifications of construction’s companies,

37
the problem will grow and thus further support the black market’s dominion over the
sector of housing and construction. Alhwish (2011) concludes that the Saudi government
must focus on deterring the manipulation of traders rather than focusing on creating
housing projects if it wishes to turn around the current prices’ trend.
Riyadh city suffers from speculative purchases of undeveloped lands and
corruption in selling/assigning lands. Studies have identified these two factors that
contribute greatly to the increase of Riyadh’s housing and construction’s costs.
Aleqtesadya (2012) explained, “There is a speculative undeveloped lands actions in
Riyadh city, and that leads to making the problem worse.” In addition, corruption in
selling lands takes the form of an investor buying a very large piece of land in a housing
area then refusing to sell or build on the land. Instead, the investor’s goal is to hold onto
that land for many years to increase the prices of other areas and to increase the prices of
rental apartments. The Saudi government does not apply tax on land to prevent investors
from keeping their lands, so the problem runs rampant, especially in Riyadh.
2.6 Strategies to minimize costs
According Master Builders Director of Housing Policy, Paul Bidwell “the biggest
problem for the construction industry is continuous rise of cost. These changes in the cost
have substantially reduced the construction activity”. He added further that, “there two
major elements that have greatly influenced that cost are; land cost and construction
cost.” (Master Builders, 2012)
By keeping in mind, what has been observed, few strategies are presented with an aim
to minimize construction’s costs. These strategies are as follows (Cooke and Williams,
2003; Mbachu and Nkado, 2004):

38
a) By ensuring efficient time management. By doing so, the contractor would be
able to effectively design a plan on how to best utilize resources and could better
develop and control the whole process. This can enable contractors to reduce
costs by managing the resources being used and would reduce additional work
allocation for which workers charge additional costs.
b) By ensuring adequate supervision, this will allow contractors to manage their
construction’s projects accordingly and eventually reduce the possibility of errors.
Adequate supervision can also reduce idle time during construction process.
c) As for complex and large projects, it would be better for contractors to hire
experienced and qualified workforce. The quality of work will be better and the
chances of making mistakes would be near to zero which can cut costs.
d) By thinking of innovative solutions for unexpected problems. To do so, the
government should give contractors sufficient time and resources along with full
support to reduce construction’s costs in Saudi Arabia.

39
CHAPTER 3
METHODOLOGY
3.1 Introduction
The objective of this thesis is to study the main factors that lead to housing and
construction costs’ escalation, focusing on Saudi Arabia as a case study. The costs of
housing and construction have increased significantly, about 200% more compared to the
prices in 2006. The problem started in 2006, when the prices of real estate began to
increase, and since that time the prices escalated exponentially. The prices are still high
and unreasonable in the Saudi society. Buying a house with such escalating prices has
become a dream. With the current prices, people in Saudi Arabia are obligated to take
long-term loans (30 years) to own a house, whereas, a few years ago people used to take
short-term loans to own a house (5-8 years). Since 2006, the real factors that are behind
the increase of housing and construction’s prices are still unknown. Many of the factors
that led to the escalation in housing and construction’s prices are in the literature.
However, there have been limited studies to analyze and document the potential factors.
All factors that are reported in the literature are assumed to contribute to prices’ increase.
In this thesis, all the reported factors are investigated with the goal of determining their
impact on the housing and construction’s prices in Saudi Arabia. Furthermore, the study
investigated the potential strategic solutions on the long run to reduce prices or at least
keep them at the current levels.

40
3.2 Participants
The goal is to collect responses from experts in the field of construction in
order to be able to determine the main factors that increased the prices in housing and
construction’s market. Moreover, this should help the researcher find applicable solutions
in order to avoid more prices’ escalation in the future. When this survey is complete and
published, it should contribute to highlighting some of the key factors that the Saudi
government should properly address.
As mentioned above, in order to determine the key factors that increased costs,
the thesis has used a survey that includes all the expected factors reported throughout the
literature. The survey was conducted in one city in Saudi Arabia, the city of Riyadh,
which is the capital of Saudi Arabia. The survey has been completed by large
construction’s companies, large construction material’s suppliers, engineers, specialists in
the field of housing and construction, economists, and some official employees who serve
in high positions in the government. All of them are familiar with the problem and have
great ideas on how to fix the current situation in housing and construction market. The
survey has been filled out by them in face-to-face sessions. The survey (page: 86)
includes 16 questions regarding the expected factors that led to prices’ escalation on a 5-
point scale (Khalafallah, 2002). The scale points are: Very high = 5, High = 4, Normal =
3, Low = 2 and Very low = 1. A draft of the survey is included in Appendix - A.

41
3.3 Survey factors and the method of analyzing data
There are 16 questions divided into 8 main categories to facilitate understanding
and analysis. These categories are listed below:
1) Escalation of Oil Prices: The increase in global demand of oil which led to the
escalation of oil prices.
2) High Demand of Housing and Construction: This category includes high demand
from, a) Saudi citizens, b) government housing projects, c) government public
work projects.
3) Low Supply of Housing: This category includes a comparison between the increase of
annul demand and the low supply of housing units.
4) Rapid Rise in Population’s Growth: This category includes the high growth rate of
Saudi population with more than 3%.
5) Shortage of Construction’s Resources: This category includes: a) manipulation and
monopoly of suppliers of cement, steel and other construction’s materials, b)
shortage of trained labor, c) black Market, d) export of construction’s materials
outside of Saudi Arabia.
6) Speculative Purchase of Undeveloped Lands: This category includes corruption in
selling undeveloped lands.
7) High Inflation Rate: This category includes the continuous increase in construction’s
materials regarding the inflation factor.
8) Other Factors, such as: the absence of the government’s role in monitoring prices,
corruption in monitoring governmental projects, and contractors who take projects
beyond their capacity.

42
To analyze the collected data, the researcher has used descriptive and quantitative
methods to discuss the potential factors. The researcher used Microsoft Excel software to
analyze the data statistically using methods such as calculating means, weighted
averages, histograms, figures, and tables. One of the important methods used in analyzing
the collected data of the survey was to observe the difference in factors based on their
means and modes. Each question includes a 5-point scale (very high, high, normal, low,
very low), and each of these choices has been quantified in order to calculate a numeric
evaluation of the mean. This should illustrate the importance of each question (factor).
Finally, in the statistical analysis of each factor 95% confidence interval allows inference
toward the population.

43
CHAPTER 4
DATA COLLECTION AND ANLYSIS
4.1 Sample Size
The research was designed to determine the main factors of the prices’ escalation
of housing and construction in Riyadh, so the researcher collected data through a survey
(Appendix A). Due to the limits of the statistical equation given below, the researcher
must collect 215 samples or more to acquire accurate findings. The researcher obtained
237 samples to meet the required number of samples. The number of samples was
calculated using the statistical equation of determining sample size for the estimation of
mean (Eq. 1).
n = (Z) 2
(б) 2
/ (E) 2
…………………………………………………............……. (1)
Where
n is the sample size
z is the z value corresponding to the level of confidence
б is the standard deviation of the population
E is the maximum error (Mann, 1995)
Thirty random samples were taken to calculate the sample standard deviation for
all 237 samples. Then, the average of those 30 standard deviations was calculated to
determine the standard deviation (б) of equation 1, which is 0.89132 (Mann, 1995). The z
value corresponding to a level of confidence of 90% is 1.645, and the maximum error
was set to 0.1 (10%). Therefore, the required sample size is:
n = (1.645)2 * (0.89132)
2 / (0.1)
2 = 214.9805

44
Thus, the sample size should be more than or equal to 215, and the researcher obtained
237 samples from the survey.
The process of collecting data took two months and took place entirely in Riyadh,
Saudi Arabia. Many of the surveys were filled out by employees who work at large
construction’s companies or at large construction material’s suppliers. In addition,
engineers, specialists in the housing and construction’s field, economists, and some
official employees who hold high positions in the government participated in the survey.
This chapter shows the analyses of the survey data. Each analysis is designed to answer
one question to help the researcher discover the potential factors that led to the escalation.
The histogram method has been used to locate, with precision, the most frequently
chosen number from the scale (very high = 5, high = 4, moderate = 3, low = 2, very low =
1). Furthermore, the mean for each question has been calculated to determine the main
factors.
4.2 Data Analysis of the Factors
Factor 1: Oil Prices’ Escalation:
The first question is to solicit experts’ opinion on the effect of oil prices’
escalation on increasing construction costs of housing projects. The question has been
answered by 237 people. Out of the completed surveys, 25% of the respondents have
evaluated the impact of this factor at 5 (Very High Impact), 26% of the respondents have
evaluated the impact of this factor at 4 (High impact), 27% of the respondents have
evaluated the impact of this factor at 3 (Moderate Impact), 12% of the respondents have
evaluated the impact of this factor at 2 (Low Impact), and 10% of the respondents have
evaluated the impact of this factor at 1 (Very Low Impact), as shown in Table 1and

45
Figure 16. The mean of the collected data is 3.426160338 and the standard deviation is
1.262157498, as shown in Table 2.
Figure 16. Impact of oil prices on construction costs’ increase
Table 1. Oil prices’ escalation.
Table 2. Statistical analysis
Bin Frequency
of response to question1.
1 24
Q1
2 29
3 64
Mean 3.426160338
4 62
Standard Error 0.08198594
5 58
Median 4
Mode 3
Standard Deviation 1.262157498
Sample Variance 1.59304155
Kurtosis -0.78427821
Skewness -0.41231071
Range 4
Minimum 1
Maximum 5
Sum 812
Count 237
Confidence Level
(95.0%) 0.161517782
1
10% 2
12%
3
27% 4
26%
5
25%
Impact Score
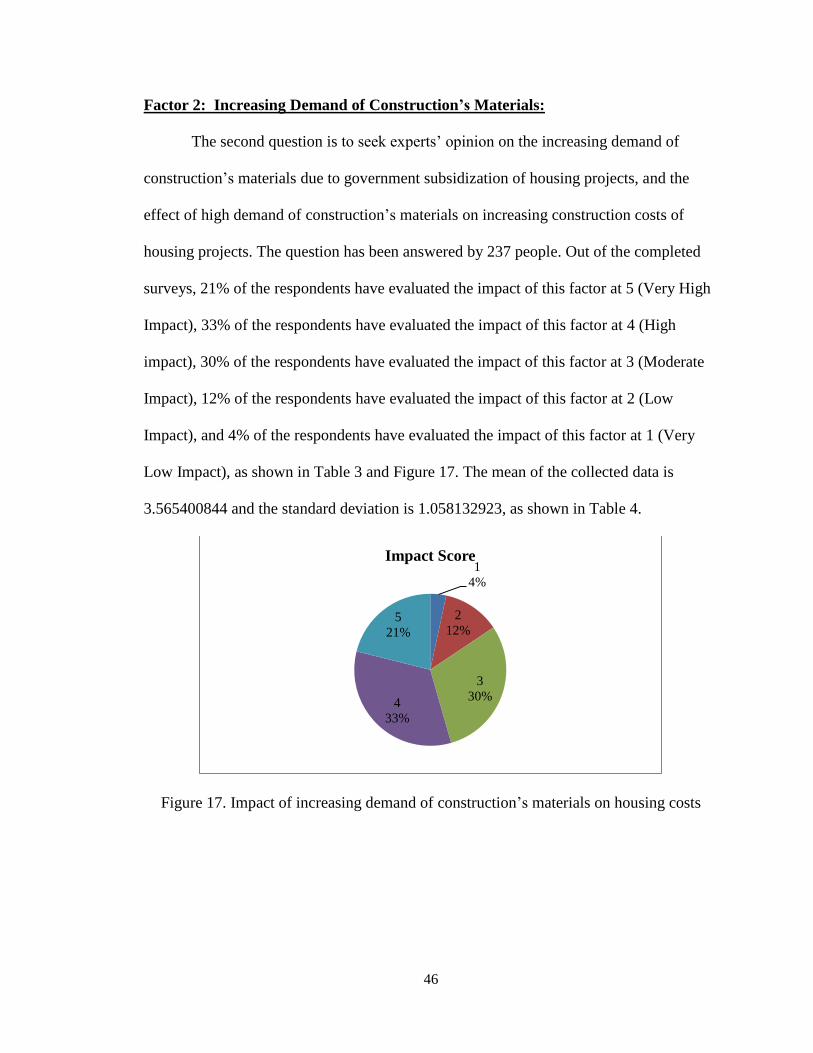
46
Factor 2: Increasing Demand of Construction’s Materials:
The second question is to seek experts’ opinion on the increasing demand of
construction’s materials due to government subsidization of housing projects, and the
effect of high demand of construction’s materials on increasing construction costs of
housing projects. The question has been answered by 237 people. Out of the completed
surveys, 21% of the respondents have evaluated the impact of this factor at 5 (Very High
Impact), 33% of the respondents have evaluated the impact of this factor at 4 (High
impact), 30% of the respondents have evaluated the impact of this factor at 3 (Moderate
Impact), 12% of the respondents have evaluated the impact of this factor at 2 (Low
Impact), and 4% of the respondents have evaluated the impact of this factor at 1 (Very
Low Impact), as shown in Table 3 and Figure 17. The mean of the collected data is
3.565400844 and the standard deviation is 1.058132923, as shown in Table 4.
Figure 17. Impact of increasing demand of construction’s materials on housing costs
1
4%
2
12%
3
30% 4
33%
5
21%
Impact Score

47
Table 3. Increasing demand of
Table 4. Statistical analysis
construction’s materials.
of responses to question 2.
Bin Frequency
Q2
1 8
2 29
Mean 3.565400844
3 71
Standard Error 0.068733119
4 79
Median 4
5 50
Mode 4
Standard Deviation 1.058132923
Sample Variance 1.119645284
Kurtosis -0.46416528
Skewness -0.37886314
Range 4
Minimum 1
Maximum 5
Sum 845
Count 237
Confidence Level
(95.0%) 0.13540884
Factor 3: Increasing Demand of Engineering Services to Support Development of
Public Work Projects:
The objective of third question is to seek experts’ opinion on the increasing of
demand of engineering services to support development of public work projects.
(Government projects, such as schools, hospitals, and other infrastructure related
projects). This factor is believed to be the reason of the increase in construction’s costs of
housing. The question has been answered by 237 people. Out of the completed surveys,
17% of the respondents have evaluated the impact of this factor at 5 (Very High Impact),
28% of the respondents have evaluated the impact of this factor at 4 (High impact), 29%
of the respondents have evaluated the impact of this factor at 3 (Moderate Impact), 19%
of the respondents have evaluated the impact of this factor at 2 (Low Impact), and 7% of
the respondents have evaluated the impact of this factor at 1 (Very Low Impact), as

48
shown in Table 5 and Figure 18. The mean of the collected data is 3.29535865 and the
standard deviation is 1.155907624, as shown in Table 6.
Figure 18. Effect of increasing demand of engineering services of public work on housing
costs
Table 5. Increasing demand of
Table 6. Statistical analysis
Engineering’s services.
Of responses to question 3.
Bin Frequency
Q3
1 16
2 45
Mean 3.29535865
3 69
Standard Error 0.075084269
4 67
Median 3
5 40
Mode 3
Standard Deviation 1.155907624
Sample Variance 1.336122434
Kurtosis -0.78492494
Skewness -0.19785909
Range 4
Minimum 1
Maximum 5
Sum 781
Count 237
Confidence
Level(95.0%) 0.147921029
1
7% 2
19%
3
29%
4
28%
5
17%
Impact Score

49
Factor 4: High Demand of Housing.
The goal of fourth question is to seek specialists’ opinion on the impact of the
high demand of housing on increasing construction’s costs of housing. The question has
been answered by 237 people. Out of the completed surveys, 49% of the respondents
have evaluated the impact of this factor at 5 (Very High Impact), 38% of the respondents
have evaluated the impact of this factor at 4 (High impact), 9% of the respondents have
evaluated the impact of this factor at 3 (Moderate Impact), 3% of the respondents have
evaluated the impact of this factor at 2 (Low Impact), and 1% of the respondents have
evaluated the impact of this factor at 1 (Very Low Impact), as shown in Table 7 and
Figure 19. The mean of the collected data is 4.324894515 and the standard deviation is
0.812985506, as shown in Table 8.
Figure 19. Impact of high demand of housing on construction’s costs
1
1%
2
3%
3
9%
4
38%
5
49%
Impact Score
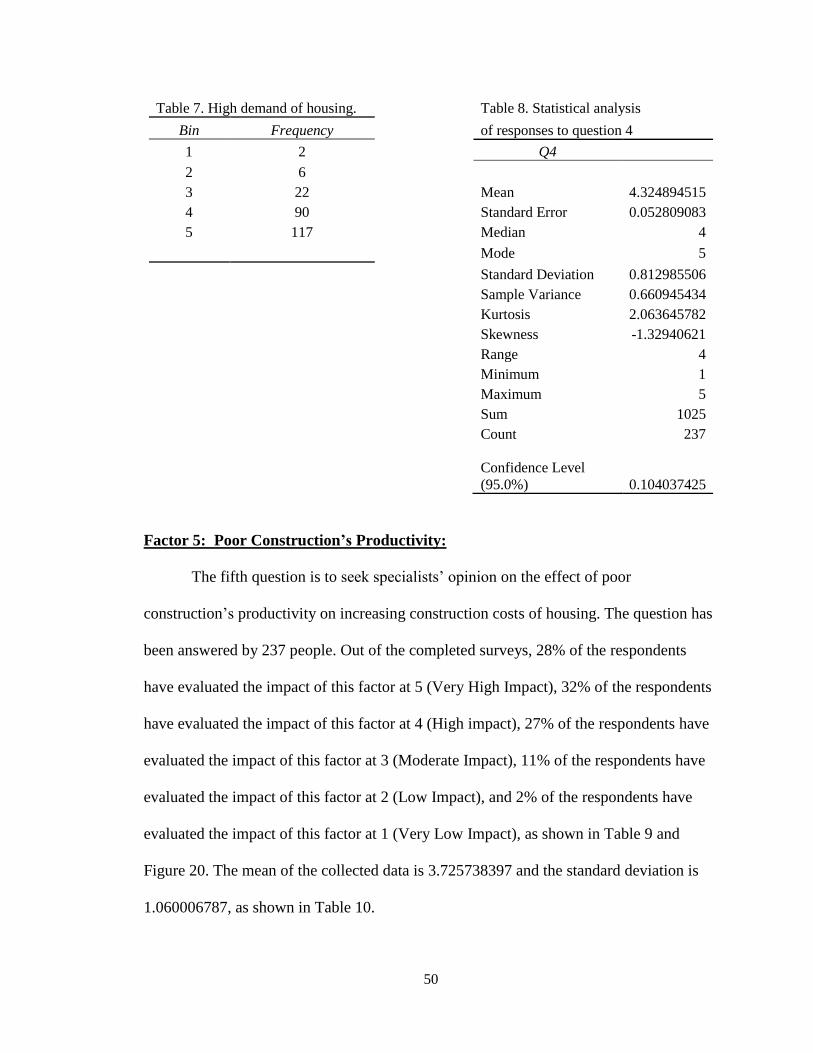
50
Table 7. High demand of housing.
Table 8. Statistical analysis
Bin Frequency
of responses to question 4
1 2
Q4
2 6
3 22
Mean 4.324894515
4 90
Standard Error 0.052809083
5 117
Median 4
Mode 5
Standard Deviation 0.812985506
Sample Variance 0.660945434
Kurtosis 2.063645782
Skewness -1.32940621
Range 4
Minimum 1
Maximum 5
Sum 1025
Count 237
Confidence Level
(95.0%) 0.104037425
Factor 5: Poor Construction’s Productivity:
The fifth question is to seek specialists’ opinion on the effect of poor
construction’s productivity on increasing construction costs of housing. The question has
been answered by 237 people. Out of the completed surveys, 28% of the respondents
have evaluated the impact of this factor at 5 (Very High Impact), 32% of the respondents
have evaluated the impact of this factor at 4 (High impact), 27% of the respondents have
evaluated the impact of this factor at 3 (Moderate Impact), 11% of the respondents have
evaluated the impact of this factor at 2 (Low Impact), and 2% of the respondents have
evaluated the impact of this factor at 1 (Very Low Impact), as shown in Table 9 and
Figure 20. The mean of the collected data is 3.725738397 and the standard deviation is
1.060006787, as shown in Table 10.

51
Figure 20. Impact of poor construction’s productivity on housing costs
Table 9. Poor construction’s
Table10. Statistical analysis
productivity.
Of response to question 5.
Bin Frequency
Q5
1 5
2 27
Mean 3.725738397
3 63
Standard Error 0.06885484
4 75
Median 4
5 67
Mode 4
Standard Deviation 1.060006787
Sample Variance 1.123614389
Kurtosis -0.59413771
Skewness -0.44465223
Range 4
Minimum 1
Maximum 5
Sum 883
Count 237
Confidence Level
(95.0%) 0.135648638
Factor 6: Rapid Rise in the Rate of Population’s Growth:
The sixth question is to solicit specialists’ opinion on the influence of rapid rise in
the rate of population’s growth on the increase of construction’s costs of housing. The
question has been answered by 237 people. Out of the completed surveys, 51% of the
1
2%
2
11%
3
27%
4
32%
5
28%
Impact Score

52
respondents have evaluated the impact of this factor at 5 (Very High Impact), 34% of the
respondents have evaluated the impact of this factor at 4 (High impact), 10% of the
respondents have evaluated the impact of this factor at 3 (Moderate Impact), 5% of the
respondents have evaluated the impact of this factor at 2 (Low Impact), and 0% of the
respondents have evaluated the impact of this factor at 1 (Very Low Impact), as shown in
Table 11 and Figure 21. The mean of the collected data is 4.29535865 and the standard
deviation is 0.871694469, as shown in Table 12.
Figure 21. Effect of rapid rise in the rate of population’s growth on construction costs
1
0%
2
5%
3
10%
4
34%
5
51%
Impact Score

53
Table 11. Rapid rise in the rate of
Table 12. Statistical analysis
Population’s growth
of responses to question 6.
Bin Frequency
Q6
1 1
2 12
Mean 4.29535865
3 23
Standard Error 0.05662264
4 81
Median 5
5 120
Mode 5
Standard Deviation 0.871694469
Sample Variance 0.759851248
Kurtosis 1.071632264
Skewness -1.23229201
Range 4
Minimum 1
Maximum 5
Sum 1018
Count 237
Confidence Level
(95.0%) 0.111550387
Factor 7: Monopoly and Other Unethical Practices of Suppliers:
The seventh question is to seek specialists’ opinion about the effect of monopoly
and other unethical practices of suppliers (cement, steel and other construction materials)
on increasing construction’s costs of housing. The question has been answered by 237
people. Out of the completed surveys, 24% of the respondents have evaluated the impact
of this factor at 5 (Very High Impact), 31% of the respondents have evaluated the impact
of this factor at 4 (High impact), 30% of the respondents have evaluated the impact of
this factor at 3 (Moderate Impact), 12% of the respondents have evaluated the impact of
this factor at 2 (Low Impact), and 3% of the respondents have evaluated the impact of
this factor at 1 (Very Low Impact), as shown in Table 13 and Figure 22. The mean of the
collected data is 3.603375527 and the standard deviation is 1.071030906, as shown in
Table 14.

54
Figure 22. Impact of monopoly and other unethical practices of suppliers on housing’s
costs
Table 13. Monopoly and other
unethical practices of suppliers
Table 14. Statistical analysis
Of responses to question 7.
Bin Frequency
Q7
1 8
2 27
Mean 3.603375527
3 72
Standard Error 0.069570933
4 74
Median 4
5 56
Mode 4
Standard Deviation 1.071030906
Sample Variance 1.147107202
Kurtosis -0.4939254
Skewness -0.38641229
Range 4
Minimum 1
Maximum 5
Sum 854
Count 237
Confidence
Level(95.0%) 0.13705939
1
3%
2
12%
3
30% 4
31%
24%
Impact Score

55
Factor 8: Lack of Trained Labor:
The eighth question is to seek experts’ opinion on the impact of lack of trained
labor on increasing construction costs of housing. The question has been answered by
237 people. Out of the completed surveys, 21% of the respondents have evaluated the
impact of this factor at 5 (Very High Impact), 30% of the respondents have evaluated the
impact of this factor at 4 (High impact), 26% of the respondents have evaluated the
impact of this factor at 3 (Moderate Impact), 17% of the respondents have evaluated the
impact of this factor at 2 (Low Impact), and 6% of the respondents have evaluated the
impact of this factor at 1 (Very Low Impact), as shown in Table 15 and Figure 23. The
mean of the collected data is 3.426160338 and the standard deviation is 1.171623902, as
shown in Table 16.
Figure 23. Impact of lack of trained labor on construction’s costs
1
6%
2
17%
3
26%
4
30%
5
21%
Impact Score

56
Table 15. Lack of trained labor.
Table 16. Statistical analysis
Bin Frequency
of responses to question 8.
1 14
Q8
2 41
3 62
Mean 3.426160338
4 70
Standard Error 0.076105151
5 50
Median 4
Mode 4
Standard Deviation 1.171623902
Sample Variance 1.372702567
Kurtosis -0.79858022
Skewness -0.30693675
Range 4
Minimum 1
Maximum 5
Sum 812
Count 237
Confidence Level
(95.0%) 0.149932235
Factor 9: Government’s Poor Role in Monitoring Material’s Prices:
The ninth question’s objective is to seek specialists’ opinion on the impact of
government’s poor role in monitoring material’s prices of construction’s costs of housing.
The question has been answered by 237 people. Out of the completed surveys, 28% of
the respondents have evaluated the impact of this factor at 5 (Very High Impact), 36% of
the respondents have evaluated the impact of this factor at 4 (High impact), 20% of the
respondents have evaluated the impact of this factor at 3 (Moderate Impact), 11% of the
respondents have evaluated the impact of this factor at 2 (Low Impact), and 5% of the
respondents have evaluated the impact of this factor at 1 (Very Low Impact), as shown in
Table 17 and Figure 24. The mean of the collected data is 3.721518987 and the standard
deviation is 1.134251514, as shown in Table 18.

57
Figure 24. Effect of government’s poor role in monitoring material’s prices on housing
costs
Table 17.Government’s poor
Table 18. Statistical analysis
role in material’s prices.
Of responses to question 9.
Bin Frequency
Q9
1 12
2 25
Mean 3.721518987
3 47
Standard Error 0.073677553
4 86
Median 4
5 67
Mode 4
Standard Deviation 1.134251514
Sample Variance 1.286526496
Kurtosis -0.22835593
Skewness -0.71813094
Range 4
Minimum 1
Maximum 5
Sum 882
Count 237
Confidence Level
(95.0%) 0.145149705
1
5%
2
11%
3
20%
4
36%
5
28%
Impact Score

58
Factor 10: Poor Inspection and Monitoring of Government Projects:
The subjective of the tenth question is to seek experts’ opinion on the effect of
poor inspection and monitoring system of government projects (leading to increased
project duration) on increasing construction’s costs of housing. The question has been
answered by 237 people. Out of the completed surveys, 22% of the respondents have
evaluated the impact of this factor at 5 (Very High Impact), 27% of the respondents have
evaluated the impact of this factor at 4 (High impact), 30% of the respondents have
evaluated the impact of this factor at 3 (Moderate Impact), 16% of the respondents have
evaluated the impact of this factor at 2 (Low Impact), and 5% of the respondents have
evaluated the impact of this factor at 1 (Very Low Impact), as shown in Table 19 and
Figure 25. The mean of the collected data is 3.459915612 and the standard deviation is
1.140304, as shown in Table 20.
Figure 25. Effect of poor inspection and monitoring system of government projects on
housing costs
1
5%
2
16%
3
30%
4
27%
5
22%
Impact Score

59
Table 19. Poor inspection and
Table 20. Statistical analysis
Monitoring system of government
projects.
Of responses to question 10.
Bin Frequency
Q10
1 11
2 38
Mean 3.459915612
3 72
Standard Error 0.074070704
4 63
Median 3
5 53
Mode 3
Standard Deviation 1.140304
Sample Variance 1.300293213
Kurtosis -0.77079247
Skewness -0.24629634
Range 4
Minimum 1
Maximum 5
Sum 820
Count 237
Confidence Level
(95.0%) 0.14592424
Factor 11: Existence of Black Market:
The eleventh question is to seek experts’ opinion on the impact of the existence of
black market (materials and labor) on increasing construction’s costs of housing. The
question has been answered by 237 people. Out of the completed surveys, 26% of the
respondents have evaluated the impact of this factor at 5 (Very High Impact), 32% of the
respondents have evaluated the impact of this factor at 4 (High impact), 26% of the
respondents have evaluated the impact of this factor at 3 (Moderate Impact), 13% of the
respondents have evaluated the impact of this factor at 2 (Low Impact), and 3% of the
respondents have evaluated the impact of this factor at 1 (Very Low Impact), as shown in
Table 21 and Figure 26. The mean of the collected data is 3.641350211 and the standard
deviation is 1.090239376, as shown in Table 22.

60
Figure 26. Effect of existence black market on construction and housing’s costs.
Table 21. Existence of a black
Table 22. Statistical analysis
market.
Of responses to question 11.
Bin Frequency
Q11
1 7
2 31
Mean 3.641350211
3 63
Standard Error 0.070818658
4 75
Median 4
5 61
Mode 4
Standard Deviation 1.090239376
Sample Variance 1.188621898
Kurtosis -0.62209988
Skewness -0.41631613
Range 4
Minimum 1
Maximum 5
Sum 863
Count 237
Confidence Level
(95.0%) 0.13951749
1
3%
2
13%
3
26%
4
32%
5
26%
Impact Score

61
Factor 12: High Inflation Rate.
The twelfth question is to ask specialists’ opinion on the effect of high inflation
rate on increasing construction’s costs of housing. The question has been answered by
237 people. Out of the completed surveys, 13% of the respondents have evaluated the
impact of this factor at 5 (Very High Impact), 28% of the respondents have evaluated the
impact of this factor at 4 (High impact), 31% of the respondents have evaluated the
impact of this factor at 3 (Moderate Impact), 16% of the respondents have evaluated the
impact of this factor at 2 (Low Impact), and 12% of the respondents have evaluated the
impact of this factor at 1 (Very Low Impact), as shown in Table 23 and Figure 27. The
mean of the collected data is 3.130801688 and the standard deviation is 1.194878101, as
shown in Table 24.
Figure 27. Effect of high inflation rate on housing and construction’s costs
1
12%
2
16%
3
31%
4
28%
5
13%
Impact Score

62
Table 23. High inflation rate.
Table 24. Statistical analysis
Bin Frequency
of responses to question 12.
1 29
Q12
2 38
3 73
Mean 3.130801688
4 67
Standard Error 0.077615673
5 30
Median 3
Mode 3
Standard Deviation 1.194878101
Sample Variance 1.427733677
Kurtosis -0.76888272
Skewness -0.2398466
Range 4
Minimum 1
Maximum 5
Sum 742
Count 237
Confidence Level
(95.0%) 0.152908065
Factor 13: Contractors Who Undertake Projects Beyond Their Capacity:
The thirteenth question is to ask specialists’ opinion about the effect of
contractors who undertake projects beyond their capacity on construction’s costs of
housing. The question has been answered by 237 people. Out of the completed surveys,
25% of the respondents have evaluated the impact of this factor at 5 (Very High Impact),
27% of the respondents have evaluated the impact of this factor at 4 (High impact), 26%
of the respondents have evaluated the impact of this factor at 3 (Moderate Impact), 15%
of the respondents have evaluated the impact of this factor at 2 (Low Impact), and 7% of
the respondents have evaluated the impact of this factor at 1 (Very Low Impact), as
shown in Table 25 and Figure 28. The mean of the collected data is 3.483050847 and the
standard deviation is 1.204481355, as shown in Table 26.

63
Figure 28. Impact of contractors who undertake projects beyond their capacity on
housing’s costs
Table 25. Contractors who undertake
Table 26. Statistical analysis
projects beyond their capacity.
Of responses to question 13.
Bin Frequency
Q13
1 16
2 35
Mean 3.483050847
3 62
Standard Error 0.078405058
4 65
Median 4
5 58
Mode 4
Standard Deviation 1.204481355
Sample Variance 1.450775334
Kurtosis -0.7724095
Skewness -0.37985282
Range 4
Minimum 1
Maximum 5
Sum 822
Count 236
Confidence Level
(95.0%) 0.154466594
1
7% 2
15%
3
26% 4
27%
5
25%
Impact Score

64
Factor 14: Speculative Purchase of Undeveloped Lands:
The fourteenth question is to ask experts’ opinion on the influence of speculative
purchase of undeveloped lands on increasing construction’s costs of housing. The
question has been answered by 237 people. Out of the completed surveys, 52% of the
respondents have evaluated the impact of this factor at 5 (Very High Impact), 35% of the
respondents have evaluated the impact of this factor at 4 (High impact), 10% of the
respondents have evaluated the impact of this factor at 3 (Moderate Impact), 3% of the
respondents have evaluated the impact of this factor at 2 (Low Impact), and 0% of the
respondents have evaluated the impact of this factor at 1 (Very Low Impact), as shown in
Table 27 and Figure 29. The mean of the collected data is 4.35443038 and the standard
deviation is 0.797846275, as shown in Table 28.
Figure 29. Effect of speculative purchase of undeveloped lands on housing and
construction’s costs
1
0%
2
3%
3
10%
4
35%
5
52%
Impact Score

65
Table 27. Speculative purchase of
Table 28. Statistical analysis
undeveloped lands.
Of responses to question 14.
Bin Frequency
Q14
1 1
2 6
Mean 4.35443038
3 24
Standard Error 0.051825685
4 83
Median 5
5 123
Mode 5
Standard Deviation 0.797846275
Sample Variance 0.636558678
Kurtosis 1.406761508
Skewness -1.23089158
Range 4
Minimum 1
Maximum 5
Sum 1032
Count 237
Confidence Level
(95.0%) 0.102100064
Factor 15: Corruption in Assigning/Selling Undeveloped Lands:
The objective of the fifteenth question is to ask experts’ opinion about the impact
of corruption in assigning/selling undeveloped lands on construction’s costs of housing.
The question has been answered by 237 people. Out of the completed surveys, 60% of
the respondents have evaluated the impact of this factor at 5 (Very High Impact), 33% of
the respondents have evaluated the impact of this factor at 4 (High impact), 6% of the
respondents have evaluated the impact of this factor at 3 (Moderate Impact), 1% of the
respondents have evaluated the impact of this factor at 2 (Low Impact), and 0% of the
respondents have evaluated the impact of this factor at 1 (Very Low Impact), as shown
in Table 29 and Figure 30. The mean of the collected data is 4.497890295 and the
standard deviation is 0.704852867, as shown in Table 30.

66
Figure 30. Influence of corruption in assigning/selling undeveloped lands on housing
cost.
Table 29. Corruption in selling/
Table 30. Statistical analysis
assigning of undeveloped lands.
Of responses to question 15.
Bin Frequency
Q 15
1 1
2 3
Mean 4.497890295
3 14
Standard Error 0.045785114
4 78
Median 5
5 141
Mode 5
Standard Deviation 0.704852867
Sample Variance 0.496817564
Kurtosis 3.137431774
Skewness -1.56668002
Range 4
Minimum 1
Maximum 5
Sum 1066
Count 237
Confidence Level
(95.0%) 0.090199735
1
0%
2
1% 3
6%
4
33% 5
60%
Impact Score

67
Factor 16: Exporting Construction’s Materials:
The sixteenth question is to solicit experts’ opinion about the influence of
exporting construction’s materials on construction’s costs of housing. The question has
been answered by 237 people. Out of the completed surveys, 27% of the respondents
have evaluated the impact of this factor at 5 (Very High Impact), 34% of the respondents
have evaluated the impact of this factor at 4 (High impact), 23% of the respondents have
evaluated the impact of this factor at 3 (Moderate Impact), 12% of the respondents have
evaluated the impact of this factor at 2 (Low Impact), and 4% of the respondents have
evaluated the impact of this factor at 1 (Very Low Impact), as shown in Table 31 and
Figure 31. The mean of the collected data is 3.675105485 and the standard deviation is
1.108486375, as shown in Table 32.
Figure 31. Impact of exporting construction’s materials on housing costs
1
4%
2
12%
3
23%
4
34%
5
27%
Impact Score

68
Table 31. Exporting construction’s
Table 32. Statistical analysis
materials.
Of responses to question 16.
Bin Frequency
Q16
1 9
2 29
Mean 3.675105485
3 55
Standard Error 0.072003928
4 81
Median 4
5 63
Mode 4
Standard Deviation 1.108486375
Sample Variance 1.228742044
Kurtosis -0.46006205
Skewness -0.55291474
Range 4
Minimum 1
Maximum 5
Sum 871
Count 237
Confidence Level
(95.0%) 0.141852551

69
A summary of the collected data is shown in table 33.
Table 33. Summary of frequencies, mean, mode, and standard deviations for factors
Factor
Mean Mode Std.
Dev.
Impact score
5 4 3 2 1
Factor 1: Escalation of oil prices 3.42 3 1.62 58 62 64 29 24
Factor 2: Increasing demand of construction’s materials 3.56 4 1.05 50 79 71 29 8
Factor 3: Increasing demand of engineering’s services 3.29 3 1.15 40 67 69 45 16
Factor 4: High demand of housing 4.32 5 0.81 117 90 22 6 2
Factor 5: Poor construction’s productivity ( low supply) 3.72 4 1.06 67 75 63 27 5
Factor 6: Rapid rise in the rate of population’s growth 4.29 5 0.87 120 81 23 12 1
Factor 7: Monopoly and other unethical practices of
suppliers
3.60 4 1.07 56 74 72 27 8
Factor 8: Lack of trained labor 3.42 4 1.17 50 70 62 41 14
Factor 9: Government’s poor role in monitoring
material’s prices
3.72 4 1.13 67 86 47 25 12
Factor 10: Poor inspection system of government
projects
3.45 4 1.14 53 63 72 38 11
Factor 11: Existence of black market 3.64 4 1.09 61 75 63 31 7
Factor 12: High inflation rate 3.13 3 1.19 30 67 73 38 29
Factor 13: Contractors who undertake projects beyond
their capacity
3.48 4 1.20 58 65 62 35 16
Factor 14: Speculative purchase of undeveloped lands 4.35 5 0.79 123 83 24 6 1
Factor 15: Corruption in assigning/selling undeveloped
lands
4.49 5 0.70 141 78 14 3 1
Factor 16: Exporting construction’s materials 3.67 4 1.10 63 81 55 29 9

70
CHAPTER 5
RESULTS AND RECOMMENDATIONS
5.1 The Goal of Results
Before the current study, the main antagonists of housing and construction’s costs
seemed extensively complex and were thus largely unknown. The researcher’s goal was
to reveal the main factors that increased housing and construction’s costs in Riyadh. The
research was conducted based on 237 opinions of specialists, experts, engineers, and
individuals in related fields.
The Saudi government and people have been suffering severely from this problem
because of its novelty. As the study shows, many factors contribute to this complex
problem. The Saudi government has to identify and analyze the key factors that
contribute to the increase of housing’s costs across the nation through a scientific study
such as this research before it can solve the problem. This study is considered a first
attempt in the field of housing and construction’s costs increase, which will help the
Saudi government (specifically the Ministry of Housing) recognize the most important
factors and their impact on housing and construction’s costs. The Ministry of Housing
will benefit greatly from this study and future research in creating long-term strategies to
solve this problem. One of the unique characteristics of this study is that it identifies four
main factors that affect housing’s costs. In addition, the results of this research are
organized in the order of importance, which should provide an easy reference tool for
future studies. This research is published in Saudi Arabia.

71
5.2 Results of the Survey
Based on the results from the collected data, figures 32 and 33 show modes and
means for each factor.
Figure 32. Modes of factors (Ascending order)
0
1
2
3
4
5
6
Mode

72
Figure 33. Means of factors (Ascending order)
00.5
11.5
22.5
33.5
44.5
5
Mean

73
According to the results of the modes, means, figures, and tables, the order of
importance of the factors that have impacted construction and housing’s costs are as
follows, in table 34:
Table 34. Ranks of factors
Rank Factor Mode Mean
1 F.15: Corruption in assigning/selling undeveloped
lands.
5 4.49
2 F.14: Speculative purchase of undeveloped lands. 5 4.35
3 F.4: High demand of housing. 5 4.32
4 F.6: Rapid rise in the rate of population’s growth. 5 4.29
5 F.5: Poor construction productivity, leading to low
supply of housing.
4 3.725
6 F.9: Government’s Poor Role in Monitoring
Materials Prices. 4 3.721
7 F.16: Exporting Construction’s Materials. 4 3.67
8 F.11: Existence of Black Market. 4 3.64
9 F.7: Monopoly and Other Unethical Practices of
Suppliers.
4 3.60
10 F.2: Increasing Demand of Construction’s Materials. 4 3.56
11 F.13: Contractors Who Undertake Projects Beyond
Their Capacity.
4 3.48
12 F.8: Lack of trained labor 4 3.42
13 F.10: Poor inspection and monitoring system of
government projects. 3 3.45
14 F.1: Escalation of Oil’s Prices. 3 3.42
15 F.3: Increasing Demand of Engineering Services to
Support Development of Public Work Projects.
3 3.29
16 F.12: High Inflation Rate. 3 3.13

74
5.3 Most Influential Factors and Recommendations to Address
their Effects
The aim of this research is to identify the influences of the factors that
contributed to the increase of housing and construction’s costs. Based on the mean
average and mode, the four factors are as follows:
1) The first main factor is Factor 15, which is corruption during assigning/selling
undeveloped lands. The mean of this factor is 4.49, and the mode is 5. The present
study, therefore, considers this factor to be the source of the problem, which is
supported by the fact that many experts have claimed that the problem will be
solved if this factor is addressed properly. At present, the Saudi government does
not apply taxes to land ownership. According to TELL (2002), the corruption and
other fraudulent practices on the part of the government, suppliers, and
contractors also directly affect the housing and construction’s costs. The
corruption of selling undeveloped lands begins when investors buy a very large
piece of land, such as one million square meters, in an undeveloped area. When
the urban sprawl reaches their land in a few years, investors refuse to sell their
land so that they can increase the price of all lands around it and thus control the
market’s prices. After waiting for the prices to skyrocket, investors start to sell
pieces of the land at very high prices.
Another form of corruption is when investors buy a very large piece of
land in a developed area, and keep it for at least ten years with the goal of
decreasing supply and increasing the prices of undeveloped areas. Investors
accomplish this second form of corruption by creating an agreement among one

75
another to control the real estate’s market. In addition, the Saudi government
grants large tracts of land to some people in both developed and undeveloped
areas, and those recipients can simply sell the land for high prices without any
monitoring by the Saudi government. The government is in the best position to
deter this corruption, because it can pass tax laws. Investors currently do not lose
any money by holding onto lands. However, if the land comes with a tax, such as
10% of its appraised value, then the investors will have to sell the lands faster to
avoid the cost leading to decreased prices.
Investors can make more money by avoiding paying property taxes and by
selling quickly in a high-demand market. The recommendations for solving this
problem are fourfold. 1) Apply a 15% tax on large plots of land to prevent
monopolies, because “applying taxes on undeveloped areas will decrease the
prices at least 30%” (Alhugail, 2012). 2) Monitor the prices of land, unify the
areas of land, and establish harsh sanctions for manipulation. 3) Saudi Arabian
government has to stop the grant lands in developed areas. 4) Prevent investors
from owning large expanses of land in developed areas; without this monopoly,
more owners can engage in trading. Solving the corruption problem requires
serious actions from up high. Investors are already monopolizing enormous
proportions of usable lands, so few solutions (the recommendations) other than
applying taxes will help to solve the problem at this stage.
2) The second main factor is Factor 14, which is the speculative purchase of
undeveloped lands. The mean of this factor is 4.35, and its mode is 5. This factor
is related to the first factor, so both of them are considered the main source of the

76
complex problem of housing’s costs. Purchasing either undeveloped or
developed lands near housing areas in Riyadh has led to the high prices of
developed lands. Moreover, “there is a speculative undeveloped lands actions in
Riyadh city, and that leads to making the problem worse” (Aleqtesadya, 2012).
Many investors have changed their businesses after the collapse of the stock
market, thus complicating the problem. “After the stock market collapse, the
investors went into the real estate market” (Bawardi, 2012). The speculators have
an organized manipulation system among them to control the market. They
bought many small pieces of land to keep for a few months, and then started to
sell them individually at high prices. These practices are called speculative
purchases operations, such as operations in the stock market.
Another form of speculative purchases is raising the prices once and
refusing to decrease the prices until a lot of land is sold. Because of these
operations, a piece of land in a developed area can be bought and sold many times
in one week at different prices. The high demand of housing, which will be
discussed next, makes this practice possible.
In general, speculators are exploiting the housing crisis and manipulating
the market. Finally, the government is not playing its role regarding these
speculative purchases while the Saudi people suffer from the housing crisis. The
Saudi government must stop speculative operations, because its citizens are facing
a housing crisis. Speculative purchases in the real estate’s market are unjust,
because people from all walks of life have equal rights to own a house.

77
This study makes three recommendations for deterring these purchases. 1)
Prevent the speculative purchases in housing areas, and establish laws and
conditions for buying and selling all types of land. 2) Create large land areas with
services ready, and unify these areas into one large area so that large areas of land
are purchased only once and for the sole purpose of building houses. 3) Unify the
prices of land tracts within each area.
3) Factor 4 holds the third strongest influence over costs, which is high demand of
housing. The mean of this factor is 4.32, and it has a mode of 5. The demand of
housing of Saudi citizens is so high that it created a shortage. LaSalle (2010)
specified that this high demand requires 150,000 additional residential housing
units per annum. Only the Saudi government can afford supporting this large
number of units. Some of the shortage is due to the lack of natural resources, but a
large portion of it has been created by investors.
The reasons behind the high demand of housing include 1) the government
housing projects which have essentially contributed to the high demand of
construction’s materials, even though the government intended to decrease the
high demand of these projects. 2) Public work projects, such as schools, hospitals,
and infrastructure, have also contributed to the increased costs of housing and
construction. 3) The high demand of housing from the citizens of Riyadh city
comprises the main demand for housing, and this demand will be discussed in the
next factor.
Saudi citizens are struggling to acquire both houses and apartments.
Investors caused the high demand of housing by buying apartments and then

78
renting them to citizens, so the high demand of housing is shared by many parties;
nevertheless, the main demand comes from the citizens. All of the previous
reasons have increased housing’s costs. When the government deters corruption
and speculative purchases (the first two factors) it will already be contributing
significantly to reducing the high demand of housing. The next four
recommendations will address this problem. 1) Monitor the prices of
construction’s materials and unify the prices of each item. In addition, establish
tough sanctions for manipulation, and prevent companies from storing
construction’s materials, thirst the market of those materials, and then sell the
materials at high prices. Moreover, prevent companies from exporting
construction’s materials outside Saudi Arabia. 2) Ask international construction’s
companies with extensive experience to share their experiences in reducing costs
and to obtain development strategies and good management for housing projects.
3) Unify prices of rental apartments. 4) Manage and control public work projects
to decrease the prices of construction’s materials.
4) The fourth most influential factor is Factor 6, which is the rapid rise in the rate of
population’s growth. The mean of this factor is 4.29, and the mode is 5. Saudi
Arabian population growth’s rate is 2.90 % (Central Department of Statistics and
Information, 2012), which is contributing to the increase of prices of housing and
construction. Saudi Economic Survey (2012) “projects that property prices will
only raise as demand across the nation grows”. In fact, the national growth rate is
so high that the supply of housing will not catch up anytime soon. Saudi Arabia
already suffers from a shortage in houses, as LaSalle (2010) remarks, “Saudi

79
Arabia, the biggest Arab economy, is facing a massive housing problem due to
rapid population’s growth.” This high growth of population is what caused the
third factor of the high demand of housing in Riyadh. High demand also presents
tempting opportunities for investors to exploit supplies, leading to factors one and
two. In short, all four top influential factors are interlinked. The Saudi Arabian
population is currently around 29,195,000, and the population of Riyadh alone is
around 5 million, putting 17% of the population in Riyadh (Central Department of
Statistics and Information, 2012). This percentage is high and arose from citizens
immigrating from neighboring cities and villages to Riyadh for the purpose of
finding better jobs or gaining education. Another source of the high demand of
housing in Riyadh is the low average of age in Riyadh, which is a mere 18 years
(Alhawas, 2010). All of these young citizens will continue to be in need of houses
for the next 10 years. The recommendations to solve this problem are threefold. 1)
Revive small cities around Riyadh to reduce the number of people moving in to
big cities, which will create “reverse immigration” where people emigrate from
large cities to small ones. Yanbu (in the western region) and Jubail (in the eastern
region) are good examples of two cities that the Saudi government developed to
discourage people from moving to the capitol city. 2) The current height limit in
housing areas is only two floors, so allowing citizens to build more floors on their
houses will help reduce the high demand in Riyadh. 3) Improve the current
mortgage system so that more citizens can begin to move into houses.

80
5.4 Additional Thoughts from the Survey/Experts
The participants mentioned other factors less frequently, which nevertheless affect
housing’s costs.
1) Construction’s companies struggle with lousy management. Many construction’s
projects run into problems a mere couple of months after commencement due to
bad management and lack follow up, which will delay projects and make them
cost even more than the initial estimated budget. The high demand of housing has
also encouraged some contractors to take more projects beyond their capacity,
leading to inadequate management.
2) The government has not been proactive in bolstering underdeveloped cities. Only
a few satellite cities, such as Jubail and Yanbu, have attracted substantial
residents, so the Saudi government has to develop other cities in other regions
around Riyadh to decrease the population’s growth in Riyadh.
3) Many Saudi families suffer from the law that restricts them from building more
than two floors in their houses. This law has increased the demand of housing in
Riyadh, because a house with only two floors is not conducive to subletting. Thus,
the government should allow more floors in houses to face the high demand.
4) Many laborers who work in construction’s projects lack credibility. The high
demand has created a labor shortage that many workers can exploit. If the
government monitors the laborers and applies sanctions for manipulation, it can
decrease costs of construction.

81
CHAPTER 6
SUMMARY AND CONCLUSION
6.1 Summary
The city of Riyadh suffers from high housing and construction’s costs, which
have increased by more than 200% in the last 7 years. Saudis initially thought that this
problem was temporary, but the citizens of Riyadh continue to suffer from the escalation
of housing costs to this day. There is a significant interest in identifying the key causes of
the problem, and there are numerous opinions on where this problem stems from. It
seems as if every expert or specialist has a unique opinion about the factors that led to
costs’ escalation in the past few years.
Some researchers look at this problem from a social perspective, because in the
Saudi culture every citizen believes he/she should own a house, and most Saudis
currently cannot afford to own a house. The government is interested in understanding
the causes of housing and construction costs’ escalation in order to develop strategies to
address this crucial issue and find long-term solutions to offer affordable housing.
In response to the absence of research regarding this problem, the researcher has
decided to conduct a survey to try to identify the factors that led to the significant
escalation in construction’s costs in Saudi Arabia in the past few years, focusing on the
city of Riyadh as a case study. While conducting a literature review, the researcher
identified 16 factors that were mentioned as possible factors. It is unknown which of
these factors are more influential than others, and as such, the main objective of this
study is to conduct a survey to identify the most significant factors that affect the housing
sector.

82
All of the survey samples were collected from construction industry professionals
and experts who work in Riyadh, including experts, specialists, engineers, economists,
construction material’s suppliers, and individuals in related fields. The required sample
size was calculated using the statistical equation mentioned in Chapter 4, and based on an
estimated level of confidence of 90%, standard error of 10%, and a standard deviation
calculated from 30 random samples collected initially. The required sample size was
estimated to be at least 215 surveys, and the researcher was able to collect a total of 237
surveys from experts in the field of construction.
After collecting the data, the researcher analyzed the data through Microsoft
Excel software by applying descriptive statistics, including determining the means,
modes, and standard deviations. Tables and figures have been used to show the results of
the survey. After analyzing the data, the researcher identified the main factors based on
the mode and mean averages. The researcher has identified the top four factors that
caused the increase of housing and construction’s costs.
These four factors are as follows: corruption in selling lands, speculative
purchases of lands, high demand of housing, and the high rate of population’s growth in
Riyadh. All of these factors and more have contributed to the significant increase in the
costs of housing and construction in Riyadh in the past few years.

83
6.2 Conclusion
The four main factors that increased the housing costs are studied more in-depth, and
recommendations were made on how to address them:
1) Factor.15, which is corruption in assigning/selling undeveloped lands. The mean
score for the impact of this factor, as identified by experts, is 4.49, with a mode of
5. The recommendations for addressing/resolving problems caused by this factor
consist of four folds: (1) apply an annual 15% tax on very large plots of lands to
prevent monopoly, it is estimated that it will help bring down housing costs by at
least 30% (Alhugail, 2012), (2) monitor the prices of land, unify plot sizes, and
establish tough sanctions on monopoly, (3) prevent land grants in developed
areas, and (4) prevent investors from owning large expanses of land in
developed/undeveloped areas. Solving the problem of corruption requires serious
actions from the government as investors are already monopolizing enormous
proportions of usable lands. The above few recommendations should help address
this problem for a short term.
2) Factor.14, which is speculative purchase of undeveloped lands. The mean score
of the impact of this factor, as identified by experts, is 4.35, with a mode of 5. The
recommendations for addressing/resolving the problems caused by this factor
consist of three folds: (1) prevent speculative purchases in housing areas, and
establish laws and conditions for buying and selling all types of land, (2) create
large land areas with infrastructure, and unify these areas into one large area, such
as 350 m2, so that large areas of land are purchased only once and for the sole
purpose of building houses, and (3) unify the prices of land tracts within each

84
area. The government must prevent the speculative purchases of developed/
undeveloped lands to actually start solving this problem. The above
recommendations should solve this problem on a short term.
3) Factor.4, which is high demand of housing. The mean score of the impact of this
factor, as identified by experts, is 4.32, with a mode of 5. The recommendations
for addressing/resolving problems caused by this factor consist of four folds: (1)
the government should monitor the prices of construction’s materials and unify
the prices for each item. In addition, establish tough sanctions on manipulation,
and prevent companies from storing large amount of construction’s materials,
thirst the market of those materials to sell them at higher prices. Moreover,
prevent companies from exporting construction’s materials outside Saudi Arabia
without government permission, (2) ask international construction’s companies
with extensive experience to share their experiences on how to reduce costs and to
obtain development strategies and good management for housing projects, (3)
unify the prices of rental apartments, and (4) reduce public work projects to
decrease the prices of construction’s materials. The Saudi government has to
monitor the market of housing and construction to prevent manipulation.
Monitoring will stop manipulation and that will help decrease constriction’s costs
in Riyadh.
4) Factor.6 which is rapid rise in the rate of population’s growth. The mean score of
the impact of this factor, as identified by experts, is 4.29, with a mode of 5. The
recommendations for addressing/ resolving the problems caused by this factor
consist of three folds: (1) revive small cities around Riyadh to reduce congestion

85
and crowding, which will reduce the immigration to large cities, such as Riyadh.
Yanbu (in the western region) and Jubail (in the eastern region) are good
examples of two cities that the Saudi government developed to discourage people
from moving to the capitol city, (2) the current height limit in housing areas is
only two floors, so allowing citizens to build more floors in their houses will help
reduce the high demand of construction’s materials in Riyadh, and (3) develop a
new mortgage system to assist with the high demand so that more citizens can
begin to move into houses instead of apartments . When the government retrieves
and develops small cites around Riyadh that will encourage people to stay in their
cities and reduce the high demand of housing in Riyadh. The government should
allow Saudi citizens to build more than two floors to make the housing as a
vertically movement to reduce the high demand.
6.3 Recommendations for future work
Future research work will focus on improving the results by studying the
correlation among the top four crucial factors, if any, and how they are related to
one another.
Further research will also focus on developing strategic solutions for identified
problems on a long term in Riyadh.
Also future research could focus on evaluating the effect of taking the
aforementioned recommended corrective actions to see whether they are effective
enough to slow down the escalation of housing and construction’s costs.

86
APPENDIX - A = TEST SURVEY

87
Effect on Escalating Building & Construction Costs
التأثير على زيادة أسعار البناء والتشييد
Factors العوامل
Very High
جدا عالي
High
عالي
Moderate
متوسط
Low
منخفض
Very Low
منخفض جدا
1. Oil price escalation. (influx in national income that drives inflation)
إرتفاع أسعار النفط. -1 )زياده في الدخل القومي مما يزيد التضخم(
2. Increasing demand for construction materials. (due to recent government subsidization of housing projects)
.مواد البناء على المتزايد الطلب -2 حديثاً( لإسكانمشاريع ال الحكوميالدعم بسبب )
3. Increasing demand for engineering services to support development of public works projects. (government projects, such as schools, hospitals, and infrastructure)
الأشغال العامه. مشاريعدعم هندسية لال لخدماتل المتزايد الطلب -3 (مثل المدارس والمستشفيات والبنية التحتيةمشاريع الحكوميه ال)
4. High demand for housing. .رتفاع الطلب على المساكنإ -4
5. Poor construction productivity. (leading to low supply of housing)
البناءتشييد وضعف انتاجيه ال -5 من المساكن( ضوعرممما يؤدي الى إن إنخفاض ال)
6. Rapid rise in the rate of population growth. .الارتفاع السريع في معدل النمو السكاني -6
7. Monopoly and unethical practices of suppliers. (cement, steel and other construction materials)
نمورديالحتكار من قبل التلاعب والإ -7 (الأسمنت والحديد ومواد البناء الأخرى)
8. Lack of trained labor. .نقص العمالة المدربة -8
9. Government’s poor role in monitoring materials prices.
.أسعار مواد البناءضعف الرقابه على -9
10. Poor inspection and monitoring of government projects. (leading to increased project duration)
ضعف رقابه ومتابعه المشاريع العامه. -11 (عوالتأخر في إنهاء المشر)مما يؤدي إلى
11. Existence of a black market. (materials and labor)
) مواد و عمالة( جود السوق السوداء للمقاولاتو -11
12. High inflation rate. .إرتفاع معدل التضخم -12
13. Contractors undertaking projects beyond their capacity. .ن لمشاريع تتجاوز قدراتهموالمقاولتصدي -13
14. Speculative purchase of undeveloped lands. .المضاربة في شراء الأراضي الغير المطورة -14
15. Corruption in assigning/selling undeveloped lands. الاراضي الغير مطورة.في تخصيص وبيع الفساد -15
16. Exporting construction materials.
.خارجالتصدير مواد النباء الى -16
17. Others: عوامل أخرى: -17
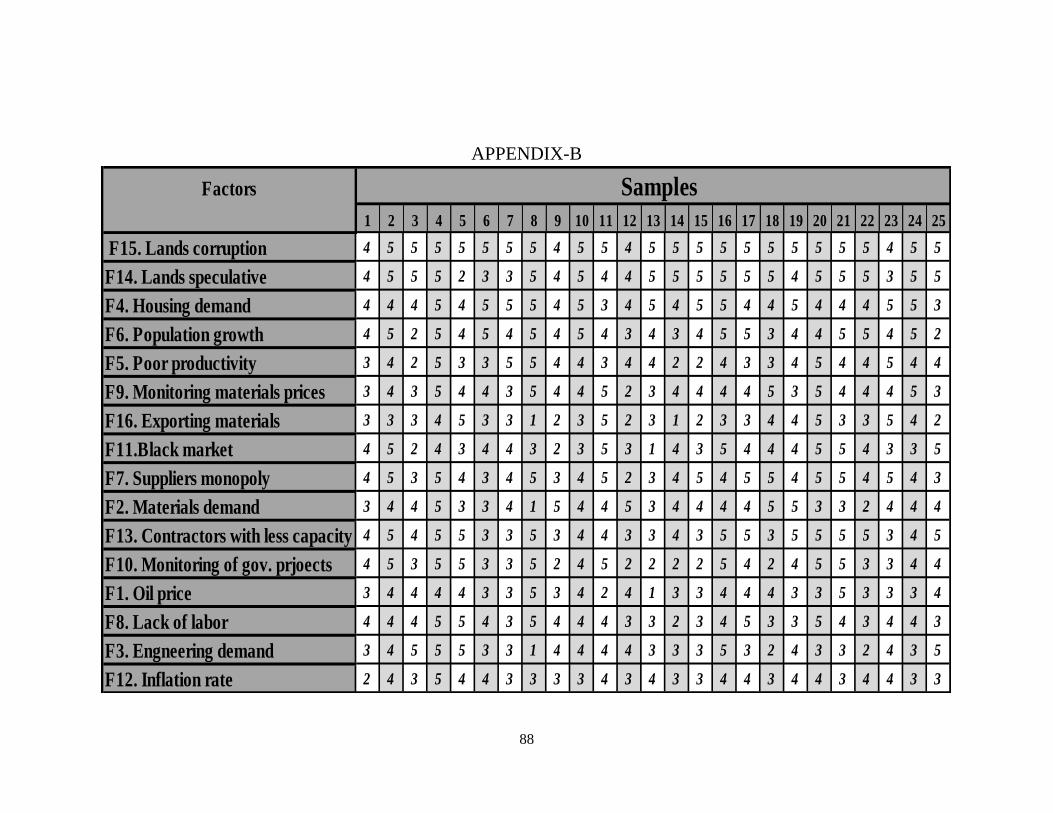
88
APPENDIX-B
Factors Samples
1 2 3 4 5 6 7 8 9 10 11 12 13 14 15 16 17 18 19 20 21 22 23 24 25
F15. Lands corruption 4 5 5 5 5 5 5 5 4 5 5 4 5 5 5 5 5 5 5 5 5 5 4 5 5
F14. Lands speculative 4 5 5 5 2 3 3 5 4 5 4 4 5 5 5 5 5 5 4 5 5 5 3 5 5
F4. Housing demand 4 4 4 5 4 5 5 5 4 5 3 4 5 4 5 5 4 4 5 4 4 4 5 5 3
F6. Population growth 4 5 2 5 4 5 4 5 4 5 4 3 4 3 4 5 5 3 4 4 5 5 4 5 2
F5. Poor productivity 3 4 2 5 3 3 5 5 4 4 3 4 4 2 2 4 3 3 4 5 4 4 5 4 4
F9. Monitoring materials prices 3 4 3 5 4 4 3 5 4 4 5 2 3 4 4 4 4 5 3 5 4 4 4 5 3
F16. Exporting materials 3 3 3 4 5 3 3 1 2 3 5 2 3 1 2 3 3 4 4 5 3 3 5 4 2
F11.Black market 4 5 2 4 3 4 4 3 2 3 5 3 1 4 3 5 4 4 4 5 5 4 3 3 5
F7. Suppliers monopoly 4 5 3 5 4 3 4 5 3 4 5 2 3 4 5 4 5 5 4 5 5 4 5 4 3
F2. Materials demand 3 4 4 5 3 3 4 1 5 4 4 5 3 4 4 4 4 5 5 3 3 2 4 4 4
F13. Contractors with less capacity 4 5 4 5 5 3 3 5 3 4 4 3 3 4 3 5 5 3 5 5 5 5 3 4 5
F10. Monitoring of gov. prjoects 4 5 3 5 5 3 3 5 2 4 5 2 2 2 2 5 4 2 4 5 5 3 3 4 4
F1. Oil price 3 4 4 4 4 3 3 5 3 4 2 4 1 3 3 4 4 4 3 3 5 3 3 3 4
F8. Lack of labor 4 4 4 5 5 4 3 5 4 4 4 3 3 2 3 4 5 3 3 5 4 3 4 4 3
F3. Engneering demand 3 4 5 5 5 3 3 1 4 4 4 4 3 3 3 5 3 2 4 3 3 2 4 3 5
F12. Inflation rate 2 4 3 5 4 4 3 3 3 3 4 3 4 3 3 4 4 3 4 4 3 4 4 3 3

89
Factors Samples
26 27 28 29 30 31 32 33 34 35 36 37 38 39 40 41 42 43 44 45 46 47 48 49 50
F15. Lands corruption 5 5 4 4 5 5 4 4 5 4 4 4 5 5 5 4 5 5 5 5 5 4 2 5 5
F14. Lands speculative 5 5 5 4 5 5 3 4 5 5 5 4 5 5 5 4 4 4 5 4 5 5 4 5 5
F4. Housing demand 4 5 4 4 2 4 4 3 5 4 4 3 5 5 2 4 5 4 4 3 5 4 5 3 5
F6. Population growth 5 5 5 5 4 5 4 3 4 5 4 4 3 5 5 4 5 4 3 3 4 5 4 2 5
F5. Poor productivity 4 4 3 2 2 4 4 2 5 4 5 4 4 4 5 4 3 5 5 3 4 4 1 2 4
F9. Monitoring materials prices 3 4 3 5 5 5 4 3 2 4 4 3 4 4 3 4 5 4 5 5 5 4 2 4 5
F16. Exporting materials 2 3 4 4 4 4 4 2 2 5 4 4 3 2 1 3 4 4 4 5 3 4 2 5 4
F11.Black market 1 2 4 5 5 5 5 2 2 4 4 4 3 3 3 4 5 4 5 4 5 4 2 3 3
F7. Suppliers monopoly 2 4 5 4 5 5 5 2 1 4 4 4 3 3 3 4 5 4 3 4 5 5 1 3 5
F2. Materials demand 4 4 3 5 4 3 4 2 3 4 5 4 4 3 3 4 5 4 2 3 4 4 2 4 4
F13. Contractors with less capacity 2 4 3 4 4 5 4 2 3 4 5 4 4 3 5 4 5 4 4 5 4 3 2 3 4
F10. Monitoring of gov. prjoects 1 3 4 5 3 5 4 2 1 4 4 4 5 3 4 4 4 5 4 5 5 3 2 3 4
F1. Oil price 4 3 3 5 3 3 3 2 2 3 5 3 4 2 4 3 5 4 1 2 1 3 2 4 3
F8. Lack of labor 2 5 4 5 5 5 4 2 1 5 4 4 4 3 3 4 5 5 5 1 3 5 2 3 4
F3. Engneering demand 3 1 3 5 3 3 3 3 1 4 5 4 4 2 4 4 5 5 2 1 3 3 2 3 3
F12. Inflation rate 3 4 4 5 5 5 5 3 3 4 5 4 5 3 2 4 4 4 3 4 3 4 3 5 5

90
Factors Samples
51 52 53 54 55 56 57 58 59 60 61 62 63 64 65 66 67 68 69 70 71 72 73 74 75
F15. Lands corruption 5 5 5 5 5 5 5 5 5 5 4 3 2 5 5 4 5 3 5 3 5 3 4 3 5
F14. Lands speculative 4 5 4 4 5 5 5 5 5 4 4 3 2 4 5 4 3 4 4 4 4 3 3 3 4
F4. Housing demand 4 4 3 5 5 5 4 4 5 5 5 4 4 4 5 5 4 5 5 4 3 4 3 4 5
F6. Population growth 4 5 4 4 2 3 5 4 5 5 5 4 4 4 5 5 4 5 5 4 4 2 4 3 5
F5. Poor productivity 3 4 3 4 1 3 4 2 4 5 4 4 5 4 5 3 4 4 4 5 3 3 4 3 5
F9. Monitoring materials prices 4 4 5 4 3 5 2 4 5 5 5 4 5 2 5 3 4 5 5 4 5 4 3 5 5
F16. Exporting materials 4 3 4 3 1 1 3 5 2 5 5 5 3 3 5 3 4 3 3 3 4 4 5 4 3
F11.Black market 4 4 4 4 5 5 2 4 4 3 5 4 4 5 3 3 4 4 5 3 3 1 5 5 4
F7. Suppliers monopoly 4 4 5 4 4 5 3 4 5 3 5 4 5 3 3 3 4 3 3 3 4 3 4 2 5
F2. Materials demand 5 4 2 5 5 5 4 4 4 3 5 3 4 2 4 3 3 5 3 5 3 4 3 4 5
F13. Contractors with less capacity 4 5 4 3 4 5 3 3 5 5 5 4 2 4 3 2 2 4 5 3 5 3 4 4 2
F10. Monitoring of gov. prjoects 4 5 5 3 3 5 2 3 5 5 5 4 4 5 4 2 4 3 5 4 5 1 4 4 5
F1. Oil price 2 5 3 3 3 1 4 4 2 1 5 2 4 2 5 3 3 5 3 4 3 4 3 4 5
F8. Lack of labor 5 4 2 4 2 4 3 4 3 5 5 4 5 5 3 4 4 3 5 4 4 4 5 5 5
F3. Engneering demand 4 4 3 5 2 3 3 4 1 2 4 4 4 2 4 2 2 4 4 5 3 3 3 4 5
F12. Inflation rate 4 5 4 3 4 5 3 3 3 3 5 3 2 3 2 3 1 3 1 3 4 1 5 3 1

91
Factors Samples
76 77 78 79 80 81 82 83 84 85 86 87 88 89 90 91 92 93 94 95 96 97 98 99 100
F15. Lands corruption 4 5 4 5 5 3 5 4 5 5 4 5 5 5 4 5 5 5 5 4 5 5 4 5 4
F14. Lands speculative 4 1 4 5 4 3 5 4 5 5 4 5 4 3 4 5 5 4 4 5 5 5 3 5 2
F4. Housing demand 4 1 4 5 3 4 4 4 4 5 5 4 5 5 4 4 4 5 4 5 5 4 3 5 3
F6. Population growth 4 1 5 5 4 5 5 4 4 5 4 2 5 4 4 4 4 5 4 5 5 4 3 4 3
F5. Poor productivity 5 1 4 5 4 5 5 5 5 5 5 3 3 4 1 2 3 2 4 4 3 3 3 5 3
F9. Monitoring materials prices 4 1 3 5 3 4 4 3 3 5 5 4 4 5 2 5 4 4 1 4 5 3 4 5 4
F16. Exporting materials 4 1 4 5 3 3 5 2 5 5 5 5 5 4 4 4 4 3 4 5 5 4 4 3 4
F11.Black market 2 1 2 5 4 2 5 5 5 4 5 5 3 3 5 4 3 3 2 5 5 5 3 5 4
F7. Suppliers monopoly 4 1 5 4 4 5 5 3 3 5 4 1 3 4 1 2 5 2 5 3 4 3 2 3 4
F2. Materials demand 5 1 5 2 4 5 3 3 2 5 5 4 4 5 5 2 4 3 2 4 4 3 2 4 4
F13. Contractors with less capacity 5 1 4 1 3 2 5 2 1 1 5 3 4 1 4 2 3 3 3 5 5 1 5 1 4
F10. Monitoring of gov. prjoects 3 1 3 5 3 2 3 4 5 5 4 3 3 4 4 5 3 3 2 4 2 3 3 3 3
F1. Oil price 5 1 5 2 4 5 3 4 2 5 5 5 5 3 5 2 4 3 1 5 4 3 2 4 5
F8. Lack of labor 3 1 4 2 2 4 4 4 4 3 5 5 3 4 4 3 3 3 1 4 3 4 4 3 4
F3. Engneering demand 5 1 5 2 4 3 4 3 4 3 5 5 4 5 1 2 4 2 4 3 2 3 2 4 4
F12. Inflation rate 2 1 3 1 2 2 2 5 1 1 4 2 4 2 5 4 3 3 2 5 1 1 4 1 3

92
Factors Samples
101 102 103 104 105 106 107 108 109 110 111 112 113 114 115 116 117 118 119 120 121 122 123 124 125
F15. Lands corruption 5 4 5 4 4 3 5 4 2 5 3 5 4 5 5 4 3 4 4 4 5 5 5 4 4
F14. Lands speculative 5 3 5 4 4 4 5 4 3 5 4 5 4 5 5 4 3 3 5 4 5 5 5 4 2
F4. Housing demand 5 4 4 4 4 4 4 4 4 5 4 5 4 3 4 3 5 4 5 4 5 4 4 4 4
F6. Population growth 5 4 2 4 5 5 5 4 4 5 4 3 4 4 4 4 5 5 5 3 5 5 5 4 4
F5. Poor productivity 5 5 2 3 4 4 3 4 4 5 2 5 3 3 3 4 3 3 3 4 5 3 4 2 4
F9. Monitoring materials prices 5 5 4 3 5 4 5 3 3 5 2 5 5 5 4 4 5 5 5 2 1 2 5 2 4
F16. Exporting materials 4 4 5 1 5 2 4 4 4 2 1 3 5 5 4 2 5 2 3 4 5 4 5 3 4
F11.Black market 5 4 3 4 5 4 5 4 2 5 5 5 5 4 3 3 4 3 3 3 5 3 5 2 4
F7. Suppliers monopoly 5 4 5 2 2 5 5 3 5 5 5 5 3 4 3 4 3 5 3 3 4 3 4 3 5
F2. Materials demand 1 4 4 4 3 2 2 5 5 2 5 3 3 4 3 3 3 5 3 5 2 4 3 3 5
F13. Contractors with less capacity 3 3 5 4 4 3 3 3 4 3 4 1 2 5 3 2 2 4 3 3 5 4 5 3 2
F10. Monitoring of gov. prjoects 3 5 5 4 4 5 3 4 3 5 4 5 4 5 3 4 3 4 3 2 2 4 5 2 4
F1. Oil price 1 5 4 4 3 2 1 4 5 1 5 3 3 4 4 3 5 4 4 5 2 4 3 2 5
F8. Lack of labor 2 4 3 4 4 4 4 2 3 1 5 2 4 3 2 4 3 5 2 3 2 3 2 2 5
F3. Engneering demand 1 4 3 4 3 4 3 5 4 2 2 5 3 4 3 3 3 5 2 5 4 3 4 2 5
F12. Inflation rate 2 2 4 2 5 2 1 3 4 1 5 3 3 4 3 2 5 5 3 3 1 2 5 3 2

93
Factors Samples
126 127 128 129 130 131 132 133 134 135 136 137 138 139 140 141 142 143 144 145 146 147 148 149 150
F15. Lands corruption 4 5 3 3 5 5 4 5 5 4 4 4 4 4 4 4 3 5 5 4 4 5 5 5 4
F14. Lands speculative 4 4 4 3 4 4 4 5 5 5 4 4 4 3 4 4 3 5 5 4 4 5 5 5 4
F4. Housing demand 4 4 4 4 5 5 4 4 4 5 4 2 4 3 4 4 4 4 5 4 5 5 5 5 5
F6. Population growth 4 5 4 3 3 5 4 5 4 5 4 2 2 4 3 4 4 4 5 4 4 5 3 5 5
F5. Poor productivity 3 4 4 3 4 5 5 5 4 5 4 2 5 2 3 3 5 2 2 3 2 3 4 4 3
F9. Monitoring materials prices 4 4 3 4 4 3 3 3 1 5 3 4 2 3 5 4 4 4 5 4 4 4 5 5 4
F16. Exporting materials 4 4 4 3 3 3 4 4 5 5 5 5 4 5 2 5 5 4 4 3 2 4 4 4 4
F11.Black market 3 5 4 3 5 4 4 4 5 1 1 4 5 4 2 3 2 3 3 3 2 3 5 5 4
F7. Suppliers monopoly 4 4 2 3 3 4 5 4 3 5 4 4 2 4 5 3 2 2 2 3 4 3 2 5 2
F2. Materials demand 3 5 5 4 4 1 5 4 4 5 5 3 5 3 5 3 3 2 3 2 3 1 3 2 4
F13. Contractors with less capacity 1 5 3 3 4 4 4 4 5 1 4 4 4 2 5 3 4 4 3 3 2 4 3 5 4
F10. Monitoring of gov. prjoects 4 4 4 3 3 3 3 4 2 5 1 2 1 4 4 3 4 3 3 4 3 3 3 3 4
F1. Oil price 5 5 5 4 5 1 5 1 4 5 5 3 5 3 5 4 3 2 3 2 5 1 3 1 4
F8. Lack of labor 2 5 5 3 5 3 3 3 3 3 3 2 4 4 4 3 1 3 4 3 2 3 2 2 2
F3. Engneering demand 3 5 5 4 4 2 2 4 3 3 5 3 5 3 4 3 3 2 3 2 2 2 2 3 4
F12. Inflation rate 4 4 4 2 4 4 4 4 3 1 2 2 5 4 2 3 5 4 4 3 2 4 1 2 4

94
Factors Samples
151 152 153 154 155 156 157 158 159 160 161 162 163 164 165 166 167 168 169 170 171 172 173 174 175
F15. Lands corruption 5 4 5 4 3 4 5 5 5 5 5 5 4 5 4 5 5 4 5 5 5 4 5 5 4
F14. Lands speculative 5 3 5 5 3 4 4 5 4 4 5 4 5 5 5 4 5 4 5 5 5 4 5 5 5
F4. Housing demand 5 4 5 5 5 3 5 5 5 5 5 5 5 3 5 5 4 4 5 4 5 4 5 3 1
F6. Population growth 5 4 5 5 5 4 5 5 5 5 5 5 5 3 5 5 5 5 5 5 5 5 4 4 2
F5. Poor productivity 5 1 4 2 2 4 5 5 3 3 5 3 3 3 4 5 3 2 4 3 4 5 5 3 5
F9. Monitoring materials prices 4 5 5 3 2 4 2 3 1 3 3 4 1 3 3 3 1 3 2 3 5 4 5 3 5
F16. Exporting materials 5 5 2 3 4 4 3 5 5 4 5 4 4 3 3 4 4 2 4 5 4 5 5 5 5
F11.Black market 3 3 2 3 2 4 3 3 2 4 4 4 3 3 2 5 2 4 4 2 4 3 4 4 5
F7. Suppliers monopoly 5 2 2 4 2 3 3 4 3 4 3 3 1 5 4 4 4 3 3 5 3 4 4 4 5
F2. Materials demand 4 1 3 3 3 3 3 3 3 5 4 5 4 4 3 4 4 3 2 3 4 5 4 4 5
F13. Contractors with less capacity 5 3 1 2 4 4 2 3 2 5 3 5 4 3 2 5 2 5 5 3 5 4 5 5 3
F10. Monitoring of gov. prjoects 3 5 2 2 3 3 2 3 3 5 2 2 4 3 1 4 1 4 2 2 4 4 5 5 5
F1. Oil price 4 1 1 3 2 3 3 1 2 4 5 3 4 4 4 4 5 3 2 4 5 3 5 4 1
F8. Lack of labor 5 5 2 2 2 4 3 2 5 5 5 4 1 3 3 4 5 4 3 4 5 3 4 4 5
F3. Engneering demand 4 1 2 3 2 3 2 2 1 4 3 4 4 3 4 4 4 3 2 2 5 5 5 4 5
F12. Inflation rate 3 3 1 4 3 4 3 5 3 2 3 4 3 3 2 4 2 4 4 3 3 3 4 4 1

95
Factors Samples
176 177 178 179 180 181 182 183 184 185 186 187 188 189 190 191 192 193 194 195 196 197 198 199 200
F15. Lands corruption 5 4 5 4 5 4 4 4 4 4 5 4 5 5 5 5 5 5 4 5 5 5 4 5 5
F14. Lands speculative 5 5 5 5 5 5 5 5 5 4 4 4 5 5 4 5 5 5 4 5 5 5 4 5 5
F4. Housing demand 5 4 4 5 5 4 5 5 5 5 5 5 5 5 5 3 5 5 5 5 2 5 5 5 2
F6. Population growth 2 4 4 5 4 5 5 5 5 5 5 5 5 4 5 4 5 5 5 5 5 5 5 4 5
F5. Poor productivity 5 5 4 4 4 3 5 4 4 3 4 4 3 3 5 3 3 4 2 3 5 5 5 5 2
F9. Monitoring materials prices 2 2 4 1 5 3 4 1 4 2 1 1 4 4 5 4 2 5 4 4 3 4 3 4 3
F16. Exporting materials 4 2 4 4 5 5 4 2 5 4 5 3 3 5 4 4 3 4 5 4 5 4 3 5 2
F11.Black market 4 2 4 4 5 4 5 3 2 3 4 2 5 4 5 3 2 4 3 3 4 4 3 3 4
F7. Suppliers monopoly 2 4 3 1 3 4 4 1 4 3 2 3 3 3 4 3 2 4 4 4 5 5 4 4 4
F2. Materials demand 4 3 3 1 4 4 5 2 5 3 4 4 4 4 4 4 3 3 2 4 2 4 2 5 4
F13. Contractors with less capacity 5 5 5 1 5 4 1 1 3 1 2 3 3 4 4 3 2 2 2 3 5 5 5 4 3
F10. Monitoring of gov. prjoects 3 2 4 5 5 5 3 2 5 2 5 1 4 3 3 3 4 2 2 4 3 4 2 3 5
F1. Oil price 4 3 3 1 5 3 5 2 5 4 4 5 5 4 4 5 5 5 3 4 3 4 3 5 5
F8. Lack of labor 2 3 4 1 5 5 1 1 5 2 1 3 3 3 5 4 2 3 3 2 4 5 1 4 2
F3. Engneering demand 5 5 3 1 4 5 5 1 5 2 5 3 3 3 4 4 4 2 3 3 3 4 3 5 3
F12. Inflation rate 4 1 4 1 4 5 1 1 4 2 4 3 1 4 2 3 4 3 3 3 4 4 3 3 1

96
Factors Samples
201 202 203 204 205 206 207 208 209 210 211 212 213 214 215 216 217 218 219 220 221 222 223 224 225
F15. Lands corruption 5 4 5 5 4 4 4 4 5 5 5 5 4 5 1 3 5 4 5 5 5 5 5 4 4
F14. Lands speculative 2 5 5 5 4 3 5 5 5 5 5 5 3 4 2 5 4 5 5 4 5 5 5 5 4
F4. Housing demand 3 5 5 4 5 5 5 5 2 4 3 5 5 5 4 5 3 5 5 5 5 4 5 5 5
F6. Population growth 5 3 5 3 5 5 5 5 5 3 3 5 5 4 4 4 5 4 5 4 2 4 5 5 5
F5. Poor productivity 4 5 3 4 5 4 5 5 5 4 2 5 5 5 4 4 5 5 3 3 5 5 4 4 5
F9. Monitoring materials prices 2 5 3 4 1 2 4 3 4 4 2 3 4 5 3 2 4 5 2 5 5 4 5 5 4
F16. Exporting materials 5 2 2 4 3 5 3 2 5 4 3 2 5 3 5 4 5 3 4 3 5 4 2 3 3
F11.Black market 3 5 2 4 1 5 5 3 2 5 4 3 3 5 3 5 4 2 4 4 5 3 3 4 4
F7. Suppliers monopoly 4 5 4 3 2 3 3 4 3 4 2 2 3 5 3 5 5 5 3 5 3 4 3 3 3
F2. Materials demand 3 5 3 5 2 5 3 3 1 4 3 2 3 2 3 5 4 4 3 5 3 5 3 2 2
F13. Contractors with less capacity 3 1 2 5 2 4 3 4 2 4 3 2 2 5 4 1 5 4 3 2 4 2 2 4 3
F10. Monitoring of gov. prjoects 3 2 4 5 1 3 5 3 2 3 2 3 4 4 3 3 5 3 3 5 4 5 2 2 4
F1. Oil price 5 2 3 5 1 5 3 2 2 5 3 1 4 1 1 2 5 4 1 4 4 4 3 5 4
F8. Lack of labor 3 2 3 3 1 5 4 5 3 5 2 3 4 2 4 5 2 4 2 4 4 2 2 4 4
F3. Engneering demand 2 1 2 5 2 3 3 2 1 3 2 3 1 4 4 5 3 4 4 4 4 4 1 3 2
F12. Inflation rate 5 1 1 5 2 4 3 2 2 3 1 2 1 2 2 4 5 4 3 5 4 5 3 2 3

97
Factors Samples
226 227 228 229 230 231 232 233 234 235 236 237
F15. Lands corruption 5 4 4 5 4 4 5 5 5 5 5 5
F14. Lands speculative 5 4 4 5 4 4 4 4 5 4 3 5
F4. Housing demand 5 5 5 5 5 5 5 5 5 4 5 5
F6. Population growth 5 5 4 5 5 5 3 5 5 5 5 5
F5. Poor productivity 3 3 2 2 5 3 2 3 5 5 3 3
F9. Monitoring materials prices 4 5 2 2 4 3 4 4 4 4 5 4
F16. Exporting materials 4 3 5 2 4 5 1 4 3 4 3 2
F11.Black market 3 4 3 2 4 3 2 3 4 3 5 5
F7. Suppliers monopoly 3 4 3 2 3 3 3 2 3 4 3 4
F2. Materials demand 3 4 3 2 4 3 4 3 3 5 4 3
F13. Contractors with less capacity 3 3 5 2 4 3 3 4 5 4 2 3
F10. Monitoring of gov. prjoects 3 3 2 2 5 3 3 3 4 3 3 1
F1. Oil price 3 4 3 2 4 3 5 3 3 4 5 2
F8. Lack of labor 3 2 3 2 4 5 3 3 3 5 2 1
F3. Engneering demand 2 2 2 2 4 2 4 4 4 4 5 3
F12. Inflation rate 3 3 4 2 4 3 2 3 4 3 3 1

98
REFERENCES
Aibinu, A.A. and Jagboro, G.O. (2002). The Effects of Construction Delays on Projects
delivery in the Nigerian Construction Industry. International Journal of Project
Management, 20, 593 – 599
Albaqamy, Fahad. (2012, April 29). The labor wages of construction has increase to %30.
Aawsat newspaper. Retrieved from
http://www.aawast.com/detalis.asp?article=674901
Alfawzan, Rashed. (2012, Augusts 14). Contractors taking projects beyond their capacity.
Alriyadh newspaper. Retrieved from
http://www.alriyadh.com/2012/08/14/article759958.html
Alhamady, Fahad. ( 2009, October 24). Increasing oil prices has increased the
construction materials, and slow implement projects. Alhayat Newspaper.
Retrieved from http://www.sauress.com/alhayat/69196
Alhawas, Saad. (2010, February 3). 18 years is the average age of the citizens in Riyadh
city. Okaz newspaper. Retrieved from
http://www.okaz.com.sa/new/Issues/20100203/Con20100203330670.htm
Alhugail, Turkey. (2012, January 14). Fee “applying taxes” will cut prices 30% . Alyaum
newspaper. Retrieved from http://www.alyaum.com/News/art/40771.html
Alhwish, Abdulkariam. (2011, July 25). Prices of construction materials are the next
crisis of the Saudi real estate market. Aleqtesadya Newspaper. Retrieved from
http://www.aleqt.com/2011/07/25/article_562355.html
Aljaliedy, Nada. (2011, Augusts 6). Prices of construction materials into the
unknown…and the citizens wonder about the role of the government. Alriyadh

99
newspaper. Retrieved from
http://www.alriyadh.com/2011/08/18/article660070.html
Al Jazira Capital. (2011). Saudi Cement Sector. Retrieved February 6, 2013, from
http://www.aljaziracapital.com.sa/jaziracapital/report_file/ess/SEC-12.pdf
Al-Nagadi, M (2010). Saudi Arabia – Concrete construction industry – Cement Based
Materials and Civil Infrastructure (CBM&CI). CBM-CI International
Workshop, Karachi, Pakistan. Retrieved February 5, 2013, from
http://enpub.fulton.asu.edu/cement/cbm_CI/CBMI_Separate_Articles/Article%20
10.pdf
Alpen Capital. (2012). GCC construction industry: residential and commercial building
construction. Retrieved February 4, 2013, from
http://www.alpencapital.com/downloads/GCC%20Construction%20Sector%20Re
port%20-%2027%20March%202012.pdf
Alsafhan, Abdulaziz. (2011, April 13). Increasing of oil prices and shipping prices led to
increase the construction materials cost by % 10. Alhayat Newspaper. Retrieved
from http://www.sauress.com/alhayat/255003
Al Sheikh, S. (2012). Saudi Cement Sector Review: Comparative Energy costs and
expansionary fiscal policies are fuelling the Saudi Cement Sector. NCB.
Retrieved February 6, 2013, from
http://www.menafn.com/updates/research_center/Saudi_Arabia/Economic/NCB0
40612.pdf

100
Althunian, Fahad. (2012, January 02). Black markets’ traders increase prices of cement to
20SR. Alriyadh newspaper. Retrieved from
http://www.alriyadh.com/2011/01/02/article697293.html
Asad, M. (2012). Residential and real estate industry in Saudi Arabia using PESTEL and
SWOT models. Retrieved February 5, 2013, from
http://papers.ssrn.com/sol3/papers.cfm?abstract_id=1987530
Badran, Omar. (2012, May 27). Expectations of rising prices of building materials are in
line with the rise of oil. Alrroya newspaper. Retrieved from
http://alrroya.com/node/198398
Bawardi, Khaled. (2012, January 14). Corruption of real estate market doubled prices 200
percent in 3 years. Alyaum newspaper. Retrieved from
http://www.alyaum.com/News/art/40771.html
Central department of statistics and information of Saudi Arabia. (2012). Population
growth rate. Retrieved November 23, 2012, from the CDSI Web site:
http://www.cdsi.gov.sa/english/
Cooke, B. and Williams, P. (2003). Construction Planning, Programming and Control,
2nd
edition. New York: Palgrave.
Deloitte. (2012a). GCC powers of construction 2012: construction sector overview.
Retrieved February 3, 2013, from http://www.deloitte.com/assets/Dcom-
MiddleEast/Local%20Assets/Documents/Industries/Real%20Estate/Construction/
me_real-estate_gcc_construction_ppt_12.pdf
Deloitte. (2012b). GCC powers of construction 2012: five lessons to learn from.
Retrieved February 3, 2013, from http://www.deloitte.com/assets/Dcom-

101
MiddleEast/Local%20Assets/Documents/Industries/Real%20Estate/Construction/
me_real-estate_gcc_construction_brochure_12.pdf
EC Harris. (2012). International Construction Costs: a changing world economy.
Retrieved February 6, 2013, from
http://www.echarris.com/pdf/Intl%20Construction%20Cost%20Report2012FINA
L.pdf
Frimpong, Y., Oluwoye, J. and Crawford, L. (2003). Causes of Delays and Cost Overruns
in Construction of Ground water Projects in Developing Countries; Ghana as a
case study. International journal of project Management, 21, 321–326
Husseini, A.A. (1991). Construction and the National Economy. The Nigerian Quantity
Surveyor, 20 – 21
IMF. (2012). Economic prospects and policy challenges for GCC countries. Annual
Meeting of Ministers of Finance and Central Bank Governors, October 5-6, 2012,
Saudi Arabia. Retrieved February 5, 2013, from
http://www.imf.org/external/pubs/ft/dp/2012/mcd1012.pdf
KhalafAllah, A. M. (2002). Estimating Cost Contingencies of Residential Buildings
Projects Using Belief Networks (Master’s Thesis), Cairo University, Cairo,
Egypt.
Masters Builders. (2012). Survey reveals strategies to reduce the cost of building.
Retrieved February 7, 2013, from http://www.masterbuilders.asn.au/media/media-
releases/survey-reveals-strategies-to-reduce-the-cost-of-building
Mann, P. S. (1995). Statistics for business and economics. New York: Wiley.
102
Mbachu, J.I.C. and Nkado, R.N. (2004). Reducing Building Construction Costs: the
Views of Consultants and Contractors. COBRA
Meed Cost Indices. (2012a). UAE construction cost report: analysis of a decade’s
construction cost data 2002-2012. Retrieved February 3, 2013, from
http://www.capitalstoneservices.com/files/MEED-Report.pdf
Meed Cost Indices. (2012b). Saudi Arabia construction cost and outlook report: analysis
of Saudi Arabia’s future construction cost trends in 2012 to 2017. Retrieved
February 7, 2013, from http://www.meedci.com/pgs/Public/Saudi
ArabiaReport.aspx?CmpID=684485185084985185185185185185185178781282
2831
Mesbah, R. (2012). Labour costs in Saudi Arabia highest in the Gulf. Retrieved February
7, 2013, from http://www.ameinfo.com/labour-costs-saudi-arabia-gulf-316522
Omoreigie A. and Radford D. (2006). Infrastructure Delay and Cost Escalations: Causes
and Effects in Nigeria. Leicester: School Of Architecture, De Montford
University.
Reuters. Saudi needs 150,000 housing units a year-LaSalle. (2010, October 20). Arabian
Business. Retrieved from http://www.arabianbusiness.com/saudi-needs-150-000-
housing-units-year-lasalle-357477.html
Real Estates companies have helped to grow the housing problems in Saudi Arabia.
(2012, April 26). Aleqtesadya newspaper. Retrieved from
http://www.aleqt.com/2012/04/26/article_650989.html
http://www.meedci.com/pgs/Public/KSAReport.aspx?CmpID=6844851850849851851851851851851851787812822831
http://www.meedci.com/pgs/Public/KSAReport.aspx?CmpID=6844851850849851851851851851851851787812822831

103
Saudi Property Prices to rise as `demand grows`. (2012, November). Saudi Economic
Survey. Retrieved from http://saudieconomicsurvey.com/2012/01/saudi-property-
prices-to-rise-as-demand-grows/
TELL. (2002). The Rot that was PTF. Nigeria’s independent weekly magazine, 43,
Special Report. TELL communications limited.
Ventures. (2011). The Saudi Construction Industry. Retrieved February 5, 2013, from
http://www.constructarabia.com/wp-content/uploads/downloads/2012/04/Saudi
Arabia-Construction-Industry-Report-Jan-20111.pdf
Ventures. (2012). GCC cement, concrete and stone market update. Retrieved February 6,
2013, from http://www.constructarabia.com/wp-
content/uploads/downloads/2012/09/The-GCC-Cement-Concrete-and-Stone-
Market-Update-2012.pdf
Warning of rising prices of construction materials. (2012, January 04). Arabian Business.
Retrieved from http://arabic.arabianbusiness.com/business/real-
estate/2012/jan/4/67009/