Analyzing Health Equity Using Household Survey Data
22
“Analyzing Health Equity Using Household Survey Data” Owen O’Donnell, Eddy van Doorslaer, Adam Wagstaff and Magnus Lindelow, The World Bank, Washington DC, 2008, www.worldbank.org/analyzinghealthequity Analyzing Health Equity Using Household Survey Data Lecture 10 Multivariate Analysis of Health Survey Data
-
Upload
chase-carson -
Category
Documents
-
view
29 -
download
2
description
Analyzing Health Equity Using Household Survey Data. Lecture 10 Multivariate Analysis of Health Survey Data. Why multivariate analysis?. Health sector inequalities measured through bivariate relationship b/w health vbl. and SES - PowerPoint PPT Presentation
Transcript of Analyzing Health Equity Using Household Survey Data
“Analyzing Health Equity Using Household Survey Data” Owen O’Donnell, Eddy van Doorslaer, Adam Wagstaff and Magnus Lindelow, The World Bank, Washington DC, 2008, www.worldbank.org/analyzinghealthequity
Analyzing Health Equity Using Household Survey Data
Lecture 10
Multivariate Analysis of Health Survey Data
“Analyzing Health Equity Using Household Survey Data” Owen O’Donnell, Eddy van Doorslaer, Adam Wagstaff and Magnus Lindelow, The World Bank, Washington DC, 2008, www.worldbank.org/analyzinghealthequity
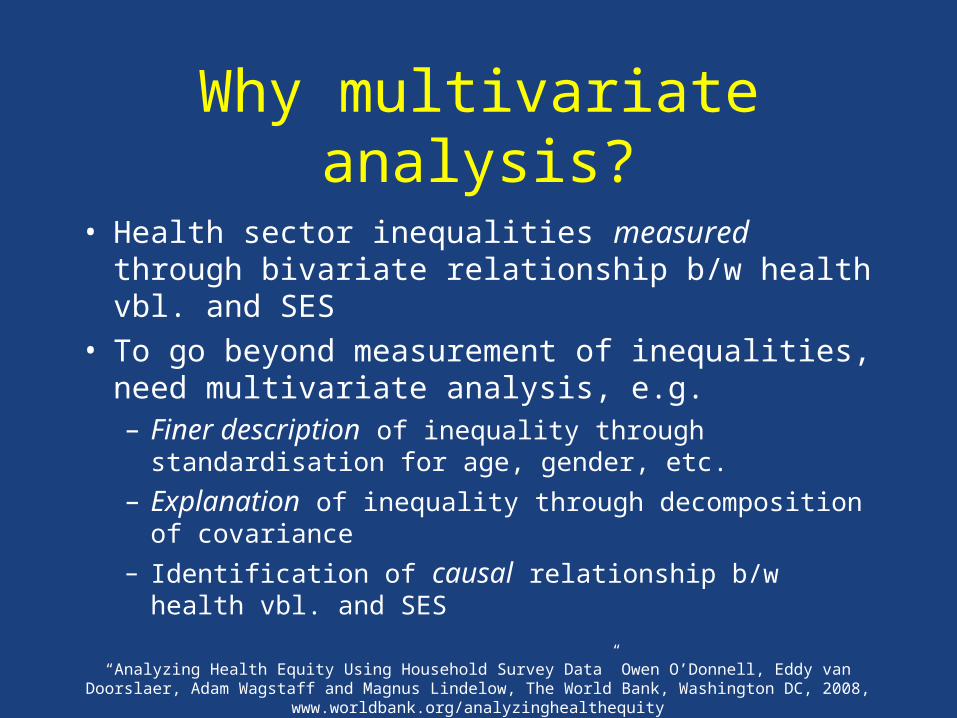
Why multivariate analysis?
• Health sector inequalities measured through bivariate relationship b/w health vbl. and SES
• To go beyond measurement of inequalities, need multivariate analysis, e.g.– Finer description of inequality through standardisation for
age, gender, etc.
– Explanation of inequality through decomposition of covariance
– Identification of causal relationship b/w health vbl. and SES
“Analyzing Health Equity Using Household Survey Data” Owen O’Donnell, Eddy van Doorslaer, Adam Wagstaff and Magnus Lindelow, The World Bank, Washington DC, 2008, www.worldbank.org/analyzinghealthequity
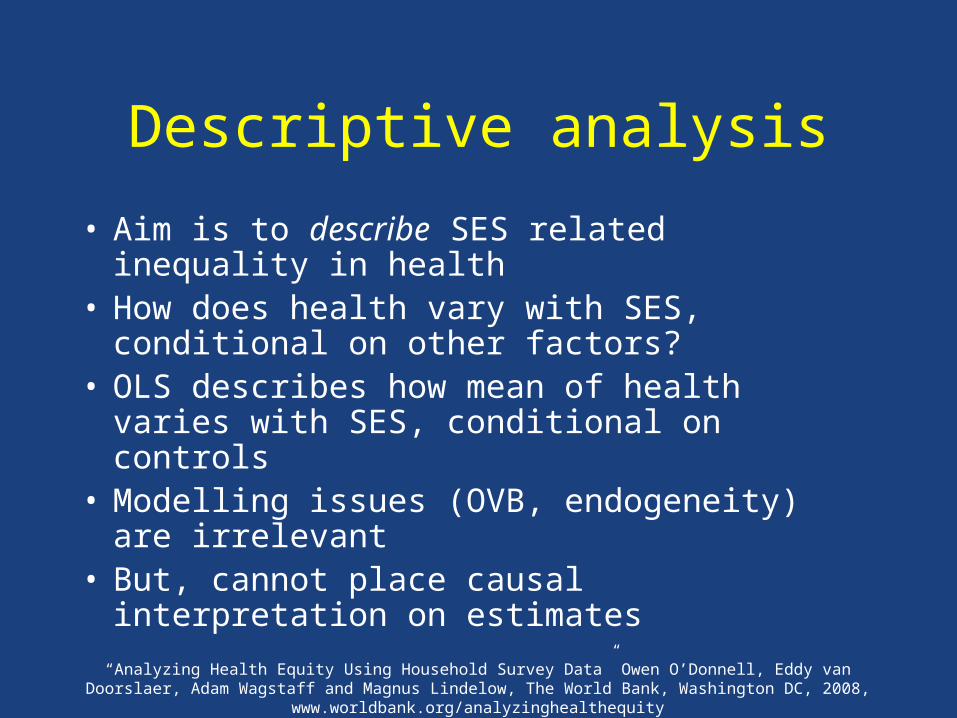
Descriptive analysis
• Aim is to describe SES related inequality in health• How does health vary with SES, conditional on
other factors?• OLS describes how mean of health varies with
SES, conditional on controls• Modelling issues (OVB, endogeneity) are
irrelevant• But, cannot place causal interpretation on
estimates

“Analyzing Health Equity Using Household Survey Data” Owen O’Donnell, Eddy van Doorslaer, Adam Wagstaff and Magnus Lindelow, The World Bank, Washington DC, 2008, www.worldbank.org/analyzinghealthequity
Causal analysis
• For causal inference need modelling approach• Appropriate model and estimator depends upon
degree of detail required• To identify total causal effect and not its
mechanisms, reduced form is adequate e.g. decomposition
• To separately identify direct and indirect effects, need structural model
“Analyzing Health Equity Using Household Survey Data” Owen O’Donnell, Eddy van Doorslaer, Adam Wagstaff and Magnus Lindelow, The World Bank, Washington DC, 2008, www.worldbank.org/analyzinghealthequity
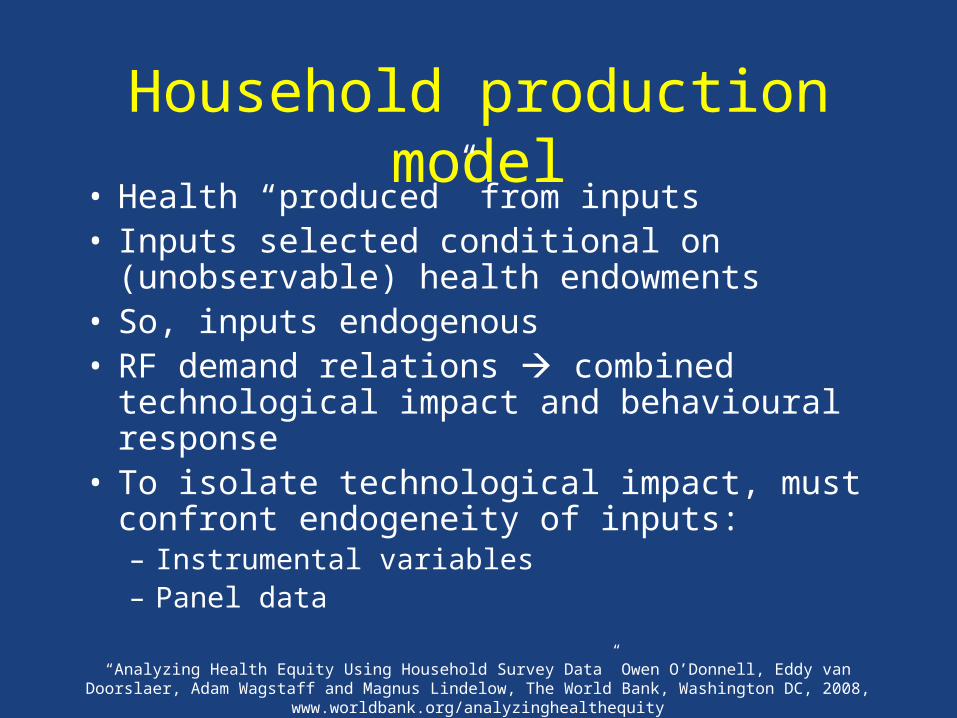
Household production model• Health “produced” from inputs • Inputs selected conditional on (unobservable)
health endowments• So, inputs endogenous• RF demand relations combined technological
impact and behavioural response• To isolate technological impact, must confront
endogeneity of inputs:– Instrumental variables– Panel data
“Analyzing Health Equity Using Household Survey Data” Owen O’Donnell, Eddy van Doorslaer, Adam Wagstaff and Magnus Lindelow, The World Bank, Washington DC, 2008, www.worldbank.org/analyzinghealthequity
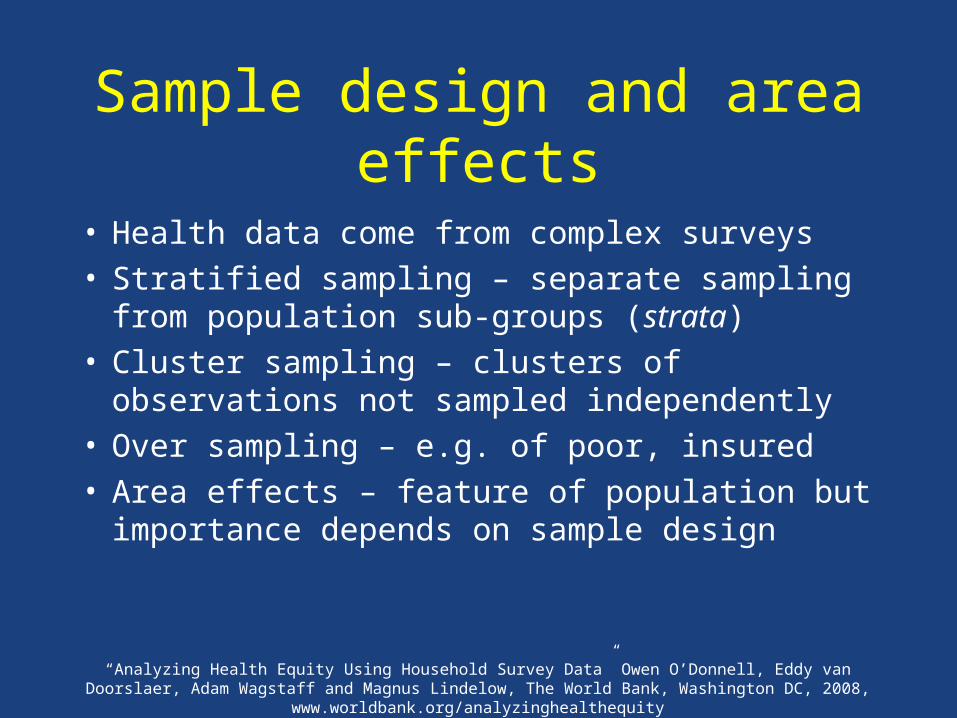
Sample design and area effects
• Health data come from complex surveys• Stratified sampling – separate sampling from
population sub-groups (strata)• Cluster sampling – clusters of observations not
sampled independently• Over sampling – e.g. of poor, insured• Area effects – feature of population but
importance depends on sample design

“Analyzing Health Equity Using Household Survey Data” Owen O’Donnell, Eddy van Doorslaer, Adam Wagstaff and Magnus Lindelow, The World Bank, Washington DC, 2008, www.worldbank.org/analyzinghealthequity
Standard stratified sampling
• Population categorised by relatively few strata e.g. urban/rural, regions
• Separate random sample of pre-defined size selected from each strata
• Sample strata proportions need not correspond to population proportions sample weights (separate issue)
• In pop. means differ by strata, standard errors of means and other descriptive statistics should be adjusted down
“Analyzing Health Equity Using Household Survey Data” Owen O’Donnell, Eddy van Doorslaer, Adam Wagstaff and Magnus Lindelow, The World Bank, Washington DC, 2008, www.worldbank.org/analyzinghealthequity
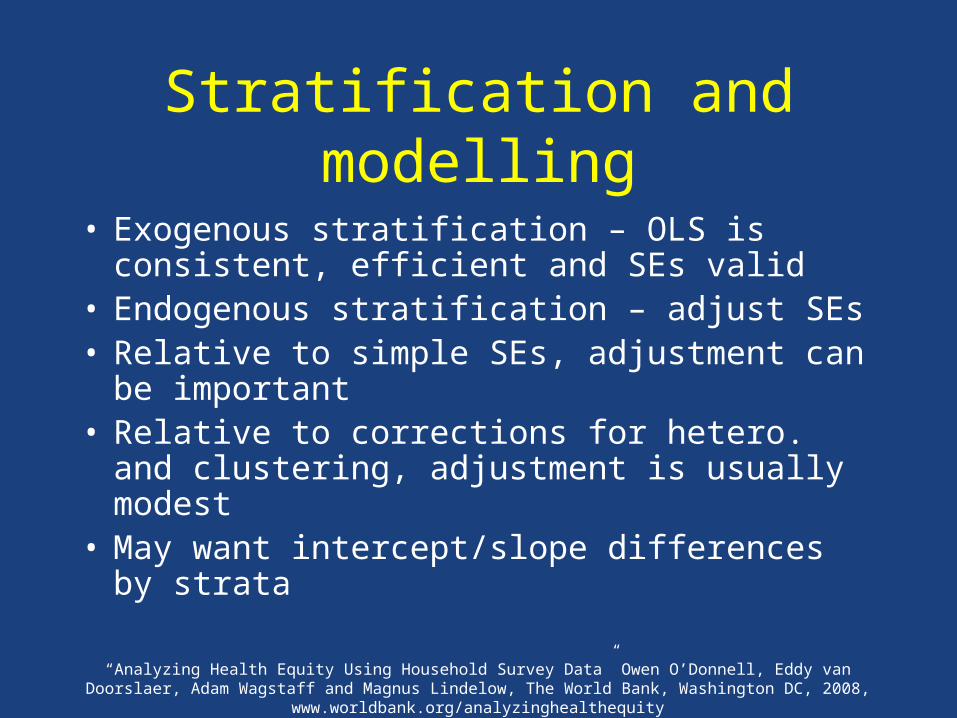
Stratification and modelling
• Exogenous stratification – OLS is consistent, efficient and SEs valid
• Endogenous stratification – adjust SEs• Relative to simple SEs, adjustment can be
important• Relative to corrections for hetero. and clustering,
adjustment is usually modest• May want intercept/slope differences by strata
“Analyzing Health Equity Using Household Survey Data” Owen O’Donnell, Eddy van Doorslaer, Adam Wagstaff and Magnus Lindelow, The World Bank, Washington DC, 2008, www.worldbank.org/analyzinghealthequity
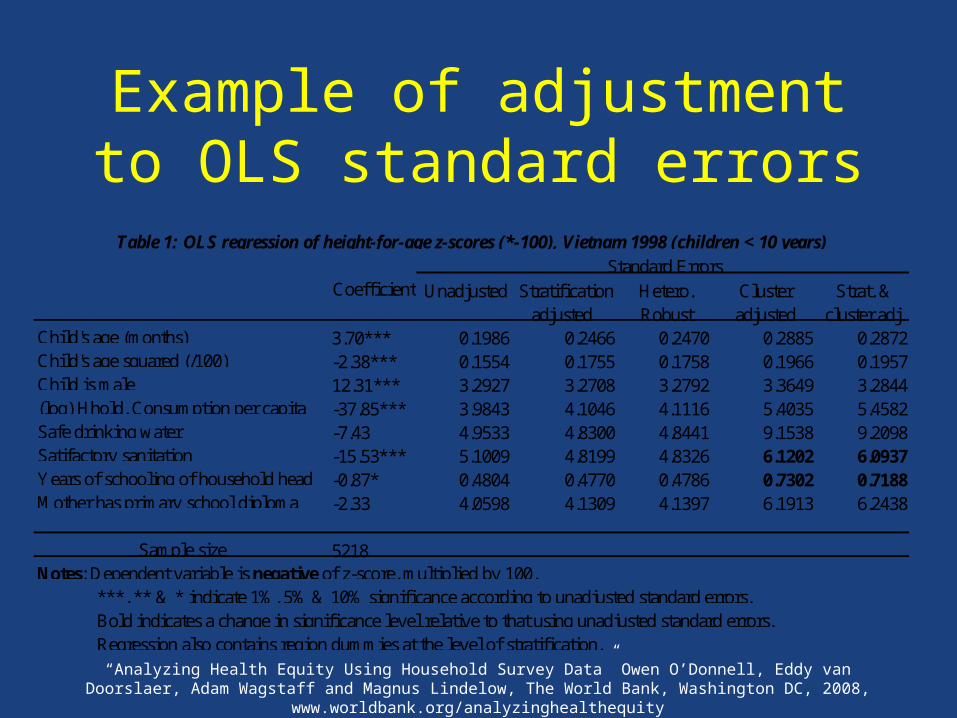
Example of adjustment to OLS standard errors
Unadjusted Stratification Hetero. Cluster Strat. &adjusted Robust adjusted cluster adj.
3.70*** 0.1986 0.2466 0.2470 0.2885 0.2872-2.38*** 0.1554 0.1755 0.1758 0.1966 0.195712.31*** 3.2927 3.2708 3.2792 3.3649 3.2844-37.85*** 3.9843 4.1046 4.1116 5.4035 5.4582-7.43 4.9533 4.8300 4.8441 9.1538 9.2098-15.53*** 5.1009 4.8199 4.8326 6.1202 6.0937-0.87* 0.4804 0.4770 0.4786 0.7302 0.7188-2.33 4.0598 4.1309 4.1397 6.1913 6.2438
5218Notes: Dependent variable is negative of z-score, multiplied by 100.
Safe drinking water
Child's age (months)Child's age squared (/100)Child is male(log) Hhold. Consumption per capita
Satifactory sanitationYears of schooling of household head
Regression also contains region dummies at the level of stratification.
Table 1: OLS regression of height-for-age z-scores (*-100), Vietnam 1998 (children < 10 years)
Sample size
Mother has primary school diploma
Standard Errors
***, ** & * indicate 1%, 5% & 10% significance according to unadjusted standard errors. Bold indicates a change in significance level relative to that using unadjusted standard errors.
Coefficient
“Analyzing Health Equity Using Household Survey Data” Owen O’Donnell, Eddy van Doorslaer, Adam Wagstaff and Magnus Lindelow, The World Bank, Washington DC, 2008, www.worldbank.org/analyzinghealthequity
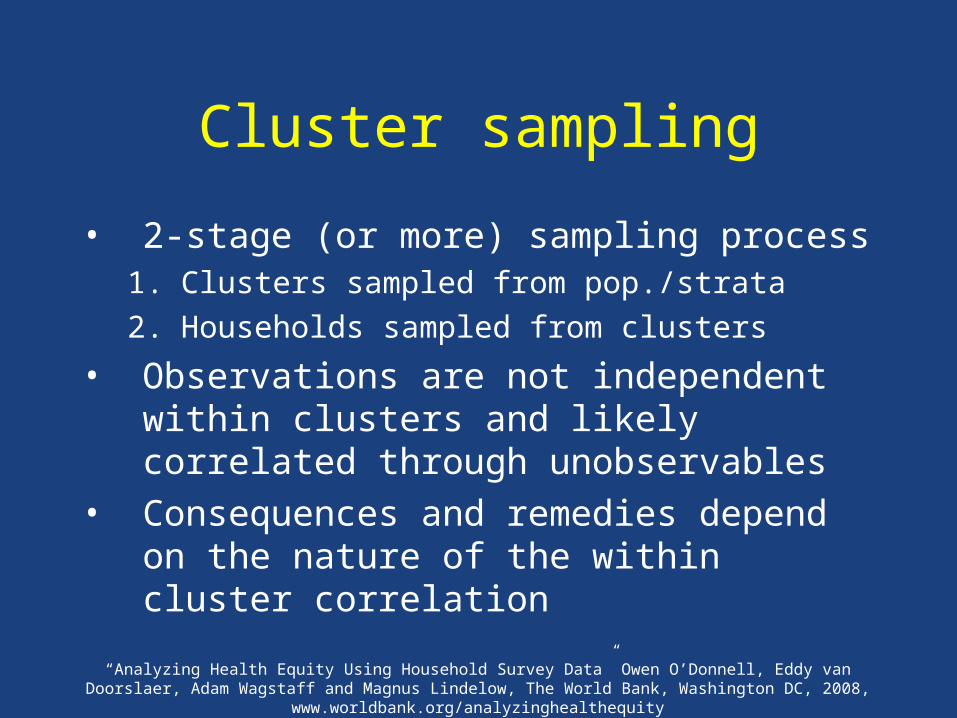
Cluster sampling
• 2-stage (or more) sampling process1. Clusters sampled from pop./strata
2. Households sampled from clusters
• Observations are not independent within clusters and likely correlated through unobservables
• Consequences and remedies depend on the nature of the within cluster correlation

“Analyzing Health Equity Using Household Survey Data” Owen O’Donnell, Eddy van Doorslaer, Adam Wagstaff and Magnus Lindelow, The World Bank, Washington DC, 2008, www.worldbank.org/analyzinghealthequity
Exogenous cluster effects
, | , 0,ic ic c ic ic ic c icy E E X β X
If |c ic cE EX have random effects model.
Conventional estimators e.g. OLS, probit, etc. are consistentbut inefficient and SEs need adjustment.
Can accept inefficiency and adjust SEs. In Stata, use optioncluster(varname)
For efficiency, must estimate and take account of within-cluster correlation, e.g. GLS, random effects probit.
(1)

“Analyzing Health Equity Using Household Survey Data” Owen O’Donnell, Eddy van Doorslaer, Adam Wagstaff and Magnus Lindelow, The World Bank, Washington DC, 2008, www.worldbank.org/analyzinghealthequity
Endogenous cluster effects(1) with |c ic cE EX is the fixed effects model
Regressors correlated with composite error conventionalestimators are inconsistent.
Need to purge cluster effects from composite error.
In linear model – cluster dummies, differences from cluster
means or first differences.Binary choice – fixed effects logit.
Having purged cluster effects, is no need to correct SEs

“Analyzing Health Equity Using Household Survey Data” Owen O’Donnell, Eddy van Doorslaer, Adam Wagstaff and Magnus Lindelow, The World Bank, Washington DC, 2008, www.worldbank.org/analyzinghealthequity
Comparison of estimators for a cluster sample
Cluster Robust Robustadjusted SE SE SE
3.72*** 0.2917 3.74*** 0.2451 3.78*** 0.2430 -2.40*** 0.1987 - 2.40*** 0.1742 -2.44*** 0.1732 12.26*** 3.4527 12.19*** 3.2394 12.97*** 3.2443-50.93*** 5.1149 -43.17*** 4.0778 -30.37*** 4.6090-12.55 8.6438 -7.93 4.8984 -2.75 5.4247-22.90*** 5.6974 -19.39*** 4.8446 -9.77** 4.9364- 0.39 0.6628 -0.33 0.4828 -0.55 0.50812.67 5.3187 1.71 4.1140 1.74 4.3186445.00*** 44.5600 377.01*** 32.1941 276.19*** 35.0991
5218 R2
0.1527 B-P LM 485.84 (0.000)Hausman 50.54 (0.0000)
OLS Random Effects
Coeff.
Fixed Effects
Coeff.Coeff.
Safe drinking water
***, ** & * indicate significance at 1%, 5% & 10% respectively. SE - standard error, Robust SE - robust to general heteroskedasticity. B-P LM - Breusch-Pagan Lagrange Multiplier test of significance of commune effects (p-value).
Intercept
Notes: Dependent variable is negative of z-score, multiplied by 100.
Table 2: Regressions of height-for-age z-scores (*-100), Vietnam 1998 (children < 10 years)
Child's age (months)
Sample size
Hausman - Hausman test of random versus fixed effects (p-value).
Satifactory sanitationYears of schooling of HoHMum has primary school dip.
Child's age squared (/100)Child is male(log) Hhold. Consumption p.c.
“Analyzing Health Equity Using Household Survey Data” Owen O’Donnell, Eddy van Doorslaer, Adam Wagstaff and Magnus Lindelow, The World Bank, Washington DC, 2008, www.worldbank.org/analyzinghealthequity
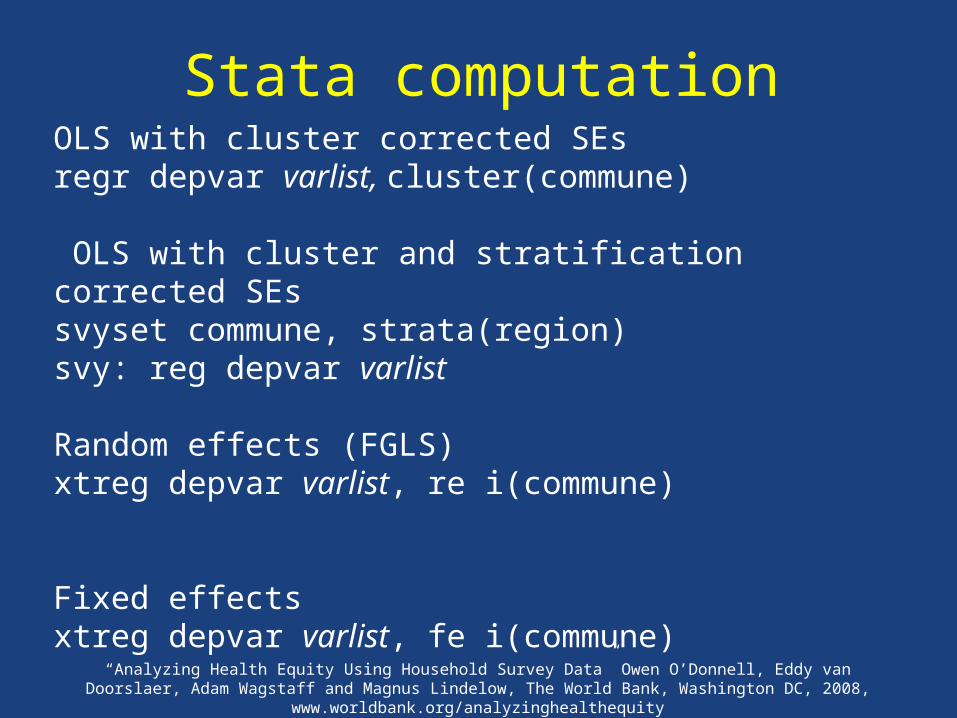
Stata computationOLS with cluster corrected SEsregr depvar varlist, cluster(commune)
OLS with cluster and stratification corrected SEssvyset commune, strata(region)svy: reg depvar varlist
Random effects (FGLS)xtreg depvar varlist, re i(commune)
Fixed effects xtreg depvar varlist, fe i(commune)

“Analyzing Health Equity Using Household Survey Data” Owen O’Donnell, Eddy van Doorslaer, Adam Wagstaff and Magnus Lindelow, The World Bank, Washington DC, 2008, www.worldbank.org/analyzinghealthequity
But community effects can be interesting
Exogenous community effects
Define, the model becomes*c c c Z
* *, | , , 0ic ic c c ic ic ic c c icy E E X Z X Z (2)
Condition for consistency: * *| ,c ic c cE X Z E
SEs need to be adjusted for within-cluster correlation.Efficiency loss from OLS may not be large.
This REM also known as the hierarchical model.
“Analyzing Health Equity Using Household Survey Data” Owen O’Donnell, Eddy van Doorslaer, Adam Wagstaff and Magnus Lindelow, The World Bank, Washington DC, 2008, www.worldbank.org/analyzinghealthequity
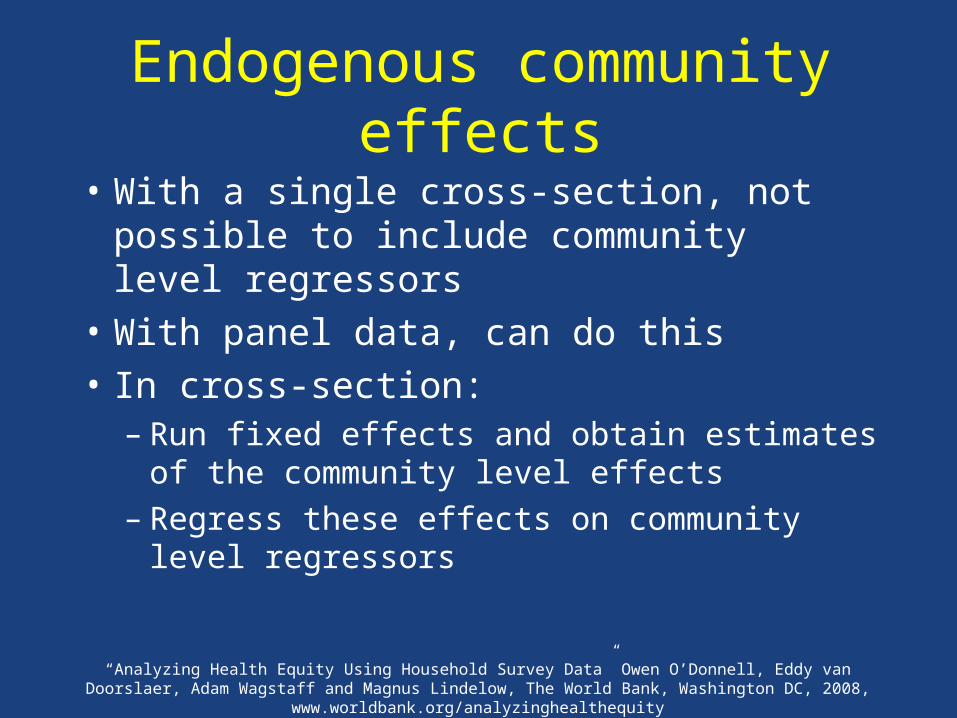
Endogenous community effects
• With a single cross-section, not possible to include community level regressors
• With panel data, can do this
• In cross-section:– Run fixed effects and obtain estimates of the
community level effects– Regress these effects on community level
regressors
“Analyzing Health Equity Using Household Survey Data” Owen O’Donnell, Eddy van Doorslaer, Adam Wagstaff and Magnus Lindelow, The World Bank, Washington DC, 2008, www.worldbank.org/analyzinghealthequity
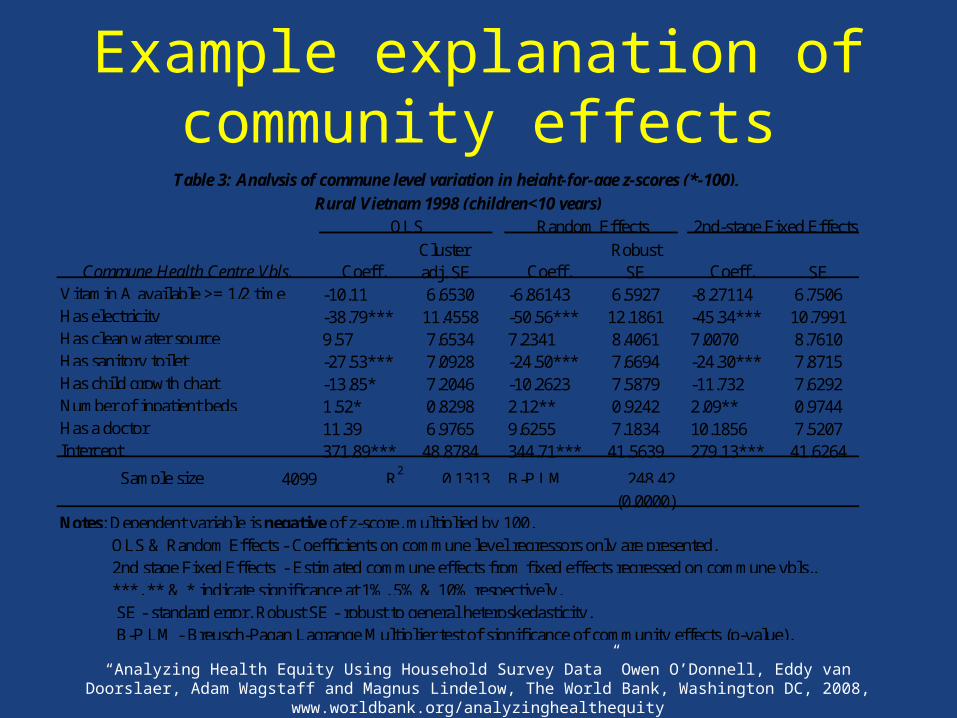
Example explanation of community effects
Cluster Robustadj. SE SE SE
-10.11 6.6530 -6.86143 6.5927 -8.27114 6.7506-38.79*** 11.4558 -50.56*** 12.1861 -45.34*** 10.79919.57 7.6534 7.2341 8.4061 7.0070 8.7610-27.53*** 7.0928 -24.50*** 7.6694 -24.30*** 7.8715-13.85* 7.2046 -10.2623 7.5879 -11.732 7.62921.52* 0.8298 2.12** 0.9242 2.09** 0.974411.39 6.9765 9.6255 7.1834 10.1856 7.5207371.89*** 48.8784 344.71*** 41.5639 279.13*** 41.6264
4099 R2
0.1313 B-P LM 248.42(0.0000)
Rural Vietnam 1998 (children<10 years)
OLS & Random Effects - Coefficients on commune level regressors only are presented. 2nd stage Fixed Effects - Estimated commune effects from fixed effects regressed on commune vbls..
Has child growth chartNumber of inpatient bedsHas a doctor
Sample size
Vitamin A available >= 1/2 time
Has clean water sourceHas electricity
Has sanitory toilet
SE - standard error, Robust SE - robust to general heteroskedasticity. B-P LM - Breusch-Pagan Lagrange Multiplier test of significance of community effects (p-value).
Intercept
***, ** & * indicate significance at 1%, 5% & 10% respectively.
Notes: Dependent variable is negative of z-score, multiplied by 100.
Table 3: Analysis of commune level variation in height-for-age z-scores (*-100),
OLS Random Effects 2nd-stage Fixed Effects
Coeff. Coeff. Coeff.Commune Health Centre Vbls.

“Analyzing Health Equity Using Household Survey Data” Owen O’Donnell, Eddy van Doorslaer, Adam Wagstaff and Magnus Lindelow, The World Bank, Washington DC, 2008, www.worldbank.org/analyzinghealthequity
Stata computation for 2-step procedure
Run fixed effects and save predictions of the fixed effects
xtreg depvar varlist, fe i(commune) predict ce, u
Use the between-groups panel estimator to regress these predicted effects on community level regressors
xtreg ce varlist2, be i(commune)
“Analyzing Health Equity Using Household Survey Data” Owen O’Donnell, Eddy van Doorslaer, Adam Wagstaff and Magnus Lindelow, The World Bank, Washington DC, 2008, www.worldbank.org/analyzinghealthequity
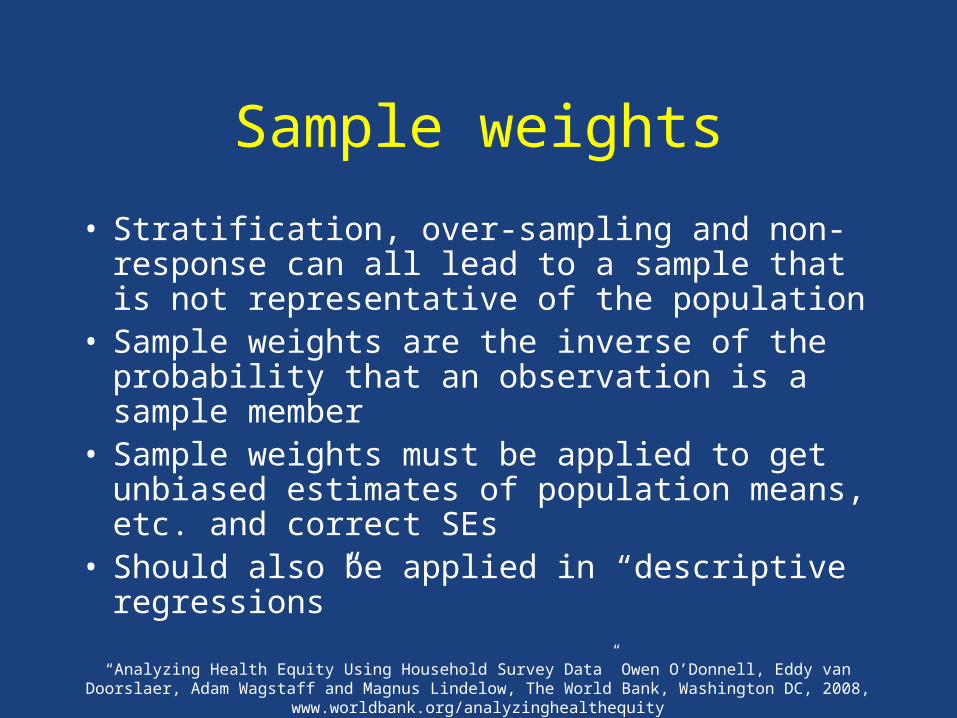
Sample weights
• Stratification, over-sampling and non-response can all lead to a sample that is not representative of the population
• Sample weights are the inverse of the probability that an observation is a sample member
• Sample weights must be applied to get unbiased estimates of population means, etc. and correct SEs
• Should also be applied in “descriptive regressions”
“Analyzing Health Equity Using Household Survey Data” Owen O’Donnell, Eddy van Doorslaer, Adam Wagstaff and Magnus Lindelow, The World Bank, Washington DC, 2008, www.worldbank.org/analyzinghealthequity
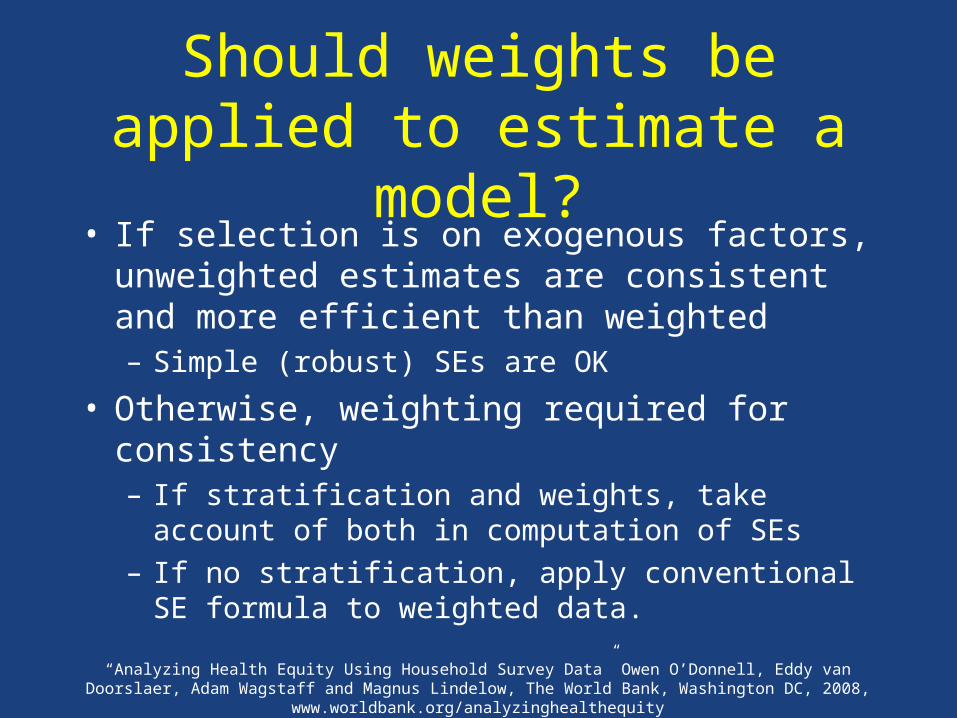
Should weights be applied to estimate a model?
• If selection is on exogenous factors, unweighted estimates are consistent and more efficient than weighted– Simple (robust) SEs are OK
• Otherwise, weighting required for consistency– If stratification and weights, take account of both in
computation of SEs
– If no stratification, apply conventional SE formula to weighted data.
“Analyzing Health Equity Using Household Survey Data” Owen O’Donnell, Eddy van Doorslaer, Adam Wagstaff and Magnus Lindelow, The World Bank, Washington DC, 2008, www.worldbank.org/analyzinghealthequity
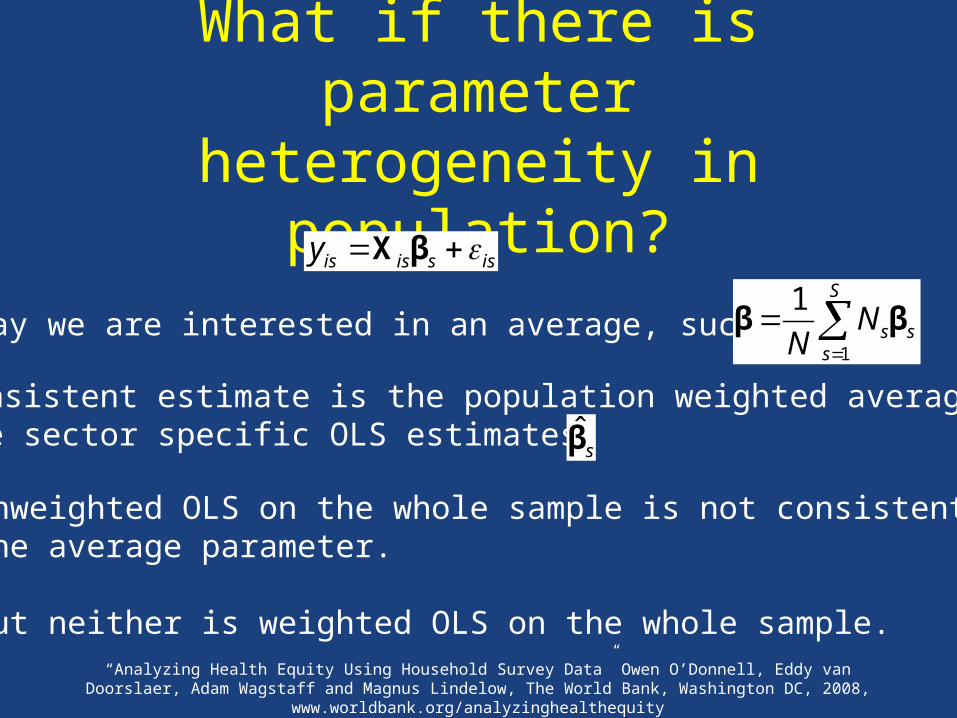
What if there is parameter heterogeneity in population?
is is s isy X β
Say we are interested in an average, such as 1
1 S
s ss
NN
β β
Consistent estimate is the population weighted average of the sector specific OLS estimates ˆ
sβ
Unweighted OLS on the whole sample is not consistent forthe average parameter.
But neither is weighted OLS on the whole sample.

“Analyzing Health Equity Using Household Survey Data” Owen O’Donnell, Eddy van Doorslaer, Adam Wagstaff and Magnus Lindelow, The World Bank, Washington DC, 2008, www.worldbank.org/analyzinghealthequity
Example application of sample weights
Adjusted Robust Robust SE SE SE
3.90*** 0.3218 3.90*** 0.2652 3.91*** 0.2642-2.51*** 0.2206 -2.50*** 0.1875 -2.51*** 0.187514.86*** 3.5718 14.56*** 3.3595 14.89*** 3.3731-50.14*** 5.5131 -40.67*** 4.3511 -26.05*** 5.0196-12.16 10.2770 -6.92 5.1624 -2.07 5.6079-22.01*** 5.9503 -19.81*** 5.3653 -10.48* 5.4439-0.21 0.7355 -0.15 0.5122 -0.42 0.53633.62 5.6510 3.04 4.2925 2.19 4.4958428.15*** 48.9827 347.47*** 34.9686 236.12*** 38.5646
R2
0.1496 R2
0.4320 R2
0.2457 Sample size 5218
***, ** & * indicate significance at 1%, 5% & 10% respectively. Adjusted SE - standard error adjusted for clustering and stratification and robust to hetero. Robust SE - standard error robust to general heteroskedasticity.
Notes: Dependent variable is negative of z-score, multiplied by 100.
Satifactory sanitationYears of schooling of HoHMum has primary school dip.Intercept
Child's age squared (/100)Child is male(log) Hhold. Consumption p.c.Safe drinking water
Coeff. Coeff. Coeff.Child's age (months)
Table 4: Weighted regressions of height-for-age z-scores (*-100), Vietnam 1998 (children < 10 years)
OLS Random Effects Fixed Effects