ANALYZING CRITICAL SUCCESSFUL FACTORS OF VINFAST IN ...
108
1 ANALYZING CRITICAL SUCCESSFUL FACTORS OF VINFAST IN SELECTING GREEN SUPPLIERS NGUYEN THI PHUONG THAO HS130206 NGUYEN THU HANG HS130090 BUI VAN ANH HS130162 Supervisor: Phi-Hung Nguyen THESIS SUBMITTED IN FULFILMENT OF THE REQUIREMENTS FOR THE DEGREE OF BACHELOR OF INTERNATIONAL BUSINESS FACULTY OF BUSINESS FPT UNIVERSITY HANOI, VIETNAM APRIL , 2021
Transcript of ANALYZING CRITICAL SUCCESSFUL FACTORS OF VINFAST IN ...

1
ANALYZING CRITICAL SUCCESSFUL FACTORS OF
VINFAST IN SELECTING GREEN SUPPLIERS
NGUYEN THI PHUONG THAO HS130206 NGUYEN THU HANG HS130090 BUI VAN ANH HS130162
Supervisor: Phi-Hung Nguyen
THESIS SUBMITTED IN FULFILMENT OF THE REQUIREMENTS
FOR THE DEGREE OF BACHELOR OF INTERNATIONAL BUSINESS
FACULTY OF BUSINESS
FPT UNIVERSITY
HANOI, VIETNAM
APRIL , 2021

ACKNOWLEDGEMENT
This thesis could not be accomplished without the effort and cooperation of our
group members within the given time by related individuals; thanks for their contribution
to this study.
First and foremost, we would like to sincerely thank our supervisor, lecturer Phi-
Hung Nguyen, who gave us the golden opportunity to do this wonderful project and for his
patient support, motivation, and expertise during the whole research process. His help has
helped us achieve new skills and ability sets related to performing this project successfully.
Secondly, we would like to thank our FPT University lecturers sincerely for giving
us the background knowledge and necessary skills in years of education to write an honour
study.
Last but not least, our special thanks also certainly go to all people who were willing
to help us during our survey and research process.
Hoa Lac, April, 2021
Authors of the thesis

EXECUTIVE SUMMARY
Increased environmental consciousness has made it essential for businesses to
choose suppliers based on sustainable and green factors. This thesis proposes Multi-
Criteria Decision Making (MCDM) models, including Fuzzy Analytical Hierarchy Process
(FAHP), Technique for Order of Preference by Similarity to Ideal Solution (TOPSIS) for
data processing and to provide assessment and selection of green and sustainable suppliers
in the automotive industry.
Methods that could be applicable to studies on other topics and used in this analysis
to identify a supplier selection approach for the producer. In particular, this study uses
FAHP to determine the weights of proposed criteria. The FTOPSIS is employed to rank
the suppliers.
This study is outlined by the fact that VinFast describes the value of social
sustainability and the automotive sector in Vietnam. This thesis is a piece of extensive
knowledge of GSCM and sustainable supplier selection. Following analyzing results
highlights short-term and long-term recommendations from donations of customers to
increase collaboration between sustainability businesses.
TABLE OF CONTENTS
ACKNOWLEDGEMENT ................................................................................................................................... 2
EXECUTIVE SUMMARY .................................................................................................................................. 3
LIST OF FIGURES ............................................................................................................................................ 6
LIST OF CHARTS ............................................................................................................................................. 6
LIST OF TABLES .............................................................................................................................................. 7
Table 4.3. Integrated Fuzzy Comparison Matrix ........................................................................................... 7
Table 4.6. Integrated Fuzzy Comparison Matrix ........................................................................................... 7
Table 4.16. Integrated matrix ....................................................................................................................... 8
ABBREVIATIONS AND ACRONYMS LIST ......................................................................................................... 9
CHAPTER 1: INTRODUCTION ....................................................................................................................... 10
1.1. BACKGROUND ................................................................................................................................. 10
1.1.1. Topic background .......................................................................................................................... 10
1.1.1.1 A brief to the automotive industry ............................................................................................. 10
1.1.1.2 Automotive industry in Vietnam and some specific countries ....................................................... 13
1.1.2. Practical problem .......................................................................................................................... 18
1.1.2.1. Environmental problems affected the economy ....................................................................... 18
1.1.2.2 Overview of green supply chain management ........................................................................... 19
1.1.2.3. "Green" economy trend in the world and Vietnam ................................................................... 22
1.1.3. Company background ................................................................................................................... 26
1.1.3.1 Vingroup joint stock company .................................................................................................... 26
1.1.3.2 VinFast Manufacturing and Trading Co., Ltd .............................................................................. 28
1.2. RESEARCH OBJECTIVES .................................................................................................................... 29
1.3. RESEARCH QUESTIONS ..................................................................................................................... 30
1.4. RESEARCH SCOPE ............................................................................................................................. 30
1.5. METHODOLOGY AND DATA REVIEW ............................................................................................... 30
1.6. CONCLUSION .................................................................................................................................... 30
1.7. THESIS OUTLINE ............................................................................................................................... 31
CHAPTER 2: LITERATURE REVIEW ............................................................................................................... 32
2.1. OVERVIEW OF THE AUTOMOTIVE INDUSTRY .................................................................................. 32

2.2. GREEN SUPPLY CHAIN MANAGEMENT ............................................................................................ 33
2.2.1. Definition of supply chain ............................................................................................................. 33
2.2.2. Green supply chain management ................................................................................................. 34
2.3. SUSTAINABLE SUPPLIER SELECTION ................................................................................................. 34
2.3.1. Sustainability Term and Misconceptions ...................................................................................... 34
2.3.2. Sustainable Supplier Selection Process ......................................................................................... 36
2.3.3. Sustainable Supplier Selection Problem ....................................................................................... 36
2.3.4. Proposed Criteria for Evaluating Sustainable Supplier ................................................................. 36
2.4. APPROACHES FOR GREEN SUPPLIER SELECTION ............................................................................. 40
2.4.1. MCDM Models .............................................................................................................................. 40
2.4.2 Fuzzy Concepts ............................................................................................................................... 42
2.4.3. Advantages and Disadvantages of MCDM Models ....................................................................... 42
2.5. RESEARCH GAP ................................................................................................................................. 45
2.6. CONCLUSION .................................................................................................................................... 45
CHAPTER 3: METHODOLOGY ...................................................................................................................... 47
3.1. INTRODUCTION ................................................................................................................................ 47
3.1.1 Research philosophy ...................................................................................................................... 47
3.1.2. Research approaches .................................................................................................................... 47
3.1.3. Research methods ........................................................................................................................ 48
3.2. DATA SOURCE (Primary/Secondary) ................................................................................................ 49
3.3. DATA ANALYSIS ................................................................................................................................ 50
3.3.1. Fuzzy AHP method ........................................................................................................................ 50
3.3.2. Fuzzy TOPSIS method .................................................................................................................... 53
CHAPTER 4: EMPIRICAL CASE ANALYSES OF VINFAST ................................................................................ 57
4.1. Case study ........................................................................................................................................ 57
4.2. Fuzzy AHP for Weighting Calculation ............................................................................................... 62
4.3. Fuzzy TOPSIS for Ranking ................................................................................................................. 83
CHAPTER 5: CONCLUSIONS AND IMPLICATIONS ........................................................................................ 93
5.1. Conclusions ...................................................................................................................................... 93
5.2. Managerial implications ................................................................................................................... 94
5.3. Limitations of this thesis .................................................................................................................. 95
REFERENCES ................................................................................................................................................ 97
APPENDIX .................................................................................................................................................. 102
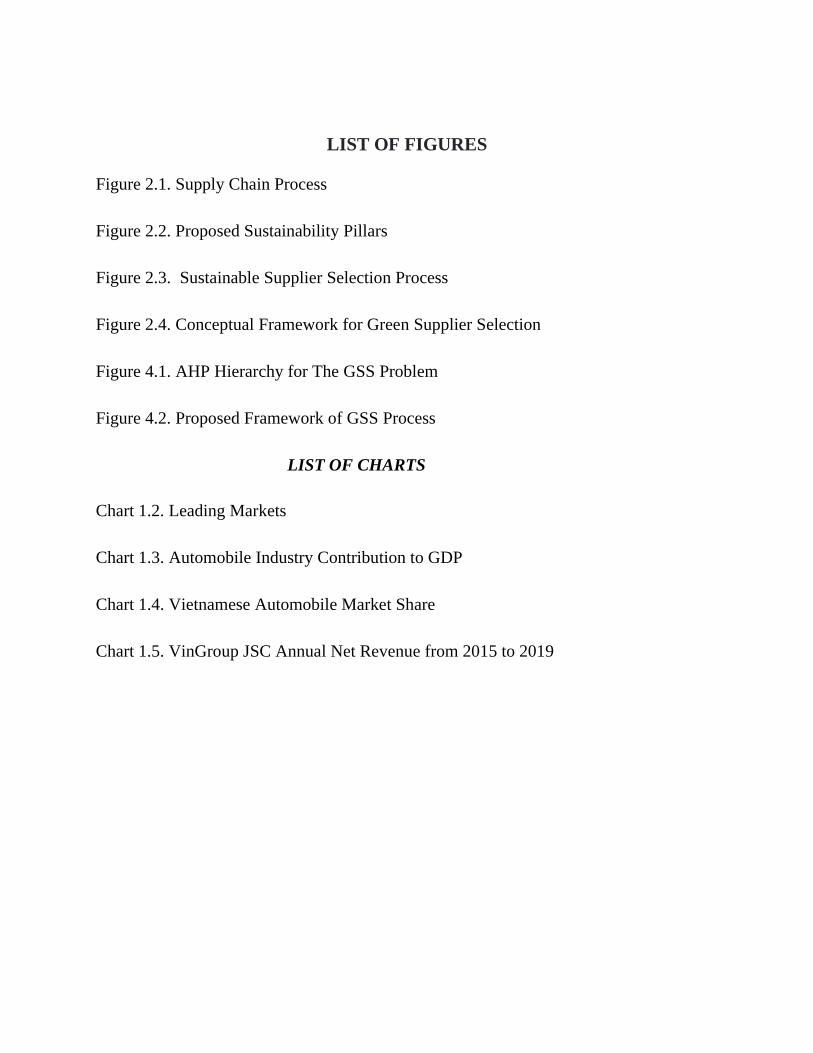
LIST OF FIGURES
Figure 2.1. Supply Chain Process
Figure 2.2. Proposed Sustainability Pillars
Figure 2.3. Sustainable Supplier Selection Process
Figure 2.4. Conceptual Framework for Green Supplier Selection
Figure 4.1. AHP Hierarchy for The GSS Problem
Figure 4.2. Proposed Framework of GSS Process
LIST OF CHARTS
Chart 1.2. Leading Markets
Chart 1.3. Automobile Industry Contribution to GDP
Chart 1.4. Vietnamese Automobile Market Share
Chart 1.5. VinGroup JSC Annual Net Revenue from 2015 to 2019

LIST OF TABLES
Table 1.1. Automotive Total Production in The World from 2000 to 2019
Table 1.2. Largest Manufacturers by Production Volume in 2017
Table 2.1. Sustainability Criteria Used in the Reviewed Articles
Table 2.2. MCDM Models Advantages
Table 2.3. MCDM Models Disadvantages
Table 4.1. Professional Backgrounds of the Selected Twelve Experts for Our Survey
Table 4.2. Initial Comparison Matrices
Table 4.3. Integrated Fuzzy Comparison Matrix
Table 4.4. Results of Fuzzy Weighting Value of Main Criteria (Economic,
Environmental, Social)
Table 4.5. Initial Comparison Matrices
Table 4.6. Integrated Fuzzy Comparison Matrix
Table 4.7. Results of Fuzzy Weighting Value of Economic
Table 4.8. Initial Comparison Matrices
Table 4.9. Integrated Fuzzy Comparison Matrix
Table 4.10. Results of Fuzzy Weighting Value of Environmental
Table 4.11. Initial Comparison Matrices
Table 4.12. Integrated Fuzzy Comparison Matrix
Table 4.13. Results of Fuzzy Weighting Value of Social
Table 4.14. Weighting and Ranking Results of FAHP
Table 4.15. Linguistic Variables for The Ratings
Table 4.16. Integrated matrix
Table 4.17. Normalized matrix
Table 4.18. Weighted normalized matrix
Table 4.19. D+
Table 4.20. D-
Table 4.21. Closeness coefficient of alternative
9
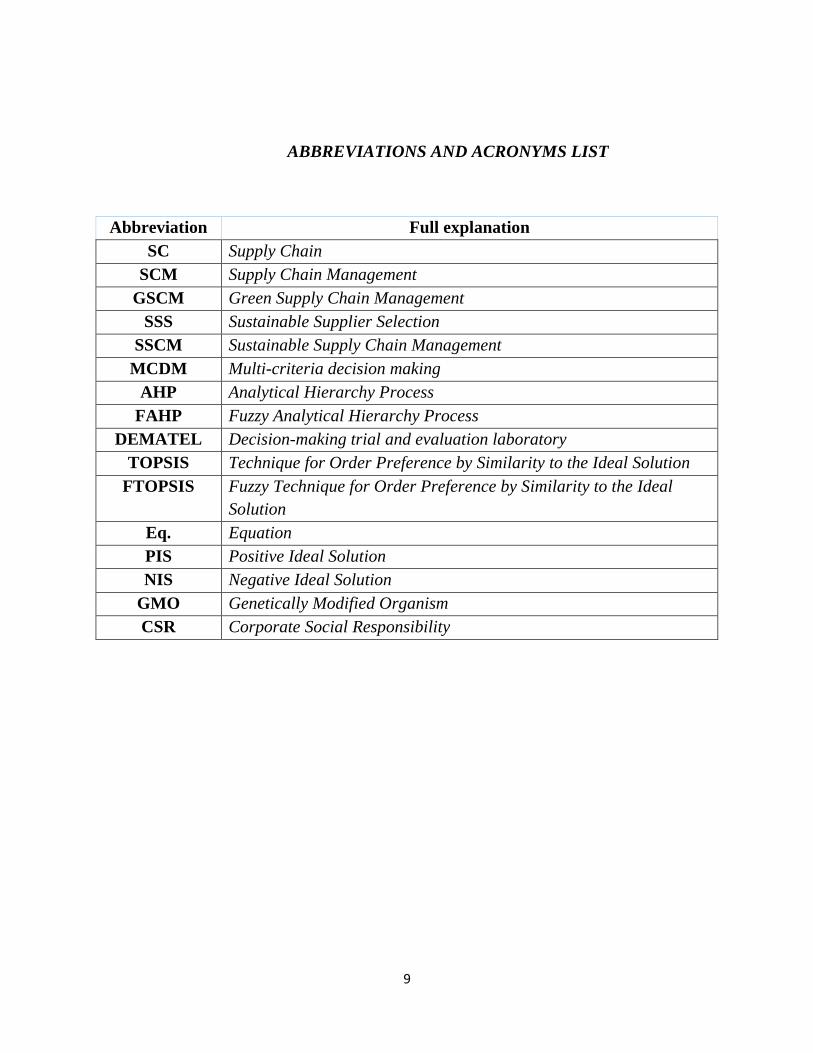
ABBREVIATIONS AND ACRONYMS LIST
Abbreviation Full explanation
SC Supply Chain
SCM Supply Chain Management
GSCM Green Supply Chain Management
SSS Sustainable Supplier Selection
SSCM Sustainable Supply Chain Management
MCDM Multi-criteria decision making
AHP Analytical Hierarchy Process
FAHP Fuzzy Analytical Hierarchy Process
DEMATEL Decision-making trial and evaluation laboratory
TOPSIS Technique for Order Preference by Similarity to the Ideal Solution
FTOPSIS Fuzzy Technique for Order Preference by Similarity to the Ideal
Solution
Eq. Equation
PIS Positive Ideal Solution
NIS Negative Ideal Solution
GMO Genetically Modified Organism
CSR Corporate Social Responsibility
10
CHAPTER 1: INTRODUCTION
1.1. BACKGROUND
1.1.1. Topic background
1.1.1.1 A brief to the automotive industry
Recently, by serving the population's transportation needs, the automobile industry
occupies a significant role in supporting the national economy and being an economic
sector with huge profits through the manufacture of goods with outstanding value.
In order to have such a brilliant automotive industry as it is today, the industry has
gone through a long embryonic period where the first major foundation was the invention
of various types of engines. In 1887, German scientist Nicolai successfully invented the 4-
wheel engine and successfully assembled its first car. It can be said that the invention of
the automobile is the indispensable crystallization of a period of blossoming inventions in
the first scientific and technical revolution of humanity. Because from the 13th-century,
the English Franciscan friar Roger Bacon identified that cars could be made to move with
unbelievable speed without animals. After that, the automobile gained the attention of
many scientists. They have continuously improved in both form and quality, from
primitive, bulky and ugly early cars to be lighter, smaller and more luxurious.
Subsequently, the automobile became popular, with the outstanding advantages of high
travel speed, maneuverability, effortlessness and a multitude of other conveniences. As a
result, the car has become an indispensable and useful means for the people of
industrialized countries and an important industrial product in all countries around the
world. Therefore, according to the history of the world automotive industry, in the first
year of the 20th century, there were 621 factories manufacturing cars and motorcycles
worldwide, of which 112 were in the UK, 11 in Italy, 35 in Germany, 167 in France, 215
in the US and 11 other countries. However, the milestone marking the official birth of the
automobile industry must be in 1910 when Henry Ford- founder of the famous Ford Motor
Corporation began to organize mass production of cars on a large scale.
After the Second World War, the modern science and technology revolution
exploded, the automobile and automobile industry also developed great progress. The
scientific and technical achievements that have been applied such as new materials,
electronic engineering, cybernetics, etc have fundamentally changed the automobile and
the automotive industry both science and technology as well as socioeconomic scale.
11
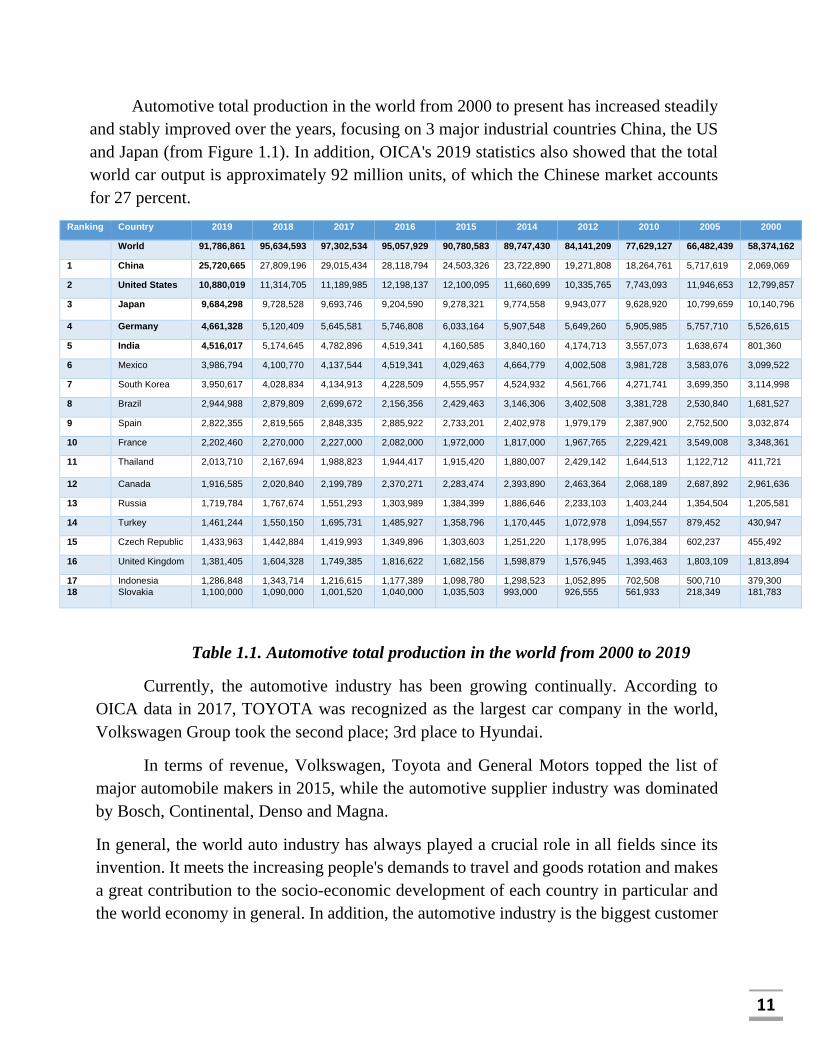
Automotive total production in the world from 2000 to present has increased steadily
and stably improved over the years, focusing on 3 major industrial countries China, the US
and Japan (from Figure 1.1). In addition, OICA's 2019 statistics also showed that the total
world car output is approximately 92 million units, of which the Chinese market accounts
for 27 percent.
Ranking Country 2019 2018 2017 2016 2015 2014 2012 2010 2005 2000
World 91,786,861 95,634,593 97,302,534 95,057,929 90,780,583 89,747,430 84,141,209 77,629,127 66,482,439 58,374,162
1 China 25,720,665 27,809,196 29,015,434 28,118,794 24,503,326 23,722,890 19,271,808 18,264,761 5,717,619 2,069,069
2 United States 10,880,019 11,314,705 11,189,985 12,198,137 12,100,095 11,660,699 10,335,765 7,743,093 11,946,653 12,799,857
3 Japan 9,684,298 9,728,528 9,693,746 9,204,590 9,278,321 9,774,558 9,943,077 9,628,920 10,799,659 10,140,796
4 Germany 4,661,328 5,120,409 5,645,581 5,746,808 6,033,164 5,907,548 5,649,260 5,905,985 5,757,710 5,526,615
5 India 4,516,017 5,174,645 4,782,896 4,519,341 4,160,585 3,840,160 4,174,713 3,557,073 1,638,674 801,360
6 Mexico 3,986,794 4,100,770 4,137,544 4,519,341 4,029,463 4,664,779 4,002,508 3,981,728 3,583,076 3,099,522
7 South Korea 3,950,617 4,028,834 4,134,913 4,228,509 4,555,957 4,524,932 4,561,766 4,271,741 3,699,350 3,114,998
8 Brazil 2,944,988 2,879,809 2,699,672 2,156,356 2,429,463 3,146,306 3,402,508 3,381,728 2,530,840 1,681,527
9 Spain 2,822,355 2,819,565 2,848,335 2,885,922 2,733,201 2,402,978 1,979,179 2,387,900 2,752,500 3,032,874
10 France 2,202,460 2,270,000 2,227,000 2,082,000 1,972,000 1,817,000 1,967,765 2,229,421 3,549,008 3,348,361
11 Thailand 2,013,710 2,167,694 1,988,823 1,944,417 1,915,420 1,880,007 2,429,142 1,644,513 1,122,712 411,721
12 Canada 1,916,585 2,020,840 2,199,789 2,370,271 2,283,474 2,393,890 2,463,364 2,068,189 2,687,892 2,961,636
13 Russia 1,719,784 1,767,674 1,551,293 1,303,989 1,384,399 1,886,646 2,233,103 1,403,244 1,354,504 1,205,581
14 Turkey 1,461,244 1,550,150 1,695,731 1,485,927 1,358,796 1,170,445 1,072,978 1,094,557 879,452 430,947
15 Czech Republic 1,433,963 1,442,884 1,419,993 1,349,896 1,303,603 1,251,220 1,178,995 1,076,384 602,237 455,492
16 United Kingdom 1,381,405 1,604,328 1,749,385 1,816,622 1,682,156 1,598,879 1,576,945 1,393,463 1,803,109 1,813,894
17 Indonesia 1,286,848 1,343,714 1,216,615 1,177,389 1,098,780 1,298,523 1,052,895 702,508 500,710 379,300
18 Slovakia 1,100,000 1,090,000 1,001,520 1,040,000 1,035,503 993,000 926,555 561,933 218,349 181,783
Table 1.1. Automotive total production in the world from 2000 to 2019
Currently, the automotive industry has been growing continually. According to
OICA data in 2017, TOYOTA was recognized as the largest car company in the world,
Volkswagen Group took the second place; 3rd place to Hyundai.
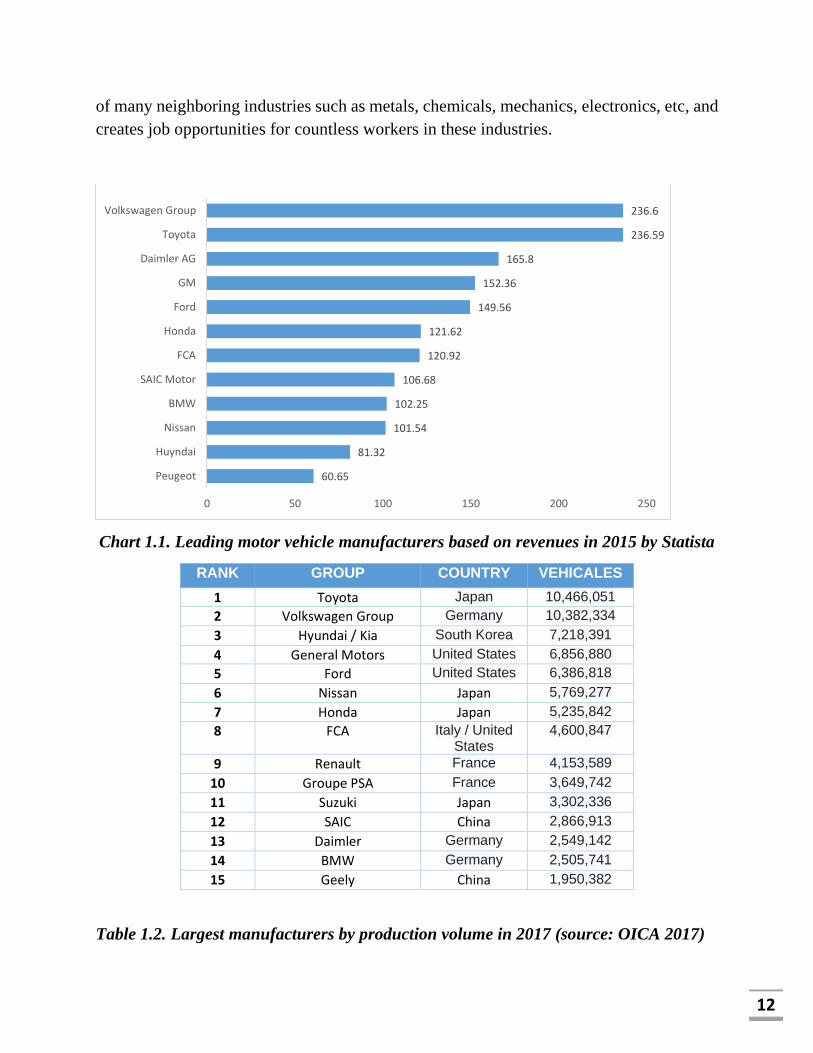
In terms of revenue, Volkswagen, Toyota and General Motors topped the list of
major automobile makers in 2015, while the automotive supplier industry was dominated
by Bosch, Continental, Denso and Magna.
In general, the world auto industry has always played a crucial role in all fields since its
invention. It meets the increasing people's demands to travel and goods rotation and makes
a great contribution to the socio-economic development of each country in particular and
the world economy in general. In addition, the automotive industry is the biggest customer
12
of many neighboring industries such as metals, chemicals, mechanics, electronics, etc, and
creates job opportunities for countless workers in these industries.
Chart 1.1. Leading motor vehicle manufacturers based on revenues in 2015 by Statista
RANK GROUP COUNTRY VEHICALES
1 Toyota Japan 10,466,051
2 Volkswagen Group Germany 10,382,334
3 Hyundai / Kia South Korea 7,218,391
4 General Motors United States 6,856,880
5 Ford United States 6,386,818
6 Nissan Japan 5,769,277
7 Honda Japan 5,235,842
8 FCA Italy / United States
4,600,847
9 Renault France 4,153,589
10 Groupe PSA France 3,649,742
11 Suzuki Japan 3,302,336
12 SAIC China 2,866,913
13 Daimler Germany 2,549,142
14 BMW Germany 2,505,741
15 Geely China 1,950,382
Table 1.2. Largest manufacturers by production volume in 2017 (source: OICA 2017)
60.65
81.32
101.54
102.25
106.68
120.92
121.62
149.56
152.36
165.8
236.59
236.6
0 50 100 150 200 250
Peugeot
Huyndai
Nissan
BMW
SAIC Motor
FCA
Honda
Ford
GM
Daimler AG
Toyota
Volkswagen Group

13
According to the Industrial Research Department, there are 7.3 million employees
in the auto industry, accounting for 11.3% of the 64.4 million employees in Japan. The
automobile industry consumes 70% of natural rubber; 67% lead; 64% cast iron; 50%
synthetic rubber; 40% of machine tools; 25% glass; 20% of semiconductor materials; 18%
aluminium; 12% steel and some huge fuel and oil. This shows that the development of the
automobile industry will motivate and entice the development of many other industries.
Finally, another important role of the world auto industry is accelerating
globalization through the internationalization of the world's auto giants and the promotion
of public transfers technology from developed countries to less developed countries.
1.1.1.2 Automotive industry in Vietnam and some specific countries
● Chinese automotive industry
China is currently the largest automobile consumption market in the world since 2009
(OICA 2009 report). Besides famous foreign models, China also has domestic cars which
are very popular in this country such as SAIC Motor, Dongfeng, FAW and Changan
Automobile. They are the four pillars of the Chinese automobile industry and help China
to actualize the domestic auto dream.
In the early 1950s, under the strong support of the Soviet Union, Chinese auto industry
was initially licensed and put into operation. During the 30 years of its establishment, this
industry had a small output, increased slightly and steadily with no more than 100-200
thousand units per year. The Chinese auto industry began to make significant strides in the
early 1990s and exceeded one million units for the first time in 1992. 10 years later, China
produced over two million units. It can be said that the golden period of the automobile
market in this country has developed rapidly since China joined the World Trade
Organization in 2001. From 2002 to 2007, national automobiles rose by an average of 21
percent, equivalent to one million vehicles per year. By 2009, China had officially usurped
the United States and became the biggest automobile manufacturer in the world in terms
of volume with approximately 14 million cars produced. In 2010, both sales and production
reached 18 million units, with 13.76 million passenger cars delivered. This was the largest
number in this country's history since joining the industry. In 2014, total vehicle production
in China reached 23.720 million units, accounting for 26% of global car production.
In 2019, according to OICA statistics, Chinese car production accounts for 27 percent
of the total world car production with approximately 26 million units. Thus, the Ministry
of Public Security found that since its establishment to the half of 2019, China has produced
about 250 million cars, making the auto industry the mainstay contributing to China's GDP.
14
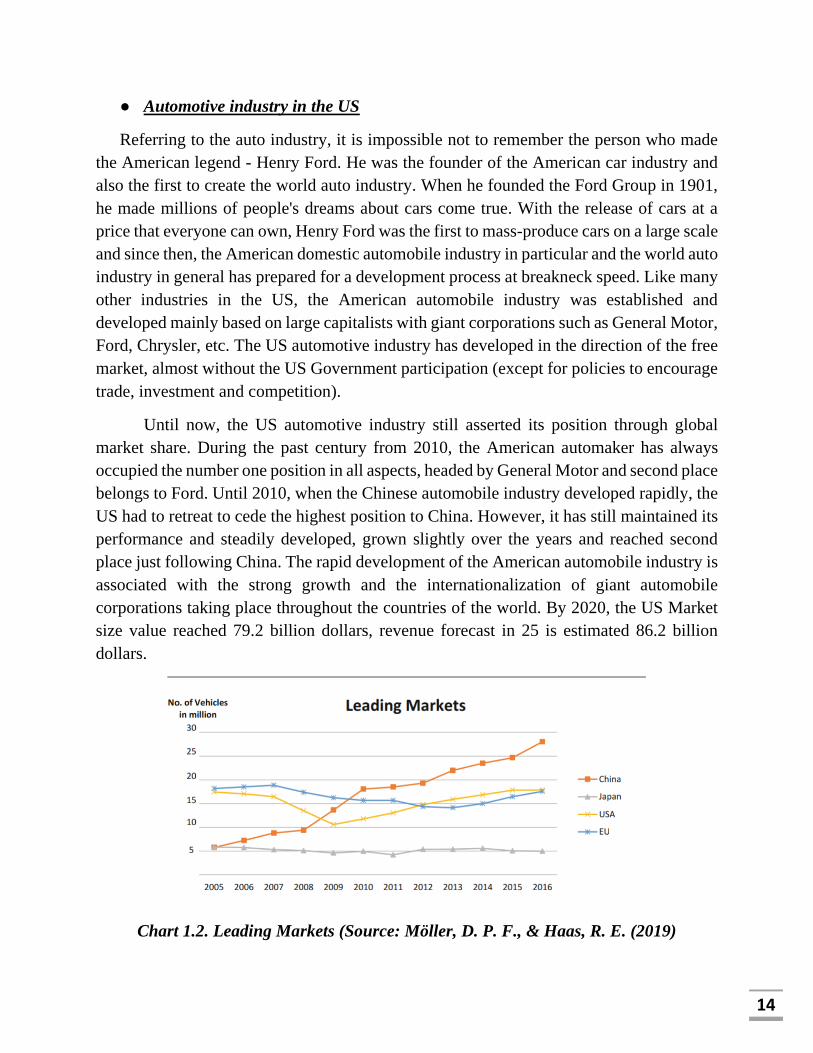
● Automotive industry in the US
Referring to the auto industry, it is impossible not to remember the person who made
the American legend - Henry Ford. He was the founder of the American car industry and
also the first to create the world auto industry. When he founded the Ford Group in 1901,
he made millions of people's dreams about cars come true. With the release of cars at a
price that everyone can own, Henry Ford was the first to mass-produce cars on a large scale
and since then, the American domestic automobile industry in particular and the world auto
industry in general has prepared for a development process at breakneck speed. Like many
other industries in the US, the American automobile industry was established and
developed mainly based on large capitalists with giant corporations such as General Motor,
Ford, Chrysler, etc. The US automotive industry has developed in the direction of the free
market, almost without the US Government participation (except for policies to encourage
trade, investment and competition).
Until now, the US automotive industry still asserted its position through global
market share. During the past century from 2010, the American automaker has always
occupied the number one position in all aspects, headed by General Motor and second place
belongs to Ford. Until 2010, when the Chinese automobile industry developed rapidly, the
US had to retreat to cede the highest position to China. However, it has still maintained its
performance and steadily developed, grown slightly over the years and reached second
place just following China. The rapid development of the American automobile industry is
associated with the strong growth and the internationalization of giant automobile
corporations taking place throughout the countries of the world. By 2020, the US Market
size value reached 79.2 billion dollars, revenue forecast in 25 is estimated 86.2 billion
dollars.
Chart 1.2. Leading Markets (Source: Möller, D. P. F., & Haas, R. E. (2019)
15
● Japanese Automotive industry
Japan is currently one of the most developed countries in the world, in which the
automobile industry plays a crucial role. During the period of miraculous development in
the decade from 1960 to 1970, Japan annually produced over 10 million cars of all kinds
and exported about 70 percent of the car produced. Some Japanese car manufacturers such
as Nissan, Toyota, Mitsubishi, Honda, etc are very famous all over the world. The growth
of the automotive accessories industry has been an important factor in the Japanese
automotive industry's growth.
45 years ago, the country's auto parts industry started out with small output and
simple technology, not even at the international level. Facing that fact, the Japanese
Government has set out legal policies to support the domestic accessories manufacturing
industry's development. The support measures have been maintained for nearly 20 years
and have strongly promoted the growth and modernization of the parts industry in
particular and the Japanese automobile industry in general. A few years after that, Japan
had 11 car manufacturers.
In 1952, Nissan transferred technology from Austin, England; 1953 Isuzu with
Hillman of England; Hino with Renault of France, etc. Meanwhile, accessories
manufacturers in the development and selection process have gradually accumulated in the
form of systematization or converted to production by themselves. In 1963, automotive
imports were liberalized, but at that time, the automakers have gained international
competitiveness. Development was then governed by American automobile industry
policy, which is the largest export market. For fear of losing the market share, the Japanese
manufacturers have flocked to technical development independent that met the demand of
the US government. In 1973 the oil crisis broke out, low fuel-using vehicles were
welcomed in the domestic market and as a result this strategy succeeded in expanding in
the US market.
Overall, the Japanese automobile industry's success based on protective policies that
manifested in the form of regulations banning car imports in 1963 and tariff regulations. In
the context of banning foreign capital from entering the auto market until 1971,
manufacturers still reached two goals: import substitution and foreign currency collection.
At the same time, this success was due to the indirect favors enjoyed by industrial policy
towards other industries in the country; in addition, the automakers know-how to take
advantage of changes in international conditions.

16
By 2018, Japan is recognized as the 3rd largest automobile market in the world, with a
total output of 9.7 million (according to OICA in Chart 1.1).
● Vietnamese Automotive industry
In the 1990s, the Vietnamese automobile industry was formed by the Government's
permission for foreign-invested enterprises to manufacture and assemble cars in Vietnam.
Before the 1990s, Vietnam mainly imported cars from socialist countries without any
enterprises investing in assembling and manufacturing cars. Major Vietnamese mechanical
enterprises primarily only repair and fix cars.
The automobile industry can be considered as a measure of the country's economic
development, at the same time, it is also a major contributor to every countries' GDP in the
world. A few years ago, this industry was considered as a "luxury" to Vietnam, however,
nowadays beside the rapid development, Vietnamese automobile industry is booming
strongly. Currently, Vietnamese automotive industry not only holds an important position
in promoting the development of national economy by meeting the needs of transportation,
contributing to the development of production and business, it is also an economic sector
that brings in very high profits with the help of production of outstanding value products,
which greatly contributes to the GDP of the country. In Vietnam, the Automotive industry
also accounts for 3 percent of the country's GDP. For this reason, this one always gets
special attention and treatment from the government. Trade agreements have always had
exceptions for the automotive industry to protect the industry from competitive pressure of
other countries worldwide.
The automobile manufacturing and assembling industry in Vietnam currently consists
of 2 blocks. The first one is foreign invested enterprises. The total investment capital of 14
FDI enterprises is 920 million USD, production capacity is 220,000 vehicles per year. They
manufacture mainly passenger cars, utility vehicles and trucks. The second sector includes
domestic firms. Up to now, more than 30 enterprises are investing in manufacturing and
assembling cars with a total capital of about 2,500 billion VND. Domestic enterprises
mainly produce buses, passenger cars, small and heavy trucks, and specialized vehicles.
In the present circumstances, Vietnam has signed a total of 15 free trade agreements
with countries and blocks, of which 13 ones have already been valid. A prominent thing
about the signed agreements is that two industries such as automotive and steel are always
treated extremely special and often on tax exemption list. Vietnam is considered a fertile
land for car manufacturers. While the car market in neighboring countries gradually
became saturated as a result of the automotive demand stimulus policy a few years ago,

17
Vietnamese people started to rush to buy cars by the law of supply and demand when the
country's economy developed significantly.
Chart 1.3. Automobile Industry Contribution to GDP (Source: Eurostat, CTS)
Source: Vietinbank report
This trend is expected to continue for a long time, plus the roadmap to join the Asean
Economic Community makes automakers strive to compete in the Vietnamese market, a
market previously considered to be the most expensive in the world because of tax and
investment policies. Moreover, even luxury car manufacturers participate enthusiastically
in this race. As an inevitable result, Vietnamese automotive market has become diverse in
terms of models, segments and also customers. That situation makes the auto market a
3.25%
12%
4%
5%
3%
US THAILAND GERMANY CHINA VIETNAM
Automobile Industry Contribution to GDP
The achieved figures
Total revenue in 2018: $ 10.3 billion
Growth from 2014 to 2018: 23.7%
Number of domestically produced cars in 2018: 263,170 Units
Estimated growth 2019-2023: 10.5 - 15%

18
fierce battle than ever. Automakers try to come up with competitive strategies to gain a
foothold in the market that is seen as becoming increasingly grumpy.
According to a VAMA report in early 2020, Toyota, Honda, Ford and Thaco
currently account for 77 percent of the auto market share in Vietnam. In which, accounting
for the highest market share is a domestic company - Thaco with 34.3 percent, the second
is Toyota with 23.8 percent, Honda and Ford hold 10.2 percent and 8.7 percent of the
domestic vehicle market respectively. The rest are other brands such as VinFast,
Mitsubishi, etc.
Chart 1.4. Vietnamese Automobile Market Share
1.1.2. Practical problem
1.1.2.1. Environmental problems affected the economy
The explosive industrial revolution has dramatically changed society and people's
lives around the world. Industrial development has rapidly increased various factories,
modern means of transport, and many items in everyday life. Besides the convenience and
modernity that they bring to human life, they have inadvertently caused more serious
environmental pollution, such as climate change leading to terrible natural disasters, global
warming, etc. Therefore, environmental protection has become an incredibly urgent issue
and also the anxiety of the whole world today.
35%
24%
22%
9%
10%
Thaco Toyota Others Ford Honda
19
In an economy increasingly focusing on environmental protection, companies and
enterprises aim to create added value and aim to be sustainable development with
consideration in terms of environment and public health. Over the past few years,
companies worldwide have been working to perfect their supply chains by building eco-
friendly supply chains- Green Supply Chain. Not only protecting the environment, but the
green supply chain is also a development that brings a competitive advantage for
companies in expanding markets and increasing profits.
In general, Green supply chain is the chain that operates efficiently, ensures both
environmental friendliness and efficient use of natural ecological resources, for instance:
product design, sourcing, and raw materials selection, operating procedure of
manufacturing, delivering products to customers, and recycling management. Besides the
environment's efficiency, GSC also brings positive effects on both the economy and
society. For the economy, GSC helps improve production processes, reduce material costs,
create competitive advantages, increase flexibility and linkages with partners. In addition,
for society, GSC helps protect human health, reduce bad impacts from industrial waste,
reduce bad effects on the community and demonstrate social responsibility per business.
1.1.2.2 Overview of green supply chain management
● Green supply chain
In recent years, the phrase "green supply chain" has been mentioned more and more.
Concerning these concerns, there have been several other words, such as "sustainable
supply chain", "sustainable green supply chain", "environmental supply chain", "ecological
supply chain", etc. The sustainable green application can be defined as using
environmentally friendly inputs and turning the by-products into something that can be
improved or recycled in the current environment. This enables the outputs and by-products
to be reused at the end of their life cycle, thus creating a sustainable supply chain. Penfield
suggested that a sustainable supply chain's whole idea is to reduce costs and be
environmentally friendly (Penfield, 2008). Narasimhan & Carter defined green supply
chain management concerning the use of methods that reduce materials in addition to
recycling, processing, and reusing (Narasimhan, 1998). Godfrey (1998) considered green
supply chain governance as the practice of continuously monitoring the environmental
impacts of a chain and improving its results (Dawei et al., 2015). Beamon emphasized the
importance of collaboration with a company and the definition of green supply chain
governance is the use of supply chains between a central company and a collaborative firm
to support organizations (Beamon, 1999). Sarkis also defined green supply chain
management as a combination of an environmental firm's operations and recovery logistics,

20
which emphasizes the importance of the latter (Sarkis, 2003). Johnny defines green supply
chain management as the process of adding 'green' elements to existing supply chains, and
creating a recalled supply chain as the act of radically rebuilding systems (Ho, 2009). This
includes the pursuit of efficiency and supply chain innovation in terms of costs, returns,
and the environment. Although there are many different concepts that are presented
depending on the perspective of each study, all the results have the common feature that
the green supply chain must ensure two problems: cost, cost minimization and more
environmentally friendly.
● Green supply chain management
Although still being a new topic in the world, there has been a lot of research focusing
on green supply chain management and its importance for businesses and applications.
practice and practical analysis in many businesses. In 1996, Robert Handfield at the
Manufacturing Research Group at Michigan State University used the concept of green
supply chain management for the first time. Handfield initially gave a basic idea of the
environmental impacts of optimizing the use of resources in the manufacturing industry's
supply chain, particularly the home appliance industry. Accordingly, green supply chain is
the process of specifying environmental criteria or concerns about an organization's
purchasing decisions and long-term supplier relationships (Dawei et al., 2015).
Green supply chain is expanding in the purchasing of raw materials for production and
input of the business. Enterprises need to improve the long-term in green supply chain
management, particularly in establishing supplier partnerships to be able to control raw
materials. Supply chain greening is playing a significant role in all sectors, especially for
high-tech electronics, fast-moving consumer goods, original product manufacturers
(OEMs), etc. Green supply chain management combines supply chain management
practices and environmental indicators to form purchasing decisions and long-term
relationships with suppliers. It also focuses on minimizing waste of all business activities
to save energy and prevent the hazardous effects of materials on the environment. Not only
that, green supply chain management is also identified as the direction of combining
logistics with business strategy and environmental issues in collaborative efforts to
maximize business performance and efficiency towards the desired results. The
distribution of goods always has high risks of harmful impacts on the environment, so
businesses that desire an effectively organized green supply chain need to organize the
distribution network and logistics well.
In specific terms, the concept of supply chain management is defined as: a green supply
chain management system should include purchasing, inbound logistics, manufacturing,

21
distribution and reversed logistics (Sarkis, 2003). In this concept, Sarkis has expanded the
idea of green supply chain management more wholly and extensively. Green supply chain
management needs to incorporate environmental ideas into the normal supply chain
management process. The above research theories have shown that green supply chain
management is consistent and covers many stages of the product life cycle, from the
production of raw materials, to the design, manufacturing and distribution stages, the
consumers' use, along with the handling of product problems at the end of the life cycle. In
other words, green supply chain management can be said to be a modern governance model
in the overall supply chain management, in which environmental effects and impacts are
concerned. Like normal supply chains, green supply chain management is concerned with
purchasing, operation, production, distribution, logistics, etc. However, the nature of the
goals and the achieved values have fundamental differences. First of all, the supply chain's
target value is often aimed at economic values from efficient management, operating costs,
warehousing, reduced production costs, and distributed goods. Approaches to the
environment are often available in the supply chain, but in the first place thanks to the
efficiency in reducing the use of resources.
● Green supplier and Green supplier selection
In the enterprise's core business activities, supply chain in general, and GSC in
particular, suppliers have an extremely significant role. They ensure to supply materials,
raw materials, goods, etc with sufficient quantity, quality, stability, accuracy, etc to meet
production and business requirements with low cost and on time. Aside from the final
consumer, suppliers are known as all the enterprises in the supply chain. Ting and Cho
demonstrated that suppliers are also the SC’s entire source. The precondition and basis of
SC cooperation is effective supplier management 2009 (Ting and Cho, 2008).
For the green industry, Hoek considered that GSM has improved and practiced based
on supplier management and it minimized environmental risks and also environmental
management obstacles for businesses (Van Hoek, 1999). In addition, green suppliers
helped minimize life cycle cost to provide consumers goods that are more environmentally-
friendly, safer, and less expensive.
In view of all the above, suppliers have become a crucial part of green supply chains
and positively affect the development of green supply chain management (Hsu et al.,
2013). Green supplier management in this study will concentrate on how enterprises select
green suppliers and how green suppliers are developed.

22
According to all the reasons below, selecting and grouping the most suitable suppliers
and managing them is a prerequisite, playing a substantial responsibility in SCM,
contributing to production and business organizations' success. Selecting suitable green
suppliers and managing them is the basis for organizations to reduce input costs, improve
goods quality and services provided to customers, and improve their competitiveness in the
market. To choose suitable green suppliers, many economic and environmental standards
need to be considered in the evaluation process. Consequently, the topic of supplier
selection has been broadly researched over the past several decades by a series of famous
researchers such as Feng et al. (2011). Dickson (1966), Johnson et al. (1995), Patton (1996)
Yahya and Kingsman (1999), etc. (Dawei et al., 2015). The primary criteria were specified
through those research, including green competency, environmental efficiency, suppliers'
green image, and net life-cycle cost. With a view to addressing all of the criteria and
difficulties in selecting green suppliers, various multi-criteria decision-making (MCDM)
techniques have continually progressed over the years.
1.1.2.3. "Green" economy trend in the world and Vietnam
The environmental issue is the concern of the whole world, so in recent decades, the
world has continuously applied and favored the green and sustainable economic
development to create an economy that both satisfies the need for economic growth and
addresses environmental challenges.
In the world, there are several common approaches to describe the Green Economy.
A green economy is an intelligent, sustainable, and equitable economy (European
Commission, 2011). Green Economic Coalition (2012) defined a green economy as an
economy that creates a better quality of life for everyone within the earth's ecological
limits. ICC has considered a green economy from business perspective and thought that a
green economy is one where economic growth and environmental responsibility go hand
in hand and mutually support each other, and at the same time supporting the social
development process (ICC, 2012). UNDESA synthesized many countries' definitions and
pointed out the common point that the green economy should aim to reduce the negative
impacts of economic activities on the environment and society (UNDESA, 2012).
The United Nations Environment Program has introduced the concept of a green
economy as one that brings human well-being and social justice, while significantly
reducing environmental risks and ecological degradation. This is considered the most
accurate and complete explanation of the green economy. Accordingly, a green economy
is simply one with low emissions, efficient use and saving of natural resources, ensuring
social equity. In GE, the growth in income and employment through public and private
23
investments in the economy reduces carbon emissions, reduces environmental pollution,
and efficiently uses energy and resources efficiently, also preventing biodiversity and
ecosystems' service degradation.
Green supply chain concept is associated with green economy. Along with the current
conditions of globalization, green supply chain and green supply chain management are
considered as a direct and effective mechanism to solve environmental problems in the
global value chain. Utilizing the purchasing power and consumption behaviour of
governments, large enterprises and communities, green supply chain management is the
market mechanism to reduce pollution and increase energy efficiency and natural
resources. When combined with national, regional and global legal sanctions, it can lead
to a green shift in industries.
The Green Public Procurement is an essential element to promote green supply chains.
In the current free-market system, demand has a significant influence on supply choices.
Due to the special concern of worldwide buyers about the environment as well as green
products, businesses must gradually change towards greening their products if they do not
want to lose market share. Therefore, green procurement is an effective market-oriented
tool to develop environmentally friendly products and services, thereby gradually greening
the supply chain. Therefore, in most countries' or region's supply chain greening strategies,
the role of green public procurement is highly valued.
With the trends of green economic development and green shopping, at present, many
countries around the world have made great strides in the development of green economic
models, specifically Asian countries such as Korea, Japan, China, etc; in Europe: Germany,
UK, France, Netherlands, etc have pioneered green growth and green procurement and
supply.
● US green development trend
The US Government has enacted laws and regulations to guide the development of
green supply chains. These focused on pollution and traffic control, food preservation and
consumer health protection. Since then, corresponding monitoring systems were also set
up and promoted market preferences to guide businesses’ behaviour in order to
environmental protection, specifically tax incentives to influence enterprises' financial
decisions, thereby increasing the efficiency of using available energy resources and
adopting renewable energy sources. The US government will subsidize the enterprises that
lead the use of renewable energy in the supply chain. In addition, laws and regulations
requiring and encouraging firms to report environmental impacts related to supply chains

24
have also been enacted. The most compelling evidence is the Toxics Release Inventory
requirement that requires companies to report the amount of chemical toxins they release
during their operations. Moreover, the US government also implemented a reporting
system on environmental information. All US companies or enterprises doing business in
the US have to report relevant financial and corporate governance issues in standard format
published by the Securities and Exchange Commission. What’s more, the US Government
has also stepped up the implementation of voluntary programs to reduce the environmental
impact of the supply chain. They encouraged enterprises to implement voluntary programs
in order to reduce the environmental impact of supply chain. The government-sponsored
volunteer programs to encourage businesses to join the green value chain and orient these
businesses towards sustainable activities. These things are instructive and where businesses
share profitable operating experiences, for instance, the SmartWay program that started in
2004. This is a partnership program between the government and the logistics industries to
reduce fuel use by means of efficiency.
Top US firms are also very interested in establishing partnerships with suppliers that
pay attention to the supply process's environmental issues. Suppliers are ultimately selected
based on compliance with laws and regulations and through other very thorough analysis.
And when they become partners, leading businesses will orient, support and help these
suppliers. For example, environmental workshops and delivery of environmental training
are often held.
● Green procurement trend to develop green supply in the European Union
The European Community has enacted policies related to the GPP quite early. In fact,
public procurement accounts for about 19.9% of the EU's total national income (Renda et
al., 2012). Therefore, promoting "green" criteria in public procurement is extremely
important in encouraging markets to produce and exchange greener products. In addition,
developing green public procurement widely is also a goal in the Europe 2020 strategy to
move towards a resource-efficient Europe. EU member states assume that when applying
the GPP they will be able to have benefits not only in terms of environment, society and
health, but also economic and political benefits.
Besides, promoting GPP also means promoting the development of environmentally
friendly technologies. Recognizing such benefits, the European Union has emphasized the
importance of the GPP since 2001 with the issuance of a statement explaining Community
legislation applied to public procurement and capacity to integrate environmental issues
into public procurement. This was the first statement explaining the incorporation of
environmental issues into the public procurement process. Later in 2004, two important

25
public procurement guidelines were adopted, including detailed items related to
environmental issues such as the use of technology that meets environmental requirements,
and using eco-labels, establishing social and environmental conditions in the enforcement
of sales contracts, requiring economic actors to meet mandatory environmental demand,
requiring economic entities when implementing contracts must comply with environmental
management criteria and apply bonus criteria based on environmental characteristics.
Following that, in 2008, the European Commission went on to issue the announcement
of Public Procurement for a Better Environment as part of the Action Plan on Sustainable
Consumption and Production and Sustainable Sector Policy. With this announcement, the
European Commission developed common GPP standards for several product and service
groups and invited agencies to incorporate these standards into their procurement
procedures, thereby purchasing greener products and services. Specifically, 10 selected
product groups included clean products and services, construction, electricity, catering
services and food products; office equipment, copy and graphic paper, textile, transport
and furniture. Recently, the number of products and services with green criteria has been
expanded to 20, including: gardening products and services; insulation products; floor
covering equipment, wall panels; street lights and traffic lights; mobile phone; indoor
lighting, sewage infrastructure and sanitary water taps. Each product group has its own
core and comprehensive standards. The core standard is the standard that applies to all
contracting agencies in Europe to address critical environmental issues at the lowest costs
of verification and incidental costs. Comprehensive standards are intended for those
agencies that want to buy the best products for the environment. These standards will incur
higher verification costs than products with the same function.
In summary, the European Union considered sustainable development a long-term
development strategy, so GPP will continue to be encouraged in the next time. Until now,
the most important change in the European Union has been the introduction of common
GPP standards for countries. Lastly, the support from policy and legal frameworks are also
important factors in accelerating the green public procurement process in Europe.
● Korean green development trend
Korea pays a lot of attention to green growth and development, and this country early
had a relatively legal basis on this issue. In fact, since 1992, Korea has established Korea's
eco-label. In 1994, the "Regulation on environmentally friendly technology development
and support" was born and initially encouraged GPP. More importantly, the Green Product
Promotion Regulation to promote the purchase of eco-friendly products was enacted in
2004 and has been valid since 2005. This regulation requires state agencies to submit

26
effective annual plans and records to green public procurement to the Ministry of
Environment. Furthermore, the Korean law allows the Ministry of the Environment to
design "Guidelines for the procurement of environmentally friendly products". This guide
oriented public agencies to prepare and create strategic procurement plans and initiatives
and have annual reports on these strategies. At the same time, it directed the public
authorities to set up a list of products that meet the standards and have the Korean eco-
label, the energy-saving stamp or the recycling mark. Since 2005, the application of the
Green Procurement Law has increased the amount of green public procurement in Korea
from 255 million USD in 2004 to 850 million USD in 2006. By 2010, this figure was
estimated at 1400 million USD, accounting for 80 % of total government procurement (Ho,
Dickinson and Chan, 2010).
● Vietnamese Green development trend
Vietnam is one of the few countries heavily affected by climate change and has suffered
many negative impacts from natural disasters and epidemics. DARA International pointed
out that climate change can cost Vietnam about $15 billion per year, equivalent to about
5% of GDP. If Vietnam does not have a timely response, climate change damage will be
estimated to reach 11% of GDP by 2030 (Scott, Hall and Gössling, 2019).
Recognizing the impacts of climate change on people's lives, Vietnam has had many
green economic development policies over the past few years. The Party's XII Congress
reaffirmed the goal of rapid and sustainable development, green economic development,
ensuring rapid and sustainable development on the basis of macroeconomic stability and
continuously improving productivity and quality, efficiency and competitiveness,
harmoniously developing between breadth and depth, focusing on deep development;
developing knowledge economy, green economy. Economic development must be closely
gone with social and cultural development, environmental protection, and proactive
response to climate change, ensuring national defense and security and maintaining peace
and stability in order to build the country.
1.1.3. Company background
1.1.3.1 Vingroup joint stock company
Vingroup - Joint Stock Company, formerly known as Technocom Group, was
established in Ukraine in 1993 by young Vietnamese people. The company initially
produced the dried foods and achieved great success with the Mivina instant noodles brand.

27
In the early years of the 21st century, Technocom always appeared in the ranking
of Top 100 largest enterprises in Ukraine. Since 2000, Technocom - Vingroup has returned
to Vietnam to invest with the desire to contribute to enrich the country. With a long-term
vision and a sustainable development perspective, Vingroup has focused on investing in
tourism and real estate with two original strategic brands- Vinpearl and Vincom. Vincom
has become a top 1 brand in real estate with unceasing efforts with a series of high-end
commercial centres, offices, apartments in big cities, and leading smart urban, luxury eco-
urban trends in Vietnam. Along with Vincom, Vinpearl has also become the tourism
industry leader with a chain of hotels, resorts, villas, amusement parks, etc.
In January 2012, Vinpearl Joint Stock Company merged into Vincom Joint Stock
Company and officially operated under the Group model with the name of Vingroup. After
establishment, Vingroup restructured and focused on growing with many brand groups
such as Vinhomes (luxury serviced villas and apartments) in the spirit of sustainable and
professional development. Vincom (High-class commercial centers), Vinpearl (Hotel,
Tourism), Vinpearl Land (Entertainment), Vinmec (Medical), Vinschool (Education),
VinCommerce (Retail business: VinMart, VinPro, Adayroi, VinDS, etc), VinEco
(Agriculture), Almaz (International Culinary and Conference Center), etc.
At the end of 2019, Vingroup announced a consolidated financial report with huge
total assets of approximately 408,572 billion VND and annual net revenue reached 100.3
trillion VND (According to Statista)
Chart 1.5: VinGroup JSC annual net revenue from 2015 to 2019.Source: Statista
0
20
40
60
80
100
120
2015 2016 2017 2018 2019
29.7
48.4
76.3
102.6 100.3
28
With the dream to bring to the market international standards products and services
and completely new experiences of modern lifestyle, in any field, Vingroup also proves its
pioneering role and orients consumer trends. Efforts and hard work from the first steps,
Vingroup has created miracles to honour Vietnamese brands and also brought sustainable
and dynamic development strategy with the potential for international integration to reach
the regional level. At present, Vingroup is proud of being one of the leading private
economic groups in Vietnam.
1.1.3.2 VinFast Manufacturing and Trading Co., Ltd
In 2017, VinFast Manufacturing and Trading Limited Liability Company was
established as a Vingroup Joint Stock Company subsidiary. This is also the 7th core
business of Vingroup with the head office located in Hanoi and the CEO is Mr. Pham Nhat
Vuong. The birth of VinFast not only contributed to making the Vietnamese car dreams
come true, but also opened Vingroup's era of development-based technology and
knowledge and participated in promoting Vietnamese automotive industry. VinFast's goal
is to become the leading car manufacturer in Southeast Asia with a design capacity of
production complex up to 500,000 vehicles per year by 2025. VinFast's main product is
internal combustion, electric motor-using cars, and eco-friendly electric motorcycles.
From the initial expectation of most Vietnamese customers for Vietnamese-branded
cars with quality and cheaper price. On 2nd September 2017, Vinfast’s factory was
officially constructed. The manufacturing factory located in Hai Phong owns an area of
335 hectares, includes 5 main workshops. From the first day of launching the product,
Vinfast has realized its ambition to manufacture Vietnamese branded cars.
In January 2018, VinFast signed a contract to buy intellectual property rights from
BMW, thereby completing the value chain led by VinFast and famous global brands such
as Pininfarina (design), BMW (technology, engineering, manufacturing methods), Magna
Steyr, and AVL (automotive engineering and manufacturing consulting), Siemens (plant
design, management, and operation), Bosch (automotive components and technology), etc.
One year after its debut, Vinfast appeared first time at the Paris Motor Show 2018.
This is one of the main milestones of Vinfast to bring the Vietnamese car brand abroad and
attract the attention of Vietnamese auto fans
One of the important goals that VinFast aimed is to export to expand the market as
well as to generate profits in scale, contributing to reduce the company's economic
29
pressures. VinFast's export targets are enormous markets, including Europe, China and
ASEAN. VinFast has prepared carefully by quietly establishing subsidiaries and
representative offices in Germany, China, and Korea since August 2018.
Up to now, Vinfast has launched 4 lines of gasoline cars: Fadil, LUX A2.0, LUX
SA2.0, President, in which Vinfast's largest internal market share is Vinfast Fadil. In early
2021, Vinfast also launched 3 lines of electric cars: VF31, VF32, VF33. This is a crucial
milestone that affirms VinFast’s vision of becoming a global electric automotive brand and
bringing Vietnam to a new position on the world automotive industry map.
According to the latest VAMA report, in the terrible effect of the Covid-19
epidemic, VinFast still achieved impressive successes with record sales of nearly 30,000
cars in Vietnam after less than 18 months officially launched the market with only 3 models
(excluding VinFast President due to the limited edition only producing 500 units). The
above figure confirmed the Vietnamese car brand's position, especially when compared
with many other famous international brands.
With the mission of bringing Vietnamese people better living standards, Vingroup
desires to build a proud, stylish, and classy automotive brand with ambitions to go beyond
the domestic market and catch the global one.
1.2. RESEARCH OBJECTIVES
The main purpose of this study is to analyze and select green suppliers for VinFast. To
achieve the set purpose, this research implements all the following objectives:
➢ Analyzing the current state of the automotive market and green supply trends in the
world in general and in Vietnam in particular;
➢ Revising overview of studies related to standards and evaluating models, and green
supplier classifications;
➢ Presenting general overview of Fuzzy Set Theory and MCDM models, specifically
FAHP, and FTOPSIS;
➢ Developing specific hybrid MCDM model to classify a group of green suppliers;
➢ Applying the proposed model of integrating FAHP and FTOPSIS to assess green
suppliers for VinFast, thereby giving some suggestions and implications.

30
1.3. RESEARCH QUESTIONS
To achieve set purpose, this study answers the following questions:
➢ What set of criteria affects VinFast’s green supplier selection?
➢ How do proposed criteria influence VinFast’s green supplier selection?
1.4. RESEARCH SCOPE
In this study, we will concentrate on groups of criteria that affect VinFast’s green
supplier selection. Our research method to collect data is direct interview, which focuses
on a group of professionals, business and economic specialists, and VinFast’s high-level
staff.
➢ Type of survey: Direct interview with automotive specialists
➢ Number of respondents expected: 12 experts
➢ Respondents: 12 experts from Technical and Customer Service, Commercial
Vehicles Service Division, Toyota Motor Vietnam Co., Ltd.; Body Development
Division, Ford Vietnam Limited; Vehicle Production Engineering Group
Production Engineering Department, Honda Vietnam Company Quality
Technology Section; Hyundai Vietnam Ltd.; Production Control Management
Division, Isuzu Viet Nam Co., Ltd.; Management Department, Suzuki Vietnam Co.,
Ltd.; Manufacturing department, Kia Motors Vietnam Parts Quality Control
Section; Porsche Vietnam Body Development Division Engineering Development
Engineer; Mercedes-Benz Vietnam Ltd Automotive Asia Limited (Audi Vietnam);
THACO passenger Car Distribution Co., Ltd (BMW Distributor in Vietnam);
VinFast Commercial and services trading limited liability company.
1.5. METHODOLOGY AND DATA REVIEW
In this research, multiple methods were applied to collect and analyse data. The
primary research was implemented on the basis of quantitative research, which is gathered
through direct interview and then analyzed by FAHP, and FAHP methods determines
weights of criteria, and FTOPSIS method evaluates green suppliers. Secondary research
was conducted through online references (news, VinFast's official website, research
articles, books, etc), consultation with economic experts, and Vinfast's internal data.
1.6. CONCLUSION
This thesis gives an introduction to the research topic and provides background
information related to our research. It focuses on introducing topic background, company
31
background, and giving an overview of the practical problem of green supply chain in
Vietnam. To investigate this problem, the research subject, research scope, and proposed
research questions are identified.
1.7. THESIS OUTLINE
The rest part of the thesis (excluding the abstract, appendix, reference, list of tables and
figure, abbreviations and acronyms list) is laid out as follows:
➢ Chapter 1: Introduction
Chapter 1 briefly provides basic information about the background, objective, and research
question as well as the methodology.
➢ Chapter 2: Literature review
Chapter 2 presents relevant theories that are the basis to develop research questions.
Different methods to evaluate and choose a green provider are presented briefly
➢ Chapter 3: Methodology
Chapter 3 presents research methods such as qualitative, quantitative, and observational
studies. Data collection and analysis methods are clarified in this chapter.
➢ Chapter 4: Empirical Case Analyses of VinFast
Chapter 4 analyses and applies the model and methods proposed in Chapter 3 to evaluate
and group green suppliers for VinFast.
➢ Chapter 5: Conclusions and Implications
Final chapter answers the research questions by summarizing the findings and suggest
recommendations for VinFast company to choose suitable green suppliers. Limitations and
implications of this study are also reminded for applying our results in future research.
32
CHAPTER 2: LITERATURE REVIEW
This chapter provides an overview of the automotive industry around the world and
Vietnam, reviews the perspectives on the literature and related models used in the process
of selecting sustainable green suppliers. Also, the literature gap is stated.
2.1. OVERVIEW OF THE AUTOMOTIVE INDUSTRY
Automated cars are now becoming an essential driving force for passenger change.
According to the latest statistical data, despite the decline of the automotive industry in
ASEAN countries was influenced and failed in 2020 by the 19 deadly viruses of COVID,
the large market in the automotive sector indicates signs of recovery. Specifically, On the
26th of February, Toyota announced a 4% improvement in production to 741,704 units
(Roberts, 2021). In 2021 SUVs began "with a success story" in Europe as a result of JATO
Dynamics, which announced that the sector accounted for 44 % of all new passenger car
registrations in January for 27 markets, the largest share ever registered for SUVs (Roberts,
2021). Through in January 2021, the demand for a new vehicle in the Thai industry dell
unexpectedly by 23% compared with that reported a year earlier, the wholesale data
collected by the Federation of Thai Industries and Malaysia's new-vehicle market
decreased by almost 24 % in January 2021 in the same month of the previous year, based
on registration data released by the Malaysian Automotive Association (Roberts, 2021).
In recent years, the automotive industry has drawn many emerging economies,
including Vietnam. Instead of importing only automobiles in the 1900s, car manufacturing
was strongly encouraged by the government’s policy but it is still under market pressure
from countries that are strong on exports such as China where is among the biggest
automotive markets in the world, India, and some ASEAN countries (An, 2019). Due to
the automotive sector's contributions, the national GDP is 3% (Bank, 2019). In January
2021, Vietnam's market for new vehicles started to recover significantly with more than
60% of sales rising in the same month last year (Team, 2021). In the first month of 2021,
Vietnam's VinFast sales of cars rose compared to May 2020. (Marklines.com, 2021).
Advanced Science and technology application significantly from foreign countries
combined domestically assembled production lines, VinFast is proud to be a sustainable
business in the automotive industry in Vietnam.
33
2.2. GREEN SUPPLY CHAIN MANAGEMENT
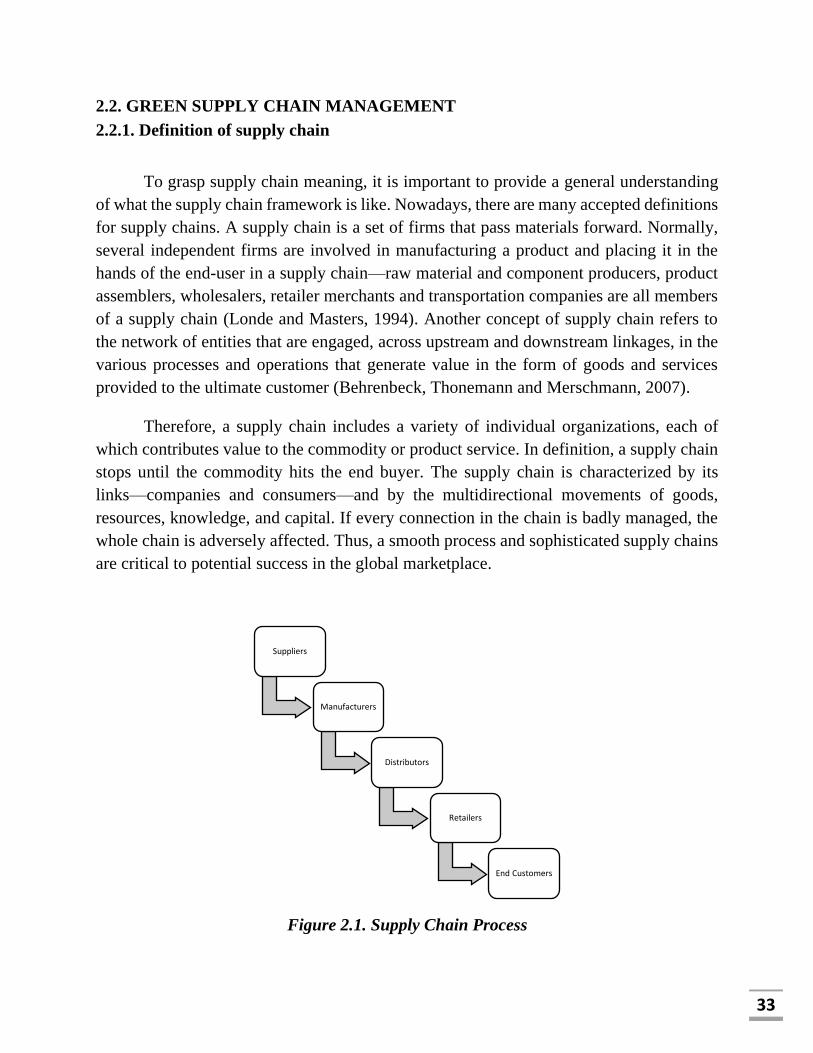
2.2.1. Definition of supply chain
To grasp supply chain meaning, it is important to provide a general understanding
of what the supply chain framework is like. Nowadays, there are many accepted definitions
for supply chains. A supply chain is a set of firms that pass materials forward. Normally,
several independent firms are involved in manufacturing a product and placing it in the
hands of the end-user in a supply chain—raw material and component producers, product
assemblers, wholesalers, retailer merchants and transportation companies are all members
of a supply chain (Londe and Masters, 1994). Another concept of supply chain refers to
the network of entities that are engaged, across upstream and downstream linkages, in the
various processes and operations that generate value in the form of goods and services
provided to the ultimate customer (Behrenbeck, Thonemann and Merschmann, 2007).
Therefore, a supply chain includes a variety of individual organizations, each of
which contributes value to the commodity or product service. In definition, a supply chain
stops until the commodity hits the end buyer. The supply chain is characterized by its
links—companies and consumers—and by the multidirectional movements of goods,
resources, knowledge, and capital. If every connection in the chain is badly managed, the
whole chain is adversely affected. Thus, a smooth process and sophisticated supply chains
are critical to potential success in the global marketplace.
Figure 2.1. Supply Chain Process
Suppliers
Manufacturers
Distributors
Retailers
End Customers
34
2.2.2. Green supply chain management
Supply chain management (SCM) is associated with almost all activities of the
business: from planning and organizing the production process, purchasing, finished goods
from raw materials, managing logistics to coordination with partners, suppliers,
intermediaries, service providers and clients. In recent years, this word became popular and
a hot subject of analysis. Despite the emergence of several theories on SCM, almost some
authors define supply chain management as a system that covers activities of the business
from organizing raw materials to distributing to customers. According to study of
(Giunipero, 2008), SCM is the group that adds value from the initial raw materials to the
end customer along with the production process. In the early 1990s, research in SCM
focused on reducing transaction costs in purchaser/supplier interaction (Giunipero, 2008).
Thus, the authors agree that the SCM deals with absolute sales operation excellence,
representing a modern process of managing the business and its relationships with other
members of the supply chain.
Besides SCM, in the era of globalization and digital technology transformation,
Green Supply Chain Management (GSCM) has become a hot term because it is related to
the environment in which people are increasingly interested, especially businesses that tend
to develop sustainably. Moreover, consumers are demanding green products in today's
world because consumers are now more conscious regarding environmental issues (Zhang,
2019). And the eco-friendly concept has become a vital part of productivity. According to
(Achillas & Bochtis, 2018), GSCM includes planning, executing, monitoring, and
controlling the practice. The GSCM is a strategy that combines environmental concerns
with supply chain techniques to make a company more productive and environmentally
sustainable. That is the reason why a competitive edge and sector’s competitiveness
appears when a company has a good strategy in GSCM.
2.3. SUSTAINABLE SUPPLIER SELECTION
2.3.1. Sustainability Term and Misconceptions
In the globalized world, being under pressure from public awareness and the
political leaders and stakeholders, firms recognized greening and sustainability in Supply
Chain Management (SCM) operations is a way to thrive and reap the business benefits.
The “sustainable” terminology has become a topic of concern and research in business
areas such as manufacturing, health care, energy, etc. and also grown up a misconception
35
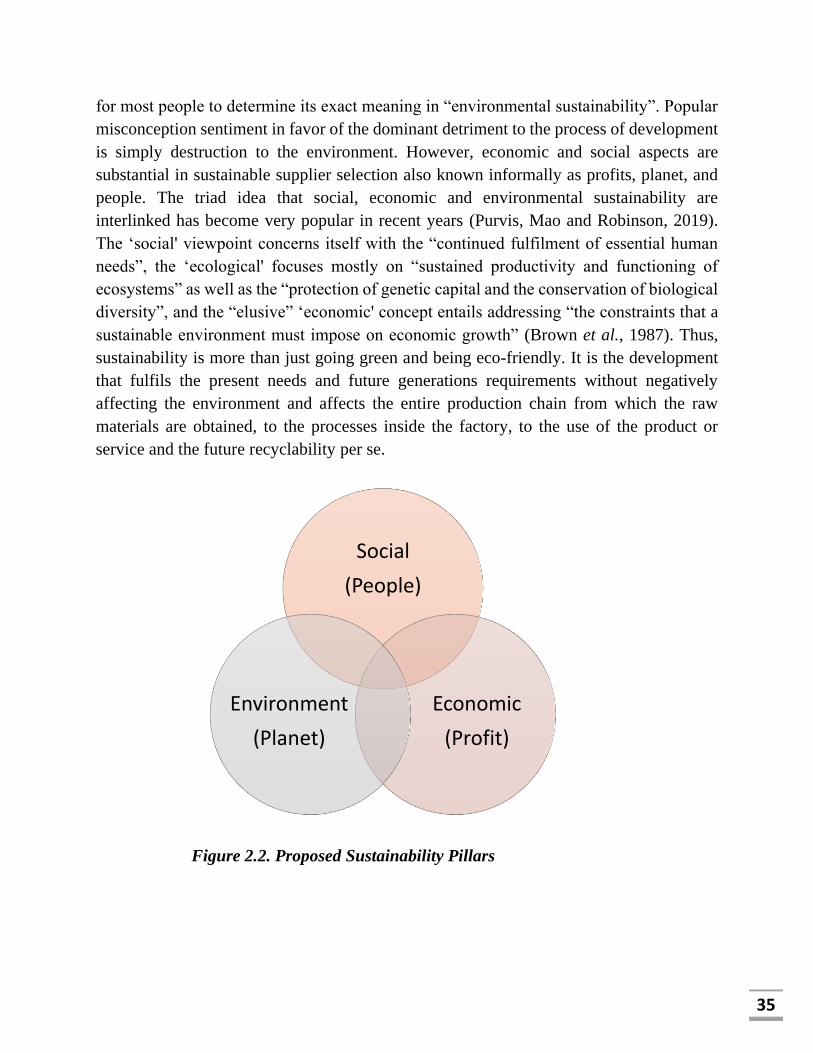
for most people to determine its exact meaning in “environmental sustainability”. Popular
misconception sentiment in favor of the dominant detriment to the process of development
is simply destruction to the environment. However, economic and social aspects are
substantial in sustainable supplier selection also known informally as profits, planet, and
people. The triad idea that social, economic and environmental sustainability are
interlinked has become very popular in recent years (Purvis, Mao and Robinson, 2019).
The ‘social' viewpoint concerns itself with the “continued fulfilment of essential human
needs”, the ‘ecological' focuses mostly on “sustained productivity and functioning of
ecosystems” as well as the “protection of genetic capital and the conservation of biological
diversity”, and the “elusive” ‘economic' concept entails addressing “the constraints that a
sustainable environment must impose on economic growth” (Brown et al., 1987). Thus,
sustainability is more than just going green and being eco-friendly. It is the development
that fulfils the present needs and future generations requirements without negatively
affecting the environment and affects the entire production chain from which the raw
materials are obtained, to the processes inside the factory, to the use of the product or
service and the future recyclability per se.
Figure 2.2. Proposed Sustainability Pillars
Social
(People)
Economic
(Profit)
Environment
(Planet)
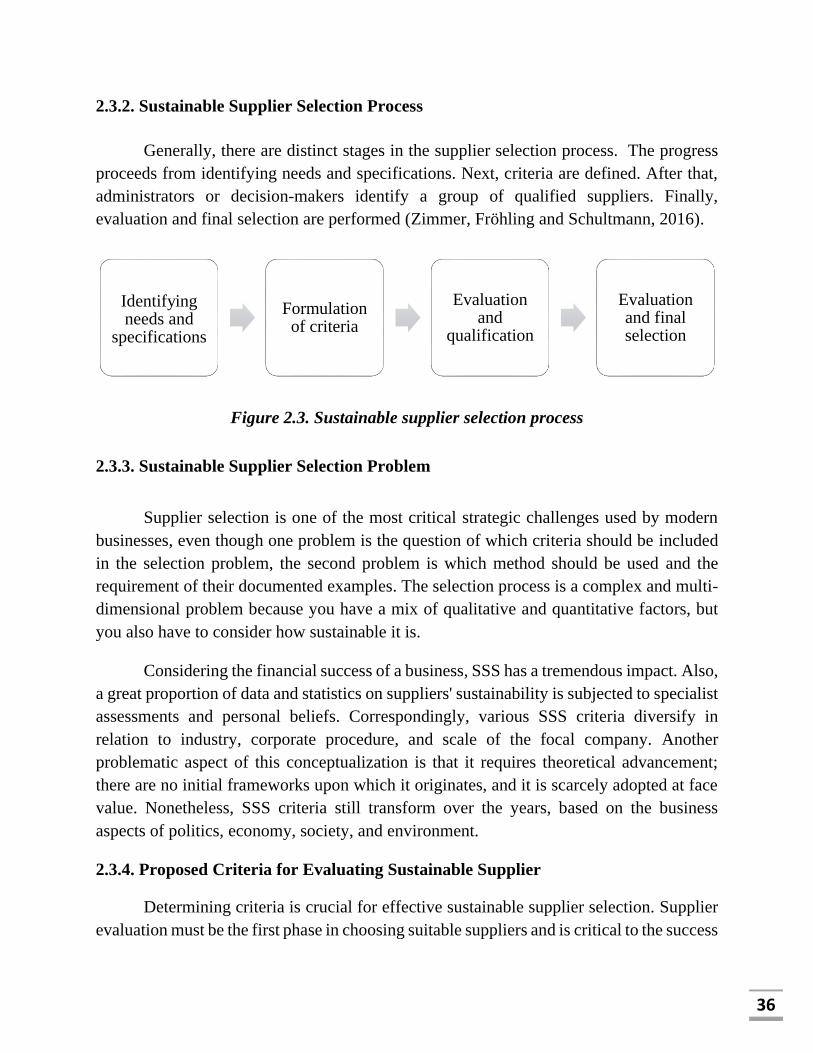
36
2.3.2. Sustainable Supplier Selection Process
Generally, there are distinct stages in the supplier selection process. The progress
proceeds from identifying needs and specifications. Next, criteria are defined. After that,
administrators or decision-makers identify a group of qualified suppliers. Finally,
evaluation and final selection are performed (Zimmer, Fröhling and Schultmann, 2016).
Figure 2.3. Sustainable supplier selection process
2.3.3. Sustainable Supplier Selection Problem
Supplier selection is one of the most critical strategic challenges used by modern
businesses, even though one problem is the question of which criteria should be included
in the selection problem, the second problem is which method should be used and the
requirement of their documented examples. The selection process is a complex and multi-
dimensional problem because you have a mix of qualitative and quantitative factors, but
you also have to consider how sustainable it is.
Considering the financial success of a business, SSS has a tremendous impact. Also,
a great proportion of data and statistics on suppliers' sustainability is subjected to specialist
assessments and personal beliefs. Correspondingly, various SSS criteria diversify in
relation to industry, corporate procedure, and scale of the focal company. Another
problematic aspect of this conceptualization is that it requires theoretical advancement;
there are no initial frameworks upon which it originates, and it is scarcely adopted at face
value. Nonetheless, SSS criteria still transform over the years, based on the business
aspects of politics, economy, society, and environment.
2.3.4. Proposed Criteria for Evaluating Sustainable Supplier
Determining criteria is crucial for effective sustainable supplier selection. Supplier
evaluation must be the first phase in choosing suitable suppliers and is critical to the success
Identifying needs and
specifications
Formulation of criteria
Evaluation and
qualification
Evaluation and final selection
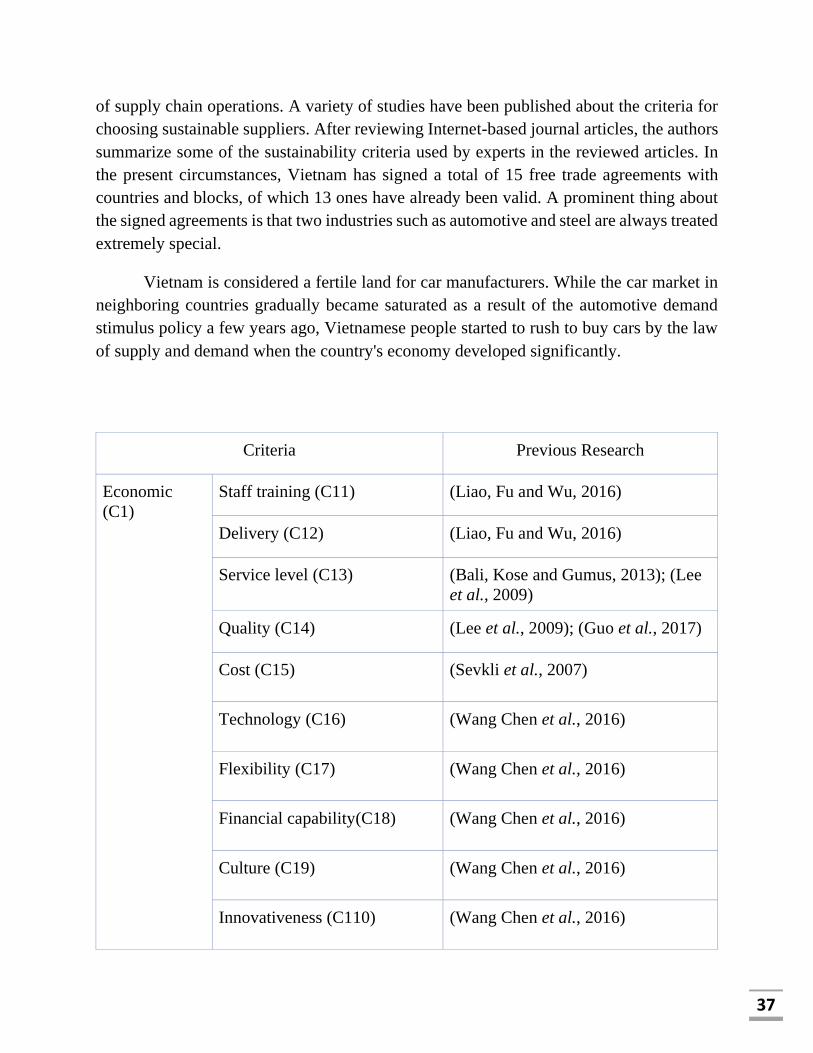
37
of supply chain operations. A variety of studies have been published about the criteria for
choosing sustainable suppliers. After reviewing Internet-based journal articles, the authors
summarize some of the sustainability criteria used by experts in the reviewed articles. In
the present circumstances, Vietnam has signed a total of 15 free trade agreements with
countries and blocks, of which 13 ones have already been valid. A prominent thing about
the signed agreements is that two industries such as automotive and steel are always treated
extremely special.
Vietnam is considered a fertile land for car manufacturers. While the car market in
neighboring countries gradually became saturated as a result of the automotive demand
stimulus policy a few years ago, Vietnamese people started to rush to buy cars by the law
of supply and demand when the country's economy developed significantly.
Criteria Previous Research
Economic
(C1)
Staff training (C11) (Liao, Fu and Wu, 2016)
Delivery (C12) (Liao, Fu and Wu, 2016)
Service level (C13) (Bali, Kose and Gumus, 2013); (Lee
et al., 2009)
Quality (C14) (Lee et al., 2009); (Guo et al., 2017)
Cost (C15) (Sevkli et al., 2007)
Technology (C16) (Wang Chen et al., 2016)
Flexibility (C17) (Wang Chen et al., 2016)
Financial capability(C18) (Wang Chen et al., 2016)
Culture (C19) (Wang Chen et al., 2016)
Innovativeness (C110) (Wang Chen et al., 2016)
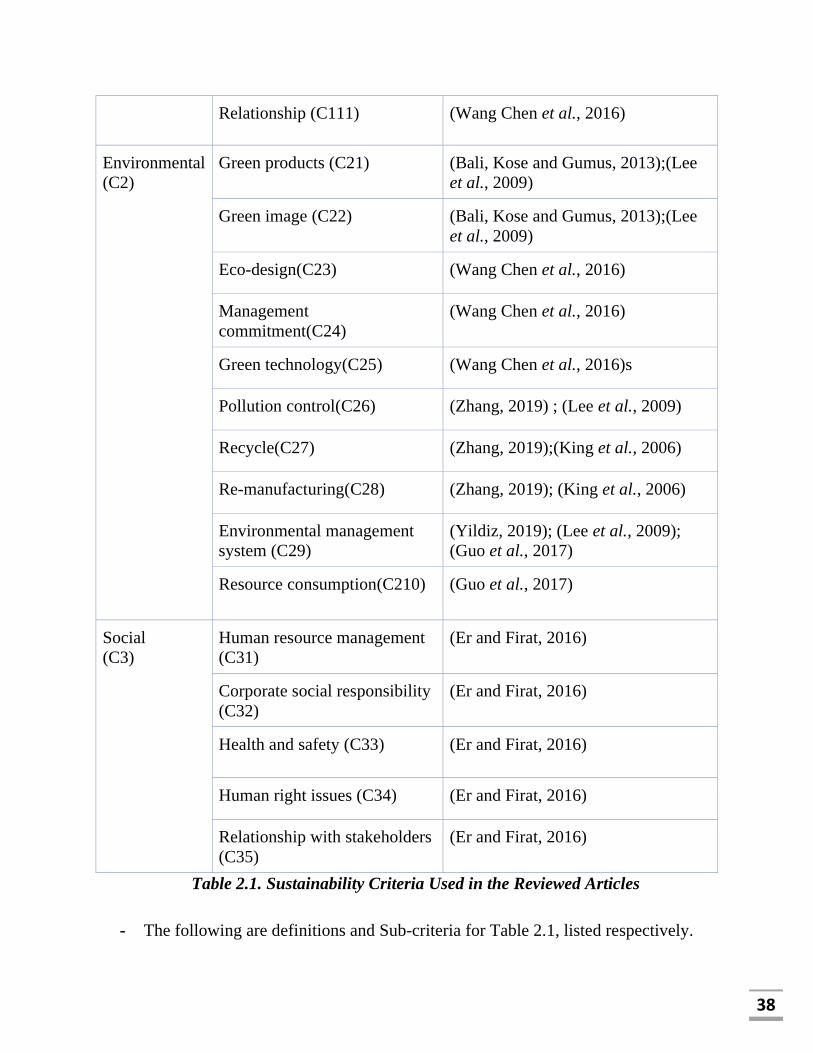
38
Relationship (C111) (Wang Chen et al., 2016)
Environmental
(C2)
Green products (C21) (Bali, Kose and Gumus, 2013);(Lee
et al., 2009)
Green image (C22) (Bali, Kose and Gumus, 2013);(Lee
et al., 2009)
Eco-design(C23) (Wang Chen et al., 2016)
Management
commitment(C24)
(Wang Chen et al., 2016)
Green technology(C25) (Wang Chen et al., 2016)s
Pollution control(C26) (Zhang, 2019) ; (Lee et al., 2009)
Recycle(C27) (Zhang, 2019);(King et al., 2006)
Re-manufacturing(C28) (Zhang, 2019); (King et al., 2006)
Environmental management
system (C29)
(Yildiz, 2019); (Lee et al., 2009);
(Guo et al., 2017)
Resource consumption(C210) (Guo et al., 2017)
Social
(C3)
Human resource management
(C31)
(Er and Firat, 2016)
Corporate social responsibility
(C32)
(Er and Firat, 2016)
Health and safety (C33) (Er and Firat, 2016)
Human right issues (C34) (Er and Firat, 2016)
Relationship with stakeholders
(C35)
(Er and Firat, 2016)
Table 2.1. Sustainability Criteria Used in the Reviewed Articles
- The following are definitions and Sub-criteria for Table 2.1, listed respectively.
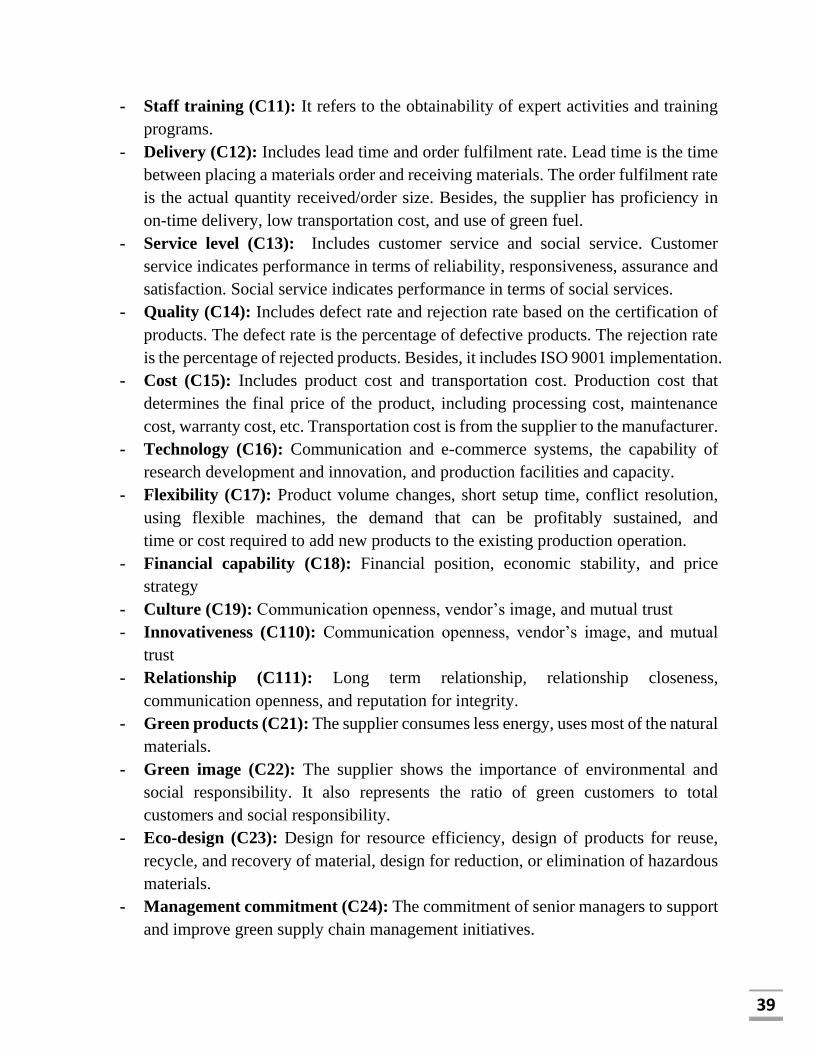
39
- Staff training (C11): It refers to the obtainability of expert activities and training
programs.
- Delivery (C12): Includes lead time and order fulfilment rate. Lead time is the time
between placing a materials order and receiving materials. The order fulfilment rate
is the actual quantity received/order size. Besides, the supplier has proficiency in
on-time delivery, low transportation cost, and use of green fuel.
- Service level (C13): Includes customer service and social service. Customer
service indicates performance in terms of reliability, responsiveness, assurance and
satisfaction. Social service indicates performance in terms of social services.
- Quality (C14): Includes defect rate and rejection rate based on the certification of
products. The defect rate is the percentage of defective products. The rejection rate
is the percentage of rejected products. Besides, it includes ISO 9001 implementation.
- Cost (C15): Includes product cost and transportation cost. Production cost that
determines the final price of the product, including processing cost, maintenance
cost, warranty cost, etc. Transportation cost is from the supplier to the manufacturer.
- Technology (C16): Communication and e-commerce systems, the capability of
research development and innovation, and production facilities and capacity.
- Flexibility (C17): Product volume changes, short setup time, conflict resolution,
using flexible machines, the demand that can be profitably sustained, and
time or cost required to add new products to the existing production operation.
- Financial capability (C18): Financial position, economic stability, and price
strategy
- Culture (C19): Communication openness, vendor’s image, and mutual trust
- Innovativeness (C110): Communication openness, vendor’s image, and mutual
trust
- Relationship (C111): Long term relationship, relationship closeness,
communication openness, and reputation for integrity.
- Green products (C21): The supplier consumes less energy, uses most of the natural
materials.
- Green image (C22): The supplier shows the importance of environmental and
social responsibility. It also represents the ratio of green customers to total
customers and social responsibility.
- Eco-design (C23): Design for resource efficiency, design of products for reuse,
recycle, and recovery of material, design for reduction, or elimination of hazardous
materials.
- Management commitment (C24): The commitment of senior managers to support
and improve green supply chain management initiatives.

40
- Green technology (C25): The application of environmental science to conserve the
natural environment and resources and to curb the negative impact of human
involvement.
- Pollution control (C26): Pollution is the unit volume of air emission pollutant,
wastewater, solid wastes and harmful materials releases. Thus, the suppliers need to
reduce air emissions, wastewater, solid wastes, and chemical wastes that are
generated in the production and transportation operations.
- Recycle (C27): Products can be remanufactured such that the second-life product
is made up to date to the market.
- Re-manufacturing (C28): The process used to recycle products.
- Environmental management system (C29): Environmental certificates such as
ISO 14000, continuous monitoring and regulatory compliance, environmental
policies, green process planning, and internal control process.
- Resource consumption (C210): Resource consumption in terms of suppliers using
up raw material, energy and water.
- Human resource management (C31): Effectiveness of discipline management,
Effectiveness of performance management system, Effectiveness of personnel
recruitment and selection, Average annual training time per employee, Annual
personnel turnover.
- Corporate and social responsibility (C32): Responsibility to the community,
Safe-guarding mechanism in CSR, Fraction of total sales invested for social projects
per year, Respect for the policy.
- Health and safety (C33): Occupational health and safety management systems,
Applications of work safety and labor health, Annual number of recordable
accidents per employee.
- Human right issues (C34): Underage labor, Long working hours, Feminist labor
issue, The interests and rights of employee, Effectiveness of compensation
management, Gender diversity.
- Relationship with stakeholders (C35): The rights of stakeholders, Organization's
openness to stakeholder involvement in decision making, relationship closeness and
attitudes, Degree of strategic cooperation.
2.4. APPROACHES FOR GREEN SUPPLIER SELECTION
2.4.1. MCDM Models
Because businesses have to change their processes in the management of a green
supply chain that is environmentally sustainable strives to respect green practices and

41
technology to establish sustainability, choosing the appropriate green supplier is a
complicated multi-dimensional challenge. Over the years, several (special) approaches for
decision-making have been adapted to solve similar issues. From the beginning of the
1970s up to now, a large range of MCDM approaches and their extensions have been
implemented. MCDM methods provide a possibility to evaluate these and other conflicting
factors and to decide which alternative is the most suitable according to different criteria”
(Siksnelyte-Butkiene, Zavadskas and Streimikiene, 2020). All of these MCDM approaches
can be used to address a broad range of complex problems from diverse fields of study.
The MCDM models allow practitioners and administrators to find the best green suppliers
from the hundreds of suppliers available in short periods of time and with minimal effort.
Figure 2.4. Conceptual framework for green supplier selection
However, green supplier selection may be viewed as an MCDM challenge, where a
small range of alternative suppliers is assessed against several contradictory quality
standards. As a result, to collect and assess data for this study without any bias and
prejudices, 2 MCDM models have been chosen. They are FAHP, and TOPSIS.
The AHP is one of the MCDM models used in this study. It is a mathematical-based
model that evaluates the validity of the decision-making and measurement methods. AHP
would be a good decision-making approach for deciding on complicated and multiple
parameters. “In this technique, rating alternatives and aggregating processes to find the
most relevant alternatives are integrated. The technique is employed for ranking a set of
alternatives or for the selection of the best in a set of alternatives. The ranking/selection is
done with respect to an overall goal, which is broken down into a set of criteria”
Knowledge
base
Data aggregation and
model exploitation
Gre
en
su
pp
lier
se
lection
pro
ble
m
Gre
en
su
pp
liers
ran
kin
g
Structuring
process
Set of suppliers
Set of criteria
42
(Ramanathan, 2004). This method includes determining the significance of criteria that
would be associated with the ultimate target. The figures are determined by evaluating each
criterion pairwise. FAHP is AHP under a fuzzy environment.
The Technique for Order Preference by Similarity to the Ideal Solution (TOPSIS)
is another model being used. It was developed by Hwang and Yoon (1981) and is the
second most widely used and popular MCDM method after AHP (Çelikbilek and Tüysüz,
2020). “ TOPSIS simplifies the decision matrix by applying vector normalization
computing the weighted normalized decision matrix, determining the positive ideal
solution (PIS) and negative ideal solution (NIS), calculating the separation or distance by
using the n-dimensional Euclidean of each alternative from PIS and NIS, determining the
relative closeness of each alternative to PIS by calculating the ranking index and finally
ranking the preference order ” (Çelikbilek and Tüysüz, 2020).
Many publications on selecting green suppliers and reviewing them have been
released in recent years. However, supplier selection is a challenge in MCDM since there
can be contradictions between qualitative and quantitative criteria. This study suggested a
fuzzy MCDM model, which can evaluate the criteria of different suppliers or malfunction
causes and choose the best supplier. The “fuzzy” concept will be defined in the next
section.
2.4.2 Fuzzy Concepts
The magnitude of individuals' expectations for particular circumstances can be
unclear, subjective and ambiguous. Simply put, if the humans' fuzziness and uncertainty
making the choices are not taken into account, the consequences can be deceptive. In
choosing which supplier to work with, it is understood that choices affect several
individuals joining the decision-making phase (including executives, staff, and specialists).
Making more participants involved enables the selection process to be more
rationale is that the group's view (prejudice) is not carrying much force. For the system to
conclude a realistic final decision, it must reflect human thinking. In making decisions,
decision-makers are more comfortable evaluate criteria for a certain degree of tolerance in
some cases than they are deciding on a set value. As a result, one system was implemented
which suggests a human-like thinking style, known as fuzzy logic.
2.4.3. Advantages and Disadvantages of MCDM Models
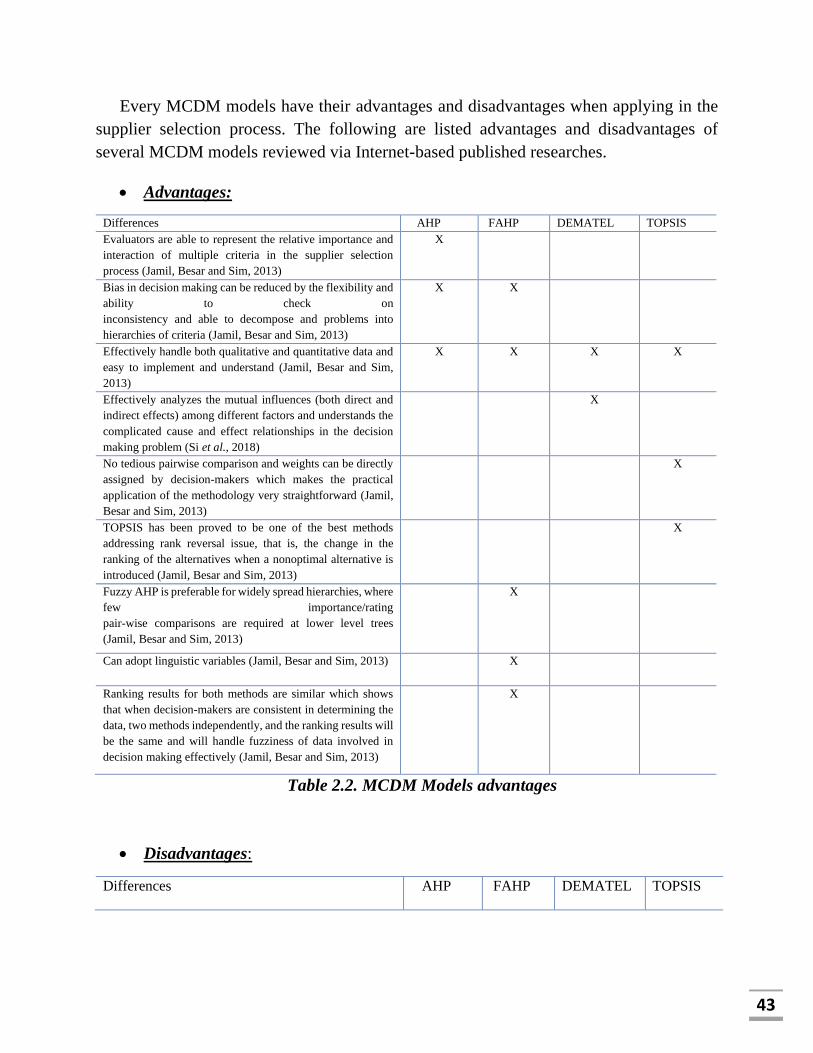
43
Every MCDM models have their advantages and disadvantages when applying in the
supplier selection process. The following are listed advantages and disadvantages of
several MCDM models reviewed via Internet-based published researches.
• Advantages:
Differences AHP FAHP DEMATEL TOPSIS
Evaluators are able to represent the relative importance and
interaction of multiple criteria in the supplier selection
process (Jamil, Besar and Sim, 2013)
X
Bias in decision making can be reduced by the flexibility and
ability to check on
inconsistency and able to decompose and problems into
hierarchies of criteria (Jamil, Besar and Sim, 2013)
X X
Effectively handle both qualitative and quantitative data and
easy to implement and understand (Jamil, Besar and Sim,
2013)
X X X X
Effectively analyzes the mutual influences (both direct and
indirect effects) among different factors and understands the
complicated cause and effect relationships in the decision
making problem (Si et al., 2018)
X
No tedious pairwise comparison and weights can be directly
assigned by decision-makers which makes the practical
application of the methodology very straightforward (Jamil,
Besar and Sim, 2013)
X
TOPSIS has been proved to be one of the best methods
addressing rank reversal issue, that is, the change in the
ranking of the alternatives when a nonoptimal alternative is
introduced (Jamil, Besar and Sim, 2013)
X
Fuzzy AHP is preferable for widely spread hierarchies, where
few importance/rating
pair-wise comparisons are required at lower level trees
(Jamil, Besar and Sim, 2013)
X
Can adopt linguistic variables (Jamil, Besar and Sim, 2013) X
Ranking results for both methods are similar which shows
that when decision-makers are consistent in determining the
data, two methods independently, and the ranking results will
be the same and will handle fuzziness of data involved in
decision making effectively (Jamil, Besar and Sim, 2013)
X
Table 2.2. MCDM Models advantages
• Disadvantages:
Differences AHP FAHP DEMATEL TOPSIS

44
When a problem is decomposed into subsystems,
the decision problem might become very large and
lengthy (Jamil, Besar and Sim, 2013)
X
AHP’s using crisp number, hence not able to
reflect human thinking style (Jamil, Besar and
Sim, 2013)
X
When the number of alternatives and criteria
increased, pair-wise comparison becomes
cumbersome and the risk of inconsistencies grows
(Jamil, Besar and Sim, 2013)
X
Determines the ranking of alternatives based on
interdependent relationships among them, but
other criteria are not incorporated in the decision
making problem (Si et al., 2018)
X
The relative weights of experts are not considered
in aggregating personal judgments of experts into
group assessments (Si et al., 2018)
Problem is not decomposed into hierarchy hence
decision-maker might encounter difficulty to
simplify the problem which makes the practical
application of the methodology very
straightforward (Jamil, Besar and Sim, 2013)
X
Does not take into account the uncertainty
associated with the mapping of one’s judgment to
a number (Jamil, Besar and Sim, 2013)
X
FAHP requires more complex computations than
FTOPSIS which includes a pairwise comparison
(Jamil, Besar and Sim, 2013)
X
In the extended analysis of FAHP, the priority
weights of criterion or alternative can be equal to
zero (Jamil, Besar and Sim, 2013)
X
Table 2.3. MCDM Models disadvantages
It can be seen from the table that their greatest constraint is that the materials from
which they are attempting to produce solutions or selection algorithms are mostly meant to
be tradeoffs for various goals, rather than one that is the optimum solution to the dilemma.
Whilst the main advantage is their ability to specifically analyze how differing
consequences can accumulate in the same decision phase.

45
2.5. RESEARCH GAP
A variety of research projects have been undertaken about the selection of suppliers
through the use of information and communication technologies. These classical methods
are commonly applied to sustainable supplier recognition and selection issues. To our
understanding, there is a lack of a general approach that understands how one might be
helpful to supplier selection, which can provide an organisation with several approaches,
and which can simultaneously collect information.
Nevertheless, we have found that there are applications of the MCDM model
approach that has been used in a wide range of areas in results in many countries. For
further information about Supplier Selection in the Automotive Industry" (Jamil, Besar and
Sim, 2013) looked at the efficiency of multicriteria decision-making in the automotive
manufacturing company with MCDM tools aimed at selecting suppliers in Malaysia; in
other study of or the article “ A green supplier selection model for the high-tech industry”
(Lee et al., 2009) studied solution and evaluation to select the most suitable green supplier
for the company; in the study: “Fuzzy Hybrid MCDM Model for Ranking the Agricultural
Water Demand Management Strategies in Arid Areas” authors proposal MCDM model to
solute water scarcity (Banihabib et al, 2016).
However, to our knowledge we have been not found out any of Vietnam’s scholar
research on the application of MCDM to green supplier selection in the automotive industry
since our team has opted to use the MCDM tools to analyze multicriteria. The articles or
studies we have read overlooked the analysis of the critical success of a business. That
analysis concentrating on the use of models and the evaluation of their effects. Therefore,
more comprehensive research is required to explore the importance of factors for the
development of a corporate in the selection of sustainable suppliers. Our study will analyze
some of the criteria in the VinFast case based on an integrating MCDM models of FAHP
and FTOPSIS.
Even if this study might have some shortcomings, there needs to be further study
and research that overcomes these limitations. The authors of this thesis proposed that
future studies are critical to establishing metrics that were not only appropriate and
comparable but would also investigate how to manage sensitive data.
2.6. CONCLUSION

46
Many theories have been proposed to explain what SCM, GSCM and sustainability
supplier selection is. Sustainability is a rising issue for both focal businesses and their
suppliers. And green supplier selection is essential for companies to retain their economic
power. This study will examine the MCDM methods in a novel manner under the analysis
of VinFast. Although the literature covers a wide variety of such theories, we will focus on
selecting green suppliers based on integrated approaches that are mentioned throughout the
study. After reviewing the literature, we clarified the important aspects of our topic by
integrating early theories and viewpoints. In conclusion, this chapter provides solutions
and an effective structure for decision-making when using methods listed in this study.

47
CHAPTER 3: METHODOLOGY This chapter provides a better understanding of the methodology in this study, plus
the rationale for why it was chosen.
3.1. INTRODUCTION
3.1.1 Research philosophy
Research philosophy deals with the source, nature and development of knowledge
(Mark, 2009). A philosophy is composed of beliefs on the approaches to gather, analyse,
and utilise data about a phenomenon. There are four major philosophies in business and
management and listed below.
Realism, in philosophy, the viewpoint which accords to things that are known or perceived
an existence or nature which is independent of whether anyone is thinking about or
perceiving them based on a personal viewpoint.
Interpretivism determines the degree of interest one has in the research. Recognizing the
gap between people is the premise of this approach.
Positivism is dependent on statistical analysis based on quantifiable observations.
Pragmatism deals with similar concepts that facilitate actual actions. This is a study
approach, through which understanding why issues arise and attempt to differentiate them.
In the area of pragmatics, different kinds of analysis may be performed at the same time.
3.1.2. Research approaches
There are three types of research approaches including inductive, deductive, and
abductive.
Inductive is data collected and theory developed from the data analysis. In inductive
inference, known premises are used to generate untested hypotheses that of generalizability
is from specific to general. Data collection is used to explore a phenomenon, identify
themes and patterns, and create a conceptual framework. The theory in this research
approach is theory generation and building (Saunders, 2009).
Pattern Theory Observations/Tests
Inductive process in research approach

48
Deductive reasoning is generalizing from the general to the specific. The reasoning always
starts with a theory and leads to a new hypothesis. Then, narrow down the results after
collection to check the hypothesis. In order to reach a conclusion, it uses facts, laws,
descriptions, or objects. In deductive inference, when the premises are correct, the
conclusion must also be correct. Data collection is used to evaluate propositions or
hypotheses related to an existing theory (Saunders, 2009).
Deductive process in research approach
Abductive is combined of inductive and deductive. is a combination of inductive and
deductive. In an abductive inference, known premises are used to generate testable
conclusions that of generalizability is from the interactions between the specific and the
general. Data collection is used to explore a phenomenon, identify themes and patterns,
locate these in a conceptual framework, and test this through following data collection and
so forth. The theory in this research approach is theory generation or modification,
incorporating existing theory where appropriate to build a new theory or modify the
existing theory (Saunders, 2009).
This research is conducted by the inductive method. In certain instances, hypotheses
are relatively straightforward since the process starts with findings that serve as proof of
regularities, and then, if proven, the pattern is detected; in some situations, it is hard since
there is little as a shred of prior evidence, and the assumptions proceed. This is the most
suitable way to assess businesses.
3.1.3. Research methods
There are two main types to collect data: qualitative and quantitative. For
discriminating between the two types of data, it is essential to use numerical (numbers)
data or not numeric (words) data.
Theory Hypothesis Observation/
Test
Confirmation
/Rejection

49
Quantitative research is characterized by the results shown in the form of statistics and
graphs. When conducting this kind of study, broad generalizable facts on the subject is
established. These three techniques are the most often used in research: experiments,
observations recorded as numbers, and surveys with closed-ended questions.
Qualitative research is expressed in words. It is used to understand concepts, thoughts or
experiences. This type of research enables gathering in-depth insights on topics that are not
well understood. Common methods include interviews with open-ended questions,
observations described in words, and literature reviews that explore concepts and theories.
This research used quantitative and qualitative data to improve the strengths of one
particular type of data and balance the limitations of its drawback.
3.2. DATA SOURCE (Primary/Secondary)
The collecting of data is a method for collecting and evaluating information on
variables of interest in a systematically defined way that helps one answer questions, test
hypotheses, and analyze findings (Kabir, 2016). Data collection is one of the most
important stages in conducting research. The project could not be accomplished without
the data collection. Numerous data collections required are hard work, patience, and clear
problems. This job begins with deciding what kind of data are needed and a sample of a
certain population is chosen. Then, authors have to use a certain tool to extract the data
from the sample chosen.
Primary data is data originated first hand by the researcher through experiments,
surveys, questionnaires, personal interviews, and etc. Then, data controlled by the
supervisor to answer specific questions. Primary data sources are time-consuming even
with a low response rate because of a shortage of societies or poor coordination. But it is
useful for current studies as greater control and can identify the tools that will be used.
These are several of the basic data sources: experiments, interviews, tests, questionnaires,
observations (Kabir, 2016).
Secondary data that is already available and has been collected by someone else
for a purpose other. It is usually in a different context because that is being reused.
Secondary data has been collected are low cost or free, time- saving, anyone can access the
data. However, it is not specific to needs and not timely. Secondary data sets analysis also
enabled development scientists to effectively address important and often challenging
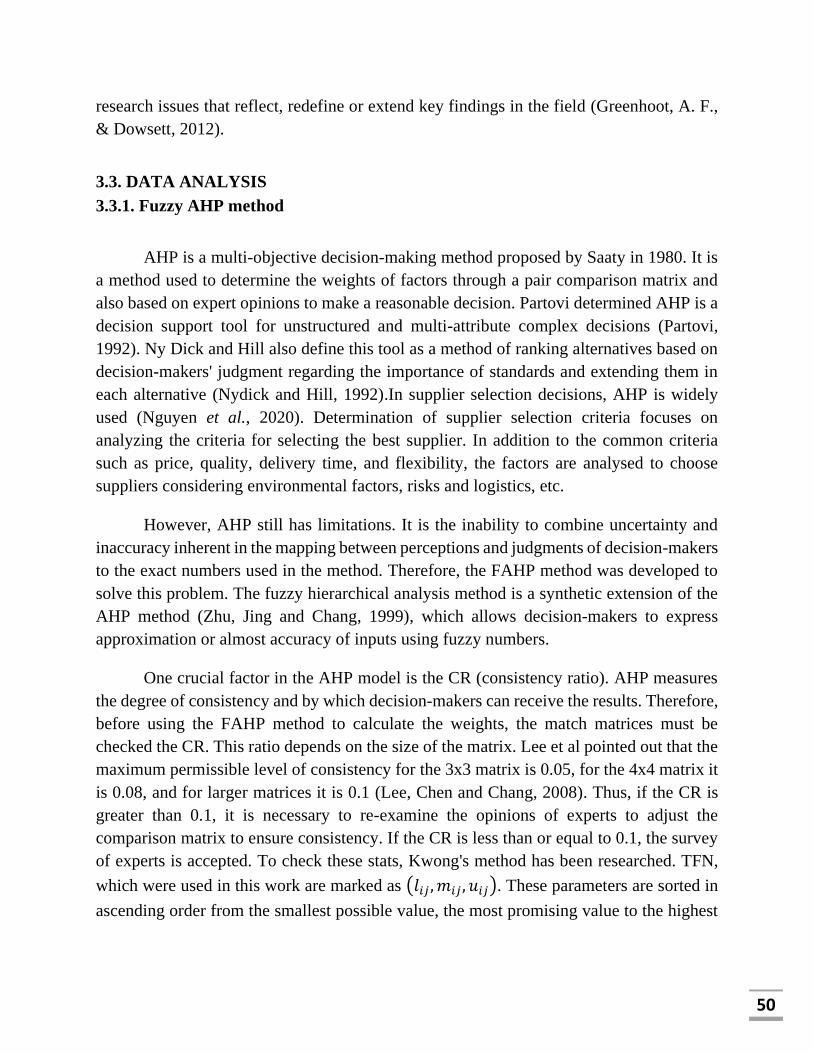
50
research issues that reflect, redefine or extend key findings in the field (Greenhoot, A. F.,
& Dowsett, 2012).
3.3. DATA ANALYSIS
3.3.1. Fuzzy AHP method
AHP is a multi-objective decision-making method proposed by Saaty in 1980. It is
a method used to determine the weights of factors through a pair comparison matrix and
also based on expert opinions to make a reasonable decision. Partovi determined AHP is a
decision support tool for unstructured and multi-attribute complex decisions (Partovi,
1992). Ny Dick and Hill also define this tool as a method of ranking alternatives based on
decision-makers' judgment regarding the importance of standards and extending them in
each alternative (Nydick and Hill, 1992).In supplier selection decisions, AHP is widely
used (Nguyen et al., 2020). Determination of supplier selection criteria focuses on
analyzing the criteria for selecting the best supplier. In addition to the common criteria
such as price, quality, delivery time, and flexibility, the factors are analysed to choose
suppliers considering environmental factors, risks and logistics, etc.
However, AHP still has limitations. It is the inability to combine uncertainty and
inaccuracy inherent in the mapping between perceptions and judgments of decision-makers
to the exact numbers used in the method. Therefore, the FAHP method was developed to
solve this problem. The fuzzy hierarchical analysis method is a synthetic extension of the
AHP method (Zhu, Jing and Chang, 1999), which allows decision-makers to express
approximation or almost accuracy of inputs using fuzzy numbers.
One crucial factor in the AHP model is the CR (consistency ratio). AHP measures
the degree of consistency and by which decision-makers can receive the results. Therefore,
before using the FAHP method to calculate the weights, the match matrices must be
checked the CR. This ratio depends on the size of the matrix. Lee et al pointed out that the
maximum permissible level of consistency for the 3x3 matrix is 0.05, for the 4x4 matrix it
is 0.08, and for larger matrices it is 0.1 (Lee, Chen and Chang, 2008). Thus, if the CR is
greater than 0.1, it is necessary to re-examine the opinions of experts to adjust the
comparison matrix to ensure consistency. If the CR is less than or equal to 0.1, the survey
of experts is accepted. To check these stats, Kwong's method has been researched. TFN,
which were used in this work are marked as (𝑙𝑖𝑗 , 𝑚𝑖𝑗 , 𝑢𝑖𝑗). These parameters are sorted in
ascending order from the smallest possible value, the most promising value to the highest

51
possible one that describes a fuzzy event. A TFN, denoted as 𝑀= (𝑙,𝑚,𝑢), can be
defuzzified to a crisp number as follows
𝑀−𝑐𝑟𝑖𝑠𝑝 =(4m + l + u)
6
(1)
The extent analysis method by Chang in 1996 has been applied in this study to
benefit from processing qualitative and quantitative data and comprehensibility and
applicability. We also prioritize implementing the fuzzy AHP method due to the existing
limitation of the AHP method mentioned above. The steps used for the Chang method are
as follows:
Let assume that 𝑋 = {𝑥1, 𝑥2, … , 𝑥𝑚} is a set of objects, and 𝑈 = {𝑢1, 𝑢2, … , 𝑢𝑚} is
a set of goals. Chang's method defined that an extended goal analysis is made for each
object. Value of the extended analysis "m" for each object can be expressed by Eq. (2):
𝑀𝑔𝑖1 , 𝑀𝑔𝑖
2 , …𝑀𝑔𝑖𝑚 (𝑖 = 1, 2, …𝑛) (2)
Where 𝑀𝑔,𝑗 𝑗 = 1, 2, …𝑚., are fuzzy triangular numbers.
STEP 1: The value of the fuzzy synthetic extent with respect to the 𝑖𝑡ℎ object is defined as
in Eq. (3), (4), (5), (6):
Si = ∑ 𝑀𝑔𝑖𝑗
𝑚
𝑗=1 × [∑ ∑ 𝑀𝑔𝑖
𝑗𝑚𝑗=1
𝑛𝑖=1 ]
−1
(3)
With
∑ 𝑀𝑔𝑖𝑗𝑚
𝑗=1 = (∑ 𝑙𝑗𝑚𝑗=1 , ∑ 𝑚𝑗
𝑚𝑗=1 , ∑ 𝑢𝑗
𝑚𝑗=1 ) (4)
∑ ∑ 𝑀𝑔𝑖𝑗𝑚
𝑗=1𝑛𝑖=1 = (∑ 𝑙𝑖
𝑛𝑖=1 , ∑ 𝑚𝑖
𝑛𝑖=1 , ∑ 𝑢𝑖
𝑛𝑖=1 )
(5)
Then

52
[∑∑𝑀𝑔𝑖𝑗
𝑚
𝑗=1
𝑛
𝑖=1
]
−1
= (1
∑ 𝑢𝑖𝑛𝑖=1
,1
∑ 𝑚𝑖𝑛𝑖=1
,1
∑ 𝑙𝑖𝑛𝑖=1
)
(6)
STEP 2: The values of Si are compared and the degree of possibility of 𝑆𝑗 =
(𝑙𝑗 ,𝑚𝑗 , 𝑢𝑗) ≥ 𝑆𝑖(𝑙𝑖 ,𝑚𝑖 , 𝑢𝑖)is calculated as in Eq. (7):
𝑉(𝑆𝑗 ≥ 𝑆𝑖) =
{
1, 𝑖𝑓 𝑚𝑗 ≥ 𝑚𝑖
0, 𝑖𝑓 𝑙𝑖 ≥ 𝑢𝑗𝑙𝑖 − 𝑢𝑗
(𝑚𝑗 − 𝑢𝑗) − (𝑚𝑖 − 𝑙𝑖) , 𝑜𝑡ℎ𝑒𝑟𝑤𝑖𝑠𝑒,
(7)
Figure below indicates 𝑉(𝑆𝑗 ≥ 𝑆𝑖) for the case 𝑚𝑗 < 𝑙𝑖 < 𝑢𝑗 < 𝑚𝑖 and “d” is the abscissa
value of the highest intersection point between 𝑆𝑗 and 𝑆𝑖
With the aim of comparison 𝑆𝑗 and 𝑆𝑖, value 𝑉(𝑆𝑗 ≥ 𝑆𝑖) and 𝑉(𝑆𝑖 ≥ 𝑆𝑗) are both required.
𝑆𝑖 𝑆𝑗
1
𝑉(𝑆𝑗 ≥ 𝑆𝑖)
0 𝑢𝑖 𝑚𝑖 𝑢𝑗 𝑚𝑗 𝑑 𝑙𝑖 𝑙𝑗
Intersection between 𝑆𝑗 and 𝑆𝑖

53
Step 3: The minimum degree of possibility 𝑑(𝑖) of 𝑉(𝑆𝑗 ≥ 𝑆𝑖) for 𝑖, 𝑗 = 1, 2, … , 𝑘 can be
calculated as in Eq. (8):
𝑉(𝑆 ≥ 𝑆1, 𝑆2, 𝑆3, … , 𝑆𝑘) = 𝑉 [(𝑆 ≥ 𝑆1) 𝑎𝑛𝑑 (𝑆 ≥ 𝑆2) 𝑎𝑛𝑑 … (𝑆 ≥ 𝑆𝑘)]
= min 𝑉(𝑆 ≥ 𝑆𝑖) = 𝑊′(𝑆𝑖)
(8)
Assume that
𝑑′(𝐴𝑖) = min 𝑉(𝑆 ≥ 𝑆𝑖), for 𝑖 = 1, 2, … , 𝑘 ; 𝑖 ≠ 𝑘
The weight vector is computed by Eq. (9)
𝑊′ = (𝑑′(𝐴1), 𝑑′(𝐴2), …𝑑′ (𝐴𝑛))𝑇 (9)
where 𝐴𝑖(𝑖 = 1, 2, 3, … , 𝑛) contains the set of n elements.
Step 4: Normalization reduces the weight vector by Eq. (10)
𝑊 = (𝑑′(𝐴1), 𝑑′(𝐴2), …𝑑′ (𝐴𝑛))𝑇 = (𝑊1,𝑊2, … ,𝑊𝑛)
𝑇 (10)
where W is a non-fuzzy number.
3.3.2. Fuzzy TOPSIS method
The Technique for Order Preference by Similarity to Ideal Situation (TOPSIS) was
introduced by Hwang & Yoon in 1981. The TOPSIS principle relates to the following idea:
An option is the best if it is closest to Positive Ideal Solution (PIS) and farthest from the
Negative Ideal Solution (NIS). Wang (2007) stated that the PIS includes all the best
possible values of the evaluation criteria, the NIS consists of all the worst possible values.
In the classical TOPSIS model, real numbers were used to evaluate the weight of criteria
and rank the criteria. However, the use of real numbers in an unstable environment will
cause difficulties for assessors. Therefore, the TOPSIS model incorporating fuzzy numbers
was proposed to be used to overcome uncertainty and inaccuracy in the assessment. Wang
et al concluded that using Fuzzy-TOPSIS evaluates efficiency in an uncertain environment
and allows accurate assessment of multiple criteria at the same time.
TOPSIS method is conducted according to the following steps:
Step 1: Determine the weighting of evaluation criteria. This research employs fuzzy AHP
to find the fuzzy preference weights.
Step 2: Construct the fuzzy performance/decision matrix and choose the appropriate
linguistic variables for the alternatives with respect to criteria (Eq. (11)):
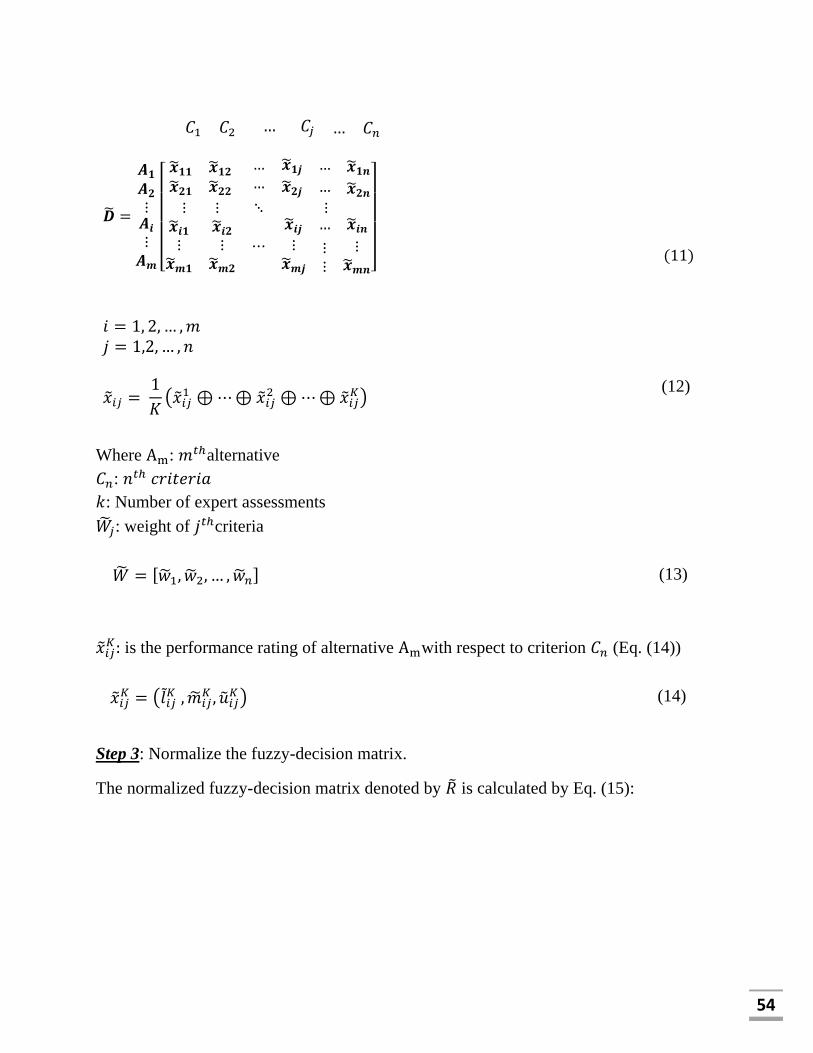
54
𝐶1 𝐶2 … 𝐶𝑗 … 𝐶𝑛
�̃� =
𝑨𝟏𝑨𝟐⋮𝑨𝒊⋮𝑨𝒎 [
�̃�𝟏𝟏 𝒙𝟏𝟐�̃�𝟐𝟏 𝒙𝟐𝟐
……
�̃�𝟏𝒋 … �̃�𝟏𝒏�̃�𝟐𝒋 … �̃�𝟐𝒏
⋮ ⋮ ⋱ ⋮�̃�𝒊𝟏⋮
�̃�𝒎𝟏
�̃�𝒊𝟐⋮
𝒙𝒎𝟐
⋯
�̃�𝒊𝒋 … �̃�𝒊𝒏⋮�̃�𝒎𝒋
⋮⋮
⋮�̃�𝒎𝒏]
(11)
𝑖 = 1, 2, … ,𝑚
𝑗 = 1,2, … , 𝑛
�̃�𝑖𝑗 = 1
𝐾(�̃�𝑖𝑗
1 ⊕⋯⊕ �̃�𝑖𝑗2 ⊕⋯⊕ �̃�𝑖𝑗
𝐾) (12)
Where Am: 𝑚𝑡ℎalternative
𝐶𝑛: 𝑛𝑡ℎ 𝑐𝑟𝑖𝑡𝑒𝑟𝑖𝑎
𝑘: Number of expert assessments
�̃�𝑗: weight of 𝑗𝑡ℎcriteria
�̃� = [�̃�1, �̃�2, … , �̃�𝑛] (13)
�̃�𝑖𝑗𝐾: is the performance rating of alternative Amwith respect to criterion 𝐶𝑛 (Eq. (14))
�̃�𝑖𝑗𝐾 = (𝑙𝑖𝑗
𝐾 , �̃�𝑖𝑗𝐾 , �̃�𝑖𝑗
𝐾) (14)
Step 3: Normalize the fuzzy-decision matrix.
The normalized fuzzy-decision matrix denoted by �̃� is calculated by Eq. (15):

55
�̃� = [�̃�ⅈ𝑗]𝑚×𝑛,
𝑖 = 1, 2, … ,𝑚
𝑗 = 1,2, … , 𝑛
(15)
Then, the normalization process can be performed by Eq. (16):
�̃�𝑖𝑗 = (𝑙𝑖𝑗
𝑢𝑗+ ,
𝑚𝑖𝑗
𝑢𝑗+ ,
𝑢𝑖𝑗
𝑢𝑗+) ,
𝑢𝑗+ = 𝑚𝑎𝑥𝑖{𝑢𝑖𝑗|𝑖 = 1, 2, … ,𝑚}
(16)
OR the best aspired level 𝑢𝑗+and 𝑖 = 1, 2, … ,𝑚 can be set to be equal one, otherwise
the worst one is zero.
The normalized �̃�𝑖𝑗 is still triangular fuzzy numbers. For trapezoidal fuzzy numbers,
the normalization process can be conducted in the same way.
The weighted fuzzy normalized decision matrix is calculated by matrix �̃� in Eq.
(17):
�̃� = [�̃�ⅈ𝑗]𝑚×𝑛,
𝑖 = 1, 2, … ,𝑚
𝑗 = 1,2, … , 𝑛
(17)
Step 4: Determine the fuzzy positive-ideal solution (FPIS) and fuzzy negative-ideal
solution (FNIS)
According to the weighted normalized fuzzy-decision matrix, we know that the
elements �̃�𝑖𝑗 are normalized positive TFN and their ranges belong to the closed interval
[0,1]. Then the two solution FPIS (𝐴∗) and FNIS (𝐴−) sets are determined by Eq.
(18),(19):
Where �̃�𝑖𝑗 = �̃�𝑖𝑗⊕ �̃�𝑗

56
𝐴∗ = (�̃�1∗, �̃�2
∗, … , �̃�𝑗∗, … , �̃�𝑛
∗) (18)
𝐴− = (�̃�1−, �̃�2
−, … , �̃�𝑗−, … , �̃�𝑛
−) (19)
Where �̃�𝑗∗ = (1, 1, 1) ⊕ �̃�𝑗 = (𝑙𝑤𝑗, 𝑚𝑤𝑗 , 𝑢𝑤𝑗) and �̃�𝑗
− = (0, 0, 0); 𝑗 = 1,2, … , 𝑛
Step 5: Calculate the distance of each alternative from FPIS and FNIS by Eq. (20), (21):
�̃�𝑖+ = ∑ 𝐷(�̃�𝑖𝑗
𝑛𝑗=1 , �̃�𝑗
+), 𝑖 = 1, 2, … ,𝑚 (20)
�̃�𝑖− = ∑ 𝐷(�̃�ⅈ𝑗
𝑛𝑗=1 , �̃�𝑗
−), 𝑗 = 1,2, … , 𝑛 (21)
Step 6: Closeness coefficient measured by using Eq. (22)
𝐶𝐶𝑖 =�̃�𝑖−
�̃�𝑖++�̃�𝑖
− = 1 − �̃�𝑖+
�̃�𝑖++�̃�𝑖
− ,
𝑖 = 1, 2, … ,𝑚
(22)
Where, �̃�𝑖−
�̃�𝑖++�̃�𝑖
− is fuzzy satisfaction degree in 𝑖𝑡ℎ alternative and �̃�𝑖+
�̃�𝑖++�̃�𝑖
− is fuzzy gap
degree in 𝑖𝑡ℎ alternative

57
CHAPTER 4: EMPIRICAL CASE ANALYSES OF VINFAST
4.1. Case study
In this paper, a comprehensive green supplier selection model that includes the
critical economic, social and environmental dimensions for evaluating green suppliers is
proposed. To find the solution in the process of selecting green supplier, the proposed
approach is extended to the case of VinFast automobile manufacturing company in the
Vietnamese automotive industry.
VinFast focuses on launching innovative and environmental-friendly products.
VinFast, on the other hand, is now struggling with increased rivalry. Consequently, to
retain customer loyalty, VinFast is therefore highly essential in selecting reliable green
suppliers for the long-term cooperation in way to garner new international customers and
expand their market share.
When VinFast stated theirs position and approach as a green supplier, they must
assess its core competences and recognize the difference in consumer requirements.
VinFast has simultaneously used the GSCM to examine environmental, social and
economic aspects to satisfy consumer requirements and regulations. In addition, VinFast
has invested proactively with quality control system and the climate system including
ISO9001 and ISO14001.
As a key provider of automotive SC, VinFast has acquired and gained a variety of
GSCM domain expertise and skills through a two-stage process of automotive components
and accessories consistency verification and aggregation of all components into one
product for each consumer. As a result, VinFast asks its suppliers to comply with their
customers' environmental, social and economic demands. VinFast's managers and heads of
divisions have agreed that commodity price, ISO quality scheme, and lead time are
economic requirements, based on the agreement of a multidisciplinary body of policy
makers from diverse points of view and reflecting the company's various services. Besides,
environmental standards include green technology and environmental certification.
Managers from various divisions, including Employee Health and Safety, Production,
Quality Control and Assessment, and Purchasing, were required to make their assessments.
In fact, VinFast must collaborate with suppliers to produce green products. The most
critical consumer demand drivers for green products are quality management and the
potential to meet economic requirements. To meet customers’ requirements, VinFast's
management team actively combines expertise to explore renewable goods such as light,
lean manufacturing, and energy conservation. VinFast maintains good relationships with
vendors that would profit from the purchase of goods if necessary. They also retain positive
relationships with consumers, which allows VinFast to produce new products and better
address the demands of customers.

58
Figure 4.1. AHP hierarchy for the GSS problem
The case showed that in enterprise practice, green requirements such as the
environment and sustainability do not yet play a critical role in green supplier selection
procedures. Suppliers must follow certain minimum standards in order to work with focal
companies in the manufacturing chain due to environmental legislation. Following that,
most businesses do not use environmental standards to choose eligible vendors; instead,
GSS
C1
C2
C3 A5
A4
A3
Delivery
Service level A1
Staff training
Quality
Cost
……………………………………..
Relationship
Green products
Green image
Eco-design
Resource consumption
………………………………………
Human resource management
Health and safety
Corporate social responsibility
Human right issues
Relationship with stakeholders
A2

59
consumers demand that suppliers have documents such as a Certificate of Nonuse of
Controlled Substances, Certificate of Nonuse of Other Controlled Substances, Material
Safety Data Sheet, and Test Report of customer assigned items issued by SGS annually.
Those certificates concern quality of economic criterion and pollution control of
environmental criterion.
Expert Organization Duties Seniority
1 VinFast Commercial and services trading limited liability
company
Specialist 10
2 VinFast Commercial and services trading limited liability
company
Development
Engineer
15
3 VinFast Commercial and services trading limited liability
company
Engineer 10
4 VinFast Commercial and services trading limited liability
company
Senior Manager 8
5 VinFast Commercial and services trading limited liability
company
Project Manager 10
6 VinFast Commercial and services trading limited liability
company
Parts Quality
Group Manager
15
7 Manufacturing department, Kia Motors Vietnam Purchasing
Manager
8
8 Parts Quality Control Section, Porsche Vietnam Section Manager 8
9 Body Development Division Engineering Development
Engineer, Mercedes-Benz Vietnam Ltd
Team Leader
10 Automotive Asia Limited (Audi Vietnam) Engineer 9
11 THACO passenger Car Distribution Co., Ltd (BMW
Distributor in Vietnam)
Purchasing
Manager
15
12 Production Control Management Division, Isuzu Viet Nam
Co., Ltd.
Team Leader 15
Table 4.1 Professional backgrounds of the selected twelve experts for our survey
GSCM is implemented through mimetic and normative (competitive and
benchmarking) processes, according to institutional theory. To thrive, businesses must
conform with societal expectations and maintain consistency with the external world when
faced with environmental conservation and authenticity isomorphism pressures. As a
result, the economic, social corporate responsibility (SCR) and environmental aspects must
be considered.
In this thesis, the criteria for three dimensions and the correlation between suppliers
and required criteria are showed in the Table 2.1 and Figure 4.1 below. Five suppliers
which are providing vehicle batteries for VinFast were selected to illustrate for this case
study. To ensure confidentiality, authors of this thesis refer 5 suppliers as A1, A2, A3, A4,
and A5.

60
This study data was collected by interviews with 12 experts who are the top
managers and heads of departments with 8-15 years of experience in the automotive field.
They were required to make their evaluation, respectively, according to their preferences
for important weights of selection criteria in Appendix and ratings of green suppliers. The
information of these experts is listed in the Table 4.1.
Then, an integrating Fuzzy AHP and Fuzzy TOPSIS method is presented in the
Figure 4.2. Firstly, the fuzzy weights of proposed criteria are identified by Fuzzy AHP.
Secondly, the Fuzzy TOPSIS technique is utilized to prioritize and ranking the 5 selected
suppliers.
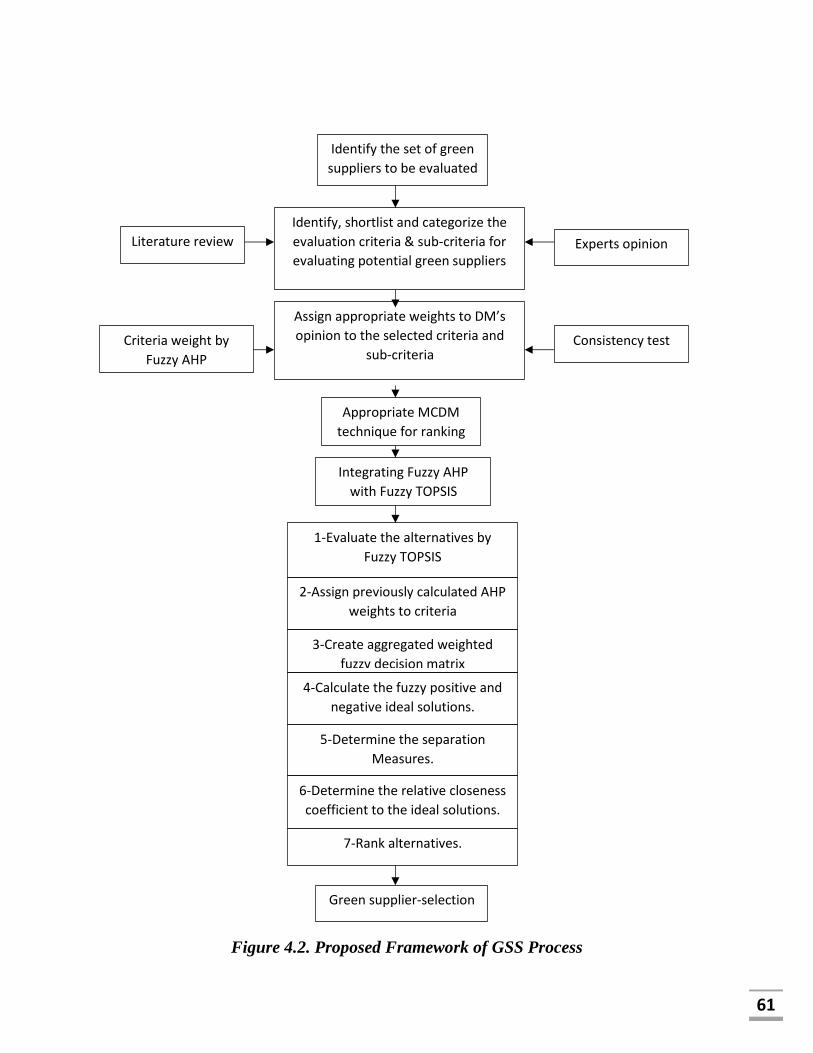
61
Figure 4.2. Proposed Framework of GSS Process
2-Assign previously calculated AHP
weights to criteria
3-Create aggregated weighted
fuzzy decision matrix
4-Calculate the fuzzy positive and
negative ideal solutions.
7-Rank alternatives.
5-Determine the separation
Measures.
6-Determine the relative closeness
coefficient to the ideal solutions.
Green supplier-selection
Appropriate MCDM
technique for ranking
Integrating Fuzzy AHP
with Fuzzy TOPSIS
1-Evaluate the alternatives by
Fuzzy TOPSIS
Identify the set of green
suppliers to be evaluated
Literature review
Identify, shortlist and categorize the
evaluation criteria & sub-criteria for
evaluating potential green suppliers Experts opinion
Criteria weight by
Fuzzy AHP
Consistency test
Assign appropriate weights to DM’s
opinion to the selected criteria and
sub-criteria
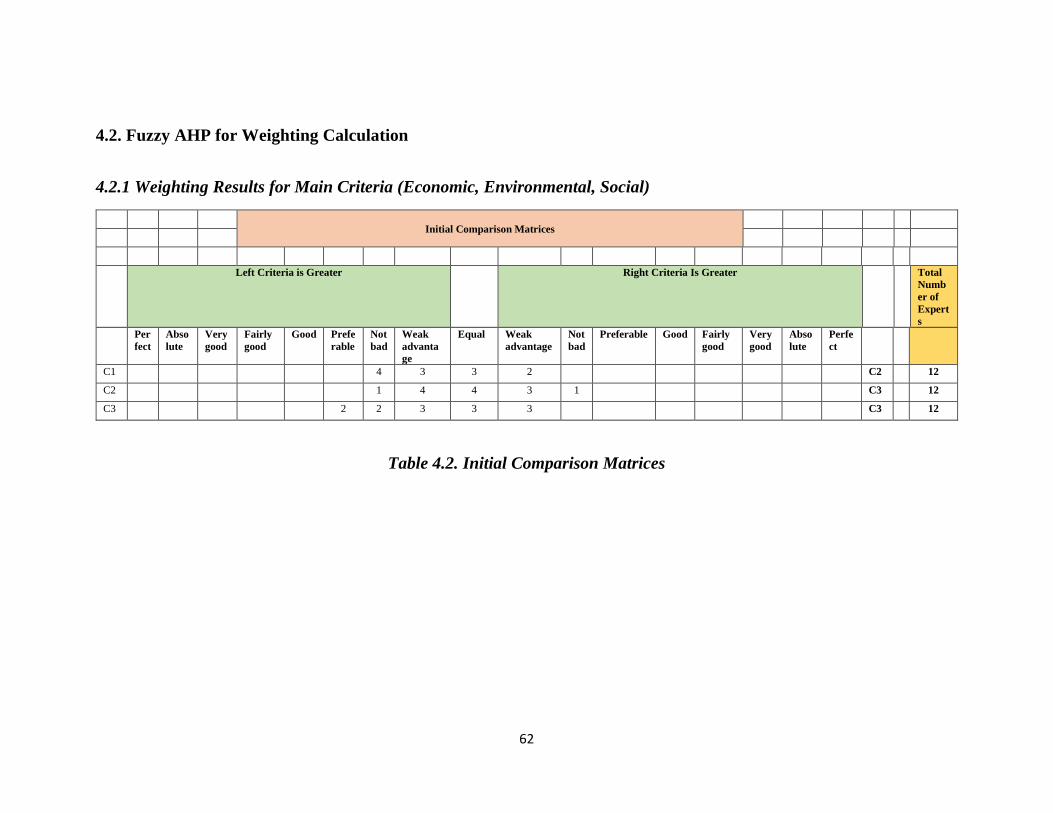
62
4.2. Fuzzy AHP for Weighting Calculation
4.2.1 Weighting Results for Main Criteria (Economic, Environmental, Social)
Initial Comparison Matrices
Left Criteria is Greater Right Criteria Is Greater Total
Numb
er of
Expert
s
Per
fect
Abso
lute
Very
good
Fairly
good
Good Prefe
rable
Not
bad
Weak
advanta
ge
Equal Weak
advantage
Not
bad
Preferable Good Fairly
good
Very
good
Abso
lute
Perfe
ct
C1 4 3 3 2 C2 12
C2 1 4 4 3 1 C3 12
C3 2 2 3 3 3 C3 12
Table 4.2. Initial Comparison Matrices

63
Integrated Fuzzy Comparison Matrix
C1 C2 C3
C1 1 1 1 1.0491 1.5280 2.0891 0.7172 1.0595 1.5280
C2 0.4787 0.6544 0.9532 1 1 1 1.0243 1.5131 2.1683
C3 0.6544 0.9439 1.3943 0.4612 0.6609 0.9763 1 1 1
Table 4.3. Integrated Fuzzy Comparison Matrix
Fuzzy Sum of Each Row Fuzzy Synthetic Extent Degree of Possibility of
Mi > Mj
Degree of Possibility
(Mi) normalization
weights of criteria
Ranking
C1 2.7663 3.5875 4.6171 0.2284 0.3833 0.6252 1.000 1.000 1.000 0.390 0.390 1
C2 2.5029 3.1675 4.1215 0.2067 0.3384 0.5581 0.880 1.000 0.880 0.343 0.343 2
C3 2.1156 2.6048 3.3706 0.1747 0.2783 0.4564 0.685 0.806 0.685 0.267 0.267 3
Sum 7.3849 9.3598 12.1093 2.565 1.0000 Sum
Table 4.4. Results Of Fuzzy Weighting Value Of Main Criteria (Economic, Environmental, Social)
Compare with 0.1, They should be less than 0.1
Consistency Ratio (CRm)
0.0696
Consistency Ratio (CRg)
0.1729
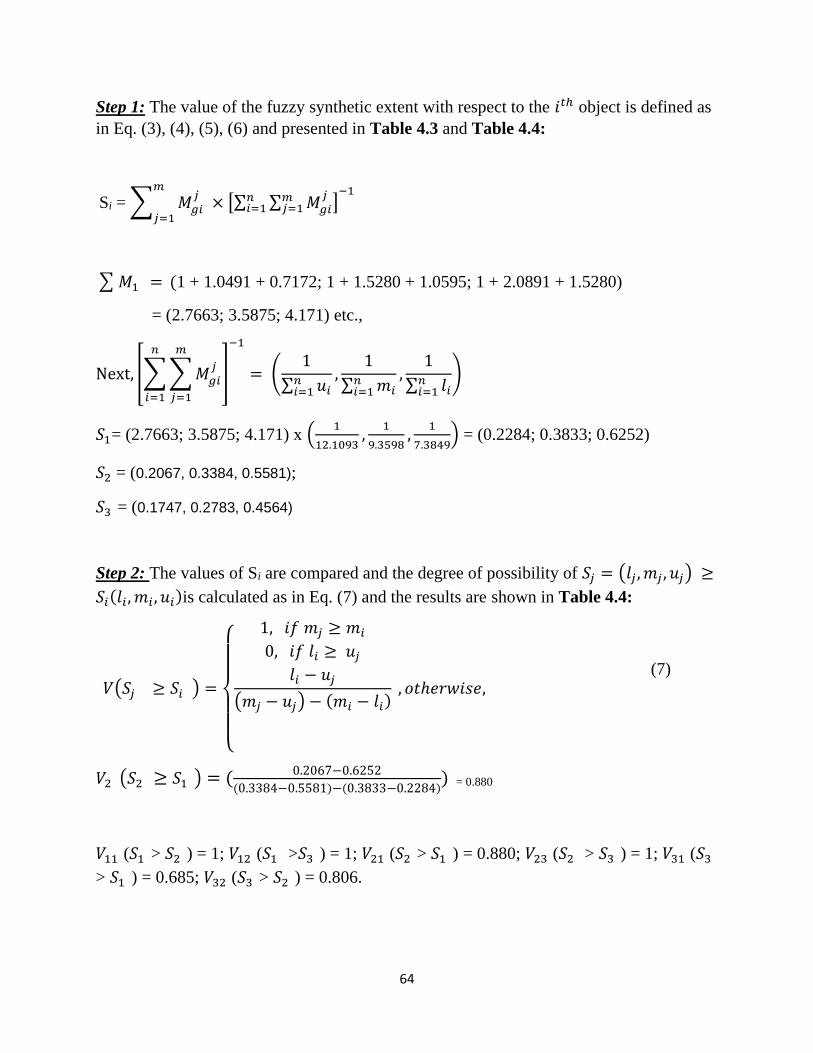
64
Step 1: The value of the fuzzy synthetic extent with respect to the 𝑖𝑡ℎ object is defined as
in Eq. (3), (4), (5), (6) and presented in Table 4.3 and Table 4.4:
Si = ∑ 𝑀𝑔𝑖𝑗
𝑚
𝑗=1 × [∑ ∑ 𝑀𝑔𝑖
𝑗𝑚𝑗=1
𝑛𝑖=1 ]
−1
∑𝑀1 = (1 + 1.0491 + 0.7172; 1 + 1.5280 + 1.0595; 1 + 2.0891 + 1.5280)
= (2.7663; 3.5875; 4.171) etc.,
Next, [∑∑𝑀𝑔𝑖𝑗
𝑚
𝑗=1
𝑛
𝑖=1
]
−1
= (1
∑ 𝑢𝑖𝑛𝑖=1
,1
∑ 𝑚𝑖𝑛𝑖=1
,1
∑ 𝑙𝑖𝑛𝑖=1
)
𝑆1= (2.7663; 3.5875; 4.171) x (1
12.1093,
1
9.3598,
1
7.3849) = (0.2284; 0.3833; 0.6252)
𝑆2 = (0.2067, 0.3384, 0.5581);
𝑆3 = (0.1747, 0.2783, 0.4564)
Step 2: The values of Si are compared and the degree of possibility of 𝑆𝑗 = (𝑙𝑗 ,𝑚𝑗 , 𝑢𝑗) ≥
𝑆𝑖(𝑙𝑖 , 𝑚𝑖 , 𝑢𝑖)is calculated as in Eq. (7) and the results are shown in Table 4.4:
𝑉(𝑆𝑗 ≥ 𝑆𝑖 ) =
{
1, 𝑖𝑓 𝑚𝑗 ≥ 𝑚𝑖
0, 𝑖𝑓 𝑙𝑖 ≥ 𝑢𝑗𝑙𝑖 − 𝑢𝑗
(𝑚𝑗 − 𝑢𝑗) − (𝑚𝑖 − 𝑙𝑖) , 𝑜𝑡ℎ𝑒𝑟𝑤𝑖𝑠𝑒,
(7)
𝑉2 (𝑆2 ≥ 𝑆1 ) = (0.2067−0.6252
(0.3384−0.5581)−(0.3833−0.2284)) = 0.880
𝑉11 (𝑆1 > 𝑆2 ) = 1; 𝑉12 (𝑆1 >𝑆3 ) = 1; 𝑉21 (𝑆2 > 𝑆1 ) = 0.880; 𝑉23 (𝑆2 > 𝑆3 ) = 1; 𝑉31 (𝑆3
> 𝑆1 ) = 0.685; 𝑉32 (𝑆3 > 𝑆2 ) = 0.806.
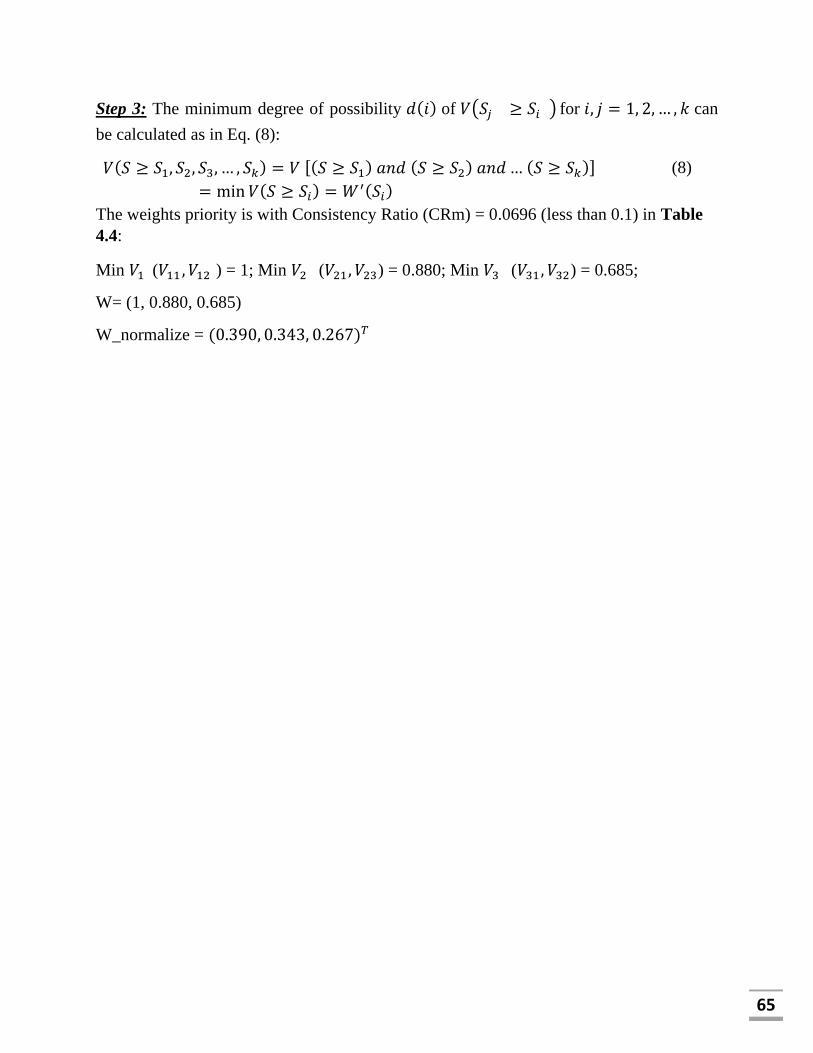
65
Step 3: The minimum degree of possibility 𝑑(𝑖) of 𝑉(𝑆𝑗 ≥ 𝑆𝑖 ) for 𝑖, 𝑗 = 1, 2, … , 𝑘 can
be calculated as in Eq. (8):
𝑉(𝑆 ≥ 𝑆1, 𝑆2, 𝑆3, … , 𝑆𝑘) = 𝑉 [(𝑆 ≥ 𝑆1) 𝑎𝑛𝑑 (𝑆 ≥ 𝑆2) 𝑎𝑛𝑑 … (𝑆 ≥ 𝑆𝑘)]
= min 𝑉(𝑆 ≥ 𝑆𝑖) = 𝑊′(𝑆𝑖)
(8)
The weights priority is with Consistency Ratio (CRm) = 0.0696 (less than 0.1) in Table
4.4:
Min 𝑉1 (𝑉11 , 𝑉12 ) = 1; Min 𝑉2 (𝑉21 , 𝑉23) = 0.880; Min 𝑉3 (𝑉31 , 𝑉32) = 0.685;
W= (1, 0.880, 0.685)
W_normalize = (0.390, 0.343, 0.267)𝑇

66
4.2.2 Weighting Results for Sub-Criteria of Economic (C1)
𝑊𝑠𝑢𝑏−𝐶1= (0.0984, 0.1004, 0.1150, 0.1007, 0.1226, 0.0634, 0.0647, 0.0954, 0.0930, 0.0793, 0.0671)𝑇
Table 1: Initial Comparison Matrices
Left Criteria Is Greater
Right Criteria Is Greater
Total
Num
ber
of
Expe
rts
Perf
ect
Absol
ute
Very
good
Fairly
good
Go
od
Prefer
able
Not
bad
Weak
advantage
Eq
ual
Weak
advantage
Not
bad
Prefer
able
Go
od
Fairly
good
Very
good
Absol
ute
Perf
ect
C
11 4 3 3 2 C1
2 12
C
11 2 2 4 3 1 C1
3 12
C
11 1 2 3 4 2 C1
4 12
C
11 3 3 3 2 1 C1
5 12
C
11 4 3 3 2 C1
6 12
C
11 4 3 3 2 C1
7 12
C
11 3 3 3 2 1 C1
8 12
C
11 3 3 3 2 1 C1
9 12
C
11 3 3 3 2 1 C1
10 12
C
11 3 3 3 2 1 C1
11 12

67
C
12 3 3 3 2 1 C1
3 12
C
12 2 4 3 2 1 C1
4 12
C
12 3 3 3 2 1 C1
5 12
C
12 4 3 3 2 C1
6 12
C
12 4 3 3 2 C1
7 12
C
12 3 3 3 2 1 C1
8 12
C
12 3 3 2 1 2 1 C1
9 12
C
12 3 3 3 2 1 C1
10 12
C
12 5 3 3 1 C1
11 12
C
13 5 3 3 1 C1
4 12
C
13 3 3 3 2 1 C1
5 12
C
13 4 3 3 2 C1
6 12
C
13 4 3 3 2 C1
7 12
C
13 3 3 3 2 1 C1
8 12
C
13 3 3 2 1 2 1 C1
9 12
C
13 3 3 3 2 1 C1
10 12
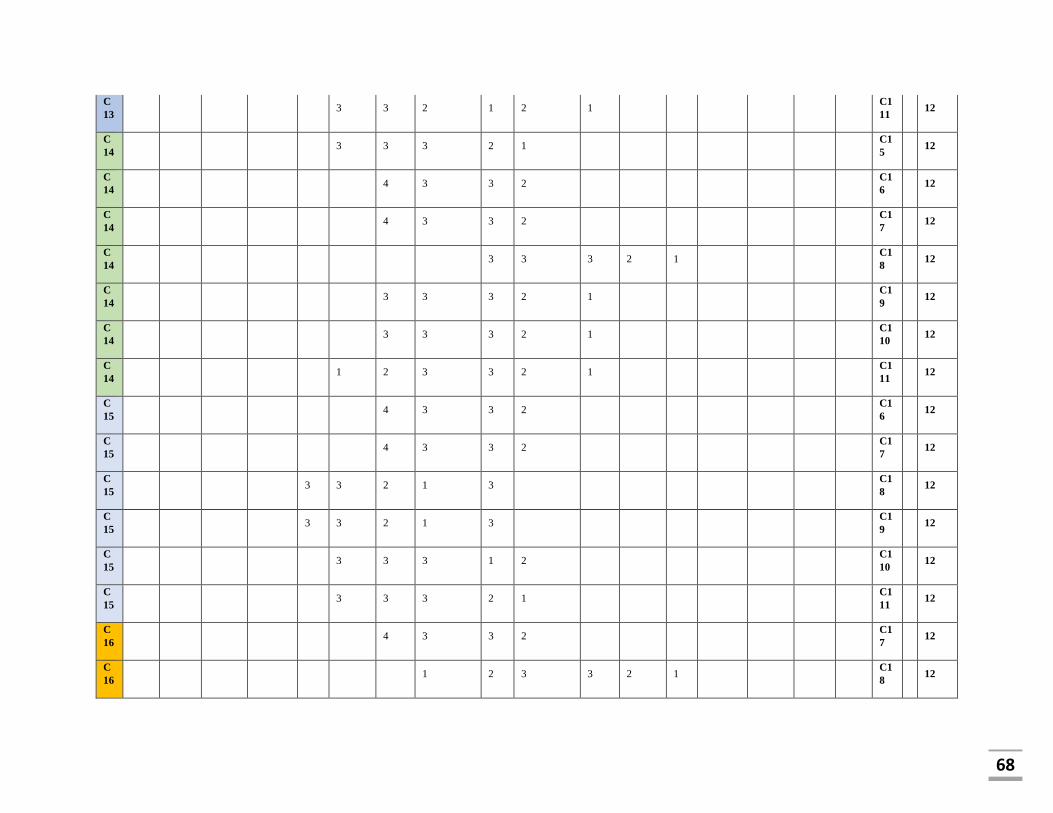
68
C
13 3 3 2 1 2 1 C1
11 12
C
14 3 3 3 2 1 C1
5 12
C
14 4 3 3 2 C1
6 12
C
14 4 3 3 2 C1
7 12
C
14 3 3 3 2 1 C1
8 12
C
14 3 3 3 2 1 C1
9 12
C
14 3 3 3 2 1 C1
10 12
C
14 1 2 3 3 2 1 C1
11 12
C
15 4 3 3 2 C1
6 12
C
15 4 3 3 2 C1
7 12
C
15 3 3 2 1 3 C1
8 12
C
15 3 3 2 1 3 C1
9 12
C
15 3 3 3 1 2 C1
10 12
C
15 3 3 3 2 1 C1
11 12
C
16 4 3 3 2 C1
7 12
C
16 1 2 3 3 2 1 C1
8 12

69
C
16 3 3 3 2 1 C1
9 12
C
16 3 3 3 2 1 C1
10 12
C
16 1 2 3 3 2 1 C1
11 12
C
17 3 3 3 2 1 C1
8 12
C
17 3 3 3 2 1 C1
9 12
C
17 3 3 3 2 1 C1
10 12
C
17 2 4 3 2 1 C1
11 12
C
18 3 3 3 2 1 C1
9 12
C
18 3 3 3 2 1 C1
10 12
C
18 3 3 3 2 1 C1
11 12
C
19 3 3 3 2 1 C1
10 12
C
19 3 3 3 2 1 C1
11 12
C
10 3 3 3 2 1 C1
11 12
Table 4.5. Initial Comparison Matrices
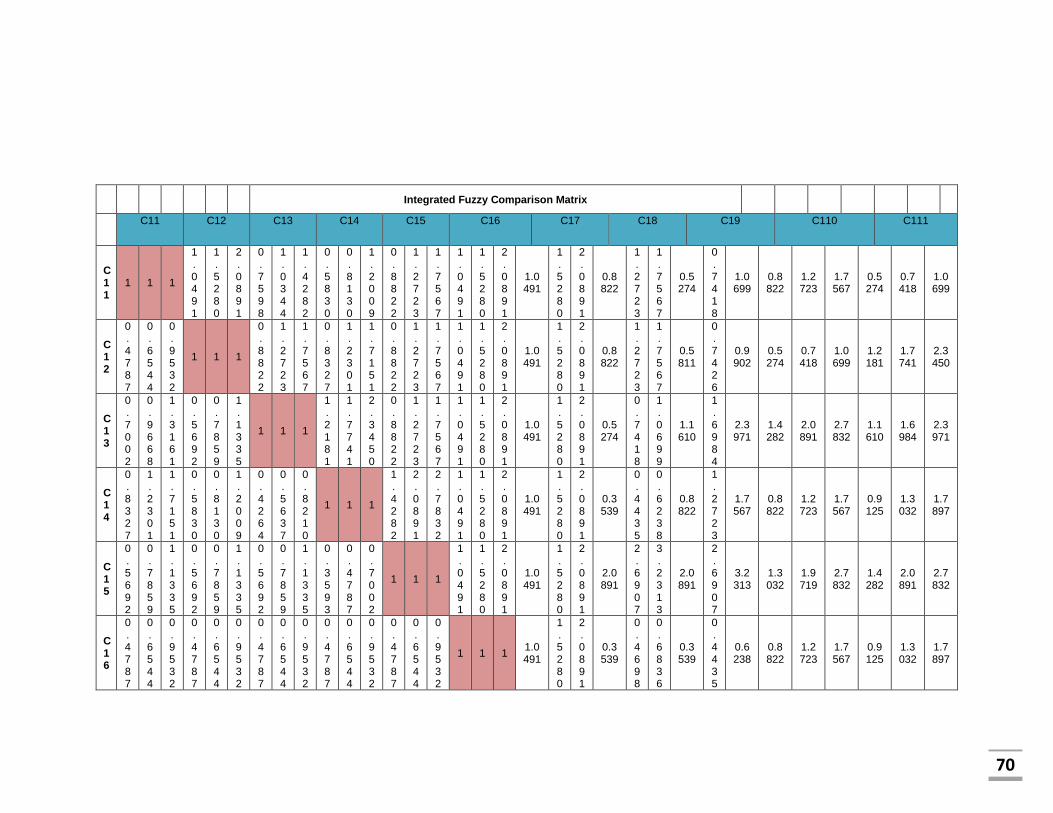
70
Integrated Fuzzy Comparison Matrix
C11 C12 C13 C14 C15 C16 C17 C18 C19 C110 C111
C11
1 1 1
1.0491
1.5280
2.0891
0.7598
1.0344
1.4282
0.5830
0.8130
1.2009
0.8822
1.2723
1.7567
1.0491
1.5280
2.0891
1.0491
1.5280
2.0891
0.8822
1.2723
1.7567
0.5274
0.7418
1.0699
0.8822
1.2723
1.7567
0.5274
0.7418
1.0699
C12
0.4787
0.6544
0.9532
1 1 1
0.8822
1.2723
1.7567
0.8327
1.2301
1.7151
0.8822
1.2723
1.7567
1.0491
1.5280
2.0891
1.0491
1.5280
2.0891
0.8822
1.2723
1.7567
0.5811
0.7426
0.9902
0.5274
0.7418
1.0699
1.2181
1.7741
2.3450
C13
0.7002
0.9668
1.3161
0.5692
0.7859
1.1335
1 1 1
1.2181
1.7741
2.3450
0.8822
1.2723
1.7567
1.0491
1.5280
2.0891
1.0491
1.5280
2.0891
0.5274
0.7418
1.0699
1.1610
1.6984
2.3971
1.4282
2.0891
2.7832
1.1610
1.6984
2.3971
C14
0.8327
1.2301
1.7151
0.5830
0.8130
1.2009
0.4264
0.5637
0.8210
1 1 1
1.4282
2.0891
2.7832
1.0491
1.5280
2.0891
1.0491
1.5280
2.0891
0.3539
0.4435
0.6238
0.8822
1.2723
1.7567
0.8822
1.2723
1.7567
0.9125
1.3032
1.7897
C15
0.5692
0.7859
1.1335
0.5692
0.7859
1.1335
0.5692
0.7859
1.1335
0.3593
0.4787
0.7002
1 1 1
1.0491
1.5280
2.0891
1.0491
1.5280
2.0891
2.0891
2.6907
3.2313
2.0891
2.6907
3.2313
1.3032
1.9719
2.7832
1.4282
2.0891
2.7832
C16
0.4787
0.6544
0.9532
0.4787
0.6544
0.9532
0.4787
0.6544
0.9532
0.4787
0.6544
0.9532
0.4787
0.6544
0.9532
1 1 1 1.0491
1.5280
2.0891
0.3539
0.4698
0.6836
0.3539
0.4435
0.6238
0.8822
1.2723
1.7567
0.9125
1.3032
1.7897
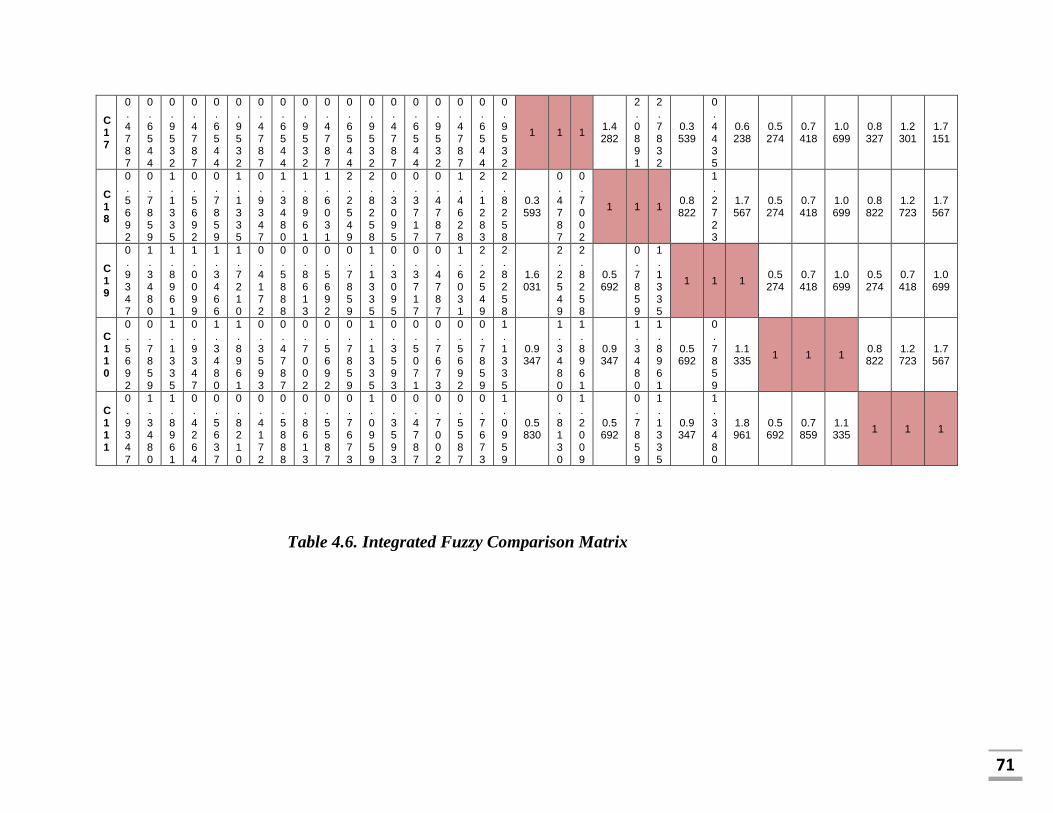
71
C17
0.4787
0.6544
0.9532
0.4787
0.6544
0.9532
0.4787
0.6544
0.9532
0.4787
0.6544
0.9532
0.4787
0.6544
0.9532
0.4787
0.6544
0.9532
1 1 1 1.4282
2.0891
2.7832
0.3539
0.4435
0.6238
0.5274
0.7418
1.0699
0.8327
1.2301
1.7151
C18
0.5692
0.7859
1.1335
0.5692
0.7859
1.1335
0.9347
1.3480
1.8961
1.6031
2.2549
2.8258
0.3095
0.3717
0.4787
1.4628
2.1283
2.8258
0.3593
0.4787
0.7002
1 1 1 0.8822
1.2723
1.7567
0.5274
0.7418
1.0699
0.8822
1.2723
1.7567
C19
0.9347
1.3480
1.8961
1.0099
1.3466
1.7210
0.4172
0.5888
0.8613
0.5692
0.7859
1.1335
0.3095
0.3717
0.4787
1.6031
2.2549
2.8258
1.6031
2.2549
2.8258
0.5692
0.7859
1.1335
1 1 1 0.5274
0.7418
1.0699
0.5274
0.7418
1.0699
C110
0.5692
0.7859
1.1335
0.9347
1.3480
1.8961
0.3593
0.4787
0.7002
0.5692
0.7859
1.1335
0.3593
0.5071
0.7673
0.5692
0.7859
1.1335
0.9347
1.3480
1.8961
0.9347
1.3480
1.8961
0.5692
0.7859
1.1335
1 1 1 0.8822
1.2723
1.7567
C111
0.9347
1.3480
1.8961
0.4264
0.5637
0.8210
0.4172
0.5888
0.8613
0.5587
0.7673
1.0959
0.3593
0.4787
0.7002
0.5587
0.7673
1.0959
0.5830
0.8130
1.2009
0.5692
0.7859
1.1335
0.9347
1.3480
1.8961
0.5692
0.7859
1.1335
1 1 1
Table 4.6. Integrated Fuzzy Comparison Matrix

72
Fuzzy Sum of Each Row Fuzzy Synthetic
Extent Degree of Possibility of Mi > Mj
Degree of
Possibility (Mi)
Normalization
Weights
Ranki
ng
C11 9.1916 12.7321 17.306
6 0.0512
0.0955
0.1775
0.983
0.870
0.982
0.803
1.000
1.000
1.000
1.000
1.000
1.000
0.803 0.0984 5
C12 9.3827 13.0161 17.522
0 0.0522
0.0977
0.1797
1.000
0.885
0.998
0.819
1.000
1.000
1.000
1.000
1.000
1.000
0.819 0.1004 4
C13 10.745
5 15.0829
20.3769
0.0598
0.1132
0.2090
1.000
1.000
1.000
0.938
1.000
1.000
1.000
1.000
1.000
1.000
0.938 0.1150 2
C14 9.3994 13.0433 17.625
5 0.0523
0.0979
0.1807
1.000
1.000
0.888
0.821
1.000
1.000
1.000
1.000
1.000
1.000
0.821 0.1007 3
C15 12.074
9 16.3349
21.3081
0.0672
0.1226
0.2185
1.000
1.000
1.000
1.000
1.000
1.000
1.000
1.000
1.000
1.000
1.000 0.1226 1
C16 6.9449 9.2891 12.708
9 0.0387
0.0697
0.1303
0.754
0.736
0.619
0.735
0.544
0.988
0.517
0.784
0.910
1.000
0.517 0.0634 11
C17 7.0141 9.4312 12.911
1 0.0390
0.0708
0.1324
0.766
0.749
0.631
0.747
0.557
1.000
0.527
0.796
0.922
1.000
0.527 0.0647 10
C18 9.0995 12.4400 16.577
0 0.0507
0.0933
0.1700
0.982
0.965
0.847
0.963
0.779
1.000
1.000
1.000
1.000
1.000
0.779 0.0954 6
C19 9.0705 12.2204 16.015
5 0.0505
0.0917
0.1642
0.967
0.949
0.829
0.948
0.759
1.000
1.000
0.986
1.000
1.000
0.759 0.0930 7
C110
7.6817 10.4460 14.446
8 0.0428
0.0784
0.1481
0.850
0.833
0.717
0.831
0.647
1.000
1.000
0.867
0.880
1.000
0.647 0.0793 8
C111
6.9112 9.2467 12.834
5 0.0385
0.0694
0.1316
0.755
0.737
0.621
0.736
0.548
0.997
0.696
0.772
0.784
0.908
0.548 0.0671 9
Sum
97.5161
133.2827
179.6330
8.158 1.0000
Sum
Compare with 0.1, They should be less than 0.1
Consistency Ratio (CRm)
0.0539
Consistency Ratio (CRg)
0.1470
Table 4.7. Results of Fuzzy Weighting Value Of Economic
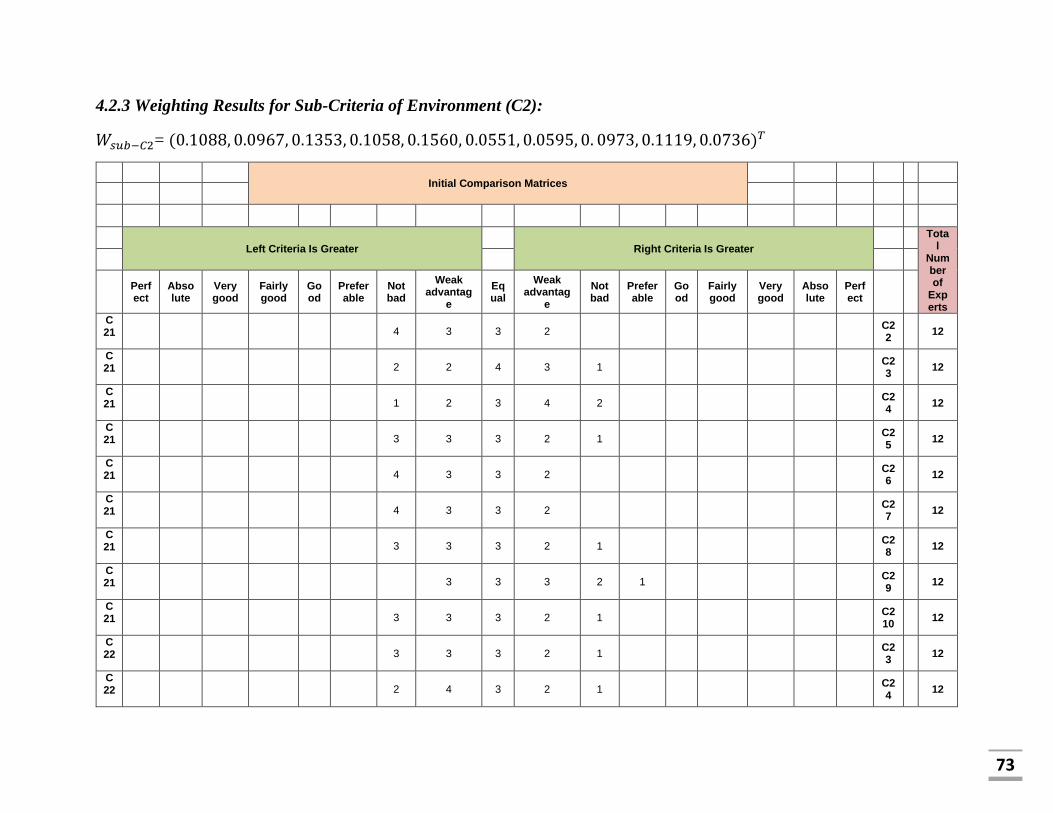
73
4.2.3 Weighting Results for Sub-Criteria of Environment (C2):
𝑊𝑠𝑢𝑏−𝐶2= (0.1088, 0.0967, 0.1353, 0.1058, 0.1560, 0.0551, 0.0595, 0. 0973, 0.1119, 0.0736)𝑇
Initial Comparison Matrices
Left Criteria Is Greater
Right Criteria Is Greater
Total
Number of
Experts
Perfect
Absolute
Very good
Fairly good
Good
Preferable
Not bad
Weak advantag
e
Equal
Weak advantag
e
Not bad
Preferable
Good
Fairly good
Very good
Absolute
Perfect
C21 4 3 3 2 C2
2 12
C21 2 2 4 3 1 C2
3 12
C21 1 2 3 4 2 C2
4 12
C21 3 3 3 2 1 C2
5 12
C21 4 3 3 2 C2
6 12
C21 4 3 3 2 C2
7 12
C21 3 3 3 2 1 C2
8 12
C21 3 3 3 2 1 C2
9 12
C21 3 3 3 2 1 C2
10 12
C22
3 3 3 2 1 C2
3 12
C22
2 4 3 2 1 C2
4 12
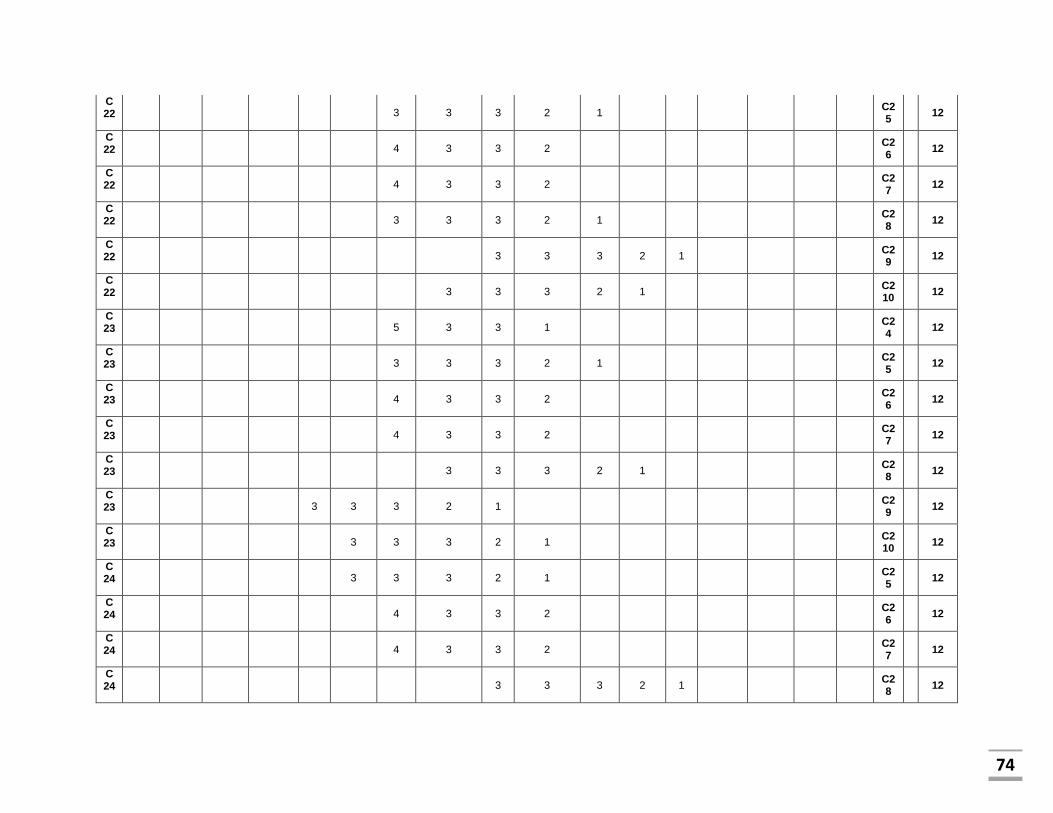
74
C22
3 3 3 2 1 C2
5 12
C22
4 3 3 2 C2
6 12
C22
4 3 3 2 C2
7 12
C22
3 3 3 2 1 C2
8 12
C22
3 3 3 2 1 C2
9 12
C22
3 3 3 2 1 C2
10 12
C23 5 3 3 1 C2
4 12
C23 3 3 3 2 1 C2
5 12
C23 4 3 3 2 C2
6 12
C23 4 3 3 2 C2
7 12
C23 3 3 3 2 1 C2
8 12
C23 3 3 3 2 1 C2
9 12
C23 3 3 3 2 1 C2
10 12
C24 3 3 3 2 1 C2
5 12
C24 4 3 3 2 C2
6 12
C24 4 3 3 2 C2
7 12
C24 3 3 3 2 1 C2
8 12

75
C24 3 3 3 2 1 C2
9 12
C24 3 3 3 2 1 C2
10 12
C25 4 3 3 2 C2
6 12
C25 4 3 3 2 C2
7 12
C25 3 3 3 2 1 C2
8 12
C25 3 3 3 2 1 C2
9 12
C25 3 3 3 2 1 C2
10 12
C26 4 3 3 2 C2
7 12
C26 3 3 3 2 1 C2
8 12
C26 3 3 3 2 1 C2
9 12
C26 3 3 3 2 1 C2
10 12
C27 3 3 3 2 1 C2
8 12
C27 3 3 3 2 1 C2
9 12
C27 1 2 3 3 2 1 C2
10 12
C28
3 3 3 2 1 C29
12
C28
3 3 3 2 1 C210
12
C29
3 3 3 2 1 C210
12
Table 4.8. Initial Comparison Matrices

76
Integrated Fuzzy Comparison Matrix
C11 C12 C13 C14 C15 C16 C17 C18 C19 C110
C11
1 1 1 1.0491
1.5280
2.0891
0.7598
1.0344
1.4282
0.5830
0.8130
1.2009
0.8822
1.2723
1.7567
1.0491
1.5280
2.0891
1.0491
1.5280
2.0891
0.8822
1.2723
1.7567
0.5274
0.7418
1.0699
0.8822
1.2723
1.7567
C12
0.4787
0.6544
0.9532
1 1 1 0.8822
1.2723
1.7567
0.8327
1.2301
1.7151
0.8822
1.2723
1.7567
1.0491
1.5280
2.0891
1.0491
1.5280
2.0891
0.8822
1.2723
1.7567
0.3539
0.4435
0.6238
0.5274
0.7418
1.0699
C13
0.7002
0.9668
1.3161
0.5692
0.7859
1.1335
1 1 1 1.2181
1.7741
2.3450
0.8822
1.2723
1.7567
1.0491
1.5280
2.0891
1.0491
1.5280
2.0891
0.5274
0.7418
1.0699
2.2134
3.1240
3.9748
1.4282
2.0891
2.7832
C14
0.8327
1.2301
1.7151
0.5830
0.8130
1.2009
0.4264
0.5637
0.8210
1 1 1 1.4282
2.0891
2.7832
1.0491
1.5280
2.0891
1.0491
1.5280
2.0891
0.3539
0.4435
0.6238
0.8822
1.2723
1.7567
0.8822
1.2723
1.7567
C15
0.5692
0.7859
1.1335
0.5692
0.7859
1.1335
0.5692
0.7859
1.1335
0.3593
0.4787
0.7002
1 1 1 1.0491
1.5280
2.0891
1.0491
1.5280
2.0891
3.1240
4.2112
5.2560
3.1240
4.2112
5.2560
1.4282
2.0891
2.7832
C16
0.4787
0.6544
0.9532
0.4787
0.6544
0.9532
0.4787
0.6544
0.9532
0.4787
0.6544
0.9532
0.4787
0.6544
0.9532
1 1 1 1.0491
1.5280
2.0891
0.3539
0.4435
0.6238
0.3539
0.4435
0.6238
0.8822
1.2723
1.7567
C17
0.4787
0.6544
0.9532
0.4787
0.6544
0.9532
0.4787
0.6544
0.9532
0.4787
0.6544
0.9532
0.4787
0.6544
0.9532
0.4787
0.6544
0.9532
1 1 1 1.4282
2.0891
2.7832
0.3539
0.4435
0.6238
0.5587
0.7673
1.0959
C18
0.5692
0.7859
1.1335
0.5692
0.7859
1.1335
0.9347
1.3480
1.8961
1.6031
2.2549
2.8258
0.1903
0.2375
0.3201
1.6031
2.2549
2.8258
0.3593
0.4787
0.7002
1 1 1 0.8822
1.2723
1.7567
0.5274
0.7418
1.0699
C19
0.9347
1.3480
1.8961
1.6031
2.2549
2.8258
0.2516
0.3201
0.4518
0.5692
0.7859
1.1335
0.1903
0.2375
0.3201
1.6031
2.2549
2.8258
1.6031
2.2549
2.8258
0.5692
0.7859
1.1335
1 1 1 0.8822
1.2723
1.7567
C110
0.5692
0.7859
1.1335
0.9347
1.3480
1.8961
0.3593
0.4787
0.7002
0.5692
0.7859
1.1335
0.3593
0.4787
0.7002
0.5692
0.7859
1.1335
0.9125
1.3032
1.7897
0.9347
1.3480
1.8961
0.5692
0.7859
1.1335
1 1 1
Table 4.9. Integrated Fuzzy Comparison Matrix
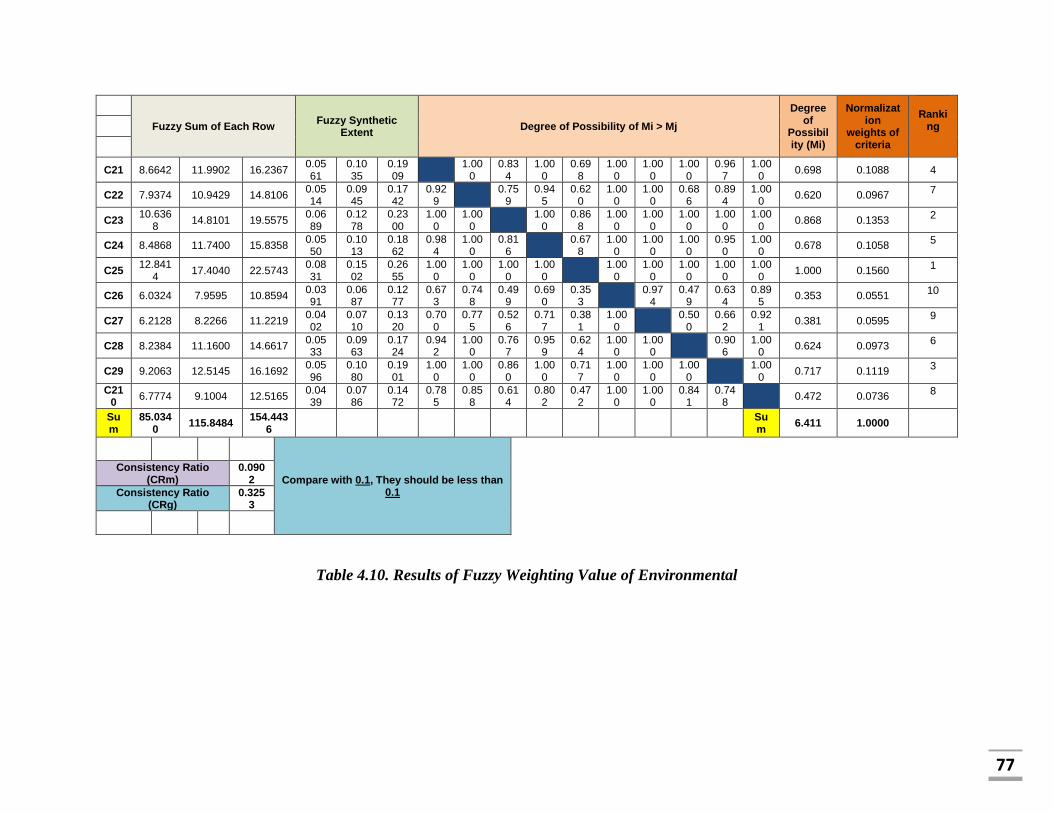
77
Fuzzy Sum of Each Row Fuzzy Synthetic
Extent Degree of Possibility of Mi > Mj
Degree of
Possibility (Mi)
Normalization
weights of criteria
Ranki
ng
C21 8.6642 11.9902 16.2367 0.0561
0.1035
0.1909
1.000
0.834
1.000
0.698
1.000
1.000
1.000
0.967
1.000
0.698 0.1088 4
C22 7.9374 10.9429 14.8106 0.0514
0.0945
0.1742
0.929
0.759
0.945
0.620
1.000
1.000
0.686
0.894
1.000
0.620 0.0967 7
C23 10.636
8 14.8101 19.5575
0.0689
0.1278
0.2300
1.000
1.000
1.000
0.868
1.000
1.000
1.000
1.000
1.000
0.868 0.1353 2
C24 8.4868 11.7400 15.8358 0.0550
0.1013
0.1862
0.984
1.000
0.816
0.678
1.000
1.000
1.000
0.950
1.000
0.678 0.1058 5
C25 12.841
4 17.4040 22.5743
0.0831
0.1502
0.2655
1.000
1.000
1.000
1.000
1.000
1.000
1.000
1.000
1.000
1.000 0.1560 1
C26 6.0324 7.9595 10.8594 0.0391
0.0687
0.1277
0.673
0.748
0.499
0.690
0.353
0.974
0.479
0.634
0.895
0.353 0.0551 10
C27 6.2128 8.2266 11.2219 0.0402
0.0710
0.1320
0.700
0.775
0.526
0.717
0.381
1.000
0.500
0.662
0.921
0.381 0.0595 9
C28 8.2384 11.1600 14.6617 0.0533
0.0963
0.1724
0.942
1.000
0.767
0.959
0.624
1.000
1.000
0.906
1.000
0.624 0.0973 6
C29 9.2063 12.5145 16.1692 0.0596
0.1080
0.1901
1.000
1.000
0.860
1.000
0.717
1.000
1.000
1.000
1.000
0.717 0.1119 3
C210
6.7774 9.1004 12.5165 0.0439
0.0786
0.1472
0.785
0.858
0.614
0.802
0.472
1.000
1.000
0.841
0.748
0.472 0.0736 8
Sum
85.0340
115.8484 154.443
6 Su
m 6.411 1.0000
Compare with 0.1, They should be less than 0.1
Consistency Ratio (CRm)
0.0902
Consistency Ratio (CRg)
0.3253
Table 4.10. Results of Fuzzy Weighting Value of Environmental

78
4.2.4 Weighting Results for Sub-Criteria of Social (C3)
𝑊𝑠𝑢𝑏−𝐶3= (0.2153, 0.2078, 0.2203, 0.2169, 0.1397)𝑇
Initial Comparison Matrices
Left Criteria Is Greater
Right Criteria Is Greater
Total
Number of
Experts
Perfect
Absolute
Very good
Fairly good
Good
Preferable
Not bad
Weak advantag
e
Equal
Weak advantag
e
Not bad
Preferable
Good
Fairly good
Very good
Absolute
Perfect
C31
4 3 3 2 C32
12
C31 2 2 4 3 1 C
33 12
C31 1 2 3 4 2 C
34 12
C31 3 3 3 2 1 C
35 12
C32 3 3 3 2 1 C
33 12
C32 2 4 3 2 1 C
34 12
C32 3 3 3 2 1 C
35 12
C33
5 3 3 1 C34
12
C33
3 3 3 2 1 C35
12
C34
3 3 3 2 1 C35
12
Table 4.11. Initial Comparison Matrices

79
Integrated Fuzzy Comparison Matrix
C31 C32 C33 C34 C35
C31 1 1 1
1.0491
1.5280
2.0891
0.7598
1.0344
1.4282
0.5830
0.8130
1.2009
0.8822
1.2723
1.7567
C32
0.4787
0.6544
0.9532 1 1 1
0.8822
1.2723
1.7567
0.8327
1.2301
1.7151
0.8822
1.2723
1.7567
C33
0.7002
0.9668
1.3161
0.5692
0.7859
1.1335 1 1 1
1.2181
1.7741
2.3450
0.8822
1.2723
1.7567
C34
0.8327
1.2301
1.7151
0.5830
0.8130
1.2009
0.4264
0.5637
0.8210 1 1 1
1.4282
2.0891
2.7832
C35
0.5692
0.7859
1.1335
0.5692
0.7859
1.1335
0.5692
0.7859
1.1335
0.3593
0.4787
0.7002 1 1 1
Table 4.12. Integrated Fuzzy Comparison Matrix

80
Table 4.13. Results of Fuzzy Weighting Value of Social
Fuzzy Sum of Each Row Fuzzy Synthetic Extent Degree of Possibility of Mi > Mj
Degree of Possibility (Mi)
normalization
Ranking
C31 4.2742 5.6477 7.4750 0.1227 0.2139 0.3727 1.000 0.977 0.993 1.000 0.977 0.2153 3
C32 4.0757 5.4292 7.1818 0.1170 0.2056 0.3581 0.966 0.943 0.959 1.000 0.943 0.2078
4
C33 4.3697 5.7991 7.5513 0.1255 0.2196 0.3765 1.000 1.000 1.000 1.000 1.000 0.2203
1
C34 4.2703 5.6958 7.5202 0.1226 0.2157 0.3749 1.000 1.000 0.985 1.000 0.985 0.2169
2
C35 3.0670 3.8365 5.1008 0.0881 0.1453 0.2543 0.657 0.695 0.634 0.652 0.634 0.1397
5
Sum 20.0570 26.4084 34.8291 4.539 1.0000
Sum
Compare with 0.1, They should be less than 0.1
Consistency Ratio (CRm) 0.0388
Consistency Ratio (CRg) 0.0976

81
Criteria W_Concept Sub-criteria W_Local Rank_Local W_Global Rank_ Global
Economic (C1)
0.390
Staff training (C11) 0.098 5 0.0384 12
Delivery (C12) 0.100 4 0.0391 10
Service level (C13) 0.115 2 0.0448 8
Quality (C14) 0.101 3 0.0393 9
Cost (C15) 0.123 1 0.0478 6
Technology (C16) 0.063 11 0.0247 24
Flexibility (C17) 0.065 10 0.0252 23
Financial capability(C18) 0.095 6 0.0372 15
Culture (C19) 0.093 7 0.0363 17
Innovativeness (C110) 0.079 8 0.0309 20
Relationship (C111) 0.067 9 0.0262 21
Environmental (C2)
0.343
Green products (C21) 0.109 4 0.0373 13
Green image (C22) 0.097 7 0.0332 19
Eco-design(C23) 0.135 2 0.0464 7
Management commitment(C24) 0.106 5 0.0363 16
Green technology(C25) 0.156 1 0.0535 5
Pollution control(C26) 0.055 10 0.0189 26
Recycle(C27) 0.060 9 0.0204 25
Re-manufacturing(C28) 0.097 6 0.0334 18
Environmental management system (C29)
0.112 3 0.0384 11
Resource consumption(C210) 0.074 8 0.0253 22
Social (C3)
0.267
Human resource management (C31)
0.215 3 0.0575 3
Corporate social responsibility (C32)
0.208 4 0.0555 4
Health and safety (C33) 0.220 1 0.0588 1
Human right issues (C34) 0.217 2 0.0579 2
Relationship with stakeholders (C35)
0.140 5 0.0373 14
Table 4.14. Weighting and Ranking Results of FAHP
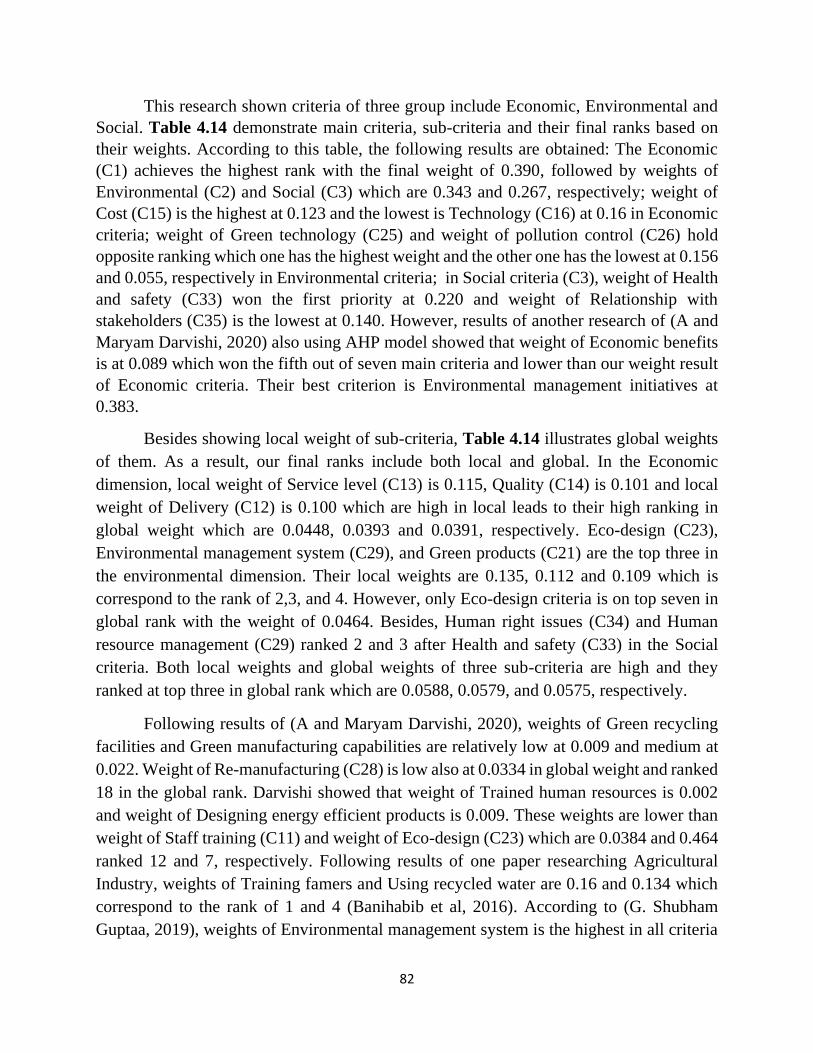
82
This research shown criteria of three group include Economic, Environmental and
Social. Table 4.14 demonstrate main criteria, sub-criteria and their final ranks based on
their weights. According to this table, the following results are obtained: The Economic
(C1) achieves the highest rank with the final weight of 0.390, followed by weights of
Environmental (C2) and Social (C3) which are 0.343 and 0.267, respectively; weight of
Cost (C15) is the highest at 0.123 and the lowest is Technology (C16) at 0.16 in Economic
criteria; weight of Green technology (C25) and weight of pollution control (C26) hold
opposite ranking which one has the highest weight and the other one has the lowest at 0.156
and 0.055, respectively in Environmental criteria; in Social criteria (C3), weight of Health
and safety (C33) won the first priority at 0.220 and weight of Relationship with
stakeholders (C35) is the lowest at 0.140. However, results of another research of (A and
Maryam Darvishi, 2020) also using AHP model showed that weight of Economic benefits
is at 0.089 which won the fifth out of seven main criteria and lower than our weight result
of Economic criteria. Their best criterion is Environmental management initiatives at
0.383.
Besides showing local weight of sub-criteria, Table 4.14 illustrates global weights
of them. As a result, our final ranks include both local and global. In the Economic
dimension, local weight of Service level (C13) is 0.115, Quality (C14) is 0.101 and local
weight of Delivery (C12) is 0.100 which are high in local leads to their high ranking in
global weight which are 0.0448, 0.0393 and 0.0391, respectively. Eco-design (C23),
Environmental management system (C29), and Green products (C21) are the top three in
the environmental dimension. Their local weights are 0.135, 0.112 and 0.109 which is
correspond to the rank of 2,3, and 4. However, only Eco-design criteria is on top seven in
global rank with the weight of 0.0464. Besides, Human right issues (C34) and Human
resource management (C29) ranked 2 and 3 after Health and safety (C33) in the Social
criteria. Both local weights and global weights of three sub-criteria are high and they
ranked at top three in global rank which are 0.0588, 0.0579, and 0.0575, respectively.
Following results of (A and Maryam Darvishi, 2020), weights of Green recycling
facilities and Green manufacturing capabilities are relatively low at 0.009 and medium at
0.022. Weight of Re-manufacturing (C28) is low also at 0.0334 in global weight and ranked
18 in the global rank. Darvishi showed that weight of Trained human resources is 0.002
and weight of Designing energy efficient products is 0.009. These weights are lower than
weight of Staff training (C11) and weight of Eco-design (C23) which are 0.0384 and 0.464
ranked 12 and 7, respectively. Following results of one paper researching Agricultural
Industry, weights of Training famers and Using recycled water are 0.16 and 0.134 which
correspond to the rank of 1 and 4 (Banihabib et al, 2016). According to (G. Shubham
Guptaa, 2019), weights of Environmental management system is the highest in all criteria

83
at 0.169 as the same weight of Environmental management system (C29) which is
relatively high at 0.112 and ranked 11. In this study, weights of Pollution control (C26)
and Green image (C22) ranked of 26 and 19 with their weight is at 0.0189 and 0.0332,
respectively. Global rank of their Eco-design (C23) is medium at 0.464 and ranked 7. In
contrast, (G. Shubham Guptaa, 2019) shows weights of Pollution control, Quality and
Green image are ranked as top four in all criteria are 0.155, 0.137, and 0.117, respectively.
From results of (Bali, Kose and Gumus, 2013), their Green product criteria ranked in the
middle as the same as our study with weight of Green products (C21) is 0.0373 and it
ranked 13. Our rankings of two Sub-criteria are Environmental management system (C29)
and Resource consumption (C210) in Environmental (C2) are completely opposite, weight
of C29 is relatively high at 0.0384 and weight of C210 is restively low at 0.0253. In
contrast, Environmental management system and Resource consumption are required at
high level.
4.3. Fuzzy TOPSIS for Ranking
After the determination of the green supplier criteria, each of managers is asked to
conduct a pairwise comparison with regard to the different criteria using the fuzzy
linguistic assessment variables (see Table 4.15 for these variables).
Fuzzy number Linguistic Triangular fuzzy
scale 𝑀 = (𝑙, 𝑚, 𝑢)
1 Equal (1,1,1)
2 Weak advantage (1,2,3)
3 Not bad (2,3,4)
4 Preferable (3,4,5)
5 Good (4,5,6)
6 Fairly good (5,6,7)
7 Very good (6,7,8)
8 Absolute (7,8,9)
9 Perfect (8,9,10)
Table 4.15. Linguistic Variables for The Ratings
A linguistic rating set of S was used to express the opinions of the managers, where
S = (E, WA, NB, PR, G, FG, VG, A, PE).

84
Step 2: Table 4.16 gives the integrated suitability ratings of four green suppliers (𝐴1, 𝐴2,
𝐴3, 𝐴4 and A5) using Eq. (14).

85
W1 W2 W3 W4 W5 W6 W7 W8 W9 W10
0.051
0.096
0.177
0.052
0.098
0.180
0.060
0.113
0.209
0.052
0.098
0.181
0.067
0.123
0.219
0.039
0.070
0.130
0.039
0.071
0.132
0.051
0.093
0.170
0.050
0.092
0.164
0.043
0.078
0.148
c1 c2 c3 c4 c5 c6 c7 c8 c9 c10
A1
6.167
8.417
10.250
1.000
2.667
4.917
1.167
2.667
5.000
2.833
5.000
7.417
6.167
8.417
10.250
1.167
2.667
5.000
3.083
5.417
7.833
1.000
2.667
4.917
2.833
5.000
7.417
5.250
7.750
10.000
A2
1.583
3.417
5.750
4.500
6.917
9.250
6.750
9.083
10.833
6.250
8.667
10.583
1.583
3.417
5.750
6.750
9.083
10.833
1.250
2.833
5.167
4.500
6.917
9.250
1.000
2.667
4.917
1.500
3.417
5.750
A3
3.083
5.417
7.833
3.667
6.083
8.333
3.250
5.583
8.000
3.333
5.750
8.083
3.333
5.750
8.083
3.250
5.583
8.000
5.750
8.250
10.250
4.500
6.917
9.250
4.500
6.917
9.250
3.167
5.417
7.833
A4
1.250
2.833
5.167
7.917
10.167
11.667
7.083
9.417
11.167
8.083
10.250
11.667
8.083
10.250
11.667
8.083
10.250
11.667
2.833
5.000
7.417
8.083
10.250
11.667
8.083
10.250
11.667
7.750
10.000
11.583
A5
5.750
8.250
10.250
2.833
5.083
7.583
1.500
3.333
5.917
1.167
2.917
5.250
1.167
2.917
5.250
1.167
2.917
5.250
6.250
8.667
10.583
1.167
2.917
5.250
1.167
2.917
5.250
1.667
3.167
5.417
W
11
W
12
W
13
W
14
W
15
W
16
W
17
W
18
W
19
W
20
0.
03
8
0.
06
9
0.
13
2
0.
05
6
0.
10
3
0.
19
1
0.
05
1
0.
09
4
0.
17
4
0.
06
9
0.
12
8
0.
23
0
0.
05
5
0.
10
1
0.
18
6
0.
08
3
0.
15
0
0.
26
5
0.
03
9
0.
06
9
0.
12
8
0.
04
0
0.
07
1
0.
13
2
0.
05
3
0.
09
6
0.
17
2
0.
06
0
0.
10
8
0.
19
0
c1
1
C
21
C
22
C
23
C
24
C
25
C
26
C
27
C
28
C
29
A1
0.
83
3
2.
33
3
4.
58
3
1.
00
0
2.
41
7
4.
58
3
5.
25
0
7.
75
0
10
.0
00
3.
41
7
5.
75
0
8.
16
7
2.
83
3
5.
00
0
7.
41
7
6.
16
7
8.
41
7
10
.2
50
2.
83
3
5.
00
0
7.
41
7
0.
83
3
2.
33
3
4.
58
3
3.
08
3
5.
41
7
7.
83
3
1.
00
0
2.
66
7
4.
91
7
A2
6.
91
7
9.
25
0
11
.0
00
0.
75
0
2.
00
0
4.
00
0
1.
50
0
3.
41
7
5.
75
0
1.
08
3
2.
41
7
4.
50
0
6.
25
0
8.
66
7
10
.5
83
1.
58
3
3.
41
7
5.
75
0
1.
00
0
2.
66
7
4.
91
7
6.
91
7
9.
25
0
11
.0
00
1.
25
0
2.
83
3
5.
16
7
4.
50
0
6.
91
7
9.
25
0
A3
2.
50
0
4.
66
7
7.
08
3
2.
83
3
5.
08
3
7.
58
3
3.
16
7
5.
41
7
7.
83
3
1.
83
3
3.
75
0
6.
08
3
6.
75
0
9.
08
3
10
.8
33
1.
00
0
2.
66
7
4.
91
7
4.
50
0
6.
91
7
9.
25
0
2.
50
0
4.
66
7
7.
08
3
5.
75
0
8.
25
0
10
.2
50
3.
66
7
6.
08
3
8.
33
3
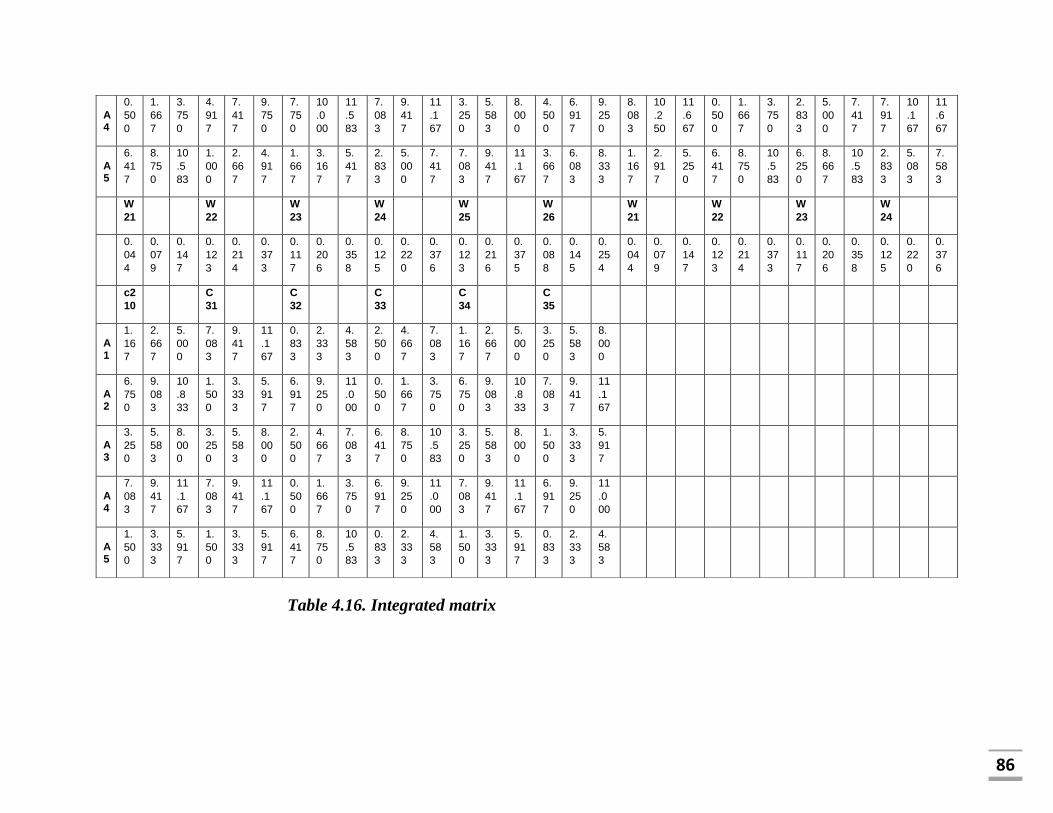
86
Table 4.16. Integrated matrix
A4
0.
50
0
1.
66
7
3.
75
0
4.
91
7
7.
41
7
9.
75
0
7.
75
0
10
.0
00
11
.5
83
7.
08
3
9.
41
7
11
.1
67
3.
25
0
5.
58
3
8.
00
0
4.
50
0
6.
91
7
9.
25
0
8.
08
3
10
.2
50
11
.6
67
0.
50
0
1.
66
7
3.
75
0
2.
83
3
5.
00
0
7.
41
7
7.
91
7
10
.1
67
11
.6
67
A5
6.
41
7
8.
75
0
10
.5
83
1.
00
0
2.
66
7
4.
91
7
1.
66
7
3.
16
7
5.
41
7
2.
83
3
5.
00
0
7.
41
7
7.
08
3
9.
41
7
11
.1
67
3.
66
7
6.
08
3
8.
33
3
1.
16
7
2.
91
7
5.
25
0
6.
41
7
8.
75
0
10
.5
83
6.
25
0
8.
66
7
10
.5
83
2.
83
3
5.
08
3
7.
58
3
W
21
W
22
W
23
W
24
W
25
W
26
W
21
W
22
W
23
W
24
0.
04
4
0.
07
9
0.
14
7
0.
12
3
0.
21
4
0.
37
3
0.
11
7
0.
20
6
0.
35
8
0.
12
5
0.
22
0
0.
37
6
0.
12
3
0.
21
6
0.
37
5
0.
08
8
0.
14
5
0.
25
4
0.
04
4
0.
07
9
0.
14
7
0.
12
3
0.
21
4
0.
37
3
0.
11
7
0.
20
6
0.
35
8
0.
12
5
0.
22
0
0.
37
6
c2
10
C
31
C
32
C
33
C
34
C
35
A1
1.
16
7
2.
66
7
5.
00
0
7.
08
3
9.
41
7
11
.1
67
0.
83
3
2.
33
3
4.
58
3
2.
50
0
4.
66
7
7.
08
3
1.
16
7
2.
66
7
5.
00
0
3.
25
0
5.
58
3
8.
00
0
A2
6.
75
0
9.
08
3
10
.8
33
1.
50
0
3.
33
3
5.
91
7
6.
91
7
9.
25
0
11
.0
00
0.
50
0
1.
66
7
3.
75
0
6.
75
0
9.
08
3
10
.8
33
7.
08
3
9.
41
7
11
.1
67
A3
3.
25
0
5.
58
3
8.
00
0
3.
25
0
5.
58
3
8.
00
0
2.
50
0
4.
66
7
7.
08
3
6.
41
7
8.
75
0
10
.5
83
3.
25
0
5.
58
3
8.
00
0
1.
50
0
3.
33
3
5.
91
7
A4
7.
08
3
9.
41
7
11
.1
67
7.
08
3
9.
41
7
11
.1
67
0.
50
0
1.
66
7
3.
75
0
6.
91
7
9.
25
0
11
.0
00
7.
08
3
9.
41
7
11
.1
67
6.
91
7
9.
25
0
11
.0
00
A5
1.
50
0
3.
33
3
5.
91
7
1.
50
0
3.
33
3
5.
91
7
6.
41
7
8.
75
0
10
.5
83
0.
83
3
2.
33
3
4.
58
3
1.
50
0
3.
33
3
5.
91
7
0.
83
3
2.
33
3
4.
58
3
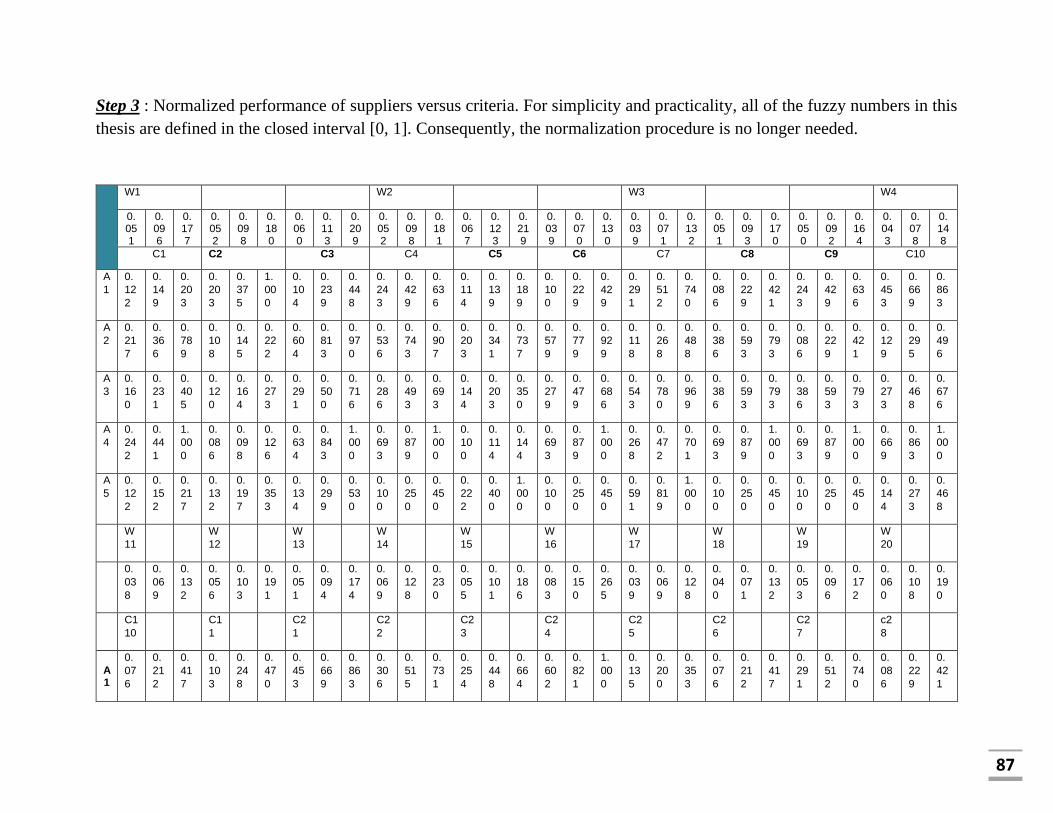
87
Step 3 : Normalized performance of suppliers versus criteria. For simplicity and practicality, all of the fuzzy numbers in this
thesis are defined in the closed interval [0, 1]. Consequently, the normalization procedure is no longer needed.
W1
W2
W3
W4
0.051
0.096
0.177
0.052
0.098
0.180
0.060
0.113
0.209
0.052
0.098
0.181
0.067
0.123
0.219
0.039
0.070
0.130
0.039
0.071
0.132
0.051
0.093
0.170
0.050
0.092
0.164
0.043
0.078
0.148
C1 C2 C3 C4 C5 C6 C7 C8 C9 C10
A
1
0.
12
2
0.
14
9
0.
20
3
0.
20
3
0.
37
5
1.
00
0
0.
10
4
0.
23
9
0.
44
8
0.
24
3
0.
42
9
0.
63
6
0.
11
4
0.
13
9
0.
18
9
0.
10
0
0.
22
9
0.
42
9
0.
29
1
0.
51
2
0.
74
0
0.
08
6
0.
22
9
0.
42
1
0.
24
3
0.
42
9
0.
63
6
0.
45
3
0.
66
9
0.
86
3
A
2
0.
21
7
0.
36
6
0.
78
9
0.
10
8
0.
14
5
0.
22
2
0.
60
4
0.
81
3
0.
97
0
0.
53
6
0.
74
3
0.
90
7
0.
20
3
0.
34
1
0.
73
7
0.
57
9
0.
77
9
0.
92
9
0.
11
8
0.
26
8
0.
48
8
0.
38
6
0.
59
3
0.
79
3
0.
08
6
0.
22
9
0.
42
1
0.
12
9
0.
29
5
0.
49
6
A
3
0.
16
0
0.
23
1
0.
40
5
0.
12
0
0.
16
4
0.
27
3
0.
29
1
0.
50
0
0.
71
6
0.
28
6
0.
49
3
0.
69
3
0.
14
4
0.
20
3
0.
35
0
0.
27
9
0.
47
9
0.
68
6
0.
54
3
0.
78
0
0.
96
9
0.
38
6
0.
59
3
0.
79
3
0.
38
6
0.
59
3
0.
79
3
0.
27
3
0.
46
8
0.
67
6
A
4
0.
24
2
0.
44
1
1.
00
0
0.
08
6
0.
09
8
0.
12
6
0.
63
4
0.
84
3
1.
00
0
0.
69
3
0.
87
9
1.
00
0
0.
10
0
0.
11
4
0.
14
4
0.
69
3
0.
87
9
1.
00
0
0.
26
8
0.
47
2
0.
70
1
0.
69
3
0.
87
9
1.
00
0
0.
69
3
0.
87
9
1.
00
0
0.
66
9
0.
86
3
1.
00
0
A
5
0.
12
2
0.
15
2
0.
21
7
0.
13
2
0.
19
7
0.
35
3
0.
13
4
0.
29
9
0.
53
0
0.
10
0
0.
25
0
0.
45
0
0.
22
2
0.
40
0
1.
00
0
0.
10
0
0.
25
0
0.
45
0
0.
59
1
0.
81
9
1.
00
0
0.
10
0
0.
25
0
0.
45
0
0.
10
0
0.
25
0
0.
45
0
0.
14
4
0.
27
3
0.
46
8
W
11
W
12
W
13
W
14
W
15
W
16
W
17
W
18
W
19
W
20
0.
03
8
0.
06
9
0.
13
2
0.
05
6
0.
10
3
0.
19
1
0.
05
1
0.
09
4
0.
17
4
0.
06
9
0.
12
8
0.
23
0
0.
05
5
0.
10
1
0.
18
6
0.
08
3
0.
15
0
0.
26
5
0.
03
9
0.
06
9
0.
12
8
0.
04
0
0.
07
1
0.
13
2
0.
05
3
0.
09
6
0.
17
2
0.
06
0
0.
10
8
0.
19
0
C1
10
C1
1
C2
1
C2
2
C2
3
C2
4
C2
5
C2
6
C2
7
c2
8
A1
0.
07
6
0.
21
2
0.
41
7
0.
10
3
0.
24
8
0.
47
0
0.
45
3
0.
66
9
0.
86
3
0.
30
6
0.
51
5
0.
73
1
0.
25
4
0.
44
8
0.
66
4
0.
60
2
0.
82
1
1.
00
0
0.
13
5
0.
20
0
0.
35
3
0.
07
6
0.
21
2
0.
41
7
0.
29
1
0.
51
2
0.
74
0
0.
08
6
0.
22
9
0.
42
1

88
A2
0.
62
9
0.
84
1
1.
00
0
0.
07
7
0.
20
5
0.
41
0
0.
12
9
0.
29
5
0.
49
6
0.
09
7
0.
21
6
0.
40
3
0.
56
0
0.
77
6
0.
94
8
0.
15
4
0.
33
3
0.
56
1
0.
20
3
0.
37
5
1.
00
0
0.
62
9
0.
84
1
1.
00
0
0.
11
8
0.
26
8
0.
48
8
0.
38
6
0.
59
3
0.
79
3
A3
0.
22
7
0.
42
4
0.
64
4
0.
29
1
0.
52
1
0.
77
8
0.
27
3
0.
46
8
0.
67
6
0.
16
4
0.
33
6
0.
54
5
0.
60
4
0.
81
3
0.
97
0
0.
09
8
0.
26
0
0.
48
0
0.
10
8
0.
14
5
0.
22
2
0.
22
7
0.
42
4
0.
64
4
0.
54
3
0.
78
0
0.
96
9
0.
31
4
0.
52
1
0.
71
4
A4
0.
04
5
0.
15
2
0.
34
1
0.
50
4
0.
76
1
1.
00
0
0.
66
9
0.
86
3
1.
00
0
0.
63
4
0.
84
3
1.
00
0
0.
29
1
0.
50
0
0.
71
6
0.
43
9
0.
67
5
0.
90
2
0.
08
6
0.
09
8
0.
12
4
0.
04
5
0.
15
2
0.
34
1
0.
26
8
0.
47
2
0.
70
1
0.
67
9
0.
87
1
1.
00
0
A5
0.
58
3
0.
79
5
0.
96
2
0.
10
3
0.
27
4
0.
50
4
0.
14
4
0.
27
3
0.
46
8
0.
25
4
0.
44
8
0.
66
4
0.
63
4
0.
84
3
1.
00
0
0.
35
8
0.
59
3
0.
81
3
0.
19
0
0.
34
3
0.
85
7
0.
58
3
0.
79
5
0.
96
2
0.
59
1
0.
81
9
1.
00
0
0.
24
3
0.
43
6
0.
65
0
W
21
W
22
W
23
W
24
W
25
W
26
W
21
W
22
W
23
W
24
0.
04
4
0.
07
9
0.
14
7
0.
12
3
0.
21
4
0.
37
3
0.
11
7
0.
20
6
0.
35
8
0.
12
5
0.
22
0
0.
37
6
0.
12
3
0.
21
6
0.
37
5
0.
08
8
0.
14
5
0.
25
4
0.
04
4
0.
07
9
0.
14
7
0.
12
3
0.
21
4
0.
37
3
0.
11
7
0.
20
6
0.
35
8
0.
12
5
0.
22
0
0.
37
6
c2
9
c2
10
C3
1
C3
2
C3
3
C3
4
C3
5
A1
0.
10
4
0.
23
9
0.
44
8
0.
63
4
0.
84
3
1.
00
0
0.
07
6
0.
21
2
0.
41
7
0.
22
7
0.
42
4
0.
64
4
0.
10
4
0.
23
9
0.
44
8
0.
29
1
0.
50
0
0.
71
6
0.
10
4
0.
23
9
0.
44
8
A2
0.
60
4
0.
81
3
0.
97
0
0.
13
4
0.
29
9
0.
53
0
0.
62
9
0.
84
1
1.
00
0
0.
04
5
0.
15
2
0.
34
1
0.
60
4
0.
81
3
0.
97
0
0.
63
4
0.
84
3
1.
00
0
0.
60
4
0.
81
3
0.
97
0
A3
0.
29
1
0.
50
0
0.
71
6
0.
29
1
0.
50
0
0.
71
6
0.
22
7
0.
42
4
0.
64
4
0.
58
3
0.
79
5
0.
96
2
0.
29
1
0.
50
0
0.
71
6
0.
13
4
0.
29
9
0.
53
0
0.
29
1
0.
50
0
0.
71
6
A4
0.
63
4
0.
84
3
1.
00
0
0.
63
4
0.
84
3
1.
00
0
0.
04
5
0.
15
2
0.
34
1
0.
62
9
0.
84
1
1.
00
0
0.
63
4
0.
84
3
1.
00
0
0.
61
9
0.
82
8
0.
98
5
0.
63
4
0.
84
3
1.
00
0
A5
0.
13
4
0.
29
9
0.
53
0
0.
13
4
0.
29
9
0.
53
0
0.
58
3
0.
79
5
0.
96
2
0.
07
6
0.
21
2
0.
41
7
0.
13
4
0.
29
9
0.
53
0
0.
07
5
0.
20
9
0.
41
0
0.
13
4
0.
29
9
0.
53
0
Table 4.17. Normalized matrix

89
Step 3: Calculate normalized weighted rating. Using Eq. (17), the normalized weighted ratings 𝐺𝑖 can be obtained as shown
in Table 4.18.
C1 C2 C3 C4 C5 C6 C7 C8 C9 C10
A1
0.006
0.014
0.036
0.011
0.037
0.180
0.006
0.027
0.094
0.013
0.042
0.115
0.008
0.017
0.041
0.004
0.016
0.056
0.011
0.036
0.098
0.004
0.021
0.072
0.012
0.039
0.104
0.019
0.052
0.128
A2
0.011
0.035
0.140
0.006
0.014
0.040
0.036
0.092
0.203
0.028
0.073
0.164
0.014
0.042
0.161
0.022
0.054
0.121
0.005
0.019
0.065
0.020
0.055
0.135
0.004
0.021
0.069
0.006
0.023
0.074
A3
0.008
0.022
0.072
0.006
0.016
0.049
0.017
0.057
0.150
0.015
0.048
0.125
0.010
0.025
0.076
0.011
0.033
0.089
0.021
0.055
0.128
0.020
0.055
0.135
0.019
0.054
0.130
0.012
0.037
0.100
A4
0.012
0.042
0.177
0.004
0.010
0.023
0.038
0.095
0.209
0.036
0.086
0.181
0.007
0.014
0.032
0.027
0.061
0.130
0.010
0.033
0.093
0.035
0.082
0.170
0.035
0.081
0.164
0.029
0.068
0.148
A5
0.006
0.014
0.039
0.007
0.019
0.063
0.008
0.034
0.111
0.005
0.024
0.081
0.015
0.049
0.219
0.004
0.017
0.059
0.023
0.058
0.132
0.005
0.023
0.076
0.005
0.023
0.074
0.006
0.021
0.069
C1
1
C2
1
C2
2
C2
3
C2
4
C2
5
C2
6
C2
7
C2
8
C2
9
A1
0.
00
3
0.
01
5
0.
05
5
0.
00
6
0.
02
6
0.
09
0
0.
02
3
0.
06
3
0.
15
0
0.
02
1
0.
06
6
0.
16
8
0.
01
4
0.
04
5
0.
12
4
0.
05
0
0.
12
3
0.
26
5
0.
00
5
0.
01
4
0.
04
5
0.
00
3
0.
01
5
0.
05
5
0.
01
6
0.
04
9
0.
12
8
0.
00
5
0.
02
5
0.
08
0
A2
0.
02
4
0.
05
8
0.
13
2
0.
00
4
0.
02
1
0.
07
8
0.
00
7
0.
02
8
0.
08
6
0.
00
7
0.
02
8
0.
09
3
0.
03
1
0.
07
9
0.
17
7
0.
01
3
0.
05
0
0.
14
9
0.
00
8
0.
02
6
0.
12
8
0.
02
5
0.
06
0
0.
13
2
0.
00
6
0.
02
6
0.
08
4
0.
02
3
0.
06
4
0.
15
1
A3
0.
00
9
0.
02
9
0.
08
5
0.
01
6
0.
05
4
0.
14
9
0.
01
4
0.
04
4
0.
11
8
0.
01
1
0.
04
3
0.
12
5
0.
03
3
0.
08
2
0.
18
1
0.
00
8
0.
03
9
0.
12
7
0.
00
4
0.
01
0
0.
02
8
0.
00
9
0.
03
0
0.
08
5
0.
02
9
0.
07
5
0.
16
7
0.
01
9
0.
05
6
0.
13
6
A4
0.
00
2
0.
01
1
0.
04
5
0.
02
8
0.
07
9
0.
19
1
0.
03
4
0.
08
2
0.
17
4
0.
04
4
0.
10
8
0.
23
0
0.
01
6
0.
05
1
0.
13
3
0.
03
7
0.
10
1
0.
24
0
0.
00
3
0.
00
7
0.
01
6
0.
00
2
0.
01
1
0.
04
5
0.
01
4
0.
04
6
0.
12
1
0.
04
0
0.
09
4
0.
19
0
A5
0.
02
2
0.
05
5
0.
12
7
0.
00
6
0.
02
8
0.
09
6
0.
00
7
0.
02
6
0.
08
1
0.
01
7
0.
05
7
0.
15
3
0.
03
5
0.
08
5
0.
18
6
0.
03
0
0.
08
9
0.
21
6
0.
00
7
0.
02
4
0.
10
9
0.
02
3
0.
05
6
0.
12
7
0.
03
2
0.
07
9
0.
17
2
0.
01
4
0.
04
7
0.
12
4
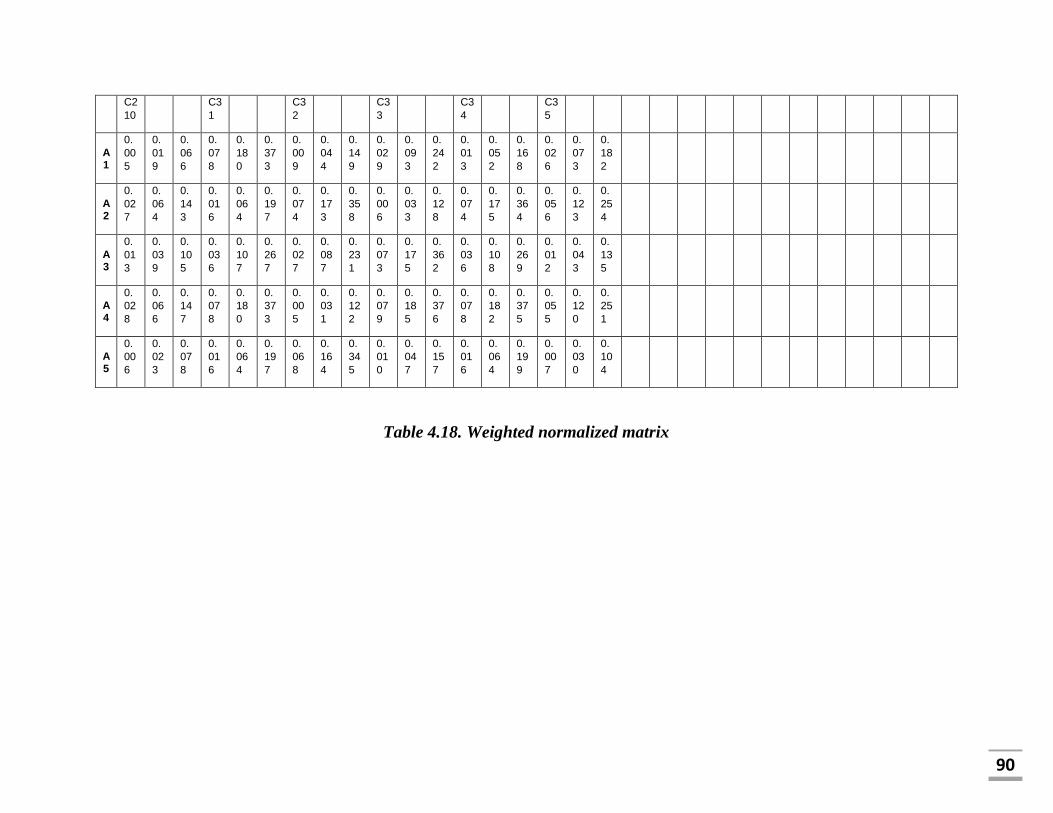
90
C2
10
C3
1
C3
2
C3
3
C3
4
C3
5
A1
0.
00
5
0.
01
9
0.
06
6
0.
07
8
0.
18
0
0.
37
3
0.
00
9
0.
04
4
0.
14
9
0.
02
9
0.
09
3
0.
24
2
0.
01
3
0.
05
2
0.
16
8
0.
02
6
0.
07
3
0.
18
2
A2
0.
02
7
0.
06
4
0.
14
3
0.
01
6
0.
06
4
0.
19
7
0.
07
4
0.
17
3
0.
35
8
0.
00
6
0.
03
3
0.
12
8
0.
07
4
0.
17
5
0.
36
4
0.
05
6
0.
12
3
0.
25
4
A3
0.
01
3
0.
03
9
0.
10
5
0.
03
6
0.
10
7
0.
26
7
0.
02
7
0.
08
7
0.
23
1
0.
07
3
0.
17
5
0.
36
2
0.
03
6
0.
10
8
0.
26
9
0.
01
2
0.
04
3
0.
13
5
A4
0.
02
8
0.
06
6
0.
14
7
0.
07
8
0.
18
0
0.
37
3
0.
00
5
0.
03
1
0.
12
2
0.
07
9
0.
18
5
0.
37
6
0.
07
8
0.
18
2
0.
37
5
0.
05
5
0.
12
0
0.
25
1
A5
0.
00
6
0.
02
3
0.
07
8
0.
01
6
0.
06
4
0.
19
7
0.
06
8
0.
16
4
0.
34
5
0.
01
0
0.
04
7
0.
15
7
0.
01
6
0.
06
4
0.
19
9
0.
00
7
0.
03
0
0.
10
4
Table 4.18. Weighted normalized matrix
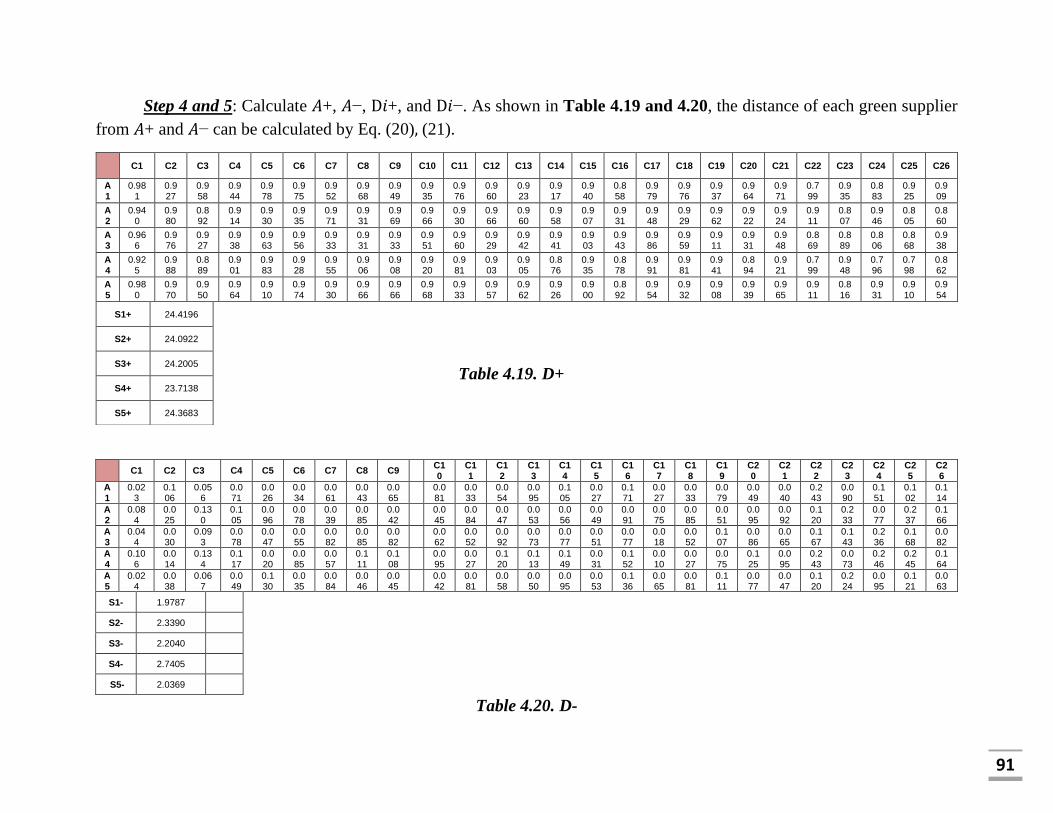
91
Step 4 and 5: Calculate 𝐴+, 𝐴−, D𝑖+, and D𝑖−. As shown in Table 4.19 and 4.20, the distance of each green supplier
from 𝐴+ and 𝐴− can be calculated by Eq. (20), (21).
C1 C2 C3 C4 C5 C6 C7 C8 C9 C1
0 C11
C12
C13
C14
C15
C16
C17
C18
C19
C20
C21
C22
C23
C24
C25
C26
A1
0.023
0.106
0.056
0.071
0.026
0.034
0.061
0.043
0.065
0.081
0.033
0.054
0.095
0.105
0.027
0.171
0.027
0.033
0.079
0.049
0.040
0.243
0.090
0.151
0.102
0.114
A2
0.084
0.025
0.130
0.105
0.096
0.078
0.039
0.085
0.042
0.045
0.084
0.047
0.053
0.056
0.049
0.091
0.075
0.085
0.051
0.095
0.092
0.120
0.233
0.077
0.237
0.166
A3
0.044
0.030
0.093
0.078
0.047
0.055
0.082
0.085
0.082
0.062
0.052
0.092
0.073
0.077
0.051
0.077
0.018
0.052
0.107
0.086
0.065
0.167
0.143
0.236
0.168
0.082
A4
0.106
0.014
0.134
0.117
0.020
0.085
0.057
0.111
0.108
0.095
0.027
0.120
0.113
0.149
0.031
0.152
0.010
0.027
0.075
0.125
0.095
0.243
0.073
0.246
0.245
0.164
A5
0.024
0.038
0.067
0.049
0.130
0.035
0.084
0.046
0.045
0.042
0.081
0.058
0.050
0.095
0.053
0.136
0.065
0.081
0.111
0.077
0.047
0.120
0.224
0.095
0.121
0.063
S1- 1.9787
S2- 2.3390
S3- 2.2040
S4- 2.7405
S5- 2.0369
Table 4.20. D-
C1 C2 C3 C4 C5 C6 C7 C8 C9 C10 C11 C12 C13 C14 C15 C16 C17 C18 C19 C20 C21 C22 C23 C24 C25 C26
A1
0.981
0.927
0.958
0.944
0.978
0.975
0.952
0.968
0.949
0.935
0.976
0.960
0.923
0.917
0.940
0.858
0.979
0.976
0.937
0.964
0.971
0.799
0.935
0.883
0.925
0.909
A2
0.940
0.980
0.892
0.914
0.930
0.935
0.971
0.931
0.969
0.966
0.930
0.966
0.960
0.958
0.907
0.931
0.948
0.929
0.962
0.922
0.924
0.911
0.807
0.946
0.805
0.860
A3
0.966
0.976
0.927
0.938
0.963
0.956
0.933
0.931
0.933
0.951
0.960
0.929
0.942
0.941
0.903
0.943
0.986
0.959
0.911
0.931
0.948
0.869
0.889
0.806
0.868
0.938
A4
0.925
0.988
0.889
0.901
0.983
0.928
0.955
0.906
0.908
0.920
0.981
0.903
0.905
0.876
0.935
0.878
0.991
0.981
0.941
0.894
0.921
0.799
0.948
0.796
0.798
0.862
A5
0.980
0.970
0.950
0.964
0.910
0.974
0.930
0.966
0.966
0.968
0.933
0.957
0.962
0.926
0.900
0.892
0.954
0.932
0.908
0.939
0.965
0.911
0.816
0.931
0.910
0.954
S1+ 24.4196
S2+ 24.0922
S3+ 24.2005
S4+ 23.7138
S5+ 24.3683
Table 4.19. D+

92
Step 6: Obtain the closeness coefficient. The closeness coefficients of green suppliers can
be calculated by Eq. (22), as shown in Table 4.21. Therefore, the ranking order of the five
green suppliers is 𝐴4 > 𝐴2 > 𝐴3 > 𝐴5 > A1. Consequently, the best green supplier is 𝐴4.
Table 4.21. Closeness coefficient of alternatives
As can be seen in Table 4.21, the rank of green suppliers based on the weights of their
evaluation criteria are determined. Thus, this table can not only show the best green
supplier, but also help to analyze the suppliers that fail to meet the specifications of the
case business. Table 4.21 demonstrate supplier A4 is the best choice, supplier A2, A3,
A5 are respectively and the last is supplier 5. In general, supplier A4 is the most suitable
when compare with sub-criteria are proposed.
A1 0.0750 5
A2 0.0885 2
A3 0.0835 3
A4 0.1036 1
A5 0.0771 4
Rank of Alternatives
0.0750
0.0885
0.0835
0.1036
0.0771

93
CHAPTER 5: CONCLUSIONS AND IMPLICATIONS
5.1. Conclusions
Green-oriented cooperation in every aspects of the supply chain has become a
leading component as global awareness of environmental sustainability grows. Since
environmental sustainability and sustainable growth are becoming increasingly important
in different industries, a successful green supply selection strategy will help a business
reduce environmental risks while still increasing its competitiveness. For supplier
selection, a variety of individual and integrated approaches have been suggested. Many
sets of criteria have since been developed to optimize this procedure. While there are many
studies that consider the supplier selection, there are just a limited number that examine at
environmental issues. The lack of awareness issue in the dispersed parameters assessing
green-oriented supplier selection was supported by a study of the literature. As a result, the
presented thesis includes a productive attempt to perform a systematic and reliable
bibliometric study for green-oriented supplier selection.
This thesis suggests a novel approach for managers to select suppliers in a
heterogeneous knowledge context based on the MCDM model. The evaluation values of
candidate suppliers were defined in this model as economic, social and environmental with
each category of information representing a different criterion. Then, to rank the candidate
suppliers, the classic Fuzzy AHP and Fuzzy TOPSIS process was generalized and paired
with the optimizing consensus approach. An empirical example from the automotive
industry was presented, along with a comparative study with the extent methods, to show
the utility of our proposed green supplier selection model. The results indicate that the
proposed model's underlying concept is appropriate to managers and decision-makers, and
that it is more suited to represent decision features and more in line with expert expectations
in the real-world sustainable supplier selection process.
Various assessment criteria were selected from the literature and after consulting
with industry experts. By combining the expert's inputs, aggregated pair-wise comparison
matrices were developed, from which weights were calculated using Chang's extended
form of Fuzzy AHP procedure. Cost, green technology, health and safety were the
assessment criteria that earned the highest weight priority in this study, and were later used
as inputs for the Fuzzy TOPSIS in order to pick the possible supplier. Table 4.21
summarizes the empirical results from the case study using the proposed green supplier
selection models. The priority values of the five suppliers considered, as well as their
respective rankings, are presented in these results. With a priority value of 0.1036, Supplier

94
A4 was rated as the top supplier. A2, A3, A5, and A1 are the next suppliers, in that order.
Despite the fact that A4 was chosen as the best supplier among the candidates and is
recommended for contracting by the automaker, the supplier received low ratings on some
evaluation criteria. The consistency test was also performed for the purpose to check the
consistency of the expert’s inputs. Organizations will use the results of the supplier
assessment to boost the efficiency of their suppliers.
For future research, these MCDM models can also handle the complex and
unpredictable environment of future studies by incorporating novel factors causing change.
To assess the general relevance of the findings, this study may be extended to real supply
chain cases in sectors such as electronics, textiles, dairy, and oil & gas. Different decision-
making techniques, such as VIKOR, PROMETHEE, and GRA, may be used in future
studies. The suggested model has a flaw in that subsystems aligned with the criteria are not
taken into account when minimizing complexity. While many efforts have been made to
select green suppliers, keeping the environment in mind remains a challenge. In addition,
future studies will be needed to determine how to assign orders to the model's prospective
green suppliers.
5.2. Managerial implications
For both researchers and practitioners in the field of GSCM, this thesis has some
administrative and theoretical implications. The automobile manufacturer may involve
complex post-selection discussions with the chosen supplier to see how certain lower-rated
performance requirements can be improved using the other suppliers as a benchmark. In
addition, the obtained results can be used as a guideline for the organization's supply chain,
meaning that no irrelevant suppliers are permitted to join the supply chain. This would
result in significant resource and expense savings, as well as a reduction in environmental
impacts.
From a theoretical standpoint, the green supplier selection model built in this
research provides the following benefits. First, heterogeneous knowledge is used to handle
the evaluation values on various criteria for different features. This is more appropriate for
complicated green supplier selection functions, and it also helps decision-makers to express
their assessments about the information types that they prefer. Second, to assess the weight
of each decision-maker, a maximizing consensus approach based on an optimization model
is proposed. It will deal with situations where expert weight knowledge is only partially
understood a priori. Third, to rate and select the most desired green provider, an expanded

95
MCDM approach is used. The suggested green supplier selection methods do not
necessitate extensive computations but still provides a fair and reliable solution result. All
of the criteria listed will assist organizations in coping with a range of problems and
strengthening their attempts to produce environmentally sustainable products.
Furthermore, the creation of GSS assessment standards using industry expert responses
and literature is a major benefit of this proposed work. Managers will be able to test the
observation stability using the applied data set.
This research also has practical implications for practitioners. Firstly, it provides
some possible advantages by assisting managers in properly allocating green marketing
behavior. A strategic green marketing dimension appears to be an important component of
a green marketing campaign because it shows top management's long-term engagement
and involvement in environmental strategies. That is, strategic initiatives such as low-
carbon energy investment and R&D-related projects may be considered future priorities in
a green marketing-oriented organization's business strategy. Second, while the thorough
review of green criteria by inspections are crucial to verify that new suppliers comply,
continuous audits are essential to foster GSCM success and collaborative efforts with
legacy suppliers. The role of empowering SC partners in the achievement and success of
GSCM should be understood by focal firms. Third, our findings suggest that Corporate
social responsibility (CSR) could be essential, but the latter demands a distinct strategy due
to the marketing-related tasks involved. In fact, this means that while a CSR policy is
essential, it is not enough to plan and execute a green marketing strategy. This implies that
tactical activities (such as the use of recycled products and green pricing policies) provide
managers with the ability to a) improve their firm's green brand profile in the short-medium
term and b) adjust their green marketing policy in response to external and internal
environmental changes.
5.3. Limitations of this thesis
This study used FAHP and FTOPSIS methods to evaluate and select any green
supplier which is the most suitable based on main criteria and sub-criteria. In those models,
the evaluation based on results of weighting and ranking of different criteria. From
previous research of experts, sub-criteria are presented as an important determinant when
a business select green suppliers. However, there are some limits to this research which
should be discussed in future studies.
Firstly, exact weights are used in this thesis to represent the relative importance and
ranking of criteria. However, weight elicitation may be complicated in some cases, and

96
imprecise data, such as weight intervals, fuzzy weights, or ordinal data, may be involved
in the GSS challenge. In future research, it is proposed that criteria weights be evaluated
using heterogeneous data. Second, in our proposed model, the assessment criteria are
assumed to be independent. We failed to consider the scope for interactions and
relationships between the sub-criteria. This research indicated that there are three main
criteria but the assessment of each criteria and its sub-criteria is desultory. The subjective
reason is AHP method suggests there must not be an excessive amount of 11 criteria.
Future studies should take these considerations into account in order to create a more
competitive green supplier range. The future research should be pursued in the hopes of
applying the proposed methodology to other production and management decision-making
issues, such as product design selection, position selection, office layouts, material
replacement selection, versatile manufacturing processes, etc. As a result, future study
projects would be able to figure out how to integrate the relationships between criteria into
the green supplier selection decision process.
Furthermore, only one instance of the problem is used to demonstrate the developed
green supplier selection model. Future studies may include a numerical experiment with a
large number of cases to confirm the applicability and efficacy of the proposed green
supplier selection method. Third, the psychological behaviors of the decision maker, which
are essential considerations, were taken into account in the proposed process. However,
authors of this thesis could not arrange meeting with more than 12 the high-level executives
of automotive manufacturing companies. To be specific, not as expecting in the beginning
process of conducting interview, authors could only have the chance to interview with 2
experts in the industry, and the others are development engineers, purchasing department,
and team leaders which is not directly involved in the GSS process.
97
REFERENCES
A, M. O. M. J. and Maryam Darvishi, A. O. M. J. (2020) ‘Green supplier selection for the steel
industry using BWM and fuzzy TOPSIS: A case study of Khouzestan steel company.pdf’.
Achillas & Bochtis (2018) Green Supply Chain Management - Charisios Achillas, Dionysis D.
Bochtis, Dimitrios Aidonis, Dimitris Folinas - Google Books. Available at:
https://books.google.com.vn/books?id=FsV1DwAAQBAJ&printsec=frontcover&dq=green+sup
ply+chain+management&hl=en&sa=X&ved=2ahUKEwjXy9_zm_PuAhWmUN4KHSMyCu4Q
6AEwBHoECAYQAg#v=onepage&q=green supply chain management&f=false (Accessed: 1
March 2021).
An, L. (2019) Phát triển ngành công nghiệp ô tô: Những vấn đề đặt ra. Available at:
http://consosukien.vn/phat-trien-nganh-cong-nghiep-o-to-nhung-van-de-dat-ra.htm (Accessed: 1
March 2021).
Bali, O., Kose, E. and Gumus, S. (2013) ‘Green supplier selection based on IFS and GRA’, Grey
Systems: Theory and Application, 3(2), pp. 158–176. doi: 10.1108/gs-04-2013-0007.
Banihabib et al (2016) ‘Fuzzy Hybrid MCDM Model for Ranking the Agricultural Water
Demand Management Strategies in Arid Areas’, Water Resources Management, pp. 495–513.
doi: 10.1007/s11269-016-1544-y.
Bank, V. (2019) ‘Report about Car Sector’, pp. 1–41.
Beamon, B. M. (1999) ‘Designing the green supply chain’, Logistics Information Management,
12(4), pp. 332–342. doi: 10.1108/09576059910284159.
Behrenbeck, K., Thonemann, U. and Merschmann, U. (2007) Soft secrets of supply chain
success, International Commerce Review. doi: 10.1007/s12146-007-0019-8.
Brown, B. J. et al. (1987) ‘Global sustainability: Toward definition’, Environmental
Management, 11(6), pp. 713–719. doi: 10.1007/BF01867238.
Çelikbilek, Y. and Tüysüz, F. (2020) ‘An in-depth review of theory of the TOPSIS method: An
experimental analysis’, Journal of Management Analytics, 7(2), pp. 281–300. doi:
10.1080/23270012.2020.1748528.
Dawei, Z. et al. (2015) ‘Sains Humanika Green Supply Chain Management : A Literature
Review’, researchgate, 2(1997), pp. 15–21.
Er, M. and Firat, S. U. (2016) ‘Sustainability’, (August 2017).
European Commission (2011) Buying green! A handbook on green public procurement.
Available at: https://ec.europa.eu/environment/gpp/pdf/Buying-Green-Handbook-3rd-Edition.pdf
(Accessed: 3 March 2021).
G. Shubham Guptaa, U. S. (2019) ‘Green supplier selection using multi-criterion decision

98
making under fuzzy environment: A case study in automotive industry.pdf’.
Giunipero, R. (2008) ‘A DECADE OF SCM LITERATURE_ PAST, PRESENT ANDFUTURE
IMPLICATIONS.pdf’.
Greenhoot, A. F., & Dowsett, C. J. (2012) ‘An important Tool for Addressing Developmental
Question. (Greenhoot & Dowsett, 2012).pdf’.
Guo, Z. et al. (2017) ‘Green supplier evaluation and selection in apparel manufacturing using a
fuzzy multi-criteria decision-making approach’, Sustainability (Switzerland), 9(4). doi:
10.3390/su9040650.
Ho, J. C. (2009) OPPORTUNITIES IN GREEN SUPPLY CHAIN MANAGEMENT.
Ho, L. W. P., Dickinson, N. M. and Chan, G. Y. S. (2010) ‘Green procurement in the asian
public sector and the Hong Kong private sector’, Natural Resources Forum, 34(1), p. 32. doi:
10.1111/j.1477-8947.2010.01274.x.
Van Hoek, R. I. (1999) ‘From reversed logistics to green supply chains’, Supply Chain
Management, 4(3), pp. 129–134. doi: 10.1108/13598549910279576.
Hsu, C. W. et al. (2013) ‘Using DEMATEL to develop a carbon management model of supplier
selection in green supply chain management’, Journal of Cleaner Production. doi:
10.1016/j.jclepro.2011.09.012.
ICC (2012) Business definition of a ‘green economy’. Available at:
www.iccwbo.org/GreenEconomy (Accessed: 3 March 2021).
Jamil, N., Besar, R. and Sim, H. K. (2013) ‘A Study of Multicriteria Decision Making for
Supplier Selection in Automotive Industry’, Journal of Industrial Engineering, 2013(January
2011), pp. 1–22. doi: 10.1155/2013/841584.
Kabir, S. M. S. (2016) ‘MethodsofDataCollection.pdf’.
King, A. M. et al. (2006) ‘Reducing waste: Repair, recondition, remanufacture or recycle?’,
Sustainable Development, pp. 257–267. doi: 10.1002/sd.271.
Lee, A. H. I. et al. (2009) ‘A green supplier selection model for high-tech industry’, Expert
Systems with Applications, pp. 7917–7927. doi: 10.1016/j.eswa.2008.11.052.
Lee, A. H. I., Chen, W. C. and Chang, C. J. (2008) ‘A fuzzy AHP and BSC approach for
evaluating performance of IT department in the manufacturing industry in Taiwan’, Expert
Systems with Applications, 34(1), pp. 96–107. doi: 10.1016/j.eswa.2006.08.022.
Liao, C. N., Fu, Y. K. and Wu, L. C. (2016) ‘Integrated FAHP, ARAS-F and MSGP methods for
green supplier evaluation and selection’, Technological and Economic Development of Economy,
pp. 651–669. doi: 10.3846/20294913.2015.1072750.
99
Londe, B. J. La and Masters, J. M. (1994) ‘Emerging Logistics Strategies: blueprints for the next
century identifying key logistics strategies’, International Journal of Physical Distribution &
Logistics Management, 24(7), pp. 35–47.
Mark, S. (2009) (PDF) Understanding research philosophies and approaches. Available at:
https://www.researchgate.net/publication/309102603_Understanding_research_philosophies_and
_approaches (Accessed: 19 March 2021).
Marklines.com (2021) News - MarkLines Automotive Industry Portal. Available at:
https://www.marklines.com/en/news?page=0&size=20&keyWord=&nations[]=9&isNewspaper=
false (Accessed: 1 March 2021).
Narasimhan, R. (1998) Environmental Supply Chain Management, The Center... - Google
Scholar. Available at:
https://scholar.google.com/scholar?hl=vi&as_sdt=0%2C5&q=Environmental+Supply+Chain+M
anagement%2C+The+Center+for+Advanced+Purchasing+Studies%2C+Focus+Study&btnG=#d
=gs_cit&u=%2Fscholar%3Fq%3Dinfo%3AP5lh_0xU43QJ%3Ascholar.google.com%2F%26out
put%3Dcite%26scirp%3D0%26hl%3Dvi (Accessed: 3 March 2021).
Nguyen, P. H. et al. (2020) ‘Stock investment of agriculture companies in the Vietnam stock
exchange market: An AHP integrated with GRA-TOPSIS-MOORA approaches’, Journal of
Asian Finance, Economics and Business, 7(7), pp. 113–121. doi:
10.13106/jafeb.2020.vol7.no7.113.
Nydick, R. L. and Hill, R. P. (1992) ‘Using the Analytic Hierarchy Process to Structure the
Supplier Selection Procedure’, International Journal of Purchasing and Materials Management,
28(2), pp. 31–36. doi: 10.1111/j.1745-493x.1992.tb00561.x.
Partovi, F. Y. (1992) ‘Determining What to Benchmark : An Analytic’, International Journal of
Operations & Production Management.
Penfield, P. (2008) Penfield: Sustainability can be a competitive advantage - Google Scholar.
Available at:
https://scholar.google.com/scholar?hl=vi&as_sdt=0,5&cluster=13807749360778290634
(Accessed: 3 March 2021).
Purvis, B., Mao, Y. and Robinson, D. (2019) ‘Three pillars of sustainability: in search of
conceptual origins’, Sustainability Science, 14(3), pp. 681–695. doi: 10.1007/s11625-018-0627-
5.
Ramanathan, R. (2004) AHP Approach - an overview | ScienceDirect Topics. Available at:
https://www.sciencedirect.com/topics/economics-econometrics-and-finance/ahp-approach
(Accessed: 2 March 2021).
Renda, A. et al. (2012) Submitted to the European Commission, DG Environment Centre for
European Policy Studies (CEPS) College of Europe (core team).
Roberts, G. 2021 (2021) Global pandemic sector recovery briefing | Automotive Industry News |
100
just-auto. Available at: https://www.just-auto.com/news/free-to-read-global-pandemic-sector-
recovery-briefing_id197509.aspx (Accessed: 1 March 2021).
Sarkis, J. (2003) ‘A portfolio-based analysis for green supplier management using the analytical
network process’, Supply Chain Management: An International Journal. Available at:
https://www.academia.edu/2808940/A_portfolio_based_analysis_for_green_supplier_manageme
nt_using_the_analytical_network_process (Accessed: 3 March 2021).
Saunders, L. and T. (2009) Research Methods for Business Students. Available at:
https://www.pearson.com/uk/educators/higher-education-educators/product/Saunders-Saunders-
Research-Methods-for-Bu-p-6-6th-Edition/9780273750758.html (Accessed: 19 March 2021).
Scott, D., Hall, C. M. and Gössling, S. (2019) ‘Global tourism vulnerability to climate change’,
Annals of Tourism Research, 77, pp. 49–61. doi: 10.1016/j.annals.2019.05.007.
Sevkli, M. et al. (2007) ‘An application of data envelopment analytic hierarchy process for
supplier selection: A case study of BEKO in Turkey’, International Journal of Production
Research, pp. 1973–2003. doi: 10.1080/00207540600957399.
Si, S. L. et al. (2018) ‘DEMATEL Technique: A Systematic Review of the State-of-the-Art
Literature on Methodologies and Applications’, Mathematical Problems in Engineering,
2018(1). doi: 10.1155/2018/3696457.
Siksnelyte-Butkiene, I., Zavadskas, E. K. and Streimikiene, D. (2020) ‘Multi-criteria decision-
making (MCDM) for the assessment of renewable energy technologies in a household: A
review’, Energies, 13(5). doi: 10.3390/en13051164.
Team, E. (2021) Vietnam sales jump 60% in January | Automotive Industry News | just-auto.
Available at: https://www.just-auto.com/news/vietnam-sales-jump-60-in-january_id200132.aspx
(Accessed: 1 March 2021).
Ting, S. C. and Cho, D. I. (2008) ‘An integrated approach for supplier selection and purchasing
decisions’, Supply Chain Management, 13(2), pp. 116–127. doi: 10.1108/13598540810860958.
UNDESA (2012) A Guidebook to the Green Economy. Issue 2: Exploring green economy
principles. New York: Division for Sustainable Development, Department of Economic and
Social Affairs. Available at: https://sustainabledevelopment.un.org/content/documents/GE
Guidebook.pdf (Accessed: 3 March 2021).
Wang Chen, H. M. et al. (2016) ‘A Fuzzy MCDM Approach for Green Supplier Selection from
the Economic and Environmental Aspects’, Mathematical Problems in Engineering, 2016. doi:
10.1155/2016/8097386.
Yildiz, A. (2019) ‘Green supplier selection using topsis method: a case study from the
automotive supply industry’, Journal of Engineering Research and Applied Science, pp. 1146–
1152.
Zhang, K. & (2019) The Critical Success Factors of Green Supply Chain Management in
101
Emerging ... - Syed Abdul Rehman Khan - Google Books. Available at:
https://books.google.com.vn/books?id=rpneDwAAQBAJ&printsec=frontcover&dq=green+suppl
y+chain+management&hl=en&sa=X&ved=2ahUKEwjXy9_zm_PuAhWmUN4KHSMyCu4Q6
AEwBnoECAcQAg#v=onepage&q=green supply chain management&f=false (Accessed: 1
March 2021).
Zhu, K. J., Jing, Y. and Chang, D. Y. (1999) ‘Discussion on extent analysis method and
applications of fuzzy AHP’, European Journal of Operational Research, 116(2), pp. 450–456.
doi: 10.1016/S0377-2217(98)00331-2.
Zimmer, K., Fröhling, M. and Schultmann, F. (2016) ‘Sustainable supplier management - A
review of models supporting sustainable supplier selection, monitoring and development’,
International Journal of Production Research, 54(5), pp. 1412–1442. doi:
10.1080/00207543.2015.1079340.
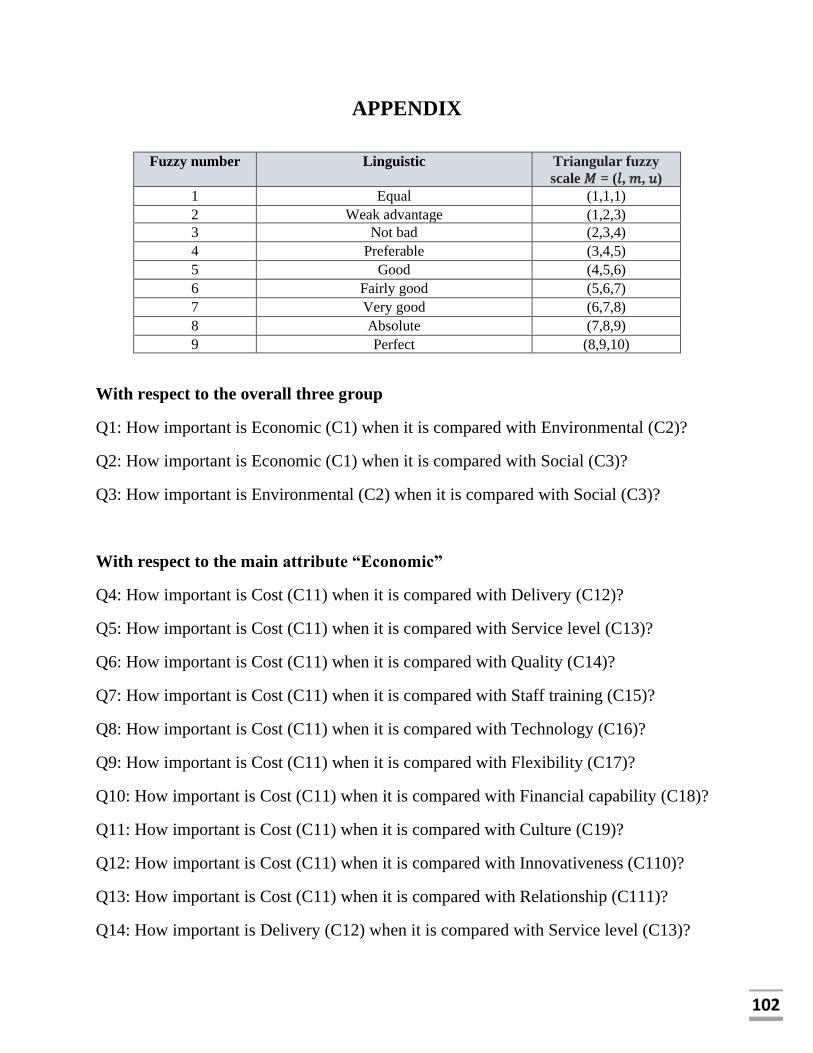
102
APPENDIX
Fuzzy number Linguistic Triangular fuzzy
scale 𝑀 = (𝑙, 𝑚, 𝑢)
1 Equal (1,1,1)
2 Weak advantage (1,2,3)
3 Not bad (2,3,4)
4 Preferable (3,4,5)
5 Good (4,5,6)
6 Fairly good (5,6,7)
7 Very good (6,7,8)
8 Absolute (7,8,9)
9 Perfect (8,9,10)
With respect to the overall three group
Q1: How important is Economic (C1) when it is compared with Environmental (C2)?
Q2: How important is Economic (C1) when it is compared with Social (C3)?
Q3: How important is Environmental (C2) when it is compared with Social (C3)?
With respect to the main attribute “Economic”
Q4: How important is Cost (C11) when it is compared with Delivery (C12)?
Q5: How important is Cost (C11) when it is compared with Service level (C13)?
Q6: How important is Cost (C11) when it is compared with Quality (C14)?
Q7: How important is Cost (C11) when it is compared with Staff training (C15)?
Q8: How important is Cost (C11) when it is compared with Technology (C16)?
Q9: How important is Cost (C11) when it is compared with Flexibility (C17)?
Q10: How important is Cost (C11) when it is compared with Financial capability (C18)?
Q11: How important is Cost (C11) when it is compared with Culture (C19)?
Q12: How important is Cost (C11) when it is compared with Innovativeness (C110)?
Q13: How important is Cost (C11) when it is compared with Relationship (C111)?
Q14: How important is Delivery (C12) when it is compared with Service level (C13)?
103
Q15: How important is Delivery (C12) when it is compared with Quality (C14)?
Q16: How important is Delivery (C12) when it is compared with Staff training (C15)?
Q17: How important is Delivery (C12) when it is compared with Technology (C16)?
Q18: How important is Delivery (C12) when it is compared with Flexibility (C17)?
Q19: How important is Delivery (C12) when it is compared with Financial capability
(C18)?
Q20: How important is Delivery (C12) when it is compared with Cultural (C19)?
Q21: How important is Delivery (C12) when it is compared with Innovativeness (C110)?
Q22: How important is Delivery (C12) when it is compared with Relationship (C111)?
Q23: How important is Service level (C13) when it is compared with Quality (C14)?
Q24: How important is Service level (C13) when it is compared with Staff training (C15)?
Q25: How important is Service level (C13) when it is compared with Technology (C16)?
Q26: How important is Service level (C13) when it is compared with Flexibility (C17)?
Q27: How important is Service level (C13) when it is compared with Financial capability
(C18)?
Q28: How important is Service level (C13) when it is compared with Cultural (C19)?
Q29: How important is Service level (C13) when it is compared with Innovativeness
(C110)?
Q30: How important is Service level (C13) when it is compared with Relationship (C111)?
Q31: How important is Quality (C14) when it is compared with Staff training (C15)?
Q32: How important is Quality (C14) when it is compared with Technology (C16)?
Q33: How important is Quality (C14) when it is compared with Flexibility (C17)?
Q34: How important is Quality (C14) when it is compared with Financial capability (C18)?
Q35: How important is Quality (C14) when it is compared with Cultural (C19)?
Q36: How important is Quality (C14) when it is compared with Innovativeness (C110)?
Q37: How important is Quality (C14) when it is compared with Relationship (C111)?
Q38: How important is Staff training (C15) when it is compared with Technology (C16)?

104
Q39: How important is Staff training (C15) when it is compared with Flexibility (C17)?
Q40: How important is Staff training (C15) when it is compared with Financial capability
(C18)?
Q41: How important is Staff training (C15) when it is compared with Cultural (C19)?
Q42: How important is Staff training (C15) when it is compared with Innovativeness
(C110)?
Q43: How important is Staff training (C15) when it is compared with Relationship (C111)?
Q44: How important is Technology (C16) when it is compared with Flexibility (C17)?
Q45: How important is Technology (C16) when it is compared with Financial capability
(C18)?
Q46: How important is Technology (C16) when it is compared with Cultural (C19)?
Q47: How important is Technology (C16) when it is compared with Innovativeness
(C110)?
Q48: How important is Technology (C16) when it is compared with Relationship (C111)?
Q49: How important is Flexibility (C17) when it is compared with Financial capability
(C18)?
Q50: How important is Flexibility (C17) when it is compared with Cultural (C19)?
Q51: How important is Flexibility (C17) when it is compared with Innovativeness (C110)?
Q52: How important is Flexibility (C17) when it is compared with Relationship (C111)?
Q53: How important is Financial capability (C18) when it is compared with Cultural
(C19)?
Q54: How important is Financial capability (C18) when it is compared with Innovativeness
(C110)?
Q55: How important is Financial capability (C18) when it is compared with Relationship
(C111)?
Q56: How important is Cultural (C19) when it is compared with Innovativeness (C110)?
Q57: How important is Cultural (C19) when it is compared with Relationship (C111)?
105
Q58: How important is Innovativeness (C110) when it is compared with Relationship
(C111)?
With respect to the main attribute “Environmental”
Q59: How important is Green products (C21) when it is compared with Green image
(C22)?
Q60: How important is Green products (C21) when it is compared with Eco – design
(C23)?
Q61: How important is Green products (C21) when it is compared with Management
commitment (C24)?
Q62: How important is Green products (C21) when it is compared with Green technology
(C25)?
Q63: How important is Green products (C21) when it is compared with Recycle (C27)?
Q64: How important is Green products (C21) when it is compared with Re-manufacturing
(C28)?
Q65: How important is Green products (C21) when it is compared with Environmental
management system (C29)?
Q66: How important is Green products (C21) when it is compared with Resource
Consumption (C210)?
Q67: How important is Green image (C22) when it is compared with Eco-design (C23)?
Q68: How important is Green image (C22) when it is compared with Management
commitment (C24)?
Q69: How important is Green image (C22) when it is compared with Green Technology
(C25)?
Q70: How important is Green image (C22) when it is compared with Pollution control
(C26)?
Q71: How important is Green image (C22) when it is compared with Recycle (C27)?

106
Q72: How important is Green image (C22) when it is compared with Re-manufacturing
(C28)?
Q73: How important is Green image (C22) when it is compared with Environmental
management system (C29)?
Q74: How important is Green image (C22) when it is compared with Resource
consumption (C210)?
Q75: How important is Eco - design (C23) when it is compared with Management
commitment (C24)?
Q76: How important is Eco - design (C23) when it is compared with Green technology
(C25)?
Q77: How important is Eco - design (C23) when it is compared with Recycle (C26)?
Q78: How important is Eco - design (C23) when it is compared with Re-manufacturing
(C28)?
Q79: How important is Eco - design (C23) when it is compared with Environmental
management system (C29)?
Q80: How important is Eco - design (C23) when it is compared with Resource consumption
(C210)?
Q81: How important is Management commitment (C24) when it is compared with Green
Technology (C25)?
Q82: How important is Management commitment (C24) when it is compared with Green
Technology (C25)?
Q83: How important is Management commitment (C24) when it is compared with
Pollution control (C26)?
Q84: How important is Management commitment (C24) when it is compared with Recycle
(C27)?
Q85: How important is Management commitment (C24) when it is compared with Re-
manufacturing (C28)?
Q86: How important is Management commitment (C24) when it is compared with
Environmental management system (C29)?

107
Q87: How important is Management commitment (C24) when it is compared with
Resource consumption (C210)?
Q88: How important is Green Technology (C25) when it is compared with Pollution
control (C26)?
Q89: How important is Green Technology (C25) when it is compared with Recycle (C27)?
Q90: How important is Green Technology (C25) when it is compared with Re-
manufacturing (C28)?
Q91: How important is Green Technology (C25) when it is compared with Environmental
management system (C29)?
Q92: How important is Green Technology (C25) when it is compared with Resource
consumption (C210)?
Q93: How important is Pollution control (C26) when it is compared with Recycle (C27)?
Q94: How important is Pollution control (C26) when it is compared with Re-manufacturing
(C28)?
Q95: How important is Pollution control (C26) when it is compared with Environmental
management system (C29)?
Q96: How important is Pollution control (C26) when it is compared with Resource
consumption (C210)?
Q97: How important is Recycle (C27) when it is compared with Re-manufacturing (C28)?
Q98: How important is Recycle (C27) when it is compared with Environmental
management system (C29)?
Q99: How important is Recycle (C27) when it is compared with Resource consumption
(C210)?
Q100: How important is Re-manufacturing (C28) when it is compared with Environmental
management system (C29)?
Q101: How important is Re-manufacturing (C28) when it is compared with Resource
consumption (C210)?
Q102: How important is Environmental management system (C29) when it is compared
with Resource consumption (C210)?
108
With respect to the main attribute “Social”
Q103: How important is Human resource management (C31) when it is compared with
Corporate social responsibility (C32)?
Q104: How important is Human resource management (C31) when it is compared with
Health and safety (C33)?
Q105: How important is Human resource management (C31) when it is compared with
Human right issues (C34)?
Q106: How important is Human resource management (C31) when it is compared with
Relationship with stakeholders (C35)?
Q107: How important is Corporate social responsibility (C32) when it is compared with
Health and safety (C33)?
Q108: How important is Corporate social responsibility (C32) when it is compared with
Human right issues (C34)?
Q109: How important is Corporate social responsibility (C32) when it is compared with
Relationship with stakeholders (C35)?
Q110: How important is Health and safety (C33) when it is compared with Human right
issues (C34)?
Q111: How important is Health and safety (C33) when it is compared with Relationship
with stakeholders (C35)?
Q112: How important is Human right issues (C34) when it is compared with Relationship
with stakeholders (C35)?