Analytics: Moving From Great Promise to Tangible Success Workbook University of Maryland University...
37
Analytics: Moving From Great Promise to Tangible Success Workbook University of Maryland University College July 21-23, 2014 Dr. Linda L. Baer Dr. Donald Norris
-
Upload
katherine-holden -
Category
Documents
-
view
213 -
download
0
Transcript of Analytics: Moving From Great Promise to Tangible Success Workbook University of Maryland University...

Analytics: Moving From Great Promise to Tangible Success Workbook
University of Maryland University
CollegeJuly 21-23, 2014Dr. Linda L. BaerDr. Donald Norris

I. First Workshop:–9:00 – 10:30 am, July 22, 2014Leadership, Culture and Readiness for Analytics
• Where are you?• How ready are you?• What’s your analytics maturity index?

Where are you?


Strategic Intelligence for Higher Education
How many, how often, where?
Where exactly is the problem?
What actions are needed?
Why is this happening?
What if these trends continue?
What will happen next?
What’s the best that can happen?

Key Questions Addressed by Analytics
Past Present Future
Information
Insight
What happened?
(Reporting)
What’s happening Now?(Alerts)
What will happen?
(Extrapolation)
What’s the best/worst that can happen?(Prediction, Optimization,Simulation)
What’s the nextbest action?
(Recommendation)
How and whydid it happen?
(Modeling,Experimental design)
Analytics at Work. Davenport, Harris and Morison.2010

STRATEGIC QUESTIONDATA
ANALYSIS AND PREDICTION
INSIGHT AND ACTION
ANALYTICS
http://www.educause.edu/library/resources/2012-ecar-study-analytics-higher-education

Defining Your Current Problem
Briefly explain your current problem: Give it a code name (just for fun):
What about this problem lends itself to an analytics solution process? Who would benefit if the problem were solved?
What is your role in the problem/solution?
What resources ($) may be available to you and others?
Who has tried to solve this before? Were they successful? Why or why not?

DESIGN Worksheet
Write the Problem Statement:
What data do you have? What data do you need? Gap between what you have and what you need?
What campus team will need to be involved?• • • • • • • • •
List criteria for completion/success:• • • • • • • • • •
What research, assessment, and analysis will you do?• • • • • • • • • •
Who can get the data?

DESIGN Worksheet
Describe current leadership and culture environment for evidence-based decision making supporting student success:
What role is leadership currently playing?
What is the investment plan?
What campus team will need to be involved?• • • • • • • • • •
List criteria for completion/success:• • • • • • • • • •
How would you describe your culture for data driven analytics to support student success?• • • • • • • • •
How are the stakeholders involved?

ECAR MATURITY OVERALL MATURITY INDEX

Analytics Maturity Index
http://www.educause.edu/ecar/research-publications/ecar-analytics-maturity-index-higher-education

DESIGN Worksheet
Campus Readiness – see ECAR Analytics Maturity Index
Culture/Process Investment
Governance and Infrastructure • • • • • • • • •
List criteria for completion/success:• • • • • • • • • •
Expertise • • • • • • • • •
Data, Reporting, Tools

Second Workshop: 3:15-4:15 pm, July 22, 2014Applying Analytics to Optimizing Student Success
• Baer Norris Ways to Use Analytics in Optimizing Student Success• Stages of Student Success• Case Study Examples

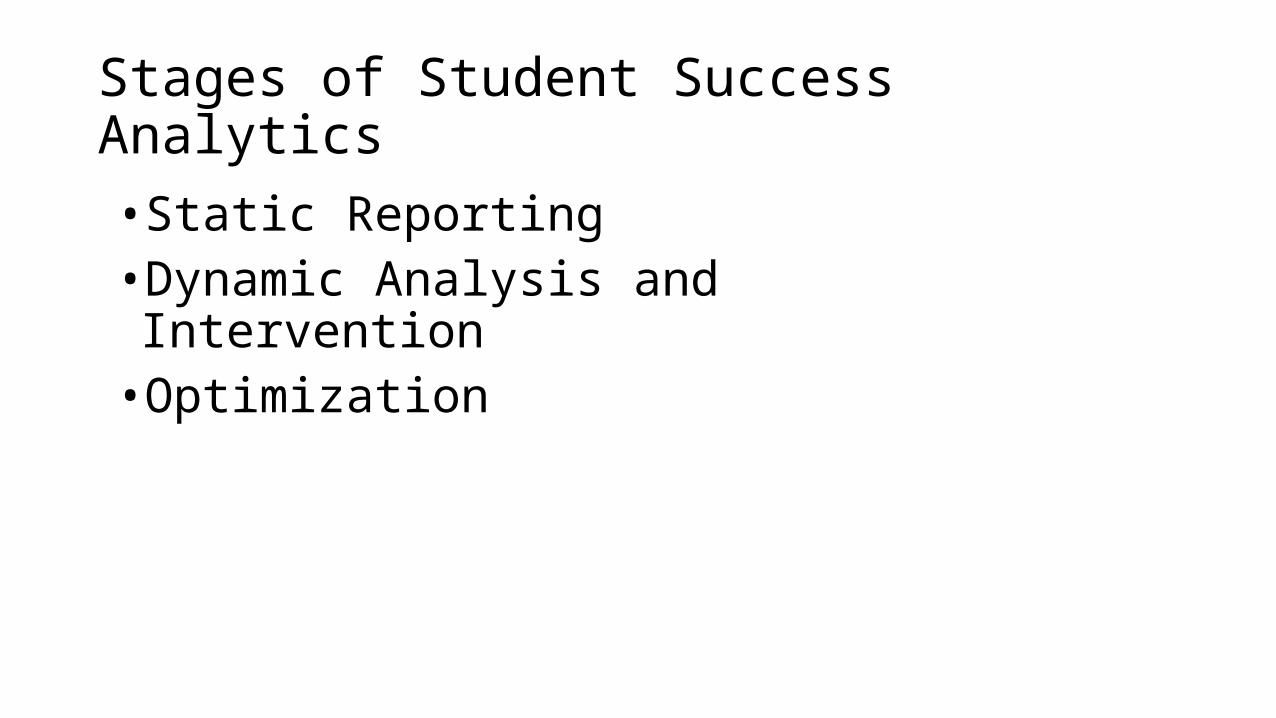
• Static Reporting• Dynamic Analysis and Intervention• Optimization
Stages of Student Success Analytics

Stages of Student Success Analytics
CharacteristicsStage I
Getting Started with Analytics
Stage IIAccelerating the Progress
of Analytics
Stage IIITransforming/Optimizing Leveraging
Analytics
Technology, Processes and Practices
Basic ERP, LMS, Report Writing ToolsFirst Ventures into Analytics Tools and Applications, Pilot Projects /Dept Solutions
Combination of ERP, LMS, Analytics Applications, CRM, Advising)First-Generation Predictive Analytics
Sophisticated Data Warehouses with Analytics, Embedded Predictive Analytics, Leading to More Advanced Practices
Skills and Values Power Users Provide Reports
Analytics Spread More Broadly – Concept of Analytics for the Masses
Pervasive Data, Information, and Analytics Engages Everyone from Front-Line Knowledge Worker to Executives
Leadership Leadership Focuses on Data and Reporting
Leadership to Encourage Evidence-Based Decision Making
Strong, Consistent Leadership, Analytics is a Strategic Imperative
Culture Culture of Reporting Culture of Evidence-Based Decision Making Reflected in Behaviors
Culture of Performance Measurement and Improvement
Number of Institutions in this Category
3,000+ Approximately 800-900 Approximately 40-60 Mostly For-Profits and Online UniversitiesUMBC, UMUC are Among These

What is Your Stage of Development of Student Success Analytics
CharacteristicsStage I
Getting Started with Analytics
Stage IIAccelerating the Progress
of Analytics
Stage IIITransforming/Optimizing Leveraging
Analytics
Technology, Processes and Practices
Skills and Values
Leadership
Culture

The market is immature, but multiple solutions are emerging in each application category
© 2010 Bill & Melinda Gates Foundation | 19
EducationPlanning
Counseling and coaching Risk Targeting andIntervention
Transfer andArticulation
Legacy ERP/SIS/LMS
Vendor point solutions
Homegrown point solutions
Direct-to-student
Austin Peay’s Degree Compass
Valencia’s LifeMap
Sinclair’s MAP
Central Piedmont’s Online Student Profile
WICHE’s Predictive Analytics Reporting

Higher Education Analytics LandscapeInstitutional Analytics (HR, Finance, Enrollment)
(Blackboard, COGNOS)
(Starfish EARLY ALERT and Starfish CONNECT, Hobsons)
(Starfish INSIGHT v.1)(Knewton, MyLabs, ALEKS)(Noel-Levitz, Mapworks,
EAB, J. Gardner, Campus Labs,
CIVITAS Learning)
Starfish INSIGHT v.2-v.3
“Retention CRM” Analytics
Program Effectiveness Analytics
Student Success Analytics
Instructional AnalyticsAt-Risk Student Predictive Analytics
Adapted from Presentation by David Yaskin, President Starfish at IPAS Conference 2014

Integrate or Replace?Learning Management Systems
(LMS) Module
Course clicks predict risk e.g. Blackboard Retention Center, Blackboard Analytics, Ellucian Signals, Desire2Learn Student
Success System
Student Information Systems (SIS) Module
Instructors flag students and/or demographics predicts risk e.g.
Jenzabar Retention, Ellucian Retention Alert, Banner Retention Mgr
Client Relationship Management (CRM) Module
Instructors flag students + email students to fix the problem e.g.
Hobsons Retain, Campus Management Talisma
Tracking / Scheduling Systems
Track meetings, schedule meetings e.g. AdvisorTrac, SARS,
TutorTrac, AccuTrac
Degree Audit and Planning
Academic Plans prevent mis-steps e.g. Ellucian Degreeworks, Hobsons
AgileGrad, CollegeSource u.Achieve/u.Direct
Early Alert Systems
Survey instructors + schedule meetings e.g. GradesFirst,
Pharos, Symplicity InsightAdvising
Case Management Systems
Walk a student through the steps for success e.g. Student Success
Plan
Predictive Analytics (standalone)
Anticipate problems based on data from systems e.g. Civitas Learning, Education Advisory
Board
Student Survey Systems
Anticipate problems based on student’s self reporting e.g. Noel
Levitz CSI, EBI Map-works, Campus Labs Beacon
Starfish® Enterprise Success Platform
integrate integrate
integrate/replace
integrate/replace
integrate/replace replace replace
replace replace

Making Student Success An Institutional Priority

Worksheet – Making Student Success an Institutional Priority
Establish a Sense of Urgency for Taking a Systemic and Systematic Approach to Student Success:
Form a Powerful Guiding Coalition: Create a Vision/Strategy and Communicate the Vision/Strategy:
Institutionalize New Approaches and Behaviors, Focus on Changing Culture and Behaviors, Demonstrate Successes:• • • • • • • • •
Plan for an Leverage Short-Term Wins/Leverage Existing Pilots and Analytics Capabilities/Demonstrate Improvements:• • • • • • • • • •
Consolidate Improvements, Produce Still More Change, Follow an Expeditionary Strategy:• • • • • • • • • •
Empower Others to Act on That Vision/Eliminate Barriers:

Third Workshop: 1:30-2:30 July 23, 2014Putting the Pieces Together
• Getting Started from Where you Are• Future of Student Success Solutions• Build, Buy, Buddy, Borrow• 3-year planning cycle


STUDENT SUCCESS SOLUTIONS
• Emerging now are a set of rapidly developing technology tools to support students as they progress through a course and program.
• Depending on the individual student’s understanding of specific ideas, concepts, and operations, these tools have the capacity to • personalize the learning experience for every student• chart individual pathways through course materials

EducationPlanning
Counseling and Coaching
Risk Targeting andIntervention
Transfer andArticulation
Legacy ERP/SIS/LMS
Vendor point solutions
Homegrown point solutions
Direct-to-student
Austin Peay’s Degree
Compass
Valencia’s LifeMap
Sinclair’s MAP
Central Piedmont’s Online Student
Profile
WICHE’s Predictive Analytics Reporting

Higher Education Analytics Landscape
Institutional Analytics (HR, Finance, Enrollment)(Blackboard, COGNOS)
(Starfish EARLY ALERT and Starfish CONNECT, Hobsons)
(Starfish INSIGHT v.1)(Knewton, MyLabs, ALEKS)(Noel-Levitz, Mapworks,
EAB, J. Gardner, Campus Labs,
CIVITAS Learning)
Starfish INSIGHT v.2-v.3
“Retention CRM” Analytics
Program Effectiveness Analytics
Student Success Analytics
Instructional AnalyticsAt-Risk Student Predictive Analytics
Adapted from Presentation by David Yaskin, President Starfish at IPAS Conference 2014

Integrate or Replace?Learning Management Systems
(LMS) Module
Course clicks predict risk e.g. Blackboard Retention Center, Blackboard Analytics, Ellucian Signals, Desire2Learn Student
Success System
Student Information Systems (SIS) Module
Instructors flag students and/or demographics predicts risk e.g.
Jenzabar Retention, Ellucian Retention Alert, Banner Retention Mgr
Client Relationship Management (CRM) Module
Instructors flag students + email students to fix the problem e.g.
Hobsons Retain, Campus Management Talisma
Tracking / Scheduling Systems
Track meetings, schedule meetings e.g. AdvisorTrac, SARS,
TutorTrac, AccuTrac
Degree Audit and Planning
Academic Plans prevent mis-steps e.g. Ellucian Degreeworks, Hobsons
AgileGrad, CollegeSource u.Achieve/u.Direct
Early Alert Systems
Survey instructors + schedule meetings e.g. GradesFirst,
Pharos, Symplicity InsightAdvising
Case Management Systems
Walk a student through the steps for success e.g. Student Success
Plan
Predictive Analytics (standalone)
Anticipate problems based on data from systems e.g. Civitas Learning, Education Advisory
Board
Student Survey Systems
Anticipate problems based on student’s self reporting e.g. Noel
Levitz CSI, EBI Map-works, Campus Labs Beacon
Starfish® Enterprise Success Platform
integrate integrate
integrate/replace
integrate/replace
integrate/replace replace replace
replace replace

Inventory of Your Student SolutionTool Sets
Educational Planning
Counseling and Coaching
At Risk and Early Alert
Transfer and Articulation
Predictive Analytics
LegacyERP/LMS
Vendor Point Solutions
Home Grown Solutions
Direct to Students

Build, Buy, Buddy, Borrow Solution Tools• Build – homegrown systems, applications, processes, and
competences • Buy - utilize solution providers to acquire systems, applications,
processes and competences• Buddy – partner collaborate and share• Borrow• Mash-up Strategy combining all four

QUESTIONSBuild, Buy, Buddy, Borrow?• What are you seeking?• What do you already have?• Where do you want to go next?• What options work best?• What is the short term and long term strategy and plan?

DESIGN Worksheet
Describe current student solution tool decision making environment
What factors are shaping the BBBB decision?
What are you seeking?
What is the short term and long term strategy and plan?• • • • • • • • • •
• • • • • • • • • •
What options work best in BBBB?• • • • • • • • •
What do you already have?
Where do you want to go next?

IMPLEMENTATION Worksheet
Summarize the Implementation Strategy for year 1, 2, and 3.
How does this serve as a gateway to analytics that optimize student success?
Target 1: Student Solution Sets
Specific actions that are necessary?• • • • • •
Target 2: Build, Buy, Buddy, Borrow
Specific actions that are necessary?• • • • • •
Target 3: Roadmap for 3-Year Plan
Specific actions that are necessary?• • • • • •
What are the key elements and features?
Who does this involve?
What does success look like?
What resources ($) are necessary?
List specific outcomes and metrics:• • • • •

SOAR Template and Analytics Readiness Strengths Opportunities Aspirations Results
Leadership and Culture
Data Readiness and
Organizational Structure
Technology and Enterprise Systems
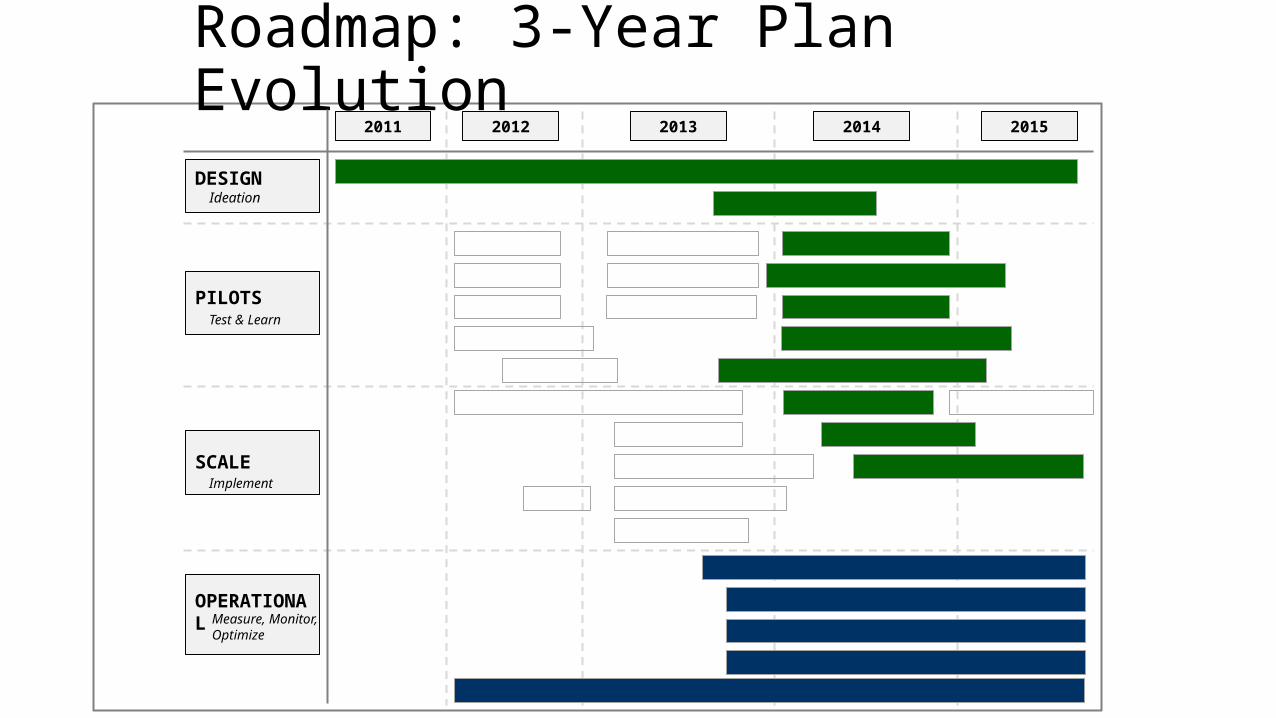
Roadmap: 3-Year Plan Evolution
2011 2012 2013 2014 2015
DESIGNIdeation
PILOTS
SCALE
OPERATIONALMeasure, Monitor, Optimize
Test & Learn
Implement

Analytics: Moving From Great Promise to Tangible Success Workbook
Dr. Linda L. [email protected]
Dr. Donald [email protected]