Analytical Techniques & Preformulation Studies ANALYTICAL...
49
43 ANALYTICAL TECHNIQUES AND PREFORMULATION STUDIES 3.1 PROCHLORPERAZINE MALEATE 3.1.1 Analytical Methods Established Gas Chromatography Mass Spectroscopy: McKay G et al., (1982), compared a gas chromatographic mass spectrometric assay using selected ion monitoring with a high performance liquid chromatographic assay using an electrochemical detector for single dose studies of the psychotherapeutic phenothiazine drug prochlorperazine. Measurements were made after extraction of prochlorperazine from basified plasma with an isopropanol pentane solvent mixture. The residual sample was analyzed by high performance liquid chromatography using an electrochemical detector. This method displayed excellent correlation for plasma concentration determinations in the range of 0.25-10 ng/ml and will allow for the study of the pharmacokinetics of prochlorperazine following single low doses of the drug. 1 Liquid Chromatography: Yan M et al., (2009), developed a sensitive and specific method using a one step liquid-liquid extraction with dichloromethane followed by liquid chromatographic- electrospray ionization mass spectrometric was developed and validated to determine prochlorperazine maleate in human plasma using amitriptyline hydrochloride as an internal standard. The samples were separated using a Thermo Hypersil-Hypurity C 18 reversed-phase column (150 mm x 2.1 mm i.d., 5 μm). A mobile phase containing 10 mM ammonium acetate (pH 3.6)-methanol-acetonitrile (27:68:5, v/v/v) was used isocratically eluting at a flow rate of 0.22 ml/min. The average extraction recovery of prochlorperazine and internal standard were 81.8±2.2% and 79.5±3.7%, respectively. Prochlorperazine maleate and internal standard were measured by electrospray ion source in positive selective ion monitoring mode. The method demonstrated that good linearity ranged from 0.20 to 6.40 ng/ml with r 2 0.9989. The limit of quantification for prochlorperazine maleate in the plasma was 0.20 ng/ml. The established method has successfully applied to a bioequivalence study of two prochlorperazine maleate formulations in 18 healthy male Chinese volunteers. 2
Transcript of Analytical Techniques & Preformulation Studies ANALYTICAL...

_____________________________________Analytical Techniques & Preformulation Studies
43
ANALYTICAL TECHNIQUES AND
PREFORMULATION STUDIES
3.1 PROCHLORPERAZINE MALEATE
3.1.1 Analytical Methods Established
Gas Chromatography Mass Spectroscopy:
McKay G et al., (1982), compared a gas chromatographic mass spectrometric assay
using selected ion monitoring with a high performance liquid chromatographic assay
using an electrochemical detector for single dose studies of the psychotherapeutic
phenothiazine drug prochlorperazine. Measurements were made after extraction of
prochlorperazine from basified plasma with an isopropanol pentane solvent mixture.
The residual sample was analyzed by high performance liquid chromatography using
an electrochemical detector. This method displayed excellent correlation for plasma
concentration determinations in the range of 0.25-10 ng/ml and will allow for the
study of the pharmacokinetics of prochlorperazine following single low doses of the
drug.1
Liquid Chromatography:
Yan M et al., (2009), developed a sensitive and specific method using a one step
liquid-liquid extraction with dichloromethane followed by liquid chromatographic-
electrospray ionization mass spectrometric was developed and validated to determine
prochlorperazine maleate in human plasma using amitriptyline hydrochloride as an
internal standard. The samples were separated using a Thermo Hypersil-Hypurity C18
reversed-phase column (150 mm x 2.1 mm i.d., 5 µm). A mobile phase containing 10
mM ammonium acetate (pH 3.6)-methanol-acetonitrile (27:68:5, v/v/v) was used
isocratically eluting at a flow rate of 0.22 ml/min. The average extraction recovery of
prochlorperazine and internal standard were 81.8±2.2% and 79.5±3.7%, respectively.
Prochlorperazine maleate and internal standard were measured by electrospray ion
source in positive selective ion monitoring mode. The method demonstrated that good
linearity ranged from 0.20 to 6.40 ng/ml with r2 0.9989. The limit of quantification for
prochlorperazine maleate in the plasma was 0.20 ng/ml. The established method has
successfully applied to a bioequivalence study of two prochlorperazine maleate
formulations in 18 healthy male Chinese volunteers.2

_____________________________________Analytical Techniques & Preformulation Studies
44
Uraisin K et al., (2006), developed a simple and fast flow injection
spectrophotometric method for the determination of bromate in water samples. The
detection system was based on the oxidation of prochlorperazine (PCP) with bromate
in strongly acidic medium. Large amounts of chloride and bromide was found, for the
first time, to act as an activator and to enhance the sensitivity for bromate detection.
The oxidation product of PCP gives pink color, which can be used to monitor the
reaction spectrophotometrically at 525 nm. Under the optimal conditions, the method
was selective; only nitrite, chlorite and hypochlorite can interfere with the
determination of bromate. The elimination of these three ions was discussed. The
calibration graph for bromate determination was linear in the range of 10-130 µg/l
with a detection limit of 2.3 µg/l. The repeatability was satisfactory, with the relative
standard deviation of 1.1% (25 µg/l, n=10). The sample throughput was 44 per hour.
The proposed method was found to be highly reliable for screening drinking waters
containing bromate, which was above or below legislation limit of 10µg/l.3
Marumo A et al., (2005), extracted seven phenothiazine derivatives, perazine,
perphenazine, prochlorperazine, propericiazine, thioproperazine, trifluoperazine, and
flupentixol from human plasma and urine samples using disk solid-phase extraction
(SPE) with an Empore C18 cartridge. Human plasma and urine (1 ml each) containing
the 7 phenothiazine derivatives were mixed with 2 ml of 0.1M NaOH and 7 ml
distilled water and then poured into the disk SPE cartridges. The drugs were eluted
with 1 ml chloroform-acetonitrile (8:2) and determined by liquid chromatography
with ammonium formate/formic acid-acetonitrile gradient elution. The detection was
performed by ultraviolet absorption at 250 nm. The separation of the 7 phenothiazine
derivatives from each other and from impurities was generally satisfactory using a
Symmetry Shield RP8 column (150 x 2.1 mm id, 3.5 µm particle size). The recoveries
of the 7 phenothiazine derivatives spiked into plasma and urine samples were 64.0-
89.9% and 65.1-92.1%, respectively. Regression equations for the 7 phenothiazine
derivatives showed excellent linearity with detection limits of 0.021-0.30 µg/ml for
plasma and 0.017-0.30 µg/ml for urine. The within day and day to day coefficients of
variation for both samples were commonly below 9.0 and 14.9%, respectively.4
Honigberg IL et al., (1975), investigated parameters associated with the separation of
antianxiety-antispasmodic agents using high pressure liquid chromatography. Eight
widely prescribed drugs were studied. The compounds were chromatographed on

_____________________________________Analytical Techniques & Preformulation Studies
45
reversed phase octadecyltrichlorosilane (C18) or diphenyldichlorosilane (phenyl)
columns, using mixtures of absolute methanol and distilled water buffered with
ammonium dihydrogen phosphate, ammonium acid phosphate or ammonium
carbonate. A mixture of phenobarbital-propantheline bromide was selected to
demonstrate the utility of the separation and quantification method. The mixture was
chromatographed on a phenyl column, using absolute methanol-aqueous 1%
ammonium dihydrogen phosphate (60:40) (pH 5.85) at a flow rate of 1.4 ml/min.
Each determination can achieve in approximately 15 min with an accuracy of 1-2%.5
High Performance Thin Layer Chromatography:
Tanaka E et al., (2007), developed a high performance liquid chromatographic
method for the simultaneous analysis of the 12 phenothiazines (chlorpromazine,
fluphenazine, levomepromazine, perazine, perphenazine, prochlorperazine,
profenamine, promethazine, propericiazine, thioproperazine, thioridazine and
trifluoperazine) in human serum using HPLC/UV. The separation was achieved using
a C18 reversed-phase column (250 mm x 4.6 mm i.d., particle size 5 µm, Inersil ODS-
SP). The mobile phase, consisting of acetonitrile-methanol-30 mM NaH2PO4 (pH 5.6)
(300:200:500, v/v/v), was delivered at a flow rate of 0.9 ml/min and UV detection
was carried out at 250 nm. The recoveries of the 12 phenothiazines spiked into serum
samples were 87.6-99.8%. Regression equations for the 12 phenothiazines showed
excellent linearity, with detection limits of 3.2-5.5 ng/ml for serum. The inter-day and
intraday coefficients of variation for serum samples were commonly below 8.8%. The
selectivity, accuracy and precision of this method were satisfactory for clinical and
forensic purposes.6
Mizuno Y et al., (2002), devolved a method to detect phenothiazines compounds by
high-performance liquid chromatography/fast atom bombardment-mass spectrometry
(HPLC/FAB-MS) method. Authentic samples of the compounds were subjected to
our HPLC/FAB-MS system their mass spectra were obtained by positive and negative
modes. Four typical phenothiazines, in the serum samples of two patients, were also
analyzed. All 17 phenothiazines were sufficiently separated on the chromatogram. In
the positive mode, all the base peaks were quasimolecular ions; their main fragment
ions observed were [M-R(1)+CH(2)](+), [R(1)](+), [M-R(1)](+) and [M+H+Gly](+).
In the negative mode, the base peaks were [Cl](-) for chlorpromazine,
prochlorperazine and perphenazine, three compounds containing chloride. For the

_____________________________________Analytical Techniques & Preformulation Studies
46
other compounds, they were [M-R(1)-CH(3)](-), [M-R(1)-CH(2)CH(3)](-) or [M-
R(1)-(CH(3))(2)](-) ions. The present method would useful in forensic toxicological
practice.7
Mou C et al., (1997), developed a high performance liquid chromatographic method
for simultaneous extraction, elution and determination of doxorubicin and
prochlorperazine content in human plasma samples. The procedure consists of
extraction through a conditioned C18 solid phase extraction cartridge, elution from a
Spherisorb C8 reversed-phase column by an isocratic mobile phase (60% acetonitrile,
15% methanol and 25% buffer) followed by detection with electrochemical and
fluorescence detectors. Recovery of doxorubicin and prochlorperazine from pooled
human plasma samples (n=3) containing 100 ng/ml of the two drugs was 77.8 ± 3.5%
and 89.1 ± 6.0%, respectively. The lower limits of quantitation for doxorubicin and
prochlorperazine in plasma samples were 6.25 ng/ml and 10 ng/ml, respectively. A
linear calibration curve was obtained for up to 2 µg/ml of doxorubicin and
prochlorperazine. This combination method may be of particular value in clinical
studies where phenothiazines such as prochlorperazine were used to enhance retention
of doxorubicin in drug resistant tumor cells.8
UV-Visible Spectroscopy:
Kitamura K et al., (1998), measured the absorption spectra of six phenothiazine
derivatives, chlorpromazine, triflupromazine, promazine, promethazine,
trifluoperazine and prochlorperazine, in the solutions containing various amounts of
human erythrocyte ghosts (HEG) showed bathocromic shifts according to the amount
of HEG. Due to the strong background signals caused by HEG, the baseline
compensation was incomplete, even though the sample and the reference solutions
contained the same amount of HEG, hence further spectral information could not be
obtained. The second derivative spectra of these absorption spectra clearly showed the
derivative isosbestic points, indicating that the residual background signal effects
were entirely eliminated. The derivative intensity differences of the phenothiazines
(DeltaD values) before and after the addition of HEG were measured at a specific
wavelength. Using the DeltaD values, the partition coefficients (Kp) of these drugs
were calculated and obtained with RSD of below 10 %. The results indicate that the
derivative method can be applicable to the determination of partition coefficients of
drugs to HEG without any separation procedures.9

_____________________________________Analytical Techniques & Preformulation Studies
47
3.1.2 Drug Analysis
Melting Point: The melting point of the prochlorperazine maleate was determined by
capillary fusion method. A capillary was sealed at one end filled with a small amount
of prochlorperazine maleate and the capillary was kept inverted i.e. sealed end
downwards into the melting point apparatus.13
Reported Melting Point: 229o
Observed Melting Point: 230o
Infrared Spectral Assignment: The FTIR analysis of the sample was carried out for
qualitative compound identification. The pellet of approximately 01 mm diameter of
the prochlorperazine maleate was prepared grinding 3-5 mg of sample with 100-150
mg of potassium bromide in pressure compression machine. The sample pellet was
mounted in FTIR (8400S, Shimadzu) compartment and scanned at wavelength 4000 –
500 cm-1
. On analysis of the FTIR spectra of the reference spectra (Fig. 3.1) given in
Clarke Analysis and pure prochlorperazine maleate (Fig. 3.2), no major differences
were observed in the characteristic absorption peak (751, 1220, 1280, 1569 cm−1
)
pattern.
Fig. 3.1: FTIR Spectra of prochlorperazine maleate given in Clarke’s Analysis
Fig. 3.2: FTIR Spectra of prochlorperazine maleate determined experimentally

_____________________________________Analytical Techniques & Preformulation Studies
48
Solubility: The solubility of prochlorperazine maleate was determined in different
solvent systems. Small amounts of the prochlorperazine maleate was added to 5 ml of
each solvent in screw capped glass tubes and shaken. The solutions were examined
physically for the absence or presence of prochlorperazine maleate particles.
Qualitative solubility determined by UV- Spectrophotometer at 254 nm.
Table 3.1: Solubility profile of prochlorperazine maleate
Solvent Solubility Solubility (gm/ml)
Distill Water + 0.002±0.01
0.1N Hydro Chloride ++ 0.041±0.016
0.1N Sodium Hydroxide ++ 0.057±0.029
Ethanol +++ 0.231±0.028
Ether ++ 0.049±0.031
Chloroform ++ 0.062±0.023
Buffer (pH 6.8) ++ 0.055±0.011
Acetone - -
Freely soluble +++ Soluble ++ Slightly soluble + Practically insoluble -
Ultraviolet Absorption Maxima:
Preparation of Sorenson’s Buffer (pH 6.8)
24.5 ml of 0.2 M dibasic sodium phosphate and 0.2 M 25.5 ml of monobasic sodium
phosphate was placed in 100 ml volumetric flask, and make up the volume 100 ml by
water. UV spectra absorption in the rage 200 to 400 nm of a 50 g/ml solution in
Sorenson’s buffer (pH 6.8) was measured. The absorption maxima (λmax) of
prochlorperazine maleate (50 µg/ml) in the solution was found to be 254 nm and 305
nm which was concordant with the Clarke Analysis shown in Table 3.2 and Fig. 3.3.
Table 3.2: Determination of wavelength maxima (λmax)
Wavelength (nm) Absorbance
200 0.612
224 0.337
254 0.682
274 0.035
305 0.084
361 0.003
Fig. 3.3: Determination of wavelength maxima (λmax)
0 0.1 0.2 0.3 0.4 0.5 0.6 0.7 0.8 0.9
1
200 225 250 275 300 325 350 375 400
Ab
sorb
ance
Wavelength (nm)

_____________________________________Analytical Techniques & Preformulation Studies
49
Preparation of Calibration Curve:
Prochlorperazine maleate (100 mg) was dissolved in small amount of Sorenson’s
buffer (pH 6.8) in a 100 ml of volumetric flask and final volume was made with the
Sorenson’s buffer. 10 ml of this solution was diluted to 100 ml with Sorenson’s buffer
(pH 6.8) in a 100 ml volumetric flask to obtain a stock solution of 100 µg/ml.
Aliquots of 1, 2, 3, 4, 5, 6 and 7 ml were taken from stock solution in 10 ml
volumetric flasks and volume was made up to 10 ml with buffer (pH 6.8). The
absorbance of these solutions was measured at 254 nm. The calibration curve was
plotted between concentration and absorbance.
Table 3.3: Calibration curve of prochlorperazine maleate
Concentration (µg/ml) Absorbance (254 nm)
0 0
10 0.155
20 0.294
30 0.423
40 0.551
50 0.674
60 0.815
70 0.941
Fig. 3.4: Calibration curve of prochlorperazine maleate
3.1.3 Drug-Polymer Interaction Studies
While designing fast dissolving tablets, it was imperative to give consideration to the
compatibility of prochlorperazine maleate and polymer used within the systems. It
was therefore necessary to confirm the interaction between polymer and drug under
y = 0.0133x + 0.0168
R² = 0.9992
0
0.1
0.2
0.3
0.4
0.5
0.6
0.7
0.8
0.9
1
0 10 20 30 40 50 60 70
Ab
sorb
ance
(2
54
nm
)
Concentration (µg/ml)
_____________________________________Analytical Techniques & Preformulation Studies
50
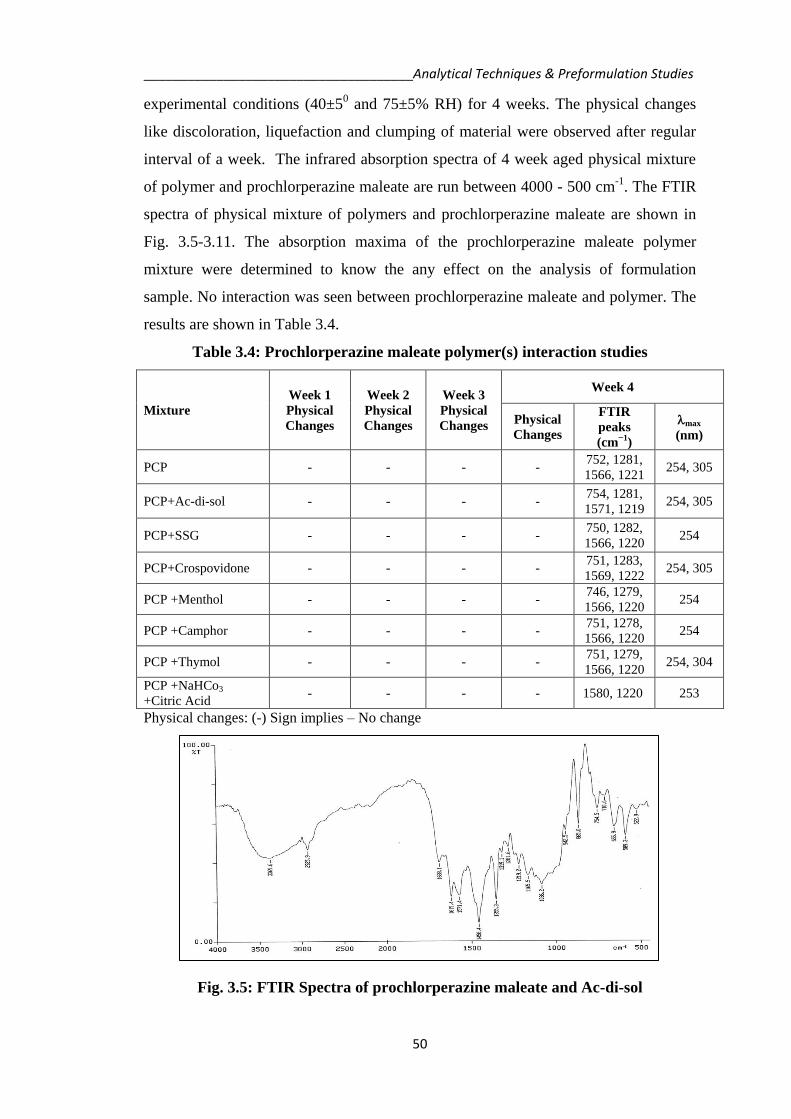
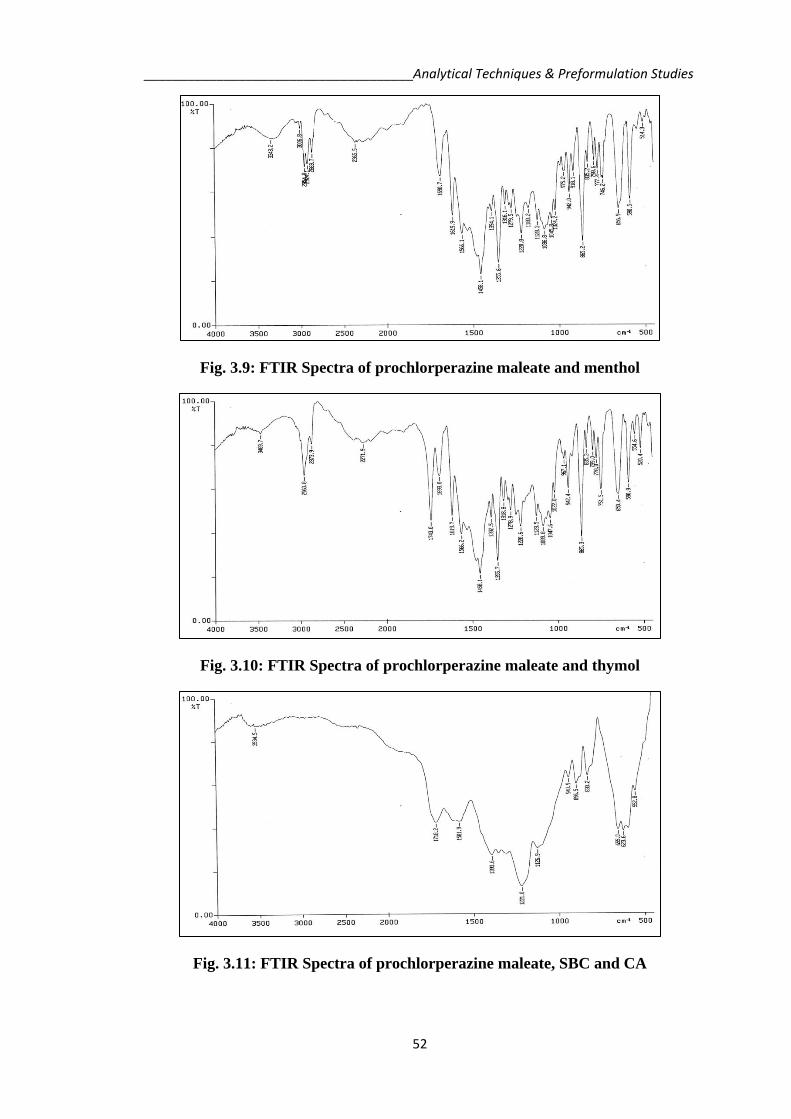
experimental conditions (40±50 and 75±5% RH) for 4 weeks. The physical changes
like discoloration, liquefaction and clumping of material were observed after regular
interval of a week. The infrared absorption spectra of 4 week aged physical mixture
of polymer and prochlorperazine maleate are run between 4000 - 500 cm-1
. The FTIR
spectra of physical mixture of polymers and prochlorperazine maleate are shown in
Fig. 3.5-3.11. The absorption maxima of the prochlorperazine maleate polymer
mixture were determined to know the any effect on the analysis of formulation
sample. No interaction was seen between prochlorperazine maleate and polymer. The
results are shown in Table 3.4.
Table 3.4: Prochlorperazine maleate polymer(s) interaction studies
Mixture
Week 1
Physical
Changes
Week 2
Physical
Changes
Week 3
Physical
Changes
Week 4
Physical
Changes
FTIR
peaks
(cm−1
)
max
(nm)
PCP - - - - 752, 1281,
1566, 1221 254, 305
PCP+Ac-di-sol - - - - 754, 1281,
1571, 1219 254, 305
PCP+SSG - - - - 750, 1282,
1566, 1220 254
PCP+Crospovidone - - - - 751, 1283,
1569, 1222 254, 305
PCP +Menthol - - - - 746, 1279,
1566, 1220 254
PCP +Camphor - - - - 751, 1278,
1566, 1220 254
PCP +Thymol - - - - 751, 1279,
1566, 1220 254, 304
PCP +NaHCo3
+Citric Acid - - - - 1580, 1220 253
Physical changes: (-) Sign implies – No change
Fig. 3.5: FTIR Spectra of prochlorperazine maleate and Ac-di-sol

_____________________________________Analytical Techniques & Preformulation Studies
51
Fig. 3.6: FTIR Spectra of prochlorperazine maleate and SSG
Fig. 3.7: FTIR Spectra of prochlorperazine maleate and crospovidone
Fig. 3.8: FTIR Spectra of prochlorperazine maleate and camphor
_____________________________________Analytical Techniques & Preformulation Studies
52
Fig. 3.9: FTIR Spectra of prochlorperazine maleate and menthol
Fig. 3.10: FTIR Spectra of prochlorperazine maleate and thymol
Fig. 3.11: FTIR Spectra of prochlorperazine maleate, SBC and CA

_____________________________________Analytical Techniques & Preformulation Studies
53
3.1.4 Results and Discussions
The sample of prochlorperazine maleate was analyzed by various organoleptic,
physicochemical and spectrophotometric methods. The sample of prochlorperazine
maleate possessed similar color, odor, taste and texture as given in officials. The
melting point of the sample was found to be 2290. The FTIR spectra of reference and
sample are shown in Fig. 3.1 and 3.2 respectively. The FTIR spectra verified the
authenticity of the procured sample as the characteristic peaks of the prochlorperazine
maleate was found at 751, 1220, 1280, 1569 cm−1
in concordance to the reference
spectra. The qualitative solubility of prochlorperazine maleate was determined in
various solvents. The maximum solubility was found in ethanol and least in acetone.
The result for solubility of prochlorperazine maleate in various solvents was shown in
Table 3.1. The absorption maxima of prochlorperazine maleate was observed at 254
nm in Sorenson’s buffer (pH 6.8), which was concordant with the value given in
Clarke Analysis of Drug. The UV spectrum of prochlorperazine maleate is shown in
Table 3.2 and Fig. 3.3. The calibration curve of prochlorperazine maleate was
prepared in Sorenson’s buffer (pH 6.8). The plot of different concentrations of
prochlorperazine maleate versus absorbance was found linear in the concentration
range of 0-70 g/ml at 254 nm. The absorbance’s obtained at different concentrations
are shown in Table 3.3. The data of standard curve was linearly regressed. The values
of slope and correlation coefficient were found to be 0.013 and 0.999 respectively.
The intercept on Y-axis was found to be 0.016. The calibration curve is shown in Fig.
3.4.
Prochlorperazine maleate polymer interaction study was carried out for 4 weeks and
samples were evaluated after every week for physical changes, change in absorption
maxima and FTIR studies. Results are shown in Table 3.4 and Fig. 3.5-3.11. There
was not any sign of physical change at the end of study. The FTIR spectra of the
various physical mixtures retained all the peaks of the pure prochlorperazine maleate
and there was no significant shift in the peaks corresponding to the prochlorperazine
maleate was observed on storage. Both the prochlorperazine maleate and polymer(s)
were found to be compatible with each other. Hence, the selected prochlorperazine
maleate and polymer(s) were successfully incorporated in the design fast dissolving
tablets.

_____________________________________Analytical Techniques & Preformulation Studies
54
3.2 PROMETHAZINE THEOCLATE
3.2.1 Analytical Methods Established
Gas Chromatography Mass Spectroscopy:
Hasegawa C et al., (2006), extracted and analyzed ten antihistamine drugs, from
human plasma samples using MonoTip C18 tips, inside which C18 bonded monolithic
silica gel was fixed. Human plasma (0.1 ml) containing the ten antihistamines was
mixed with 0.4 ml of distilled water and 25 µl of a 1 M potassium phosphate buffer
(pH 8.0). After centrifugation of the mixture, the supernatant fraction was extracted to
the C18 phase of the tip by 25 repeated aspirating/dispensing cycles using a manual
micropipettor. The analytes retained on the C18 phase were then eluted with methanol
by five repeated aspirating/dispensing cycles. The eluate was injected into a gas
chromatography (GC) injector without evaporation and reconstitution steps and was
detected by a mass spectrometer with selected ion monitoring in the positive-ion
electron impact mode.10
Leelavathi DE et al., (1985), developed highly specific and sensitive method using
automated high performance liquid chromatography with electrochemical detection
(HPLC-ED) and a method using gas chromatograph mass spectrometry (GCMS) for
the quantitative determination of promethazine in plasma. The lowest detectable
concentration by HPLC-ED was 0.1 ng/ml of plasma and by GC-MS 0.5 ng/ml of
plasma. The HPLC-ED method incorporates a valve switching unit to prevent all of
the electroactive impurities from entering the electrode compartment, thus
maintaining the sensitivity of the detector for the analyses of large numbers of
samples. The GC-MS method incorporates the highly specific selected ion monitoring
technique.11
Reddropa CJ et al., (1980), determined unchanged promethazine in biological
material using gas chromatography mass spectrometry by a nitrogen-selective flame
ionization detector.12
Nuclear Magnetic Resonance:
Lutka A, (2002), studied the effect of beta-CD and its substituted derivatives (DM-
beta-CD and HP-beta-CD) on the solubility and photostability of promethazine (PM)
was investigated in solution and in the solid state. Formation of solid inclusion
complexes of PM with CDs was evaluated using FTIR, 13C NMR and DSC methods.
The results obtained indicate that independently of the complexation method in the

_____________________________________Analytical Techniques & Preformulation Studies
55
solid state (kneading or heating), the presence of CD decreases the solubility of PM;
the reason may be that the phenothiazine ring of PM did not enter into the cavity of
beta-CD and its derivatives.13
DeMol NJ and Koenen J, (1985), investigated degradation products of the
promethazine radical cation, generated from promethazine with horseradish
peroxidase/H2O2. Several products were identified which resulted from fission of the
bond between the two ethanamine carbon atoms of the N10 side chain. The main
product was identified as 10-formyl-5-oxophenothiazine. The likely structure of three
minor products was also elucidated. The degradation of the promethazine radical
cation was different from that of radical cations derived from the propanamine side
chain containing phenothiazine drugs.14
High Performance Liquid Chromatography:
Saleha OA et al., (2009), developed simple, rapid and validated method for
separation and determination of promethazine enantiomers. Promethazine was
separated and quantitated on a Vancomycin Chirobiotic V column (250 x 4.6 mm),
using a mixture of methanol, acetic acid and triethylamine (100:0.1:0.1) as a mobile
phase at 20° and at a flow rate of 1 ml/min. The UV detector was set to 254 nm.
Acetyl salicylic acid (aspirin) was used as an internal standard. The applied HPLC
method allowed separation and quantification of promethazine enantiomers with good
linearity (r > 0.999) in the studied range. The relative standard deviations were 0.29
and 0.36 for the promethazine enantiomers with accuracy of 100.06 and 100.08. The
limit of detection and limit of quantification of promethazine enantiomers were found
to be 0.04 and 0.07 μg/ml, respectively. The method was validated through the
parameters of linearity, accuracy, precision, and robustness. The HPLC method was
applied for the quantitative determination of promethazine in pharmaceutical
formulations.15
Thumma S, et al., (2008), developed simple and rapid stability indicating HPLC
method for determination of promethazine in hot-melt extruded films and sustained
release tablets. Chromatographic separation was achieved on a 150 mm x 4.6 mm i.d.,
3 µm2 particle size, C8 column with acetonitrile 25 mM phosphate buffer (pH 7.0),
50:50 (v/v) as mobile phase at a flow rate of 1 ml/min. Quantization was achieved
with UV detection at 249 nm based on peak area. The method was validated in terms
of linearity, precision, accuracy, robustness specificity, limits of detection and
quantitation according to ICH guidelines.16
_____________________________________Analytical Techniques & Preformulation Studies
56
Tanaka E et al., (2007), developed high performance liquid chromatographic UV
method for the analysis of the promethazine in human serum. The separation was
achieved using a C18 reversed phase column (250 mm x 4.6 mm i.d., particle size 5
µm, Inersil ODS-SP). The mobile phase, consisting of acetonitrile-methanol-30 mM
NaH2PO4 (pH 5.6) (300:200:500), was delivered at a flow rate of 0.9 ml/min and UV
detection was carried out at 250 nm. The recoveries of the promethazine spiked into
serum samples were 87.6 - 99.8%. Regression equations for the promethazine show
excellent linearity, with detection limits of 3.2 - 5.5 ng/ml for serum.6
Patel RB and Welling PG, (2006), determined plasma levels of promethazine using a
high pressure liquid chromatographic procedure incorporating a fixed wavelength
(254 nm) UV detector, following single 50 mg intravenous, intramuscular and oral
doses to two male dogs. Initial plasma promethazine concentrations following
intravenous doses were 556 and 535 ng/ml in the two dogs. The subsequent decline in
drug levels was satisfactorily described by a triexponential function. Peak
promethazine levels of 76 and 64 ng/ml were obtained at 0.5 h following
intramuscular doses. Peak levels for the oral doses were 10.6 and 11.0 ng/ml
occurring 2 h after dosing. The apparent biological half-life of promethazine, obtained
from only 2-3 data points, varied from 8.5 to 27.7 h. Areas under the promethazine
plasma curves, compared to values obtained from intravenous doses between 0 and 24
h, indicated that systemic availability of intact drug was 55 - 73% following
intramuscular injection and 8.3 - 9.5% following oral administration.17
Liquid Chromatography:
Cruz VM et al., (2009), developed a simple and rapid method for the determination
of promethazine derivatives in human urine samples. The analytes were extracted
from the sample in 50 µl of the ionic liquid 1-butyl-3-methyl-imidazolium
hexafluorophosphate working in an automatic flow system under dynamic conditions.
The chemical affinity between the extractant and the analytes allows a good isolation
of the drugs from the sample matrix achieving at the same time their pre
concentration. The separation and detection of the extracted compounds was
accomplished by liquid chromatography and UV detection. The proposed method was
a valuable alternative for the analysis of these drugs in urine within the concentration
range 0.07-10 µg/ml. Limits of detection were in the range from 21 to 60 ng/ml. The
repeatability of the proposed method expressed as RSD (n=5) varied between 2.2%
and 3.9%.18

_____________________________________Analytical Techniques & Preformulation Studies
57
Ponder GW and Stewart JT, (1995), developed LC method for the concurrent assay
of R(+) and S(-) promethazine from human urine and serum. The method involves the
use of solid-phase extraction for sample clean-up. Chromatographic resolution of the
enantiomers was performed under isoeratic conditions using a mobile phase of hexane
1,2-dichlorethane-absolute ethanol-trifluoroacetic acid (400:150:100:1) at a flow rate
of 1 ml/min on a brush-type column KK-CARNU. The enantiomers were detected by
fluorescence using an excitation wavelength of 250 nm and a 280 nm emission cutoff
filter. Chlorpromazine was used as the internal standard for urine analysis. Standard
addition was used for promethazine analysis from serum. Drug to internal standard
ratios were linear from 0.25 to 10 μg/ml in urine. Serum levels were linear from 2 to
10 ng/ml.19
High Performance Thin Layer Chromatography:
Magdalena WK et al., (2006), described high performance thin-layer
chromatography (HPTLC) method combined with densitometry for determination of
phenothiazine derivatives. Quantitation was performed in reflectance mode by using a
computer controlled densitometer. Established calibration curve (r > 0.999), precision
(RDS values: 0.95 – 2.53%), detection limits as well as recovery values (101.1 –
102.8%) were found to be satisfactory. The presented method was rapid, precise and
sensitive and may be alternative to traditionally used HPLC. The method has
successfully applied in the analysis of pharmaceutical formulations.20
UV-Visible Spectroscopy:
Abdol Am and Khoi E, (2006), developed spectrophotometric method for
determining promethazine complexed with bromcresol green and then extracted with
chloroform. The complex in chloroform showed maximum absorption at 415 nm and
obeyed Beer's law over 1.2-8.5 g/ml. The complex molar absorptivity was 1.93 M.
Complex formation and extraction were complete and quantitative over pH 2.7 - 2.8.
The promethazine -bromcresol green molar ratio was 1:1. Excipients, coloring matter,
flavoring agents and other substances likely to be present in promethazine
preparations did not interfere in the determination. Direct determination in tablet,
syrup, and injection preparations were carried out satisfactorily.21
Liu YM and Yu RQ, (1987), determined promethazine in pure form and in a number
of pharmaceutical in 0.5N sulphuric acid by employing first-derivative at 265 nm and
zero-order at 250 nm spectrophotometric modes. The results obtained by utilizing the
first derivative procedure were 99.98, 101.70, 101.70 and 101.15 for the tablets, oral
_____________________________________Analytical Techniques & Preformulation Studies
58
suspension, drops and suppositories respectively. In a similar way the results obtained
for the zero order technique were 105.38, 101.70, 108.56 and 102.23 in the order.22
3.2.2 Drug Analysis
Melting Point: Melting point of the promethazine theoclate was determined by
capillary fusion method; one sided closed capillary filled with promethazine theoclate
was put into the melting point apparatus. Temperature was noted at which solid
promethazine theoclate converts into liquid.
Reported Melting Point: 232o
Observed Melting Point: 231o
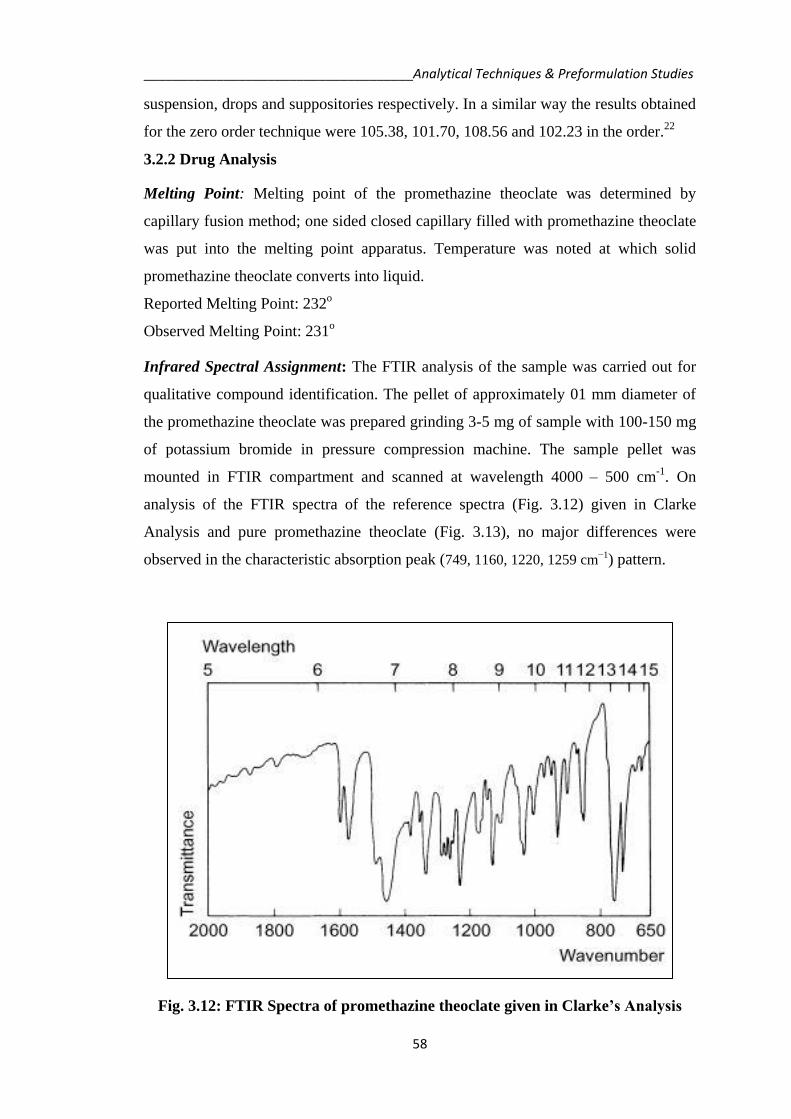
Infrared Spectral Assignment: The FTIR analysis of the sample was carried out for
qualitative compound identification. The pellet of approximately 01 mm diameter of
the promethazine theoclate was prepared grinding 3-5 mg of sample with 100-150 mg
of potassium bromide in pressure compression machine. The sample pellet was
mounted in FTIR compartment and scanned at wavelength 4000 – 500 cm
-1. On
analysis of the FTIR spectra of the reference spectra (Fig. 3.12) given in Clarke
Analysis and pure promethazine theoclate (Fig. 3.13), no major differences were
observed in the characteristic absorption peak (749, 1160, 1220, 1259 cm−1) pattern.
Fig. 3.12: FTIR Spectra of promethazine theoclate given in Clarke’s Analysis

_____________________________________Analytical Techniques & Preformulation Studies
59
Fig. 3.13: FTIR Spectra of promethazine theoclate determined experimentally
Solubility: The solubility of promethazine theoclate was determined in different
solvent systems. Small amount of the promethazine theoclate was added to 5 ml of
each solvent in screw capped glass tubes and shaken. The solutions were examined
physically for the absence or presence of promethazine theoclate particles. Qualitative
solubility determined by UV- Spectrophotometer at 250 nm.
Table 3.5: Solubility profile of promethazine theoclate
Solvent Solubility Solubility (gm/ml)
Distilled Water - -
0.1N Hydro Chloric acid + -
0.1N Sodium hydroxide + -
Ethanol ++ 0.045 ± 0.025
Ether - -
Chloroform +++ 0.112 ± 0.012
Buffer (pH 6.8) + -
Acetone - -
Freely soluble +++ Soluble ++ Slightly soluble + Practically insoluble –
Ultraviolet Absorption Maxima: Ultraviolet absorption in the rage 200 to 400 nm of a
5 g/ml solution in Sorenson’s buffer (pH 6.8) was measured. The absorption
maximum (λmax) of promethazine theoclate (5 µg/ml) in this solution was found to be
250 nm is shown in Table 3.6 and Fig. 3.14.
Table 3.6: Determination of wavelength maxima (λmax)
Wavelength (nm) Absorbance
200 0.472
224 0.302
250 0.557
266 0.198
280 0.264
200 0.472

_____________________________________Analytical Techniques & Preformulation Studies
60
Fig. 3.14: Determination of wavelength maxima (λmax)
Preparation of Calibration Curve: Promethazine theoclate (100 mg) was dissolved in
little amount of Sorenson’s buffer (pH 6.8) in a 100 ml of volumetric flask and final
volume was made with the Sorenson’s buffer. 1.0 ml of this solution was diluted to
100 ml with Sorenson’s buffer (pH 6.8) in a 100 ml volumetric flask to obtain a stock
solution of 10 µg/ml. From this stock solution, aliquots of 1, 2, 3, 4, 5, 6, 7, 8 and 9
ml were taken, transferred to 10 ml volumetric flasks and volume was made upto 10
ml using Sorenson’s buffer (pH 6.8). The absorbance of these solutions was measured
at 250 nm. The calibration curve was plotted between concentration and absorbance.
Table 3.7: Calibration curve of promethazine theoclate
Concentration
(µg/ml)
Absorbance
(250 nm)
0 0.000
1 0.181
2 0.257
3 0.352
4 0.458
5 0.557
6 0.665
7 0.782
8 0.865
9 0.942
0
0.1
0.2
0.3
0.4
0.5
0.6
200 225 250 275 300
Ab
sorb
ance
Wavelength (nm)

_____________________________________Analytical Techniques & Preformulation Studies
61
Fig. 3.15: Calibration curve of promethazine theoclate
3.2.3 Drug Polymer Interaction Studies
To confirm that promethazine theoclate was not interacting with polymer under
experimental conditions (40±50 and 75±5% RH) for 4 weeks. The physical changes
like discoloration, liquefaction and clumping of material were observed after regular
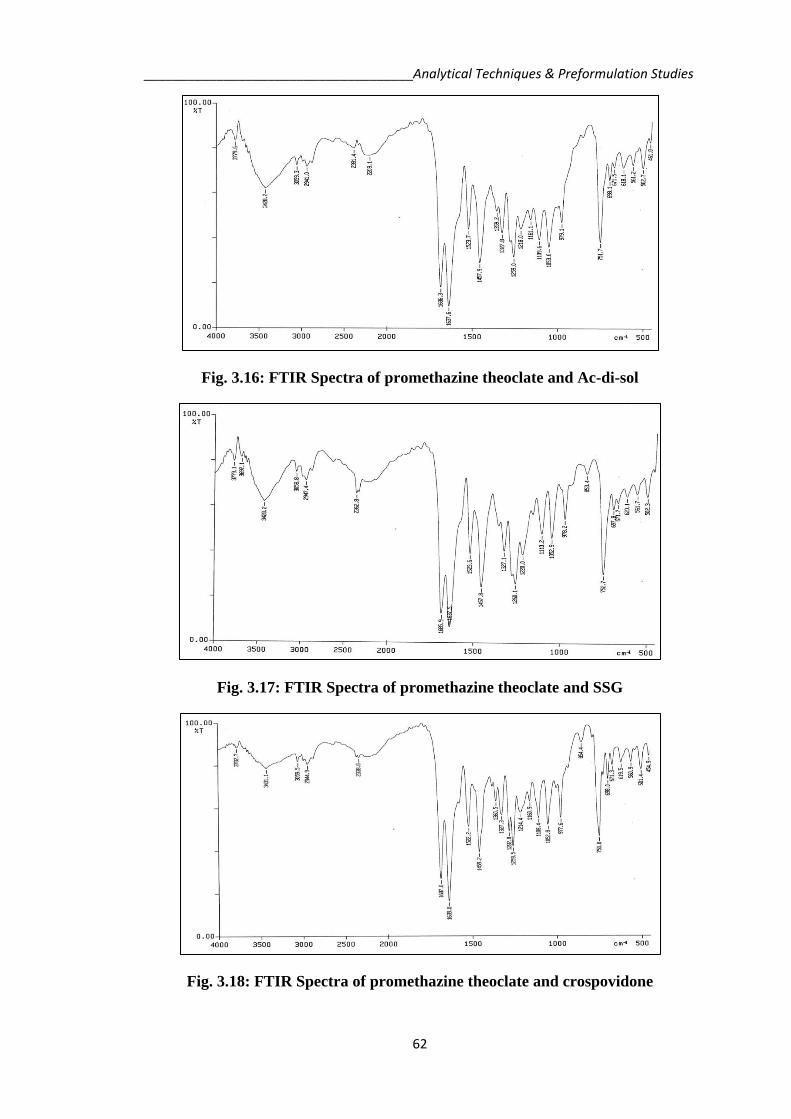
interval of a week. The infrared absorption spectra of 4 week aged physical mixture
of polymer and promethazine theoclate were run between 4000 - 500 cm-1
. The FTIR
spectra of physical mixture of polymers and promethazine theoclate are shown in Fig.
3.16-3.23. The absorption maxima of the promethazine theoclate polymer mixture
were determined to know the any effect on the analysis of formulation sample.
Table 3.8: Promethazine theoclate polymer(s) interaction studies
Mixture
Week 1
Physical
Changes
Week 2
Physical
Changes
Week 3
Physical
Changes
Week 4
Physical
Changes
FTIR peaks
(cm−1
) max
(nm)
PMT - - - - 749, 1160,
1220, 1259 250
PMT+Ac-di-sol - - - - 751, 1161,
1220, 1259 250
PMT+SSG - - - - 752, 1160,
1218, 1260 250
PMT+Crospovidone - - - - 750, 1160,
1220, 1259 250
PMT +Menthol - - - - 751, 1158,
1219, 1263 250
PMT +Camphor - - - - 752, 1161,
1220 250
PMT +Thymol - - - - 752, 1160,
1270 251
PMT +NaHCo3
+Citric Acid - - - -
750, 1162,
1222, 1260 249
PMT +β-CD - - - - 757, 1158,
1220 250
Physical changes: (-) Sign implies – No change
y = 0.1008x + 0.0495
R² = 0.9953
0
0.2
0.4
0.6
0.8
1
0 1 2 3 4 5 6 7 8 9
Ab
sorb
ance
(2
50
nm
)
Concentration (µg/ml)
_____________________________________Analytical Techniques & Preformulation Studies
62
Fig. 3.16: FTIR Spectra of promethazine theoclate and Ac-di-sol
Fig. 3.17: FTIR Spectra of promethazine theoclate and SSG
Fig. 3.18: FTIR Spectra of promethazine theoclate and crospovidone

_____________________________________Analytical Techniques & Preformulation Studies
63
Fig. 3.19: FTIR Spectra of promethazine theoclate and camphor
Fig. 3.20: FTIR Spectra of promethazine theoclate and menthol
Fig. 3.21: FTIR Spectra of promethazine theoclate and thymol
_____________________________________Analytical Techniques & Preformulation Studies
64
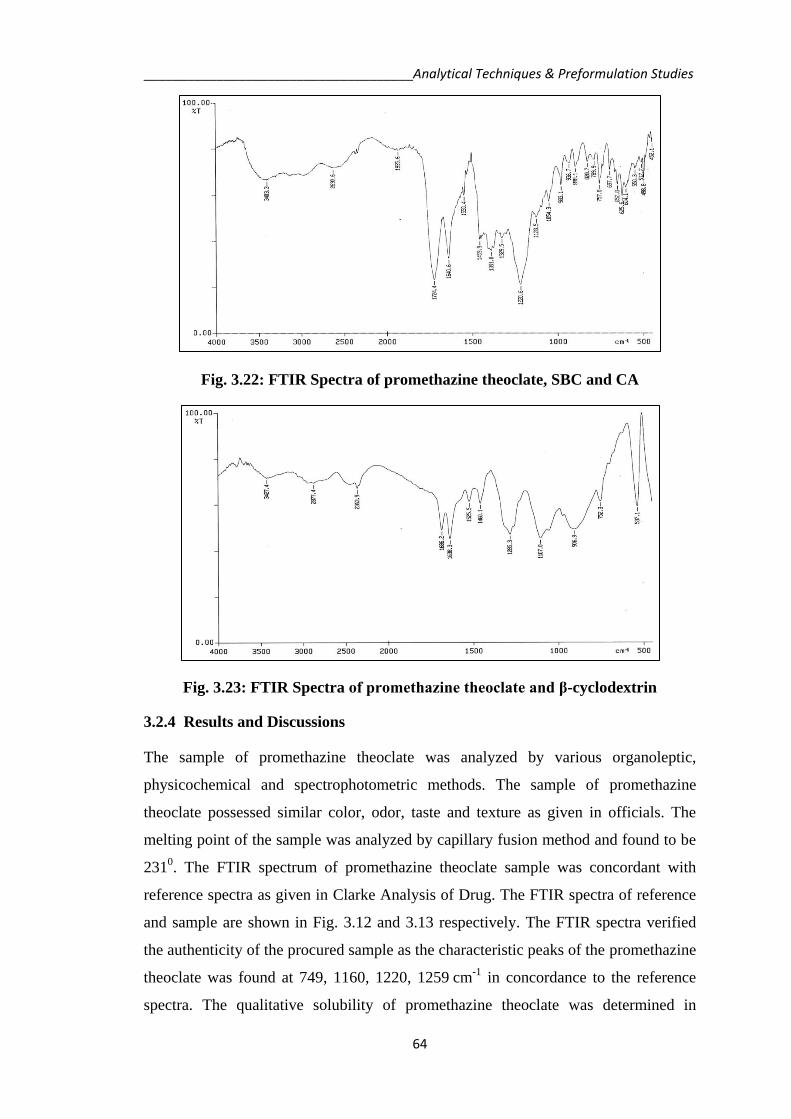
Fig. 3.22: FTIR Spectra of promethazine theoclate, SBC and CA
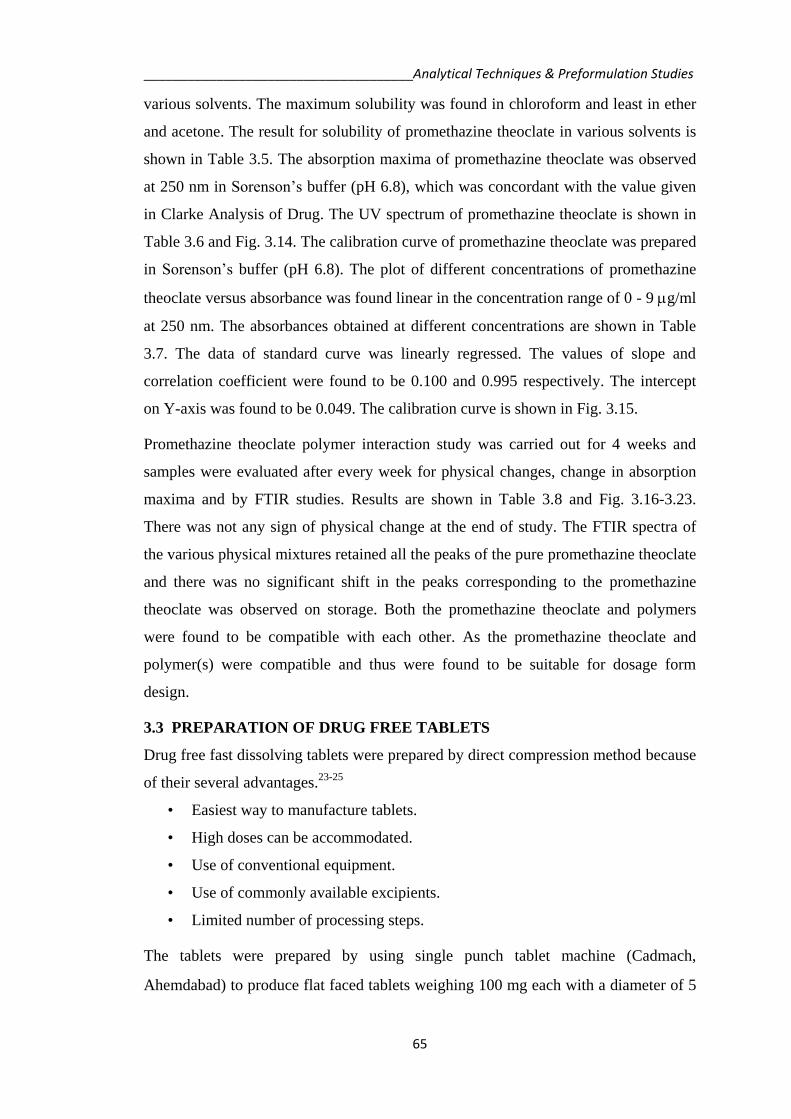
Fig. 3.23: FTIR Spectra of promethazine theoclate and β-cyclodextrin
3.2.4 Results and Discussions
The sample of promethazine theoclate was analyzed by various organoleptic,
physicochemical and spectrophotometric methods. The sample of promethazine
theoclate possessed similar color, odor, taste and texture as given in officials. The
melting point of the sample was analyzed by capillary fusion method and found to be
2310. The FTIR spectrum of promethazine theoclate sample was concordant with
reference spectra as given in Clarke Analysis of Drug. The FTIR spectra of reference
and sample are shown in Fig. 3.12 and 3.13 respectively. The FTIR spectra verified
the authenticity of the procured sample as the characteristic peaks of the promethazine
theoclate was found at 749, 1160, 1220, 1259 cm-1
in concordance to the reference
spectra. The qualitative solubility of promethazine theoclate was determined in
_____________________________________Analytical Techniques & Preformulation Studies
65
various solvents. The maximum solubility was found in chloroform and least in ether
and acetone. The result for solubility of promethazine theoclate in various solvents is
shown in Table 3.5. The absorption maxima of promethazine theoclate was observed
at 250 nm in Sorenson’s buffer (pH 6.8), which was concordant with the value given
in Clarke Analysis of Drug. The UV spectrum of promethazine theoclate is shown in
Table 3.6 and Fig. 3.14. The calibration curve of promethazine theoclate was prepared
in Sorenson’s buffer (pH 6.8). The plot of different concentrations of promethazine
theoclate versus absorbance was found linear in the concentration range of 0 - 9 g/ml
at 250 nm. The absorbances obtained at different concentrations are shown in Table
3.7. The data of standard curve was linearly regressed. The values of slope and
correlation coefficient were found to be 0.100 and 0.995 respectively. The intercept
on Y-axis was found to be 0.049. The calibration curve is shown in Fig. 3.15.
Promethazine theoclate polymer interaction study was carried out for 4 weeks and
samples were evaluated after every week for physical changes, change in absorption
maxima and by FTIR studies. Results are shown in Table 3.8 and Fig. 3.16-3.23.
There was not any sign of physical change at the end of study. The FTIR spectra of
the various physical mixtures retained all the peaks of the pure promethazine theoclate
and there was no significant shift in the peaks corresponding to the promethazine
theoclate was observed on storage. Both the promethazine theoclate and polymers
were found to be compatible with each other. As the promethazine theoclate and
polymer(s) were compatible and thus were found to be suitable for dosage form
design.
3.3 PREPARATION OF DRUG FREE TABLETS
Drug free fast dissolving tablets were prepared by direct compression method because
of their several advantages.23-25
• Easiest way to manufacture tablets.
• High doses can be accommodated.
• Use of conventional equipment.
• Use of commonly available excipients.
• Limited number of processing steps.
The tablets were prepared by using single punch tablet machine (Cadmach,
Ahemdabad) to produce flat faced tablets weighing 100 mg each with a diameter of 5
_____________________________________Analytical Techniques & Preformulation Studies
66
mm. A minimum of 50 tablets were prepared for each batch. Before compression
tablet blends were evaluated for mass-volume relationship (bulk density, tapped
density, Hausner’s ratio, compressibility index) and flow properties (angle of repose).
The formulations were developed by using different techniques.
3.3.1 Technology Followed – Superdisintegrant Addition
The superdisintegrants (Ac-di-sol, sodium starch glycolate and crospovidone) in
varying concentration (1-5% w/w) are used to develop the tablets. All the ingredients
are shown in Table 3.9 were passed through sieve no. 60 and were co-grounded in a
glass pestle motor.25-27
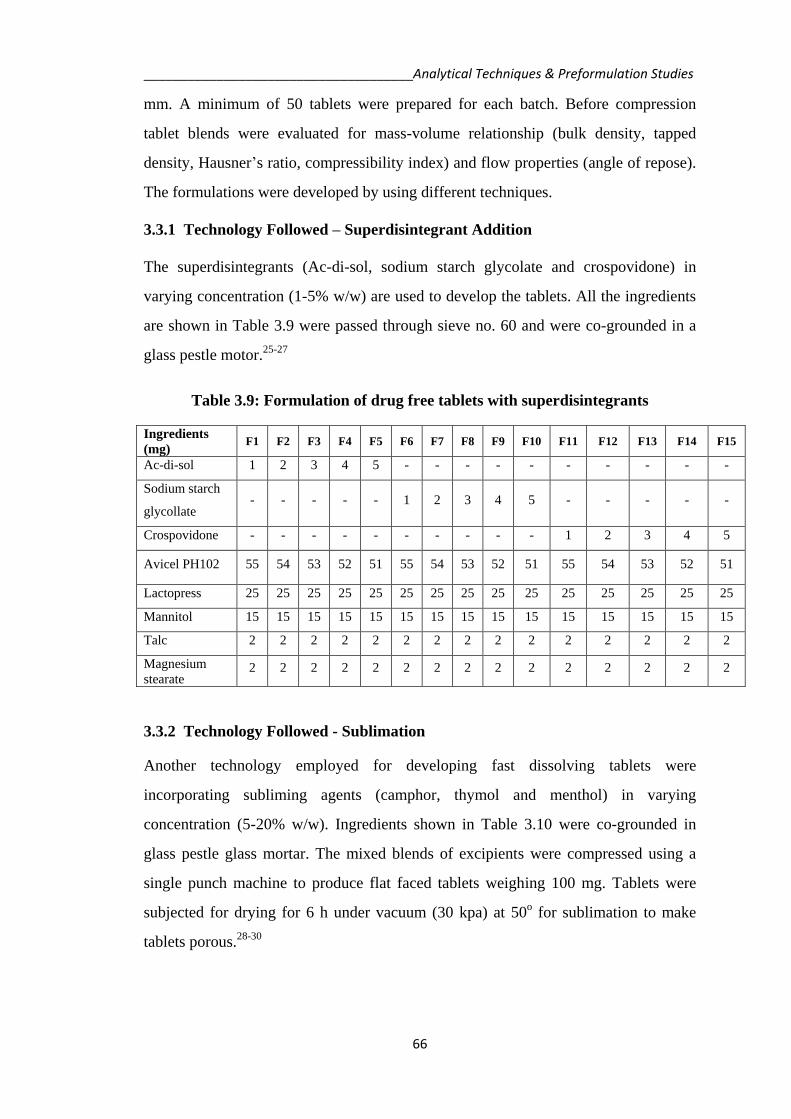
Table 3.9: Formulation of drug free tablets with superdisintegrants
Ingredients
(mg) F1 F2 F3 F4 F5 F6 F7 F8 F9 F10 F11 F12 F13 F14 F15
Ac-di-sol 1 2 3 4 5 - - - - - - - - - -
Sodium starch
glycollate - - - - - 1 2 3 4 5 - - - - -
Crospovidone - - - - - - - - - - 1 2 3 4 5
Avicel PH102 55 54 53 52 51 55 54 53 52 51 55 54 53 52 51
Lactopress 25 25 25 25 25 25 25 25 25 25 25 25 25 25 25
Mannitol 15 15 15 15 15 15 15 15 15 15 15 15 15 15 15
Talc 2 2 2 2 2 2 2 2 2 2 2 2 2 2 2
Magnesium
stearate 2 2 2 2 2 2 2 2 2 2 2 2 2 2 2
3.3.2 Technology Followed - Sublimation
Another technology employed for developing fast dissolving tablets were
incorporating subliming agents (camphor, thymol and menthol) in varying
concentration (5-20% w/w). Ingredients shown in Table 3.10 were co-grounded in
glass pestle glass mortar. The mixed blends of excipients were compressed using a
single punch machine to produce flat faced tablets weighing 100 mg. Tablets were
subjected for drying for 6 h under vacuum (30 kpa) at 50o for sublimation to make
tablets porous.28-30

_____________________________________Analytical Techniques & Preformulation Studies
67
Table 3.10: Formulation of drug free tablets with sublimating agents
Ingredients
(mg) F16 F17 F18 F19 F20 F21 F22 F23 F24 F25 F26 F27
Camphor 5 10 15 20 - - - - - - - -
Thymol - - - - 5 10 15 20 - - - -
Menthol - - - - - - - - 5 10 15 20
Avicel PH102 51 46 41 36 51 46 41 36 51 46 41 36
Lactopress 25 25 25 25 25 25 25 25 25 25 25 25
Mannitol 15 15 15 15 15 15 15 15 15 15 15 15
Talc 2 2 2 2 2 2 2 2 2 2 2 2
Magnesium
stearate 2 2 2 2 2 2 2 2 2 2 2 2
3.3.3 Technology Followed - Effervescent
Fast dissolving tablets were prepared by using citric acid and sodium-bi-carbonate in
combination in (1:2 ratio) with other excipients shown in Table 3.11 was co-grounded
in glass pestle glass mortar. These tablets contain (1-5% w/w) effervescent agent.31-33
Table 3.11: Formulation of drug free tablet with effervescent technology
Ingredient
(mg) F28 F29 F30 F31 F32
Citric Acid 0.33 0.66 1.00 1.32 1.65
NaHCO3 0.67 1.34 2.00 2.68 3.35
Avicel PH 102 55 54 53 52 51
Lactopress 25 25 25 25 25
Mannitol 15 15 15 15 15
Talc 2 2 2 2 2
Magnesium stearate 2 2 2 2 2
3.4 PRE-COMPRESSION CHARACTERIZATION
The quality of tablet, once formulated by rule, was generally dictated by the quality of
physicochemical properties of blends. There were many formulations and process
variables involved in mixing steps and all these can affect the characteristics of blend
produced. The characterization parameters for evaluating the flow property of mixed

_____________________________________Analytical Techniques & Preformulation Studies
68
blends includes bulk density, tapped density, Hausner’s ratio, compressibility index
and angle of repose.
3.3.1 Bulk Density
Apparent bulk density (ρb) was determined by pouring the blend into a graduated
cylinder. The bulk volume (Vb) and weight of powder (M) was determined.
34-37 The
bulk density was calculated using the formula
b
bV
M
3.3.2 Tapped Density
The measuring cylinder containing a known mass of blend was tapped 100 times
using density apparatus. The constant minimum volume (Vt) occupied in the cylinder
after tappings and the weight (M) of the blend was measured.34-37
The tapped density
(ρt) was calculated using the formula
t
tV
M
3.3.3 Compressibility Index
The simplest way for measurement of flow of the powder was its compressibility, an
indication of the ease with which a material can be induced to flow. 34-37
It is
expressed as compressibility index (I) which can be calculated as follows
100
t
btI
where, ρt = Tapped density; ρb = Bulk density
Table 3.12: Compressibility index as an indication of powder flow properties
Compressibility Index (%) Type of flow
>12 Excellent
12-16 Good
18-21 Fair to passable
23-35 Poor
33-38 Very poor
>40 Extremely poor
_____________________________________Analytical Techniques & Preformulation Studies
69
3.3.4 Hausner’s Ratio
Hausner’s ratio (HR) is an indirect index of ease of powder flow. It was calculated by
the following formula
b
tHR
where, ρt is tapped density and ρb is bulk density.
Lower Hausner’s ratio (<1.25) indicates better flow properties than higher ones.34
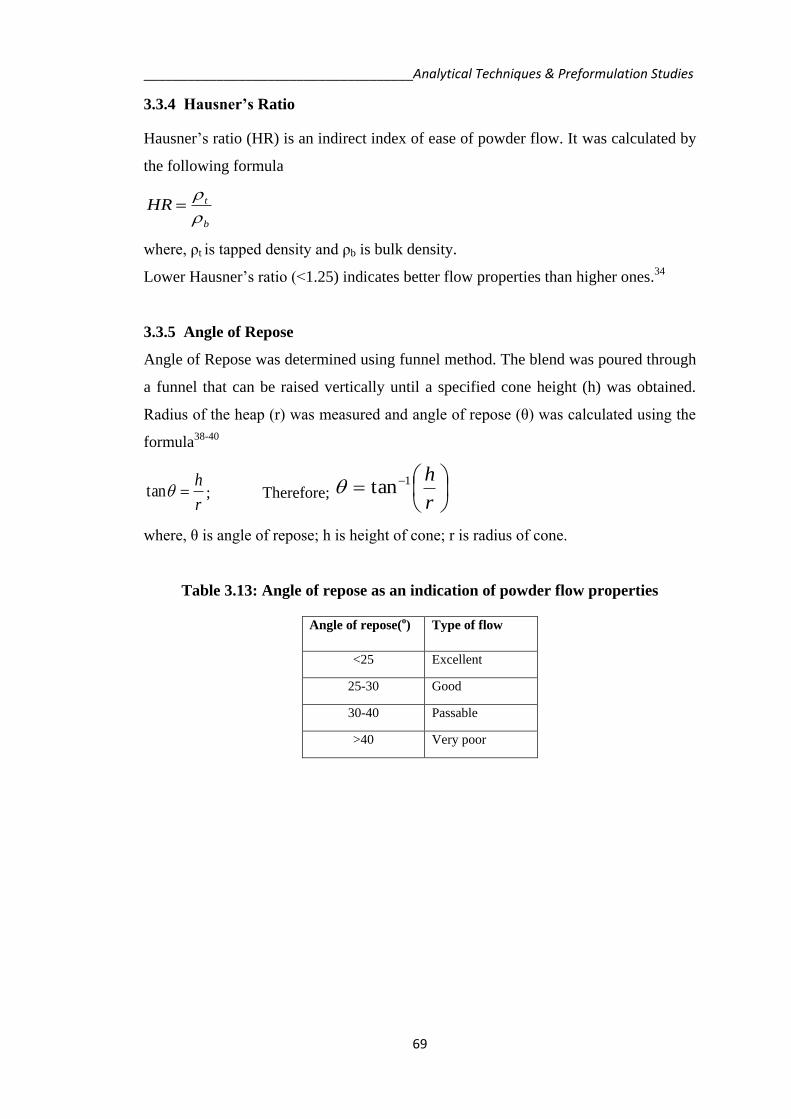
3.3.5 Angle of Repose
Angle of Repose was determined using funnel method. The blend was poured through
a funnel that can be raised vertically until a specified cone height (h) was obtained.
Radius of the heap (r) was measured and angle of repose (θ) was calculated using the
formula38-40
r
htan ; Therefore;
r
h1tan
where, θ is angle of repose; h is height of cone; r is radius of cone.
Table 3.13: Angle of repose as an indication of powder flow properties
Angle of repose(o) Type of flow
<25 Excellent
25-30 Good
30-40 Passable
>40 Very poor
_____________________________________Analytical Techniques & Preformulation Studies
70
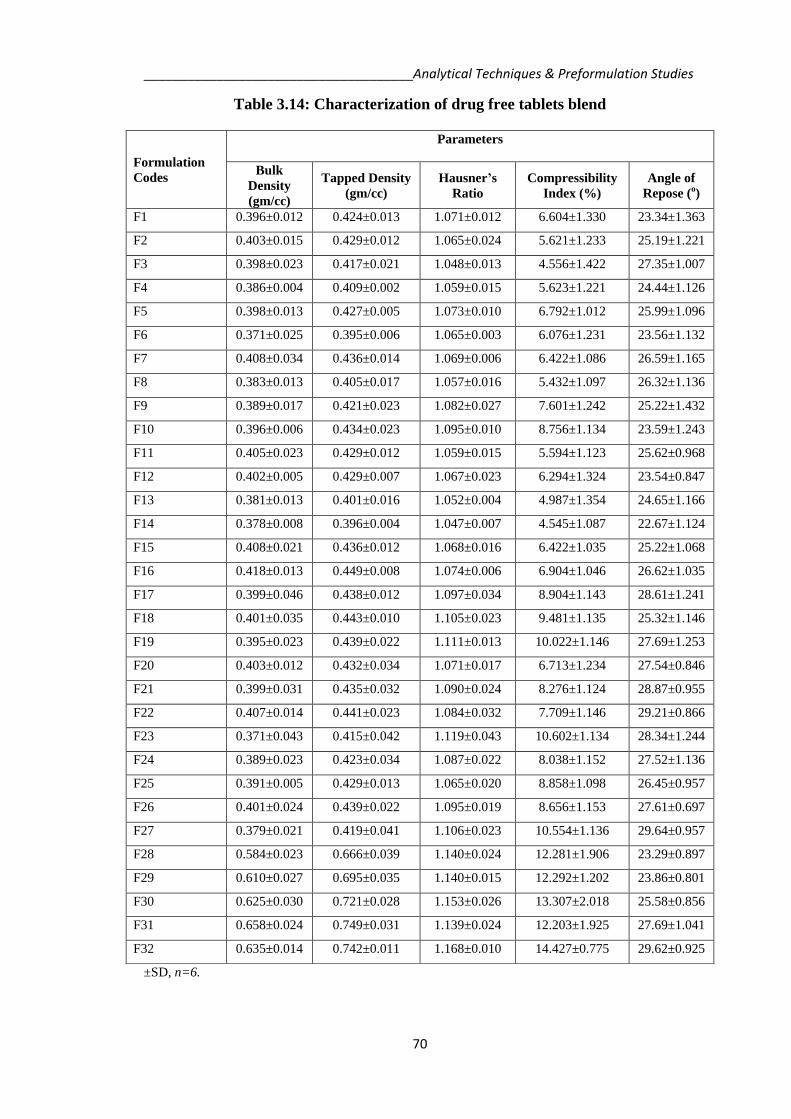
Table 3.14: Characterization of drug free tablets blend
±SD, n=6.
Formulation
Codes
Parameters
Bulk
Density
(gm/cc)
Tapped Density
(gm/cc)
Hausner’s
Ratio
Compressibility
Index (%)
Angle of
Repose (o)
F1 0.396±0.012 0.424±0.013 1.071±0.012 6.604±1.330 23.34±1.363
F2 0.403±0.015 0.429±0.012 1.065±0.024 5.621±1.233 25.19±1.221
F3 0.398±0.023 0.417±0.021 1.048±0.013 4.556±1.422 27.35±1.007
F4 0.386±0.004 0.409±0.002 1.059±0.015 5.623±1.221 24.44±1.126
F5 0.398±0.013 0.427±0.005 1.073±0.010 6.792±1.012 25.99±1.096
F6 0.371±0.025 0.395±0.006 1.065±0.003 6.076±1.231 23.56±1.132
F7 0.408±0.034 0.436±0.014 1.069±0.006 6.422±1.086 26.59±1.165
F8 0.383±0.013 0.405±0.017 1.057±0.016 5.432±1.097 26.32±1.136
F9 0.389±0.017 0.421±0.023 1.082±0.027 7.601±1.242 25.22±1.432
F10 0.396±0.006 0.434±0.023 1.095±0.010 8.756±1.134 23.59±1.243
F11 0.405±0.023 0.429±0.012 1.059±0.015 5.594±1.123 25.62±0.968
F12 0.402±0.005 0.429±0.007 1.067±0.023 6.294±1.324 23.54±0.847
F13 0.381±0.013 0.401±0.016 1.052±0.004 4.987±1.354 24.65±1.166
F14 0.378±0.008 0.396±0.004 1.047±0.007 4.545±1.087 22.67±1.124
F15 0.408±0.021 0.436±0.012 1.068±0.016 6.422±1.035 25.22±1.068
F16 0.418±0.013 0.449±0.008 1.074±0.006 6.904±1.046 26.62±1.035
F17 0.399±0.046 0.438±0.012 1.097±0.034 8.904±1.143 28.61±1.241
F18 0.401±0.035 0.443±0.010 1.105±0.023 9.481±1.135 25.32±1.146
F19 0.395±0.023 0.439±0.022 1.111±0.013 10.022±1.146 27.69±1.253
F20 0.403±0.012 0.432±0.034 1.071±0.017 6.713±1.234 27.54±0.846
F21 0.399±0.031 0.435±0.032 1.090±0.024 8.276±1.124 28.87±0.955
F22 0.407±0.014 0.441±0.023 1.084±0.032 7.709±1.146 29.21±0.866
F23 0.371±0.043 0.415±0.042 1.119±0.043 10.602±1.134 28.34±1.244
F24 0.389±0.023 0.423±0.034 1.087±0.022 8.038±1.152 27.52±1.136
F25 0.391±0.005 0.429±0.013 1.065±0.020 8.858±1.098 26.45±0.957
F26 0.401±0.024 0.439±0.022 1.095±0.019 8.656±1.153 27.61±0.697
F27 0.379±0.021 0.419±0.041 1.106±0.023 10.554±1.136 29.64±0.957
F28 0.584±0.023 0.666±0.039 1.140±0.024 12.281±1.906 23.29±0.897
F29 0.610±0.027 0.695±0.035 1.140±0.015 12.292±1.202 23.86±0.801
F30 0.625±0.030 0.721±0.028 1.153±0.026 13.307±2.018 25.58±0.856
F31 0.658±0.024 0.749±0.031 1.139±0.024 12.203±1.925 27.69±1.041
F32 0.635±0.014 0.742±0.011 1.168±0.010 14.427±0.775 29.62±0.925

_____________________________________Analytical Techniques & Preformulation Studies
71
3.5 POST-COMPRESSION CHARACTERIZATION
After compression of powder blends, the prepared tablets were evaluated for
organoleptic characteristics like color, odor, taste, diameter, thickness and physical
characteristics like hardness, friability, disintegration time, wetting time, dispersion
time. The results are shown in Table 3.16.
3.5.1 General Appearance
The general appearance of a tablet, its visual identification and over all ‘elegance’ is
essential for consumer acceptance. This includes tablet’s size, shape, color, presence
or absence of an odor, taste, surface texture, physical flaws etc.41
3.5.2 Tablet Thickness
Ten tablets were taken and their thickness was recorded using micrometer (Mityato,
Japan).
3.5.3 Weight Variation
The weight variation test would be satisfactory method of determining the drug
content uniformity. As per USP42
, twenty tablets were taken and weighted
individually, calculating the average weight, and comparing the individual tablet
weights to the average. The average weight of one tablet was calculated.
Table 3.15: Weight variation limits for tablets as per USP
Average Weight of Tablets (mg) Maximum % Difference Allowed
130 or less 10
130-324 7.5
More than 324 5
3.5.4 Hardness
Hardness of tablet is defined as the force applied across the diameter of the tablet in
order to break the tablet. The resistance of the tablet to chipping, abrasion or breakage
under condition of storage transformation and handling before usage depends on its
hardness. Hardness of the tablet of each formulation was determined using Pfizer
Hardness Tester.41, 43

_____________________________________Analytical Techniques & Preformulation Studies
72
3.5.5 Friability
Friability of the tablets was determined using Roche friabilator. This device subjects
the tablets to the combined effect of abrasions and shock in a plastic chamber
revolving at 25 rpm and dropping the tablets at a height of 6 inch in each revolution.
Preweighed sample of tablets was placed in the friabilator and were subjected to 100
revolutions. Tablets were dedusted using a soft muslin cloth and reweighed. The
friability (F %) was determined by the formula
100.1%
W
WoF
Where, W0 is initial weight of the tablets before the test and W is the weight of the
tablets after test.41, 44
3.5.6 Wetting Time
Wetting time of the tablets was measured using a piece of tissue paper (12 cm x10.75
cm) folded twice, placed in a small petridish (ID = 6.5 cm) containing 6 ml of
Sorenson’s buffer (pH 6.8). A tablet was put on the paper, and the time for the
complete wetting was measured.35, 45-47
Fig. 3.24: In vitro wetting property
3.5.7 In Vitro Dispersion Time
In vitro dispersion time was measured by dropping a tablet in a glass cylinder
containing 6 ml of Sorenson’s buffer (pH 6.8). Six tablets from each formulation were
randomly selected and in vitro dispersion time was performed.46, 48, 49
Fig. 3.25: In vitro dispersion property
_____________________________________Analytical Techniques & Preformulation Studies
73
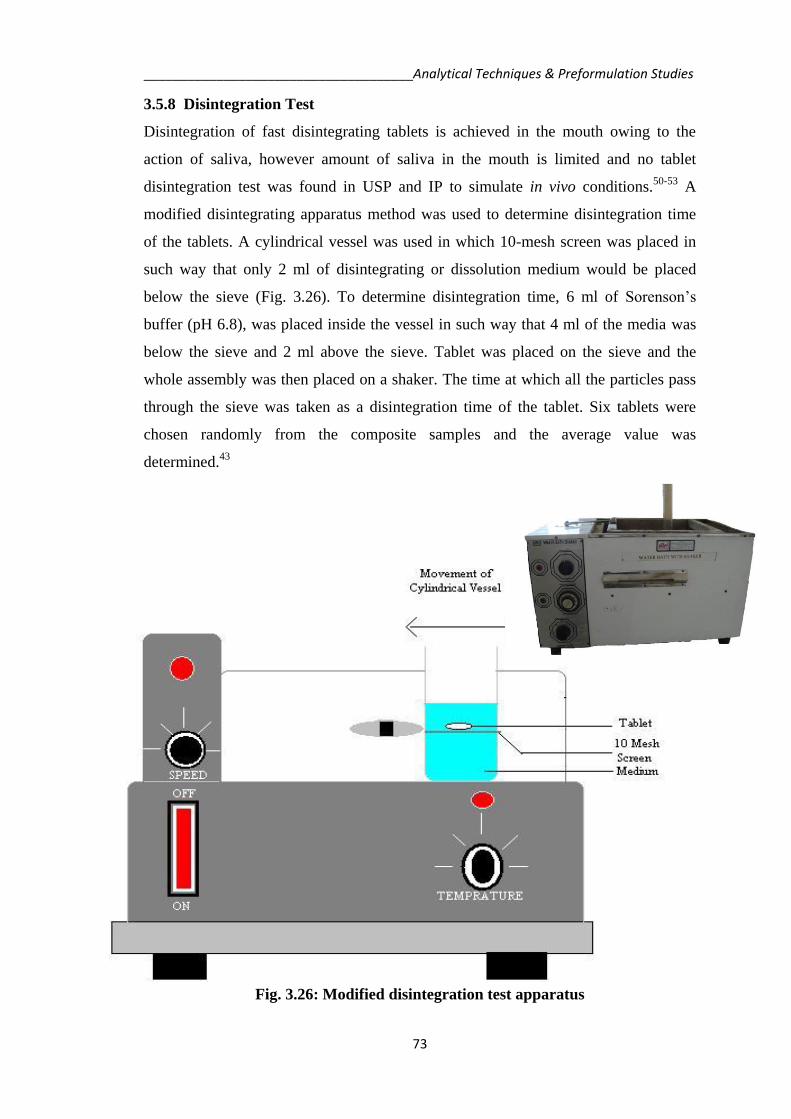
3.5.8 Disintegration Test
Disintegration of fast disintegrating tablets is achieved in the mouth owing to the
action of saliva, however amount of saliva in the mouth is limited and no tablet
disintegration test was found in USP and IP to simulate in vivo conditions.50-53
A
modified disintegrating apparatus method was used to determine disintegration time
of the tablets. A cylindrical vessel was used in which 10-mesh screen was placed in
such way that only 2 ml of disintegrating or dissolution medium would be placed
below the sieve (Fig. 3.26). To determine disintegration time, 6 ml of Sorenson’s
buffer (pH 6.8), was placed inside the vessel in such way that 4 ml of the media was
below the sieve and 2 ml above the sieve. Tablet was placed on the sieve and the
whole assembly was then placed on a shaker. The time at which all the particles pass
through the sieve was taken as a disintegration time of the tablet. Six tablets were
chosen randomly from the composite samples and the average value was
determined.43
Fig. 3.26: Modified disintegration test apparatus
_____________________________________Analytical Techniques & Preformulation Studies
74
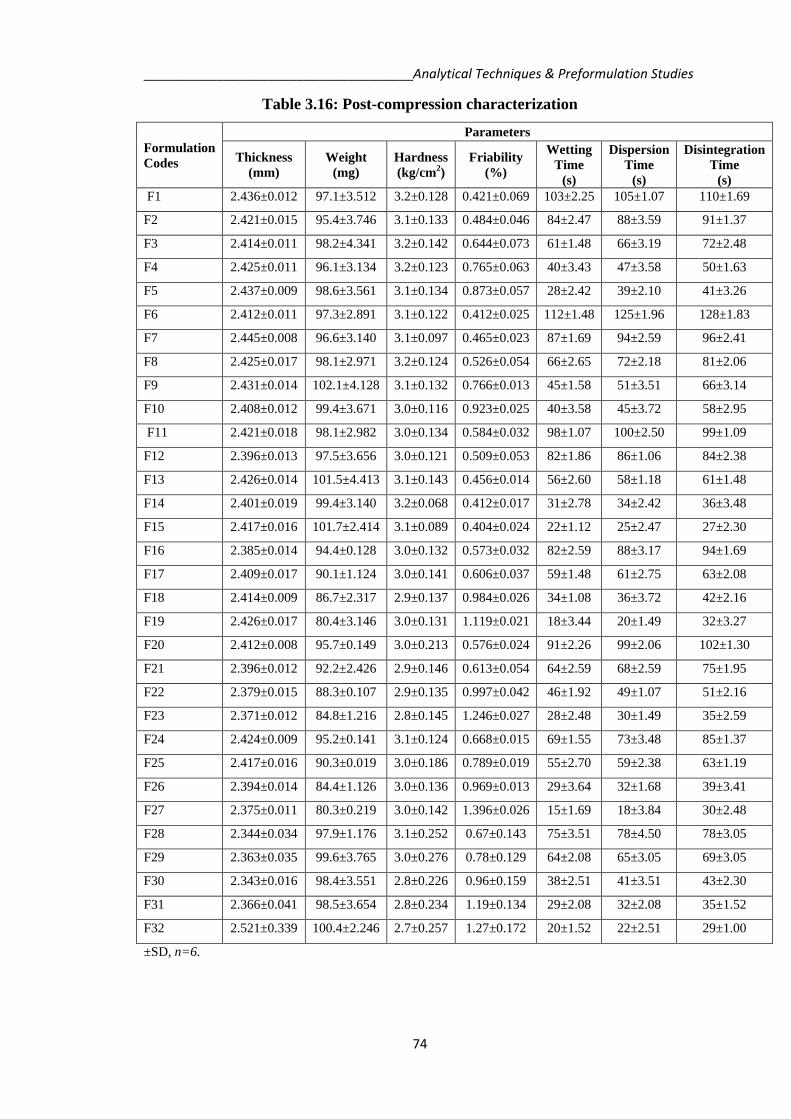
Table 3.16: Post-compression characterization
Formulation
Codes
Parameters
Thickness
(mm)
Weight
(mg)
Hardness
(kg/cm2)
Friability
(%)
Wetting
Time
(s)
Dispersion
Time
(s)
Disintegration
Time
(s)
F1 2.436±0.012 97.1±3.512 3.2±0.128 0.421±0.069 103±2.25 105±1.07 110±1.69
F2 2.421±0.015 95.4±3.746 3.1±0.133 0.484±0.046 84±2.47 88±3.59 91±1.37
F3 2.414±0.011 98.2±4.341 3.2±0.142 0.644±0.073 61±1.48 66±3.19 72±2.48
F4 2.425±0.011 96.1±3.134 3.2±0.123 0.765±0.063 40±3.43 47±3.58 50±1.63
F5 2.437±0.009 98.6±3.561 3.1±0.134 0.873±0.057 28±2.42 39±2.10 41±3.26
F6 2.412±0.011 97.3±2.891 3.1±0.122 0.412±0.025 112±1.48 125±1.96 128±1.83
F7 2.445±0.008 96.6±3.140 3.1±0.097 0.465±0.023 87±1.69 94±2.59 96±2.41
F8 2.425±0.017 98.1±2.971 3.2±0.124 0.526±0.054 66±2.65 72±2.18 81±2.06
F9 2.431±0.014 102.1±4.128 3.1±0.132 0.766±0.013 45±1.58 51±3.51 66±3.14
F10 2.408±0.012 99.4±3.671 3.0±0.116 0.923±0.025 40±3.58 45±3.72 58±2.95
F11 2.421±0.018 98.1±2.982 3.0±0.134 0.584±0.032 98±1.07 100±2.50 99±1.09
F12 2.396±0.013 97.5±3.656 3.0±0.121 0.509±0.053 82±1.86 86±1.06 84±2.38
F13 2.426±0.014 101.5±4.413 3.1±0.143 0.456±0.014 56±2.60 58±1.18 61±1.48
F14 2.401±0.019 99.4±3.140 3.2±0.068 0.412±0.017 31±2.78 34±2.42 36±3.48
F15 2.417±0.016 101.7±2.414 3.1±0.089 0.404±0.024 22±1.12 25±2.47 27±2.30
F16 2.385±0.014 94.4±0.128 3.0±0.132 0.573±0.032 82±2.59 88±3.17 94±1.69
F17 2.409±0.017 90.1±1.124 3.0±0.141 0.606±0.037 59±1.48 61±2.75 63±2.08
F18 2.414±0.009 86.7±2.317 2.9±0.137 0.984±0.026 34±1.08 36±3.72 42±2.16
F19 2.426±0.017 80.4±3.146 3.0±0.131 1.119±0.021 18±3.44 20±1.49 32±3.27
F20 2.412±0.008 95.7±0.149 3.0±0.213 0.576±0.024 91±2.26 99±2.06 102±1.30
F21 2.396±0.012 92.2±2.426 2.9±0.146 0.613±0.054 64±2.59 68±2.59 75±1.95
F22 2.379±0.015 88.3±0.107 2.9±0.135 0.997±0.042 46±1.92 49±1.07 51±2.16
F23 2.371±0.012 84.8±1.216 2.8±0.145 1.246±0.027 28±2.48 30±1.49 35±2.59
F24 2.424±0.009 95.2±0.141 3.1±0.124 0.668±0.015 69±1.55 73±3.48 85±1.37
F25 2.417±0.016 90.3±0.019 3.0±0.186 0.789±0.019 55±2.70 59±2.38 63±1.19
F26 2.394±0.014 84.4±1.126 3.0±0.136 0.969±0.013 29±3.64 32±1.68 39±3.41
F27 2.375±0.011 80.3±0.219 3.0±0.142 1.396±0.026 15±1.69 18±3.84 30±2.48
F28 2.344±0.034 97.9±1.176 3.1±0.252 0.67±0.143 75±3.51 78±4.50 78±3.05
F29 2.363±0.035 99.6±3.765 3.0±0.276 0.78±0.129 64±2.08 65±3.05 69±3.05
F30 2.343±0.016 98.4±3.551 2.8±0.226 0.96±0.159 38±2.51 41±3.51 43±2.30
F31 2.366±0.041 98.5±3.654 2.8±0.234 1.19±0.134 29±2.08 32±2.08 35±1.52
F32 2.521±0.339 100.4±2.246 2.7±0.257 1.27±0.172 20±1.52 22±2.51 29±1.00
±SD, n=6.

_____________________________________Analytical Techniques & Preformulation Studies
75
3.6 DEVELOPMENT OF COMBINATIONAL DRUG FREE TABLETS
The fast dissolving tablets were prepared by the combination of two disintegrants to
check their influence on the pre and post compression characteristics of the tablets.
These tablets were prepared as methods described earlier. Only the least concentration
of the disintegrants was used in tablets to evaluate their combined effect. The blends
and tablets were characterized as described earlier. The formulation of the tablet is
tabulated in Table 3.17.
Table 3.17: Combined formulation of drug free tablet
Ingredients
(mg) F33 F34 F35 F36 F37 F38
Ac-di-sol 1 - - - - -
SSG - 1 - - - -
Camphor - - 2.5 - - -
Menthol - - - 2.5 - -
Thymol - - - - 5 -
Effervescent - - - - - 1
Crospovidone 1 1 1 1 1 1
Avicel PH102 54 54 52.5 52.5 50 54
Lactopress 25 25 25 25 25 25
Mannitol 15 15 15 15 15 15
Talc 2 2 2 2 2 2
Magnesium
stearate 2 2 2 2 2 2
Table 3.18: Pre-compression tablet characterization
Characterization F33 F34 F35 F36 F37 F38
Bulk Density
(g/cc)
0.587
±0.013
0.599
±0.014
0.429
±0.012
0.360
±0.005
0.426
±0.007
0.629
±0.010
Tapped Density
(g/cc)
0.759
±0.039
0.857
±0.032
0.511
±0.005
0.413
±0.003
0.471
±0.009
0.682
±0.015
Hausner’s
Ratio
1.392
±0.055
1.431
±0.051
1.192
±0.025
1.148
±0.019
1.106
±0.014
1.084
±0.008
Compressibility
Index (%)
22.481
±3.295
30.066
±2.537
16.064
±1.782
12.910
±1.489
16.231
±0.326
7.759
±0.658
Angle of
Repose (o)
36.533
±0.501
38.557
±0.505
25.820
±0.459
25.020
±0.761
25.940
±0.516
24.533
±0.616
±SD, n=6.

_____________________________________Analytical Techniques & Preformulation Studies
76
Table 3.19: Post-compression characterization of drug free tablets
Characterization F33 F34 F35 F36 F37 F38
Weight
(mg)
100.20
±0.966
99.86
±0.266
94.083
±0.878
94.940
±1.195
93.380
±0.960
100.030
±0.121
Hardness
(kg/cm2)
3.0
±0.058
2.9
±0.116
2.9
±0.141
3.0
±0.042
3.0
±0.011
3.1
±0.014
Friability (%) 1.225
±0.059
1.375
±0.029
0.525
±0.032
0.659
±0.095
0.608
±0.032
0.626
±0.041
Disintegration
Time (s)
98
±3.25
92
±2.14
78
±1.19
68
±3.84
81
±2.13
70
±1.58
±SD, n=6.
From this study, it was clears that the combined effect of disintegrants with
crospovidone shows the better results on the properties of the tablets.54, 55
The
friability of the tablets was decreased by the incorporation of the crospovidone. The
disintegration time of the prepared tablets was also decreased by the crospovidone.
In the batches, F33 and F34 fair to passable flow of blends were observed. The
Hausner’s ratio was found greater than 1.25 and compressibility index was found
more than 16%. The poor flow of the blends were also evidenced by the angle of
repose, the values were higher than 30o. Hence it was clears, if a physical mixture of
superdisintegrant was used in high speed tabletting; the problem of segregation of the
disintegrants may be encountered. The attempt was made to overcome these problems
by the coprocessing of superdisintegrants (Ac-di-sol with crospovidone and sodium
starch glycolate with crospovidone).
3.7 DEVELOPMENT OF FDT BY COPROCESSED SUPERDISINTEGRANTS
Coprocessing is defined as combining two or more established excipients by an
appropriate process. Coprocessing of excipients by could lead to formation of
excipients with superior properties compared with simple physical mixture of their
components or with individual components.55
3.7.1 Preparation of Coprocessed Disintegrant Blends
The coprocessed superdisintegrant was prepared as follows. Blends of Ac-di-sol/SSG
and crospovidone in different ratios (1:1, 1:2, 1:3, 2:1, 2:3, 3:1, and 3:2) total weight
of 10 g was added to 50 ml of isopropyl alcohol. The content of beaker was stirred on
a magnetic stirrer at 50 rpm. The temperature was maintained between 65-700 and
stirring was continued till most of isopropyl alcohol evaporated. The wet coherent
mass was sieved through sieve number 100. The wet powder was dried in a tray drier

_____________________________________Analytical Techniques & Preformulation Studies
77
at 600 for 20 min. The dried powder sifted on 120 mesh sieve and stored in airtight
container until further used. For the preliminary study and evaluation only
coprocessed superdisintegrant was prepared in 1:1 ratio. Rest of ratio was prepared
for the factorial design batch/optimization.
3.7.2 Evaluation of Coprocessed Disintegrant Blends
Particle size analysis
The microscopic technique was used to test the particle size distribution of
superdisintegrants and their blends. The particle size of the disintegrants was
evaluating to prepare the slides of powder and observes under the microscope. To test
the swelling of superdisintegrant in water and Sorenson’s buffer (pH 6.8, saliva pH),
disintegrant powder were first dispersed in a small volume of liquid and the
ultrasonicated for 10 min. The suspension transferred with a pipette to a small volume
on the glass slide. The ratio of particle diameter in the dispersing medium to the dry
powders was used as an intrinsic swelling capacity of super disintegrant in the test
medium.
Fig. 3.27: Particle size analysis
0
50
100
150
200
250
Ac-
di-
sol
So
diu
m S
tarc
h G
lyco
late
Cro
spo
vid
on
e
PM
Ac-
di-
sol+
Cro
spo
vid
on
e (1
:1)
PM
SS
G+
Cro
spo
vid
on
e (1
:1)
Co
pro
cess
ed A
c-d
i-
sol+
Cro
spo
vid
on
e(1
:1)
Co
pro
cess
ed S
SG
+C
rosp
ov
ido
ne(
1:1
)
Vo
lum
e m
edia
n d
iam
eter
(μ
m)
Dry powder
Water
pH 6.8

_____________________________________Analytical Techniques & Preformulation Studies
78
Mass- volume relationship and flow properties
For the mass-volume relationship bulk density (ρb), tapped density (ρt), Hausner’s
ratio (RH = ρt / ρb) and compressibility index (Ic =100 (ρt – ρb) / ρb) was determined
with the bulk/tapped densitometer. The angle of repose was determined using funnel
method. The blend was poured through a glass funnel that can be raised vertically
until a specified cone height (h) was obtained. Radius of the conical pile (r) was
measured and angle of repose (θ) was calculated using the formula tan θ = h/r.34-40
The results are shown in Table 3.20.
Table 3.20: Evaluation of superdisintegrant
Batch Ratio
Bulk
Density
(g/cc)
Tapped
Density
(g/cc)
Hausner’s
Ratio
Compressibility
Index
(%)
Angle of
Repose
(0)
Ac-di-sol - 0.742
±0.019
0.911
±0.034
1.235
±0.011
21.059
±0.119
38.18
±0.106
SSG - 0.759
±0.005
0.945
±0.004
1.250
±0.004
20.029
±0.234
36.18
±0.174
Crospovidone - 1.244
±0.020
1.858
±0.015
1.494
±0.034
33.039
±1.519
44.02
±1.010
Physical Mixture
(Ac-di-sol
+Crospovidone)
1:1 0.785
±0.004
1.131
±0.009
1.312
±0.016
25.946
±1.153
39.96
±1.623
Physical Mixture
(SSG+
Crospovidone)
1:1 0.891
±0.008
1.157
±0.040
1.299
±0.039
22.946
±2.268
37.83
±1.714
Coprocessed
(Ac-di-sol
+Crospovidone)
1:1 0.512
±0.080
0.601
±0.017
1.173
±0.023
14.801
±0.218
24.16
±0.529
Coprocessed
(SSG+
Crospovidone)
1:1 0.624
±0.002
0.700
±0.004
1.122
±0.004
10.856
±0.332
22.42
±0.626
±SD, n=6.

_____________________________________Analytical Techniques & Preformulation Studies
79
Scanning electron micrographs
Finally to investigate the morphology of SSG, crospovidone and prepared
coprocessed superdisintegrant, scanning electron micrographs were taken using
(JOEL, JSM-35, CF) scanning electron microscope; where the samples were
previously sputter coated with gold.56
Fig. 3.28: Scanning electron micrographs
A. Crospovidone; B. Ac-di-sol; C. Sodium starch glycolate; D. Coprocessed Ac-di-Sol + Crospovidone;
E. Coprocessed Sodium starch glycolate + Crospovidone
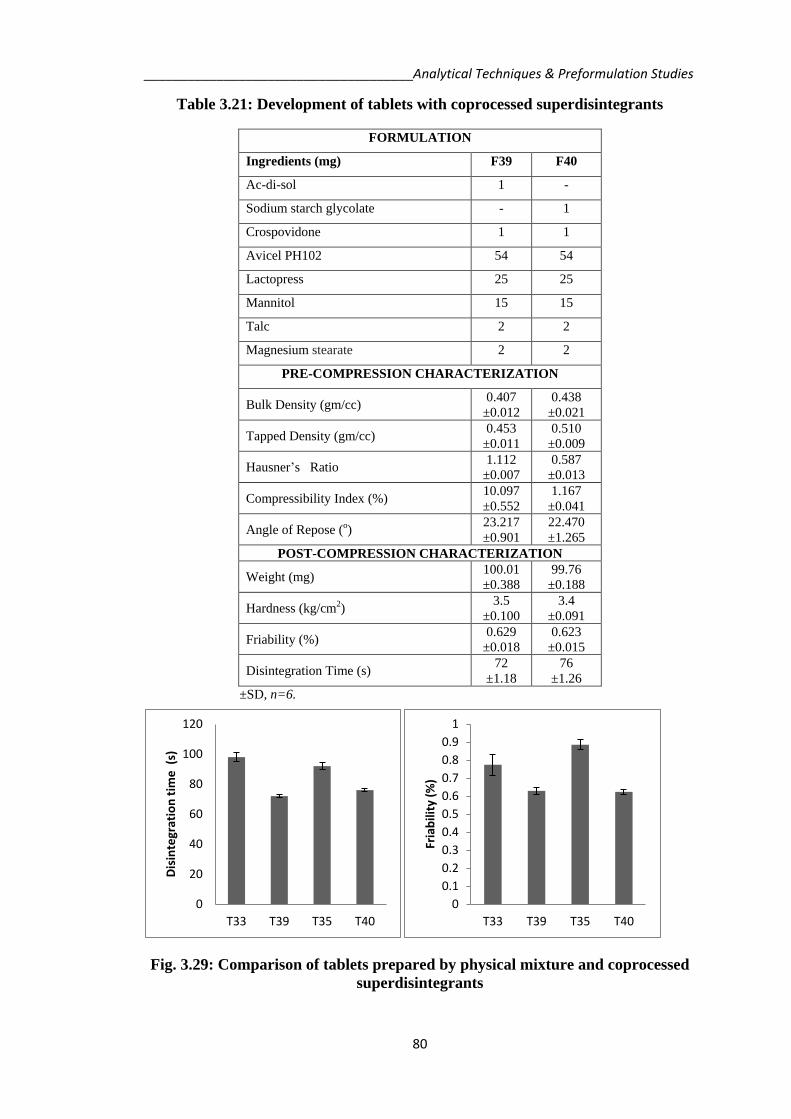
3.7.3 Preparation of FDT with Coprocessed Superdisintegrants
The fast dissolving tablets were prepared with coprocessed superdisintegrants (Ac-di-
sol with crospovidone and sodium starch glycolate with crospovidone) and evaluated
for pre and post-compression properties. The evaluated parameters were compared
with the tablets prepared by physical mixture of superdisintegrants. The formulation
and evaluations are tabulated in Table 3.21.
_____________________________________Analytical Techniques & Preformulation Studies
80
Table 3.21: Development of tablets with coprocessed superdisintegrants
FORMULATION
Ingredients (mg) F39 F40
Ac-di-sol 1 -
Sodium starch glycolate - 1
Crospovidone 1 1
Avicel PH102 54 54
Lactopress 25 25
Mannitol 15 15
Talc 2 2
Magnesium stearate 2 2
PRE-COMPRESSION CHARACTERIZATION
Bulk Density (gm/cc) 0.407
±0.012
0.438
±0.021
Tapped Density (gm/cc) 0.453
±0.011
0.510
±0.009
Hausner’s Ratio 1.112
±0.007
0.587
±0.013
Compressibility Index (%) 10.097
±0.552
1.167
±0.041
Angle of Repose (o) 23.217
±0.901
22.470
±1.265
POST-COMPRESSION CHARACTERIZATION
Weight (mg) 100.01
±0.388
99.76
±0.188
Hardness (kg/cm2) 3.5
±0.100
3.4
±0.091
Friability (%) 0.629
±0.018
0.623
±0.015
Disintegration Time (s) 72
±1.18
76
±1.26
±SD, n=6.
Fig. 3.29: Comparison of tablets prepared by physical mixture and coprocessed
superdisintegrants
0
20
40
60
80
100
120
T33 T39 T35 T40
Dis
inte
grat
ion
tim
e (
s)
0
0.1
0.2
0.3
0.4
0.5
0.6
0.7
0.8
0.9
1
T33 T39 T35 T40
Fria
bili
ty (
%)

_____________________________________Analytical Techniques & Preformulation Studies
81
3.8 RESULTS AND DISCUSSIONS
During preliminary studies, thirty two blind formulations were prepared by employing
different concentrations of superdisintegrants (1-5% w/w), sublimating agents (5-20%
w/w) and effervescent agents (1-5% w/w). The pre-compression characterizations of
mixed blends were done for determination of mass volume relationship and flow
properties. The evaluated parameters were bulk density, tapped density, Hausner’s
ratio, compressibility index and angle of repose.
For drug free tablets prepared by using various disintegrating agents, the bulk density
of blend varied between 0.371-0.658 gm/cc. The tapped density was found in the
range of 0.395-0.749 gm/cc. The results indicated good packaging capacity of tablets.
By using these two density data, Hausner’s ratio and compressibility index was
calculated. If the bed particle was more compressible then the powder will be less
flowable and vice versa. The value of compressibility index was found between
4.545-14.427%. The powder blends of all formulation had Hausner’s ratio less than
1.25 indicating good flow characteristics.34
The compressibility–flowability
correlation data indicating a good flowability of the powder blend. The flowability of
the powder was also evidenced by the angle of repose. The angle of repose below 30o
range indicates good to excellent flow properties of powder. Lower the friction
occurring within the mass, better the flow rate.39
The angle of repose was found to be
in range 23.29-29.62o. The results showed good flow property of the formulated
mixed blends due to the addition of talc as lubricant and magnesium stearate as
glidant in the 2% w/w and 2% w/w of the tablet weight respectively. The results for
pre-compression characterization of blend are shown in Table 3.14.
After compression of powder blends, the tablets were evaluated for their post-
compression properties like organoleptic, physical and quality control parameters
(diameter, thickness, hardness, friability, disintegration time, wetting time and
dispersion time). All the formulations are white in color, odorless, flat in shape with
smooth surface. The prepared tablets were elegant and lot-to-lot tablet uniformity and
also free from any surface texture problems.
The thickness of the tablets varied between 2.343-2.521 mm. The average weight of
the prepared tablets with superdisintegrants and effervescent agents were found
between 95.4-102.1 mg. The average weight of the tablets prepared by vacuum drying

_____________________________________Analytical Techniques & Preformulation Studies
82
technique was found 80.3-95.7 mg due to the elimination of the sublimating agents
from the tablets. So it was predicted that all the tablets exhibited uniform weight with
low standard deviation values within the acceptable variation as per USP.42
The friability of the formulations was less than 1.0%, showed the durability of the
tablets; resistance to loss of weight indicates the tablet’s ability to withstand abrasion
in handling, packaging and shipment.39
The friability of all the formulations was
found to be less than 1.0 % except those containing higher concentrations of
subliming agents (F19, F21, F27, F31 and F32). It was clear from the study that as the
concentration of sublimating agents was increasing the percent friability was also
increasing. The hardness of the prepared tablet varied from 2.7-3.2 kg/cm2, which has
satisfactory strength to withstand with the applied mechanical shocks.
A disintegrant was found in all the formulations to facilitate a breakup or
disintegration of the tablet when it contacts with water or saliva in mouth. The
disintegration process of the tablet was fully dependable on nature and concentration
of superdisintegrant used. Disintegrants drawing the water into the tablet causes
wicking, swelling and burst apart. The tablets with crospovidone disintegrate faster
than the tablets with the citric acid and sodium-bi-carbonate, sodium starch glycolate
and Ac-di-sol and camphor, menthol and thymol. The tablets prepared with
superdisintegrants disintegrate in 27-128 s. The tablets prepared with effervescent
technology elaborates the carbon-di-oxide gas when the tablet comes in contact with
little amount of saliva or water due to reaction between citric acid and sodium-bi-
carbonate which results in breakup of tablets. The tablets prepared with effervescent
agents disintegrate in 29-78 s. The porous structure of the tablets prepared with
sublimating agents was responsible for the for fast water uptake, which facilitates the
disintegration of tablets. The tablets prepared with sublimating agents disintegrate in
29-102 s.
The in vitro wetting time was also studied to know the time required for complete
wetting of tablets when placed on tong. The in vitro wetting time of all the
formulations were varied between 20-125 s. The swelling properties of the tablets
were depending upon their concentration and type of superdisintegrants. The result
shows that swelling time was reduced with increase in the concentration of the
superdisintegrant. The results are tabulated in Table 3.16.
_____________________________________Analytical Techniques & Preformulation Studies
83
The tablets with crospovidone showed the best results on compare to others and hence
it was selected as one factor of the optimization of the fast dissolving tablets.54
Thus,
it was decided to carryout optimization studies with other disintegrants in
combination with the superdisintegrant crospovidone.
The tablets prepared by combination of two disintegrants gave better results in terms
of disintegration time and friability than using single disintegrant. The tablet may
disintegrate by two properties. In the tablets, F35, F36 and F37 the porous structure
developed by sublimating agents (camphor, menthol and thymol) was responsible for
water uptake, hence it facilitates wicking action of crospovidone in bringing faster
disintegration.54
By the incorporation of crospovidone the friability of the tablets was
also decreased. In the tablets, batch F38 the capillary action of crospovidone raises the
medium, for the completion of reaction between sodium-bi-carbonate and citric acid.
The faster uptake of medium in the tablets faster the tablet disintegrates. In tablet
batch F33 and F34 pre-compression and post-compression evaluations not found in
limits, due to the great difference between shape, size and compressibility properties
of two superdisintegrants (Ac-di-sol/sodium starch glycolate and crospovidone). The
poor flow property and compressibility properties of the physical mixture was
observed (Table 3.18). Due to the less compressibility the formed tablets were friable
in nature. Thus, it was decided to prepare coprocessed disintegrants (Ac-di-sol with
crospovidone and sodium starch glycolate with crospovidone). Coprocessing of
excipients could lead to formation of excipients with superior properties compared
with the simple physical mixture of their components or individual components.55
In preliminary investigation, water, ethyl alcohol, dichloromethane and isopropyl
alcohol were used for coprocessing of the superdisintegrant. Water was ruled out for
further experiment because gel formation occurs due to the presence of starch in Ac-
di-sol and sodium starch glycolate. Dichloromenthane was omitted because of
floating of crospovidone and sedimentation of Ac-di-sol and sodium starch glycolate.
Ac-di-sol and sodium starch glycolate was sparingly soluble in ethyl alcohol.
Isopropyl alcohol was selected considering the absence of gel formation and phase
separation.
The diameters of superdisintegrants in different media was determined are given in
Fig. 3.27. A significant reduction in swelling capacity was also observed in physical

_____________________________________Analytical Techniques & Preformulation Studies
84
mixture as well as coprocessed superdisintegrants in Sorenson’s buffer (pH 6.8). The
sudden decrease in swelling capacity of chemically modified starch may attribute to
the converting of the carboxymethyl sodium moieties to its free acid form in acidic
medium. Since the acid medium form has less hydration capacity than its salt form,
the liquid holding capacity of the disintegrant particle reduces after deionization in the
slightly acidic medium.26
Therefore, the total degree of substitution and the ratio of
basic to acidic substituent’s were potential factors determining the extent of influence
of medium pH on the swelling properties of disintegrants and blends particles. Unlike
the other superdisintegrant, there was no apparent change in the swelling capability of
the nonionic polymer crospovidone in both media. The results illustrated that the
physical mixing and coprocessing give better swelling than used alone.
The bulk density, tapped density, compressibility index, Hausner’s ratio and angle of
repose studied all batches shown in Table 3.20. According to literature the powder
compressibility index between 5 to 16% was suitable for punching tablets and those
Hausner’s ratio below 1.25 exhibited good flowability.39
Only coprocessed
superdisintegrant batches were fallen in the limit/range. On the evaluation of
superdisintegrant angle of repose of the physical mixture and coprocessed
disintegrants (1:1) was found to be 37.83-39.360 and 22.42-24.16
0 respectively.
According to literature, good flow (angle of repose between 200 and 35
0) was shown
by coprocessed superdisintegrants. It was concluded that the particle size distribution
and shape of the excipients would be kept the same to avoid the tabletting problem.
The morphology and surface properties of Ac-di-sol, sodium starch glycolate,
crospovidone and coprocessed superdisintegrant were visualized using scanning
electron microscopy (SEM) shown in Fig. 3.28. All powder batches were presented in
magnificence of X150. From these micrographs we observed clear difference between
the structure and size of superdisintegrants.
The tablets were prepared by the coprocessed superdisintegrants showed better results
than the tablets prepared by using physical mixture or by using individual components
(Table 3.21 and Fig. 3.29). The results clears that the disintegration time and percent
friability have a great difference in physical mixture and coprocessed
superdisintegrants. When, Ac-di-sol and sodium starch glycolate was used, higher
water uptake swelling and deformation of disintegrants take place, which gives
internal pressure to tablet to disintegrate. It was obvious that in the presence of

_____________________________________Analytical Techniques & Preformulation Studies
85
crospovidone, wicking was facilitated.57
The use of a physical mixture
superdisintegrant resulted in increased friability probably due to low compressibility
of excipients. By the coprocessing technology the friability of tablets was also
decreased.
By evaluating these tablets, the levels for the optimization of the independent factors
were to be set. The three levels (-1, low; 0, medium; +1, high) of different
disintegrating agents were selected.
Table 3.22: Selected independent factors with their levels
Category Group Independent Factor Level (mg)
-1 0 1
Coprocessing
Technology
G-1 X1 Ac-di-sol 1 2 3
X2 Crospovidone 1 2 3
G-2 X1 Sodium Starch Glycolte 1 2 3
X2 Crospovidone 1 2 3
Pore forming
Technology
G-3 X1 Camphor 2.5 5 7.5
X2 Crospovidone 1 2 3
G-4 X1 Menthol 2.5 5 7.5
X2 Crospovidone 1 2 3
G-5 X1 Thymol 5 10 15
X2 Crospovidone 1 2 3
Effervescent
Technology
G-6 X1 Effervescent Agent 1 2 3
X2 Crospovidone 1 2 3

_____________________________________Analytical Techniques & Preformulation Studies
86
REFERENCES
1. McKay G, Hall K, Cooper JK, Hawes EM, Midha KK. Gas chromatographic
mass spectrometric procedure for the quantitation of prochlorperazine in plasma
and its comparison with a new high performance liquid chromatographic assay
with electrochemical detection. J Chromatogr 1982; 232(2): 275-282.
2. Yan M, Zhu YG, Li HD, Chen BM, Ma N, Lei YQ, Liu YP. Quantification of
prochlorperazine maleate in human plasma by liquid chromatography-mass
spectrometry: application to a bioequivalence study. J Chromatogr B Analyt
Technol Biomed Life Sci 2009; 877(27): 3243-3247.
3. Uraisin K, Takayanagi T, Nacapricha D, Motomizu S. Novel oxidation reaction
of prochlorperazine with bromate in the presence of synergistic activators and its
application to trace determination by flow injection/spectrophotometric method.
Anal Chim Acta 2006; 580(1): 68-74.
4. Marumo A, Kumazawa T, Lee XP, Fujimaki K, Kuriki A, Hasegawa C, Sato K,
Seno H, Suzuki O. Analysis of phenothiazines in human body fluids using disk
solid-phase extraction and liquid chromatography. J AOAC Int 2005;
88(6):1655-1660.
5. Honigberg IL, Stewart JT, Smith AP, Plunkett RD, Justice EL. Liquid
chromatography in pharmaceutical analysis IV: determination of antispasmodic
mixtures. J Pharm Sci 1975; 64(8): 1389-1393.
6. Tanaka E, Nakamura T, Terada M, Shinozuka T, Hashimoto C, Kurihara K,
Honda K. Simple and simultaneous determination for 12 phenothiazines in
human serum by reversed phase high performance liquid chromatography. J
Chromatogr B Analyt Technol Biomed Life Sci 2007; 854(1-2): 116-120.
7. Mizuno Y, Sato K, Sano T, Kurihara R, Kojima T, Yamakawa Y, Ishii A,
Katsumata Y. Identification and characterization of 17 phenothiazine
compounds by capillary high-performance liquid chromatography/fast atom
bombardment mass spectrometry. Leg Med 2002; 4(4): 207-216.
8. Mou C, Ganju N, Sridhar KS, Krishan A. Simultaneous quantitation of plasma
doxorubicin and prochlorperazine content by high performance liquid
chromatography. J Chromatogr B Biomed Sci Appl 1997; 703(1-2): 217-224.
9. Kitamura K, Goto T, Kitade T. Second derivative spectrophotometric
determination of partition coefficients of phenothiazine derivatives between

_____________________________________Analytical Techniques & Preformulation Studies
87
human erythrocyte ghost membranes and water. Talanta 1998; 46(6): 1433-
1438.
10. Hasegawa C, Kumazawa T, Lee XP, Fujishiro M, Kuriki A, Marumo A, Seno
H, Sato K. Simultaneous determination of ten antihistamine drugs in human
plasma using pipette tip solid phase extraction and gas chromatography/mass
spectrometry. Rapid Commun Mass Spectrom 2006; 20(4): 537-543.
11. Leelavathi DE, Dressler DE, Soffer EF, Yachetti SD, Knowles JA.
Determination of promethazine in human plasma by automated high
performance liquid chromatography with electrochemical detection and by gas
chromatography mass spectrometry. J Chromatogr 1985; 339(1):105-115.
12. Reddropa CJ, Riessa W, Slatera TF. Determination of unchanged promethazine
by gas chromatography mass spectrometry. J Chromatogar A 1980; 192(2):
375-386.
13. Lutka A. Investigation of interaction of promethazine with cyclodextrins. Acta
Pol Pharm 2002; 59(1): 45-51.
14. DeMol NJ, Koenen J. Degradation products of the promethazine radical cation.
Pharm World Sci 1985; 7(3): 121-124.
15. Saleha OA, El-Azzounya AA, Aboul-Eneina HY, Badawyb AM. A validated
HPLC method for separation and determination of promethazine enantiomers in
pharmaceutical formulations. Drug Dev Ind Pharm 2009; 35(1): 19-25.
16. Thumma S, Zhang SQ, Repka MA. Development and validation of a HPLC
method for the analysis of promethazine hydrochloride in hot-melt extruded
dosage forms. Pharmazie 2008; 63(8): 562-567.
17. Patel RB, Welling PG. High pressure liquid chromatographic determination of
promethazine plasma levels in the dog after oral, intramuscular, and intravenous
dosage. J Pharm Sci 2006; 71(5): 529-532.
18. Cruz VM, Lucena R, Cardenas S, Valcarcel M. Determination of phenothiazine
derivatives in human urine by using ionic liquid based dynamic liquid-phase
microextraction coupled with liquid chromatography. J Chromatogr B Analyt
Technol Biomed Life Sci 2009; 877(1-2): 37-42.
19. Ponder GW, Stewart JT. A liquid chromatographic method for the
determination of promethazine enantiomers in human urine and serum using
solid-phase extraction and fluorescence detection. J Pharm Biomed Ana 1995;
13(9): 1161-1166.
_____________________________________Analytical Techniques & Preformulation Studies
88
20. Magdalena WK, Skalskaa A, Matysikb A. Determination of phenothiazine
derivatives by high performance thin layer chromatography combined with
densitometry. J Pharm Biomed Ana 2006; 41(1): 286-289.
21. Abdol AM, Khoi E. Spectrophotometric promethazine hydrochloride
determination using bromcresol green. J Pharm Sci 2006; 72(6): 704-705.
22. Liu YM, Yu RQ, (1987), UV spectrophotometric simultaneous determination of
promethazine hydrochloride. Yao Xue Xue Bao 1987; 2(12): 913-917.
23. Mishra DN, Vijaya KSG. Rapidly disintegrating oral tablets of meloxicam.
Indian Drugs 2006; 43(2): 117-121.
24. Bi YX, Sunda Y, Yonezawa Y, Danjo K. Evaluation of rapidly disintegrating
tablets prepared by a direct compression method. Drug Dev Ind Pharm 1999; 25
(5): 571-581.
25. Sreenivas SA, Gadad AP, Dandagi PM, Mastiholimath VS, Patil MB.
Formulation and evaluation of ondeanesetron hydrochloride directly compressed
mouth disintegrating tablets. Indian Drugs 2006; 43(1): 35-38.
26. Zhao N, Augsburger LL. Functionally compression of 3 classes of
superdisintegrants in promoting aspirin tablet disintegration and dissolution.
AAPS Pharm Sci Tech 2005; 6(4): 634-640.
27. Kuchekar BS, Mahajan HS, Bandhan AC. Mouth dissolve tablets of salbutamol
sulphate: a novel drug delivery system. Indian Drugs 2004; 41(10): 592-598.
28. Aly AM, Semreen M, Qato MK. Superdisintegrants for solid dispersion to
produce rapidly disintegrating tenoxicam tablets via camphor sublimation.
Pharm Tech 2005; 20: 68-78.
29. Koizumi K, Watanabe Y, Morita K, Utoguchi N, Matsumoto M. New method of
preparing high-porosity rapidly saliva soluble compressed using mannitol with
camphor: a subliming material. Int J Pharm 1997; 152: 127-131.
30. Mane AR, Kusum DV, Asha AN. A novel technique for the preparation of
mouth dissolving tablets of domperidone. Indian Drugs 2003; 40(9): 544-546.
31. Sallam E, Ibrahim H, Abu DR, Shubair M, Khalil E. Evaluation of fast
disintegrants in terfenadine tablets containing a gas evolving disintegrant. Drug
Dev Ind Pharm 1998; 24(6): 501-507.

_____________________________________Analytical Techniques & Preformulation Studies
89
32. Nayak SM, Gopalkumar P. Design and optimization of fast dissolving tablets for
promethanine. Indian Drugs 2004; 41(9): 554-556.
33. Kaushik D, Dureja H, Saini TR, Formulation and evaluation of olanzapine
mouth dissolving tablets by effervescent formulation approach. Indian Drugs
2004; 41(7): 410-412.
34. Khan S, Kataria P, Nakhat P, Yeole P. Taste masking of ondansetron
hydrochloride by polymer carrier system and formulation of rapid disintegrating
tablets. AAPS Pharm Sci Tech 2007; 8(2): E1-E7.
35. Sunada H, Bi Y. Preparation, evaluation and optimization of rapidly
disintegrating tablets. Powder Technology 2002; 122: 188-198.
36. Marshall K, Compression and consolidation of powdered solid. In: Lachman L,
Liberman HA and Kaning JL, Eds., The Theory and Practice of Industrial
Pharmacy, 3rd
Edn., Varghese publishing house, Mumbai, 1987; 66-99.
37. Gorman EA, Rhodes CT, Rudnic EM. An evaluation of croscarmellose as a
tablet disintegrant in direct compression systems. Drug Dev Ind Pharm 1982;
8(4): 397–410.
38. Chaudhari PD, Chaudhari SP, Kolhe SR, Dave KV, More DM. Formulation and
evaluation of fast dissolving tablets of famotidine. Indian Drugs 2005; 42(10):
641-649.
39. Lindberg N, Palsoson M, Pihl A, Freeman R, Zetzener H, Enstad G. Flowability
measurements of pharmaceutical powder mixtures with poor flow using five
different techniques. Drug Dev Ind Pharm 2004; 30(7): 785-791.
40. Cooper J, Gunn C. Powder flow and compaction. In: Carter SJ, Eds., Tutorial
Pharmacy, 3rd
Edn., CBS publishers and distributors, New Delhi, 1986; 211-
233.
41. Banker SB, Anderson NR, Tablets. In: Lachman L, Liberman HA and Kaning
JL, Eds., The Theory and Practice of Industrial Pharmacy, 3rd
Edn., Varghese
publishing house, Mumbai, 1987; 293-345.
42. United States Pharmacopoeia 30/ NF25. The Official Compendia of Standards.
Electronic edition. Rockville, MD: United States Pharmacopoeial Convention
Inc. 2007.
_____________________________________Analytical Techniques & Preformulation Studies
90
43. Late SG, Yi-Ying Y, Banga AK. Effect of disintegration promoting agent,
lubricants and moisture treatment on optimized fast disintegrating tablets. Int. J
Pharm 2009; 365: 4-11.
44. Pandey PV, Amarnath R. Formulation and evaluation of chlorquine phosphate
tablets using some disintegrants. The Indian Pharmacist 2007; 6(66): 75-79.
45. Bi Y, Sunada H, Yonezawa Y, Danjo K, Otsuka A, Lida K. Preparation and
evaluation of a compressed tablet rapidly disintegrating in oral cavity. Chem
Pharm Bull 1996; 44: 2121-2127.
46. Simone S, Peter CS. Fast dispersible ibuprofen tablets. Eur J Pharm Sci 2002;
15(3): 295-305.
47. Fukani J, Yonemochi E, Yoshihashi Y, Terada K. Evalution of rapidly
disintegrating tablets containing glycine and carboxy methyl cellulose. Int J
Pharm 2006; 310: 101-109.
48. Kuno Y, Kojima M, Ando S, Nakagami H. Evaluation of rapidly disintegrating
tablets manufactured by phase transition of sugar alcohols. J. Control Release
2005; 105: 16-22.
49. Sharma S, Gupta GD. Formulation and characterization of fast dissolving tablets
containing promethazine theoclate solid dispersion with PEG 4000. Pharma
Review 2008; 4: 164-169.
50. Wantabe Y, Yamamoti Y, Fuji M, Kondoh M, Sibata Y. A novel method for
predicting disintegration time in mouth for rapid disintegrating tablet by
compaction analysis. Chem Pharm Bull 2004; 52: 1394-1395.
51. Narazaki R, Harada T, Takami N, Kato T, Ohwaki T, A new method for
disintegration studies of rapid disintegrating tablet. Chem Pharm Bull 2004; 52:
704-707.
52. Schneider. Disintegration testing device. 1988. United States Patent, Patent
number: 4,754,657.
53. El-Arini SK, Clas SD. Evaluation of disintegration testing of different fast
dissolving tablets using the texture analyzer. Pharm Develop Tech 2002; 7: 361-
371.

_____________________________________Analytical Techniques & Preformulation Studies
91
54. Gohel M, Patel M, Amin A, Agarwal R, Dave R, Bariya N. Formulation design
and optimization of mouth dissolving tablets of nimesulide using vacuum drying
technique. AAPS Pharm Sci Tech 2004; 5(3): Article 36.
55. Gohel MC, Parikh RK, Brahmbhatt BK, Shah AR. Preparation and assessment
of novel coprocessed superdisintegratnt consisting of crospovidone and sodium
starch glycolate. AAPS Pharm Sci Tech 2007; 8(1): Article 9.
56. Jeong SH, Park K. Development of sustained release fast disintegrating tablets
using various polymer-coated ion-exchange resin complexes. Int J Pharm 2008;
353: 195–204.
57. Caramella C, Colmbo P, Conte U. Water uptake and disintegration force
measurements: towards a general understanding of disintegration mechanism.
Drug Dev Ind Pharm 1986; 12: 1749-1766.