Review Article Analytical Strategies for the Determination ...

Analytical Methods for Determination of the Oxidative Status in Oils
Thea Norveel Semb
Biotechnology (5 year)
Supervisor: Turid Rustad, IBTCo-supervisor: Revilija Mozuraityte, SINTEF
Vera Kristinova, SINTEF
Department of BiotechnologyNorwegian University of Science and Technology


I
Summary
In industry today standard oxidative quality parameters are based on measurements of primary and secondary oxidation products, measured by PV and AV respectively. These methods are all prone to limitations and weaknesses, and their suitability for application on marine oils is not well documented. An increase in fish oil products with added flavor, color compounds, antioxidants and vitamins has entered the market in recent years. However, no documentation on the effect of these additives on the oxidation parameters has been found. The aim of this thesis was therefore to study the effect of variations in procedures in an attempt to highlight weaknesses and further to establish the most suitable procedures for each method when performing measurements on marine oils. In addition, the effect of antioxidants and additives on the oxidation parameters in cod liver oil has been evaluated.
In this thesis, PV measurements by iodometric titration and by the ferric thiocyanate method were used to measure primary oxidation products, and AV and TBARS measurements were used to measure secondary oxidation products. Uncertainty of the methods was determined by performing n -measurements at different stages of the oxidation process. Measurement by the iodometric titration method was found to have a lower detection limit of PV >2.0 mEq peroxide kg-1 oil, with an uncertainty of ± 2%. Measurement by the ferric thiocyanate method was found to have a lower detection limit of PV ≥3.6 mEq peroxide kg-1 oil, with an uncertainty of ±10%. Measurement by the AV method was found to have a lower detection limit of AV≥ 1.3, with an uncertainty of ±5%. Measurements by the TBARS method was found to have a lower detection limit of 0.7 µM TBARS /g sample, with an uncertainty of ±12%.
The published method of the International Dairy Federation (IDF) for PV determination was evaluated by comparison with a modified version of the method. Factors such as type of solvent used, deaeration of reagents, premixing of reagents and addition of antioxidant were differences between the methods. It was observed significant difference in absorbance in the two methods, and it was therefore concluded that the varied factor had an influence on the method. It is necessary to perform further experiments to determine which of the varied factors that cause variations in the absorbance measurements.
PV measurements by the iodometric titration method were found to be influenced by the stirring method, reagent reaction time and oxygen removal. Stirring by magnetic stirring was found to give a higher PV compared to gentle stirring. The importance of the 1 minute reagent reaction time was strengthened as the PV was found to rapidly increased at prolonged reagent reaction times. It was demonstrated that this to a higher degree is important for marine oils compared to vegetable oils, as new hydroperoxides are formed more rapidly in the unstable marine oils. A significant influence of oxygen removal in reagents was detected in cod liver oil. The findings in

II
this thesis suggests that stirring by magnetic stirring, 1 minute reagent reaction time and deaeration of all reagents should be standard procedure when PV is determined in marine oils by the iodometric titration method.
Among eight investigated antioxidants and additives, Q10, tocopherol, vitamin K1, lemon – and peppermint extract was found to significantly elevate the PV measured by iodometric titration. For PV determination by the ferric thiocyanate method, lemon extract was found to significantly elevate the PV. Rosemary extract was found to significantly lower the AV measurement, while lemon extract to a very high degree elevated the AV measurement. In measurements by the TBARS method only lemon extract was found to significantly interfere with the method, leading to an elevated TBARS value.
Both methods for PV detection were influenced by several of the investigated antioxidants and additives. Clearly there is need for reevaluation of the methods is use today and development of new methods. New methods for measurements of secondary decomposition products are especially needed for fish oils with added lemon extracts as today’s measurements by the AV and TBARS method give highly unreliable results.

III
Sammendrag
Måling av oksidasjonsparametere i olje i dagens industri baserer seg på måling av primær og sekundær produkter, målt ved henholdsvis PV og AV. Disse målemetodene har flere svakheter og begrensninger, og hvorvidt metodene er anvendbare for marine oljer er ikke dokumentert. Mengden fiskeoljeprodukter med tilsetning av smak, fargestoffer, antioksidanter og vitaminer har økt på markedet de siste årene. Det finnes tilsynelatende ingen dokumentasjon på effekten av disse tilsetningsstoffene på oksidasjonsparameterne. Målet med denne oppgaven var derfor å studere virkningen av variasjoner i prosedyrene for å belyse svakheter forbundet med metodene. Denne kunnskapen kan videre benyttes til å etablere bedre prosedyrer for hver metode for oksidasjonsmåling i marine oljer. I tillegg ble effekten av antioksidanter og tilsetningsstoffer på oksidasjonsparameterne i hver metode evaluert.
I oppgaven ble konsentrasjonen av primær produkter målt ved PV ved å benytte jodometrisk titrering og jern-thiocyanate metoden. AV og TBARS metoden ble benytte for å måle konsentrasjonen av sekundære produkter i marine oljeprøver. Usikkerheten forbundet med metodene ble bestemt ved å gjennomføre n-paralleller ved ulike stadier av oksidasjonsprosessen i olje. Målinger med jodometrisk titrering viste en nedre deteksjonsgrense på PV>2.0 mEq peroksid kg-1 olje, med en usikkerhet på ± 2%. Målinger med jern-thiocyanate metoden viste en nedre deteksjonsgrense på PV≥ 3.6 mEq peroksid kg-1 olje, med en usikkerhet på ± 10%. Målinger med AV metoden viste en nedre deteksjonsgrense på AV≥ 1.3, med en usikkerhet på ±5%. Målinger med TBARS metoden viste en nedre deteksjonsgrense på 0.7 µM TBARS /g prøve, med en usikkerhet på ±12%.
Den publiserte metodene til International Dairy Federation (IDF) for PV bestemmelse ble evaluert ved sammenligning med en modifisert versjon av metoden. Faktorer som type løsemiddel, fjerning av oksygen, forhåndsblanding av reagenser og tilsetning av antioksidant var ulikheter ved versjonene av metoden. Det ble observert ulik absorbans ved de to metodene, og det ble derfor påvist at faktorene påvirket metoden. Det er behov for ytterligere eksperimenter for å påvise hvilke av de varierte faktorene som forårsaker variasjon i absorbansmålingene.
Det ble påvist at målinger ved jodometrisk titrering påvirkes av røremetode, reagens reaksjonstid og fjerning av oksygen. Røring ved magnetrøring ga høyere PV målinger sammenlignet med rolig røring. Viktigheten av ett minutts reaksjonstid for reagenser ble bekreftet, ettersom rask økning i PV ble påvist ved forlengede reaksjonstider. Det ble påvist at tidsfaktoren er spesielt viktig for marine oljer sammenlignet med vegetabilske oljer, ettersom nye hydroperoksider dannes raskere i de ustabile marine oljene. Det ble detektert signifikant forskjell i målinger med og uten fjerning av oksygen i reagensene. Samlet viser dette at røring med magnetrører, ett minutts reagenstid og fjerning av oksygen i reagensene bør være standard prosedyre for PV bestemmelse i marine oljer ved jodometrisk titrering.

IV
Blant åtte undersøkte antioksidanter og tilsetningsstoffer, ble Q10, tocopherol, vitamin K1, sitron ekstrakt og peppermynte ekstrakt påvist å interferere med den jodometriske titrerings metoden. PV målinger utført ved jern-thiocyanate metoden ble påvist forhøyet av sitron ekstrakt. Rosmarin ekstrakt ble påvist å senke AV målingene, mens sitron ekstrakt i stor grad forhøyet AV målingene. For TBARS målinger ble kun sitron ekstrakt påvist å interferer med metoden, og gi forhøyede verdier.
Begge metodene for PV målinger ble påvirket av flere av de undersøkte antioksidantene og tilsetningsstoffene. Det er et stort behov for reevaluering av metodene som benyttes i dag og utvikling av nye metoder. Særlig stort er behovet for metoder for måling av sekundære oksidasjonsprodukter i fiskeoljeprodukter med tilsatt sitronekstrakt, ettersom dagens målinger med AV og TBARS metoden gir svært upålitelige resultater.

V
Preface
The work of this thesis was carried out at the Department of Biotechnology at the Norwegian University of Science and Technology, NTNU and at SINTEF Department of Fisheries and Aquaculture. Both institutions are located in Trondheim, Norway.
The supplement company is thanked for donation of fish -and cod liver oil, antioxidants and additives used in this thesis.
Supervisor Dr. ing. Revilija Mozuraityte is thanked for excellent guidance in the laboratory and for always being available to discuss and answer questions no matter time of the day, week day or weekend.
Supervisor Vera Kristinova is thanked for being so patient and understanding with all the struggles and questions I had with the titrator. You taught me that there is always an explanation and a setting to be changed when it comes to iodometric titration! To both my supervisors at Sintef, Revilija and Vera, thank you for inspiring me with all your knowledge and enthusiasm for this work.
Supervisor Professor Turid Rustad is thanked for discussions and advises, for interest in your master students and sharing of knowledge. A special thank is also given for taking the time to proofread and give valuable opinions and views on the writing of this thesis.
To the girls that I have met during my university years in Trondheim, thank you for all the laughter and memories we made. On top of it all we even got an education.
To family and Espen, thank you for always being supportive and believing in me.
___________________________
Thea Norveel Semb
Trondheim 15th of May 2012

VI
Abbreviations
AOCS – American Oil Chemists’ Society
AV – Anisidine value
BHA – Butylated hydroxyanisole
BHT – Butylated hydroxytoluene
CHD – Coronary heart disease
DHA - Decosahexaenoic acid
EDTA – Ethylenediaminetetraacetic acid
EPA – Eicosapentaenoic acid
FOX – Xylenol orange
FRS – Free radical scavengers
HPLC – High-performance liquid chromatography
IDF – International Dairy Federation
Ln – Linolenic acid
MDA – Malonaldehyd
PG – Propyl gallate
PUFA – Poly unsaturated fatty acid
PV – Peroxide value
R� - Alkyl radical
RO� – Alkoxyl radical
ROO� - Peroxyl radical
ROOH – Hydroperoxide
RSD – Relative standard deviation
TBA – Thiobarbituric acid

VII
TBARS – Thiobarbituric acid reacting substances
UV – Ultraviolet

Contents 1. Introduction ............................................................................................................................. 1 1.1 General aspects ........................................................................................................................ 1 1.2 Lipid oxidation ........................................................................................................................ 2
1.2.1 General steps in lipid oxidation ........................................................................................... 2 1.2.2 Kinetics and products of lipid oxidation ............................................................................. 4
1.3 Antioxidants ............................................................................................................................ 6 1.4 Determination of the oxidation status ...................................................................................... 9
1.4.1 Determination of primary oxidation products; peroxide value (PV) ............................... 9 1.4.1.1 Iodometric titration method .......................................................................................... 9 1.4.1.2 Spectrophotometric ferric thiocyanate method .......................................................... 10 1.4.1.3 Determination of conjugated dienes ........................................................................... 11 1.4.2 Determination of secondary oxidation products ............................................................ 11 1.4.2.1 Anisidine value ........................................................................................................... 12 1.4.2.2 Thiobarbituric acid reactive substances (TBARS) assay. .......................................... 13
1.5 Aim of thesis .......................................................................................................................... 14
2. Materials and methods ............................................................................................................. 15 2.1 Oils ........................................................................................................................................... 15 2.2 Reagents and solvents .............................................................................................................. 17 2.3 Antioxidant and additives ......................................................................................................... 17 2.4 Analytical methods ................................................................................................................... 19
2.4.1 Iodometric titration method ............................................................................................... 19 2.4.2 Spectrophotometric ferric thiocyanate method ................................................................. 20 2.4.3 Spectrophotometric ferric thiocyanate method, modified version .................................... 21 2.4.4 Anisidine value .................................................................................................................. 22 2.4.5 Thiobarbituric acid reactive substances (TBARS) assay .................................................. 23
2.5 Equipment ................................................................................................................................ 24 2.6 Statistics ................................................................................................................................... 25
3. Results and discussion .............................................................................................................. 26 3.1 Determination of uncertainty of methods .............................................................................. 26
3.1.1 Determination of uncertainty of the iodometric titration method .................................. 26 3.1.2 Determination of uncertainty of the spectrophotometric ferric thiocyanate method ..... 29 3.1.3 Determination of uncertainty of the AV method ............................................................ 31 3.1.4 Determination of uncertainty of the thiobarbituric acid (TBARS) method ................... 33
3.2 Reevaluation of the ferric thiocyanate method ...................................................................... 35 3.3 Iodometric titration method ................................................................................................... 38
3.3.1 Influence of stirring procedure ....................................................................................... 38 3.3.2 Influence of reagent reaction time .................................................................................. 41 3.3.3 Influence of oxygen removal ............................................................................................. 45

II
3.4 Influence of antioxidants and additives on oxidation parameters ............................................ 47 3.4.1 Influence of antioxidants and additives on PV measurements by iodometric titration ..... 47 3.4.2 Influence of antioxidants and additives on PV measurements by the ferric thiocyanate method ........................................................................................................................................ 49 3.4.3 Influence of antioxidants and additives on AV measurements ......................................... 51 3.4.4 Influence of antioxidants and additives on TBARS measurements .................................. 54
4. Conclusion ................................................................................................................................. 55
References ..................................................................................................................................... 57
Appendixes .................................................................................................................................... 61

1
1. Introduction
1.1 General aspects In the 1970s Berg and Dyerberg reported findings of lower levels of total plasma lipids, pre-β–lipoproteins, triglycerides and cholesterol among the Inuit population, a population known to have a diet rich in polyunsaturated fatty acids (PUFAs) from marine origin. These remarkable findings were found compared to a Danish control group. PUFAs are known to protect against increased plasma cholesterol level, which are strongly correlated to coronary heart disease (CHD). Metabolism of pre-β–lipoproteins and triglycerides are related to carbohydrate metabolism and therefore also to diabetes mellitus. Their findings therefore gave an explanation of the very low rate of CHD and complete absence of diabetes mellitus in the Inuite population, and interest in fatty acids from marine origin quickly arose (Bang and Dyerberg, 1972, Dyerberg et al., 1975). PUFAs’ are classified into two main categories, omega-3 (ω-3) and omega-6 (ω-6). The ω-6 PUFA is obtained from the parent fatty acid linoleic acid, while the ω-3 PUFA is obtained from the parent α- linolenic acid (Gurr, 1999, Simopoulos, 1991). Linoleic and α- linolenic acids cannot be synthesized in the human body (Frankel, 2005), and must therefore be obtained from sources in our diet. Examples of sources of linoleic acid are most seeds found in nature, while α- linolenic acids are found in the chloroplast of most green leafy vegetables (Simopoulos, 1991, Gurr, 1999). Common to the ω-3 fatty acids is the appearance of their first unsaturated bond positioned at the third carbon, in contrast to the ω-6 fatty acids having their first double bond positioned at the sixth carbon counting from the methyl end (Simopoulos, 1991). α- linolenic acids are metabolized through series of desaturation and elongation to long chain ω-3 fatty acids, among them eicosapentaenoic acid (EPA) and decosahexaenoic cid (DHA), illustrated in figure 1.1.1. However, this process is not very efficient in humans (Anderson and Ma, 2009). Our main source of long chain ω-3 fatty acids is therefore fish and fish oils, were EPA and DHA is present in different amount and ratio depending on fish species (Simopoulos, 1991).
Figure 1.1.1: Chemical structures of ω-3 PUFAs; α-linoleinic acid (parent compound), eicosapentaenoic acid (EPA) and decosahexaenoic acid (DHA) (Kamal‐Eldin and Yanishlieva, 2002).
© 2002 WILEY-VCH Verlag GmbH & Co. KGaA, Weinheim 0931-5985/2002/1212-0825 $17.50+.50/0
Eur. J. Lipid Sci. Technol. 104 (2002) 825–836 825
Rev
iew
Art
icle
1 IntroductionInterest in n-3 fatty acids grew during the 1970s and1980s with the observation that the mortality of coronaryheart disease was low is Eskimos (Inuit), who consume alarge amount of seafood [1]. The mortality from coronaryheart disease was also less in subjects who ate at leasttwo servings of fish per week in comparison to peoplewho did not eat fish [2-6]. Long-chain n-3 polyunsaturatedfatty acids (PUFA) may be beneficial for the preventionand treatment of a myriad of other conditions and dis-eases, e.g. arthritis and inflammation, auto-immune dis-ease, type 2 diabetes, hypertension, kidney and skin dis-orders and cancer. N-3 PUFA are also important for thedevelopment of the eye and brain [4, 5]. N-3 PUFA pos-sess hypolipidaemic, anti-hypertensive, anti-inflammato-ry, anti-thrombotic and anti-arrhythmic properties. All ofthese have been implicated in their health-promoting ef-fects [4-9]. The beneficial effect of n-3 PUFA is mainly dueto its effect on the fatty acid composition of cell mem-branes (increased levels of EPA acid at the expense ofarachidonic acid) and the effect of this on the productionof prostaglandins and leukotrienes [10, 11].
The characteristic feature of n-3 fatty acids is that theirfirst double bond is located at the third carbon from themethyl end of the hydrocarbon chain. N-3 PUFA mainlyinclude the essential fatty acid α-linolenic acid (Ln,C18:3n-3) and its long-chain metabolites eicosapen-taenoic acid (EPA, C20:5n-3) and docosahexaenoic acid(DHA, C22:6n-3) (Fig. 1). Major sources of Ln include the
seeds and oils of flaxseed (Linum usitatissimum), perilla(Perilla frutescens), soybean (Glycine max), rapeseed/canola (Brassica spp.), and walnut (Juglans regia) (Tab.1, [11-14]). Other nuts, peas, beans, and green leafy veg-etables also provide considerable amounts of dietary Ln[15, 16]. The primary sources of EPA and DHA in the dietare marine products (i.e. fish and shellfish). Humans cansynthesise EPA and DHA through desaturation and elon-gation of dietary Ln (Fig. 2). This pathway is an importantsource of these long-chain n-3 PUFA in strict vegetarians,who do not consume fish [17]. Although nutritionally lessvaluable than EPA and DHA, Ln may also provide an im-portant healthy complement to linoleic acid (L, C18:2n-6),the major polyunsaturated fatty acid in the diet [18].
Marine oils are produced from the body of fatty fish, liversof lean fish, as well as from blubber of marine mammals,
Afaf Kamal-Eldina,Nedyalka V. Yanishlievab
a Department of Food Science, Swedish University of AgriculturalSciences, Uppsala, Sweden
b Institute of Organic Chemistry, BulgarianAcademy of Sciences,Sofia, Bulgaria
N-3 fatty acids for human nutrition: stability considerationsCurrently there is great interest in dietary n-3 fatty acids to promote health. The food in-dustry aims to produce food products enriched in α-linolenic acid (Ln), eicosapen-taenoic acid (EPA) and/or docosahexaenoic acid (DHA) to reduce some of the physio-logical effects of linoleic acid (L), the major polyunsaturated fatty acid in our diet. How-ever, the goal is hampered by the susceptibility of the n-3 fatty acids to oxidation. As aresult the sensory and nutritional quality of such foods deteriorates. Lipid scientiststherefore have to find a way to stabilise these fatty acids. Innovative technologies toprotect n-3 polyunsaturates using antioxidants, adequate preparation, refining andpackaging of the oil are needed. In this paper we review the inherent stability and thestabilisation of these nutritionally valuable polyunsaturated fatty acids.
Keywords: N-3 fatty acids, α-linolenic acid, eicosapentaenoic acid, docosahexaenoicacid, oxidative stability.
Correspondence: Afaf Kamal-Eldin, Department of Food Science, Swedish University of Agricultural Sciences, Box 7051,750 07 Uppsala, Sweden. Phone : +46-18-672036, Fax: +46-18-672995 ; e-mail: [email protected]
Fig. 1. Chemical structures of n-3 PUFA: α-linolenic (Ln),eicosapentaenoic (EPA) and docosahexaenoic acid(DHA).

2
There is a great interest in the food, health and nutraceutical industry of using fish and ω -3 oils for enrichment and dietary supplement because of the documented positive health effect of EPA and DHA (Simopoulos, 1991, Burr et al., 1989, Von Schacky, 1987, Prickett et al., 1983). However, the use is limited as the lipids are highly susceptibility to oxidation and decomposition (Kamal-Eldin and Yanishlieva, 2002).
1.2 Lipid oxidation Lipids containing high levels of PUFA are highly susceptible to oxidation. Unsaturated fatty acids are prone to photooxidation during light exposure, enzymatic oxidation when exposed to lipooxygenases, and autooxidation, which is the direct reaction of molecular oxygen with organic compounds (Frankel, 2005). The degree and rate of lipid oxidation is influenced by the composition of fatty acids, oxygen concentration present, temperature, surface area, water activity and presence of anti –and prooxidants (Fennema et al., 2007b). Photooxidation is generally of little concern, as light absorption cannot affect the lipids unless they are exposed to direct sunlight or fluorescent light without suitable protection (List et al., 2005). Enzymatic oxidation is also of less concern in oils, because lipooxygenases are inactivated by heating during refining (Fennema et al., 2007b). Based on these facts, autooxidation is the primary concern of oxidation in refined oils. The susceptibility to fatty acid radical formation increases with degree of unsaturation. The dissociation energy in a carbon-hydrogen bond associated with an electron-rich double bond is lowered by 9kcal mol-1, compared to a saturated carbon-hydrogen covalent bond. The lowered dissociation energy makes unsaturated carbon chains more susceptible to hydrogen abstraction (Fennema et al., 2007b). Marine oils, with a high content of long chain PUFAs are therefore especially prone to oxidation (Kamal-Eldin and Yanishlieva, 2002). The process of lipid oxidation can be described in three general steps; initiation, propagation and termination.
1.2.1 General steps in lipid oxidation In edible oils the initiation step involves abstraction of a hydrogen atom from a fatty acid or acylglyserol, to form the radical known as the alkyl radical (R˙). Stabilization through delocalization of the double bond occurs once the alkyl radical has been formed. This leads to changes in the conformation of the double bonds in cis and trans configurations, with the more stable trans configuration predominating. In the case of polyunsaturated fatty acids, conjugated double bonds are rapidly formed upon the abstraction of hydrogen in the initiation step (Fennema et al., 2007b). The initiation process is summarized in equation 1.2.1 (Chaiyasit et al., 2007):
RH à R˙+H˙ (1.2.1) The oxidation process proceeds to the propagation step as the alkyl radical reacts with oxygen. The oxygen molecule can exist in several states, and both the singlet and the triplet state are

3
involved in the oxidation of lipids. The singlet oxygen (1O2) has an empty outer antibonding orbital. The 1O2 is seeking to fill this empty orbital, which makes it a highly reactive electrophile capable of reacting directly with unsaturated fatty acids (Coultate, 2009). The 1O2 is therefore considered a substrate in the oxidation process, as it promote formation of a fatty acid radical, one type of alkyl radicals. In the triplet state (3O2) the two outer antibonding orbitals contain a single electron each, with the same spin direction. This is considered a low energy state and the oxygen will not be able to abstract a hydrogen atom directly. However, one of the available electrons in 3O2 can interfere with the alkyl radical at a diffusion-limited rate and form a covalent bond. Interference of the 3O2 electron and alkyl radical leads to the formation of a high-energy peroxyl radical (ROO˙). The high-energy radical promotes abstraction of a hydrogen atom from a nearby fatty acid. When a hydrogen atom is gained, a fatty acid hydroperoxide (ROOH) is formed. However, at the same time a new alkyl radical has been created. In this way the propagation step proceeds through repetitive chain reactions (Fennema et al., 2007) The propagation process is summarized in equation 1.2.2 and 1.2.3 (Chaiyasit et al., 2007): R˙ + 3O2 à ROO˙ (1.2.2) ROO˙ + RH à ROOH + R˙ (1.2.3) In the termination step two radicals are joined to form a non-reactive unit. During conditions of oxygen excess, peroxyl radicals will join to make the termination product. This is a result of oxygen being added to the alkyl radical and leaving peroxyl as the main radical in the reaction. In conditions of low oxygen levels, the termination products are a result of interference between alkyl radicals, creating fatty acid dimers (Fennema et al., 2007a). The termination process is summarized in equation 1.2.4 and alternatively in equation 1.2.5 (Chaiyasit et al., 2007): ROO˙ + R˙ à ROOR (1.2.4) R˙ + R˙ à RR (1.2.5) The cyclic lipid oxidation reaction is shown schematically in figure 1.2.1.1

4
Figure 1.2.1.1: The classical free radical route emphasizing the cyclic nature of the oxidation process (Allen and Hamilton, 1994).
1.2.2 Kinetics and products of lipid oxidation In lipid oxidation the oxidation process generally show a lag phase followed by an exponential increase in oxidation rate. During the lag phase the oxidation is relatively slow and at a steady rate. Increasing the length of this phase as much as possible by lowering temperature, reducing oxygen concentration, reducing activity of prooxidants and increasing concentration of antioxidants, is important from a quality perspective as there is no decomposition products formed and hence no related rancidity in this phase (Fennema et al., 2007c, Allen and Hamilton, 1994). Once the exponential phase is reached, fatty acid decomposition products quickly form.
Hydroperoxides are the main primary oxidation products, accumulating during the initiation and propagation step of the oxidation process (Fennema et al., 2007b). The time to reach maximum level of hydroperoxides in the oxidation process is related to degree of saturation, and occurs earliest in highly unsaturated lipids because their hydroperoxides decompose more easily. After the maximum hydroperoxide level has been reached, a drop in hydroperoxides will theoretically be seen as the hydroperoxides decompose into a variety of secondary oxidation products (Frankel, 2005).
The drop in hydroperoxides is observed when the rate of decomposition into secondary products exceeds the formation rate (Shahidi and Wanasundara, 2002). In theory this means that the primary oxidation products will dominate in the early stage and secondary oxidation products

5
will dominate in later stages of the oxidation process. This scheme is illustrated in figure 1.2.2.1
Figure 1.2.2.1: Theoretical development of primary and secondary oxidation products as a function of time in lipid oxidation. Adapted from Frankel, 2005 (Frankel, 2005)
The hydroperoxides are as already mentioned, known as the primary oxidation products in lipid oxidation. However, it is well known that the hydroperoxides themselves do not contribute to the off-aromas causing rancidity (Reindl and Stan, 1982). The hydroperoxide will initially decompose into an alkoxyl radical (RO˙). The following pathway will have numerous alternative routes, resulting in a large number of possible secondary oxidation products (Fennema et al., 2007a). The formation of the high energy alkoxyl radical is the starting point for the cleaving of the aliphatic chain in fatty acids, known as the β-scission reaction (Frankel, 1998). The cleaving of the aliphatic chain produces aldehydes in addition to a radical on the aliphatic chain. This radical (e.g. alkyl radical) can theoretically react further with a hydrogen radical to form a hydrocarbon, a hydroxyl radical to form an alcohol or oxygen to produce a hydroperoxide. The mentioned alkoxyl radical can convert to a ketone by loosening an electron, or an epoxide through bonding to adjacent carbons. In addition some of the decomposition products are likely to contain intact pentadiene systems. The presence of these double bonds can result in additional formation of decomposition products because of further hydrogen abstraction or reaction with 1O2 (Fennema et al., 2007b). Figure 1.2.2.2 illustrates some of the possible secondary oxidation products created from decomposition of hydroperoxides.

6
Figure 1.2.2.2: Formation of some possible secondary oxidation products from decomposition of lipid hydroperoxides. Adapted from unpublished work by Vera Kristinova, 2012.
The numerous end products of the β-scission reaction are a result of hydroperoxides being able to form at multiple locations in the fatty acid, differences in degree of saturation and type of fatty acid (Fennema et al., 2007a). The highly varied chemical structures and properties of the secondary oxidation products formed make it difficult to find accurate methods for measurements of secondary oxidation products. The products of the β-scission reaction are low molecular weight, volatile compounds causing rancidity (Frankel, 1985). Combinations of different decomposition compounds give different sensory properties (Fennema et al., 2007a).
1.3 Antioxidants The use of antioxidants as inhibitors of free radical autoxidation is of major importance in preserving polyunsaturated lipids from oxidative deterioration (Frankel, 2005). An antioxidant can be classified as any substance that significantly delays or inhibits oxidation of a substrate. There are different mechanisms for antioxidant activity. In general antioxidants can be divided in two classes; primary (chain braking) antioxidants and secondary (preventative) antioxidants (Antolovich et al., 2002). Some antioxidants can also have both primary and secondary antioxidant properties. Common to the primary antioxidants is the ability to scavenge free radicals and hence inhibit initiation, propagation and the β- scission reaction. As described by Liebler (Liebler, 1993) the free radical scavengers (FRSs) interact with peroxyl radicals as described in the following mechanism:
ROO˙ + FRS à ROOH + FRS˙ (1.3.1)

7
In the same manner FRSs and alkoxyl radicals interfere by the following mechanism:
RO˙ + FRS à ROH + FRS˙ (1.3.2)
The capability of FRSs to donate a hydrogen to a free radical is essential for its antioxidant activity. FRSs have a low bond energy associated with its hydrogen(s), resulting in a greater tendency of donating a hydrogen to a free radical. Any compound with a lower reduction potential compared to the reduction potential of the free radical, is capable of donating its hydrogen (Buettner, 1993, Antolovich et al., 2002) resulting in hydroperoxide formation. Ideally the FRS˙ radical formed should be a low energy radical, to avoid that this radical has the ability to oxidize other unsaturated fatty acids or to react with oxygen (Fennema et al., 2007c). A low energy FRS˙ results from resonance delocalization (Fennema et al., 2007c, Choe and Min, 2009). An ideal antioxidant inactivates at least two free radicals, one alkoxyl/peroxyl radical by interference with the FRS and secondly by interference of the FRS˙ with an additional lipid radical or another FRS˙ to form a termination product (Fennema et al., 2007a). Possible pathways of antioxidant mechanisms are illustrated in figure 1.3.1:
Figure 1.3.1: Possible mechanism of antioxidants. The phenolic antioxidants donate hydrogen to the free radical and become a low energy radical stabilized through resonance delocalization. Pathway A illustrate the mechanism of antioxidant quercetin, while pathway B illustrate the mechanism of antioxidant BHA. A non-reacting termination product is formed by reaction of the low energy antioxidant with a free radical (not shown) (Çelik et al., 2010).
Known antioxidants with FRS properties are phenolic compounds such as tocopherols, butylated hydroxyanisole (BHA), butylated hydroxytoluene (BHT), propyl gallate (PG), lignans, flavonoids, ubiquinone (Q10), carotenoids and ascorbic acid among others (Choe and Min, 2009).
Secondary antioxidants delay the oxidative process by reacting with prooxidants or oxidation intermediates. Examples of known prooxidants are transition metals, such as iron and copper.

8
These transition metals promote lipid oxidation by reacting with hydroperoxides and thereby creating free radicals. An example of such reaction is shown in the following formula involving iron and a hydroperoxide resulting in formation of a peroxyl radical:
Fe3+ + ROOH à Fe2+ + ROO˙ +H+ (1.3.3)
(Fennema et al., 2007b). The prooxidant activity of transition metals can be hampered by antioxidants functioning as chelators. A chelator can be defined as a compound having two or more atoms on the same molecule capable of binding to, and hence stabilize a metal atom (Miller et al., 1990). A metal chelator functions by preventing metal redox cycling, by forming insoluble metal complexes, or by providing steric hindrance between the fatty acid or oxidation intermediate and the metal (Graf and Eaton, 1990). In food systems, EDTA and citric acid are the most common metal chelators in use (Choe and Min, 2009). Some antioxidants, such as EDTA, can behave both as an antioxidant and as a prooxidant, depending on its concentration, type of metal present and the lipid system. When iron is the metal present, EDTA in low concentrations will favor chelation of Fe3+ and therefore act as a prooxidant because Fe2+ oxidize fatty acids more easily compared to Fe3+. On the other hand, at high concentrations EDTA will favor chelation of Fe2+, and hence function as an antioxidant by limiting the oxidative activity of Fe2+
(Frankel, 2005).
Enhanced activity of antioxidants can sometimes be accomplished through use of combinations of antioxidants. This is called synergism. Examples of such enhanced antioxidant activity has been seen when a free radical is transferred between different FRSs, regenerating the antioxidant activity of the primary FRS. Together, the level of fatty acid radicals is reduced because the primary FRS continuously regenerates its antioxidant activity (Fennema et al., 2007b).
Despite the efficiency, consistent quality and relatively low cost of synthetic antioxidants, a worldwide trend of substituting synthetic antioxidants with natural antioxidants has occurred in recent years (Frankel, 2005, Pokorný, 1991). Examples of natural alternatives are α-tocopherol (Ohshima et al., 1998), rosemary extracts (Frankel, 1999) and the carotenoid astaxanthin (Hussein et al., 2006). α-tocopherol and rosemary extracts are both primary antioxidants, while astaxanthin can behave both as a primary and as a secondary antioxidant.

9
1.4 Determination of the oxidation status In early stages of the oxidation process the primary oxidation products, hydroperoxides, accumulates. Later in the oxidation process however, a high level of secondary products is observed along with low levels of primary products. This theoretical scheme was illustrated in figure 1.2.2.1. The concentrations of primary and secondary products can be measured quantitatively and therefore give an indications of the oxidative status of the oil. PV and AV are the two most frequently used quality parameters of edible oils, measuring primary and secondary oxidation products respectively (Farhoosh and Pazhouhanmehr, 2009).
1.4.1 Determination of primary oxidation products; peroxide value (PV) In the initial stage of lipid oxidation, conjugated double bonds rapidly form due to abstraction of a hydrogen from PUFAs. UV measurement of conjugated dienes and trienes are therefore one way to detect primary oxidation products. PV measurements is however the preferred method in industry, where measurements give a quantitative value of hydroperoxides present in the initial stage of lipid oxidation. UV measurements of conjugated dienes is sometimes used interchangeably with PV measurement because many hydroperoxides contain a conjugated diene system (Fennema et al., 2007b). In this thesis however, PV measurements were chosen as detection method of the primary oxidation stage. PV is a commonly used quality parameter for fats and oils and there are several methods available in a variety of versions (Shahidi and Zhong, 2005b). In this thesis PV was measured by the iodometric titration method and the spectrophotometric ferric thiocyanate method.
1.4.1.1 Iodometric titration method The reaction between a saturated solution of potassium iodide and an oil sample is the basis of the method. The method takes advantage of the ability of hydroperoxides to oxidize iodide ions (I-) to iodine (I2), as described in equation 1.4.1.1.1:
R-O-O-R + 2H+ + 2KI à I2 + ROH + H2O + 2K+ (1.4.1.1.1)
The iodine formed give a quantitative measurement of the hydroperoxides present when titrated against sodium thiosulfate with starch as an endpoint indicator, as described in equation 1.4.1.1.2 (Shahidi and Zhong, 2005b):
I2 + 2NaS2O3 à Na2S2O6 + 2NaI (1.4.1.1.2)
PV is expressed as milliequivalents of peroxide per kilogram of sample.
Despite being the standard method used in industry today, the method has a number of limitations. The method is time consuming, labor intensive, require large amounts of sample and

10
generates a significant amount of waste (Ruíz and Lendl, 2001, Dobarganes and Velasco, 2002). Besides these practical limitations, the method is considered to have two main limitations. The first main limitation is that iodine can be absorbed at unsaturated bonds in the lipid material and therefore erroneously lower the PV measurement. Secondly, iodine can be liberated from potassium iodide by oxygen present in the sample and erroneously elevate the PV measurement (Mehlenbacher, 1960). Uneven reactivity among different peroxides, variation in weight of sample, variations in reaction conditions such as time and temperature are also possible sources of error in the iodometric titration method which has been reported (Gray, 1978). The limiting requirement of large sample amount (5g) was in a study by Crowe and White successfully reduced to only 10% of the sample size used in the AOCS official method (Crowe and White, 2001). However, this study only included experiments with vegetable oils and similar documentation does not seem to exist for fish oil.
It has been proposed to limit the possible interference of oxygen present in the sample with iodine by bubbling with nitrogen gas (Heaton and Uri, 1958), although this has not been established as standard procedure in the AOCS or ISO official methods. Complexion of the iodine with cadmium ions to protect from interference with oxygen has also been suggested (Takagi et al., 1978).
According to Frankel, the iodometric titration method has a lower detection limit of 0.5 mEq peroxide / kg sample (Frankel, 2005). This is considered a relatively low sensitivity, and this combined with the already mentioned limitations has led to development of several new methods for PV measurements. Among them is the spectrophotometric ferric thiocyanate method, which is more sensitive and requires smaller sample size (0.1g) compared to the iodometric titration method (Frankel, 2005).
1.4.1.2 Spectrophotometric ferric thiocyanate method The method is based on the ability of hydroperoxides to oxidize ferrous ions (Fe2+) to ferric ions (Fe3+) in an acidic medium. The ferric ions form chromophores when complexed to thiocyanate, which can be measured by spectrophotometry (Eymard and Genot, 2003). Ferric thiocyanate is a red-violet complex with absorption spectra at 500-510 nm.
The ferric thiocyanate method for PV determination in edible oils is simple, reproducible and considered more sensitive than the standard iodometric titration method. The increased sensitivity (0.05 mEq peroxide/kg) is mainly due to the lower sensitivity of ferrous ion to spontaneous oxidation by oxygen in air, as compared to high susceptibility to oxidation of iodide solutions. Error associated with oxygen presence can be avoided by bubbling reagents with nitrogen (Mihaljevic et al., 1996), however this is not standard procedure according to the published method of IDF. In a reevaluation of the ferric thiocyanate method, Mihaljevic et al. also reported that the obtained results are dependent of the analytical solution including both solvent, reducing agent and type of hydroperoxides present in sample (Mihaljevic et al., 1996).

11
PV is similarly to the iodometric titration method expressed as milliequivalents of peroxide per kilogram of sample. Several experiments have been done to evaluate the correlation between PV results obtained by the ferric thiocyanate method and by iodometric titration. Mäkinen et al. reported that the ferric thiocyanate method give PV values that are twice as high compared to the iodometric method (AOCS Official method Cd 8b-90). Results obtained by the ferric thiocyanate method must therefore be multiplied by a correction factor 0.5 (Makinen et al., 1995).
1.4.1.3 Determination of conjugated dienes Hydroperoxides from PUFAs form conjugated dienes that can be measured quantitatively by spectrophotometric UV measurement at wavelength 234nm. The method is considered very simple and requires equipment available in most laboratories. The sample to be investigated is simply diluted in iso-octane (for lipids) and measured directly in a cuvette placed in a spectrophotometer. The method does not depend on any chemical reaction or color development and requires relatively small amounts of sample (0.1g) (White, 1995, Frankel, 2005). The conjugated diene value is based on the detected absorbance and is expressed as µmol hydroperoxides /g sample.
Measurement of conjugated dienes is a sensitive method to follow the early stages of the oxidation process, however at later stages the formed secondary oxidation products overlap in the same UV detection range (Frankel, 2005). Limitations of the method are the strong dependence on fatty acid composition in the sample to be investigated. Oils containing high amount of PUFAs will have a faster increase in conjugated dienes compared to oils with less PUFAs. Consequently the method cannot be used to compare oxidation in oils with different composition of fatty acids. Further the method is only useful for measurement of changes in oils containing substantial amounts of linoleate or more highly unsaturated fatty acids because the diene systems are produced from abstraction of hydrogen in unsaturated fatty acids (White, 1995).
1.4.2 Determination of secondary oxidation products A large variety of secondary oxidation products are produces through decomposition of fatty acid hydroperoxides as described in section 1.2.2. Small quantities and the large variations in chemical structure and properties, makes it is difficult to measure all the compounds simultaneously. Analysis for determination of secondary oxidation products therefore tends to focus on a single compound or group of compounds. One drawback of secondary oxidation product measurements is the lack of detection at an early stage in the oxidation process where primary products are high, while secondary products are low. In many food systems appearance of amine and sulfhydryl groups also make the measurement of e.g. aldehydes difficult, as they react with the secondary oxidation products and thereby lowering their concentration. Some authors argue that an advantage of measurement of secondary oxidation products is the good correlated with sensory analysis, as the measured compounds are the direct cause of the off-aromas (Fennema et al., 2007a).

12
1.4.2.1 Anisidine value The method is based on the reaction between p-anisidine and aldehydic compounds (principally 2-alkenals and 2,4-alkadienals) present in oil samples at acidic conditions. The reaction produces a yellow-colored compound with absorbance at 350nm. Figure 1.4.2.1.1. illustrates the proposed reaction between the p-anisidine reagent and malonaldehyd resulting in the yellow-colored compound (Shahidi and Wanasundara, 2002). The AV is expressed as the absorbance of a solution made of 1 gram fat in 100mL isooctane solvent and p-anisidine reagent (Frankel, 2005). The reaction does not include use of any strong acids or high temperature and therefore an advantage of the method is minimized influence on hydroperoxide decomposition (White, 1995). The main limitation of the method is the low sensitivity. Other limitations are requirement of water free reagents as the reactions are not fully completed in presence of water, and that the reagents must be carbonyl free to avoid interference with existing carbonyls in the sample (White, 1995). Holm suggested a combined expression of peroxides and secondary oxidation products, and therefore developed the concept TOTOX value. Holms demonstrated that an increase of one PV unit corresponded to increase in two AV units. Together this established the TOTOX value = 2PV + AV, giving a value of the total oxidation status in oil (Holm, 1972)
Figure 1.4.2.1.1: Proposed reaction between p-anisidine
reagent and malonaldehyd (Shahidi and Wanasundara, 2002).

13
1.4.2.2 Thiobarbituric acid reactive substances (TBARS) assay. The TBARS assay is one of the oldest methods used for detection of lipid oxidation and was first proposed in the 1980’s (Kishida et al., 1993, Shahidi and Wanasundara, 2002). The method is based on the formation of a pink complex with strong absorbance at 532-535nm when thiobarbituric acid (TBA) and oxidation products from unsaturated fatty acids react. Because the reaction can involve several secondary oxidation products, the reacting secondary products are generally referred to as TBA-reacting substances, or TBARS in short. Initially the reaction was believed to involve a reaction between 2 moles of TBA and one mole of malonaldehyd, as illustrated in figure 1.4.2.2.1.
Based on this, the test is still standardized by using malonaldehyd generated from 1,1,3,3-tetraethoxypropane by acid hydrolysis (Frankel, 2005). The measurement of secondary oxidation products by the TBARS method is expressed as µmoles TBARS / g sample.
The TBARS assay is frequently in use in spite of its well known limitation in lack of sensitivity and specificity. Reaction conditions such as temperature, time of heating, pH, and presence of antioxidants and metal ions are known to significantly effect the color development (Antolovich et al., 2002). However, the main limitation rise from the ability of several compounds to react with the TBA reagent and hence contribute to an overestimation of the intensity of the color complex (de las Heras et al., 2003). Examples of such absorbing compounds are alkanals, 2-
Figure 1.4.2.2 1: The reaction of thiobarbituric acid (TBA) and malonaldehyd (MDA) form a pink complex, which strongly absorb in the UV range 532-535 nm (Antolovich et al., 2002).

14
alkenals, 2,4-alkdienals, ketones, ketosteroids, acids, esters, proteins, sucrose, urea, pyridines and pyrimidines (Jardine et al., 2002). Several attempts have been done to improve the selectivity of the TBARS method. Among several authors, Chirico et al. used the TBARS method in combination with HPLC to characterize the individual compounds formed, however the possibility of compounds with similar spectral properties were still a limitation (Chirico et al., 1993),
1.5 Aim of thesis In industry today standard oxidative quality parameters are based on measurements on primary and secondary oxidation products, measured by PV and AV respectively. In addition, also TBARS measurement is a well-known method to determine secondary oxidation products. The mentioned methods are however all prone to limitations and weaknesses. Some standard procedures also seem to lack specificity in the stepwise procedure and are therefore susceptible to variable results.
Today many fish oil products with added flavors, color compounds, antioxidants and vitamins are on the market. However, no documentation on the effect of the additives on the oxidation parameters seems to exist. The aim of this thesis was to study the effect of variations in measuring conditions such as reagent reaction time, oxygen level and sample preparation on the oxidation parameters measured by iodometric titration, the ferric thiocyanate method, the AV method and the TBARS method. In addition, the effect of antioxidants and additives on the oxidation parameters in cod liver oil has been evaluated.

15
2. Materials and methods
2.1 Oils The cod liver oil and fish oil (originating from South America) used in the experiments were donated from a known supplement company. The company donated oil from two different factories, A and B. All oils were refined without additionally added antioxidants. During the workday, the oils were only kept at room temperature during weighing of samples. Time in room temperature was attempted kept at a minimum, and beyond this the oils were stored in a refrigerator at 4°C in dark, green bottles to limit temperature influence and light exposure. At the end of each workday nitrogen was flushed directly into the green bottles to limit the oxidation process in the oil, followed by freezing of the entire bottle at -18°C. When the oils were to be used again, they were thawed in a refrigerator for 2-3 hours followed by experiments the same day. To investigate measurements by the ferric thiocyanate method, AV and TBARS methods at different oxidation levels, cod liver oil from factory A was used. To investigate measurements by iodometric titration cod liver oil and fish oil from factory B was used.
For investigation of measurements by the ferric thiocyanate method, AV method and TBARS method at different oxidation levels, cod liver oil was intentionally left to oxidize. The following description of cod liver oil oxidation is schematically illustrated in figure 2.1.1
Figure 2.1.1: Cod liver oil was placed in a 2L beaker on a magnetic stirrer to oxidize to reach 6 oxidation levels in the PV range <1-30. When desired oxidation levels were reached; 10 parallels were measured by the ferric thiocyanate, AV and TBARS method. At day 1-10 the beaker was placed in a 4°C cold room. At day 10-29 the beaker was placed in room temperature to speed up the oxidation process.
1200mL cod liver oil was kept in a 2L beaker placed on a magnetic stirrer. The magnetic stirrer was set to a low speed to maintain a gentle circulation of the oil. The beaker was placed at 4°C in
Cod liver oil in 2L beaker
Day 1, oil 1 10 Parallels measured by the ferric thiocyanate, AV and TBARS method
Day 2, Oil 2 10 parallels measured by the ferric thiocyanate and AV method
Day 10, Oil 3 10 parallels measured by the ferric thiocyanate, AV and TBARS method
Day 14, Oil 4 10 parallels measured by the ferric thiocyanate, AV and TBARS method
Day 24, Oil 5 10 parallels measured by the ferric thiocyanate, AV and TBARS method
Day 29, Oil 6 10 parallels measured by the ferric thiocyanate, AV and TBARS method

16
a cold room covered by aluminum foil to limit light exposure and possible contamination. The first day 180mL was taken from the beaker and marked as “Oil 1”. 10 parallels of oil 1 were measured by the ferric thiocyanate method, AV and TBARS method. Each workday 3 parallels were measured by the ferric thiocyanate method by sampling directly from the beaker using a clean pipette tip. This gave an indication of the oxidation level of the oil. PV levels in the oil was intended to reach PV 1 the second day, PV 2-3 the third day, PV 6-8 the fourth day, PV 15 the fifth day and PV 30 the sixth workday. For each oxidation level reached, 180mL oil was taken from the beaker and market “oil 2” - “oil 6”. 10 parallels of oil 2-6 were measured by the ferric thiocyanate method, AV method and TBARS method (with the exception of oil 2 not being measured by the TBARS method). The oxidation of the oil was slower than expected, and the beaker was moved from the cold room after 10 days and placed in room temperature to speed up the oxidation process. The speed of the magnetic stirrer was also slightly increased in an attempt to increase oxidation. The highest aimed PV level (PV 32,2) was reached 29 days after the first measurement, as schematically illustrated in figure 2.1.1.
Oil 6 had a relatively low AV and TBARS value. To investigate the AV and TBARS method at higher oxidation levels, cod liver oil was heated in a 95°C water bath for 30 minutes followed by cooling under running water. 10mL samples were taken from the heated cod liver oil followed by repeated rounds of heating, as schematically illustrated in figure 2.1.2. The Cod liver oil used in this oxidation process was chosen based on prior knowledge of relatively high degree of oxidation in the oil.
Figure 2.1.2: A cod liver oil was chosen based on prior knowledge of relatively high degree of oxidation. To increase the degree of oxidation the cod liver oil was heated in a 95°C water bath for 30 minutes before a 10mL sample, marked as oil 7, was taken. The heating was repeated as illustrated to obtain three additional levels of oxidation, marked oil 8-10.
The 10 mL samples were marked “oil 7” – “oil 10”. 10 Parallels of oil 7-10 were measured by the AV method and 10 parallels of oil 7-8 were measured by the TBARS method.
The investigation of measurements by the iodometric titration method at different oxidation levels was based on measurements on fish and cod liver oil. Three bottles of fish oil and five bottles of cod liver oil were selected based on prior knowledge of approximately oxidation level in the bottles. Four to six parallels were measured for each oil. Four to six parallels were considered sufficient based on the observed small deviation between measurements.
Cod liver oil
Oil 7
• 30 min heating
Oil 8
• 30 min heating
Oil 9
• 30 min heating
Oil 10

17
2.2 Reagents and solvents The following reagents and solvent were obtained from the source given in parentheses. PV measurements, ferric thiocyanate method; ethanol (GPR Rectapur, VWR International, France), iso-hexane (VWR International, France), ammoniumthiocyanate (Merck, Germany), hydrogen chloride (Merck, Germany), iron (II) chloride tetrahydride (Merck, Germany), iron (II) sulfate (Acros Organics, Belgium). PV measurements, iodometric titration; acetic acid (VWR International, France), Isooctane (Merck, Germany), potassium iodide (Merck, Germany), distilled water. AV measurements; p-anisidine reagent (TCI Europe nv, Belgium), acetic acid (VWR International, France), iso-octane (Merck, Germany). TBARS value; acetic acid (VWR International, France), chloroform (VWR International, France), 2-thiobarbituric acid (Sigma Aldrich, USA), sodium sulphite (Merck, Germany), trichloracetic acid (Merck, Germany), 1,1,3,3-tetraethoxypropane (Sigma Aldrich, Germany), distilled water.
2.3 Antioxidant and additives The antioxidant -and additives and their concentration used are listed in table 2.3.1. For antioxidants and vitamins the added concentrations were chosen based on natural content present in the oil. Antioxidant or additive and 60 mL cod liver oil from factory B was mixed in a test tube to concentrations given in table 2.3.1. The mixture of cod liver oil and antioxidant or additive was further divided into four 15mL test tubes, one tube for each method to be investigated. Influence of antioxidants and additives on oxidation parameters was investigated by the ferric thiocyanate method, by iodometric titration and by AV and TBARS measurements.

18
Table 2.3.1: Antioxidants and additives added to cod liver oil for investigation of influence on oxidation parameters.
Antioxidant / additive
Producer Purity (%) Chemical formula
Concentration used in analysis
Butylated hydroxytoluene
(BHT)
Sigma- Aldrich, Germany
>99 C15H24O 200 ppm
α-Tocopherol Fluka BioChemika, Switzerland
>97 C29H50O2 1500 ppm
Peppermint extract Givaudan, Switzerland
Multi-component
mixture
- 2%
Lemon extract Givaudan, Switzerland
Multi-component
mixture
- 2% (0,5%, 1%, 2%)
Astaxanthin Sigma-Aldrich, Germany
>92 C40H52O4 500 ppm
Rosemary extract G.O. Jonhsen A.S. Multi-component
mixture
- 1000 ppm
Vitamin K1 DSM Nutritional Products Ltd.
Not specified C31H46O2 100 ppm
Q10 (ubiquinone) Sigma Aldrich, China
>98 C59H90O4 150 ppm

19
2.4 Analytical methods Measurements by the ferric thiocyanate method, AV and TBARS method were completed at NTNU, Department of Biotechnology while the iodometric titration and conjugated diene/triene measurements were completed at SINTEF, Department of Fisheries and Aquaculture, Trondheim.
2.4.1 Iodometric titration method To perform iodometric titration, calibration with thiosulphate solution was performed according to the procedure of Radiometer analytical S.A. A 0.01M sodium thiocyanate solution was prepared from 0.1 M sodium thiocyanate. The 0.01M sodium thiocyanate solution was found to be stable, and it was therefore not considered necessary to calibrate the titrator each working day. The sodium thiosulphate solution was stored in a 1000mL brown glass flask to avoid light exposure.
PV was measured as described in the procedure of Radiometer analytical given in appendix A. The method is based on the ISO3960 (2001) procedure. Amount of necessary sample was estimated to 5 grams and was carefully weighed in 150 mL plastic cups for each sample. The sample was diluted in an isooctane/acetic acid solution ratio 2:3. 0.5 mL saturated potassium iodide solution was added and the sample was left on a magnetic stirrer for one minute, or stirred gently for one minute. Gentle stirring was equivalent to three times manual gentle circulation of the oil solution at time 0, 30 and 60 seconds followed by titration. The reagent reaction time was changed in some of the experiments to investigate the importance of the one-minute reaction time described in ISO 3960 (2001). 30 mL distilled water was added before the sample was placed in the titrator. The titrator used two electrodes that were stored in distilled water or SDS when not in use to prevent drying out. Prior to investigation of influence of oxygen access, all reagents were nitrogen flushed. The titrator was emptied and flushed before nitrogen flushed sodium thiocyanate titrant was installed.
Blank samples were determined by the Radiometer analytical procedure, but without oil. PV was calculated by the following formula:
PV (mEq peroxide kg-1 oil) = Ctitr.× (Vtitr. – blank) × 1000 / Wsmp. (2.4.1.1)
where,
Ctitr. = titrant concentration in mol/L
Vtitr. = necessary titrant volume in mL
Wsmp = weighed amount of sample in grams.

20
2.4.2 Spectrophotometric ferric thiocyanate method PV was determined using the published ferric thiocyanate method of IDF with modifications according to Ueda et al. (1986) and Undeland et al. (1998). The procedure is given in appendix B.
Blank samples were prepared using 5mL of high purity ethanol, 100µL high purity iso-hexane, 100µL 30% ammoniumthiocyanate solution and 100µL Fe2+ solution. A stopwatch was used to ensure that the reaction time was exactly three minutes after addition of iron. Absorbance was measured at 500nm against pure ethanol. Fe2+ solution was made fresh each working day. Oil samples were made by the same procedure as blank samples, except that 100µL of iso-hexane was replaced by 100µL of sample dissolved in iso-hexane. The procedure of PV detection in oil samples by the published IDF ferric thiocyanate method is described schematically in figure 2.4.3.1 (blue color). The sample solution was made of minimum 0.02g oil, which was weighed directly into a short test tube with 1mL of iso-hexane added as solvent.
A standard curve was made based on 0.1 mg/mL Fe3+ standard work solution
PV was calculated by the following equation:
PV (mEq peroxide kg-1) = ((Asample – Ablank) × L × V / 55.845 × S ×0.1) × 0.5 (2.4.2.1)
where,
L = slope of the standard curve constructed as m Fe3+ = f (A)
V = volume of iso-hexane used to dissolve oil (mL)
S = amount of oil sample (g)
55.845 = molar weight of iron (g/mol)
0.1 = volume of the sample dissolved in iso-hexane added to the ethanol (mL)
0.5 = correction factor

21
2.4.3 Spectrophotometric ferric thiocyanate method, modified version A modified version of the IDF published ferric thiocyanate method (described in the previous section) has modifications that might have an impact on the final PV result. In the modified version several factors are varied compared to the official method, as illustrated schematically in figure 2.4.3.1 where the procedure of the official method is illustrated by blue color and the procedure of the modified version is illustrated by the turquoise color. The detailed procedure of the modified version is given in appendix C.
Figure 2.4.3.1: Schematic illustration of the procedure of PV determination by the published IDF ferric thiocyanate method (illustrated in blue color) and procedure of PV determination of a modified version (illustrated in turquoise). Several factors vary in the compared methods; solvent used, untreated /deaerated reagents, reducing agent, separate or combined addition of NH4SCN and iron solution, and use of antioxidant.
The oil was dissolved in different solvents in the very first step of the methods. Iso hexane was used in the IDF method while ethanol was used in the modified version. The modified version limited influence of oxygen by deaeration of all reagents, a factor not considered in the IDF method. In the IDF method, NH4SCN and iron solution was added separately to the test tube, while in the modified version, NH4SCN and iron solution in ratio 1:1 was combined to a reagent solution before it was added to the test tube. The reagent solution was kept on ice covered in
Dissolved oil
Iso hexane Oil
Dissolved oil
Deaerated ethanol Oil
Test tube Ethanol
NH4SCN
Iron (II) chloride in
HCl UV
measurement
Test tube
Deaerated ethanol
4% BHT
Reagent solution
UV measurement
Iron(II) sulfate in deaerated
HCl
NH4SCN in
deaerated ethanol
.

22
aluminum foil to maintain low temperature and avoid light exposure. Prior to addition of the reagent solution, a 4% antioxidant BHT solution was added to the test tube in the modified version. The use of antioxidant is not part of the IDF method. Another important factor was the use of iron (II) sulfate in the iron solution in the modified version, in contrast to iron (II) chloride in the IDF method.
The aim of the comparison of the IDF ferric thiocyanate method and the modified version was to detect whether the variations in procedures affected absorbance at 500nm or not. Measurements were done by following the whole procedure described in the IDF published method and the modified version. This meant that all factors that possibly influenced the absorbance were investigated in the same experiment, and possible influence of individual varied factors was not emphasized.
2.4.4 Anisidine value AV was determined according to a modification of AOCS’s official method Cd 18-90, given in appendix C. 0.3 grams of sample was measured directly into a 10mL flask. The sample was dissolved in iso-octane in a 10mL flask. The absorbance (A1) from 2.5mL sample was measured in glass cuvettes at 350 nm against a pure iso-octane blank. 0.5 mL p-anisidine reagent was then added to the cuvettes and placed in the dark for 10 minutes before a new spectrophotometric measurement (A2) was made. Measurements were performed in batches of three samples and one blank at a time to avoid oxidation due to delays between measurements of samples.
AV was calculated by the following formula:
AV = 10mL × (1.2 × (AS2 – AB2) – (AS1 – AB1) ) / Wsmp (2.4.4.1)
where,
10mL = volume of iso-octane used to dissolve the sample
1.2 = correction factor for dilution of sample solution with 1 mL of anisidine reagent dissolved in acetic acid
AS1 and AS2 = first and second spectrophotometric measurement of samples
AB1 and AB2 = first and second spectrophotometric measurement of blanks
Wsmp = weight of sample

23
2.4.5 Thiobarbituric acid reactive substances (TBARS) assay The TBARS value was determined according to the method described by Ke et al. The procedure is given in appendix D. 10mg of sample oil was accurately weighed directly into a short kimax test tube. 5mL of TBA work solution was added before the test tubes were closed tightly. The test tubes were mixed for 15 seconds on a vortex mixer before incubation in a 95̊ C water bath for 45 minutes. After cooling under running cold water, 2.5 mL TCA solution was added to the kimax tubes. To separate the chloroform phase from the water phase, the samples were centrifuged at 2500 g for 10 minutes. The water phase was gently transferred from the kimax test tube into a 10mm QS cuvette and absorbance was measured against distilled water as a reference at 538 nm. When working with oils of particular high absorbance (>900), the samples were diluted with 55% acetic acid. The dilutions were considered in the final calculations. For calculations a standard curve based on known concentrations of 0.1 mM TEP (1.1.3.3 tetraethoxypropane) working solution was constructed. The value of TBARS was calculated by the following formula:
µM TBARS / g oil = (A-b) / (a × m × 1000) (2.4.5.1)
where,
A = absorbance of the oil sample
a = slope of the standard curve
b = intercept of the standard curve
m = amount of sample oil (g.)
1000 = conversion to µM / g.

24
2.5 Equipment Table 2.5.1: Overview of applied equipment. Type of equipment is given on the left side of the table and producer of equipment is given on the right side of the table.
NTNU, Department of Biotechnology
Vortex mixer: WM /250 /SC /P Asons scientific apparatus
Weight : Mettler AE 200 Mettler Toledo
UV- spectrophotometer : Pharmasia Biotech, Ultrospec 2000
Richmond Scientific Ltd
Centrifuge: Sigma 202 Sigma Laborzentrifugen GmbH
Magnet stirrer: Heidolph, unknown type Heidolph
Glass / quartz cuvettes: 10mm OS/QS Hellma GmbH & Co. KG
SINTEF, Department of Fisheries and Aquaculture
Weight: AG204 Delta Range Mettler Toledo
Magnet stirrer: Heidolph MR 3001K Heidolph
Autotitrator: TIM 980 Titration Manager Radiometer analytical
Reference electrode: REF 921 (351-11-031) Radiometer analytical
Detection electrode: M2IPt (680-11-031) Radiometer analytical
UV-spectrophotometer: Spectronic Genesys 10 Bio Thermo scientific
Quartz cuvettes: 10mm QS Hellma GmbH & Co. KG

25
2.6 Statistics In this thesis, the uncertainty of the methods rather than the uncertainty of the measurements themselves were determined. To determine the uncertainty of the methods in this thesis, standard deviation of ten parallels (with the exception of iodometric titration, where four to six parallels were considered sufficient) were measured at different oxidation levels with each method. The standard deviation was further used to calculate relative standard deviation (RSD) at increasing oxidation levels measured by each method.
To determine uncertainty and lower detection limit of the methods, the RSD were used. The RSD (also termed coefficient of variation) was calculated by equation 2.6.1 (Miller and Miller, 1993):
RSD = 100 !! (2.6.1)
Significant differences between measurements were calculated by the following formula:
𝑡 = !!!!!!!!
(2.6.2)
where,
A and B = values of the measurements to be compared
𝑎! + 𝑏! = uncertainty in the standard deviations of the measurements to be compared
From a table of normal error integral, the value of t was used to find the probability of A differing from B (Taylor, 1997). A 95% confidence interval was used.
Microsoft excel was used to perform all calculations. Rejection of measurement data was done according to the Chauvenet’s criterion (Taylor, 1997)

26
3. Results and discussion
3.1 Determination of uncertainty of methods As a starting point for this thesis, determination of the uncertainty of the methods to be used was estimated. It was important to determine this, as the uncertainty of the methods was used to evaluate measurements in later stages of the thesis. To determine the uncertainty of the methods, n-parallels were measured at different stages of the oxidation process, as described in section 2.1. Numbering of oils are based on the labeling “oil 1-oil 10” given during the oxidation process. As described in section 2.6, the n-parallels were used to determine standard deviation and relative standard deviation (RSD). By plotting RSD as a function of oxidation parameter (PV, AV or TBARS value), the uncertainty and lower detection limit of the method was determined. Determination of uncertainty was based on observations of stable RSD values in the plot after a certain oxidation parameter value. The point were the RSD was stabilized was considered the lower detection limit. In this thesis this means that oxidation parameter values below the lower detection limit are unreliable because they lay out of the stable RSD range.
3.1.1 Determination of uncertainty of the iodometric titration method To determine the uncertainty of the iodometric titration method, three different fish oils and five different cod liver oils were measured. The oils were from factory B and were chosen based on prior knowledge of approximate oxidation level, as described in section 2.1. All measurements were performed according to the procedure of Radiometer analytical, which is based on ISO 3960. The results of PV determination by iodometric titration of the oils are presented in figure 3.1.1.1. PV given for each oil is the mean value based on four to six parallels and the uncertainty is given as standard deviation. Measurement data is given in appendix F.

27
Figure 3.1.1.1: Determination of PV in three different fish oils and five different cod liver oils by the iodometric titration method. The PV given for each oil is the mean value based on four to six parallels, and the uncertainty is given as standard deviation of the measurements in each oil.
To determine the uncertainty and lowest detection limit of the iodometric titration method, the RSD was calculated according to the formula described in section 2.6. The calculated RSD was based on standard deviation measurements from data given in appendix F. The results are presented in figure 3.1.1.2
Figure 3.1.1.2: Determination of RSD based on PV measurements from three different fish oils and five different cod liver oils measured by iodometric titration. The PVs given are mean values of four to six parallels.
Four to six parallels were considered sufficient based on the low standard deviation observed for the samples. The standard deviation, illustrated by error bars in figure 3.1.1.2, did not seem to differ significantly at any investigated stages of the oxidation process. However the RSD as a
0
5
10
15
20 PV
(mEq
per
oxid
e kg
-1 o
il )
Fish oil Fish oil Cod liver oil Fish oil Cod liver oil Cod liver oil Cod liver oil Cod liver oil
0 2 4 6 8
10 12 14 16 18
0 2 4 6 8 10 12 14 16 18
RSD
(%)
PV (mEq peroxide kg-1 oil)

28
function of PV, shown in figure 3.1.1.2, illustrates a higher RSD at low PV (PV<1.4) compared to higher PV (PV>1.5). A relatively stable 2 % RSD at PV >1.5 is seen in figure 3.1.1.2. Data reported in literature points at the limitations of the method at early stages of the oxidation process, as the hydroperoxides are susceptible to further reactions (Gray, 1978). A study by Shantha and Decker confirms detection problems at low PV values (<0.4) for measurements on butter, chicken –and beef fat with the iodometric titration method (Shantha and Decker, 1994). According to several authors, the lower detection limit for the method is at 0.5 mEq peroxide/kg (Frankel, 2005, Dobarganes and Velasco, 2002, Fennema et al., 2007c). However, the detection limit are said to vary with procedures because of interference with oxygen and light exposure. Precautions to limit these factors are generally not taken for routine analysis (Frankel, 2005). Attempts to limit influence of oxygen and light exposure were not done in the determination of uncertainty of the method, as this is not included in the procedure described in ISO 3960. This might explains the higher detection limit, found to be PV> 1.5 ±2% mEq peroxide /kg in this thesis, as illustrated in figure 3.1.1.2.
The AOCS Official Method Cd 8b-90 for PV determination states the precision of the iodometric titration method. The official method operates with RSD ranging from 2.93-11.53 %, however this is based on animal fat and vegetable oils. The precision given in the AOCS official method is likely to differ slightly compared to the ISO 3960 method, as the AOCS method is based on manual titration. The findings of a relatively stable 2% RSD when the method was applied to fish and cod liver oils correlate however fairly well with the higher range precision given in the official method.
Based on experiments on vegetable oils, findings of higher percent RSD at low PV compared to lower percent RSD at higher PV was reported by Crowe and White (Crowe and White, 2001). These findings support the change in percent RSD results found by measurements in three fish oils and five cod liver oils at increasing stages of oxidation in this thesis.

29
3.1.2 Determination of uncertainty of the spectrophotometric ferric thiocyanate method To determine the uncertainty of the spectrophotometric ferric thiocyanate method, cod liver oil from factory A was intentionally left to oxidize as described in section 1.2. The cod liver oil was measured at six different stages (labeled “oil 1–oil 6”) of the oxidation process by the published spectrophotometric ferric thiocyanate method of IDF with modifications according to Ueda et al. (1986) and Undeland et al. (1998). The results of PV determination are presented in figure 3.1.2.1. The PV given for each oxidation stage is the mean value, based on ten parallels. The uncertainty is given as standard deviation, and is based on measurement data given in appendix G.
Figure 3.1.2. 1: PV in cod liver oil at six different stages of the oxidation process determined by the spectrophotometric ferric thiocyanate method. The PV given for each oxidation stage is the mean value based on ten parallels, and the uncertainty is given as standard deviation.
To evaluate the uncertainty and lower detection limit of the method, the RSD was calculated. The calculations are based on standard deviation measurements from data given in appendix G. The results of RSD calculations are illustrated in figure 3.1.2.2
0
5
10
15
20
25
30
35
40
PV (m
Eq p
erox
ide
kg-1
oil)
Oil 1 Oil 2 Oil 3 Oil 4 Oil 5 Oil 6

30
Figure 3.1.2.2: RSD as a function of PV, measured by the ferric thiocyanate method based on measurements at six different stages of the oxidation process. The PVs given are mean values based on ten parallels.
The standard deviation, illustrated by error bars, appears to increase proportionally with the increase in PV shown in figure 3.1.2.1. The related RSD shown in figure 3.1.2.2 illustrates a decrease in RSD at increasing PV. The lowest range (PV 0.7-1.9) had standard deviations 0.34 and 0.55 respectively, and the resulting RSD was therefore high. At PV ≥3.6 a relatively stable RSD of 10% is seen in figure 3.1.2.2, and this was therefore considered the lower detection limit when the method was applied to cod liver oil, with an uncertainty of 10%. A lower detection limit of 0.1meq peroxide O2 / kg for the ferric thiocyanat method has been reported by several authors, however this value is a general value given for all types of oil (Dobarganes and Velasco, 2002). Several authors point at the use of the ferric thiocyanate method as a better alternative to iodometric titration at low oxidation levels, due to the lack of sensitivity in the latter method. However, the lower detection limit might vary due to different composition of fatty acids in the type of fat to be analyzed. Different fatty acids will yield numerous decomposition products, which might have different affinity to the reagents used in the method (Tsoukalas and Grosch, 1977). This might explain the higher detection limit PV≥3.6 ±10% found in this thesis, when the ferric thiocyanate method was applied to cod liver oil. The findings of a higher detection limit by the ferric thiocyanate method compared to the iodometric titration are unexpected, as the literature data conclude with the opposite.
Shanta and decker reported a 6.1% RSD for the ferric thiocyante method when applied to fish oil at PV 12.9 (Shantha and Decker, 1994). The findings of 10% RSD in this thesis therefore correlate fairly well with this literature data.
0 5
10 15 20 25 30 35 40 45 50 55 60
0 2 4 6 8 10 12 14 16 18 20 22 24 26 28 30 32 34
RSD
(%)
PV (mEq peroxide kg-1 oil)

31
3.1.3 Determination of uncertainty of the AV method The uncertainty of the AV method was determined based on cod liver oil from factory A, which was intentionally oxidized to ten levels of oxidation as describes in section 2.1. Measurements taken at each stage of oxidation were labeled “oil 1- oil 10”. The oil was measured according to the AOCS official method Cd 18-90. The results of the AV determination are presented in figure 3.1.3.1. AV given for each oil is the mean value of ten parallels, and uncertainty is given as standard deviation. Measurement data are given in appendix H.
Figure 3.1.3. 1: Determination of AV in cod liver oil at ten different stages of the oxidation process. Each AV given is the mean value based on ten parallels, and uncertainty is given as standard deviation.
To determine the uncertainty and lower detection limit of the AV method, the RSD was determined. The calculations are based on standard deviation measurements from data given in appendix H. The results of RSD calculations are illustrated in figure 3.1.3.2
0 2 4 6 8
10 12 14 16 18 20 22 24 26 28 30
AV
Oil 1 Oil 2 Oil 3 Oil 4 Oil5 Oil 6 Oil 7 Oil 8 Oil 9 Oil 10

32
Figure 3.1.3.2: RSD as a function of AV, measured in cod liver oil at ten different oxidation levels. Each AV measurement given is the mean value based on ten parallels.
No clear relationship between standard deviation, illustrated by error bars, and increasing AV is seen in figure 3.1.3.1 as the standard deviation fluctuates between oil 2-9. Nevertheless, the highest AV has higher standard deviation compared to the lowest AV. A clearer relationship is seen in the calculation of RSD, illustrated in figure 3.1.3.2. A high % RSD (maximum 65%) is observed at AV ≤ 0.89, and measurements at this low AV are therefore highly unreliable. In the same figure a relatively stable 5% RSD at AV ≥ 1.3 is seen, and measurements in this range therefore have a much higher precision. AV is a measurement of aldehydes present in the sample, a decomposition product of the oxidation process. As mentioned in section 1.2.2, each oil produces a large number of decomposition products depending on fatty acid composition and environmental factors. The affinity of the anisidine reagent towards different aldehydes is likely to vary in different oils. In the AOCS official method Cd 18-90 a precision of 4.0-5.8% RSD is given. These precision measurements are however based on vegetable oils (crude rapeseed oil and refined palm oil), oils with a higher stability compared to fish oil. In this thesis the AV method was found to have a 5% RSD for AV measurements ≥1.3 when applied on cod liver oils. These findings correlate well with the precision values give in the AOCS official method, and hence indicate that the fatty acid composition in fish oil do not influence the precision given in the AOCS official method.
0 5
10 15 20 25 30 35 40 45 50 55 60 65 70
0 2 4 6 8 10 12 14 16 18 20 22 24 26 28 30 32
RSD
(%)
AV

33
3.1.4 Determination of uncertainty of the thiobarbituric acid (TBARS) method The uncertainty of the TBARS method was determined based on cod liver oil from factory A, which was intentionally oxidized to eight oxidation levels as described in section 2.1. The eight oxidation levels were labeled “oil 1- oil 8”. TBARS measurements for oil 2 were not made, as the level of oxidation was very similar to the oxidation level in oil 1. For each oil, ten parallels were measured based on the spectrophotometric method of Ke et al. The results of TBARS determination are presented in figure 3.1.4.1. TBARS value given for each oil is the mean value of the ten parallels, and uncertainty is given as standard deviation. Measurement data are given in appendix I.
Figure 3.1.4. 1: Determination of TBARS value measured in cod liver oil at seven oxidation levels. Each AV given is a mean value based on ten parallels, and uncertainty is given as standard deviation.
To determine the uncertainty and lower detection limit of the TBARS method, RSD was determined. The results of the RSD calculations are presented in figure 3.1.4.2. The calculations are based on standard deviation measurements from data given in appendix I.
0
0.5
1
1.5
2
2.5
3
3.5
4
4.5
µM T
BA
RS
/ g
Oil1 Oil3 Oil 4 Oil 5 Oil 6 Oil 7 Oil 8

34
Figure 3.1.4.2: RSD as a function of TBARS value, measured in cod liver oil at seven oxidation levels. Each TBARS value given is the mean value based on ten parallels.
With the exception of oil 3 and 4, the standard deviation (illustrated by error bars) appears to increase proportionally as the TBARS value increase in figure 3.1.4.1. The relationship between TBARS value and standard deviation is illustrated in figure 3.1.4.2 where RSD is shown as a function of TBARS values. Low TBARS measurements (0.11-0.48 µM TBARS/g) had relatively high standard deviations of 0.051 and 0.16 respectively, resulting in high % RSD illustrated in figure 3.1.4.2. A relatively stable 12% RSD is however seen at 0.68 µM TBARS/g in figure 3.1.4.2. A lower detection limit of 0.68 µM TBARS/g was therefore determined for the TBARS method when applied to cod liver oil, with a 12% uncertainty.
As the TBA reagent react with numerous secondary oxidation products, the uncertainty and lower detection limit of the method are likely to change when applied to different types of oil having different fatty acid composition. In the method described by Ke et al. the RSD of the method is given for several marine oils. The RSD given ranges from 2.2-7.1% in herring, mackerel, redfish, capelin and oxidized herring oil with corresponding oxidation levels from 0.107 to 2.063 µM TBARS/g (Ke and Woyewoda, 1979). The variation in RSD emphasize that the uncertainty of the method is dependent on fatty acid composition in the investigated oil, as the RSD change even between different marine oils. The uncertainty of 12% RSD found in this thesis is therefore only representative for the cod liver oil used in this thesis.
0 5
10 15 20 25 30 35 40 45 50
0 0.5 1 1.5 2 2.5 3 3.5 4
RSD
(%)
µM TBARS / g

35
3.2 Reevaluation of the ferric thiocyanate method The published method of IDF was reevaluated by comparison with a modified version of the IDF method. As described in section 2.4.2 the modified version has several modifications, including the solvent used to dissolve sample oil, deaeration of reagents, premixing of reagent solution, use of antioxidant and type of reducing agent used. These were all factors that possibly had an influence on absorbance and consequently on PV determination. The experiment investigated whether the varied factors led to a difference in absorbance between the IDF method and the modified version. Possible differences were tested at two different stages of the oxidation process, at a low level and at a relatively high oxidation level. In addition, the importance of the three minutes reagent reaction time stated in the IDF method was investigated by measuring absorbance as a function of increasing reagent reaction time. Measurements were detected after 1, 2 and 3 minutes followed by measurements every second minute until the 15th minute. The results are presented in figure 3.2.1.1, where the IDF method is represented by blue boxes, and light green circles represent the modified version. Each value of absorbance is given as a mean value based on four parallels. Blank samples are seen in the lower part of the figure and given as a mean value of four parallels at each time detection point. Measurement data is given in appendix J.
Figure 3.2.1 1: Absorbance as a function of time measured by the published ferric thiocyanate method of IDF and by a modified version of this method. The IDF method is represented by blue boxes, while the modified version is represented by light green circles. The two methods were tested at two different stages of the oxidation process. The values of absorbance given are mean values based on four parallels. Blank samples are shown in the lower part of the figure and were based on three parallels.
The net absorbance (absorbance – blank) obtained by the IDF method and the modified version at two different stages of the oxidation process is illustrated in figure 3.2.1.2.
0
0.05
0.1
0.15
0.2
0.25
0.3
0.35
0 1 2 3 4 5 6 7 8 9 10 11 12 13 14 15
Abs
orba
nce
Time (minutes)
Published IDF method-high oxidation
Published IDF method - low oxidation
Modified version - high oxidation
Modified version - low oxidation
Blank, published IDF method
Blank, modifed version

36
Figure 3.2.1.2: Net absorbance (absorbance – blank) obtained by the IDF ferric thiocyanate method and by the modified version of the method. The IDF method is represented by blue boxes, while the modified version of the method is represented by light green circles. Absorbance values given are mean values based on four parallels.
A steeper increase in absorbance as a function of time is observed in the blank samples of the IDF method, compared to a close to unchanged absorbance in the blank of the modified version, illustrated in figure 3.2.1.1. This observation can have two possible explanations. One explanation is that iron and NH4SCN might need time to react, and the premixed reagent solution in the modified version therefore give a stable absorbance of the blank sample. This in contradiction to the IDF method, where iron and NH4SCN is added separately, causing absorbance to increase as the reagents react. Fe2+ ions can be autoxidized by atmospheric oxygen (Aust et al., 1985), and might give a second explanation of the observation in difference in absorbance of the two blank samples. Deaeration of the reagents by nitrogen flushing in the modified version might have eliminated influence of oxygen and therefore stable absorbance was observed as the iron remains in its reduced form. If Fe2+ ions were oxidized to Fe3+ ions in the IDF method, these ions will interfere with NH4SCN in the blank sample and explain the increased absorbance. If the latter explanation is right, these findings suggest that the IDF method give an overestimation of hydroperoxide content, due to influence of atmospheric oxygen on the reagents. This explanation is also supported by literature data (Mihaljevic et al., 1996).
When net absorbance was determined, as illustrated in figure 3.2.1.2, the increase in absorbance as a function of time was very similar in both methods. Both methods seemed to have a change in steepness in the absorbance curve just after 3 minutes of reagent reaction time. This suggests that the reaction between the reagent and the hydroperoxides are completed at this point, followed by a flattening of the curve. This strengthens the importance of the reagent reaction time of 3 minutes stated in the published method of IDF.
0.000
0.050
0.100
0.150
0.200
0.250
0.300
0 1 2 3 4 5 6 7 8 9 10 11 12 13 14 15
Abs
orba
nce
Time (minutes)
Published IDF method -high oxidation
Published IDF method - low oxidation
Modified version - high oxiditionn
Modified version - low oxidation

37
As can be seen in figure 3.2.1.2, a difference in absorbance was detected between the two methods. However, the way the experiment was set up made it impossible to detect the influence of the individually varied factors. Additional experiments, changing one factor at a time, need to be completed to give answers to which factors influences the absorbance. One clue might be the large difference in the ease of dissolving the oil in different solvents that was observed when the experiment was run in the laboratory. It was much easier to dissolve the oil in iso-hexane used in the IDF method, compared to ethanol used in the modified version. Extensive mixing on a vortex mixer solved the struggle with dissolving the oil in ethanol in the modified version. However, one might suspect that this extensive mixing accelerated decomposition of hydroperoxides and therefore resulted in an erroneous measurement of the oil.

38
3.3 Iodometric titration method
3.3.1 Influence of stirring procedure To investigate the possible influence of stirring method on PV measurements by iodometric titration, one fish oil and four cod liver oils from factory B were studied. The oils were chosen based on prior knowledge of approximate oxidation status, and the aim was to investigate the influence of stirring method at increasing levels of the oxidation process. For each oil, six parallels were measured after one minute on the magnetic stirrer at 350 rpm, and six parallels were measured after one minute of gentle stirring. Gentle stirring was equivalent to three times manual gentle circulation of the oil solution at time 0, 30 and 60 seconds upon titration. The results are presented in figure 3.3.1.1. Two columns represent each oil, the gentle stirring procedure is represented in the left column and the magnetic stirring procedure is represented in the right column. The PV measurements given are mean values of the six parallels, and the uncertainty is given as standard deviation. Measurement data is given in appendix K.
Figure 3.3.1.1: Influence of stirring method studied in one fish oil and four cod liver oils. Two columns represent each oil, where gentle stirring is presented in the left column and magnetic stirring is presented in the right column. The PV measurements given are mean values of six parallels and the uncertainty is given as standard deviation.
The difference in magnetic stirring and gentle stirring appeared to increase proportionally to the increase in PV, as illustrated in figure 3.3.1.1. To clarify this relationship, the difference between the procedures as a function of PV was plotted. The difference was calculated as the difference between stirring methods subtracted from PV obtained from gentle stirring. The results are presented in figure 3.3.1.2.
0
2
4
6
8
10
12
14
PV
(mEq
per
oxid
e kg
-1 o
il)
Fish oil Cod liver oil Cod liver oil Cod liver oil Cod liver oil
Fish oil gentle stirring
Fish oil magnet stirring
Cod liver oil, gentle stirring
Cod liver oil, magnet stirring
Cod liver oil, gentle stirring
Cod liver oil, magnet stirring
Cod liver oil, gentle stirring
Cod liver oil, magnet stirring
Cod liver oil, gentle stirring
Cod liver oil, magnet stirring

39
Figure 3.3.1. 2: Difference between gentle and magnetic stirring plotted as a function of PV. The difference was calculated as the difference between stirring methods subtracted from PV obtained by gentle stirring. PV measurements are mean values based on six parallels.
An increase in standard deviation (illustrated by error bars) at increasing PV, especially by the gentle stirring procedure is illustrated in figure 3.3.1.1. To clarify this possible relationship standard deviations for both methods were plotted as a function of PV. The calculated results are illustrated in figure 3.3.1.3
Figure 3.3.1. 3: Standard deviation obtained by gentle and magnetic stirring plotted as a function of PV. PV measurements given are mean values based on six parallels.
0
0.5
1
1.5
2
2.5
0 2 4 6 8 10
Diff
eren
ce in
PV
bet
wee
n st
irrin
g pr
oced
ures
PV (mEq peroxide kg-1 oil)
0
0.2
0.4
0.6
0.8
1
1.2
1.4
0 2 4 6 8 10 12 14
Stan
dard
dev
iatio
n
PV (mEq peroxide kg-1 oil)
Gentle stirring
Magnet stirring

40
Figure 3.3.1.1 illustrate a higher PV in general when magnetic stirring was used compared to gentle stirring. It is stated in the AOCS Official Method Cd 8b-90 that rapid mechanical stirring (e.g. with magnet stirrer) is highly recommended. However, it is only a recommendation and not an absolute requirement. Change of normal reactant interaction by applying extensive shaking is by Frankel termed an accelerating parameter. An increased reactant contact will accelerate the oxidation process (Frankel, 2005), and might explain the higher PV observed by the more vigorous magnetic stirring procedure. It is also likely that magnetic stirring to a higher degree dissolves the oil, and hence a greater amount of fatty acids are available to react with iodine resulting in higher determination of PV.
The difference between stirring procedures appeared to increase at later stages of the oxidation process, as illustrated in figure 3.3.1.2 were the difference was plotted as a function of PV. An explanation of this observation might be that the sample oil is dissolved to a lesser degree when prepared by gentle stirring compared to the magnetic stirring. Incomplete dissolvement becomes aggravated at later stages of the oxidation process, as more undissolved hydroperoxides accumulates. The accumulated undissolved hydroperoxides are likely to be less available to react with iodine, and this possibly explains the increased difference between the stirring procedures at more elevated stages of the oxidation process.
A higher standard deviation was expected for gentle stirring compared to magnet stirrer, as gentle stirring must be done manually and therefore are prone to human error. However, this does not explain the increase in standard deviation observed at increasing PV illustrated in figure 3.3.1.3. Again this can be explained by the lack of complete dissolvent of the sample oil when prepared by gentle stirring. At elevated stages of the oxidation process, the sample oil becomes increasingly heterogeneous due to the incomplete dissolvent of accumulated hydroperoxides. Heterogenic samples will lead to higher standard deviations between parallels measured. A higher degree of homogeneous dissolvent obtained by the magnetic stirring results in more consistent accessibility of iodide to react with the hydroperoxides present in the sample oil, and hence more repeatable parallels are obtained resulting in the constant standard deviation illustrated in figure 3.3.1.3.

41
3.3.2 Influence of reagent reaction time In the ISO 3960 method the reagent reaction time is specified to one minute. To investigate the importance of the 1minute reagent reaction time, one fish oil and three cod liver oils were studied. The oils were all from factory B. Four parallels with reagent reaction time 0.5, 1, 2 and 4 minutes respectively were measured, making a total of 16 parallels for each oil. Each oil sample was dissolved using a magnetic stirrer at 350 rpm. The results are presented in figure 3.3.2.1. The PV measurements given are mean values of the four parallels measured. Experimental data is given in appendix K.
Figure 3.3.2. 1: Influence of reagent reaction time on PV determination by iodometric titration. The PV measurements given are mean values based on four parallels.
PV measured by the iodometric titration method in fish and cod liver oils demonstrated an increase in PV at increasing reagent reaction time, as illustrated in figure 3.3.2.1. The influence of the reagent reaction time on PV measurements is mentioned by several authors (Shahidi and Zhong, 2005a, Gray, 1978), and therefore supports this observation.
To determine whether the observed increase in PV was due to additional formation of hydroperoxides or other chemical factors, conjugated dienes and trienes were measured in cod liver oil from factory B. The samples were prepared according to the procedure of Radiometer analytical, except that samples were measured at reagent reaction time 1, 5 and 10 minutes. In addition, 2mL of the prepared sample was removed prior to titration at the given reagent reaction times to simultaneously determine concentration of conjugated dienes /trienes by spectrophotometric measurements. The results are presented in figure 3.3.2.2, where PV and conjugated dienes / trienes values are mean values based on four parallels.
0
2
4
6
8
10
12
14
0 0.5 1 1.5 2 2.5 3 3.5 4 4.5
PV (m
Eq p
erox
ide
kg-1
oil)
Reagent reaction time (minutes)
Fish oil
Cod liver oil
Cod liver oil
Cod liver oil

42
Figure 3.3.2.2: Conjugated dienes / trienes and PV measured in cod liver oil at reagent reaction time 1, 5 and 10 minutes. Absorbance detected from conjugated dienes (234 nm) and trienes (266 nm) is shown on the primary vertical axis, while the PV detected in the same cod liver oil is shown on the secondary vertical axis. Absorbance measurements are represented by triangular symbols, while PV measurements are represented by round symbols. All measurements are mean values based on four parallels.
The observed increase in conjugated dienes and conjugated trienes, illustrated in figure 3.3.2.2 indicate that additional hydroperoxides were formed during the time interval of 1-10 minutes. Additional formation of hydroperoxides will lead to more oxidation of iodide ions to form iodine and can therefore explain the observed increased in PV at increasing reagent reaction time.
The relatively rapid increase in formation of new hydroperoxides are likely to be explained by the unstable nature of the fatty acids in marine oils. To investigate this assumption, the marine oil was compared to a vegetable oil with higher stability fatty acids. Two fish oils and two cod liver oils from factory B was compared to canola oil obtained from a local grocery store. The increase in PV as a function of time was investigated in each oil by measuring four parallels at time 0.5, 1, 2 and 4 minutes. The results are presented in figure 3.3.2.3.
0
1
2
3
4
5
6
7
0
0.5
1
1.5
2
2.5
3
3.5
4
0 1 2 3 4 5 6 7 8 9 10 11
PV (m
Eq p
erox
ide
kg-1
oil)
Abs
orba
nce
(234
nm
and
266
nm
)
Reagent reaction time (minutes)
Conjugated dienes
Conjugated trienes
PV

43
Figure 3.3.2.3: Investigation of differences in increasing PV as a function of time in vegetable -and marine oils. Marine oils are presented by squares, while vegetable oil is presented by diamonds. The PV measurements given are mean values based on four parallels.
The findings illustrated in figure 3.3.2.3 indicated a steeper increase in PV as a function of time in the marine oils compared to the vegetable oil. The results are most likely explained by the composition of fatty acids of the investigated oils. The high content of EPA and DHA found in cod liver and fish oil are much more susceptible to oxidation than linolenate containing vegetable oils (Cho et al., 1987, Frankel, 2005). The fatty acid composition of canola oil has been estimated to consist of approximately 55% oleic acid, 25% linoleic acid, 10% α-linolenate and 4% saturated fatty acids (Dupont et al., 1989).This explanation was investigated further by measuring formation of conjugated dienes and trienes as a function of time, while simultaneously following increase in PV as a function of time in canola oil. The results were compared to the results obtained by cod liver oil illustrated in figure 3.3.2.2. The comparison of canola oil and cod liver oil are presented in figure 3.3.2.4. PV and conjugated dienes/trienes values given are mean values of four parallels.
0
2
4
6
8
10
12
14
0 1 2 3 4 5
PV (m
Eq p
erox
ide
kg-1
oil)
Reagent reaction time (minutes)
Canola oil
Fish oil
Cod liver oil
Cod liver oil
Fish oil

44
Figure 3.3.2.4: Conjugated dienes /trienes and PV measured in cod liver oil and canola oil at reagent reaction time 1, 5 and 10 minutes. Absorbance detected from conjugated dienes (234 nm) and conjugated trienes (266 nm) is shown on the primary vertical axis, while the PV detected in the same oils are shown on the secondary vertical axis. Absorbance measurements are represented by triangsle, while PV measurements are represented by circles. All measurements are mean values based on four parallels.
The results presented in figure 3.3.2.4 illustrate a steeper increase in PV and conjugated dienes/trienes as a function of time in the cod liver oil compared to the canola oil. These findings support the suggestion that the cod liver oil is more susceptible to oxidation, and hence formation of additional hydroperoxides, compared to the canola oil. These findings are also supported by experimental findings of higher oxygen consumption in fish oil compared to vegetable oil at a time interval of 0-40 minutes reported by Tian and coworkers. Also a lower activation energy for fatty acid decomposition was found in fish oil compared to vegetable oil. The latter fact is independent of reagent reaction time (Tian and Dasgupta, 1999), however it supports the explanation of easier oxidation of fish oils compared to vegetable oils. Reagent reaction time has therefore to a higher degree influence on PV measurements for marine oils compared to vegetable oils, as new hydroperoxides are formed more rapidly in the unstable marine oils and consequently elevates the PV.
At further extension of the reagent reaction time, the PV is expected to drop at an earlier stage in the fish and cod liver oil compared to the vegetable oil, due to the greater instability of the hydroperoxides formed in fish oils (Frankel, 2005). The higher susceptibility to decomposition because of the unstable hydroperoxides formed in marine oils, might argue against PV measurements by iodometric titration at late stages of the oxidation process. This is supported by findings of Tian and coworkers, who reported a decrease in PV despite increase in oxygen consumption at elevated stages of the oxidation process in fish oil (Tian and Dasgupta, 1999).
0
1
2
3
4
5
6
7
0
1
2
3
4
5
6
7
0 1 2 3 4 5 6 7 8 9 10 11
PV (m
Eq O
2 kg-1
oil)
Abs
orba
nce
(234
nm
and
266
nm
)
Reagent reaction time (minutes)
Conjugated dienes, cod liver oil Conjugated dienes, canola oil Conjugated trienes, cod liver oil Conjugated trienes, canola oil PV, cod liver oil
PV, canola oil

45
3.3.3 Influence of oxygen removal The possibility of atmospheric oxygen influencing reagents and consequently the PV measurements obtained by the iodometric titration method was investigated. Nitrogen flushing of all reagents was performed no longer than three minutes before measurements were done. Four parallels with deaerated reagents and four parallels with untreated reagents were measured in two fish oils, one at a low oxidation level and one at a relatively high oxidation level. Both oils were from factory B. The results of the investigation of influence of oxygen removal in reagents are presented in figure 3.3.3.1. Experimental data is given in appendix K.
Figure 3.3.3.1: Differences between PV measurements obtained by iodometric titration with both deaerated and untreated reagents. Two fish oils at different stages of the oxidation process, one low oxidation level and one relatively high oxidation level were investigated. PV measurements given are mean values based on four parallels. Uncertainty is given as a 4.6% RSD in the low oxidation level oil and as a 2% RSD in the high oxidation level oil in the measurements performed according to the Radiometer analytical method, where reagents are prepared without nitrogen flushing. Uncertainty in the measurements with nitrogen flushed reagents is given as standard deviation.
The uncertainty in the measurements was determined based on the findings in section 3.3.1, for the measurements performed according to the procedure of Radiometer analytical (based on ISO3960), where reagents are prepared without nitrogen flushing. The determination of % uncertainty of the method, was 2% at PV>1.5, and were found to be 4.6% at PV measurements approximately 1.2. 4.6% and 2% RSD was therefore used as the uncertainty associated with the measurements performed according to the Radiometer analytical measurements. The possibility of different % uncertainty of the method when reagents were nitrogen flushed were considered, and the uncertainties associated with these measurements are therefore given as standard
0
2
4
6
8
10
12
14
16
18
20
PV (m
Eq O
2 kg-1
oil)
Fish oil Fish oil
Fish oil, N2 flushed
Fish oil, without N2 flushing
Fish oil, N2 flushed
Fish oil, without N2 flushing

46
deviation based on four parallels. Based on the uncertainties given, measurements with and without nitrogen flushing were found to be significantly different at both investigated oxidation levels. The higher PV obtained from untreated reagents is likely to be explained by the presence of oxygen causing liberation of iodine from potassium iodide and therefore erroneously high PV values is obtained. The reaction is accelerated in the presence of light and peroxides. This source of error is often referred to as the oxygen error in literature (Crowe and White, 2001, Gray, 1978).
Despite these findings, deaeration of reagents and solvents is not standard procedure in routine analyses (Frankel, 2005). In the investigation of influence of antioxidant and additive on the iodometric titration method, the deareation procedure was intentionally left out to obtain as realistic results as possible without modifications of the Radiometer analytical method.

47
3.4 Influence of antioxidants and additives on oxidation parameters By following standard procedures of methods, the possible influence of antioxidants and additives on oxidation parameters in the methods was studied. The aim was to investigate whether the antioxidants and additives interfered with the methods and consequently caused erroneously high or low oxidation parameters. The influence of the antioxidants and additives on the oxidation status in the oil, was out of the scope of this thesis. For all methods the effect of flavor additives (peppermint, lemon), antioxidants (Q10, BHT, tocopherol, astaxanthin, rosemary) and vitamins (vitamin K1) was studied. In the experiment, all additives were blended in cod liver oil obtained from factory B, to concentrations given in table 2.3.1. Experimental data from investigation of antioxidant and additive influence on the methods are given in appendix L.
3.4.1 Influence of antioxidants and additives on PV measurements by iodometric titration To investigate the possible influence of antioxidants and additives on the iodometric titration, three parallels of each additive and four control parallels were measured according to the procedure of Radiometer analytical. All measurements were completed the same day at similar conditions. The results of the studied effect of antioxidant and additive addition are illustrated in figure 3.4.1.1. Uncertainties are given as a 2% RSD, as determined for PV>1.5 measurements by iodometric titration in section 3.1.1.
Figure 3.4.1.1: Effect of antioxidants and additives on PV measurements by iodometric titration. PV measurements given are mean values based on four parallels for the control sample and three parallels for the antioxidant and additive parallels. Uncertainty is given as a 2% RSD.
Influence on PV measurements by the added antioxidants and additives are illustrated in figure 3.4.1.1. The control sample was found to have PV 2.9 ±2%, and all samples were evaluated as significantly different or not according to formula 2.6.2 described in section 2.6. Among the added antioxidants and additives BHT, rosemary and astaxanthin was found not to interfere with
0.0
1.0
2.0
3.0
4.0
5.0
6.0
PV (m
Eq p
erox
ide
kg-1
oil)
Control Q10 BHT Vit. K1 Lemon Peppermint Rosemary Astaxanthin Tocopherol

48
the iodometric titration method. Antioxidants Q10, and tocopherol, vitamin K1 and lemon –and peppermint extracts were all found to significantly increase PV, as compared to the control sample. The highest influence on PV was observed by addition of lemon extract, with a detected PV 4.7 ±2%. The chemical components of the lemon extract were not specified by the producer, but the lemon extract is likely to contain citric acid. In a recent study, H2O2 dependent oxidation of iodide was found to increase when citric acid was added to the reaction mix (Li et al., 2012). The observation was explained by the formation of peroxy carboxylic acid, summarized in the following steps:
R- COOH + H2O2 à R-COOOH + H2O (3.4.1.1)
The formed peroxy carboxylic acid is a powerful oxidant, which readily oxidize iodide to triiodide (three iodine atoms):
R-COOOH + 3I- + 2H+ à R-COOH + H20 + I-3 (3.4.1.2)
Based on the findings of Li et al., an explanation of the increased PV observed with addition of lemon extract might be a hydroperoxide dependent oxidation of iodide through a similar reaction, leading to elevated levels of iodine formed. This consequently increases the PV. Citric acid has three carboxyl groups available for peroxy carboxyl group formation. The potential to oxidize iodide has been found to depend on number of available sites for peroxy carboxyl groups to form (Li et al., 2012). Common to menthol (peppermint) and tocopherol is that they are phenolic compounds, while Q10 and vitamin K1 are quinones. The results demonstrated that these antioxidants and additives had a significant influence on the PV measurements, however the chemical mechanisms causing these observations need to be further investigated.

49
3.4.2 Influence of antioxidants and additives on PV measurements by the ferric thiocyanate method To study the possible influence of antioxidants and additives on PV measurements, four parallels of each additive and four control parallels were measured according to the method of IDF, with modifications according to Ueda et al. (1986) and Undeland et al. (1998). All measurements were performed at the same day with similar conditions. The results of the studied effect of antioxidants and additives on PV measurements are illustrated in figure 3.4.2.1. Uncertainty is given as a 30% RSD in control, tocopherol, BHT, rosemary and astaxanthin, as determined for 1.9≤AV<3.6 in section 3.1.2. Uncertainty is given as a 10% RSD in Q10, vitamin K1, peppermint and lemon extract, found to have PV>3.6. The 10% RSD at PV>3.6 was determined in section 3.1.2.
Figure 3.4.2. 1: Effect of antioxidants and additives on PV measurements performed by the ferric thiocyanate method. PV measurements given are mean values based on four parallels. Uncertainty is given as a 30% RSD in control, tocopherol, BHT, rosemary and astaxanthin. Uncertainty is given as a 10% RSD in Q10, vitamin K1, peppermint and lemon extract.
The control sample was found to have PV 2.6 ± 30%. All samples were evaluated as significantly different or not according to formula 2.6.2 described in section 2.6. Among the tested antioxidants and additives, only lemon extract was found to significantly interfere with the ferric thiocyanate method, with PV 5.0±10%.
As described in the previous section, although the chemical components of the lemon extract is not specified by the producer, the lemon extract is likely to contain citric acid. The results of higher PV with addition of lemon extract can be explained by the possibility of citric acid in lemon extract functioning as a chelator of Fe3+. A chelator can be defined as a compound having
0.0
1.0
2.0
3.0
4.0
5.0
6.0
PV (m
Eq p
erox
ide
kg-1
oil)
Control Tocopherol BHT Rosemary Q10 Vitamin K1 Peppermint Astaxanthin Lemon

50
two or more atoms on the same molecule capable of binding to, and hence stabilizing a metal atom (Miller et al., 1990), as describes in section 1.3. Common metal binding atoms are oxygen, nitrogen and sulfur. Chelators with an oxygen ligand tend to stabilize Fe3+, which decrease the reduction potential of iron. This characteristic of a chelator leads to higher oxidation rate of Fe2+ to Fe3+. Citric acid has three oxygen atoms, and is likely to function as a chelator in the oxidation reaction. This is supported by reported findings of six fold increase in oxidation rates of Fe2+ in the presence of citric acid, compared to oxidation of Fe2+ in tris buffer alone (Welch et al., 2002). With the higher rate of formation of Fe3+, more iron is complexed to NH4SCN and absorbance increase. Consequently the calculated PV is higher compared to samples where no citric acid was added, as illustrated in figure 3.4.2.1.

51
3.4.3 Influence of antioxidants and additives on AV measurements To investigate the possible influence of antioxidants and additives on AV measurements, four parallels for each additive and four control parallels were measured according to the AOCS official method Cd 18-90. All measurements were performed at the same day with similar conditions. The results from AV measurement with antioxidants and additives are illustrated in figure 3.4.3.1. Uncertainty given is a 5% RSD, which was determined for AV>1.3 in section 3.1.3.
Figure 3.4.3.1: Effect of antioxidants and additives on AV measurements. The AV measurements given are mean values based on four parallels, and uncertainty is given as a 5% RSD.
As illustrated in figure 3.4.3.1 added lemon extract influenced AV measurements to a high degree. To give a clearer view of the influence on AV measurements in the other investigated antioxidants and additives, figure 3.4.3.2 illustrate the observed influence on AV, with lemon extract left out.
0
50
100
150
AV
Control Tocopherol BHT Peppermint Rosemary Astaxanthin Vitamin K1 Q10 Lemon

52
Figure 3.4.2.2: Effect of antioxidants and additives on AV measurements. The AV measurements given are mean values based on four parallels, and uncertainty is given as a 5% RSD.
The control sample was found to have AV 6.0 ±5%. All samples were evaluated as significantly different or not according to formula 2.6.2 described in section 2.6. Among the investigated antioxidants and additives, rosemary and lemon extract had a significant influence on the AV measurement compared to the control sample. Rosemary extract significantly lowered the AV measurement, while lemon extract significantly elevated the AV measurement, as illustrated in figure 3.4.2.2. An explanation of the lowered AV measurement obtained by addition of rosemary extract might be that the aldehydes in the cod liver oil sample have higher affinity for binding to compounds in the rosemary extract compared to the p-anisidine reagent. If the binding of p-anisidine to aldehydes in the sample is lowered, the AV measurements decrease. This is however an explanation that needs to be further investigated.
The elevated measurement of AV illustrated in figure 3.4.2.1 is likely to be explained by interference of the p-anisidine reagent with aldehydes found in the lemon extract. It is generally accepted that aldehydes are responsible for the characteristic aroma of lemon extracts. Citral has been identified as the main aldehyde responsible for aroma, consisting of the isomers neral and geranial. In addition, aldehydes such as octanal, nonanal, citronellal and decanal has been identified in lemon oil (Ikeda et al., 1962). The amount of citral in lemon oil has been determined to be 2-5% w/w (Wilson et al., 2002). The p-anisidine reagent interferes with aldehydic compounds, as described in section 1.4.2.1. When the amount of aldehydes is the sample are increased by addition of lemon extract, elevated amounts of aldehyde-p-anisidine reagent complexes absorbing in the 350 nm UV spectra are created, and hence a higher AV is detected.
The elevated AV measurement in oil with added lemon extract, illustrated in figure 3.4.2.1, was further investigated by studying different levels of lemon extract addition. Concentrations of 0.5%, 1% and 2% were investigated. The results are illustrated in figure 3.4.2.3. AV
0.0
1.0
2.0
3.0
4.0
5.0
6.0
7.0 AV
Control Tocopherol BHT Peppermint Rosemary Astaxanthin Vitamin K1 Q10

53
measurements given are mean values based on four parallels, and uncertainty is given as a 5% RSD.
Figure 3.4.2. 1: Effect of lemon extract (concentrations of 0.5%, 1% and 2%) addition on AV measurements. AV measurements given are mean values based on four parallels. Uncertainty is given as a 5% RSD.
The results of varied percent of added lemon extract shown in figure 3.4.2.3, illustrate a proportional relationship between concentration of added lemon extract and AV. The results demonstrate that AV measurement on oil with added lemon extract give highly unreliable results most likely due to interference of aldehydes in lemon extract with the p-anisidine reagent.
0
20
40
60
80
100
120
140
160
0 0.5 1 1.5 2 2.5
AV
Added concentration of lemon extract (%)

54
3.4.4 Influence of antioxidants and additives on TBARS measurements To study the influence of antioxidants and additives on TBARS measurements, four parallels for each additive and four control parallels were measured. All measurements were performed according to the spectrophotometric method described by Ke et al. All measurements were performed at the same day with similar conditions. The results from TBARS measurements with additives and control samples are illustrated in figure 3.4.3.1. TBARS values given are mean values based on four parallels, and uncertainty is given as a 12% RSD as found for TBARS > 0.68 in section 3.1.4.
Figure 3.4.3.1: Influence of antioxidants and additives on TBARS measurements. The TBARS value given are mean values based on four parallels, and uncertainty is given as a 12% RSD.
The control sample was found to have a TBARS value 1.578 ±12%. All samples were evaluated as significantly different or not according to formula 2.6.2 described in section 2.6. Among the investigated antioxidants and additives, only lemon extract was found to significantly interfere with the TBARS method when compared to the control sample.
As described in section 1.4.2.2, a main limitation of the TBARS method rises from the ability of several compounds to react with the TBA reagent. Several carbonyls, such as alkanals, ketones, ketosteroids and esters, in addition to acids, proteins and sucrose among others have been found to react with the TBA reagent. As already described in the previous section, lemon extract contain several aldehydes, but also ketones such as methyl heptenone has been identified in lemon extract (Bernhard, 1960). It is therefore likely that the oil containing lemon extract give an overestimation of the intensity of the color complex formed, because compounds in the lemon extract are able to react with the TBA reagent. Although to a less degree affected of the lemon
0.0
0.5
1.0
1.5
2.0
2.5
3.0
µM
TB
AR
S /g
Control BHT Peppermint Lemon Tocopherol Vit. K1 Q10 Astaxanthin Rosemary

55
extract addition compared to the AV method, the TBARS measurements of oil containing lemon extract are unreliable.
4. Conclusion
In this thesis uncertainty and lower detection limit of the methods was determined for measurements on fish -and cod liver oil. Measurement by the iodometric titration method was found to have a lower detection limit of PV >2.0 mEq peroxide kg-1 oil, with an uncertainty of ± 2%. According to literature the ferric thiocyanate method was expected to have a lower sensitivity compared to the iodometric titration, however the opposite was found in this thesis when methods were applied to marine oils. Measurement by the ferric thiocyanate method was found to have a detection limit of PV ≥3.6 mEq peroxide kg-1 oil, with an uncertainty of ±10%. Measurements by the AV method was found to have a lower detection limit of AV≥ 1.3, with an uncertainty of ± 5%. Measurements by the TBARS method were found to have a lower detection limit of 0.7 µM TBARS /g sample, with an uncertainty of ±12%.
The published method of IDF for PV determination by the ferric thiocyanate method was reevaluated by comparison with a modified version. Differences between the methods were variations in factors such as type of solvent used, deaeration of reagents, premixing of reagents and addition of antioxidant. It was observed difference in absorbance in the two methods, and it can therefore be concluded that the varied factor affected the method. It is necessary to perform further experiments to determine which of the varied factors that cause variations in the absorbance measurements.
PV measurements by the iodometric titration method were found to be influenced by the stirring method, reagent reaction time and oxygen removal. Stirring by magnetic stirring was found to give a higher PV compared to gentle stirring. However, stirring by magnetic stirring was found to give a consistent standard deviation, in contradiction to gentle stirring. The importance of the 1minute reagent reaction time was strengthened as the PV was found to rapidly increase at prolonged reagent reaction times. It was demonstrated that this to a higher degree is important for marine oils compared to vegetable oils, as new hydroperoxides are formed more rapidly in the unstable marine oils. Significant influence of oxygen removal in reagents was detected in cod liver oil. The findings in this thesis suggests that stirring by magnetic stirring, 1 minute reagent reaction time and deaeration of all reagents should be standard procedure when PV is determined in marine oils by the iodometric titration method.
Among eight investigated antioxidants and additives, Q10, tocopherol, vitamin K1, lemon – and peppermint extract was found to significantly elevate the PV measured by iodometric titration. For PV determination by the ferric thiocyanate method, lemon extract was found to significantly elevate the PV. Rosemary extract was found to significantly lower the AV measurement, while lemon extract to a very high degree elevated the AV measurement. In measurements by the TBARS method only lemon extract was found to significantly interfere with the method, leading

56
to an elevated TBARS value. There is need for development of methods that are less sensitive to influence by antioxidants and additives. Especially methods for measurements of secondary decomposition products are needed for fish oils with added lemon extracts as today’s measurements by AV and TBARS method give highly unreliable results.

57
References
ALLEN, J. C. & HAMILTON, R. J. 1994. Rancidity in foods, Aspen Publishers. ANDERSON, B. M. & MA, D. 2009. Are all n-3 polyunsaturated fatty acids created equal.
Lipids Health Dis, 8, 33. ANTOLOVICH, M., PRENZLER, P. D., PATSALIDES, E., MCDONALD, S. & ROBARDS,
K. 2002. Methods for testing antioxidant activity. Analyst, 127, 183-198. AUST, S. D., MOREHOUSE, L. A. & THOMAS, C. E. 1985. Role of metals in oxygen radical
reactions. Journal of free radicals in biology & medicine, 1, 3. BANG, H. O. & DYERBERG, J. 1972. Plasma lipids and lipoproteins in Greenlandic west coast
Eskimos. Acta Medica Scandinavica, 192, 85-94. BERNHARD, R. A. 1960. Analysis and composition of oil of lemon by gas-liquid
chromatography. Journal of Chromatography A, 3, 471-476. BUETTNER, G. R. 1993. The Pecking Order of Free Radicals and Antioxidants: Lipid
Peroxidation, -Tocopherol, and Ascorbate. Archives of Biochemistry and Biophysics, 300, 535-535.
BURR, M., GILBERT, J., HOLLIDAY, R. M., ELWOOD, P., FEHILY, A., ROGERS, S., SWEETNAM, P. & DEADMAN, N. 1989. Effects of changes in fat, fish, and fibre intakes on death and myocardial reinfarction: diet and reinfarction trial (DART). The Lancet, 334, 757-761.
ÇELIK, S. E., ÖZYÜREK, M., GÜÇLÜ, K. & APAK, R. 2010. Solvent effects on the antioxidant capacity of lipophilic and hydrophilic antioxidants measured by CUPRAC, ABTS/persulphate and FRAP methods. Talanta, 81, 1300-1309.
CHAIYASIT, W., ELIAS, R. J., MCCLEMENTS, D. J. & DECKER, E. A. 2007. Role of physical structures in bulk oils on lipid oxidation. Critical Reviews in Food Science and Nutrition, 47, 299-317.
CHIRICO, S., SMITH, C., MARCHANT, C., MITCHINSON, M. J. & HALLIWELL, B. 1993. Lipid peroxidation in hyperlipidaemic patients. A study of plasma using an HPLC-based thiobarbituric acid test. Free Radical Research, 19, 51-57.
CHO, S. Y., MIYASHITA, K., MIYAZAWA, T., FUJIMOTO, K. & KANEDA, T. 1987. Autoxidation of ethyl eicosapentaenoate and docosahexaenoate. Journal of the American Oil Chemists' Society, 64, 876-879.
CHOE, E. & MIN, D. B. 2009. Mechanisms of antioxidants in the oxidation of foods. Comprehensive Reviews in Food Science and Food Safety, 8, 345-358.
COULTATE, T. 2009. Food, The chemistry of its components, Cambridge, UK, RSC Publishing. CROWE, T. D. & WHITE, P. J. 2001. Adaptation of the AOCS official method for measuring
hydroperoxides from small-scale oil samples. Journal of the American Oil Chemists' Society, 78, 1267-1269.
DE LAS HERAS, A., SCHOCH, A., GIBIS, M. & FISCHER, A. 2003. Comparison of methods for determining malondialdehyde in dry sausage by HPLC and the classic TBA test. European Food Research and Technology, 217, 180-184.
DOBARGANES, M. C. & VELASCO, J. 2002. Analysis of lipid hydroperoxides. European journal of lipid science and technology, 104, 420-428.

58
DUPONT, J., WHITE, P., JOHNSTON, K., HEGGTVEIT, H., MCDONALD, B., GRUNDY, S. & BONANOME, A. 1989. Food safety and health effects of canola oil. Journal of the American College of Nutrition, 8, 360-375.
DYERBERG, J., BANG, H. & HJORNE, N. 1975. Fatty acid composition of the plasma lipids in Greenland Eskimos. The American journal of clinical nutrition, 28, 958-966.
EYMARD, S. & GENOT, C. 2003. A modified xylenol orange method to evaluate formation of lipid hydroperoxides during storage and processing of small pelagic fish. European Journal of Lipid Science and Technology, 105, 497-501.
FARHOOSH, R. & PAZHOUHANMEHR, S. 2009. Relative contribution of compositional parameters to the primary and secondary oxidation of canola oil. Food Chemistry, 114, 1002-1006.
FENNEMA, O. R., PARKIN, K. L. & DAMODARAN, S. 2007a. Food Chemistry, Taylor & Francis Group.
FENNEMA, O. R., PARKIN, K. L. & SRINIVASAN, D. 2007b. Fennemas' Food Chemistry, Madison, Wisconsin, USA, CRC Press, Taylor & Francis Group.
FENNEMA, O. R., PARKIN, K. L. & SRINIVASAN, D. 2007c. Food Chemistry, USA, CRC Press, Taylor and Francis Group.
FRANKEL, E. 1985. Chemistry of autoxidation: mechanism, products and flavor significance. Flavor chemistry of fats and oils, 1-37.
FRANKEL, E. N. 1998. Lipid oxidation, Oily Press Dundee, Scotland. FRANKEL, E. N. 1999. Food antioxidants and phytochemicals: present and future perspectives.
Lipid/Fett, 101, 450-455. FRANKEL, E. N. 2005. Lipid Oxidation, Bridgwater, England, The Oily Press. GRAF, E. & EATON, J. W. 1990. Antioxidant functions of phytic acid. Free Radical Biology
and Medicine, 8, 61-69. GRAY, J. 1978. Measurement of lipid oxidation: a review. Journal of the American Oil
Chemists' Society, 55, 539-546. GURR, M. I. 1999. Lipids in nutrition and health : a reappraisal, Bridgewater, England, The
Oily Press. HEATON, F. & URI, N. 1958. Improved iodometric methods for the determination of lipid
peroxides. Journal of the Science of Food and Agriculture, 9, 781-786. HOLM, U. 1972. Abstracts. International Society for Fat Research Congress. Gøteborg, Sweden. HUSSEIN, G., SANKAWA, U., GOTO, H., MATSUMOTO, K. & WATANABE, H. 2006.
Astaxanthin, a Carotenoid with Potential in Human Health and Nutrition⊥. Journal of natural products, 69, 443-449.
IKEDA, R., ROLLE, L., VANNIER, S. & STANLEY, W. 1962. Lemon Oil Composition, Isolation and Identification of Aldehydes in Cold-Pressed Lemon Oil. Journal of Agricultural and Food Chemistry, 10, 98-102.
JARDINE, D., ANTOLOVICH, M., PRENZLER, P. D. & ROBARDS, K. 2002. Liquid chromatography-mass spectrometry (LC-MS) investigation of the thiobarbituric acid reactive substances (TBARS) reaction. J Agric Food Chem, 50, 1720-1724.
KAMAL-ELDIN, A. & YANISHLIEVA, N. V. 2002. N-3 fatty acids for human nutrition: stability considerations. European Journal of Lipid Science and Technology, 104, 825-836.

59
KE, P. & WOYEWODA, A. 1979. Microdetermination of thiobarbituric acid values in marine lipids by a direct spectrophotometric method with a monophasic reaction system. Analytica Chimica Acta, 106, 279-284.
KISHIDA, E., TOKUMARU, S., ISHITANI, Y., YAMAMOTO, M., ORIBE, M., IGUCHI, H. & KOJO, S. 1993. Comparison of the formation of malondialdehyde and thiobarbituric acid-reactive substances from autoxidized fatty acids based on oxygen consumption. J Agric Food Chem, 41, 1598-1600.
LI, H. P., YEAGER, C. M., BRINKMEYER, R., ZHANG, S., HO, Y. F., XU, C., JONES, W. L., SCHWEHR, K., OTOSAKA, S. & ROBERTS, K. A. 2012. Bacterial production of organic acids enhances H2O2-dependent iodide oxidation.
LIEBLER, D. C. 1993. The role of metabolism in the antioxidant function of vitamin E. CRC Critical Reviews in Toxicology, 23, 147-169.
LIST, G. R., WANG, T. & SHUKLA, V. K. S. 2005. Storage, Handling, and Transport of Oils and Fats. Bailey's Industrial Oil and Fat Products.
MAKINEN, M., HAILA, K., LAMPI, A. & VIINANEN, E. DETERMINATION OF PEROXIDE VALUE-COMPARISON OF IODOMETRIC AND FERRIC THIOCYANATE METHODS. 1995. LIPIDFORUM.
MEHLENBACHER, V. C. 1960. Analysis of fats and oils. MIHALJEVIC, B., KATUSIN-RAZEM, B. & RAZEM, D. 1996. The reevaluation of the ferric
thiocyanate assay for lipid hydroperoxides with special considerations of the mechanistic aspects of the response. Free Radical Biology and Medicine, 21, 53-63.
MILLER, D. M., BUETTNER, G. R. & AUST, S. D. 1990. Transition metals as catalysts of" autoxidation" reactions. Free radical biology & medicine, 8, 95.
MILLER, J. C. & MILLER, J. N. 1993. Statistics for Analytical Chemistry, England, Ellis Horwood PTR Prentice Hall.
OHSHIMA, T., YANKAH, V. V., USHIO, H. & KIOZUMI, C. 1998. Antioxidizing potentials of BHA, BHT, TBHQ, tocopherol, and oxygen absorber incorporated in a Ghanaian fermented fish product. Advances in Experimental Medicine and Biology, 434, 181-188.
POKORNÝ, J. 1991. Natural antioxidants for food use. Trends in Food Science & Technology, 2, 223-227.
PRICKETT, J. D., ROBINSON, D. R. & STEINBERG, A. D. 1983. Effects of dietary enrichment with eicosapentaenoic acid upon autoimmune nephritis in female NZBxNZW/F1 mice. Arthritis & Rheumatism, 26, 133-139.
REINDL, B. & STAN, H. J. 1982. Determination of volatile aldehydes in meat as 2, 4-dinitrophenylhydrazones using reversed-phase high-performance liquid chromatography. Journal of Agricultural and Food Chemistry, 30, 849-854.
RUÍZ, A. & LENDL, B. 2001. A rapid method for peroxide value determination in edible oils based on flow analysis with Fourier transform infrared spectroscopic detection. Analyst, 126, 242-246.
SHAHIDI, F. & WANASUNDARA, U. 2002. Methods for measuring oxidative rancidity in fats and oils. FOOD SCIENCE AND TECHNOLOGY-NEW YORK-MARCEL DEKKER-, 465-488.
SHAHIDI, F. & ZHONG, Y. 2005a. Lipid oxidation: measurement methods. Bailey's Industrial Oil and Fat Products.
SHAHIDI, F. & ZHONG, Y. 2005b. Lipid Oxidation: Measurement Methods. Bailey's Industrial Oil and Fat Products. St. John's, Newfoundland, Canada: John Wiley & Sons, Inc.

60
SHANTHA, N. C. & DECKER, E. A. 1994. Rapid, sensitive, iron-based spectrophotometric methods for determination of peroxide values of food lipids. Journal of AOAC International, 77, 421-424.
SIMOPOULOS, A. P. 1991. Omega-3 fatty acids in health and disease and in growth and development. The American journal of clinical nutrition, 54, 438-463.
TAKAGI, T., MITSUNO, Y. & MASUMURA, M. 1978. Determination of peroxide value by the colorimetric iodine method with protection of iodide as cadmium complex. Lipids, 13, 147-151.
TAYLOR, J. R. 1997. An introduction to error analysis, Sausalito, California, USA, University Science Books.
TIAN, K. & DASGUPTA, P. K. 1999. Determination of oxidative stability of oils and fats. Analytical chemistry, 71, 1692-1698.
TSOUKALAS, B. & GROSCH, W. 1977. Analysis of fat deterioration-comparison of some photometric tests. Journal of the American Oil Chemists' Society, 54, 490-493.
VON SCHACKY, C. 1987. Prophylaxis of atherosclerosis with marine omega-3 fatty acids. Annals of internal medicine, 107, 890-899.
WELCH, K. D., DAVIS, T. Z. & AUST, S. D. 2002. Iron autoxidation and free radical generation: effects of buffers, ligands, and chelators. Archives of Biochemistry and Biophysics, 397, 360-369.
WHITE, P. 1995. Conjugated diene, anisidine value, and carbonyl value analyses. Methods to assess quality and stability of oils and fat-containing foods, 159-178.
WILSON, N. D., IVANOVA, M. S., WATT, R. A. & MOFFAT, A. C. 2002. The quantification of citral in lemongrass and lemon oils by near‐infrared spectroscopy. Journal of pharmacy and pharmacology, 54, 1257-1263.

61
Appendixes
Appendix A : Radiometer analytical iodometric titration metod (ISO 3960) ................................... i
Appendix B: IDF published ferric thiocyanate method .................................................................... i
Appendix C: Modified version of the IDF published ferric thiocyanate method ........................... iv
Appendix D: AOCS official AV method ..................................................................................... viii
Appendix E: TBARS method of Ke et al. ........................................................................................ x
Appendix F : Experimental data from determination of uncertainty of the iodometric titration method .......................................................................................................................................... xiii
Appendix G : Experimental data from determination of uncertainty of the ferric thiocyanate method ........................................................................................................................................... xvi
Appendix H : Experimental data from determination of uncertainty of the AV method .............. xxi
Appendix I : Experimental data from determination of uncertainty of TBARS method ......... xxviii
Appendix J : Experimental data, reevaluation of the IDF ferric thiocyanate method ............... xxxii
Appendix K : Experimental data from investigation of influence of stirring procedure, reagent reaction time and oxygen removal on the iodometric titration method. ................................... xxxiv

i
Appendix A : Radiometer analytical iodometric titration metod (ISO 3960)
Page 1 of 3
Titra
tion
Appl
icatio
ns –
TTI
P02-
01AF
D/20
02-0
6A
Peroxide Number of Edible Oils(NF T 60-220 (1995) and ISO 3960 (2001))
Introduction
The peroxide number is a meas-urement of the concentration of(-O-O-) groups in edible oils. It is ameasurement of the decomposi-tion of the product and in manycountries, official standards specifya maximum peroxide numberbeyond which the oil is unfit forhuman consumption. The peroxidenumber is therefore measured byoil manufacturers during produc-tion and after storage to check itspreservation.International standards use a redoxtitration in non-aqueous media,results are generally expressed inµg of peroxide (or active oxygen)per gram of product but mmoles/kgor meq of O2/kg are also used.The following two standards usethe same titration principle but notthe same solvents.NF T 60-220 uses chloroform CHCl3ISO 3960 uses isooctane C8H18
According these two standards,the equivalence point of theredox titration is determinedusing starch as colour indica-tor, but it is very easy to usepotentiometric determination.
Summary
Peroxide number determinationinvolves a two-step redox reaction:1) Reaction of peroxide group withan excess of iodide ion according to:
R-O-O-R + 2I- + 2H+ Æ 2ROH + I2
2) Titration of Iodine with Na2S2O3solution (generally 0.01 or 0.02M)according to:
I2 + 2S2O32- Æ 2I- + S4O6
2-
The titration is run according toinflection detection with continu-ous addition of the titrant with acombined platinum/referenceelectrode.
Electrode and reagents
MC3051Pt-9 Metal electrode,combined, platinum (part no.E31M003) with CL114 cable (partno. A94L114).Glacial acetic acid (CH3COOH)Chloroform (CHCl3) (NF T 60-220)Isooctane C8H18 (ISO 3960)
Solvent used for ISO 3960Acetic acid/isooctane solution bymixing of 3 volumes of glacialacetic acid and 2 volumes ofisooctane.
Saturated aqueous solution ofpotassium iodide (KI)Note that the solubility of KI inwater is approximately 150g/100 mlof water.Do not prepare too a large volumeof this solution. Store it in the dark.
Distilled water
Sodium thiosulphate solution0.01M (or 0.02 mol/l) in water(Na2S2O3)To prepare a 0.01 mol/l (or 0.02 mol/l)sodium thiosulphate solution, dis-solve 2.4818 g (or 4.9636 g) ofNa2S2O3, 5H2O in 500 ml offreshly distilled water (or freshlyboiled and cooled deionised wa-ter). Add 2 or 3 drops of CHCl3 (or0.4 g of NaOH), as stabilisingagent, and complete to 1000 mlusing a volumetric flask.

ii Page 2 of 3
Titra
tion
Appl
icatio
ns –
TTI
P02-
01AF
D/20
02-0
6A
Wait for one day and filter the so-lution if necessary (precipitation ofsulphur can occur).Stock the solution in a brownglass flask.From time to time, look at the so-lution and filter or standardiseagain if necessary.Na2S2O3, 5H2O has a molecularweight corresponding to248.181 g/mol.
As solutions with a concentrationcorresponding to 0.01M are notvery stable, do not store this solu-tion for more than 1 week.As Sodium thiosulphate solution0.1M is commercially available,you can prepare the 0.01 or 0.02Msolution by dilution.
Check that solvents and reagentsdo not contain dissolved oxygen.Bubbling nitrogen in the differentsolutions is one way to do this.
Inflection Detectionsettings
CONTINUOUS IP MODE
Titration with blankBurette volume: 5 ml
(see working range)Max. volume: 3.5 mlStirring speed: 500 rpmWorking mode: mV i=0Blank: YESStart timer: 10 sMin. ordinate: 150 mVMax. ordinate: 250 mVStop point: 0 mV
Minimum speed: 0.20 ml/minMaximum speed: 3.00 ml/minSmoothing parameter: 4
Titration: Decreasing potentialInflection number: 1Inflection 1:Min. ordinate: 150 mVMax. ordinate: 280 mVStop at last IP: YES
SampleDilution: NOSample unit: gSample amount: 2
(see working range)
ResultsResult 1:Unit: mg/kgReaction: 1 sample + 2 TitrantMolar weight: 16 g/mol
(see results)
No of equations: 2Equation 1Unit: mmoles O2/kgFormula: R1/16Equation 2Unit: meq O2/kgFormula: R1/8
Procedure
According to NF T 60-220Use a stoppered titration vessel.First run a blank titration accord-ing the following procedure butwithout sample.Then run a titration.Accurately weigh the necessaryamount of edible oil.Add 10 ml of chloroform and stirto dissolve.Add 15 ml of glacial acetic acidand 1 ml of saturated potassiumiodide solution.Stop the titration vessel, stir for1 minute and wait 5 minutes,keeping away from daylight.Then add 75 ml of distilled waterand titrate with 0.01 (or 0.02 mol/l)thiosulphate solution.
Peroxide Number of Edible Oils (NF T 60-220 (1995) and ISO 3960 (2001))
Procedure according to ISO 3960The general procedure is exactlythe same as for NF T 60-220.Weigh the necessary sampleamount.Dilute with 50 ml of the isooctane/acetic acid solution.Add 0.5 ml of potassium iodidesolution and stir for 1minute thenadd 30 ml of distilled water.
Results
Expressed as µg/g (or mg/kg) ofactive oxygen the results corre-sponds to:
R = Ctitr * Vtitr * 16 * 1000 / 2 * Wsmp
Ctitr = Titrant concentration in mol/lVtitr = Necessary titrant volume in ml1000 = Constant to express theresult in µg16 = molar weight of oxygen2 = As 2 moles of titrant corre-spond to 1 mole of sampleWsmp = Weighed amount of sam-ple in g
Some other units can be used forresult expression.
Result in mmoles/kg correspondsto: R/16Result in meq of active oxygen/kgcorresponds to: R/8
Results3 determinations on old peanutoilMean: 192.8 mg/kg
(standard deviation: 2.6)12.05 mmoles O2/kg
(standard deviation: 0.16)24.10 meq O2/kg
(standard deviation: 0.33)(blank determination: 0.107 ml

iii
Page 3 of 3
Titra
tion
Appl
icatio
ns –
TTI
P02-
01AF
D/20
02-0
6A
Working range
Use the following table whichsummarises the data in bothstandards to determine the neces-sary amount of sample:
Peroxide Number of Edible Oils (NF T 60-220 (1995) and ISO 3960 (2001))
Peroxide number Peroxide number Sample amount Titrant volumeµg/g or mg/kg meq/kg (g) (ml)
0-100 0-12 5.0-2.0 2.4
100-150 12-18.75 2.0-1.2 2.25
150-250 18.75-31.25 1.2-0.8 2.25-1.5
250-400 31.25-50 0.8-0.5 1.5-2.5
400-700 50-87.5 0.5-0.3 2.5-2.6
(*) Calculated with oleic acid molar weight(**) For a 0.1M titrant
Notes
ProcedureThe main difficulty is to obtainreproducible results avoiding theinfluence of atmospheric oxygen.Note that the saturated solution ofpotassium iodide is highlyoxidisible. It is necessary to checkthis solution using the thiosul-phate 0.01M solution according tothe procedure described in thestandards.Low values for blanks are recom-mended (between 0.05 and 0.1 mlaccording to the standards).After addition of water, the titrationmedium is a two-phase solution.Check you immerse the measur-ing electrode in the aqueousphase. Do not use too high a titra-tion speed, because it is neces-sary to free all the iodine from thesolvent layer.
mV
ml0.9 1.8
300
260
220
3.62.7
Curve

Appendix B: IDF published ferric thiocyanate method
Determination of peroxide value (PV) in edible oils
Ferric thiocyanate method
Principle
Lipid hydroperoxides (LOOH) oxidize Fe2+ into Fe3+, which reacts with ammonium thiocyanate to form a pink ferric thiocyanate complex. The absorbance of the complex is proportional to the amount of lipid hydroperoxides.
LOOH + Fe2+ → Fe3+ + LO• + OH–
Fe3+ + [SCN]– + 5H2O → [Fe(NCS)(H2O)5]2+
Chemicals
iso-hexane (=2-methylpentane)
96% ethanol
30% ammoniumthiocyanate solution (7.5 g dissolved in 25 mL of dest. water)
3.7% HCl (conc. HCl diluted with dest. water, 1/10)
Fe2+ solution (FeCl2.4H2O; 40 mg dissolved in 10 mL 3.7% HCl)
Fe3+ standard stock solution, 1 mg/mL (Titrisol: one ampule diluted in 1.0 L of 3.5% HCl)
Fe3+ standard work solution 0.1 mg/mL – dilute Fe3+ standard stock solution by 3.7% HCl (1/10)
Procedure
Blank sample analysis (triplicate)
Into a test tube that is long enough and allows strong vortex-mixing add in the following order:
5 mL ethanol
100 µL iso-hexane
100 µL 30% ammoniumthiocyanate solution
100 µL Fe2+ solution

ii
Immediately after iron addition wait for exactly 3 minutes, while mixing the tube on a vortex shortly, and measure absorbance at 500 nm against ethanol.
The typical blank sample absorbance is 0.070.
Sample analysis (triplicate each sample)
Dissolve the sample (fat/oil) in iso-hexane to a concentration min. 20 mg/mL.
Follow the same procedure as blank sample, only 100 µL of iso-hexane is replaced by 100 µL of the sample dissolved in iso-hexane.
If the absorbance is >900, dilute at an appropriate ratio with ethanol.
Standard curve (duplicate each Fe3+ concentration)
Standard curve is based on 0.1 mg/mL Fe3+ standard work solution.
Follow the same procedure as blank sample, only 100 µL Fe2+ solution is replaced by Fe3+ solution according to this table:
µL Fe3+ 0 25 50 75 100
µL 3.7% HCl 100 75 50 25 0
m Fe3+ (µg) 0 2.5 5 7.5 10
Calculation
meq peroxide O2/kg=Asample-‐Ablank ×L×V55.845 ×S×0.1 ×
12
L ... slope of the standard curve constructed as m Fe3+ = f(A), a typical value is ca. 21 [µg]
V ... volume of iso-hexane used for dissolving fat (mL)
S ... amount of fat (g)
55.845 ... molar weight of iron (g/mol)
0.1 ... volume of the sample dissolved in iso-hexane that was added to ethanol (mL)
1/2 ... correction factor

iii
Citation
Peroxide value (PV) was determined using the official ferric thiocyanate method of the International Dairy Federation (IDF) with modifications according to Ueda et al. (1986) and Undeland et al. (1998).
International Dairy Federation. Anhydrous Fat, Determination of Peroxide Value. IDF Standard 74A; IDF: Brussels, Belgium, 1991.
Ueda, S., Hayashi, T., Namiki, M. (1986). Effect of ascorbic acid on lipid autoxidation in a model food system. Agric. Biol. Chem., 50 (1), 1-7.
Undeland, I., Stading, M., Lingnert, H. (1998). Influence of skinning on lipid oxidation in different horizontal layers of herring (Clupea harengus) during frozen storage. J Sci Food Agric, 78 (3), 441-450.
Notes
It is very important that both iso-hexane and ethanol are of high purity, and all the used glassware is clean. Contamination of the solvents and solutions may lead to high blank absorbance. If the blank absorbance is too high (> 0.200), it usually helps to use a different bottle (supplier) of iso-hexane and/or ethanol and/or prepare fresh solutions.
All the solutions must be freshly made; Fe2+ solution should not be older than 1 hour.
It is important to measure the absorbance at exactly the third minute after adding Fe2+ as the color still develops later on, and this may lead to erratic results.
The unit & the correction factor
The calculation gives results in mmol Fe3+/kg fat.
From the stoichiometry in the reaction equations: 1 mmol Fe3+ = 1 mmol LOOH, thus the results can be expressed as mmol preoxide O2/kg fat.
To convert mmol to meq, number of electrons involved in the red-ox reaction must be taken into account. In this case it is 1, thus mmol/kg = meq/kg.

iv
Appendix C: Modified version of the IDF published ferric thiocyanate method
Determination of peroxide value (PV) in edible oils
Ferric thiocyanate method – modified #2
Principle
LOOH + Fe2+ → Fe3+ + LO• + OH–
Fe3+ + [SCN]– + 5H2O → [Fe(NCS)(H2O)5]2+
Chemicals
96% ethanol (deaerated by sonication)
4% BHT ethanolic solution (1 g into 25 mL of deaerated ethanol)
0.2 M HCl (deaerated by N2) = 40 mL of 0.5 M HCl into 100 mL + deaerated by N2
0.5 M HCl = 4,17 mL of conc. HCl into 100 mL, fill up with distilled water (add ca. 50 mL of distilled water first, then add conc. HCl, and fill up with distilled water)
Reagent solution is obtained by mixing equal volumes (10 or 25 mL) of deaerated
4.5 mM FeSO4.7H2O in deaerated 0.2 M HCl
4.5 mM Fe2+ = 5.625 mL of 20 mM Fe2+ stock into 25 mL (filled up with deaerated 0.2 M HCl)
20 mM Fe2+ stock in deaerated 0.2 M HCl = 0.2780 g into 50 mL
3% deaerated ethanolic solution of KSCN (or NH4SCN)
0.75 g into 25 mL
Keep the resulting reagent solution in dark (use dark bottle) and cold (ice bath).
Fe3+ standard stock solution, 1 mg/mL (Titrisol: one ampule diluted in 1.0 L of 3.5% HCl) – usually prepared by a technician and stored in a fridge (stable for several months)

v
Fe3+ standard work solution 0.1 mg/mL – dilute 10x Fe3+ standard stock solution by deaerated 0.2 M HCl (for example 1 mL into 10 mL) (stable for several weeks).
Procedure
Blank analysis (triplicate at least)
Into a test tube that is long enough and allows strong vortex-mixing add in the following order:
5 mL deaerated ethanol
100 µL distilled water or ethanol
(if the sample to be analyzed is dissolved in water, f.ex. liposomes/emulsion, use water; if the sample is dissolved in ethanol, f.ex. oil/phospholipids, use ethanol)
200 µL 4% ethanolic BHT solution
200 µL reagent solution
Keep all test tubes on ice. Immediately after addition of the reagent solution wait for exactly 10 min, while mixing the tube on a vortex shortly, and measure absorbance at 500 nm against ethanol in glass OC cuvettes.
Sample analysis (triplicate each sample at least)
Follow the same procedure as blank sample, only 100 µL of water or ethanol is replaced by 100 µL of liposomes or oil dissolved in ethanol (of known concentration! – it works with ca. 20 mg/mL).
If the absorbance is >900, dilute the sample at an appropriate ratio with ethanol.
Standard curve (triplicate each Fe3+ concentration)
Standard curve is based on 0.1 mg/mL Fe3+ standard work solution.
Follow the same procedure as blank sample, only 100 µL of water or ethanol is replaced by Fe3+ solution according to this table:

vi
µL Fe3+ 0 25 50 75 100
µL 0.2 M deaerated HCl
100 75 50 25 0
m Fe3+ (µg) 0 2.5 5 7.5 10
Calculation:
Standard curve:
Calculate the average absorbance for 0 µg Fe3+, and subtract this value from the absorbance values for 2.5 – 10.0 µg Fe3+, in order to get net absorbance for Fe3+. Plot mass of Fe3+ vs net absorbance, and made linear regression with beginning in origin.
Formula for liposomes and fat sample is the same
PV mmolkg =
(Abs− Abs!")×VSlope×55,845×100×G×1000
Liposomes
Vabs … absorbance of the sample
Vabs bl … absorbance of the blank (average value)
V ... total volume of liposomes (mL)
Slope … slope of the standard curve (ug) constructed as Abs = linear function of mass Fe3+ (ug)
G ... amount of phospholipids used for making liposomes (g)
55.845 ... molar weight of iron (g/mol)
100 ... volume aliquot of liposomes used for analysis (uL)
1000 … conversion between units

vii
Fat sample
Vabs … absorbance of the sample
Vabs bl … absorbance of the blank (average value)
V … volume, in which the fat was dissolved (mL)
Slope … slope of the standard curve (ug) constructed as Abs = linear function of mass Fe3+ (ug)
G ... amount of fat (g)
55.845 ... molar weight of iron (g/mol)
100 ... volume aliquot of liposomes used for analysis (uL)
The molar ratio between LOOH and Fe3+ is often disputable in the literature, and presumably is not 1:1. It is therefore safest to express the result as mmol Fe3+/kg fat.
Example:
STANDARD CURVE
The average absorbance for 0 µg Fe3+ was 0,042 ± 0,001 (n = 3).

viii
Appendix D: AOCS official AV method

ix

x
Appendix E: TBARS method of Ke et al.
Determination of thiobarbituric aid reactive substances (TBARS) in edible oils
Chemicals
glacial acetic acid
chloroform
0.04 M TBA stock solution: dissolve 2,88 g of 2-thiobarbituric acid (TBA) in 50 mL dest. water in a 500 mL volumetric flask and dilute to volume with glacial acetic acid. Put the solution on a magnetic stirrer overnight.
0.3 M Na2SO3 solution: dissolve 18,91 g of sodium sulphite in 500 mL dest. water
0.28 M TCA solution: dissolve 22,87 g of trichloracetic acid (TCA) in 500 mL dest. water
0.01 M TEP stock solution: dissolve 0.22 g TEP (1,1,3,3,-tetraethoxypropane) in 100 mL dest. water on a magnetic stirrer. Dilute the TEP stock solution to 0.0001 M TEP work solution (1/100) (0.1 mM TEP).
TBA work solution: prepare max. 30 min before analysis by mixing
180 mL TBA stock solution
120 mL chloroform
15 mL sodium sulphite solution
(alternative ratios: 12-8-1; 36-24-3; 60-40-5)
Procedure
Sample analysis (triplicate)
Weigh accurately ± 10 mg of oil into a short Kimax test tube.
Add 5 mL TBA work solution and close the tube tightly with a fitting cup.
Mix for 15 s on a vortex to dissolve the oil.

xi
Incubate the tubes in a water bath with almost boiling water (95°C) for 45 min; cool them down under running cold water.
Add 2.5 mL TCA solution and mix by inverting the tube a few times.
Centrifuge for 10 min at 2500 rpm to separate the pink water phase from the chloroform phase (bottom).
Measure the absorbance of the water phase at 538 nm in 10 mm QS glass cuvettes against blank that was prepared as above, only without the oil.
If the absorbance of the sample is too high (> 900), dilute the water phase with 55% acetic acid.
Standard curve (duplicate each TEP concentration)
Standard curve is based on 0.1 mM TEP work solution.
Follow the same procedure as sample analysis, only the oil is replaced by TEP work solution according to this table:
µL TEP 0 25 50 100 150 200
µL H2O 200 175 150 100 50 0
n TEP (nmol) 0 2.5 5 10 15 20
Construct the standard curve as A = f(n TEP) ⇒ y = ax + b.
A typical value for the slope (a) is 0,024.
Calculation
µM TBARS/g fat = (A – b)/(a × m × 1000)
A ... absorbance of the sample (oil)
a ... slope of the standard curve
b ... intercept of the standard curve

xii
m ... amount of the sample (g)
1000 ... conversion to µM/g
Citation
Thiobarbituric acid reactive substances (TBARS) were determined according to the spectrophotometric method described by Ke et al. (1979). The amounts of the solutions were reduced to half compared to the original method.
Ke, P. J., Woyewoda, A. D. (1979). Microdetermination of thiobarbituric acid values in marine lipids by a direct spectrophotometric method with a monophasic reaction system. Analytica Chimica Acta, 106 (2), 279-284.
Notes
Make sure that the grooves on the Kimax tubes are whole and undamaged. The cups should be equipped with a clean rubber seal and must tightly close the tube. This will prevent evaporation of the solvents during boiling in the water bath. If it happens that the phases evaporate, discard the sample.

xiii
Appendix F : Experimental data from determination of uncertainty of the iodometric titration method
This appendix contains experimental data used for determination of uncertainty of the iodometric titration method. In the study, cod liver and fish oils from factory B were chosen based on prior knowledge of approximate oxidation level, as described in section 2.1. All oils were measured according to the procedure described in appendix A. PV values were calculated according to formula 2.4.1.1, given in section 2.4.1. Data from determination of standard deviation of iodometric titration measurements on fish oil in the PV range 1.14-16.76 is given in table F1-F8.
Table F1: Data from determination of standard deviation by iodometric titration at PV 1.14. 5 grams of fish oil was used in each parallel. The parallels are numbered 1-6.
Blank: 0.213 Mean value St. dev.
Sample: 1 2 3 4 5 6
Titrant: 0.794 0.829 0.827 0.726 0.726 0.811
Calculated PV: 1.161 1.231 1.226 1.025 1.025 1.194 1.144 0.095
Table F2: Data from determination of standard deviation by iodometric titration at PV 1.18. 5 grams of fish oil was used in each parallel. The parallels are numbered 1-6.
Blank: 0.066 Mean value St. dev.
Sample: 1 2 3 4 5 6
Titrant: 0.615 0.641 0.646 0.694 0.671 0.659
Calculated PV: 1.097 1.149 1.160 1.255 1.209 1.185 1.176 0.054
Table F3: Data from determination of standard deviation by iodometric titration at PV 1.5. 5 grams of cod liver oil was used in each parallel. The parallels are numbered 1-6.
Blank: 0.213 Mean value St.dev.
Sample: 1 2 3 4 5 6
Titrant: 0.929 0.942 1.162 0.981 0.826 0.864
Calculated PV: 1.430 1.456 1.896 1.534 1.224 1.300 1.474 0.235

xiv
Table F4: Data from determination of standard deviation by iodometric titration at PV 1.5. 5 grams of cod liver oil was used in each parallel. The parallels are numbered 1-6.
Blank: 0.213 Mean value St. dev.
Sample: 1 2 3 4 5 6
Titrant: 0.965 0.980 0.962 0.975 0.978 0.969
Calculated PV: 1.502 1.532 1.496 1.522 1.528 1.510 1.515 0.015
Table F5: Data from determination of standard deviation by iodometric titration at PV 2.2. 5 grams of cod liver oil was used in each parallel. The parallels are numbered 1-6.
Blank: 0.203 Mean value St.dev.
Sample: 1 2 3 4 5 6
Titrant: 1.327 1.283 1.260 1.279 1.293 1.288
Calculated PV: 2.238 2.150 2.104 2.142 2.170 2.160 2.161 0.044
Table F6: Data from determination of standard deviation by iodometric titration at PV 7.0. 5 grams of cod liver oil was used in each parallel. The parallels are numbered 1-4.
Blank: 0.223 Mean value St.dev.
Sample: 1 2 3 4 5 6
Titrant: 3.751 3.616 3.709 3.805 - -
Calculated PV: 7.025 6.754 6.941 7.132 - - 6.963 0.160

xv
Table F7: Data from determination of standard deviation by iodometric titration at PV 11.7. 5 grams of cod liver oil was used in each parallel. The parallels are numbered 1-4.
Blank: 0.223 Mean value St.dev.
Sample: 1 2 3 4 5 6
Titrant: 6.030 6.104 6.173 6.109 - -
Calculated PV: 11.562 11.709 11.845 11.716 - - 11.708 0.115
Table F8: Data from determination of standard deviation by iodometric titration at PV 16.7. 5 grams of cod liver oil was used in each parallel. The parallels are numbered 1-6.
Blank: 0.066 Mean value St.dev.
Sample: 1 2 3 4 5 6
Titrant: 8.272 8.395 8.401 8.475 8.506 8.613
Calculated PV: 16.412 16.660 16.667 16.819 16.877 17.094 16.755 0.232

xvi
Appendix G : Experimental data from determination of uncertainty of the ferric thiocyanate method
This appendix contains experimental data used for determination of uncertainty of the ferric thiocyanate method. In the study, oils were intentionally left to oxidize to obtain high oxidation parameters, as described in section 2.1. PV values were calculated according to formula 2.4.2.1, given in section 2.4.2. The formula includes the value of the slope from the standard curve constructed based on known concentrations of Fe3+. Due to space considerations in the appendix, only one table with data to construct the calibration curve and one calibration curve is shown. The calibration curve used to determine PV calculations at the lowest PV measurement (PV 0.73) is illustrated in figure G1. This calibration curve was constructed based on measurement data given in table G1. For PV measurements 1.94-32.2 the value of the slope from the calibration curve is given in the text above each data table G2-G7. The Chauvenet's criterion, described in section 2.6 was used to reject data. Rejected data are labeled in red color.
Table G1: Measurement data based on known concentrations of Fe3+. The data was used to construct the calibration curve, where the value of the slope was used in calculation of PV 0.73. Two parallels for each Fe3+ concentration were measured, numbered Abs.1-2.
Conc. Fe3+ (µg) Abs.1 Abs.2 Average
0 -0.012 -0.015 -0.014
2.5 0.085 0.095 0.090
5.0 0.197 0.187 0.192
7.5 0.309 0.292 0.301
10.0 0.421 0.404 0.413

xvii
Figure G1: Calibration curve constructed from known concentrations of Fe3+. The value of the slope of the calibration curve is used in the formula to calculate PV measured by the ferric thiocyanate method.
Table G2: Determination of standard deviation of the ferric thiocyanate method at PV 0.726. Cod liver oil was dissolved in iso-hexane to a concentration of minimum 20mg/mL. The slope of the standard curve (shown in figure B1) used for PV calculations was 23.5203. The parallels are numbered 1-10. Negative PV measurements were discarded when calculating mean value and standard deviation.
y = 23.52x + 0.383 R² = 0.99961
0.0 1.0 2.0 3.0 4.0 5.0 6.0 7.0 8.0 9.0
10.0
0.00 0.05 0.10 0.15 0.20 0.25 0.30 0.35 0.40 0.45 0.50
Fe3+
(ug)
Absorbance (500 nm)
Sample: 1 2 3 4 5 6 7 8 9 10
Blank: 0.287 0.287 0.183 0.183 0.183 0.183 0.183 0.183 0.183 0.183
Absorbance: 0.302 0.285 0.194 0.191 0.185 0.182 0.193 0.199 0.167 0.179
Calculated PV (mEq/kg):
1.589 -0.119 0.889 0.722 0.145 -0.076 0.892 0.979 -1.105 -0.292
Mean value: 0.726
Standard deviation: 0.302

xviii
Table G3: Determination of standard deviation of the ferric thiocyanate method at PV 1.943. Oil was dissolved in iso-hexane to a concentration of minimum 20mg/mL. The slope of the standard curve used to calculate PV was 23.5203. The parallels are numbered 1-10.
Table G4: Determination of RSD of ferric thiocyanate method at PV 3.636. Oil was dissolved in iso-hexane to a concentration of minimum 20 mg/mL. The slope of the standard curve used for PV calculations was 23.8415. The parallels are numbered 1-10.
Sample: 1 2 3 4 5 6 7 8 9 10
Blank: 0.119 0.119 0.119 0.119 0.119 0.119 0.119 0.119 0.119 0.119
Absorbance: 0.138 0.154 0.152 0.156 0.146 0.156 0.131 0.14 0.152 0.144
Calculated PV (mEq/kg):
1.263 2.168 2.594 2.174 1.559 2.259 1.139 1.345 2.833 2.098
Mean value: 1.943
Standard deviation: 0.553
Sample: 1 2 3 4 5 6 7 8 9 10
Blank: 0.080 0.080 0.080 0.080 0.080 0.080 0.080 0.080 0.080 0.080
Absorbance: 0.135 0.131 0.138 0.125 0.129 0.118 0.131 0.137 0.113 0.206
Calculated PV (mEq/kg):
3.547 3.156 3.763 3.953 4.470 3.782 3.558 3.568 2.927 8.379
Mean value: 3.636
Standard deviation: 0.420

xix
Table G5: Determination of RSD of ferric thiocyanate method at PV 8.114. Oil was dissolved in iso-hexane to a concentration of minimum 20mg/mL. The slope of the standard curve used for PV calculations were 23.8415. The parallels are numbered 1-10.
Table G6: Determination of RSD of ferric thiocyanate method at PV 16.44. Oil was dissolved in iso-hexane to a concentration of minimum 20mg/mL. The slope of the standard curve used for PV calculations were 22.6178. The parallels are numbered 1-10.
Sample: 1 2 3 4 5 6 7 8 9 10
Blank: 0.085 0.085 0.085 0.085 0.085 0.085 0.085 0.085 0.085 0.085
Absorbance: 0.200 0.197 0.238 0.179 0.186 0.198 0.165 0.165 0.175 0.198
Calculated PV (mEq/kg):
9.959 7.813 9.720 8.291 7.259 7.987 7.145 7.145 8.445 7.377
Mean value: 8.114
Standard deviation: 0.969
Sample: 1 2 3 4 5 6 7 8 9 10
Blank: 0.089 0.089 0.089 0.089 0.089 0.089 0.089 0.089 0.089 0.089
Absorbance: 0.345 0.288 0.359 0.323 0.283 0.352 0.331 0.341 0.301 0.301
Calculated PV (mEq/kg):
14.94 12.88 17.03 19.11 15.67 17.69 15.56 16.25 17.36 17.95
Mean value: 16.44
Standard deviation: 1.689

xx
Table G7: Determination of RSD of ferric thiocyanate method at PV 32.208. Oil was dissolved in iso-hexane to a concentration of minimum 20mg/mL. The slope of the standard curve used for PV calculations were 24.2778. The parallels are numbered 1-10.
Sample: 1 2 3 4 5 6 7 8 9 10
Blank: 0.094 0.094 0.094 0.094 0.094 0.094 0.094 0.094 0.094 0.094
Absorbance: 0.463 0.448 0.405 0.411 0.473 0.390 0.487 0.376 - 0.550
Calculated PV (mEq/kg):
35.25 30.15 33.85 33.99 28.98 29.82 36.69 26.54 - 34.60
Mean value: 32.208
Standard deviation: 3.220

xxi
Appendix H : Experimental data from determination of uncertainty of the AV method
This appendix contains experimental data used for determination of uncertainty of the AV method. In the study, oils were intentionally left to oxidize to obtain high oxidation parameters described in section 2.1. Data from determination of standard deviation of the method at AV ranging from 0.51-28.89 are given in table H1- H10. In all tables S1 and B1 represent absorbance of sample and blank before addition of p-anisidine reagent, and S2 and B2 represent absorbance after addition of p-anisidine reagent at t=10 minutes. The Chauvenet's criterion was used to reject data. Rejected data are labeled in red color.
Table H1: Determination of standard deviation of the AV method at AV 0.506. The parallels are numbered 1-10.
Sample # S1 B1 S2 B2 AV
1 0.049 0.000 0.062 0.000 0.507
2 0.151 0.000 0.165 0.000 0.543
3 0.128 0.000 0.143 0.000 0.561
4 0.024 0.000 0.033 0.005 0.156
5 0.026 0.000 0.037 0.005 0.248
6 0.088 0.000 0.127 0.005 1.413
7 0.066 0.004 0.078 0.008 0.342
8 0.033 0.004 0.046 0.008 0.370
9 0.077 0.004 0.090 0.008 0.392
10 0.206 0.000 0.198 -0.021 0.523
Mean value: 0.506
Standard deviation: 0.328

xxii
Table H2: Determination of standard deviation of the AV method at AV 0.89. The parallels are numbered 1-10.
Sample # S1 S2 B1 B2 AV
1 0.233 0.266 -0.003 0.001 1.193
2 0.335 0.383 -0.003 0.001 0.986
3 0.209 0.245 -0.003 0.001 1.099
4 0.335 0.377 0.000 0.007 0.776
5 0.189 0.211 0.000 0.007 0.611
6 0.187 0.211 0.000 0.007 0.625
7 0.277 0.312 -0.003 0.001 0.826
8 0.198 0.227 -0.003 0.001 0.918
9 0.166 0.189 -0.003 0.001 0.744
10 0.230 0.259 -0.003 0.000 1.129
Mean value: 0.891
Standard deviation: 0.197
Table H3: Determination of standard deviation of the AV method at AV 1.37. The parallels are numbered 1-10.
Sample # S1 S2 B1 B2 AV
1 0.253 -0.002 0.297 0.004 1.327
2 0.245 -0.002 0.287 0.004 1.305
3 0.254 -0.002 0.296 0.004 1.260
4 0.212 -0.005 0.253 0.000 1.495
5 0.244 -0.005 0.287 0.000 1.382
6 0.277 -0.005 0.330 0.000 1.579

xxiii
7 0.220 -0.003 0.262 0.002 1.348
8 0.225 -0.003 0.265 0.002 1.361
9 0.231 -0.003 0.270 0.002 1.296
10 0.251 -0.003 0.296 0.002 1.402
Mean value: 1.376
Standard deviation: 0.092
Table H4: Determination of standard deviation of the AV method at AV 1.74. The parallels are numbered 1-10.
Sample # S1 S2 B1 B2 AV
1 0.216 -0.001 0.266 0.003 1.841
2 0.231 -0.001 0.281 0.003 1.752
3 0.267 -0.001 0.326 0.003 1.773
4 0.197 0.000 0.241 0.007 1.627
5 0.245 0.000 0.299 0.007 1.673
6 0.243 0.000 0.298 0.007 1.732
7 0.255 0.000 0.316 0.007 1.847
8 0.234 0.000 0.288 0.007 1.720
9 0.229 0.000 0.282 0.007 1.812
10 0.253 -0.006 0.311 0.005 1.628
Mean value: 1.740
Standard deviation: 0.076

xxiv
Table H5: Determination of standard deviation of the AV method at AV 2.18. The parallels are numbered 1-10.
Sample # S1 S2 B1 B2 AV
1 0.205 0.289 -0.004 0.016 2.529
2 0.201 0.269 -0.004 0.016 1.961
3 0.211 0.289 -0.004 0.016 2.281
4 0.249 0.334 0.006 0.032 2.059
5 0.382 0.494 0.006 0.032 1.933
6 0.243 0.306 -0.002 0.005 2.005
7 0.190 0.256 -0.002 0.005 2.400
8 0.210 0.281 -0.002 0.005 2.233
9 0.249 0.322 0.006 0.032 1.608
10 0.169 0.243 -0.030 -0.034 3.276
Mean value: 2.175
Standard deviation: 0.205
Table H6: Determination of standard deviation of the AV method at AV 3.28. The parallels are numbered 1-10.
Sample # S1 S2 B1 B2 AV
1 0.192 0.271 -0.007 0.000 3.106
2 0.203 0.285 -0.007 0.000 3.138
3 0.210 0.292 -0.007 0.000 3.009
4 0.219 0.317 -0.012 -0.008 3.345
5 0.222 0.310 -0.012 -0.008 3.278
6 0.192 0.283 -0.012 -0.008 3.446

xxv
7 0.225 0.331 -0.012 -0.005 3.398
8 0.199 0.289 -0.012 -0.005 3.321
9 0.237 0.347 -0.002 0.007 4.251
10 0.214 0.336 -0.012 -0.005 3.442
Mean value: 3.276
Standard deviation: 0.148
Table H7: Determination of standard deviation of the AV method at AV 5.60. The parallels are numbered 1-10.
Sample # S1 S2 B1 B2 AV
1 0.235 0.000 0.360 0.003 5.357
2 0.269 0.000 0.419 0.003 5.596
3 0.180 0.000 0.280 0.003 5.580
4 0.192 0.000 0.317 0.009 5.604
5 0.232 0.000 0.374 0.009 5.598
6 0.271 0.000 0.427 0.009 5.444
7 0.198 0.004 0.321 0.008 5.629
8 0.226 0.004 0.366 0.008 5.767
9 0.231 0.004 0.372 0.008 5.728
10 0.233 0.000 0.383 0.008 5.682
Mean value: 5.599
Standard deviation: 0.116

xxvi
Table H8: Determination of standard deviation of the AV method at AV 9.95. The parallels are numbered 1-10.
Sample # S1 S2 B1 B2 AV
1 0.232 -0.007 0.487 -0.002 10.653
2 0.226 -0.007 0.476 -0.002 10.769
3 0.219 -0.007 0.436 -0.002 9.204
4 0.233 0.017 0.463 0.023 9.488
5 0.228 0.017 0.482 0.023 10.078
6 0.228 0.017 0.449 0.023 9.773
7 0.212 0.000 0.437 0.009 9.766
8 0.250 0.000 0.526 0.009 10.168
9 0.231 0.000 0.482 0.009 9.821
10 0.255 -0.010 0.517 0.000 9.767
Mean value: 9.949
Standard deviation: 0.460
Table H9: Determination of standard deviation of the AV method at AV 18.4. The parallels are numbered 1-10.
Sample # S1 S2 B1 B2 AV
1 0.271 0.000 0.788 0.010 18.498
2 0.248 0.000 0.735 0.010 18.506
3 0.247 0.000 0.748 0.010 18.854
4 0.239 0.007 0.683 0.008 18.268
5 0.254 0.007 0.730 0.008 18.441

xxvii
6 0.251 0.007 0.726 0.008 18.625
7 0.244 0.000 0.706 0.012 17.828
8 0.243 0.000 0.722 0.012 18.236
9 0.267 0.000 0.781 0.012 17.971
10 0.245 0.000 0.732 0.000 18.925
Mean value: 18.415
Standard deviation: 0.333
Table H10: Determination of standard deviation of AV method at AV 28.9. The parallels are numbered 1-10.
Sample # S1 S2 B1 B2 AV
1 0.238 0.000 0.991 0.101 27.973
2 0.239 -0.015 0.979 0.010 28.104
3 0.226 -0.015 0.964 0.010 30.405
4 0.227 -0.015 0.992 0.010 29.829
5 0.278 -0.016 1.104 0.021 28.630
6 0.285 -0.016 1.120 0.021 28.198
7 0.263 -0.016 1.038 0.021 28.132
8 0.247 -0.020 1.029 -0.011 29.884
9 0.244 -0.020 0.957 -0.011 29.395
10 0.264 -0.020 1.039 -0.011 28.370
Mean value: 28.892
Standard deviation: 0.853

xxviii
Appendix I : Experimental data from determination of uncertainty of TBARS method
This appendix contains experimental data used for determination of uncertainty of the TBARS method. In the study, oils were intentionally left to oxidize to obtain high oxidation parameters, as described in section 2.1. TBARS values were calculated according to formula 2.4.5.1, given in section 2.4.5. The formula includes the value of the slope from the standard curve constructed based on known concentrations of malonaldehyd (MDA). Due to space considerations in the appendix, only one table with data to construct the calibration curve and one calibration curve is shown. The calibration curve used to determine TBARS calculations at the lowest TBARS measurement (0.114µM TBARS/g) is illustrated in figure I1. This calibration curve was constructed based on measurement data given in table I1. For TBARS measurements ranging from 0.48-3.47µM TBARS/g, the value of the slope from the calibration curve is given in the text above each data table I3-I8. The Chauvenet's criterion, described in section 2.6 was used to reject data. Rejected data are labeled in red color.
Table I1: Data from construction of calibration curve based on known concentrations of MDA. The slope from the calibration curve is part of the TBARS calculations. Three parallels for MDA
concentration ranging from 0-20 nmol/mL were measured, numbered A1-A3.
MDA conc. (nmol/mL) A1 A2 A3 Average
0 0.003 - - 0.003
2.5 0.105 0.079 0.083 0.089
5.0 0.145 0.146 - 0.146
10.0 0.284 0.276 - 0.280
15.0 0.408 0.424 0.427 0.420
20.0 0.543 0.568 0.553 0.555

xxix
Figure I1: Calibration curve based on known MDA conc. ranging from 0-20 nmol/mL. The value of the slope is used in the calculations of TBARS values.
The following tables I2-I9 contains experimental data from determination of standard deviation of the TBARS method when applied to cod liver oil with TBARS value ranging from 0.11-3.47 µM TBARS/g oil.
Table I2: Experimental data from determination of standard deviation of the TBARS method at 0.114µM TBARS/g oil. The parallels are numbered 1-10
Sample: 1 2 3 4 5 6 7 8 9 10
Dilution: 1 1 1 1 1 1 1 1 1 1
Absorbance: 0.07 0.089 0.062 0.054 0.051 0.037 0.02 0.064 0.068 0.098
µM TBARS/g 0.143 0.168 0.121 0.090 0.100 0.060 0.012 0.125 0.136 0.185
Mean value: 0.114
St. Dev. 0.051
y = 0.0272x + 0.0104 R² = 0.99921
0
0.1
0.2
0.3
0.4
0.5
0.6
0 5 10 15 20 25
Abs
orba
nce
(538
nm
)
MDA conc. (nmol/mL)
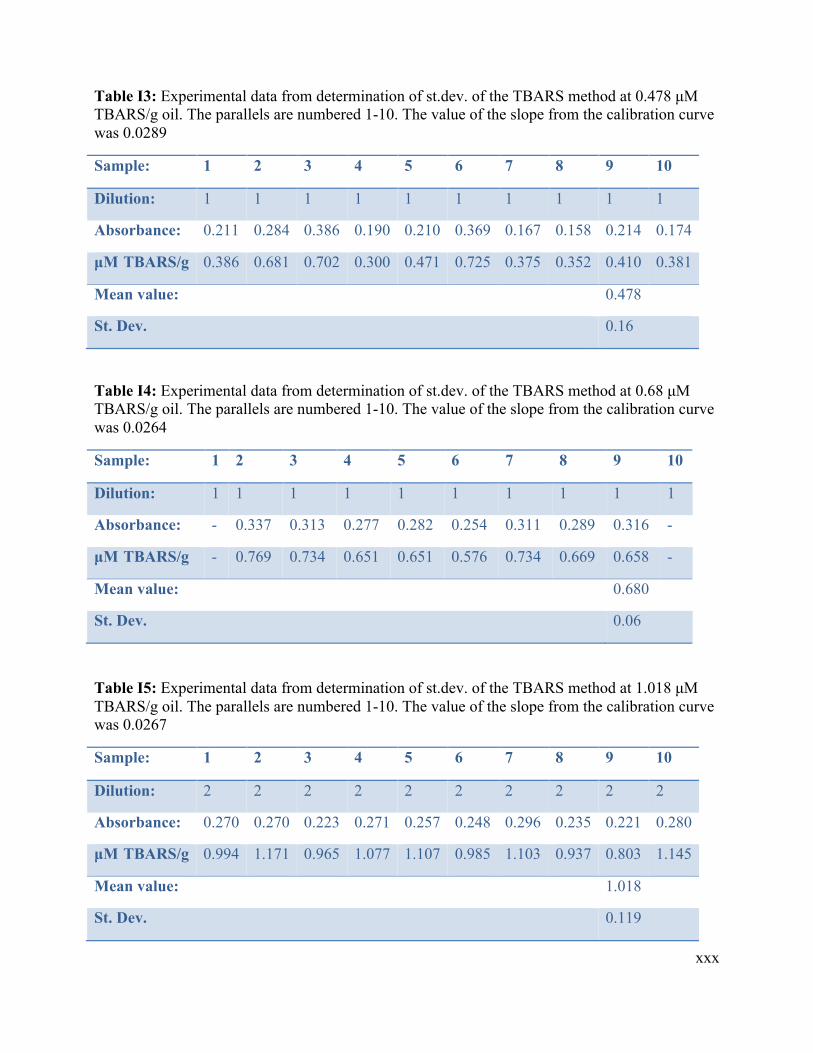
xxx
Table I3: Experimental data from determination of st.dev. of the TBARS method at 0.478 µM TBARS/g oil. The parallels are numbered 1-10. The value of the slope from the calibration curve was 0.0289
Sample: 1 2 3 4 5 6 7 8 9 10
Dilution: 1 1 1 1 1 1 1 1 1 1
Absorbance: 0.211 0.284 0.386 0.190 0.210 0.369 0.167 0.158 0.214 0.174
µM TBARS/g 0.386 0.681 0.702 0.300 0.471 0.725 0.375 0.352 0.410 0.381
Mean value: 0.478
St. Dev. 0.16
Table I4: Experimental data from determination of st.dev. of the TBARS method at 0.68 µM TBARS/g oil. The parallels are numbered 1-10. The value of the slope from the calibration curve was 0.0264
Sample: 1 2 3 4 5 6 7 8 9 10
Dilution: 1 1 1 1 1 1 1 1 1 1
Absorbance: - 0.337 0.313 0.277 0.282 0.254 0.311 0.289 0.316 -
µM TBARS/g - 0.769 0.734 0.651 0.651 0.576 0.734 0.669 0.658 -
Mean value: 0.680
St. Dev. 0.06
Table I5: Experimental data from determination of st.dev. of the TBARS method at 1.018 µM TBARS/g oil. The parallels are numbered 1-10. The value of the slope from the calibration curve was 0.0267
Sample: 1 2 3 4 5 6 7 8 9 10
Dilution: 2 2 2 2 2 2 2 2 2 2
Absorbance: 0.270 0.270 0.223 0.271 0.257 0.248 0.296 0.235 0.221 0.280
µM TBARS/g 0.994 1.171 0.965 1.077 1.107 0.985 1.103 0.937 0.803 1.145
Mean value: 1.018
St. Dev. 0.119

xxxi
Table I6: Experimental data from determination of st.dev. of the TBARS method at 1.442 µM TBARS/g oil. The parallels are numbered 1-10. The value of the slope from the calibration curve was 0.0267
Sample: 1 2 3 4 5 6 7 8 9 10
Dilution: 1 1 1 1 1 1 1 1 2 2
Absorbance: 0.488 0.480 0.451 0.526 0.433 0.541 0.573 0.523 0.236 0.399
µM TBARS/g 1.643 1.461 1.555 1.383 1.245 1.364 1.622 1.521 1.184 2.227
Mean value: 1.442
St. Dev. 0.161
Table I7: Experimental data from determination of st.dev. of the TBARS method at 2.315 µM TBARS/g oil. The parallels are numbered 1-10. The value of the slope from the calibration curve was 0.0267
Sample: 1 2 3 4 5 6 7 8 9 10
Dilution: 2 2 2 2 2 2 2 2 2 2
Absorbance: 0.363 0.536 0.403 0.370 0.369 0.333 0.481 0.398 0.606 0.834
µM TBARS/g 2.011 2.801 2.345 1.887 2.414 2.139 2.740 2.186 4.291 4.410
Mean value: 2.315
St. Dev. 0.328
Table I8: Experimental data from determination of st.dev. of the TBARS method at 3.466 µM TBARS/g oil. The parallels are numbered 1-10. The value of the slope from the calibration curve was 0.0267
Sample: 1 2 3 4 5 6 7 8 9 10
Dilution: 2 2 2 2 2 2 2 2 2 2
Absorbance: 0.789 0.504 0.802 0.706 0.751 0.661 0.485 0.570 0.665 0.682
µM TBARS/g 3.135 3.104 4.115 3.631 3.872 3.390 2.810 3.597 4.303 2.709
Mean value: 3.466
St. Dev. 0.535

xxxii
Appendix J : Experimental data, reevaluation of the IDF ferric thiocyanate method
This appendix contains experimental data from the reevaluation of the published IDF ferric thiocyanate method. The method was compared to a modified version of the method were several factors was changed, as described in section 2.4.2. The two methods were compared at two stages of the oxidation process, one low and one relatively high. Table J1 and J2 shows experimental data from measurement of absorbance as a function of increasing time.
Figure J1: Experimental data from investigation of the IDF method. Absorbance was measured as a function of time. Four parallels were measured at each time detection point. The method was investigated at a low stage of the oxidation process and at a relatively high stage of the oxidation process.
IDF ferric thiocyanate method
Low stage of oxidation
Time (min):
1 2 3 5 7 9 11 13 15
Blank: 0.033 0.038 0.041 0.051 0.057 0.061 0.066 0.071 0.075
Abs. 1 0.102 0.125 0.141 0.155 0.160 0.170 0.172 0.177 0.183
Abs. 2 0.051 0.058 0.061 0.076 0.080 0.086 0.095 0.098 0.104
Abs. 3 0.051 0.054 0.055 0.063 0.069 0.072 0.074 0.082 0.086
Abs. 4 0.046 0.049 0.055 0.063 0.069 0.071 0.079 0.085 0.089
Mean abs.: 0.063 0.072 0.078 0.089 0.095 0.100 0.105 0.111 0.116
High stage of oxidation
Time (min):
1 2 3 5 7 9 11 13 15
Blank: 0.033 0.038 0.041 0.051 0.057 0.061 0.066 0.071 0.075
Abs. 1 0.25 0.263 0.284 0.311 0.324 0.338 0.35 0.361 0.373
Abs. 2 0.22 0.223 0.229 0.238 0.245 0.25 0.254 0.261 0.262
Abs. 3 0.234 0.238 0.244 0.247 0.252 0.258 0.261 0.265 0.268
Abs. 4 0.216 0.22 0.222 0.224 0.229 0.235 0.239 0.242 0.25
Mean abs.: 0.230 0.236 0.245 0.255 0.263 0.270 0.276 0.282 0.288

xxxiii
Figure J2: Experimental data from investigation of the modified version. Absorbance was measured as a function of time. Four parallels were measured at each time detection point. The method was investigated at a low stage of the oxidation process and at a relatively high stage of the oxidation process.
Modified version
Low stage of oxidation
Time (min):
1 2 3 5 7 9 11 13 15
Blank: 0.019 0.017 0.016 0.020 0.020 0.023 0.026 0.026 0.026
Abs. 1 0.032 0.033 0.038 0.037 0.037 0.038 0.038 0.039 0.044
Abs. 2 0.032 0.033 0.037 0.034 0.036 0.036 0.037 0.038 0.040
Abs. 3 0.020 0.033 0.029 0.033 0.032 0.033 0.039 0.036 0.039
Abs. 4 0.031 0.030 0.033 0.033 0.032 0.032 0.035 0.036 0.038
Mean abs.: 0.029 0.032 0.034 0.034 0.034 0.035 0.037 0.037 0.040
High stage of oxidation
Time (min):
1 2 3 5 7 9 11 13 15
Blank: 0.019 0.017 0.016 0.020 0.020 0.023 0.026 0.026 0.026
Abs. 1 0.330 0.317 0.335 0.339 0.347 0.341 0.358 0.350 0.352
Abs. 2 0.339 0.354 0.333 0.335 0.343 0.351 0.358 0.350 0.349
Abs. 3 0.175 0.208 0.206 0.207 0.210 0.214 0.214 0.218 0.217
Abs. 4 0.302 0.288 0.302 0.303 0.315 0.310 0.307 0.318 0.317
Mean abs.: 0.287 0.292 0.294 0.296 0.304 0.304 0.309 0.309 0.309

xxxiv
Appendix K : Experimental data from investigation of influence of stirring procedure, reagent reaction time and oxygen removal on the iodometric titration method.
This appendix contains experimental data from investigation of influence of stirring procedure, reagent reaction time and oxygen removal on PV determination (mEq peroxide kg-1 oil) by the iodometric titration method. The experimental data is given in table K1 – K4.
Table K1: Experimental data from comparison of PV measurements obtained by gentle and magnetic stirring in the iodometric titration method. Four to six parallels were measured for each stirring method in one fish oil and four cod liver oils. Parallels are numbered 1-6.
Fish oil Sample: 1 2 3 4 5 6 Average St.dev.
PV, gentle stirring 1.120 1.095 1.063 1.326 1.157 0.997 1.126 0.112
PV, magnetic stirring 1.161 1.231 1.226 1.025 1.025 1.194 1.144 0.095
Cod liver oil Sample: 1 2 3 4 5 6 Average St.dev.
PV, gentle stirring 1.404 1.382 1.296 0.973 1.664 1.334 1.342 0.223
PV, magnetic stirring 1.430 1.456 1.896 1.534 1.224 1.300 1.474 0.235
Cod liver oil Sample: 1 2 3 4 5 6 Average St.dev.
PV, gentle stirring 1.322 1.039 1.445 1.573 1.051 1.646 1.346 0.258
PV, magnetic stirring 2.238 2.150 2.104 2.142 2.170 2.160 2.161 0.044
Cod liver oil Sample: 1 2 3 4 5 6 Average St.dev.
PV, gentle stirring 5.433 4.826 6.226 4.985 - - 5.368 0.628
PV, magnetic stirring 7.025 6.754 6.941 7.132 - - 6.963 0.160
Cod liver oil Sample: 1 2 3 4 5 6 Average St.dev.
PV, gentle stirring 10.076 8.510 11.100 8.335 - - 9.505 1.320
PV, magnetic stirring 11.562 11.709 11.845 11.716 - - 11.708 0.115

xxxv
Table K2: Experimental data from investigation of influence of reagent reaction time on the iodometric titration method. PV was measured as a function of time, at t= 0.5, 1, 2 and 4 minutes. Four to six parallels were measured in one fish oil, three cod liver oils and one canola oil. Parallels are numbered 1-6.
Fish
oil
Sample Time (min.): 0.5 1 2 4
1 0.843 1.502 2.265 3.102
2 0.915 1.532 2.207 3.460
3 0.921 1.496 2.351 3.388
4 0.997 1.522 2.385 3.840
5 0.987 1.528 2.293 3.546
6 0.953 1.510 2.351 3.531
Average PV: 0.936 1.515 2.309 3.478
Cod
live
r oi
l
1 1.109 1.430 1.652 3.460
2 1.167 1.456 2.265 2.617
3 1.019 1.896 2.021 3.352
4 1.003 1.534 2.049 2.840
5 1.298 1.224 2.004 3.206
6 1.220 1.300 2.169 3.078
Average PV: 1.136 1.474 2.027 3.092
Cod
live
r oi
l
1 1.603 2.238 3.567 4.896
2 1.805 2.150 3.484 4.926
3 1.626 2.104 3.499 4.923
4 1.554 2.142 3.659 5.006
5 1.676 2.170 3.673 5.088
6 1.692 2.160 3.782 5.151
Average PV: 1.659 2.161 3.611 4.998

xxxvi
Table K3: Experimental data from investigation of influence of reagent reaction time on the iodometric titration method. PV was measured as a function of time, at t= 1, 5 and 10 minutes. Four parallels were measured in cod liver oil and canola oil. Parallels are numbered 1-4.
Sample Time (min.): 1 5 10
Can
ola
oil
1 0.751 1.246 2.118
2 0.768 1.385 1.730
3 0.630 1.551 1.864
4 0.612 1.207 0.691
Average PV: 0.690 1.347 1.601
Cod
live
r oi
l
1 1.258 2.803 4.926
2 1.330 3.045 7.316
3 1.396 2.497 5.904
4 1.889 2.051 6.474
Average PV: 1.468 2.599 6.155
Cod
live
r oi
l 1 5.203 7.025 11.104 12.924
2 5.160 6.754 11.059 13.105
3 5.268 6.941 10.899 13.008
4 5.329 7.132 8.947 -
Average PV: 5.240 6.963 10.502 13.012
Can
ola
oil
1 0.484 0.751 0.846 1.835
2 0.601 0.768 1.071 1.915
3 0.530 0.630 1.109 1.919
4 0.585 0.612 0.890 1.852
Average PV: 0.550 0.690 0.979 1.880

xxxvii
Table K4: Four parallels were measured in cod liver oil in samples were reagents had been N2 flushed and four parallels were measured in samples were reagents were not N2 flushed. Measurements were completed at one low and one relatively high oxidation level. Parallels are numbered 1-4.
Low oxidation level
N2 flushed
Sample PV
1 1.174
2 1.128
3 1.134
4 1.126
Average: 1.141
Without N2 flushing
1 1.305
2 1.295
3 1.409
4 1.309
Average: 1.329
High oxidation level
N2 flushed
1 15.804
2 16.090
3 16.385
4 16.502
Average: 16.195
Without N2 flushing
1 17.490
2 17.556
3 17.440
4 17.801
Average: 17.572

xxxviii
Appendix L : Experimental data from investigation of influence of antioxidants and additives on oxidation parameters in methods.
By following standard procedures of methods, the possible influence of antioxidants and additives on oxidation parameters in the methods was measured. For all methods the effect of flavor additives (peppermint, lemon), antioxidants (Q10, BHT, tocopherol, astaxanthin, rosemary) and vitamins (vitamin K1) was studied. In the experiment, all additives were blended in cod liver oil obtained from factory B, to concentrations given in table 2.3.1. Table L1-L5 contains the experimental data. Only calculated oxidation parameter value (PV, AV or TBARS) is included. The Chauvenet's criterion, described in section 2.6 was used to reject data. Rejected data are labeled in red color
Table L1: Experimental data from investigation of influence of antioxidants and additives on the PV obtained by iodometric titration. All values given in black color in the table are PV values (mEq peroxide kg-1 oil). Parallels are numbers 1-3.
Sample Control Q10 BHT Vit.K1 Lemon Pepperm. Rosemary Astaxa. Tocoph.
1 2.916 4.250 3.096 3.704 4.644 4.057 2.614 2.853 4.068
2 2.915 4.371 3.150 3.834 4.787 4.067 2.746 2.892 4.273
3 2.884 4.452 3.172 3.933 4.765 4.300 2.677 2.841 4.305
Average PV:
2.905 4.358 3.139 3.824 4.732 4.141 2.679 2.862 4.216

xxxix
Table L2: Experimental data from investigation of influence of antioxidants and additives on the PV obtained by the ferric thiocyanate method. All values given in black color in the table are PV values (mEq peroxide kg-1 oil). Parallels are numbered 1-4.
Blank: 0.102
Sample Control Q10 BHT Vit.K1 Lemon Pepperm. Rosemary Astaxa. Tocoph.
1 2.549 3.893 2.375 4.654 6.215 4.243 2.697 2.353 4.699
2 2.340 3.668 3.046 2.980 6.114 3.907 3.306 3.370 3.446
3 2.957 3.952 2.760 3.195 4.281 4.284 2.768 3.022 1.969
4 0.465 3.207 3.106 3.390 3.557 3.284 2.564 3.144 1.915
Average PV:
2.615 3.680
2.822
3.555
5.042
3.929
2.834
2.972
3.007
Table L3: Experimental data from investigation of influence of antioxidants and additives on the AV measurements. All values given in black color in the table are AV values. Parallels are numbered 1-4.
Sample Control Q10 BHT Vit.K1 Lemon Pepperm. Rosemary Astaxa. Tocoph.
1 6.146 5.626 5.931 5.348 131.09 5.236 4.804 5.363 5.567
2 5.964 5.575 5.193 5.411 131.21 5.161 4.605 5.205 5.282
3 6.029 6.091 6.076 4.945 131.01 5.327 4.879 5.326 5.281
4 5.724 5.554 5.805 5.410 130.63 5.257 4.880 5.203 5.447
Average AV:
5.966 5.712
5.751
5.279
130.99
5.245
4.792
5.274
5.394

xl
Table L4: Experimental data from investigation of influence of addition of lemon extract on the AV measurements. Lemon extract was added in concentrations; 0.5, 1 and 2%. All values given in black color in the table are AV values. Parallels are numbered 1-4.
Added lemon extract conc. (%): 0.5 1 2
Sample
1 35.533 55.300 132.402
2 34.820 54.121 132.582
3 34.807 53.753 132.297
4 34.670 54.397 131.943
Average AV: 34.957 54.393 132.306
Table L5: Experimental data from investigation of influence of antioxidants and additives on TBARS measurements. All values given in black color in the table are TBARS values (µM TBARS /g). Parallels are numbered 1-4.
Sample Control Q10 BHT Vit.K1 Lemon Pepperm. Rosemary Astaxa. Tocoph.
1 4.820 1.457 1.453 1.608 2.912 1.502 1.151 1.339 0.816
2 0.975 1.650 1.284 1.190 2.645 1.716 1.764 1.440 1.750
3 2.083 1.823 1.651 1.312 2.177 2.033 1.467 1.222 1.761
4 1.675 1.167 1.764 1.701 2.416 2.192 1.727 1.787 2.509
Average TBARS value:
1.578
1.524
1.538
1.453
2.537
1.861
1.527
1.447
1.709