ANALYTIC HIERARCHY PROCESS FOR QOS EVALUATION …aircconline.com/ijcnc/V7N6/7615cnc09.pdf ·...
13
International Journal of Computer Networks & Communications (IJCNC) Vol.7, No.6, November 2015 DOI : 10.5121/ijcnc.2015.7609 125 ANALYTIC HIERARCHY PROCESS FOR QOS EVALUATION OF MOBILE DATA NETWORKS Daniel E. Asuquo and Uduak A. Umoh Department of Computer Science University of Uyo, PMB 1017, 520003, Uyo, Nigeria ABSTRACT The widespread demand for data applications over mobile networks requires that service providers guarantee a well-defined quality of service (QoS) for subscribers. Evaluating the QoS provided by service providers within a geographical area to determine which network provides the best QoS is a challenging task. The complex nature of mobile networks with multi-criteria and conflicting factors makes good decision making difficult. This paper presents a measurement-based method called Analytic Hierarchy Process (AHP) for evaluating QoS in application-specific and user-centric data on 3G mobile networks. The evaluation problem is formulated as a multi-criteria decision problem. Latency, jitter, data loss, and throughput are the parameters collected as criteria in drive testing over the mobile network. Decision matrix is applied to solve the problem by reaching a final ranking of the network based on the collected measured values of the problem parameters. A case study of 3G mobile networks in Uyo metropolis is used to show how this approach can be effective in ranking the QoS in data applications to determine which network provides the best QoS based on users’ perception of quality. The implemented results in Java indicate that Etisalat network is the alternative that offers the best QoS for web browsing application based on measured criteria. This is followed by Airtel and then MTN, while Glo is ranked least. The result provides useful information to decision makers for performance improvement on service quality. KEYWORDS Quality of service, multi-criteria decision making, analytic hierarchy process, web browsing & mobile networks 1.INTRODUCTION One of the objectives of wireless mobile networks is the provision of required quality of service (QoS). Whether the QoS level is measured from the end-users’ experience or obtained from the network’s switching centre, its aim is to improve subscribers’ loyalty to a particular brand of service provider as well as yield more revenue to the operator. According to [1] and [2], enhancements in the form of higher data rates, QoS, security measures, location-awareness, new flexible communication capabilities, etc. are needed to enable wireless networks support demands for voice, data, and multimedia services. With the continuous growth in data rates, operators are forced to more-intelligently manage the traffic on their networks. Since different applications have different QoS requirements, efficient mechanisms (admission control, resource reservation, and packet scheduling) are needed to provide guaranteed QoS. In [3], the network-centric and end-system based approaches are proposed to support QoS guarantees. The former requires network devices such as routers, switches, and base stations to provide QoS support to satisfy data rate, bounded delay, and packet loss requirements by applications [4][5] while the latter does not impose any requirements on the network. Instead, control techniques are employed by the end systems to maximize the quality demanded by applications.
Transcript of ANALYTIC HIERARCHY PROCESS FOR QOS EVALUATION …aircconline.com/ijcnc/V7N6/7615cnc09.pdf ·...

International Journal of Computer Networks & Communications (IJCNC) Vol.7, No.6, November 2015
DOI : 10.5121/ijcnc.2015.7609 125
ANALYTIC HIERARCHY PROCESS FOR QOS
EVALUATION OF MOBILE DATA NETWORKS
Daniel E. Asuquo and Uduak A. Umoh
Department of Computer Science
University of Uyo, PMB 1017, 520003, Uyo, Nigeria
ABSTRACT
The widespread demand for data applications over mobile networks requires that service providers
guarantee a well-defined quality of service (QoS) for subscribers. Evaluating the QoS provided by service
providers within a geographical area to determine which network provides the best QoS is a challenging task. The complex nature of mobile networks with multi-criteria and conflicting factors makes good
decision making difficult. This paper presents a measurement-based method called Analytic Hierarchy
Process (AHP) for evaluating QoS in application-specific and user-centric data on 3G mobile networks.
The evaluation problem is formulated as a multi-criteria decision problem. Latency, jitter, data loss, and
throughput are the parameters collected as criteria in drive testing over the mobile network. Decision
matrix is applied to solve the problem by reaching a final ranking of the network based on the collected
measured values of the problem parameters. A case study of 3G mobile networks in Uyo metropolis is used
to show how this approach can be effective in ranking the QoS in data applications to determine which
network provides the best QoS based on users’ perception of quality. The implemented results in Java
indicate that Etisalat network is the alternative that offers the best QoS for web browsing application
based on measured criteria. This is followed by Airtel and then MTN, while Glo is ranked least. The result provides useful information to decision makers for performance improvement on service quality.
KEYWORDS
Quality of service, multi-criteria decision making, analytic hierarchy process, web browsing & mobile
networks
1.INTRODUCTION
One of the objectives of wireless mobile networks is the provision of required quality of service
(QoS). Whether the QoS level is measured from the end-users’ experience or obtained from the
network’s switching centre, its aim is to improve subscribers’ loyalty to a particular brand of
service provider as well as yield more revenue to the operator. According to [1] and [2], enhancements in the form of higher data rates, QoS, security measures, location-awareness, new
flexible communication capabilities, etc. are needed to enable wireless networks support demands
for voice, data, and multimedia services. With the continuous growth in data rates, operators are forced to more-intelligently manage the traffic on their networks. Since different applications
have different QoS requirements, efficient mechanisms (admission control, resource reservation,
and packet scheduling) are needed to provide guaranteed QoS. In [3], the network-centric and
end-system based approaches are proposed to support QoS guarantees. The former requires network devices such as routers, switches, and base stations to provide QoS support to satisfy
data rate, bounded delay, and packet loss requirements by applications [4][5] while the latter does
not impose any requirements on the network. Instead, control techniques are employed by the end systems to maximize the quality demanded by applications.

International Journal of Computer Networks & Communications (IJCNC) Vol.7, No.6, November 2015
126
Evaluating the performance of a mobile network requires saturating the network with a high load
of real-world mobile subscribers’ traffic, and measuring key performance indicators (KPIs) that
identify QoS. Without a structured technique, an attempt to evaluate the overall QoS of a network is a very challenging task [6]. An intelligent approach to call admission control for quality of
service provision using fuzzy logic was adopted in [7]. However, in [8], it was reported that a
multi-criteria decision making scheme can provide a more optimal result for signal quality evaluation in wireless cellular networks. Since multimedia applications in wireless networks can
tolerate a certain probability of QoS degradation called soft guarantee due to its capacity being a
random variable, we consider a statistical evaluation of QoS in four 3G mobile networks in Uyo
metropolis, Nigeria using the Analytic Hierarchy Process (AHP). The AHP method builds a hierarchical framework for decision making comprising the goal to be achieved at the top of the
hierarchy, followed by criteria needed to achieve the goal and possibly the alternatives for each
criterion at the bottom of the hierarchy. A comparison matrix is formed by comparing each pair of criteria/or alternatives such that the paired comparisons produce weighting scores that measure
how much importance the criteria and alternatives have with each other. The method tries to
optimize decision making when decision makers are faced with conflicting qualitative and
quantitative data. In enables decision makers, in its final ranking, to choose the best solution among several alternatives across multiple criteria to attaining a specific goal. The ability of the
method to capture both subjective and objective data in a quantitative manner for evaluation as
well as the provision of a mechanism for checking the consistency ratio of the evaluation measurements [9] makes it a veritable tool for decision making. The performance of a network
within a geographical area can then be evaluated for a given application based on specified
criteria [6].
This paper therefore focuses on performance evaluation of the quality of service of different 3G
mobile networks to determine which network provides the best QoS for web browsing
applications from the end-user perspective. The rest of the paper is organized as follows. Section II provides a review of related literature on challenges of QoS guarantee in wireless networks and
some approaches to meet these challenges while section III presents the proposed AHP method as
a QoS evaluation methodology for wireless data networks. In section IV, the AHP method is implemented and numerical results are discussed. Section V summarizes the paper giving
conclusive remarks and direction for future work.
2.LITERATURE REVIEW
Most times, wireless networks become overloaded with packet-oriented services leading to
excessive packet delay and jitter. Overloading the network beyond its capacity causes congestion.
This scenario can cause the throughput at the network or user level to drop below acceptable threshold. The objectives of managing scarce radio resources include to guarantee the QoS of
admitted traffic, maintain the planned coverage, and maximize the amount of traffic admitted into
the system [8]. The greatest challenge for wireless mobile networks has been congestion [3][10][11] and QoS guarantee ensures that the network continues to provide a satisfactory
service level for a given service type (e.g. voice, data, multimedia). For data networks, this
problem can lead to packet loss, delay, jitter, and low throughput which are key performance indicators (KPIs) for evaluating the performance of the network. While throughput is the amount
of data processed by a computing device, data loss refers to the fraction of packets that is lost
during transmission from one point (sender) to the other (receiver). Jitter refers to flicking
transmission signal or display image. Latency refers to the delay between data request and response in a network. Finding ways of providing reliable network performance while at the same
time utilizing the total network resources in an efficient manner thus become paramount. Several
schemes have been devised to provide QoS in traditional networks [2]. [12] propose the user-perceived quality approach with a focus on less-time sensitive applications such as web surfing
International Journal of Computer Networks & Communications (IJCNC) Vol.7, No.6, November 2015
127
since some traditional schemes are wasteful by reserving network resources beyond the user’s
need. A guarantee of delay assures that a packet of data will travel from sender to receiver within
a specified amount of time. A guarantee of loss assures that the fraction of packets lost during transmission will not be beyond a specified threshold. A guarantee of jitter assures that the delay
will not vary by more than a specified amount while a guarantee of throughput assures that the
amount of data transmitted within a specified unit of time will be greater than or equals to a certain value.
In [13], a QoS assessment methodology for cellular networks based on data collected through
drive testing was presented. The work focus on the end user’s perception of service quality without consideration for access technologies used. QoS assessment for both the circuit switched
and packet switched of the network is studied. However, the authors could not provide QoS
measurements for both voice and data services at the same time. In [14], a methodology for evaluating the quality of file transfer protocol data service in cellular universal mobile
telecommunications system (UMTS) networks based on data collected through drive testing is
presented. Although user experience was taken as a key factor in determining the network
operator’s success, it was only evaluated based on data services on a single network. In [15], a methodology for evaluating the QoS provided in different routes by a UMTS cellular network for
background services is presented. The methodology concentrated on a single UMTS and so could
not be used universally on different networks. [16] use the AHP method to evaluate QoS for a campus e-learning platform to help students and teachers know which location on the campus
provides the best QoS. However, at what time of the day a location could be better than others
was not specified. The authors in [6] also used the AHP method to evaluate a wireless cellular network so as to determine how well it performs for different periods of a day.
This paper analyzes the QoS of some 3G mobile data networks in Uyo metropolis, Nigeria to
determine which of them provides the best service quality for browsing application based on some criteria. One of the modern tools developed to assess, prioritize, rank, and evaluate decision
choices in many areas of human endeavour is the Analytic Hierarchy Process (AHP) developed
by Thomas Saaty [17][18]. Figure 1 shows the design of the AHP method. It is a mathematical technique used to formalize decision making where there are multi-criteria. Multi-criteria
decision support methods have been applied for sustainability of renewable energy systems
[19][20], for network selection decision during handover in heterogeneous wireless networks [21-
23]. In this paper, the statistical approach to highlighting the multi-criteria decision process involved as well as the major procedures that must be followed to rank the various network
alternatives and criteria so as to obtain the best goal are presented.
3.PROPOSED AHP METHOD FOR QOS EVALUATION
AHP is a useful and widespread method for solving problems where a choice has to be made
from a number of alternatives based on their relative importance. It is a theory of measurement through pair-wise comparisons and relies on the judgments of experts to derive priority scales.
AHP enables decision makers to select the alternative that best meets his criteria by developing a
numerical score to rank each decision based on how well each alternative meets them.
This work adopts the AHP methodology to compare the QoS of a four wireless cellular networks
and determine which network provides the best QoS based on user’s perception of quality. The
output provided by the AHP approach can then be used as a general measurement of the perceived QoS by users of these different networks. The proposed AHP method for network QoS
evaluation is shown in Figure 2. It is used to evaluate different network providers based on
multiple QoS evaluation criteria. The application of the AHP method to a complex problem
usually involves the following major steps [24]:

International Journal of Computer Networks & Communications (IJCNC) Vol.7, No.6, November 2015
128
Define the unstructured problem by describing the hierarchy with the goal at the top,
followed by criteria at the lower levels and then alternatives at the bottom.
Construct a set of pair-wise comparison matrices among decision elements (criteria
and alternatives) by establishing priorities among them based on the preference scale
shown on table 1.
Estimate the relative weights of the decision elements using eigenvector method.
Aggregate these relative weights and synthesize them for the final measurements of
the decision alternatives.
Compute the consistency ratio to determine the acceptability or otherwise of the
chosen criteria or alternative.
Figure 1. The AHP method
Figure 2. AHP Method for Network QoS Evaluation
In the first step of the AHP method, we define the problem as determining the network that provides the best QoS for browsing application considering latency, jitter, data loss and
throughput as criteria. In the second step, decision makers systematically evaluate the various
alternatives in the hierarchy by comparing them to one another with respect to the criteria. In making these comparisons, the decision makers can use concrete data about the alternatives, but
they typically use their judgments about the alternatives’ relative meaning and importance. The
same process is made for comparing the criterion with respect to the goal. This process results in
a comparison matrix shown in figure 3 with each leading diagonal element equals to 1, i.e.
V .
Network with Best QoS
Latency DataLoss Jitter Throughput
Airtel
Glo
MTN
Etisalat
Airtel
Glo
MTN
Etisalat
Airtel
Glo
MTN
Night
Airtel
Glo
MTN
Etisalat
Goal
Criterion1
Alternative1
Criterion2 Criterion3 Criterion4
Alternative2
Alternative3
Alternative4 Alternative4
Alternative3
3
Alternative2
Alternative1
Alternative1
Alternative2
Alternative3
Alternative4
Alternative1
Alternative2
Alternative3
Alternative4

International Journal of Computer Networks & Communications (IJCNC) Vol.7, No.6, November 2015
129
=
Figure 3: Comparison matrix
For a given level in the hierarchy, the comparison matrix is created by assigning the value of
pair-wise comparison of the element in row with the element in column into the position .
A low value indicates less importance in the element comparison while a high value indicates a
greater importance in the element comparison. Note that is the number of criteria or alternatives
to be evaluated, is the criteria, and is the comparison of the criteria (alternative) with
respect to the criteria (alternative). According to [24], this process is repeated upwards for
each level until the top of the hierarchy is reached. In the third and fourth steps, the AHP method
determines the relative weight of each criteria (alternative) and aggregates the eigenvectors for each comparison matrix until the composite weight (final score) for alternatives is obtained. The
values of the final weight vector indicate the relative importance of each alternative with respect
to the goal of the decision problem [19]. A decision maker then uses the eigenvectors to rank the alternatives for appropriate decision making.
A pair-wise comparison scale is needed for each comparison matrix in the weight vector. First, a
weight matrix shown in figure 4, is derived for each comparison matrix where a weight vector
is computed to determine the relative importance of each alternative in the comparison matrix.
Assuming we have the weight vector , the value of represents the relative
importance of alternative of the associated comparison matrix based on criterion such that
.
Figure 4: The weight matrix
The weights used for matrix are derived through pair-wise comparison using the scale shown on Table 1 as in [24]. Realistic observed data obtained from a regulatory body for the criteria
concerning each alternative is used for the analysis. The threshold set by this body is used as a
benchmark to indicate the level of preference of these criteria on the expected performance.
C1
C2
C3
C4
.
Cn
C1 C2 C3 C4 … Cn
N1 N2 N3 … N4

International Journal of Computer Networks & Communications (IJCNC) Vol.7, No.6, November 2015
130
Table 1: Proposed pair-wise comparison scale
Using the formula shown in figure 5, we formalize . Here represents the element at row
and column of the respective alternative versus alternative or criteria versus criteria
comparison matrix. Given , a weight eigenvector is then calculated using the formula in fig. 6. The relative weight called the weighted eigenvector is computed as the row average of the
resulting normalized matrix. The overall weight coefficient with respect to the goal for each
decision alternative is then obtained in this weight eigenvector. Using the equation in fig. 6, the
alternatives are compared with each other in terms of the decision criteria which results in an overall ranking with respect to the criteria.
Figure 5: Normalized matrix
=
Figure 6: Weight vector calculation
Once all weight eigenvectors in the evaluation problem have been computed, they are used to
determine the alternatives that provide the best goal. For example, if a problem has alternatives
and criteria, then the decision maker is required to construct judgment matrices (each for one
criterion) of the order and one judgment matrix of order [25]. Assuming the weight
eigenvector of alternative comparison with respect to each criteria is where
and is the weight eigenvector of criteria comparison with respect to the goal, then we need
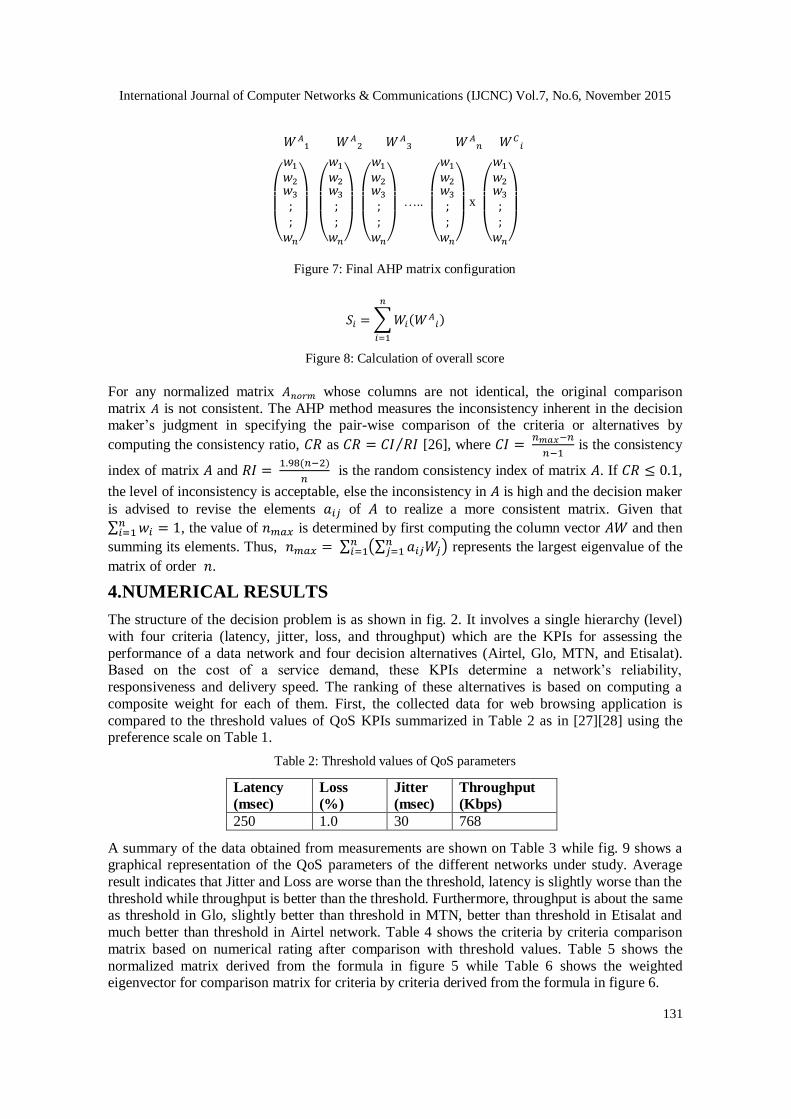
to multiply them to obtain the final score of the goal at the top of the hierarchy as shown in fig. 7.
To obtain the final score of the goal, we compute the relative preference for alternative . Let
, and , we define as the overall score for alternative , where represents
the element of the vectors and . is calculated as shown in fig. 8. Once overall
scores are computed for all networks, the highest score is identified as the alternative providing the best goal, followed by the second highest score, and so on.
Scale Description
9 Far better than the threshold
8 Much better than the threshold 7 Better than the threshold
6 Slightly better than the threshold
5 About the same as the threshold 4 Slightly worse than the threshold
3 Worse than the threshold
2 Much worse than the threshold 1 Far worse than the threshold
International Journal of Computer Networks & Communications (IJCNC) Vol.7, No.6, November 2015
131
…..
x
Figure 7: Final AHP matrix configuration
Figure 8: Calculation of overall score
For any normalized matrix whose columns are not identical, the original comparison
matrix is not consistent. The AHP method measures the inconsistency inherent in the decision maker’s judgment in specifying the pair-wise comparison of the criteria or alternatives by
computing the consistency ratio, as [26], where
is the consistency
index of matrix and
is the random consistency index of matrix . If ,
the level of inconsistency is acceptable, else the inconsistency in is high and the decision maker
is advised to revise the elements of to realize a more consistent matrix. Given that
, the value of is determined by first computing the column vector and then
summing its elements. Thus,
represents the largest eigenvalue of the
matrix of order .
4.NUMERICAL RESULTS
The structure of the decision problem is as shown in fig. 2. It involves a single hierarchy (level)
with four criteria (latency, jitter, loss, and throughput) which are the KPIs for assessing the
performance of a data network and four decision alternatives (Airtel, Glo, MTN, and Etisalat). Based on the cost of a service demand, these KPIs determine a network’s reliability,
responsiveness and delivery speed. The ranking of these alternatives is based on computing a
composite weight for each of them. First, the collected data for web browsing application is
compared to the threshold values of QoS KPIs summarized in Table 2 as in [27][28] using the preference scale on Table 1.
Table 2: Threshold values of QoS parameters
Latency
(msec)
Loss
(%)
Jitter
(msec)
Throughput
(Kbps)
250 1.0 30 768
A summary of the data obtained from measurements are shown on Table 3 while fig. 9 shows a graphical representation of the QoS parameters of the different networks under study. Average
result indicates that Jitter and Loss are worse than the threshold, latency is slightly worse than the
threshold while throughput is better than the threshold. Furthermore, throughput is about the same as threshold in Glo, slightly better than threshold in MTN, better than threshold in Etisalat and
much better than threshold in Airtel network. Table 4 shows the criteria by criteria comparison
matrix based on numerical rating after comparison with threshold values. Table 5 shows the
normalized matrix derived from the formula in figure 5 while Table 6 shows the weighted eigenvector for comparison matrix for criteria by criteria derived from the formula in figure 6.

International Journal of Computer Networks & Communications (IJCNC) Vol.7, No.6, November 2015
132
Table 3: Mean values of QoS parameters for each network
Alternatives/
Criteria
Latency Loss Jitter Throughput
Airtel 276.01 1.98 60.92 989.66
Glo 322.34 2.44 93.15 758.72
MTN 301.00 2.19 87.21 780.64
Etisalat 262.15 1.03 52.25 895.27
Average Value 290.38 1.91 73.38 856.07
Figure 9: Graph of summarized QoS parameters for each network
Table 4: Criteria by criteria comparison matrix
Scale 4 3 3 7
Criteria Latency Loss Jitter Throughput
Latency 1.00 1.33 1.33 0.57
Loss 0.75 1.00 1.00 0.43
Jitter 0.75 1.00 1.00 0.43
Throughput 1.75 2.33 2.33 1.00
Total 4.25 5.66 5.66 2.43
Table 5: Normalized matrix for criteria by criteria
Latency Loss Jitter Throughput
Latency 0.24 0.23 0.23 0.23
Loss 0.18 0.18 0.18 0.18
Jitter 0.18 0.18 0.18 0.18
Throughput 0.41 0.41 0.41 0.41
Table 6: Weighted eigenvector for criteria by criteria comparison matrix
Latency 0.23
Loss 0.18
Jitter 0.18
Throughput 0.41
Since the columns of the normalized matrix on table 5 are identical, it therefore means that the
consistency level of the original comparison matrix on table 4 is reasonable. The Alternative by alternative pair-wise comparisons are then computed based on the set threshold of the criteria to
determine the pair-wise rating of each alternative using the preference scale. This results in Table
7. Since Latency in Etisalat network is about the same as the set threshold, we used the value 5. It
0 200 400 600 800 1000
Airtel
Glo
MTN
Etisalat Throughput
Jitter
Loss
Latency

International Journal of Computer Networks & Communications (IJCNC) Vol.7, No.6, November 2015
133
is slightly worse in Airtel network so we used the value 4. Our latency measurements get worse in
MTN network so it is given the value 3. Likewise, it becomes much worse and further away from
the threshold in Glo network so it is given the value 2. Table 7 is then normalized using the formula in the matrix of figure 5 as shown in Table 8. Using the formula in figure 6, the weighted
eigenvector comparison matrix for latency is obtained in Table 9.
Table 7: Network comparison matrix for latency
4 2 3 5
Latency Airtel Glo MTN Etisalat
Airtel 1.00 2.00 1.33 0.8
Glo 0.5 1.00 0.67 0.4
MTN 1.5 1.5 1.00 0.6
Etisalat 1.25 2.5 1.67 1.00
Total 4.25 7.00 4.67 2.8
Table 8: Normalized comparison matrix for latency
Latency Airtel Glo MTN Etisalat
Airtel 0.24 0.29 0.28 0.29
Glo 0.12 0.14 0.14 0.14
MTN 0.35 0.21 0.21 0.21
Etisalat 0.29 0.36 0.36 0.36
Table 9: Weighted eigenvector comparison matrix for latency
Airtel 0.28
Glo 0.14
MTN 0.25
Etisalat 0.34
Since the columns of the normalized matrix on Table 8 are not identical, is computed to
determine if the level of inconsistency in the original matrix on Table 7 is acceptable. For the
matrix under consideration, the column vector gives and
yields 4.2895. Hence, for , = 0.0965 and = 0.99. Thus, gives an acceptable level of inconsisitency in matrix .
The same process is applied to criteria Loss, Jitter, and Throughput and the results are as
presented on Tables 10 -18, respectively.
Table 10: Network comparison matrix for loss
3 2 3 4
Loss Airtel Glo MTN Etisalat
Airtel 1.00 1.5 1.00 0.75
Glo 0.67 1.00 0.67 0.5
MTN 1.00 1.5 1.00 0.75
Etisalat 1.33 2.00 1.33 1.00
Total 4.00 6.00 4.00 3.00

International Journal of Computer Networks & Communications (IJCNC) Vol.7, No.6, November 2015
134
Table 11: Normalized comparison matrix for loss
Loss Airtel Glo MTN Etisalat
Airtel 0.25 0.25 0.25 0.25
Glo 0.17 0.17 0.17 0.17
MTN 0.25 0.25 0.25 0.25
Etisalat 0.33 0.33 0.33 0.33
Table 12: Weighted eigenvector comparison matrix for loss
Airtel 0.25
Glo 0.17
MTN 0.25
Etisalat 0.33
Table 13: Network comparison matrix for jitter
3 2 2 4
Jitter Airtel Glo MTN Etisalat
Airtel 1.00 1.5 1.5 0.75
Glo 0.67 1.00 1.00 0.5
MTN 0.67 1.00 1.00 0.5
Etisalat 1.33 2.00 2.00 1.00
Total 3.67 5.50 5.50 2.75
Table 14: Normalized comparison matrix for jitter
Jitter Airtel Glo MTN Etisalat
Airtel 0.27 0.27 0.27 0.27
Glo 0.18 0.18 0.18 0.18
MTN 0.18 0.18 0.18 0.18
Etisalat 0.36 0.36 0.36 0.36
Table 15: Weighted eigenvector comparison matrix for jitter
Airtel 0.27
Glo 0.18
MTN 0.18
Etisalat 0.36
Table 16: Network comparison matrix for throughput
8 5 6 7
Throughput Airtel Glo MTN Etisalat
Airtel 1.00 1.60 1.33 1.14
Glo 0.63 1.00 0.83 0.71
MTN 0.75 1.20 1.00 0.86
Etisalat 0.88 1.40 1.17 1.00
Total 3.26 5.20 4.33 3.71

International Journal of Computer Networks & Communications (IJCNC) Vol.7, No.6, November 2015
135
Table 17: Normalized comparison matrix for throughput
Throughput Airtel Glo MTN Etisalat
Airtel 0.31 0.31 0.31 0.31
Glo 0.19 0.19 0.19 0.19
MTN 0.23 0.23 0.23 0.23
Etisalat 0.27 0.27 0.27 0.27
Table 18: Weighted eigenvector comparison matrix for throughput
Airtel 0.31
Glo 0.19
MTN 0.23
Etisalat 0.27
The final AHP matrix configuration and calculation of final score for ranking of the best
alternative for decision making is as shown on table 19 and 20, respectively.
Table 19: Final AHP matrix configuration
Table 20: Overall score of each network
Airtel 0.29
Glo 0.17
MTN 0.23
Etisalat 0.31
Based on these calculations, the overall weighted score from table 20 indicates that Etisalat has
the highest composite weight and, hence represents the network with the best QoS. Airtel is
ranked next, followed by MTN while Glo offers the worst QoS as perceived by users.
5.CONCLUSION AND FUTURE WORK
Service quality and the performance of wireless systems are related to the conditions of their infrastructures. It thus becomes desirable that these infrastructures be in their best possible
condition and offer attractive, quality, satisfactory services for subscribers. This paper employs
the analytic hierarchy process to compare users’ experience on four well-established 3G data networks for browsing applications to determine which network provides the best QoS based on
users’ perception of quality. The outcome from the evaluation ranks Etisalat network as the
alternative that achieves the goal of providing the best QoS considering latency, data loss, jitter
and throughput parameters as mobile network criteria. This result is useful in informing operators or decision makers to improve service quality through infrastructure upgrade and efficient radio
resource management schemes. In future work, fuzzy AHP technique will be employed to
consider inherent uncertainties or fuzziness in the decision maker’s preferences and further improve the connectivity of the respective data networks.

International Journal of Computer Networks & Communications (IJCNC) Vol.7, No.6, November 2015
136
REFERENCES
[1] M.Frodigh, S. Parkvall, C. Roobol, P. Johansson, and P. Larsson, “Future-generation wireless
networks,” IEEE Personal Communications, pp.10–17, 2001.
[2] T.S.Rappaport, A. Annamalai, R. M. Buehrer, and W. H. Tranter, “Wireless communications: Past
events and a future perspective,” IEEE Communications Magazine, vol. 40, pp. 148–161, 2002.
[3] B.Jabbari, “Teletraffic aspects of evolving and next-generation wireless communication networks,”
IEEE Personal Communications Magazine, pp. 4–9, 1996.
[4] S.Shenker, C. Partridge, and R. Guerin, Specification of guaranteed quality of service, RFC 2212, Internet Engineering Task Force, 1997.
[5] S.Blake, D. Black, D. Carlson, E. Davies, Z. Wang, and W. Weiss, An architecture for differentiated
services, RFC 2475, Internet Engineering Task Force, 1998.
[6] L.Oborkhale, A. Salatian, and G. Onoh, “Ranking the quality of service of a wireless cellular
network for different periods of the day,” International Journal of Energy, Information and
Communications, vol. 3, issue 1, pp. 55-66, February, 2012.
[7] D.E. Asuquo, E. E. Williams, E. O. Nwachukwu, and U. G. Inyang, “An intelligent call admission
control scheme for quality of service provisioning in a multi-cell CDMA network,” International
Journal of Scientific and Engineering Research, vol. 4, issue 12, pp. 152-161, December, 2013.
[8] D.E. Asuquo, E. E. Williams, and E. O. Nwachukwu, “A survey of call admission control schemes in
wireless cellular networks,” International Journal of Scientific and Engineering Research, vol. 5, issue
2, pp. 111-120, 2014. [9] N.Bhushan, and K. Ria, Strategic decision making: Applying the analytical hierarchical process,
Springer-Verlag: London, 2004.
[10] B.A. Forouzan, Data communications and networking, 3rd ed., Tata McGraw-Hill Publishing
Company: New Delhi, 2004.
[11] B.Moon, and A. H. Aghvami, “Quality-of-service mechanisms in all-IP wireless access networks,
IEEE Journal on Selected Areas in Communications, vol. 22, no. 5, pp. 873 – 888, 2004.
[12] J.Saliba, A. Beresford, M. Ivanovich and P. Fitzpatrick, “User-perceived quality of service in
wireless data networks,” Personal and Ubiquitous Computing, 9(6), 2005.
[13] I.Kostanic, N. Mijatovic, and S. D. Vest, “Measurement-based QoS comparison of cellular
communication networks,” In proceedings of IEEE International CQR Workshop, Naples, FL, 2009.
[14] I.Weissberger, N. Mijatovic, and I. Kostanic, “Evaluating FTP QoS in a UMTS network,” In proceedings of the International Conference on Wireless Networks, Las Vegas, 2009.
[15] I.Weissberger ,I. Kostanic and C. E. Otero, “Background service QoS in a UMTS network,”
Proceedings of IEEE Southeast Conf., 230 – 233, 2010.
[16] K.A.P.Agyekum, E. T. Tchao, and E. Affum, “Quality of service evaluation of a deployed 3G data
network for a campus wide e-Learning platform,” International Journal of Computer Applications,
vol. 91, no.16, pp 14-19, April 2014.
[17] T.L.Saaty, The Analytic Hierarchy Process, McGraw-Hill: New York, 1980.
[18] T.L. Saaty, Decision Making for Leaders, 3rd ed., RWS Publications: Pittsburgh, PA, 1999.
[19] S.Pohekar and D. Ramachandran, “Application of multi-criteria decision making to sustainable
energy planning,” A Renewable and Sustainable Energy Review, vol. 8, pp. 365-381, 2004.
[20] C.Wimmler, G. Hejazi, E. de Oliveira Fernandes, C. Moreira, and S. Connors, “Multi-criteria decision support methods for renewable energy systems on islands, Journal of Clean Energy
Technologies, vol. 3, no. 3, pp. 185-195, May, 2015.
[21] K.Savitha and C. Chandrasekar, “Network selection using TOPSIS in vertical handover decision
schemes for heterogeneous wireless networks,” International Journal of Computer Science Issues, vol.
8, issue 3, no. 2, pp. 400-406, May, 2011.
[22] L.Mohamed, C. Leghris, and A. Abdellah, “Network selection decision based on handover history in
heterogeneous wireless networks,” International Journal of Computer Science and
Telecommunications, vol. 3, issue 2, pp. 21-25, February, 2012.
[23] Y.Shen, N. Xin, Q. Pei, and J. MA, “The QoS-ensured vertical handoff decision in heterogeneous
wireless networks,” Journal of Information Science and Engineering, vol. 30, pp. 875-893, 2014.
[24] T.L. Saaty, ”Decision making with the analytic hierarchy process,” Int. J. Services Sciences, vol. 1,
no. 1, pp. 83-98, 2008. [25] ITU-T G1010 series G, Quality of service and performance – end-user multimedia QoS categories,
2001.
International Journal of Computer Networks & Communications (IJCNC) Vol.7, No.6, November 2015
137
[26] H.A. Taha, Operations Research: An Introduction, 7th ed., Prentice-Hall: New Delhi, 2005.
[27] International Telecommunication Union (ITU-T) X.608.1: “Information technology-enhanced
communications transport protocol: Specification of QoS management for N-plex multicast
transport”; White paper published Nov., 2008.
[28] L. Cottrell, W. Matthews, and L. Logg,, Tutorial on Internet Monitoring and PingER at SLAC:
Tutorial. Last update December, 2014.
AUTHORS
Daniel Asuquo graduated from the University of Calabar, Nigeria, in 2002 with a B.Sc.
degree in Computer Science. In 2007, he received a M.Sc. degree in Computer Science from
the University of Ibadan, Nigeria and in 2015, he received a Ph.D degree in Computer
Science from the University of Port Harcourt, Nigeria. He is a lecturer in the department of
Computer Science, University of Uyo, Nigeria. His special fields of interest include mobile computing, wireless communications and computer networks as well as web technology. He
is an associate member and member of Nigeria Computer Society and Computer Professionals Registration
Council of Nigeria, respectively.
Umoh U. A. had received her Doctor of Philosophy (PhD) degree in Soft Computing from
University of Port Harcourt, Rivers State, Nigeria in the year 2012, Master’s degree in
Database Management System from University of Port Harcourt, Rivers State, Nigeria in the
year 2006 and Bachelor’s degree from University of Uyo, Akwa Ibom State, Nigeria in
2007. She is currently working as a Lecturer I, in the University of Uyo in the Department of
Computer Science. She has published several articles in her areas in reputable national and
international journals and has written some quality books in Computer discipline. Her area of interest include; Fuzzy System, Neural network, Hybrid models, Database System, Data Communications, etc. She
is a member of Nigerian Computer Society (NCS), Member, Computer Professionals Registration Council
of Nigeria (CPN), etc.