Analysts’ and Investors’ Call 2020 Good progress towards ... · trends Managing industry hot...
111
Analysts’ and Investors’ Call 2020 Good progress towards 2020 ambition – Exploiting opportunities in an improving market environment 28 February 2020 Image: Klaus Ohlenschläger / dpa Picture Alliance Please note: Presentation based on 2019 preliminary figures
Transcript of Analysts’ and Investors’ Call 2020 Good progress towards ... · trends Managing industry hot...

Analysts’ and Investors’ Call 2020
Good progress towards 2020 ambition – Exploiting
opportunities in an improving market environment
28 February 2020
Image: Klaus Ohlenschläger / dpa Picture AlliancePlease note: Presentation based on 2019 preliminary figures
2Analysts’ and Investors’ Call 2020
Analysts' and Investors' Call 2020
1Good progress towards 2020 ambitionJoachim Wenning
Group finance and risk Christoph Jurecka
ERGOMarkus Rieß
2
3 4
5 Additional information
Reinsurance Torsten Jeworrek
28 February 2020

3Analysts’ and Investors’ Call 2020
Strong performance in 2019
Figures as at 31.12.2019 (31.12.2018). 1 Subject to the approval of the Supervisory Board and the Annual General Meeting.
€2.7bn (€2.3bn)
Exceeds initial guidance of €2.5bn
9.2% (8.4%)
Above cost of capital
€9.80 (€9.25)
High pay-out to shareholders
237% (245%)
Well above target capitalisation
Solvency II ratio
Dividend per share
IFRS net income
Return on Equity
Good progress towards 2020 ambition
1
28 February 2020

2.32.5
2.8
2.3
2.7
2018 2019 2020
Guidance Actual
4
Ongoing business and earnings growth
supports 2020 ambition
Reinsurance1
ERGO1
Plan2020
Actual2019
Guidance2019
2.1 2.3 €2.3bn
1 IFRS net income.
Digital transformation
Reduce complexity
Increaseearnings1
Plan2020
Actual2019
Guidance2019
440400
€530m
Analysts’ and Investors’ Call 2020
€bn
2020
Good progress towards 2020 ambition
28 February 2020
5
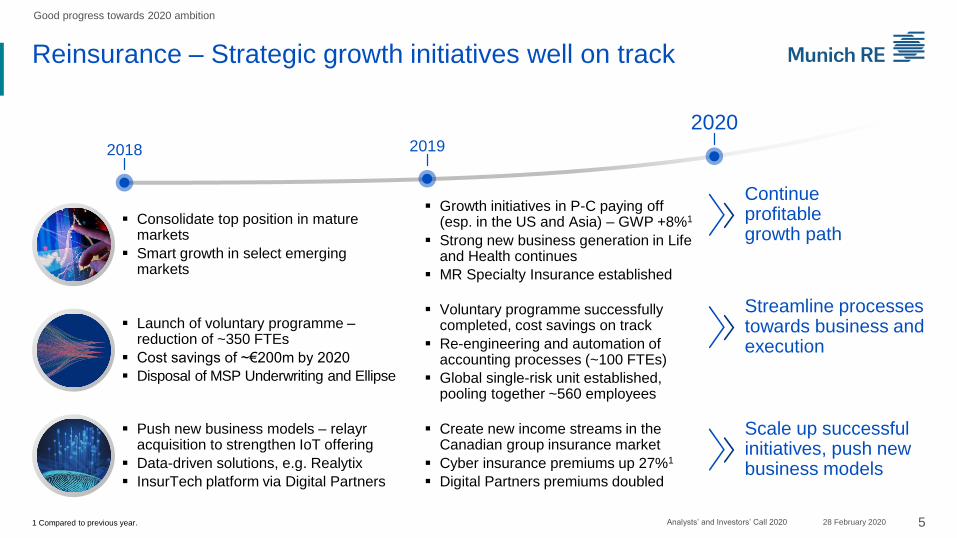
Reinsurance – Strategic growth initiatives well on track
▪ Consolidate top position in mature markets
▪ Smart growth in select emerging markets
▪ Launch of voluntary programme –reduction of ~350 FTEs
▪ Cost savings of ~€200m by 2020
▪ Disposal of MSP Underwriting and Ellipse
Continue profitable growth path
Streamline processes towards business and execution
Scale up successful initiatives, push new business models
▪ Push new business models – relayracquisition to strengthen IoT offering
▪ Data-driven solutions, e.g. Realytix
▪ InsurTech platform via Digital Partners
▪ Growth initiatives in P-C paying off (esp. in the US and Asia) – GWP +8%1
▪ Strong new business generation in Life and Health continues
▪ MR Specialty Insurance established
▪ Voluntary programme successfully completed, cost savings on track
▪ Re-engineering and automation of accounting processes (~100 FTEs)
▪ Global single-risk unit established, pooling together ~560 employees
▪ Create new income streams in the Canadian group insurance market
▪ Cyber insurance premiums up 27%1
▪ Digital Partners premiums doubled
Analysts’ and Investors’ Call 2020
2018 2019
2020
Good progress towards 2020 ambition
1 Compared to previous year. 28 February 2020

6
ERGO – Sustainably increasing profitability
▪ ESP2 ahead of financial targets
▪ Tied agent productivity significantly increased by 20%1
▪ Cost savings of €174m achieved
▪ Simplification of products, e.g. full modular product design
▪ Fully separated traditional life book
Successful completion of ESP2
Further simplify product offering and processes
Scale up and internationalisedigital solutions
▪ Strategic investments in mobility ecosystem startups, e.g. ridecell
▪ Transformation of customer interaction –30%1 user increase of customer self-service portal
▪ Nexible doubles number of policies
▪ ESP2 ahead of financial targets
▪ Tied agent productivity further improved by 18%1
▪ Cost savings of €234m achieved
▪ International portfolio streamlining finalised – 18 entities sold in total
▪ New life offerings through unified risk carrier – double-digit APE growth
▪ B2B2C mobility cooperation strategy expanded
▪ Digital process automation scaled up –first relevant AI applications, 70+ bots
▪ Minority stake in Next Insurance3
Analysts’ and Investors’ Call 2020
2018 2019
2020
1 Compared to previous year. 2 ERGO Strategy Programme. 3 Closing expected in March 2020.
Good progress towards 2020 ambition
28 February 2020
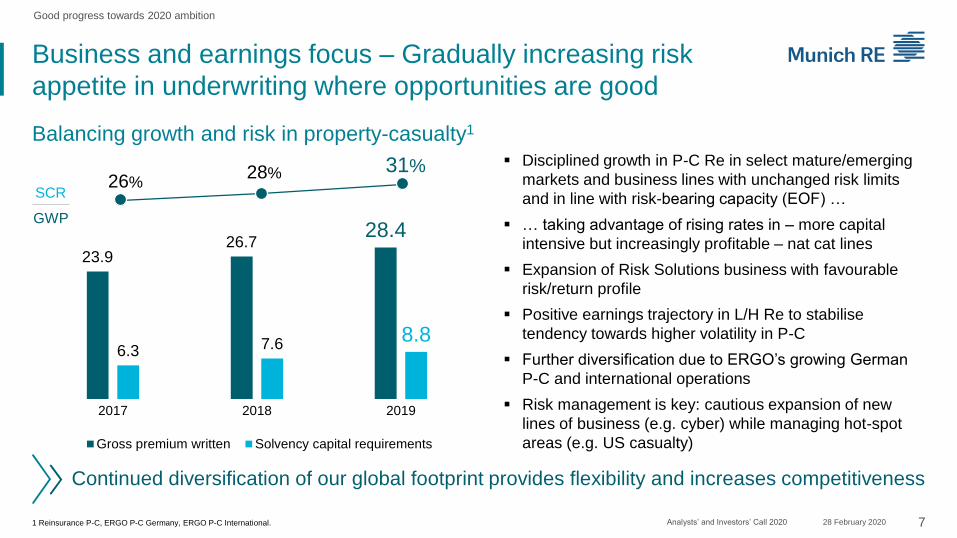
23.926.7
28.4
6.3 7.68.8
2017 2018 2019
Gross premium written Solvency capital requirements
7Analysts’ and Investors’ Call 2020
Business and earnings focus – Gradually increasing risk
appetite in underwriting where opportunities are good
GWP
SCR
31%
Balancing growth and risk in property-casualty1
1 Reinsurance P-C, ERGO P-C Germany, ERGO P-C International.
▪ Disciplined growth in P-C Re in select mature/emerging
markets and business lines with unchanged risk limits
and in line with risk-bearing capacity (EOF) …
▪ … taking advantage of rising rates in – more capital
intensive but increasingly profitable – nat cat lines
▪ Expansion of Risk Solutions business with favourable
risk/return profile
▪ Positive earnings trajectory in L/H Re to stabilise
tendency towards higher volatility in P-C
▪ Further diversification due to ERGO’s growing German
P-C and international operations
▪ Risk management is key: cautious expansion of new
lines of business (e.g. cyber) while managing hot-spot
areas (e.g. US casualty)
28%26%
Good progress towards 2020 ambition
Continued diversification of our global footprint provides flexibility and increases competitiveness
28 February 2020

8Analysts’ and Investors’ Call 2020
New organisational set-up in investments
aims to generate higher returns
Well on track towards best-practice investment processes
Group approachOne consistent investment
strategy across the Group
Strategic levelFurther expand asset classes that still have
attractive returns, e.g. illiquid assets such as
infrastructure and private equity/debt
Best ownershipAssigning investment
mandates either in-house or
to specialised third parties
Tactical allocationActively managing our portfolio
by using trading ranges and
incorporating external managers
Close to businessCombining investment and
underwriting expertise
Further diversificationContinuously improving the risk-
return profile to limit downside
Streamlining the organisation Improving risk-return profile
Identify untapped return potential without changing the overall risk
Good progress towards 2020 ambition
28 February 2020
9Analysts’ and Investors’ Call 2020
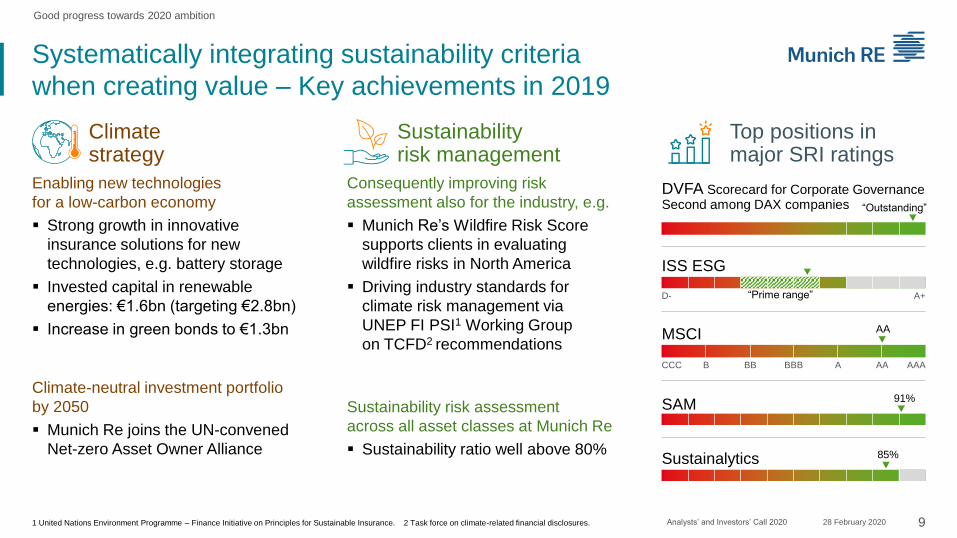
Systematically integrating sustainability criteria
when creating value – Key achievements in 2019
Climate-neutral investment portfolio
by 2050
▪ Munich Re joins the UN-convened
Net-zero Asset Owner Alliance
1 United Nations Environment Programme – Finance Initiative on Principles for Sustainable Insurance. 2 Task force on climate-related financial disclosures.
Enabling new technologies
for a low-carbon economy
▪ Strong growth in innovative
insurance solutions for new
technologies, e.g. battery storage
▪ Invested capital in renewable
energies: €1.6bn (targeting €2.8bn)
▪ Increase in green bonds to €1.3bn
Consequently improving risk
assessment also for the industry, e.g.
▪ Munich Re’s Wildfire Risk Score
supports clients in evaluating
wildfire risks in North America
▪ Driving industry standards for
climate risk management via
UNEP FI PSI1 Working Group
on TCFD2 recommendations
Climate strategy
Top positions in major SRI ratings
Sustainability risk management
Sustainability risk assessment
across all asset classes at Munich Re
▪ Sustainability ratio well above 80%
Good progress towards 2020 ambition
28 February 2020
DVFA Scorecard for Corporate GovernanceSecond among DAX companies “Outstanding”
ISS ESG
D- A+“Prime range”
MSCI AA
CCC AAAB BB BBB A AA
Sustainalytics 85%
SAM 91%
10Analysts’ and Investors’ Call 2020
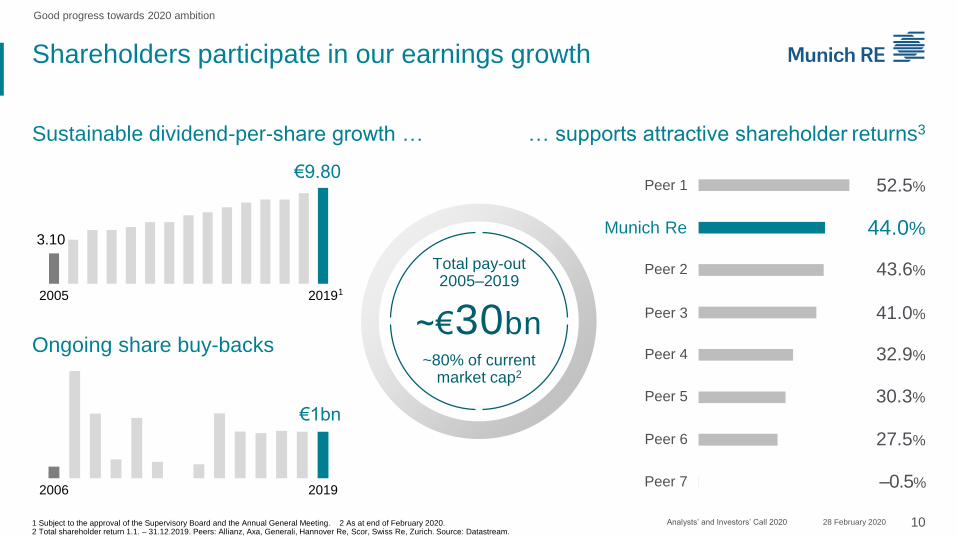
Shareholders participate in our earnings growth
1 Subject to the approval of the Supervisory Board and the Annual General Meeting. 2 As at end of February 2020.2 Total shareholder return 1.1. – 31.12.2019. Peers: Allianz, Axa, Generali, Hannover Re, Scor, Swiss Re, Zurich. Source: Datastream.
Sustainable dividend-per-share growth …
3.10
€9.80
2005 20191
€1bn
2006 2019
Ongoing share buy-backs
… supports attractive shareholder returns3
Peer 2
Munich Re
Peer 7
Peer 6
Peer 5
Peer 3
Peer 4
Peer 1 52.5%
43.6%
44.0%
41.0%
32.9%
30.3%
27.5%
–0.5%
Total pay-out 2005–2019
~€30bn~80% of current
market cap2
Good progress towards 2020 ambition
28 February 2020
11Analysts’ and Investors’ Call 2020
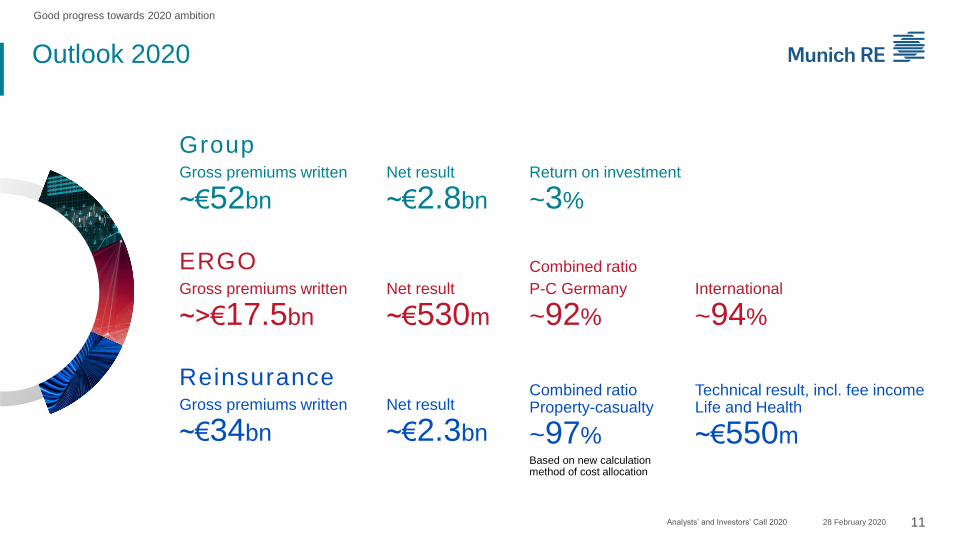
Outlook 2020
ReinsuranceGross premiums written
~€34bn
Net result
~€2.3bn
Combined ratioProperty-casualty
~97%Based on new calculation method of cost allocation
Technical result, incl. fee incomeLife and Health
~€550m
ERGOGross premiums written
~>€17.5bn
P-C Germany
~92%
International
~94%
Combined ratio
Net result
~€530m
Good progress towards 2020 ambition
Gross premiums written
~€52bn
Net result
~€2.8bn
GroupReturn on investment
~3%
28 February 2020

12Analysts’ and Investors’ Call 2020
Munich Re Investor Day
Presentation of business ambition beyond 2020
8 December 2020
Image: ipopba / Getty Images

Group finance and risk
2Image: Vertigo3d / Getty ImagesiStockphoto

▪ Earnings growth in Reinsurance despite challenging Q4 – improved underlying C/R of ~98-99%
▪ ERGO contributing €440m – ahead of its ESP targets
▪ High investment result (RoI: 3.2%) and low tax expenses
14Analysts’ and Investors’ Call 2020
Financial results 2019 – Strong earnings despite
high large losses and low/negative interest rates
Group finance and risk
Figures as at 31.12.2019 (31.12.2018). 1 Comprehensive disclosure on economic earnings will be available on 18 March 2020.
€2.7bn (€2.3bn)
IFRS net income
€1.5bn (€2.2bn)
HGB result
237% (245%)
Solvency II ratio
▪ Decline in HGB result due to lower underwriting result and higher tax expenses …
▪ … partially offset by strong investment result
▪ Distributable earnings support continuation of attractive capital management returns
▪ Well above target capitalisation
▪ High economic earnings1 of >€7bn compensate for …
▪ … increase of required capital due to business growth and further decline of interest rates
28 February 2020
15Analysts’ and Investors’ Call 2020
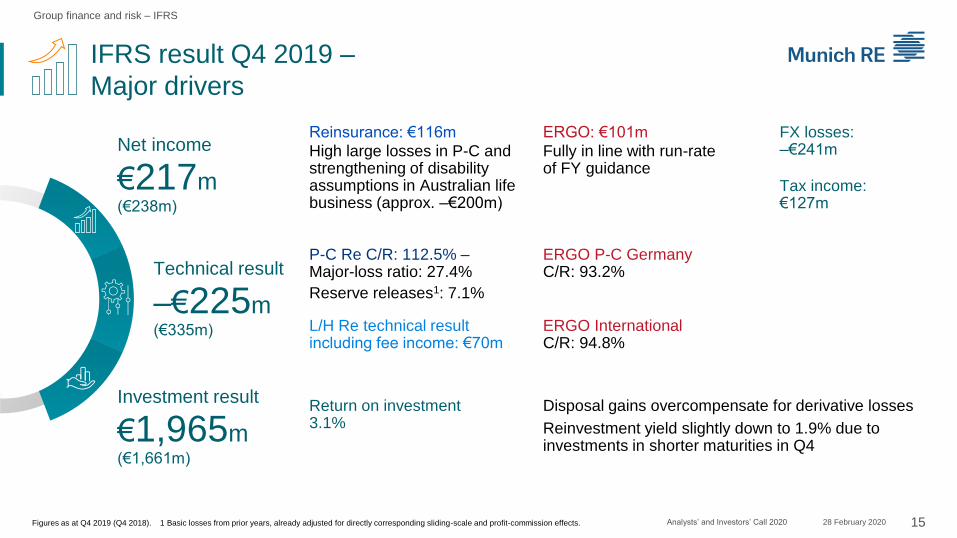
IFRS result Q4 2019 –
Major drivers
Group finance and risk – IFRS
Figures as at Q4 2019 (Q4 2018). 1 Basic losses from prior years, already adjusted for directly corresponding sliding-scale and profit-commission effects.
€217m(€238m)
Net income
–€225m(€335m)
Technical result
€1,965m(€1,661m)
Investment resultReturn on investment 3.1%
Disposal gains overcompensate for derivative losses
Reinvestment yield slightly down to 1.9% due to investments in shorter maturities in Q4
Reinsurance: €116m FX losses: –€241m
ERGO: €101m
High large losses in P-C and strengthening of disability assumptions in Australian life business (approx. –€200m)
Fully in line with run-rate of FY guidance
Tax income: €127m
P-C Re C/R: 112.5% –Major-loss ratio: 27.4%
Reserve releases1: 7.1%
L/H Re technical result including fee income: €70m
ERGO P-C GermanyC/R: 93.2%
ERGO InternationalC/R: 94.8%
28 February 2020

16Analysts’ and Investors’ Call 2020
IFRS result FY 2019 – Operating performance
supported by strong balance sheet
Reserving Investments Taxes
Valuation reserves increased to €33bn
Ongoing prudent setting of reserves
Resilience to adverse development, e.g. US casualty –unchanged reserve strength
ALM and ZZR-driven realisations overcompensate derivate losses from equity-and interest-rate hedging
Some tax releases –tax rate of 15.1%
Ongoing high reserve releases for basic losses –2019: 5.6%
Group finance and risk – IFRS
Strong balance sheet
Earnings supportin 2019
28 February 2020
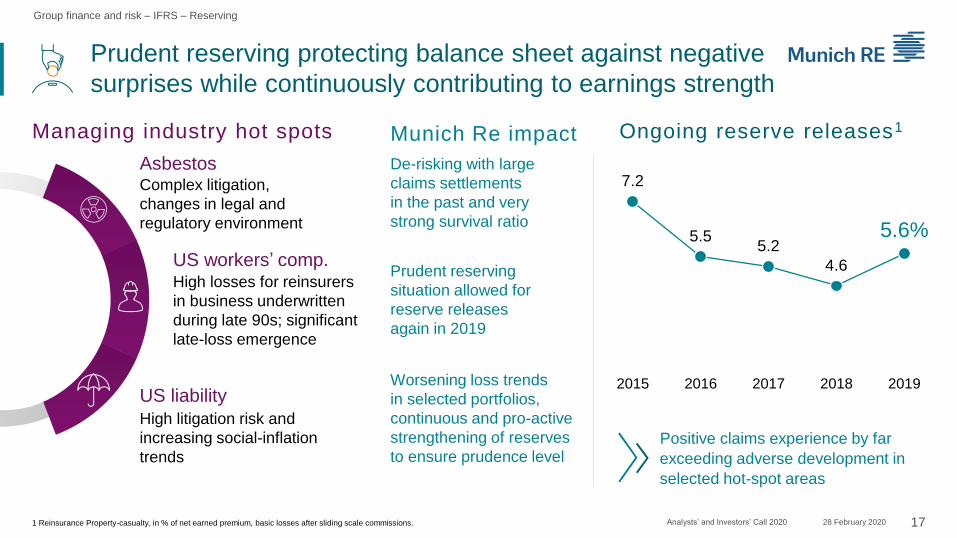
Prudent reserving protecting balance sheet against negative
surprises while continuously contributing to earnings strength
17Analysts’ and Investors’ Call 20201 Reinsurance Property-casualty, in % of net earned premium, basic losses after sliding scale commissions.
Group finance and risk – IFRS – Reserving
AsbestosComplex litigation,
changes in legal and
regulatory environment
US workers’ comp.High losses for reinsurers
in business underwritten
during late 90s; significant
late-loss emergence
US liability
High litigation risk and
increasing social-inflation
trends
Managing industry hot spots Munich Re impact
De-risking with large
claims settlements
in the past and very
strong survival ratio
Prudent reserving
situation allowed for
reserve releases
again in 2019
Worsening loss trends
in selected portfolios,
continuous and pro-active
strengthening of reserves
to ensure prudence level
7.2
5.55.2
4.6
5.6%
2015 2016 2017 2018 2019
Ongoing reserve releases1
Positive claims experience by far
exceeding adverse development in
selected hot-spot areas
28 February 2020

Portfolio
share1
Running
yield1
Fixedincome ~80% ~2.5%
Non-fixed income ~20% ~4.0%
18Analysts’ and Investors’ Call 2020
Investment return – Resilience to
low interest rates expected to persist
1 Munich Re, as at 31.12.2019. 2 Write-ups/write-downs, derivatives, other income/expenses.
Disposal gains
Running yield
Other items2
ZZR financing, prudent ALM
and usual portfolio turnover –
valuation reserves partly realised
Well-balanced, high-quality investment portfolio reduces impairment risk –
ALM-based equity and interest-rate hedges protect against adverse development
RoI
Group finance and risk – IFRS – Investments
Regular
attrition
Negative
impact on
running yield
Expected attrition
~10 bps
Delta reinvestmentand running yield1
Asset duration1
2.8 2.7 2.8 2.8
1.1 1.1 0.71.1
–0.7 –0.6 –0.7 –0.7
3.2% 3.2%2.8%
3.2%
2016 2017 2018 2019
~5bps
~5bps
~60bps 8.4
28 February 2020

€3.8bn –1.3
–1.0
1.5 –0.1 €3.0bn
Distributableearnings
31.12.2018
Dividend Sharebuy-back
HGB result2019
Other Distributableearnings
31.12.2019
8.5
€9.3bn
2018 2019
19Analysts’ and Investors’ Call 2020
German GAAP (HGB) – Capital repatriation well
funded despite decline of distributable earnings
Equalisation provision
HGB result 2018 €bn
2.2
Underwriting result –0.9
Investment result +0.6
Other –0.4
HGB result 2019 1.5
HGB result below capital repatriation
1
1 Changes in restrictions on distribution.
Group finance and risk – HGB
+€0.8bn
28 February 2020
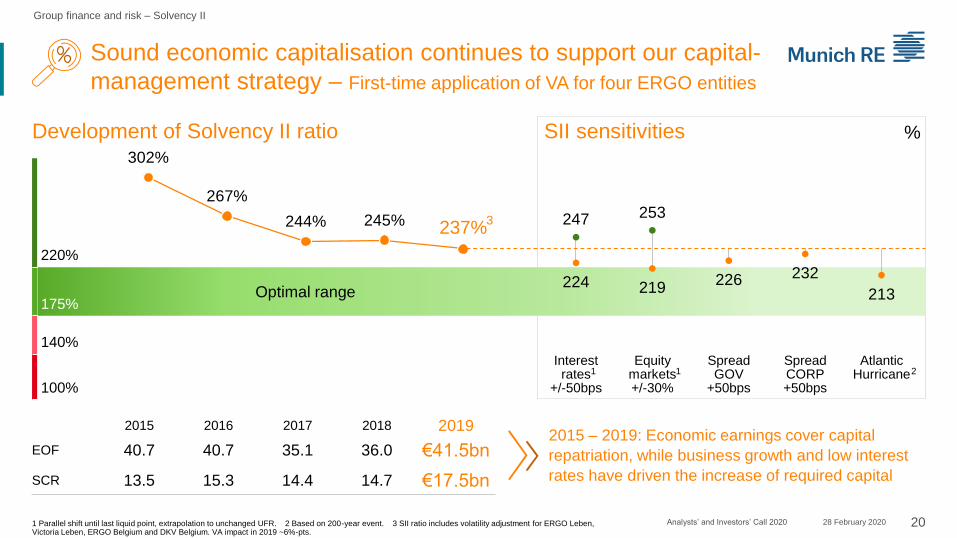
220%
175%
140%
100%
302%
267%
244% 245% 237%
20Analysts’ and Investors’ Call 2020
Sound economic capitalisation continues to support our capital-
management strategy – First-time application of VA for four ERGO entities
Group finance and risk – Solvency II
Optimal range
2015 2016 2017 2018 2019
EOF 40.7 40.7 35.1 36.0 €41.5bn
SCR 13.5 15.3 14.4 14.7 €17.5bn
247 253
224 219226 232
213
Interest rates
+/-50bps
Equity markets+/-30%
Spread GOV
+50bps
Spread CORP +50bps
Atlantic Hurricane
SII sensitivities
1 1 2
2015 – 2019: Economic earnings cover capital
repatriation, while business growth and low interest
rates have driven the increase of required capital
1 Parallel shift until last liquid point, extrapolation to unchanged UFR. 2 Based on 200-year event. 3 SII ratio includes volatility adjustment for ERGO Leben, Victoria Leben, ERGO Belgium and DKV Belgium. VA impact in 2019 ~6%-pts.
Development of Solvency II ratio
3
%
28 February 2020
21Analysts’ and Investors’ Call 2020
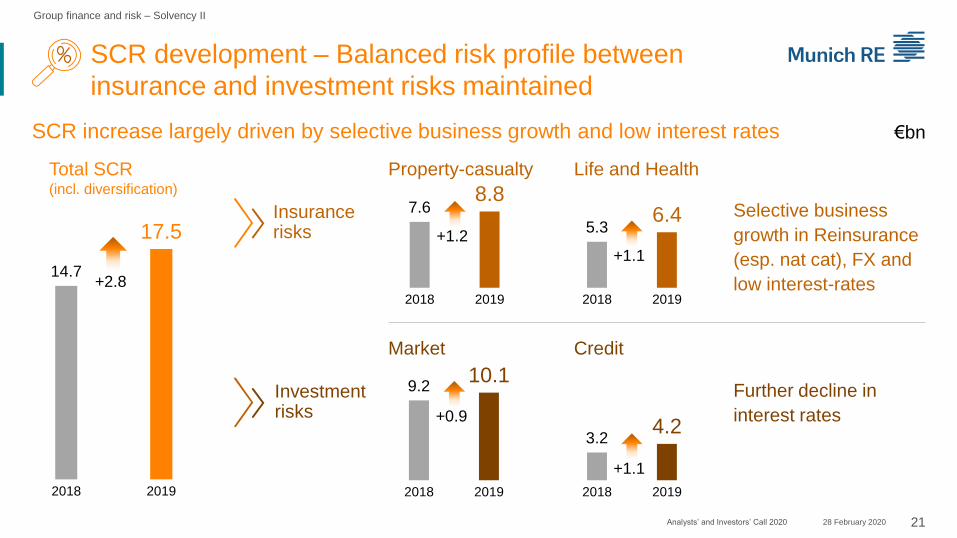
SCR development – Balanced risk profile between
insurance and investment risks maintained
Group finance and risk – Solvency II
Selective business
growth in Reinsurance
(esp. nat cat), FX and
low interest-rates
Further decline in
interest rates
14.7
17.5
2018 2019
Total SCR(incl. diversification)
+2.8
7.68.8
2018 2019
Property-casualty
+1.25.3
6.4
2018 2019
Life and Health
+1.1
9.210.1
2018 2019
Market
+0.9
3.24.2
2018 2019
Credit
+1.1
SCR increase largely driven by selective business growth and low interest rates €bn
Insurance risks
Investment risks
28 February 2020

22Analysts’ and Investors’ Call 20201 Calculation method of shareholders‘ equity based on beginning and end of year (not quarterly averages), adjusted for unrealised gains/losses and including currency translation effects. 2 Further details provided in the backup. 3 E.g. Group project, overhead and innovation costs.
▪ Focus on economic value creation, stronger consideration of IFRS
▪ Some inconsistency of KPIs across segments
▪ IFRS ROE1 to replace external RORAC
▪ Harmonise allocation of admin costs between ERGO and Reinsurance2
Current situation Changes as from Q1 20201
▪ Most peers allocate some costs outside admin costs
▪ Reallocation of some admin costs affecting technical and investment result3
▪ No impact on operating result
▪ P-C Re combined ratio reduces by approx. 0.5%-pt. to ~1%-pt.
▪ Some costs, especially related to Strategy Programme (e.g. project costs) accounted for as non-operating, albeit being rather operating
▪ Allocation of respective costs to other operating result
▪ Decline of operating result, other non-operating result increases accordingly
Selected changes in disclosure as from Q1 2020
to increase comparability across segments and peers
Group finance and risk
Group
Re-insurance
ERGO
28 February 2020

ERGO
3Image: dem10 / iStockphoto Getty Images

Actual
2018
Guidance
2019
Actual
2019
ESP guidance
20202
Total premiums €18.7bn ~€18.5bn1 €18.9bn ~€18.5bn
Net profit €412m ~€400m1 €440m ~€530m
Investments(net, accumulated)
€597m €908m2 €770m €1,008m
Total cost savings(net, accumulated)
€174m €227m2 €234m €279m
Combined ratio
P-C Germany96.0% ~93%1 92.3% 92%
24Analysts’ and Investors’ Call 2020
ERGO Strategy Programme (ESP) –
On track to deliver targets 2020
ERGO
1 From Annual Report 2018. 2 ESP guidance (total premiums adjusted for Munich Health integration and portfolio streamlining). 28 February 2020

25Analysts’ and Investors’ Call 2020
ERGO Strategy Programme –
Progress in focus areas
Germany
▪ Product portfolio optimisation continued,
simplified product approach shows first results
▪ Sales increased by ~6%1; tied-agent
productivity further improved (~18%1,2)
▪ Progress in hybrid customer business model:
▪ ERGO Direkt, ERV and D.A.S. Germany
unified in one brand ERGO; modern
OneWebsite “Ergo.de” launched
▪ Integrated campaigns performed based on
new CRM analytics – leads to tied agents
significantly increased (>230k, +330%1)
▪ Registered customer portal users reached
one million (2018: 900k users)
Digital Ventures
▪ nexible
▪ Growth continued (~62k policies; +23%1;
~100k risks insured)
▪ Focus on process optimization after
successful launch
▪ ERGO Mobility Solutions
▪ Cooperation strategy successfully expanded
▪ SAP platform for B2B2C mobility business
launched
▪ Robotics and Artificial Intelligence (AI):
Process automation scaled up; more than
70 Bots and first AI applications in operation
International
▪ High earnings contribution and profitability in
core markets continued
▪ Top 5 positions in core markets maintained
▪ Footprint in emerging markets expanding,
e.g. regional expansion in China; merger in
India leading to increasing business
opportunities
▪ International portfolio streamlining finalised
while maintaining strong earnings level;
sale of 18 subsidiaries completed3
1 Compared to previous year. 2 ERGO Beratung und Vertrieb only. 3 Thirteen transactions closed.
ERGO
Unlocking further business potential through continued technical integration of products into omni-channel sales system (e.g. health)
Technology
Delivery volume of Digital IT significantly increased while improving efficiency and time-to-market (e.g. OneWebsite, new KPI cockpit for tied agents)
Integrated target IT architecture across ERGO brands currently in implementation
28 February 2020
Group
26Analysts’ and Investors’ Call 2020
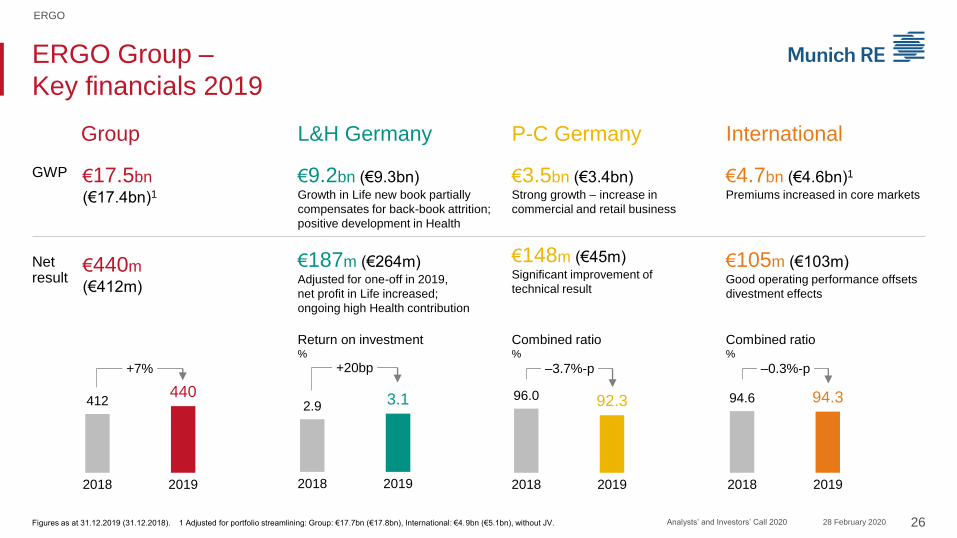
ERGO Group –
Key financials 2019
L&H Germany P-C Germany International
Figures as at 31.12.2019 (31.12.2018). 1 Adjusted for portfolio streamlining: Group: €17.7bn (€17.8bn), International: €4.9bn (€5.1bn), without JV.
ERGO
GWP
Net result
412440
2018 2019
+7%
€17.5bn
(€17.4bn)1
€440m
(€412m)
€9.2bn (€9.3bn)Growth in Life new book partially
compensates for back-book attrition;
positive development in Health
€187m (€264m)Adjusted for one-off in 2019,
net profit in Life increased;
ongoing high Health contribution
€3.5bn (€3.4bn)Strong growth – increase in
commercial and retail business
€148m (€45m)Significant improvement of
technical result
€4.7bn (€4.6bn)1
Premiums increased in core markets
€105m (€103m)Good operating performance offsets
divestment effects
2.9 3.1
2018 2019
+20bp
96.0 92.3
2018 2019
–3.7%-p
94.6 94.3
2018 2019
–0.3%-p
Return on investment%
Combined ratio%
Combined ratio%
28 February 2020
27Analysts’ and Investors’ Call 2020
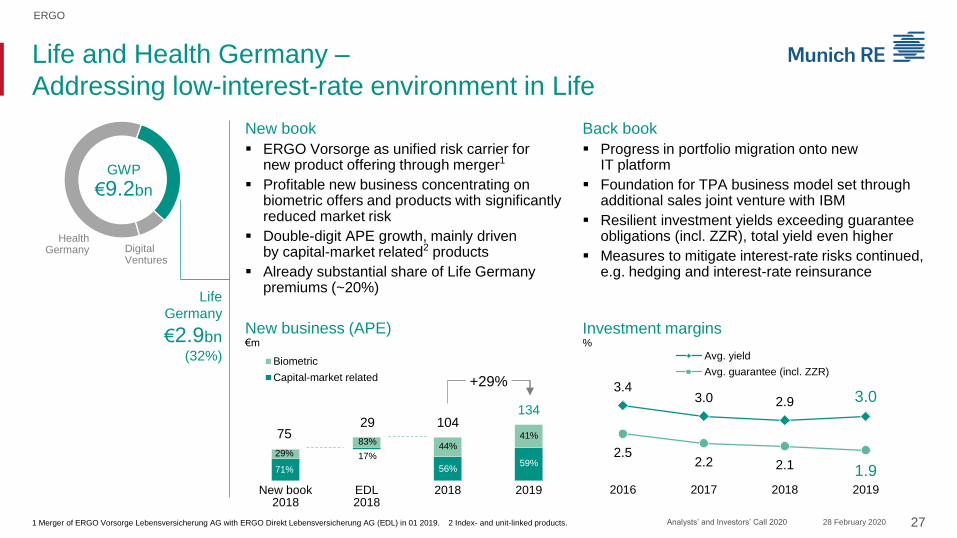
Life and Health Germany –
Addressing low-interest-rate environment in Life
Life
Germany
€2.9bn(32%)
Back book
▪ Progress in portfolio migration onto new IT platform
▪ Foundation for TPA business model set through additional sales joint venture with IBM
▪ Resilient investment yields exceeding guarantee obligations (incl. ZZR), total yield even higher
▪ Measures to mitigate interest-rate risks continued,e.g. hedging and interest-rate reinsurance
Investment margins %
Digital Ventures
HealthGermany
1 Merger of ERGO Vorsorge Lebensversicherung AG with ERGO Direkt Lebensversicherung AG (EDL) in 01 2019. 2 Index- and unit-linked products.
GWP
€9.2bn
New business (APE)€m
ERGO
New book
▪ ERGO Vorsorge as unified risk carrier fornew product offering through merger1
▪ Profitable new business concentrating on biometric offers and products with significantly reduced market risk
▪ Double-digit APE growth, mainly drivenby capital-market related2 products
▪ Already substantial share of Life Germany premiums (~20%)
28 February 2020
New book 2018
EDL2018
2018 2019
Biometric
Capital-market related3.4
3.0 2.9 3.0
2.52.2 2.1 1.9
2016 2017 2018 2019
Avg. yield
Avg. guarantee (incl. ZZR)
134
7529 104
71% 56%59%
41%44%
29%
83%
17%
+29%

28Analysts’ and Investors’ Call 2020
Life and Health Germany –
Maintaining leading positions in Health
Business development on track
▪ Strong and sustainable earnings contribution
▪ Focus on profitable and low-risk supplementary insurance without ageing reserves
▪ Launch of integrated mobile application “Meine DKV”
Health
Germany
€5.6bn1
(60%)
1 Travel included. 2 GWP. 3 Local GAAP for DKV and ERGO Krankenversicherung AG.
Digital Ventures
(thereof Health €0.6bn)
Life Germany
ERGO
Extension of market leading position in supplementary insurance
▪ Market leader with >20% market share2; strong new business development
▪ Expansion in long-term care and dental insurance
▪ Further integration of on- and offline sales channels with positive impact on new business
GWP
€9.2bn
Insured persons (supplementary insurance) 1,000
Business mix (GWP)€bn3
70.2% 69.6% 68.7% 68.0%
29.8% 30.4% 31.3% 32.0%
5.2 5.3 5.4 5.5
2016 2017 2018 2019
Supplementary insuranceComprehensive insurance
28 February 2020
5,084 5,116 5,171 5,231
2016 2017 2018 2019
+3%

3.23.3
3.43.5
2016 2017 2018 2019
29Analysts’ and Investors’ Call 2020
Property-casualty Germany –
Ongoing profitable premium growth
2020 level already almost achieved in 2019
▪ Sustainable improvement in 2019 driven by
▪ Reduction of claims ratio: favourable claims development in basic losses driven by improved underwriting (esp. commercial lines) and claims management (esp. motor) as well as lower nat-cat and man-made losses
▪ Improvement of cost ratio: stable cost development despite strong growth and supported by reduced fixed cost level
▪ Lowest combined ratio since 2011
Motor
ERGO
Business development on track
▪ Strong premium growth in 2019 – increases in commercial and retail
▪ Simplified product approach and process optimisation with first successes:
▪ Successful renewal of new motor insurance – simplified product approach continued with legal protection and business content insurance
▪ Digitalisation of claims processes with focus on speed and improved efficiency in motor completed; customer satisfaction increased
Gross premiums written€bn
9899
96
9392
97.0 97.5
96.0
92.3
2016 2017 2018 2019 2020
ESP guidance
Actual
Combined ratio %
Personal accident
Fire/Property
Liability
OtherTransport/Marine
Legal protection
+3.6%
GWP
€3.5bn
28 February 2020
CAGR +3.1%
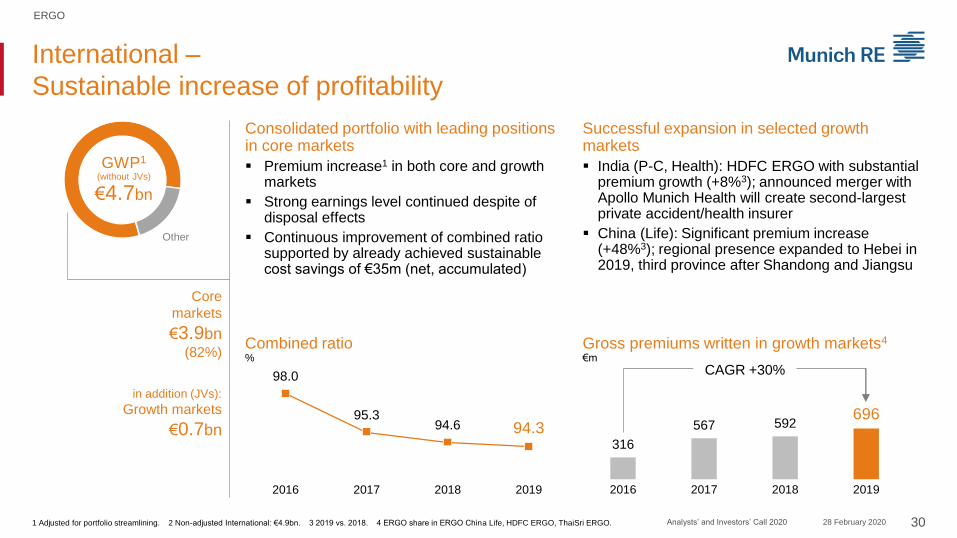
Consolidated portfolio with leading positions in core markets
▪ Premium increase1 in both core and growth markets
▪ Strong earnings level continued despite of disposal effects
▪ Continuous improvement of combined ratio supported by already achieved sustainable cost savings of €35m (net, accumulated)
30Analysts’ and Investors’ Call 2020
International –
Sustainable increase of profitability
Core
markets
€3.9bn(82%)
Other
ERGO
98.0
95.394.6 94.3
2016 2017 2018 2019
Successful expansion in selected growth markets
▪ India (P-C, Health): HDFC ERGO with substantial premium growth (+8%3); announced merger with Apollo Munich Health will create second-largest private accident/health insurer
▪ China (Life): Significant premium increase (+48%3); regional presence expanded to Hebei in 2019, third province after Shandong and Jiangsu
GWP1
(without JVs)
€4.7bn
1 Adjusted for portfolio streamlining. 2 Non-adjusted International: €4.9bn. 3 2019 vs. 2018. 4 ERGO share in ERGO China Life, HDFC ERGO, ThaiSri ERGO.
in addition (JVs):
Growth markets
€0.7bn
Combined ratio%
Gross premiums written in growth markets4
€m
28 February 2020
316
567 592696
2016 2017 2018 2019
CAGR +30%

Reinsurance
4Image: John Lund Getty Images

▪ Sustained favourable reserve development
– releases exceed last year’s level in
absolute and relative terms
▪ Confidence level preserved – showing
resilience as positive claims experience
exceeds adverse development in selected
hot-spot areas
32Analysts’ and Investors’ Call 2020
Property-casualty – Earnings growth
fully supports the 2020 ambition
Reinsurance – Financials 2019
Figures as at 31.12.2019 (31.12.2018). 1 Basic losses from prior years, already adjusted for directly corresponding sliding-scale and profit-commission effects.
▪ Strong volume increase by almost €2bn –
earnings trajectory supported by growth
from renewals and strategic initiatives
▪ Overall sound underlying profitability of
portfolio – comfortably exceeding cost
of capital
▪ High nat cat (esp. typhoons in Japan)
and man-made claims, particularly in Q4
▪ Strong investment result, incl. disposal gains
▪ Normalised for single large events
(e.g. aerospace) positive development
of profitability in Risk Solutions business
▪ Support from low tax expenses
€1,562m (€1,135m)Net result 101.0% (99.4%)
Combined ratio
5.6% (4.6%)Reserve releases1
▪ Major losses (15.2%) above average
▪ Underlying combined ratio ~98–99%,
slightly elevated due to non-outlier losses,
higher admin expenses and cautious
loss picks
28 February 2020

▪ Again high level
▪ Strong traditional business development
in North America and Asia
▪ FinMoRe with ongoing strong demand
33Analysts’ and Investors’ Call 2020
Life and Health – Result below guidance on strain from
Australia – Favourable experience in other markets
Reinsurance – Financials 2019
Figures as at 31.12.2019 (31.12.2018). 1 Incl. Fee income.
▪ On aggregate positive claims experience
▪ Strong contribution from new business and
positive impact from restructuring of certain
large treaties
▪ Negative impact from reserve review in
Australia; overall global reserve position
considered strong
▪ Strain on technical result from restructuring
of asset portfolio in Canada
▪ Positive 2020 outlook: vital new business
proposition and earnings stabilisation from
2019 inforce management and reserve review
€456m (€584m)Technical result1 €706m (€729m)
Netresult
~€1.3bn (€1.1bn)New business contribution
▪ Decline of technical result
▪ High investment result driven by
restructuring of assets in Canada,
overcompensating strain on technical
result
28 February 2020

34Analysts’ and Investors’ Call 2020
Munich Re is well positioned to profitably grow its
core business fields and drive innovation in the industry
Reinsurance
Sustainable new business proposition and active portfolio management
1 Effectively serving our clients and strengthening the business model
2 Reinforcing underlying profitability and growth
3 Building a diversified profit base –shaping and seizing opportunities in the digital transformation of the (re)insurance industry
4
Data-drivensolutions
Expanding theboundaries of insurabilityReshuffling
the valuechain
Trends
Risk Solutions
Reinsurance P-CReinsurance
Life and Health
28 February 2020

35Analysts’ and Investors’ Call 2020
1 Strong footprint in all major markets
Reinsurance Life and Health – Overview of major markets
Gross premiums written 2019 / share of total (core regions).
Asia / MENA (€3.0bn / 26%)
▪ Pleasing development of new business, including vital pipeline of FinMoRe solutions
▪ Substantial share of health reinsurance
▪ Product trends to be monitored closely, particularly in critical illness
Canada (€1.7bn / 14%)
▪ Attractive margins despite competitive environment
▪ Maintain leadership position in traditional business
▪ Develop footprint in Group business
Continental Europe (€1.0bn / 9%)
▪ Sound but stagnating traditional business overall
▪ Demand for tailor-made FinMoRe solutions
Australia (€0.8bn / 7%)
▪ State of disability market remains an area of concern
▪ Strengthening of assumptions reflecting recent experience – in Q4 technical result impact of ~–€200m
▪ Rehabilitation of in-force top priority
▪ Highly selective new business proposition
USA (€2.9bn / 25%)
▪ Solid position among market leaders
▪ Further develop FinMoRebusiness and predictive analytics to foster growth
▪ Attractive risk-return profile of new business
▪ Successful inforcemanagement execution
UK / Ireland (€1.8bn / 15%)
▪ Successful FinMoRe and longevity proposition
▪ Margins in protection business remain unattractive
▪ Organisational set-up ready for Brexit
28 February 2020

36Analysts’ and Investors’ Call 2020
1 Strong new business generation continues –
Portfolio composition fosters steady earnings growth
Growth
Portfolio management
Australian disability portfolio
US pre-2009 mortality block
Leading digital services
New (re-) insurance products
Established growth areas1
Risk-related services
Ambition2
Technical result, incl. fee income
450475
500
2017 2018 2019 2020e
~€550m
1 FinMoRe, Asia, USA, longevity and financial markets. 2 Ambition assumes claims in the range of expectation and no major one-offs from inforce management.
Reinsurance Life and Health – New business
Improves earnings stability
Fundament of earnings generation
Safeguards earnings progress
CoreStrong footprint in
traditional reinsurance
In-depth expertise in risk
assessment and management
28 February 2020

37Analysts’ and Investors’ Call 2020
Market developments Munich Re January renewals
Further improving environment –
uneven distribution across lines
and geographies
Overall price increases over-
compensating loss-trend expectations
Reinsurance Property-casualty – January renewals 2019
2 January renewals 2020 – Overall positive outcome
Positive trends for loss-affected
business and specialty lines
Alternative capital: volume
stagnation – some strain in
retro markets
Primary markets for commercial
single risk and specialty lines
developing favourably
Flat pricing in Asia (ex Japan),
distinct price increases in Europe
Worldwide and North American
business with stronger rate development
Business expansion for selected
markets – top-line growth driven by
specialty lines and Europe/Asia
Actively giving up business not meeting
our criteria, e.g. casualty with US clients
Cautiously optimistic outlook on upcoming treaty renewals
Continued disciplined portfolio management
28 February 2020
38Analysts’ and Investors’ Call 2020
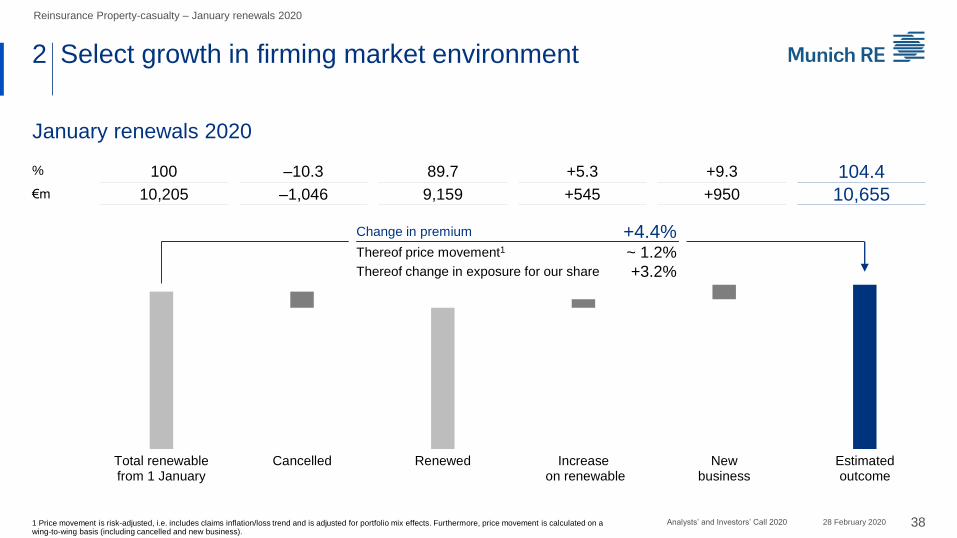
2 Select growth in firming market environment
January renewals 2020
1 Price movement is risk-adjusted, i.e. includes claims inflation/loss trend and is adjusted for portfolio mix effects. Furthermore, price movement is calculated on a wing-to-wing basis (including cancelled and new business).
Reinsurance Property-casualty – January renewals 2020
% 100 –10.3 89.7 +5.3 +9.3 104.4€m 10,205 –1,046 9,159 +545 +950 10,655
Total renewablefrom 1 January
Cancelled Renewed Increase on renewable
Newbusiness
Estimatedoutcome
Change in premium +4.4%Thereof price movement1 ~ 1.2%Thereof change in exposure for our share +3.2%
28 February 2020

France: Successful re-entry and
already ahead of plan, further
strengthened as at 1.1.2020,
now >€300m premiums
Global Clients: Growth in long-
standing relationships, focus on
balanced portfolios and adequate
reflection of client strength
US: Selective expansion in local or
regional business, when pricing and
risk relation deemed good, cautious
on casualty
Japan: Expansion of nat cat
business reacting to increasing
rates in wake of recent typhoons
39Analysts’ and Investors’ Call 2020
2 Growth initiatives gaining traction –
Profitable business expansion
Reinsurance Property-casualty – Strategic initiatives
~99% ~98–99%
Underlying combined ratio
20.422.1
2018 2019
+8%
Gross premiums written1
€bn
F&C: Direct Property and
Energy business seizing
market opportunities to write
more business at hardening
terms and better rates
AMIG: Transformation
efforts bearing fruit and
permitting growth of 17%,
well above market average
Risk Solutions business2
Mature markets2
India: Executing growth strategy
and broadening offer successful,
leading to diversified portfolio
now >€300m premiums
Latin America: Growing in
line with our ambition and
market position with existing
partners and new business
Emerging markets2
1 Compared to previous year. 2 Examples. F&C = Facultative & Corporate.
Expansion of nat cat business
+4% +21% +14%
28 February 2020

40Analysts’ and Investors’ Call 2020
2 Growth areas – Expansion of nat cat business globally,
but locally selective based on risk appetite and terms
Reinsurance Property-casualty – Strategic initiatives
US nat cat
Secondary perils, e.g. wildfire, only written with material price increases, otherwise reduced appetite in reinsurance for US and global clients
US hurricane
Reinsurance with selective increase and opportunities written, e.g. in Florida –also given up business in January renewals, which did not meet expectations
Japan Wind prices better after Jebi and Trami, therefore exposure slightly increased
Caribbean markets
After strong hit in the Bahamas (Dorian), acutely aware of need for appropriate cover, thus willing to accept material price increases
Risk Solutions
Given loss experience 2017–2019, all primary units profiting from the primary market hardening and certain capacity retreat, e.g. F&C direct
28 February 2020
41Analysts’ and Investors’ Call 2020
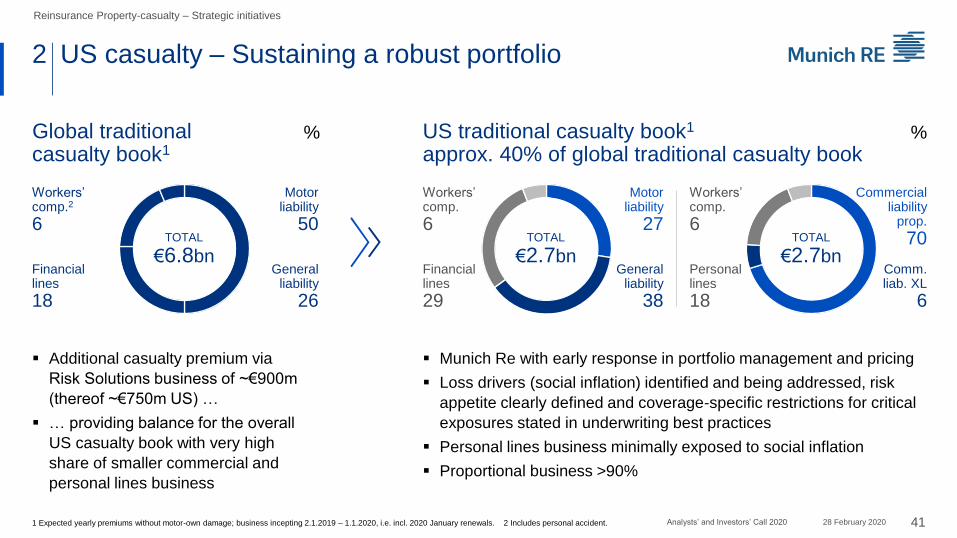
2 US casualty – Sustaining a robust portfolio
TOTAL
€6.8bn
Workers’ comp.2
6
Financiallines
18
General liability
26
Motor liability
50
Global traditional casualty book1
1 Expected yearly premiums without motor-own damage; business incepting 2.1.2019 – 1.1.2020, i.e. incl. 2020 January renewals. 2 Includes personal accident.
▪ Additional casualty premium via
Risk Solutions business of ~€900m
(thereof ~€750m US) …
▪ … providing balance for the overall
US casualty book with very high
share of smaller commercial and
personal lines business
US traditional casualty book1
approx. 40% of global traditional casualty book
TOTAL
€2.7bn
▪ Munich Re with early response in portfolio management and pricing
▪ Loss drivers (social inflation) identified and being addressed, risk
appetite clearly defined and coverage-specific restrictions for critical
exposures stated in underwriting best practices
▪ Personal lines business minimally exposed to social inflation
▪ Proportional business >90%
Workers’ comp.
6
Motor liability
27
Financiallines
29
Generalliability
38
TOTAL
€2.7bn
Workers’comp.
6
Personallines
18
Comm. liab. XL
6
Commercial liability
prop.
70
Reinsurance Property-casualty – Strategic initiatives
% %
28 February 2020
42Analysts’ and Investors’ Call 2020
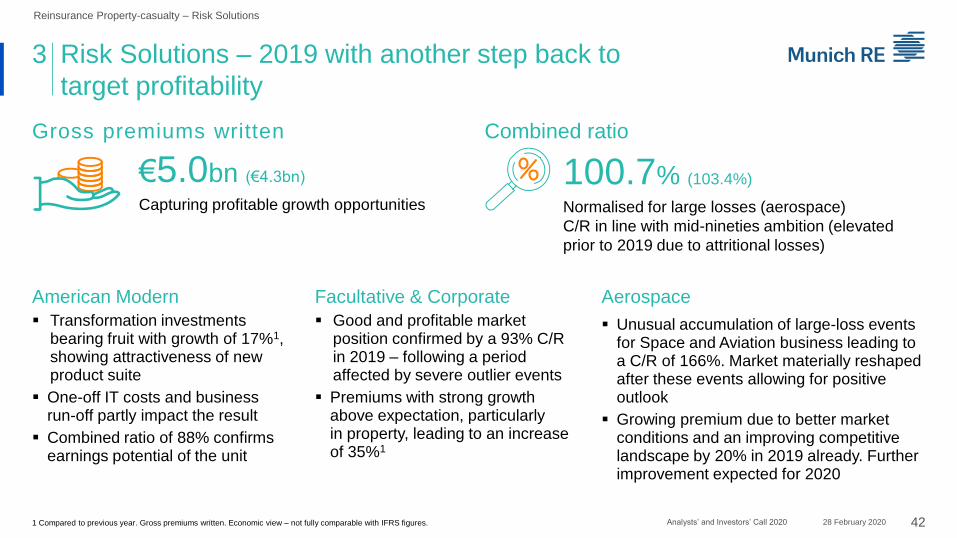
Reinsurance Property-casualty – Risk Solutions
100.7% (103.4%)
Normalised for large losses (aerospace)
C/R in line with mid-nineties ambition (elevated
prior to 2019 due to attritional losses)
€5.0bn (€4.3bn)
Capturing profitable growth opportunities
Gross premiums written Combined ratio
American Modern
▪ Transformation investments bearing fruit with growth of 17%1, showing attractiveness of new product suite
▪ One-off IT costs and business run-off partly impact the result
▪ Combined ratio of 88% confirms earnings potential of the unit
Facultative & Corporate
▪ Good and profitable market position confirmed by a 93% C/R in 2019 – following a period affected by severe outlier events
▪ Premiums with strong growth above expectation, particularly in property, leading to an increase of 35%1
Aerospace
▪ Unusual accumulation of large-loss events for Space and Aviation business leading to a C/R of 166%. Market materially reshaped after these events allowing for positive outlook
▪ Growing premium due to better market conditions and an improving competitive landscape by 20% in 2019 already. Further improvement expected for 2020
3 Risk Solutions – 2019 with another step back to
target profitability
1 Compared to previous year. Gross premiums written. Economic view – not fully comparable with IFRS figures. 28 February 2020
43Analysts’ and Investors’ Call 2020
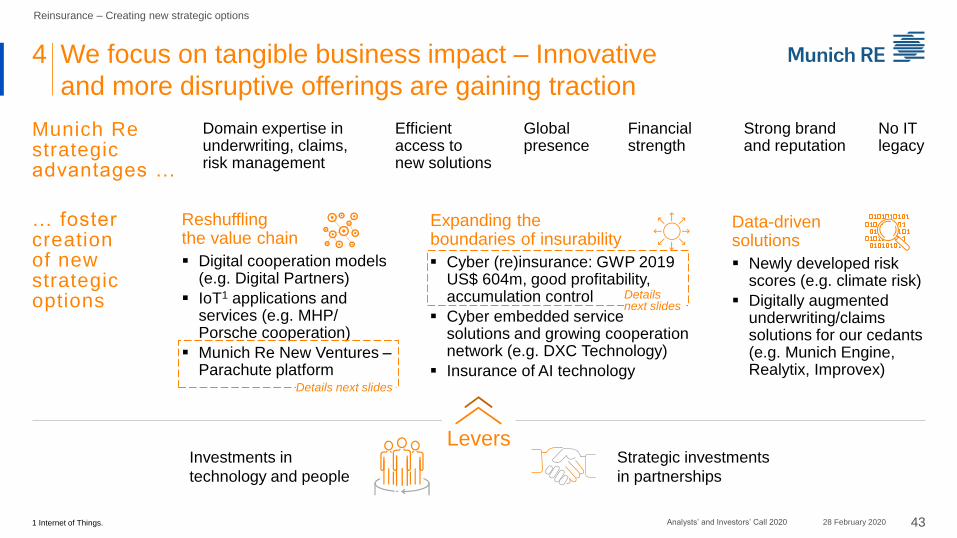
4 We focus on tangible business impact – Innovative
and more disruptive offerings are gaining traction
Reinsurance – Creating new strategic options
Munich Re strategic advantages …
Domain expertise in underwriting, claims, risk management
Strong brand and reputation
No IT legacy
Global presence
Financial strength
Efficient access to new solutions
… foster creation of new strategic options
Reshuffling the value chain
▪ Digital cooperation models (e.g. Digital Partners)
▪ IoT1 applications and services (e.g. MHP/ Porsche cooperation)
▪ Munich Re New Ventures –Parachute platform
Details next slides
Expanding the boundaries of insurability
▪ Cyber (re)insurance: GWP 2019 US$ 604m, good profitability, accumulation control
▪ Cyber embedded service solutions and growing cooperation network (e.g. DXC Technology)
▪ Insurance of AI technology
Data-driven solutions
▪ Newly developed risk scores (e.g. climate risk)
▪ Digitally augmented underwriting/claims solutions for our cedants(e.g. Munich Engine, Realytix, Improvex)
Investments in
technology and people
Strategic investments
in partnerships
Levers
Details next slides
28 February 20201 Internet of Things.
44Analysts’ and Investors’ Call 2020
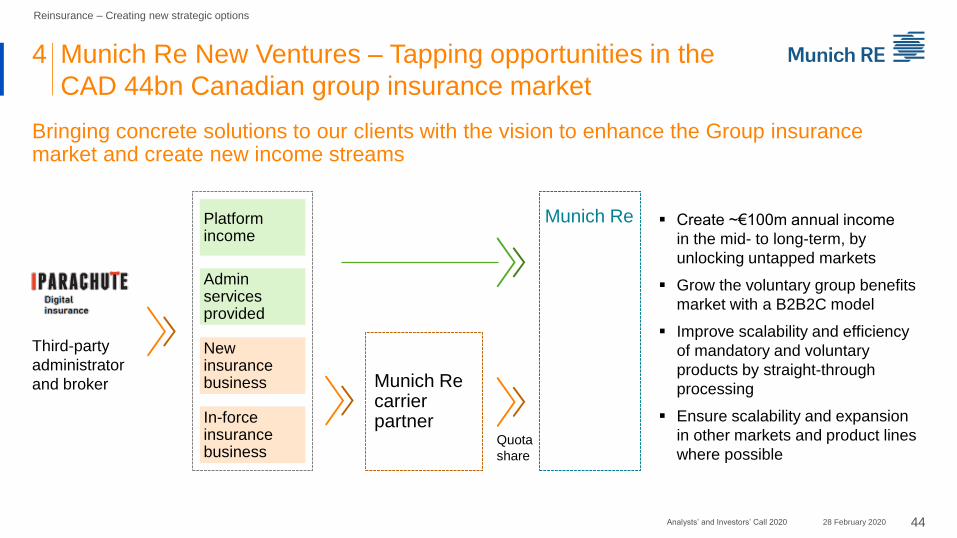
Third-party
administrator
and broker
Platform income
New insurance business
In-force insurance business
Admin services provided
Munich Re carrier partner
Quota
share
Munich Re
4 Munich Re New Ventures – Tapping opportunities in the
CAD 44bn Canadian group insurance market
Reinsurance – Creating new strategic options
Bringing concrete solutions to our clients with the vision to enhance the Group insurance market and create new income streams
▪ Create ~€100m annual income
in the mid- to long-term, by
unlocking untapped markets
▪ Grow the voluntary group benefits
market with a B2B2C model
▪ Improve scalability and efficiency
of mandatory and voluntary
products by straight-through
processing
▪ Ensure scalability and expansion
in other markets and product lines
where possible
28 February 2020

45Analysts’ and Investors’ Call 2020
4 Cyber insurance – Continuously one of
Munich Re’s main strategic growth areas
Reinsurance – Cyber (re)insurance
▪ Early and full commitment to cyber allows us to
shape the market and results in a lead position
▪ Good profitability of the cyber insurance book
▪ Competitive knowledge advantage and further
investments in leading cyber expertise (~100 FTE)
▪ Further establishing relevant and efficient partner-
ships and detecting new distribution channels
▪ Actively addressing the topic silent cyber,
managing our own exposure and creating new
business by supporting clients
▪ Accumulation management is constantly
challenged, further refined and state of the art
Gross premiums written cyber portfolio1
US$ m
▪ Profitable growth in line with strategy and ambition
▪ Cautious participation in a further growing market
balancing growth and stringent risk management –
market share of up to 10%
1 Munich Re Group excl. ERGO
354
473
604
2017 2018 2019
28 February 2020

Additional information
5Image: imaginima / Getty Images
47Analysts’ and Investors’ Call 2020
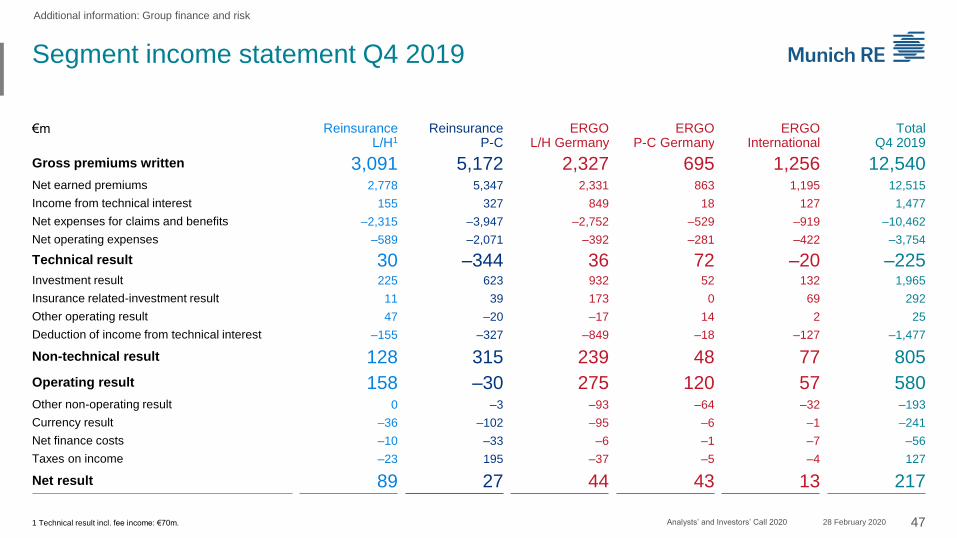
Segment income statement Q4 2019
Additional information: Group finance and risk
€m Reinsurance L/H1
Reinsurance P-C
ERGO L/H Germany
ERGO P-C Germany
ERGO International
TotalQ4 2019
Gross premiums written 3,091 5,172 2,327 695 1,256 12,540Net earned premiums 2,778 5,347 2,331 863 1,195 12,515
Income from technical interest 155 327 849 18 127 1,477
Net expenses for claims and benefits –2,315 –3,947 –2,752 –529 –919 –10,462
Net operating expenses –589 –2,071 –392 –281 –422 –3,754
Technical result 30 –344 36 72 –20 –225Investment result 225 623 932 52 132 1,965
Insurance related-investment result 11 39 173 0 69 292
Other operating result 47 –20 –17 14 2 25
Deduction of income from technical interest –155 –327 –849 –18 –127 –1,477
Non-technical result 128 315 239 48 77 805
Operating result 158 –30 275 120 57 580Other non-operating result 0 –3 –93 –64 –32 –193
Currency result –36 –102 –95 –6 –1 –241
Net finance costs –10 –33 –6 –1 –7 –56
Taxes on income –23 195 –37 –5 –4 127
Net result 89 27 44 43 13 217
1 Technical result incl. fee income: €70m. 28 February 2020

48Analysts’ and Investors’ Call 2020
Segment income statement 2019
Additional information: Group finance and risk
€m Reinsurance L/H1
Reinsurance P-C
ERGO L/H Germany
ERGO P-C Germany
ERGO International
Total2019
Gross premiums written 11,716 22,091 9,238 3,500 4,912 51,457Net earned premiums 10,540 20,566 9,191 3,362 4,621 48,280
Income from technical interest 652 1,215 4,196 75 591 6,729
Net expenses for claims and benefits –8,580 –13,714 –11,701 –2,056 –3,633 –39,685
Net operating expenses –2,283 –7,066 –1,415 –1,077 –1,408 –13,249
Technical result 329 1,000 271 303 171 2,074Investment result 1,080 2,152 3,916 157 430 7,737
Insurance related-investment result 30 65 751 0 330 1,176
Other operating result 62 –238 –61 22 –39 –254
Deduction of income from technical interest –652 –1,215 –4,196 –75 –591 –6,729
Non-technical result 520 763 410 105 131 1,930
Operating result 849 1,764 681 408 302 4,004Other non-operating result –10 –47 –305 –212 –92 –665
Currency result 47 149 –41 –24 –59 73
Net finance costs –39 –128 –23 –5 –27 –222
Taxes on income –142 –176 –127 –19 –19 –483
Net result 706 1,562 187 148 105 2,707
1 Technical result incl. fee income: €456m. 28 February 2020
49Analysts’ and Investors’ Call 2020
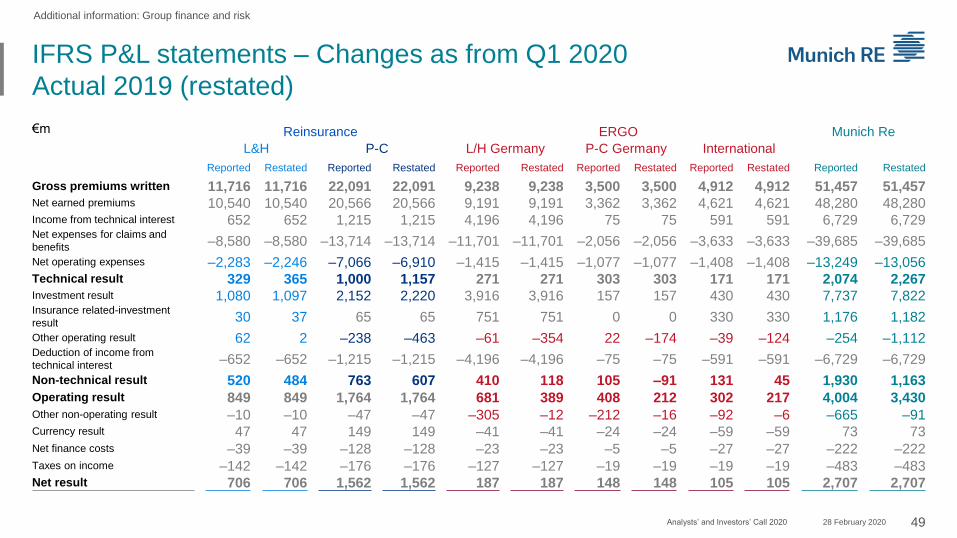
IFRS P&L statements – Changes as from Q1 2020
Actual 2019 (restated)
Additional information: Group finance and risk
€m Reinsurance ERGO Munich Re
L&H P-C L/H Germany P-C Germany International
Reported Restated Reported Restated Reported Restated Reported Restated Reported Restated Reported Restated
Gross premiums written 11,716 11,716 22,091 22,091 9,238 9,238 3,500 3,500 4,912 4,912 51,457 51,457Net earned premiums 10,540 10,540 20,566 20,566 9,191 9,191 3,362 3,362 4,621 4,621 48,280 48,280Income from technical interest 652 652 1,215 1,215 4,196 4,196 75 75 591 591 6,729 6,729Net expenses for claims and
benefits –8,580 –8,580 –13,714 –13,714 –11,701 –11,701 –2,056 –2,056 –3,633 –3,633 –39,685 –39,685
Net operating expenses –2,283 –2,246 –7,066 –6,910 –1,415 –1,415 –1,077 –1,077 –1,408 –1,408 –13,249 –13,056Technical result 329 365 1,000 1,157 271 271 303 303 171 171 2,074 2,267Investment result 1,080 1,097 2,152 2,220 3,916 3,916 157 157 430 430 7,737 7,822Insurance related-investment
result 30 37 65 65 751 751 0 0 330 330 1,176 1,182
Other operating result 62 2 –238 –463 –61 –354 22 –174 –39 –124 –254 –1,112Deduction of income from
technical interest –652 –652 –1,215 –1,215 –4,196 –4,196 –75 –75 –591 –591 –6,729 –6,729
Non-technical result 520 484 763 607 410 118 105 –91 131 45 1,930 1,163Operating result 849 849 1,764 1,764 681 389 408 212 302 217 4,004 3,430Other non-operating result –10 –10 –47 –47 –305 –12 –212 –16 –92 –6 –665 –91Currency result 47 47 149 149 –41 –41 –24 –24 –59 –59 73 73Net finance costs –39 –39 –128 –128 –23 –23 –5 –5 –27 –27 –222 –222Taxes on income –142 –142 –176 –176 –127 –127 –19 –19 –19 –19 –483 –483Net result 706 706 1,562 1,562 187 187 148 148 105 105 2,707 2,707
28 February 2020

50Analysts’ and Investors’ Call 2020
Actual vs. analysts’ consensus
Operating result – Actual vs. analysts’ consensus1 €m Major developments in Q4 2019
Q4 2019 Consensus Delta
Reinsurance Property-casualty –30 251 –281
Reinsurance Life and Health 158 63 95
ERGO Life and Health Germany 275 115 160
ERGO Property-casualty Germany 120 84 36
ERGO International 57 75 –18
Operating result 580 588 –8
FX –241
Other –249
Taxes 127
Net result 217 293 –76
Reinsurance Property-casualty Combined ratio: 112.5% (consensus: 105.1%) – major-loss
ratio: 27.4%, reserve releases basic losses: 7.1%; RoI: 3.8%
Reinsurance Life and HealthTechnical result, incl. fee income of €70m; RoI: 3.1%
ERGO Life and Health GermanyPolicyholder participation in FX result and tax-related positive
one-off; RoI: 2.9%
ERGO Property-casualty Germany Combined ratio: 93.2% (consensus: 94.8%); RoI: 2.8%
ERGO InternationalCombined ratio: 94.8% (consensus: 98.0%); RoI: 2.8%
1 Simple average of estimates the Munich Re Investor Relations team has gathered from analysts covering Munich Re, not taking into account any external data providers.
Additional information: Group finance and risk
28 February 2020
51Analysts’ and Investors’ Call 2020
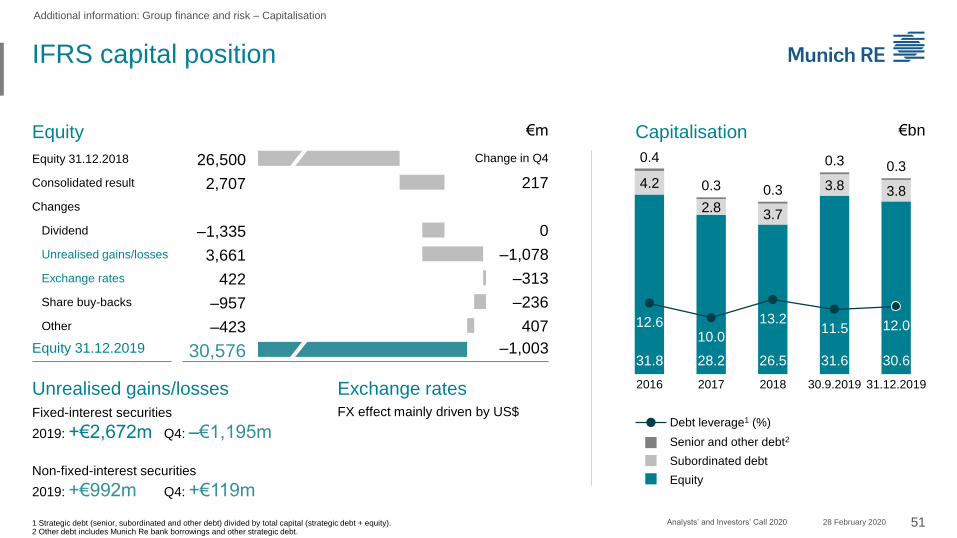
IFRS capital position
Additional information: Group finance and risk – Capitalisation
Equity €m
Subordinated debt
Senior and other debt2
Equity
Capitalisation €bn
1 Strategic debt (senior, subordinated and other debt) divided by total capital (strategic debt + equity). 2 Other debt includes Munich Re bank borrowings and other strategic debt.
Debt leverage1 (%)
31.8 28.2 26.5 31.6 30.6
4.2
2.83.7
3.8 3.8
0.4
0.3 0.3
0.3 0.3
12.610.0
13.211.5 12.0
2016 2017 2018 30.9.2019 31.12.2019
Equity 31.12.2018 26,500 Change in Q4
Consolidated result 2,707 217
Changes
Dividend –1,335 0
Unrealised gains/losses 3,661 –1,078
Exchange rates 422 –313
Share buy-backs –957 –236
Other –423 407
Equity 31.12.2019 30,576 –1,003
Unrealised gains/losses Exchange rates
Fixed-interest securities
2019: +€2,672m Q4: –€1,195m
Non-fixed-interest securities
2019: +€992m Q4: +€119m
FX effect mainly driven by US$
28 February 2020
52Analysts’ and Investors’ Call 2020
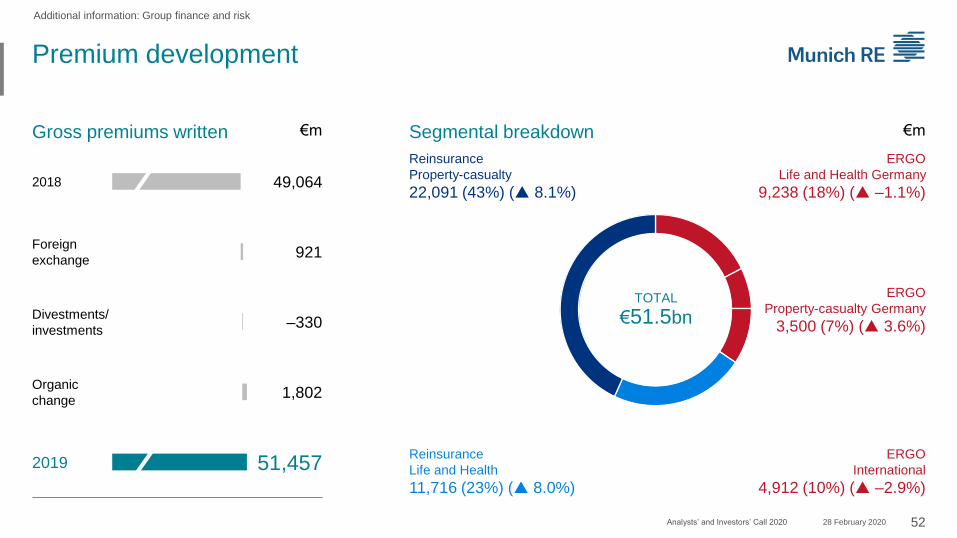
Premium development
Additional information: Group finance and risk
2018 49,064
Foreign
exchange921
Divestments/
investments–330
Organic
change1,802
2019 51,457
Gross premiums written €m Segmental breakdown €m
ERGO
Property-casualty Germany
3,500 (7%) (p 3.6%)
ERGO
Life and Health Germany
9,238 (18%) (p –1.1%)
ERGO
International
4,912 (10%) (p –2.9%)
Reinsurance
Property-casualty
22,091 (43%) (p 8.1%)
Reinsurance
Life and Health
11,716 (23%) (p 8.0%)
TOTAL
€51.5bn
28 February 2020

53Analysts’ and Investors’ Call 2020
Reconciliation of operating result with net result
Additional information: Group finance and risk
Reconciliation of operating result with net result €m
2019 Q4 2019
Operating result 4,004 580
Other non-operating result –665 –193
Currency result 73 –241
Net finance costs –222 –56
Taxes on income –483 127
Net result 2,707 217
Other non-operating result (€m) 2019 Q4 2019
Goodwill impairments –1 0
Restructuring expenses –60 –4
Other –605 –189
Tax rates (%) 2019 Q4 2019
Group 15.1 –139.8
Reinsurance 12.3 307.7
ERGO 27.2 31.4
28 February 2020
54Analysts’ and Investors’ Call 2020
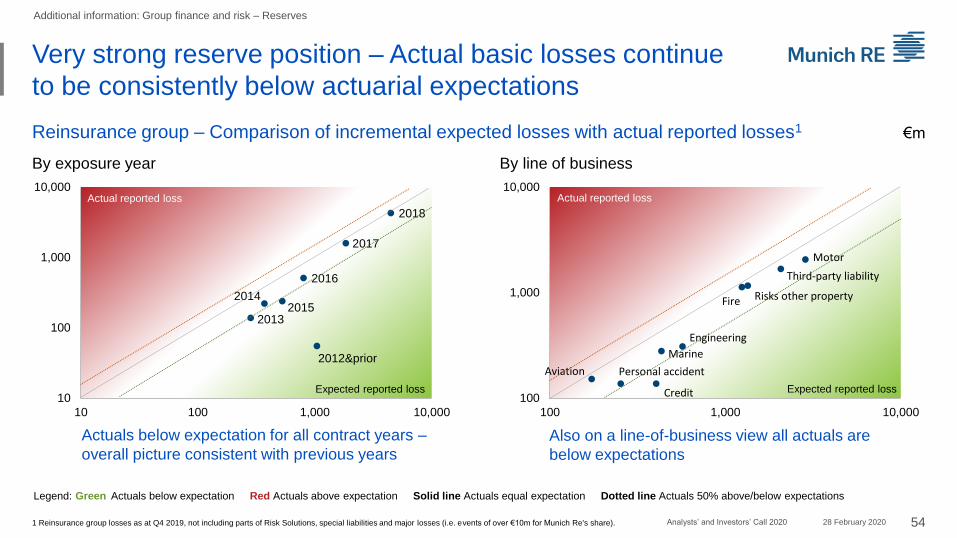
Very strong reserve position – Actual basic losses continue
to be consistently below actuarial expectations
1 Reinsurance group losses as at Q4 2019, not including parts of Risk Solutions, special liabilities and major losses (i.e. events of over €10m for Munich Re's share).
Reinsurance group – Comparison of incremental expected losses with actual reported losses1 €m
Legend: Green Actuals below expectation Red Actuals above expectation Solid line Actuals equal expectation Dotted line Actuals 50% above/below expectations
By exposure year By line of business
2018
2017
2016
20152014
2013
2012&prior
10
100
1,000
10,000
10 100 1,000 10,000
Expected reported loss
Actual reported loss
Aviation
Credit
Engineering
Fire
Marine
Motor
Personal accident
Risks other property
Third-party liability
100
1,000
10,000
100 1,000 10,000
Expected reported loss
Actual reported loss
Actuals below expectation for all contract years –
overall picture consistent with previous years
Also on a line-of-business view all actuals are
below expectations
Additional information: Group finance and risk – Reserves
28 February 2020
55Analysts’ and Investors’ Call 2020
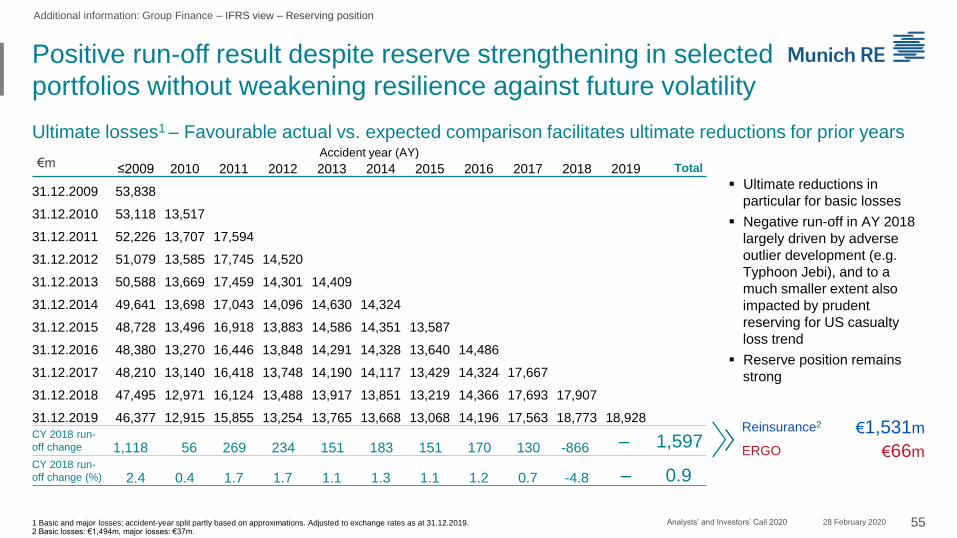
Positive run-off result despite reserve strengthening in selected
portfolios without weakening resilience against future volatility
Additional information: Group Finance – IFRS view – Reserving position
Ultimate losses1 – Favourable actual vs. expected comparison facilitates ultimate reductions for prior years
€mAccident year (AY)
≤2009 2010 2011 2012 2013 2014 2015 2016 2017 2018 2019 Total
31.12.2009 53,838
31.12.2010 53,118 13,517
31.12.2011 52,226 13,707 17,594
31.12.2012 51,079 13,585 17,745 14,520
31.12.2013 50,588 13,669 17,459 14,301 14,409
31.12.2014 49,641 13,698 17,043 14,096 14,630 14,324
31.12.2015 48,728 13,496 16,918 13,883 14,586 14,351 13,587
31.12.2016 48,380 13,270 16,446 13,848 14,291 14,328 13,640 14,486
31.12.2017 48,210 13,140 16,418 13,748 14,190 14,117 13,429 14,324 17,667
31.12.2018 47,495 12,971 16,124 13,488 13,917 13,851 13,219 14,366 17,693 17,907
31.12.2019 46,377 12,915 15,855 13,254 13,765 13,668 13,068 14,196 17,563 18,773 18,928
CY 2018 run-
off change 1,118 56 269 234 151 183 151 170 130 -866 – 1,597CY 2018 run-
off change (%) 2.4 0.4 1.7 1.7 1.1 1.3 1.1 1.2 0.7 -4.8 – 0.9
▪ Ultimate reductions in
particular for basic losses
▪ Negative run-off in AY 2018
largely driven by adverse
outlier development (e.g.
Typhoon Jebi), and to a
much smaller extent also
impacted by prudent
reserving for US casualty
loss trend
▪ Reserve position remains
strong
Reinsurance2 €1,531m
ERGO €66m
1 Basic and major losses; accident-year split partly based on approximations. Adjusted to exchange rates as at 31.12.2019. 2 Basic losses: €1,494m, major losses: €37m.
28 February 2020

56Analysts’ and Investors’ Call 2020
Response to benign emergence of basic losses
in line with considered judgement
Casualty
Specialty1
Property
Actual vs. expected Business rationaleChanges in projection
Reserve release
Reserve release
Releases follow favourable indications
▪ Positive actual-versus-expected indications
▪ Short-tail lines develop relatively quickly
▪ Releases spread across various property lines of business
Small releases despite favourable indications
▪ Deliberately small reserve release, despite favourable
overall actual-versus-expected development
▪ Releases in motor and third-party liability
▪ Cautious reaction to signs of deterioration in selected
casualty portfolios
Favourable loss development leads to release
▪ Favourable indications across all lines
▪ Reserve release primarily in credit and marine
1 Aviation, credit and marine.
Additional information: Group Finance – Reserves – Property-casualty – Reinsurance
Reserve release
28 February 2020
57Analysts’ and Investors’ Call 2020
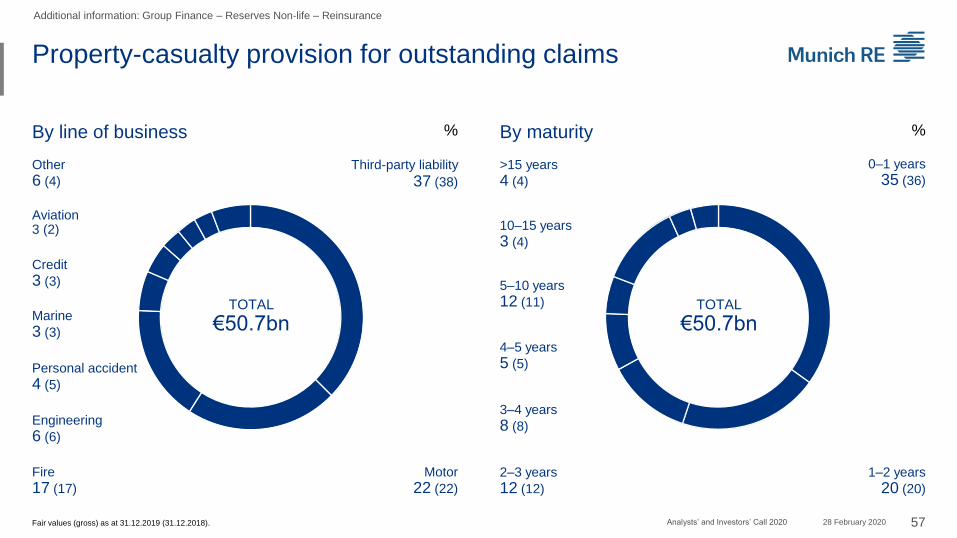
Property-casualty provision for outstanding claims
By line of business
Credit
3 (3)
Other
6 (4)
Third-party liability
37 (38)
Fire
17 (17)
Engineering
6 (6)
Personal accident
4 (5)
Marine
3 (3)
TOTAL
€50.7bn
Motor
22 (22)
Aviation3 (2)
%
Fair values (gross) as at 31.12.2019 (31.12.2018).
By maturity
5–10 years
12 (11)
>15 years
4 (4)
0–1 years
35 (36)
TOTAL
€50.7bn
10–15 years
3 (4)
%
1–2 years
20 (20)
2–3 years
12 (12)
3–4 years
8 (8)
4–5 years
5 (5)
Additional information: Group Finance – Reserves Non-life – Reinsurance
28 February 2020
58Analysts’ and Investors’ Call 2020
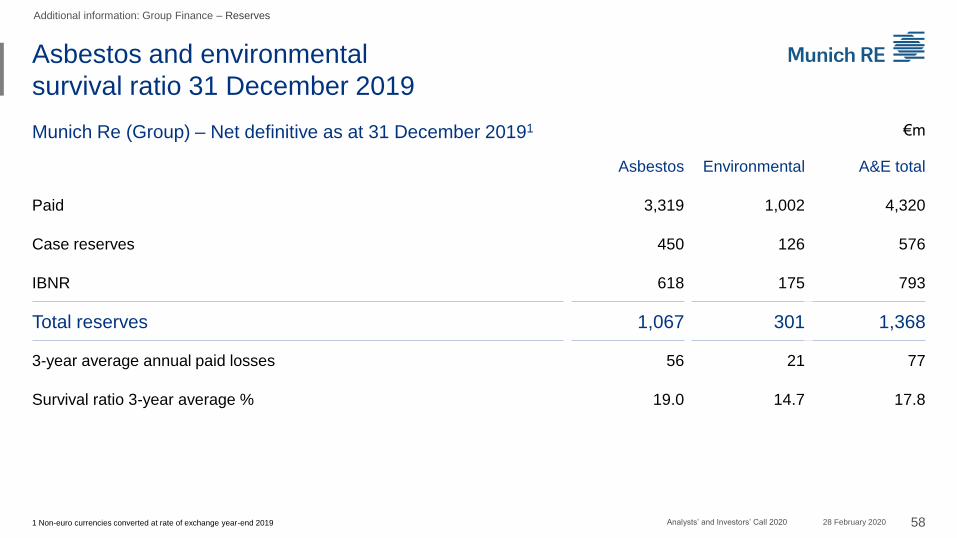
Asbestos and environmental
survival ratio 31 December 2019
Munich Re (Group) – Net definitive as at 31 December 20191 €m
Additional information: Group Finance – Reserves
Asbestos Environmental A&E total
Paid 3,319 1,002 4,320
Case reserves 450 126 576
IBNR 618 175 793
Total reserves 1,067 301 1,368
3-year average annual paid losses 56 21 77
Survival ratio 3-year average % 19.0 14.7 17.8
1 Non-euro currencies converted at rate of exchange year-end 2019 28 February 2020

59Analysts’ and Investors’ Call 2020
Investment result
Additional information: Group finance and risk – Investments
€m Q4 2019 Return1 2019 Return1 2018 Return1
Regular income 1,618 2.6% 6,751 2.8% 6,586 2.8%
Write-ups/write-downs –24 0.0% –309 –0.1% –1,054 –0.5%
Disposal gains/losses 1,108 1.8% 2,779 1.1% 1,582 0.7%
Derivatives2 –509 –0.8% –717 –0.3% 103 0.0%
Other income/expenses –228 –0.4% –767 –0.3% –691 –0.3%
Investment result 1,965 3.1% 7,737 3.2% 6,526 2.8%
Total return –4.9% 7.7% 1.4%
3-month reinvestment yield
Q4 2019 1.9%
Q3 2019 2.1%
Q2 2019 2.2%
Q4 2019
Write-ups/ write-
downs
Disposal gains/ losses
De-rivatives
Fixed income –3 597 –269
Equities –83 500 –268
Commodities/Inflation 7 0 46
Other 55 11 –18
2019
Write-ups/ write-
downs
Disposal gains/ losses
De-rivatives
Fixed income –51 1,530 184
Equities –311 1,037 –927
Commodities/Inflation 70 0 13
Other –18 211 12
1 Annualised return on quarterly weighted investments (market values) in %. Impact from dividends in regular income: 0.2%-points in Q4 and 0.3%-points in Q1-4.2 Result from derivatives without regular income and other income/expenses.
28 February 2020

60Analysts’ and Investors’ Call 2020
Return on investment by asset class and segment2019
Additional information: Group finance and risk – Investments
1 Annualised. 2 Including management expenses.
%1Regular income
Write-ups/-downs
Disposal result
Extraord. derivative result
Other inc./exp. RoI
ᴓ Market value (€m)
Afs fixed-income 2.3 –0.0 1.0 0.0 0.0 3.2 130,076
Afs non-fixed-income 4.1 –1.7 5.7 0.0 0.0 8.1 18,112
Derivatives 6.7 0.0 0.0 –32.9 –1.1 –27.3 2,181
Loans 2.8 –0.0 0.3 0.0 0.0 3.1 65,979
Real estate 4.7 –1.1 1.4 0.0 0.0 5.0 10,899
Other2 3.3 1.0 0.3 0.0 –4.5 0.1 16,416
Total 2.8 –0.1 1.1 –0.3 –0.3 3.2 243,663Reinsurance 2.9 –0.1 1.2 –0.1 –0.4 3.5 91,991
ERGO 2.7 –0.2 1.1 –0.4 –0.3 3.0 151,672
3.6%3.2%
2.7%
3.4%3.1% 3.1%
2.3%
2.9% 2.9% 3.1%3.4% 3.1%
3.1%
Q1 2017 Q2 2017 Q3 2017 Q4 2017 Q1 2018 Q2 2018 Q3 2018 Q4 2018 Q1 2019 Q2 2019 Q3 2019 Q4 2019
Return on investment Average
28 February 2020

61Analysts’ and Investors’ Call 2020
Investment portfolio
Additional information: Group finance and risk – Investments
1 Approximation – not fully comparable with IFRS figures. Fair values as at 31.12.2019 (31.12.2018). 2 Net of hedges: 6.4 (5.2%). 3 Deposits retained on assumed reinsurance, deposits with banks, investment funds (excl. equities), derivatives and investments in renewable energies and gold. 4 Non-fixed derivatives. 5 Non-fixed property funds and non-fixed bond funds
Investment portfolio
TOTAL
€247bn
Miscellaneous3
8.1 (7.7)
Land and buildings
4.7 (4.6)
Shares, equity funds and participating interests2
7.1 (6.2)
%
Miscellaneous %
Fixed-interest securities1
Loans1
Pfandbriefe/Covered bonds
13 (14)
Corporates
18 (17)
Banks
2 (2)
Governments/Semi-government
63 (64)
Structured products
4 (3)
TOTAL
€20bn
%
Fixed-interest securities
53.9 (53.8)
Loans
26.1 (27.7)
%
Deposits on reinsurance
40 (41)
Bank deposits
19 (18)
Investment funds5
11 (10)
Derivatives4
6 (9)
Other
25 (22)
Loans to policyholders/
mortgage loans
13 (12)
Pfandbriefe/Covered bonds
41 (44 )
Banks
1 (2)
Governments/Semi-government
41 (41)
TOTAL
€133bn
TOTAL
€65bnCorporates
4 (2)
Cash/Other
1 (0)
28 February 2020

62Analysts’ and Investors’ Call 2020
Fixed-income portfolioTotal
Additional information: Group finance and risk – Investments
Approximation – not fully comparable with IFRS figures. Fair values as at 31.12.2019 (31.12.2018).
Fixed-income portfolio %
Structured products
2 (2)
Loans to policyholders/ Mortgage loans
4 (4)
Governments/Semi-government
53 (53)
Pfandbriefe/Covered bonds
21 (23)
Cash/Other
5 (5)
Bank bonds
1 (2)
Corporates
13 (12)
TOTAL
€208bn
28 February 2020
63Analysts’ and Investors’ Call 2020
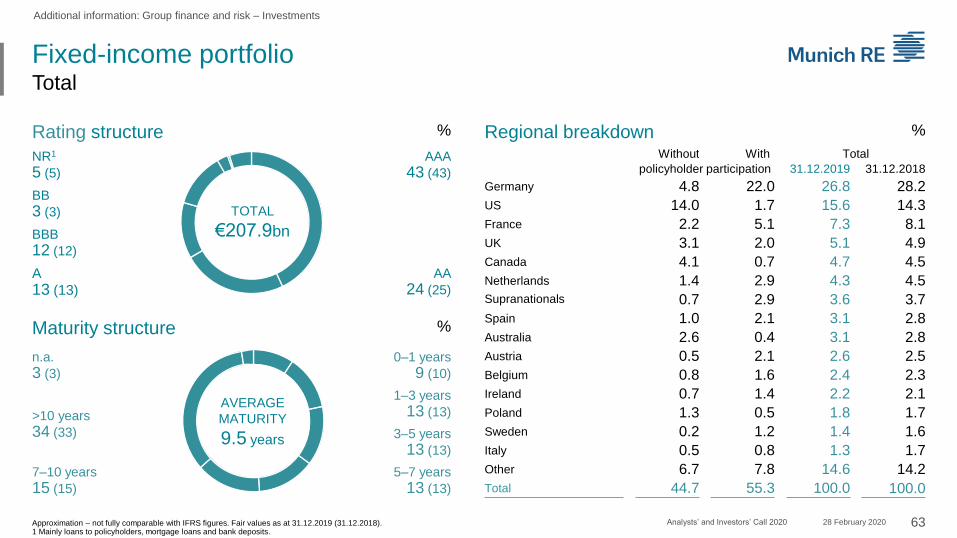
Fixed-income portfolioTotal
Additional information: Group finance and risk – Investments
Rating structure %
Maturity structure
Regional breakdown
TOTAL
€207.9bn
AVERAGE
MATURITY
9.5 years
Without With Total
policyholder participation 31.12.2019 31.12.2018
Germany 4.8 22.0 26.8 28.2
US 14.0 1.7 15.6 14.3
France 2.2 5.1 7.3 8.1
UK 3.1 2.0 5.1 4.9
Canada 4.1 0.7 4.7 4.5
Netherlands 1.4 2.9 4.3 4.5
Supranationals 0.7 2.9 3.6 3.7
Spain 1.0 2.1 3.1 2.8
Australia 2.6 0.4 3.1 2.8
Austria 0.5 2.1 2.6 2.5
Belgium 0.8 1.6 2.4 2.3
Ireland 0.7 1.4 2.2 2.1
Poland 1.3 0.5 1.8 1.7
Sweden 0.2 1.2 1.4 1.6
Italy 0.5 0.8 1.3 1.7
Other 6.7 7.8 14.6 14.2
Total 44.7 55.3 100.0 100.0
A
13 (13)
NR1
5 (5)
BB
3 (3)
BBB
12 (12)
7–10 years
15 (15)
>10 years
34 (33)
n.a.
3 (3)
%
%
AAA
43 (43)
AA
24 (25)
0–1 years
9 (10)
1–3 years
13 (13)
3–5 years
13 (13)
5–7 years
13 (13)
Approximation – not fully comparable with IFRS figures. Fair values as at 31.12.2019 (31.12.2018).1 Mainly loans to policyholders, mortgage loans and bank deposits.
28 February 2020
64Analysts’ and Investors’ Call 2020
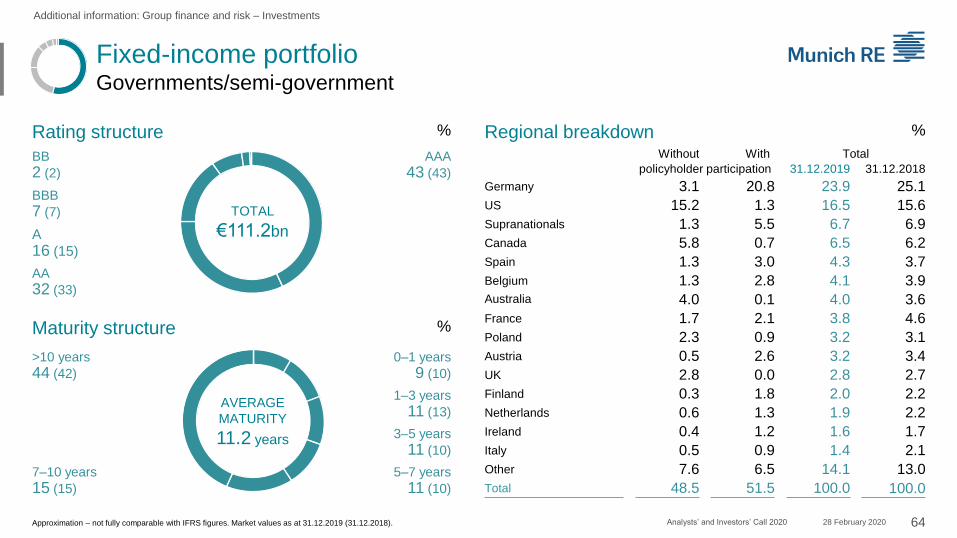
Fixed-income portfolioGovernments/semi-government
Additional information: Group finance and risk – Investments
Rating structure %
Maturity structure
Regional breakdown
BB
2 (2)
BBB
7 (7)
A
16 (15)
AA
32 (33)
7–10 years
15 (15)
>10 years
44 (42)
Without With Total
policyholder participation 31.12.2019 31.12.2018
Germany 3.1 20.8 23.9 25.1
US 15.2 1.3 16.5 15.6
Supranationals 1.3 5.5 6.7 6.9
Canada 5.8 0.7 6.5 6.2
Spain 1.3 3.0 4.3 3.7
Belgium 1.3 2.8 4.1 3.9
Australia 4.0 0.1 4.0 3.6
France 1.7 2.1 3.8 4.6
Poland 2.3 0.9 3.2 3.1
Austria 0.5 2.6 3.2 3.4
UK 2.8 0.0 2.8 2.7
Finland 0.3 1.8 2.0 2.2
Netherlands 0.6 1.3 1.9 2.2
Ireland 0.4 1.2 1.6 1.7
Italy 0.5 0.9 1.4 2.1
Other 7.6 6.5 14.1 13.0
Total 48.5 51.5 100.0 100.0
AVERAGE
MATURITY
11.2 years
TOTAL
€111.2bn
Approximation – not fully comparable with IFRS figures. Market values as at 31.12.2019 (31.12.2018).
AAA
43 (43)
0–1 years
9 (10)
1–3 years
11 (13)
3–5 years
11 (10)
5–7 years
11 (10)
%
%
28 February 2020
65Analysts’ and Investors’ Call 2020
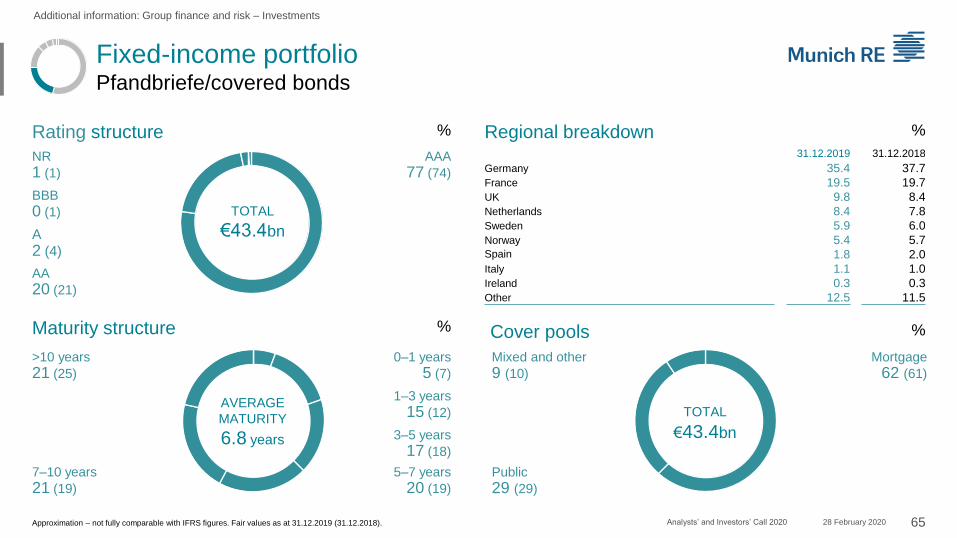
Fixed-income portfolioPfandbriefe/covered bonds
Additional information: Group finance and risk – Investments
Approximation – not fully comparable with IFRS figures. Fair values as at 31.12.2019 (31.12.2018).
Rating structure %
Maturity structure
Regional breakdown
%Cover pools
TOTAL
€43.4bn
Mortgage
62 (61)
Public
29 (29)
Mixed and other
9 (10)
31.12.2019 31.12.2018
Germany 35.4 37.7
France 19.5 19.7
UK 9.8 8.4
Netherlands 8.4 7.8
Sweden 5.9 6.0
Norway 5.4 5.7Spain 1.8 2.0
Italy 1.1 1.0
Ireland 0.3 0.3
Other 12.5 11.5
TOTAL
€43.4bn
NR
1 (1)
BBB
0 (1)
A
2 (4)
AA
20 (21)
AVERAGE
MATURITY
6.8 years
%
%
AAA
77 (74)
0–1 years
5 (7)
1–3 years
15 (12)
3–5 years
17 (18)
5–7 years
20 (19)
7–10 years
21 (19)
>10 years
21 (25)
28 February 2020
66Analysts’ and Investors’ Call 2020
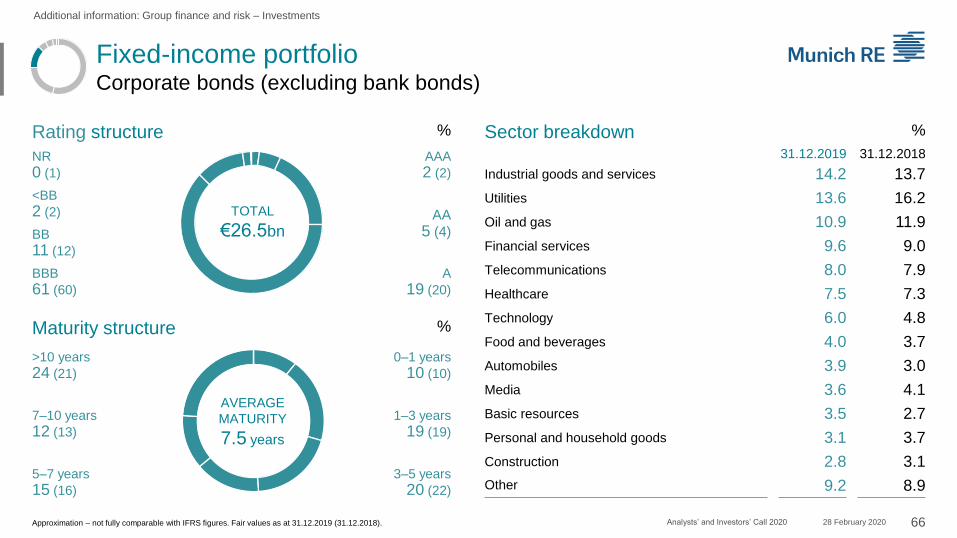
Fixed-income portfolioCorporate bonds (excluding bank bonds)
Additional information: Group finance and risk – Investments
Approximation – not fully comparable with IFRS figures. Fair values as at 31.12.2019 (31.12.2018).
Rating structure %
Maturity structure
Sector breakdown
TOTAL
€26.5bn
NR
0 (1)
<BB
2 (2)
BB
11 (12)
BBB
61 (60)
AVERAGE
MATURITY
7.5 years
>10 years
24 (21)
7–10 years
12 (13)
5–7 years
15 (16)
A
19 (20)
%
%
AA
5 (4)
AAA
2 (2)
3–5 years
20 (22)
1–3 years
19 (19)
0–1 years
10 (10)
31.12.2019 31.12.2018
Industrial goods and services 14.2 13.7
Utilities 13.6 16.2
Oil and gas 10.9 11.9
Financial services 9.6 9.0
Telecommunications 8.0 7.9
Healthcare 7.5 7.3
Technology 6.0 4.8
Food and beverages 4.0 3.7
Automobiles 3.9 3.0
Media 3.6 4.1
Basic resources 3.5 2.7
Personal and household goods 3.1 3.7
Construction 2.8 3.1
Other 9.2 8.9
28 February 2020

67Analysts’ and Investors’ Call 2020
Fixed-income portfolioStructured products
Additional information: Group finance and risk – Investments
Structured products portfolio (at market values): Breakdown by rating and region €m
1 Consumer loans, auto, credit cards, student loans. 2 Asset-backed CPs, business and corporate loans, commercial equipment. Approximation – not fully comparable with IFRS figures. Fair values as at 31.12.2019 (31.12.2018).
Rating Region
Total
Market-to-
parAAA AA A BBB <BBB NR USA + RoW Europe
ABS Consumer-related ABS1 174 80 66 0 0 0 188 133 320 101%
Corporate-related ABS2 0 7 188 40 0 0 32 202 235 100%
Subprime HEL 1 0 0 0 0 0 1 0 1 95%
CDO/
CLNSubprime-related 0 0 0 0 0 0 0 0 0 0%
Non-subprime-related 748 1,359 35 18 0 9 764 1,405 2,169 100%
MBS Agency 1,402 26 0 0 0 0 1,428 0 1,428 104%
Non-agency prime 4 17 1 0 0 0 1 22 23 100%
Non-agency other (not subprime) 101 26 2 0 0 0 18 110 129 100%
Commercial MBS 446 13 11 0 0 0 438 32 470 104%
Total 31.12.2019 2,876 1,527 303 58 0 9 2,870 1,904 4,774 101%
In % 60% 32% 6% 1% 0% 0% 60% 40% 100%
Total 31.12.2018 2,217 1,264 378 89 0 0 2,107 1,840 3,947 100%
28 February 2020
68Analysts’ and Investors’ Call 2020
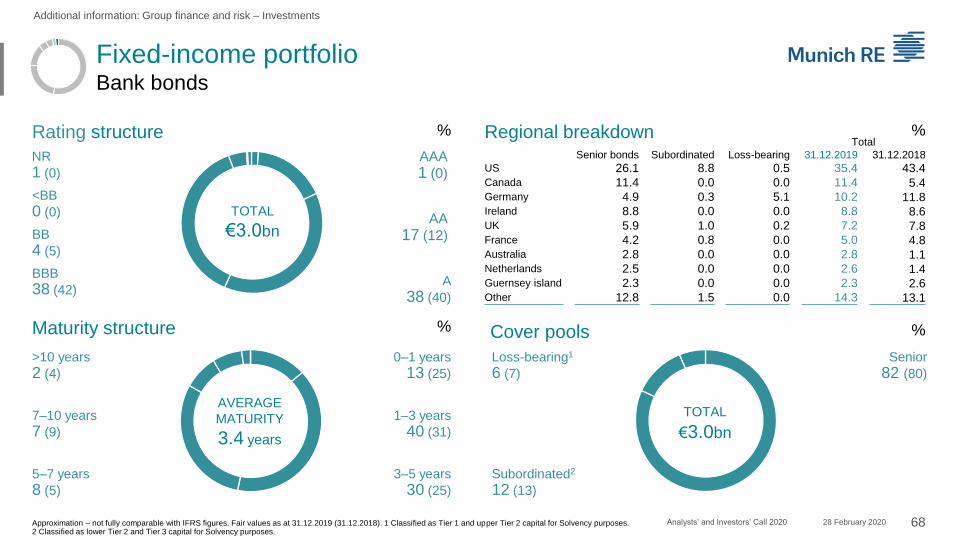
Fixed-income portfolioBank bonds
Additional information: Group finance and risk – Investments
Rating structure %
Maturity structure
Regional breakdown
%Cover pools
TOTAL
€3.0bn
NR
1 (0)
<BB
0 (0)
BB
4 (5)
BBB
38 (42)
AVERAGE
MATURITY
3.4 years
>10 years
2 (4)
7–10 years
7 (9)
5–7 years
8 (5)
A
38 (40)
%
%
AA
17 (12)
AAA
1 (0)
3–5 years
30 (25)
1–3 years
40 (31)
0–1 years
13 (25)
Total
Senior bonds Subordinated Loss-bearing 31.12.2019 31.12.2018
US 26.1 8.8 0.5 35.4 43.4Canada 11.4 0.0 0.0 11.4 5.4Germany 4.9 0.3 5.1 10.2 11.8Ireland 8.8 0.0 0.0 8.8 8.6UK 5.9 1.0 0.2 7.2 7.8France 4.2 0.8 0.0 5.0 4.8Australia 2.8 0.0 0.0 2.8 1.1Netherlands 2.5 0.0 0.0 2.6 1.4Guernsey island 2.3 0.0 0.0 2.3 2.6Other 12.8 1.5 0.0 14.3 13.1
TOTAL
€3.0bn
Senior
82 (80)
Subordinated2
12 (13)
Loss-bearing1
6 (7)
28 February 2020Approximation – not fully comparable with IFRS figures. Fair values as at 31.12.2019 (31.12.2018). 1 Classified as Tier 1 and upper Tier 2 capital for Solvency purposes. 2 Classified as lower Tier 2 and Tier 3 capital for Solvency purposes.

69Analysts’ and Investors’ Call 2020
Sensitivities to interest rates, spreads and equity markets
Additional information: Group finance and risk – Investments
1 Rough calculation with limited reliability assuming unchanged portfolio as at 31.12.2019. After rough estimation of policyholder participation and deferred tax; linearity of relations cannot be assumed. Approximation – not fully comparable with IFRS figures. 2 Sensitivities to changes of spreads are calculated for every category of fixed-interest securities, except government securities with AAA ratings. 3 Worst-case scenario assumed, including commodities: impairment as soon as market value is below acquisition cost. Approximation – not fully comparable with IFRS figures.
Sensitivity to risk-free interest rates – Basis points –50 –25 +50 +100
Change in gross market value (€bn) +9.1 +4.4 –8.3 –15.7
Change in on-balance-sheet reserves, net (€bn)1 +2.3 +1.1 –2.1 –4.1
Change in off-balance-sheet reserves, net (€bn)1 +0.4 +0.2 –0.4 –0.7
P&L impact (€bn)1 +0.2 +0.1 –0.2 –0.4
Sensitivity to spreads2 (change in basis points) +50 +100
Change in gross market value (€bn) –6.0 –11.3
Change in on-balance-sheet reserves, net (€bn)1 –1.4 –2.8
Change in off-balance-sheet reserves, net (€bn)1 –0.3 –0.5
P&L impact (€bn)1 –0.1 –0.2
Sensitivity to equity and commodity markets3 –30% –10% +10% +30%
Change in gross market value (€bn) –6.0 –2.0 +2.0 +6.2
Change in on-balance-sheet reserves, net (€bn)1 –1.4 –0.6 +0.9 +2.7
Change in off-balance-sheet reserves, net (€bn)1 –1.1 –0.4 +0.4 +1.3
P&L impact (€bn)1 –1.5 –0.3 –0.0 +0.1
28 February 2020
70Analysts’ and Investors’ Call 2020
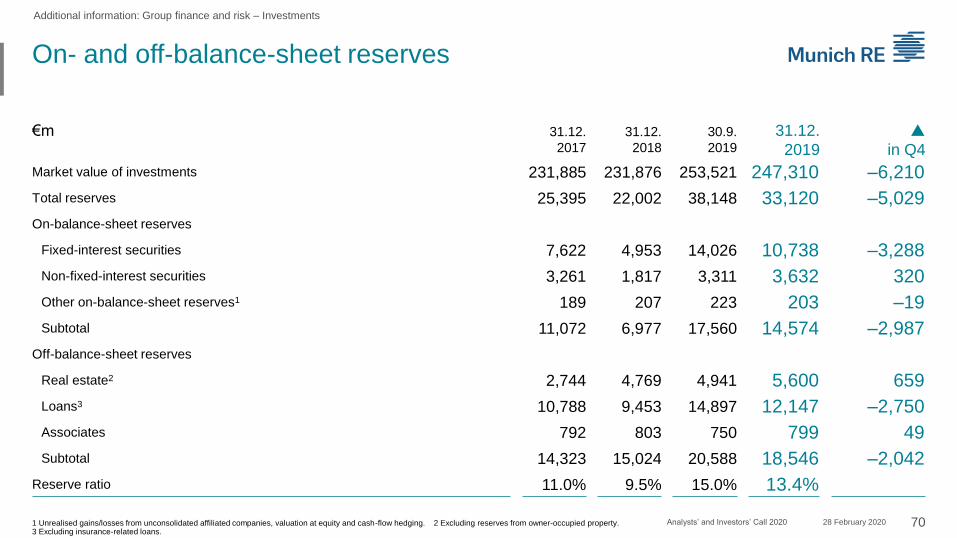
On- and off-balance-sheet reserves
Additional information: Group finance and risk – Investments
1 Unrealised gains/losses from unconsolidated affiliated companies, valuation at equity and cash-flow hedging. 2 Excluding reserves from owner-occupied property. 3 Excluding insurance-related loans.
€m 31.12.
2017
31.12.
2018
30.9.
2019
31.12.
2019
p
in Q4
Market value of investments 231,885 231,876 253,521 247,310 –6,210
Total reserves 25,395 22,002 38,148 33,120 –5,029
On-balance-sheet reserves
Fixed-interest securities 7,622 4,953 14,026 10,738 –3,288
Non-fixed-interest securities 3,261 1,817 3,311 3,632 320
Other on-balance-sheet reserves1 189 207 223 203 –19
Subtotal 11,072 6,977 17,560 14,574 –2,987
Off-balance-sheet reserves
Real estate2 2,744 4,769 4,941 5,600 659
Loans3 10,788 9,453 14,897 12,147 –2,750
Associates 792 803 750 799 49
Subtotal 14,323 15,024 20,588 18,546 –2,042
Reserve ratio 11.0% 9.5% 15.0% 13.4%
28 February 2020

71Analysts’ and Investors’ Call 2020
On- and off-balance-sheet reserves
Additional information: Group finance and risk – Investments
1 Excluding reserves for owner-occupied property and insurance-related loans.
€m On-balance-sheet reserves Off-balance-sheet reserves1
Total reserves (gross) 14,574 18,546
Provision for deferred premium refunds –6,200 –10,861
Deferred tax –1,782 –2,348
Minority interests –7 0
Consolidation and currency effects –206 0
Shareholders' stake 6,379 5,338
28 February 2020
72Analysts’ and Investors’ Call 2020
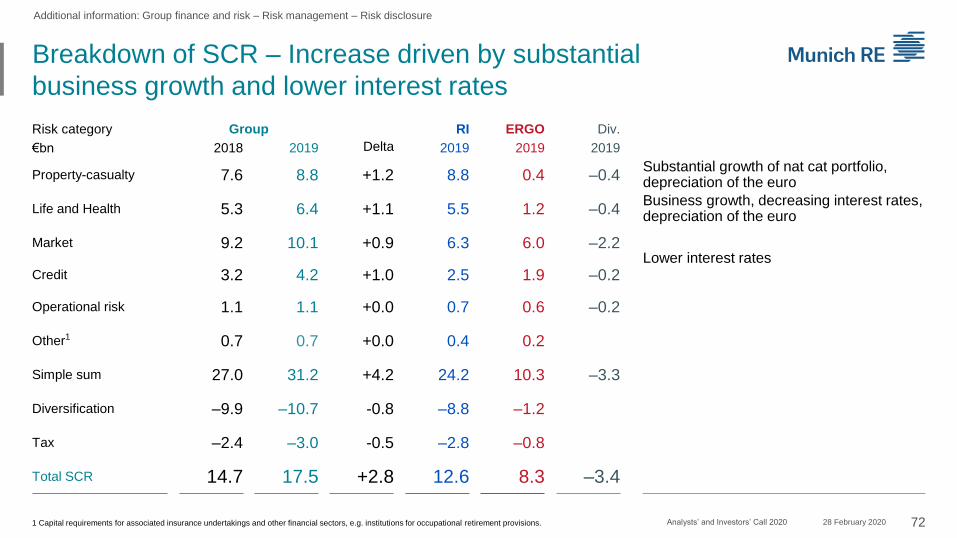
Breakdown of SCR – Increase driven by substantial
business growth and lower interest rates
Additional information: Group finance and risk – Risk management – Risk disclosure
1 Capital requirements for associated insurance undertakings and other financial sectors, e.g. institutions for occupational retirement provisions.
Risk category Group
Delta
RI ERGO Div.
€bn 2018 2019 2019 2019 2019
Property-casualty 7.6 8.8 +1.2 8.8 0.4 –0.4Substantial growth of nat cat portfolio, depreciation of the euro
Life and Health 5.3 6.4 +1.1 5.5 1.2 –0.4Business growth, decreasing interest rates, depreciation of the euro
Market 9.2 10.1 +0.9 6.3 6.0 –2.2Lower interest rates
Credit 3.2 4.2 +1.0 2.5 1.9 –0.2
Operational risk 1.1 1.1 +0.0 0.7 0.6 –0.2
Other1 0.7 0.7 +0.0 0.4 0.2
Simple sum 27.0 31.2 +4.2 24.2 10.3 –3.3
Diversification –9.9 –10.7 -0.8 –8.8 –1.2
Tax –2.4 –3.0 -0.5 –2.8 –0.8
Total SCR 14.7 17.5 +2.8 12.6 8.3 –3.4
28 February 2020

1
2
3
4
5
6
73Analysts’ and Investors’ Call 2020
Property-casualty risk – Increase mainly driven by
business growth in P-C Reinsurance
Top scenario exposures (net of retrocession) – AggVaR1
▪ Exploiting opportunities in an improving market
environment – exposure growth in all major scenarios in
accordance with higher risk-bearing capacity (strongly
increased EOF)
▪ Additional exposure expansion due to depreciation of euro
▪ Well-diversified cat portfolio across perils and regions
1 Munich Re. Return period 200 years, pre-tax. 2 Natural catastrophes, man-made (including terrorism and casualty accumulations) and major single losses.
€bn €bn 2019 2018
Basic losses 4.0
Major losses2 7.1
Diversification –3.5
Total 7.6
Top exposures
1 Atlantic Hurricane
2 Earthquake North America
3 Earthquake Japan
4 Storm Europe
5 IT-Virus
1 2 3 4 5 6 7 8 9 10 11 12 13 14 15
2019 2018
Additional information: Group finance and risk – Risk management – Solvency II
4.0
8.3
–3.5
8.8
28 February 2020
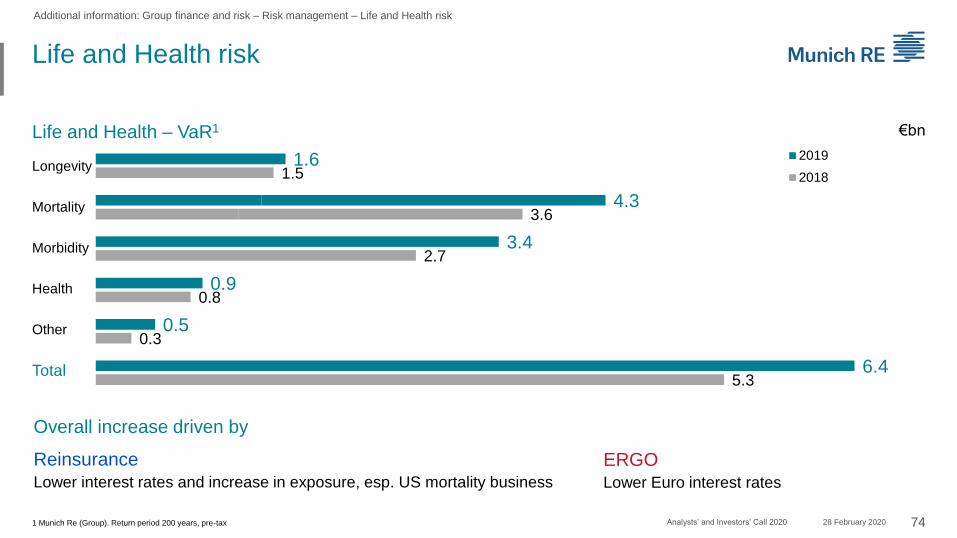
74Analysts’ and Investors’ Call 2020
Life and Health risk
Additional information: Group finance and risk – Risk management – Life and Health risk
1 Munich Re (Group). Return period 200 years, pre-tax
Life and Health – VaR1 €bn
Longevity
Mortality
Morbidity
Health
Other
Total
Overall increase driven by
ReinsuranceLower interest rates and increase in exposure, esp. US mortality business
1.61.5
4.33.6
3.42.7
0.90.8
0.50.3
6.45.3
2019
2018
ERGOLower Euro interest rates
28 February 2020
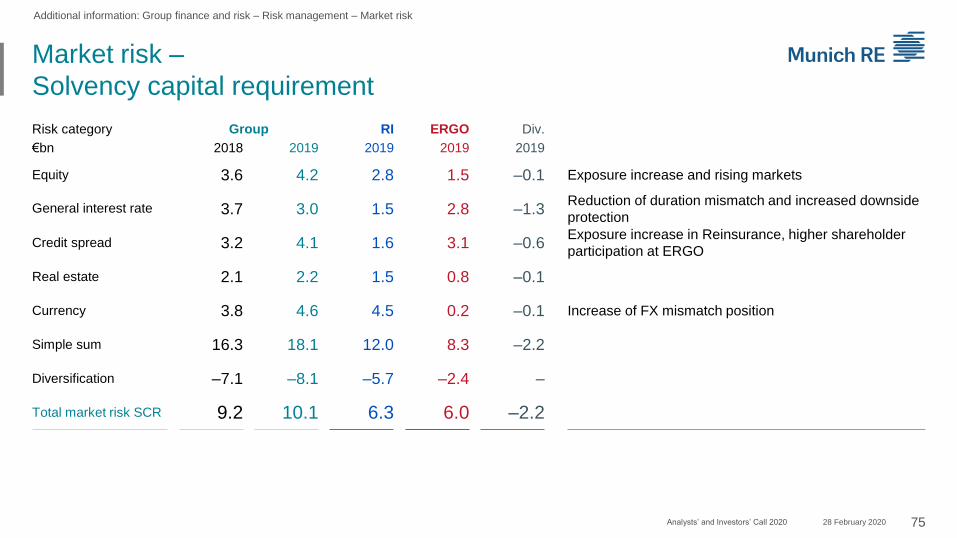
75Analysts’ and Investors’ Call 2020
Market risk –
Solvency capital requirement
Additional information: Group finance and risk – Risk management – Market risk
Risk category Group RI ERGO Div.
€bn 2018 2019 2019 2019 2019
Equity 3.6 4.2 2.8 1.5 –0.1 Exposure increase and rising markets
General interest rate 3.7 3.0 1.5 2.8 –1.3Reduction of duration mismatch and increased downside
protection
Credit spread 3.2 4.1 1.6 3.1 –0.6Exposure increase in Reinsurance, higher shareholder
participation at ERGO
Real estate 2.1 2.2 1.5 0.8 –0.1
Currency 3.8 4.6 4.5 0.2 –0.1 Increase of FX mismatch position
Simple sum 16.3 18.1 12.0 8.3 –2.2
Diversification –7.1 –8.1 –5.7 –2.4 –
Total market risk SCR 9.2 10.1 6.3 6.0 –2.2
28 February 2020
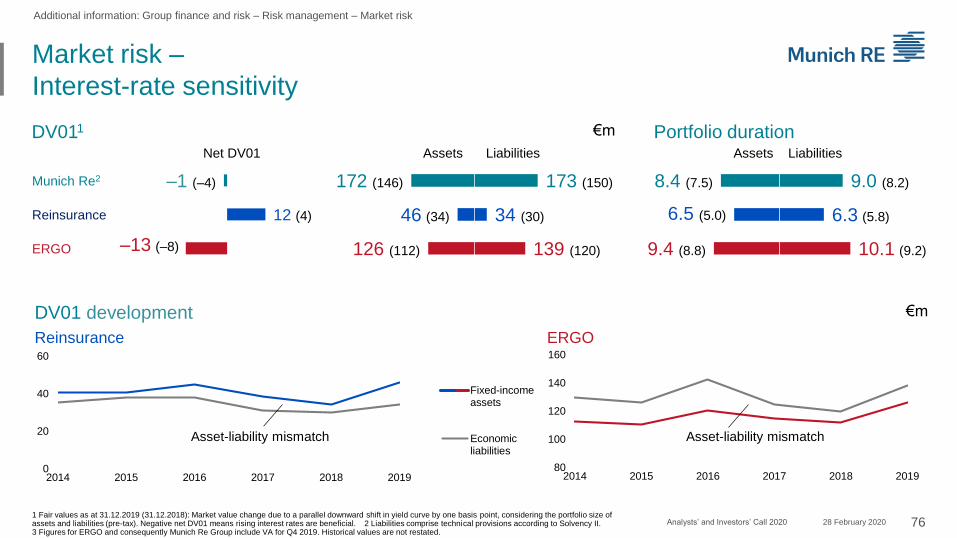
76Analysts’ and Investors’ Call 2020
Market risk –
Interest-rate sensitivity
Additional information: Group finance and risk – Risk management – Market risk
Munich Re2
Reinsurance
ERGO
Assets Liabilities
8.4 (7.5)
6.5 (5.0)
9.4 (8.8)
9.0 (8.2)
6.3 (5.8)
10.1 (9.2)
Assets Liabilities
172 (146)
46 (34)
126 (112)
173 (150)
34 (30)
139 (120)
Portfolio durationDV011 €m
Net DV01
–13 (–8)
12 (4)
–1 (–4)
1 Fair values as at 31.12.2019 (31.12.2018): Market value change due to a parallel downward shift in yield curve by one basis point, considering the portfolio size of assets and liabilities (pre-tax). Negative net DV01 means rising interest rates are beneficial. 2 Liabilities comprise technical provisions according to Solvency II. 3 Figures for ERGO and consequently Munich Re Group include VA for Q4 2019. Historical values are not restated.
Reinsurance ERGO
DV01 development €m
80
100
120
140
160
2014 2015 2016 2017 2018 20190
20
40
60
2014 2015 2016 2017 2018 2019
Fixed-incomeassets
Economicliabilities
Asset-liability mismatch Asset-liability mismatch
28 February 2020

0
100
200
300
400
500
1 2 3
77Analysts’ and Investors’ Call 2020
Operational risk
Additional information: Group finance and risk – Risk management – Operational risk
Internal control system implemented to actively manage
operational risks for Munich Re (Group)
Integral part of the internal model
1 Scenarios at field-of-business level, before diversification. 2 Listed are the first-level categories according to the standard of Operational Risk Consortium.
Operational risk scenarios1 – VaR €m
1 Inappropriate financial reporting RI
(misreporting, erroneous tax statement)
2 Inappropriate financial reporting ERGO
3 Product flaws RI
Top exposures2
Overall no changes to quantitative assessment
28 February 2020
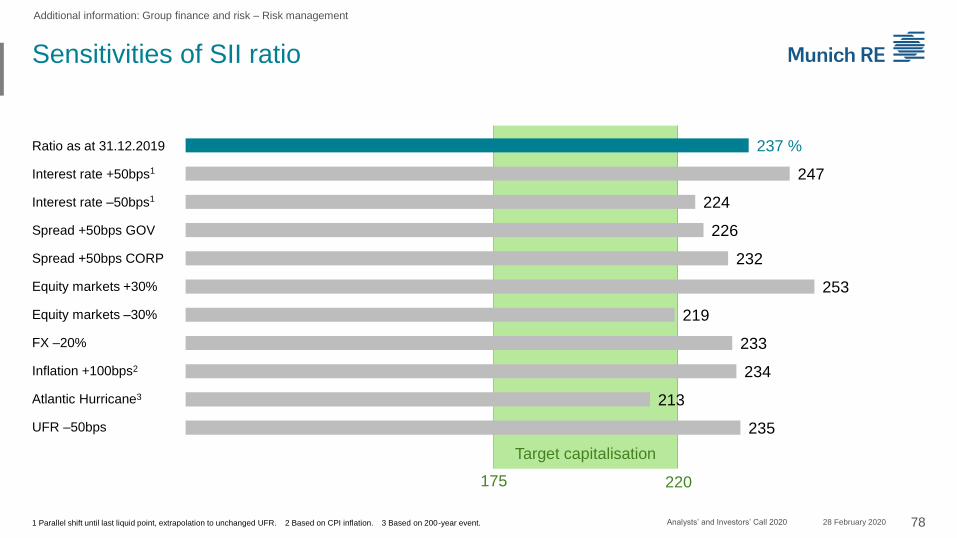
78Analysts’ and Investors’ Call 2020
Sensitivities of SII ratio
Additional information: Group finance and risk – Risk management
28 February 2020
237 %
247
224
226
232
253
219
233
234
213
235
220175
1 Parallel shift until last liquid point, extrapolation to unchanged UFR. 2 Based on CPI inflation. 3 Based on 200-year event.
Target capitalisation
Ratio as at 31.12.2019
Interest rate +50bps1
Interest rate –50bps1
Spread +50bps GOV
Spread +50bps CORP
Equity markets +30%
Equity markets –30%
FX –20%
Inflation +100bps2
Atlantic Hurricane3
UFR –50bps
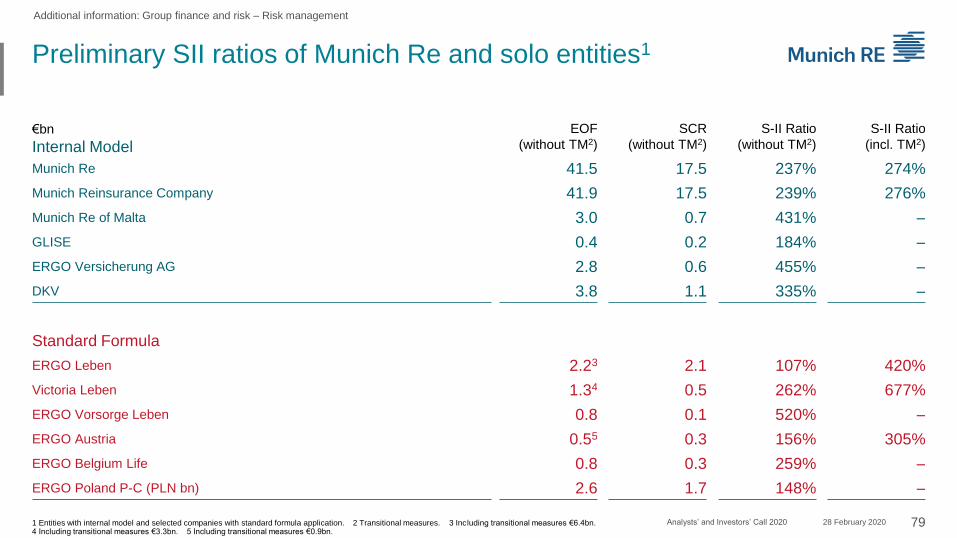
79Analysts’ and Investors’ Call 2020
Preliminary SII ratios of Munich Re and solo entities1
1 Entities with internal model and selected companies with standard formula application. 2 Transitional measures. 3 Including transitional measures €6.4bn. 4 Including transitional measures €3.3bn. 5 Including transitional measures €0.9bn.
€bn
Internal Model
EOF
(without TM2)
SCR
(without TM2)
S-II Ratio
(without TM2)
S-II Ratio
(incl. TM2)
Munich Re 41.5 17.5 237% 274%
Munich Reinsurance Company 41.9 17.5 239% 276%
Munich Re of Malta 3.0 0.7 431% –
GLISE 0.4 0.2 184% –
ERGO Versicherung AG 2.8 0.6 455% –
DKV 3.8 1.1 335% –
Standard Formula
ERGO Leben 2.23 2.1 107% 420%
Victoria Leben 1.34 0.5 262% 677%
ERGO Vorsorge Leben 0.8 0.1 520% –
ERGO Austria 0.55 0.3 156% 305%
ERGO Belgium Life 0.8 0.3 259% –
ERGO Poland P-C (PLN bn) 2.6 1.7 148% –
Additional information: Group finance and risk – Risk management
28 February 2020

80Analysts’ and Investors’ Call 2020
ERGO Life and Health Germany (1)
Additional information: ERGO
2018 9,345
Foreign exchange 1
Divestments/investments –5
Organic change –102
2019 9,238
Gross premiums written €m Major result drivers €m
Q4 2019 Q4 2018 p 2019 2018 p
Technical result 36 94 –58 271 552 –281
Non-technical result 239 118 120 410 238 172
thereof investment result 932 1,008 –76 3,916 3,502 415
Other –231 –147 –84 –494 –527 33
Net result 44 66 –22 187 264 –77
Life and Health Germany (€m) Q4 2019 Return1 2019 Return1 2018 Return1
Regular income 849 2.6% 3,571 2.8% 3,489 2.9%
Write-ups/write-downs –69 –0.2% –249 –0.2% –387 –0.3%
Disposal gains/losses 611 1.9% 1,439 1.1% 650 0.5%
Derivatives2 –362 –1.1% –499 –0.4% 83 0.1%
Other income/expenses –97 –0.3% –345 –0.3% –333 –0.3%
Investment result 932 2.9% 3,916 3.1% 3,502 2.9%Average market value 129,142 125,982 120,251
1 Return on quarterly weighted investments (market values) in % p.a. 2 Result from derivatives without regular income and other income/expenses. 28 February 2020

81Analysts’ and Investors’ Call 2020
ERGO Life and Health Germany (2) –
Key figures
Additional information: ERGO
Key figures1 % 2017 2018 2019
Reinvestment yield 1.5 1.6 1.8
Average yield 3.0 2.9 2.8
Average guarantee2 2.1 2.0 1.9
Key financials1 €bn 2017 2018 2019
Free RfB 1.4 1.3 1.6
Terminal bonus fund 0.9 0.9 0.8
Unrealised gains 10.4 9.4 13.3
Accumulated ZZR 5.0 5.4 6.2
5.5
3.72.8 2.8
2.3
Peer 1 ERGO Peer 2 Peer 3 Peer 4
€bn
1.7
0.90.7 0.6 0.5
ERGO Peer 1 Peer 2 Peer 3 Peer 4
Life Germany Health Germany GWP – Market view3
Comprehensive insurance – ERGO number 2 in German market
Supplementary insurance – ERGO clear market leader
1 German GAAP figures. 2 Actuarial interest rate incl. effect from ZZR. 3 Market data as at 2018. 28 February 2020

82Analysts’ and Investors’ Call 2020
ERGO Property-casualty Germany (1)
Additional information: ERGO
2018 3,377
Foreign exchange 1
Divestments/investments 0
Organic change 122
2019 3,500
Gross premiums written €m Major result drivers €m
Q4 2019 Q4 2018 p 2019 2018 p
Technical result 72 37 36 303 166 138
Non-technical result 48 18 30 105 62 42
thereof investment result 52 35 17 157 133 24
Other –77 –49 –27 –260 –183 –77
Net result 43 5 38 148 45 103
Property-casualty Germany (€m) Q4 2019 Return1 2019 Return1 2018 Return1
Regular income 40 2.1% 159 2.1% 148 2.1%
Write-ups/write-downs –5 –0.2% –27 –0.4% –40 –0.6%
Disposal gains/losses 27 1.4% 100 1.3% 30 0.4%
Derivatives2 –6 –0.3% –51 –0.7% 13 0.2%
Other income/expenses –4 –0.2% –23 –0.3% –19 –0.3%
Investment result 52 2.8% 157 2.1% 133 1.9%Average market value 7,617 7,504 7,085
1 Return on quarterly weighted investments (market values) in % p.a. 2 Result from derivatives without regular income and other income/expenses. 28 February 2020

83Analysts’ and Investors’ Call 2020
ERGO Property-casualty Germany (2)
Additional information: ERGO
2017 97.5
2018 96.0
2019 92.3
Q4 2019 93.2
€mCombined ratio % Gross premiums written 2019 (2018)
TOTAL
€3,500m(€3,377m)
◼ Expense ratio◼ Loss ratio
Personal accident
605 (619)
Liability
599 (556)
Other
278 (264)
Motor
680 (665)
Fire/property
684 (635)
Legal protection
410 (411)
101.7
90.3
94.797.9 98.1
86.2
92.1 93.2
Q12018
Q22018
Q32018
Q42018
Q12019
Q22019
Q32019
Q42019
64.1
62.5
60.3
60.7
33.5
33.4
32.0
32.5
Transport/Marine
243 (228)
28 February 2020

84Analysts’ and Investors’ Call 2020
ERGO International (1)
Additional information: ERGO
Gross premiums written €m Major result drivers €m
2018 5,057
Foreign exchange –28
Divestments/investments –142
Organic change 25
2019 4,912
Q4 2019 Q4 2018 p 2019 2018 p
Technical result –20 7 –26 171 228 –57
Non-technical result 77 15 62 131 14 116
thereof investment result 132 107 25 430 348 82
Other –44 –40 –4 –197 –139 –58
Net result 13 –18 31 105 103 2
International (€m) Q4 2019 Return1 2019 Return1 2018 Return1
Regular income 96 2.0% 368 2.0% 406 2.3%
Write-ups/write-downs 8 0.2% 40 0.2% –55 –0.3%
Disposal gains/losses 59 1.3% 112 0.6% 3 0.0%
Derivatives2 –24 –0.5% –65 –0.4% 22 0.1%
Other income/expenses –6 –0.1% –25 –0.1% –27 –0.2%
Investment result 132 2.8% 430 2.4% 348 2.0%Average market value 18,763 18,186 17,361
1 Return on quarterly weighted investments (market values) in % p.a. 2 Result from derivatives without regular income and other income/expenses. 28 February 2020

85Analysts’ and Investors’ Call 2020
ERGO International (2)
Additional information: ERGO
93.8 91.9 93.1 93.6 84.697.6 94.3
Poland Spain Austria Baltics Greece Legalprotection
Total
Lifethereof:
2019 2018
Austria 367 376Belgium 161 185
Healththereof:
Spain 820 792Belgium 604 580
Combined ratio €mGross premiums written 2019 (2018)
TOTAL
€4,912m(€5,057m)
Health
1,424 (1,374)
Property-casualty
2,791 (2,840)
Life
698 (843)
2019P-Cthereof:
2019 2018
Poland 1,463 1,404
Legal protection 647 642
Greece 240 239
Baltics 144 137
Austria 96 84
%
95.3 95.6
93.3
94.595.4 95.0
91.8
94.8
Q12018
Q22018
Q32018
Q42018
Q12019
Q22019
Q32019
Q42019
28 February 2020
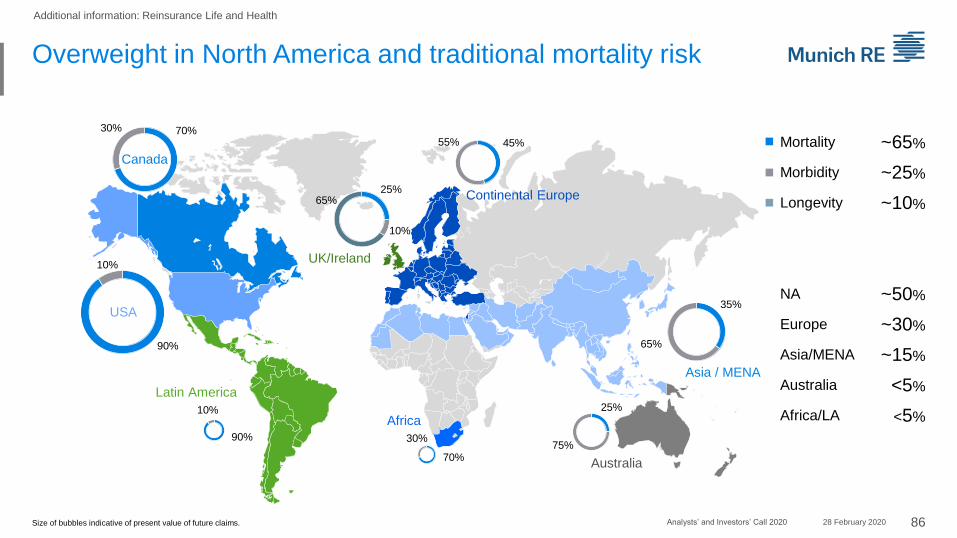
86Analysts’ and Investors’ Call 2020
Overweight in North America and traditional mortality risk
Additional information: Reinsurance Life and Health
Size of bubbles indicative of present value of future claims.
Mortality ~65%
Morbidity ~25%
Longevity ~10%
NA ~50%
Europe ~30%
Asia/MENA ~15%
Australia <5%
Africa/LA <5%
90%
10%
USA
90%
10%
Latin America
70%
30%
Africa
70%30%
Canada
45%55%
Continental Europe25%
10%
65%
UK/Ireland
35%
65%
Asia / MENA
25%
75%
Australia
28 February 2020

87Analysts’ and Investors’ Call 2020
Reinsurance Life and Health
Additional information: Reinsurance Life and Health
Gross premiums written Major result drivers €m
2018 10,849
Foreign exchange 309
Divestments/investments 0
Organic change 558
2019 11,716
€m
Q4 2019 Q4 2018 p 2019 2018 p
Technical result 30 141 –111 329 503 –175
Non-technical result 128 40 87 520 427 94
thereof investment result 225 261 –36 1,080 988 92
Other –69 –56 –13 –144 –201 58
Net result 89 126 –37 706 729 –23
Reinsurance Life and Health (€m) Q4 2019 Return1 2019 Return1 2018 Return1
Regular income 191 2.6% 791 2.8% 806 3.1%
Write-ups/write-downs 14 0.2% 14 0.0% –108 –0.4%
Disposal gains/losses 48 0.7% 322 1.1% 358 1.4%
Derivatives2 –13 –0.2% –9 0.0% –2 0.0%
Other income/expenses –15 –0.2% –38 –0.1% –65 –0.3%
Investment result 225 3.1% 1,080 3.8% 988 3.8%Average market value 29,170 28,205 25,812
1 Return on quarterly weighted investments (market values) in % p.a. 2 Result from derivatives without regular income and other income/expenses. 28 February 2020

88Analysts’ and Investors’ Call 2020
Result below guidance – Growth of fee income partly
balances lower than expected technical result
€m 2019 2018
Gross premiums written 11,716 10,849
Mortality 51% 51%
Morbidity 42% 41%
Other 7% 8%
Technical result 329 503
Mortality 124% 50%
Morbidity –28% 34%
Other 4% 16%
Fee income 127 81
Gross premiums written
▪ Top-line growth in Europe, Asia and the US
Technical result
▪ Strain from disability business in Australia (claims experience and
reserve strengthening)
▪ Negative impact from restructuring of asset portfolio in Canada
▪ Aggregate positive claims experience (including Australia)
▪ Strong contribution from new business and positive impact from
restructuring of certain large treaties
▪ Positive impact from reserve review (except Australia)
Fee income
▪ Comprises business with little or no risk transfer
▪ Stable and predictable result contribution
▪ Strong growth particularly in Asia and the US
Additional information: Reinsurance Life and Health
28 February 2020
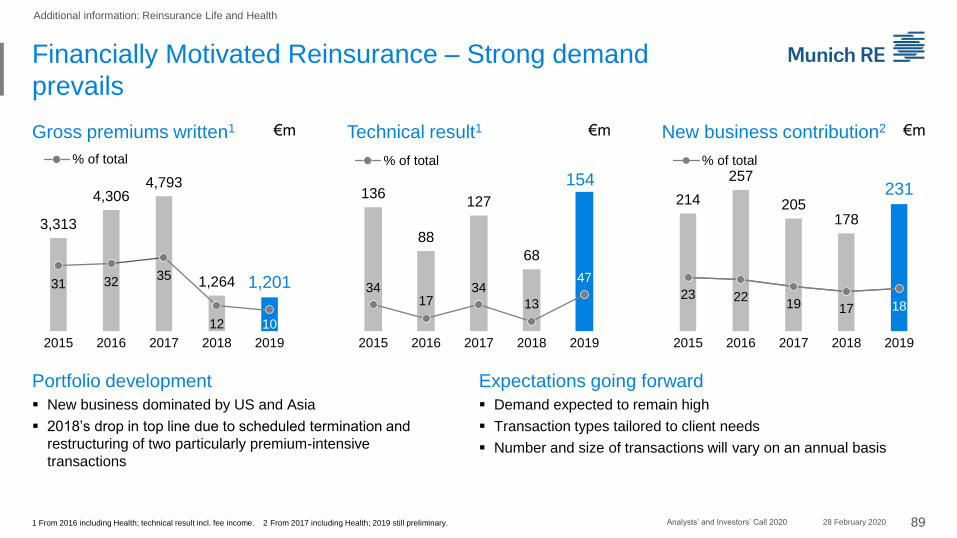
89Analysts’ and Investors’ Call 2020
Financially Motivated Reinsurance – Strong demand
prevails
Additional information: Reinsurance Life and Health
€mGross premiums written1 Technical result1
▪ Demand expected to remain high
▪ Transaction types tailored to client needs
▪ Number and size of transactions will vary on an annual basis
▪ New business dominated by US and Asia
▪ 2018’s drop in top line due to scheduled termination and
restructuring of two particularly premium-intensive
transactions
Portfolio development
1 From 2016 including Health; technical result incl. fee income. 2 From 2017 including Health; 2019 still preliminary.
3,313
4,3064,793
1,264 1,20131 3235
12 10
2015 2016 2017 2018 2019
% of total
136
88
127
68
154
3417
34
13
47
2015 2016 2017 2018 2019
% of total
214
257
205178
231
23 2219 17 18
2015 2016 2017 2018 2019
% of total
€m€m
Expectations going forward
New business contribution2
28 February 2020
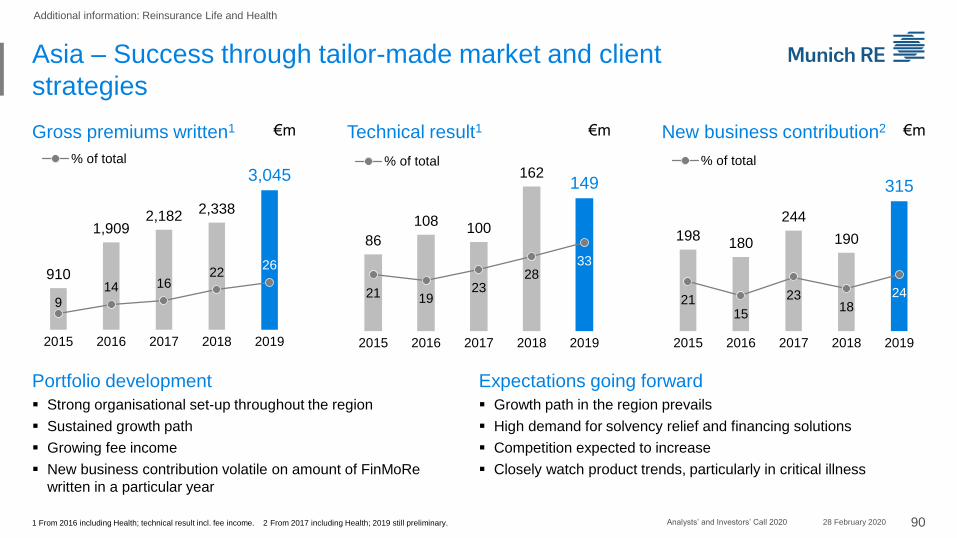
90Analysts’ and Investors’ Call 2020
Asia – Success through tailor-made market and client
strategies
€mGross premiums written1 Technical result1 New business contribution2
▪ Growth path in the region prevails
▪ High demand for solvency relief and financing solutions
▪ Competition expected to increase
▪ Closely watch product trends, particularly in critical illness
Expectations going forward
▪ Strong organisational set-up throughout the region
▪ Sustained growth path
▪ Growing fee income
▪ New business contribution volatile on amount of FinMoRe
written in a particular year
Portfolio development
1 From 2016 including Health; technical result incl. fee income. 2 From 2017 including Health; 2019 still preliminary.
Additional information: Reinsurance Life and Health
910
1,9092,182
2,338
3,045
914 16
2226
2015 2016 2017 2018 2019
% of total
86
108100
162149
21 1923
2833
2015 2016 2017 2018 2019
% of total
198180
244
190
315
2115
2318
24
2015 2016 2017 2018 2019
% of total
€m€m
28 February 2020

91Analysts’ and Investors’ Call 2020
Longevity – Hold on to prudent underwriting approach
Gross premiums written Liability p.a. Strategic proposition
▪ No change to prudent underwriting approach
▪ Carefully consider expansion beyond UK and extension of product
offering
Expectations going forward
▪ Book carefully developed in line with risk appetite
▪ Claims emerge better than expected in pricing
▪ Positive contribution to IFRS and SII earnings
▪ 2019: one large transaction executed late in the year
Portfolio development
▪ Portfolio comprises longevity
transactions in the UK
▪ Market entry in 2011 after in-depth
research
▪ Prudent approach in pricing and
valuation
Additional information: Reinsurance Life and Health
€m€m
381
484417
614685
4 4 36 6
2015 2016 2017 2018 2019
% of total
1,366
1,884
697
3,292
2,020
2015 2016 2017 2018 2019
28 February 2020
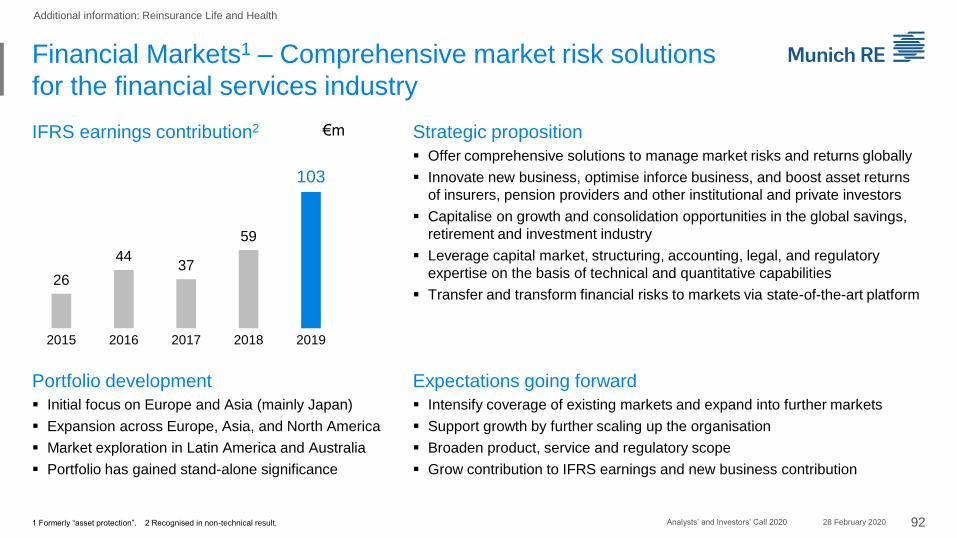
92Analysts’ and Investors’ Call 2020
Financial Markets1 – Comprehensive market risk solutions
for the financial services industry
€mIFRS earnings contribution2 Strategic proposition
▪ Intensify coverage of existing markets and expand into further markets
▪ Support growth by further scaling up the organisation
▪ Broaden product, service and regulatory scope
▪ Grow contribution to IFRS earnings and new business contribution
Expectations going forward
▪ Initial focus on Europe and Asia (mainly Japan)
▪ Expansion across Europe, Asia, and North America
▪ Market exploration in Latin America and Australia
▪ Portfolio has gained stand-alone significance
Portfolio development
▪ Offer comprehensive solutions to manage market risks and returns globally
▪ Innovate new business, optimise inforce business, and boost asset returns
of insurers, pension providers and other institutional and private investors
▪ Capitalise on growth and consolidation opportunities in the global savings,
retirement and investment industry
▪ Leverage capital market, structuring, accounting, legal, and regulatory
expertise on the basis of technical and quantitative capabilities
▪ Transfer and transform financial risks to markets via state-of-the-art platform
1 Formerly “asset protection”. 2 Recognised in non-technical result.
Additional information: Reinsurance Life and Health
26
4437
59
103
2015 2016 2017 2018 2019
28 February 2020
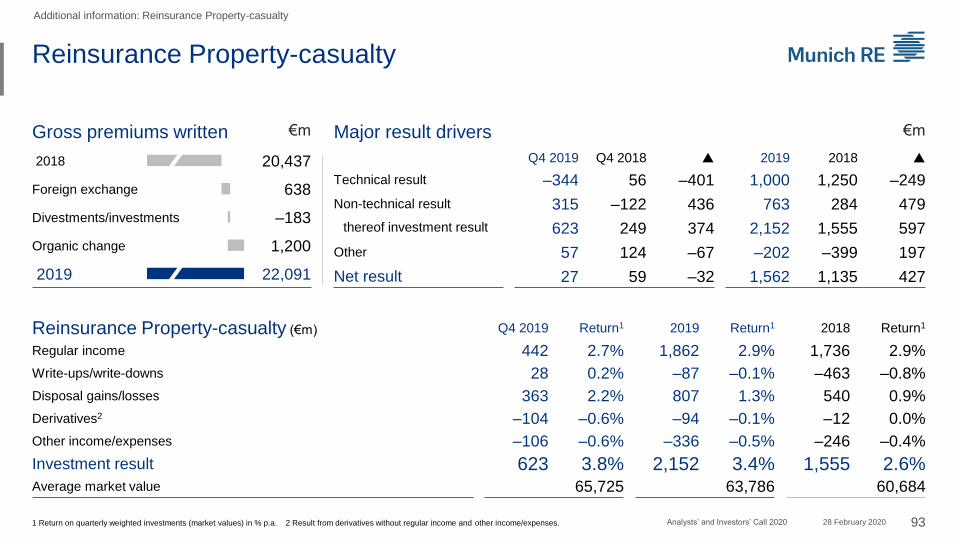
93Analysts’ and Investors’ Call 2020
Reinsurance Property-casualty
Additional information: Reinsurance Property-casualty
Gross premiums written €m Major result drivers €m
2018 20,437
Foreign exchange 638
Divestments/investments –183
Organic change 1,200
2019 22,091
Q4 2019 Q4 2018 p 2019 2018 p
Technical result –344 56 –401 1,000 1,250 –249
Non-technical result 315 –122 436 763 284 479
thereof investment result 623 249 374 2,152 1,555 597
Other 57 124 –67 –202 –399 197
Net result 27 59 –32 1,562 1,135 427
1 Return on quarterly weighted investments (market values) in % p.a. 2 Result from derivatives without regular income and other income/expenses.
Reinsurance Property-casualty (€m) Q4 2019 Return1 2019 Return1 2018 Return1
Regular income 442 2.7% 1,862 2.9% 1,736 2.9%
Write-ups/write-downs 28 0.2% –87 –0.1% –463 –0.8%
Disposal gains/losses 363 2.2% 807 1.3% 540 0.9%
Derivatives2 –104 –0.6% –94 –0.1% –12 0.0%
Other income/expenses –106 –0.6% –336 –0.5% –246 –0.4%
Investment result 623 3.8% 2,152 3.4% 1,555 2.6%Average market value 65,725 63,786 60,684
28 February 2020
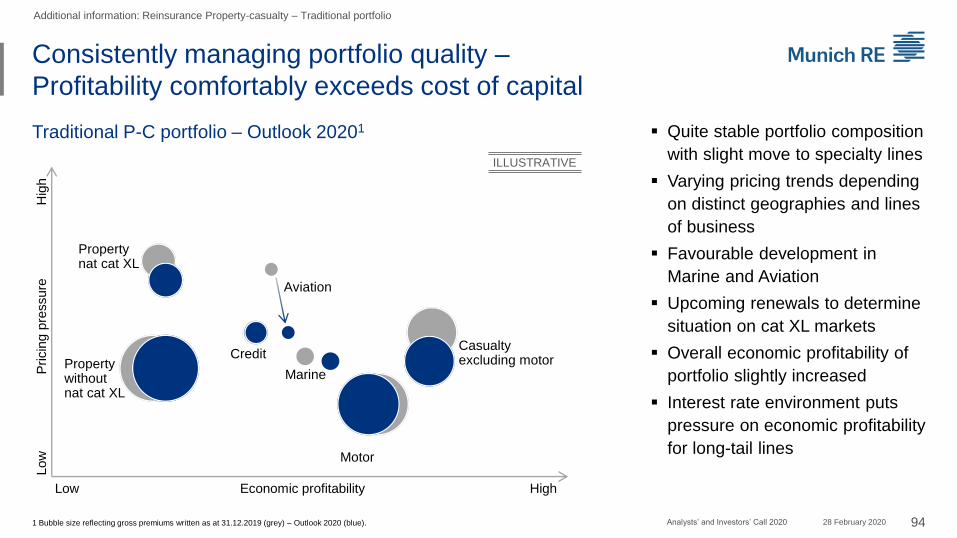
1 Bubble size reflecting gross premiums written as at 31.12.2019 (grey) – Outlook 2020 (blue).
Traditional P-C portfolio – Outlook 20201
94Analysts’ and Investors’ Call 2020
Consistently managing portfolio quality –
Profitability comfortably exceeds cost of capital
Low Economic profitability High
Low
P
ricin
g p
ressure
H
igh
ILLUSTRATIVE
▪ Quite stable portfolio composition
with slight move to specialty lines
▪ Varying pricing trends depending
on distinct geographies and lines
of business
▪ Favourable development in
Marine and Aviation
▪ Upcoming renewals to determine
situation on cat XL markets
▪ Overall economic profitability of
portfolio slightly increased
▪ Interest rate environment puts
pressure on economic profitability
for long-tail lines
Property without nat cat XL
Credit
Property nat cat XL
Casualty excluding motor
Motor
Aviation
Marine
Additional information: Reinsurance Property-casualty – Traditional portfolio
28 February 2020
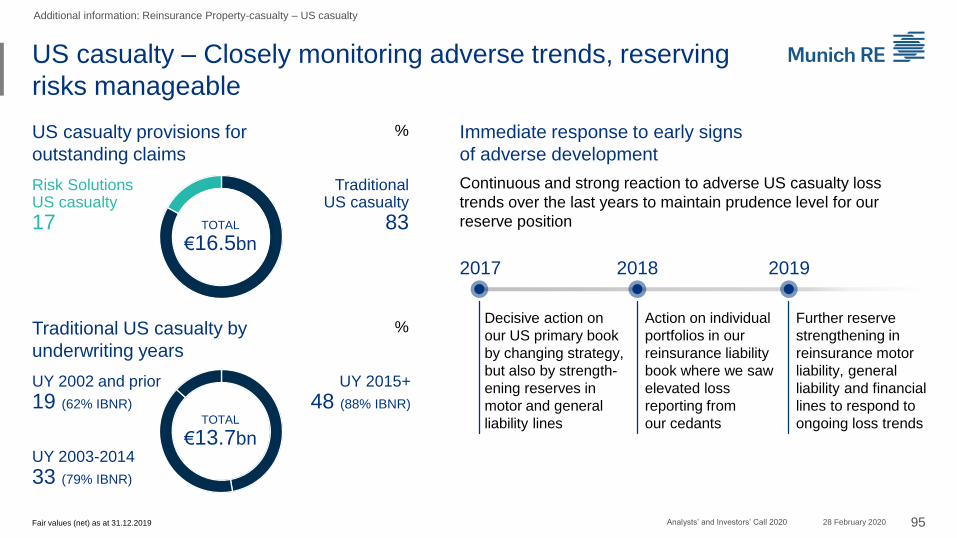
Continuous and strong reaction to adverse US casualty loss
trends over the last years to maintain prudence level for our
reserve position
95Analysts’ and Investors’ Call 2020
US casualty – Closely monitoring adverse trends, reserving
risks manageable
Additional information: Reinsurance Property-casualty – US casualty
TOTAL
€16.5bn
Risk Solutions US casualty
17
Traditional US casualty
83
US casualty provisions for
outstanding claims
TOTAL
€13.7bn
Fair values (net) as at 31.12.2019
Traditional US casualty by
underwriting years
UY 2015+
48 (88% IBNR)
UY 2003-2014
33 (79% IBNR)
UY 2002 and prior
19 (62% IBNR)
Immediate response to early signs
of adverse development
%
%Decisive action on
our US primary book
by changing strategy,
but also by strength-
ening reserves in
motor and general
liability lines
2018 20192017
Action on individual
portfolios in our
reinsurance liability
book where we saw
elevated loss
reporting from
our cedants
Further reserve
strengthening in
reinsurance motor
liability, general
liability and financial
lines to respond to
ongoing loss trends
28 February 2020

96Analysts’ and Investors’ Call 2020
US casualty market highly differentiated – Still allows us to
seize opportunities while active risk management remains key
▪ Long-term track record in managing and early responding to risk of
change, e.g. social inflation
▪ Active portfolio management
▪ Selective opportunities in some proportional business lines –
benefitting from increasing original rates, credible alignment of
interest and high transparency
▪ Expansion of personal lines business from 7% to 18%1
▪ Reduction of portfolio parts with imbalanced premium/risk reward,
e.g. US commercial liability XL business from 10% to 6%1
▪ Proactive adjustment of pricing parameters to reflect dynamic market/
claims environment and avoid anti-selection
▪ Reduction of ceding commissions
▪ Risk management – strict limit management, accumulation control and
feedback loops between underwriting, claims and reserving
▪ Social inflation reflects the changing values of society
and particularly materialises as a frequency of severity
▪ Mainly exposed are bodily-injury related classes of
business, e.g. commercial auto, general and product
liability and healthcare/medical malpractice
▪ Limit reductions on original policies
▪ Accelerating rate increases on original policies,
primarily in the non-admitted market, e.g. E&S and
D&O
▪ Further firming in primary admitted market to be
expected after adjusted rate filings
▪ Accelerated rate increases expected throughout 2020
renewals, especially for high excess Bermuda and
financial lines renewals
Munich Re approach
1 Share in % of total US traditional casualty book, 2017 to 2020.
Market observations
Ongoing qualitative improvement of our proportional US commercial liability portfolio
Additional information: Reinsurance Property-casualty – US casualty
28 February 2020

97Analysts’ and Investors’ Call 2020
Risk Solutions: AMIG, F&C and MRS with particularly good
results – Aerospace hit by large loss events
Additional information: Reinsurance Property-casualty – Risk solutions
1 Economic view – not fully comparable with IFRS figures. 2 Compared to previous year. Gross premiums written.
Combined ratio 20191
GWP growth
20191,2
Combined ratio 20191
GWP growth
20191,2
Munich Re Syndicate (MRS)▪ Better market conditions and
diversification in new specialty lines supporting positive growth
▪ Investing in digitalisation and process automation
F&C▪ Good and profitable market position after
a period affected by severe outlier events
▪ Premiums with strong growth above expectations, particularly driven by property
96% +31%
93% +35%American Modern (AMIG)▪ Transformation investments bearing
fruits with higher growth than expected
▪ One-offs IT costs and business run off partly impact the result
Aerospace▪ Unusual accumulation of large loss
events for Space and Aviation business
▪ Growing premium due to better market conditions and an improving competitive landscape
88% +17%
166% +20%Munich Re Specialty Insurance
Hartford Steam Boiler
▪ Investing in newly created unit and building up E&S business
▪ Solid property result
▪ Turnaround of casualty business executed
▪ Strong growth of strategic products and further growth in core business
▪ Investing in new MR wide IoT activities
102% +7%
92% +13%
28 February 2020

98Analysts’ and Investors’ Call 2020
Reinsurance Property-casualty –
Combined ratio
Additional information: Reinsurance Property-casualty
1 Basic losses from prior years, already adjusted for directly corresponding sliding-scale and profit-commission effects. 2 Based on reserve releases of 4%-pts.
2017 114.1
2018 99.4
2019 101.0
Q4 2019 112.5
◼ Major losses ◼ Expenses◼ Basic losses
54.8
53.6
51.4
46.4
25.8
11.6
15.2
27.4
33.5
34.2
34.4
38.7
Major losses Nat cat Man-made Reserve releases1
2019 15.2 10.0 5.2 –5.6
Q4 2019 27.4 21.1 6.3 –7.1
Ø Annual
expectation ~12.0 ~8.0 ~4.0 ~–4.0
88.6
102.0
100.7
105.1
97.9
87.7
104.7
112.5
Q12018
Q22018
Q32018
Q42018
Q12019
Q22019
Q32019
Q42019
%
28 February 2020

99Analysts’ and Investors’ Call 2020
Retrocession – Stable programme structure despite a
tightened market
Additional information: Reinsurance Property-casualty – Risk trading
1 Including indemnity retrocession, ILW/derivatives, risk swaps, cat bonds and the sidecars including Eden Re. Selection of main scenarios. 2 Munich Re structured and arranged transactions.
Retrocession – Maximum in-force
protection per nat cat scenario1
▪ Protection against peak risks via multiple instruments –
mainly traditional retrocession (CXL) and sidecars
▪ Well-balanced buying strategy reflecting
▪ strong Munich Re capital base and risk-bearing capacity,
▪ expected IFRS result stabilisation,
▪ market terms
0
500
1,000
1,500
2015 2016 2017 2018 2019 2020
Australia Cyclone US Windstorm NE US Windstorm SETraditional retrocession
▪ Munich Re has one of the largest retrocession
programmes globally
▪ Capacity constraints in the broader market, some
locked-in capital
▪ Reliable Munich Re approach – placements well
received
Sidecar program2
▪ One of the largest sidecar programmes in the market
(US$ 685m); QS cessions of certain lines of business
▪ Placed with a broad range of investors and targeting
long-term partnerships with large institutional accounts
▪ Two products: (1) placed with broad investor group,
(2) bilateral (single counterparty)
Munich Re key channels€m
28 February 2020

100Analysts’ and Investors’ Call 2020
Munich Re's maximum in-force nat cat protection
€m
500
1,000
AustraliaCyclone
US WindstormNortheast
US WindstormSoutheast
USEarthquake
EUWindstorm
EUOther perils
JapanEarthquake
Risk swaps
Sidecars
Indemnity retro
0
Nat cat protection before reinstatement premiums, as at January 2020
Additional information: Reinsurance Property-casualty – Risk trading
28 February 2020
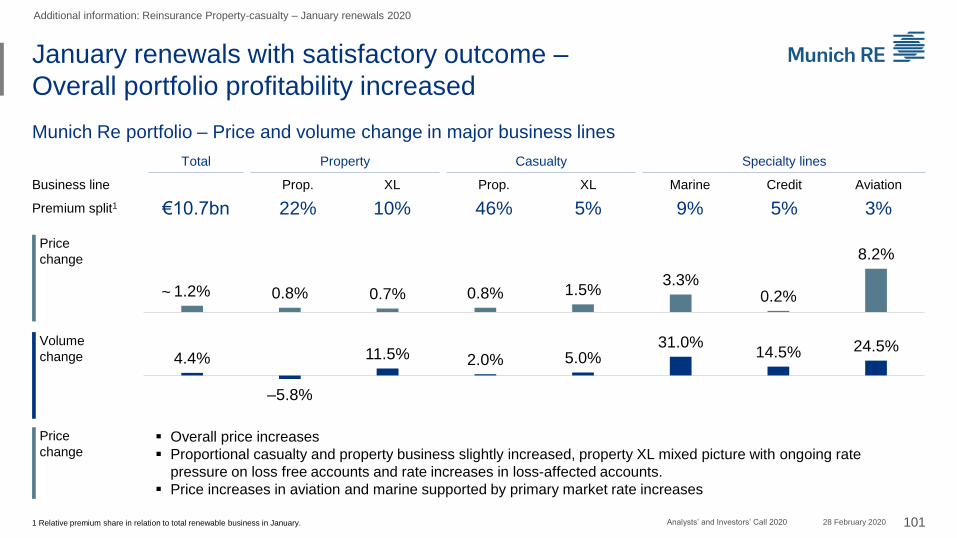
Total Property Casualty Specialty lines
Business line Prop. XL Prop. XL Marine Credit Aviation
Premium split1 €10.7bn 22% 10% 46% 5% 9% 5% 3%
101Analysts’ and Investors’ Call 2020
January renewals with satisfactory outcome –
Overall portfolio profitability increased
Munich Re portfolio – Price and volume change in major business lines
1 Relative premium share in relation to total renewable business in January.
Price
change▪ Overall price increases
▪ Proportional casualty and property business slightly increased, property XL mixed picture with ongoing rate
pressure on loss free accounts and rate increases in loss-affected accounts.
▪ Price increases in aviation and marine supported by primary market rate increases
Price
change
Volume
change
Additional information: Reinsurance Property-casualty – January renewals 2020
1.2% 0.8% 0.7% 0.8% 1.5%3.3%
0.2%
8.2%
~
4.4%
–5.8%
11.5% 2.0% 5.0%31.0%
14.5% 24.5%
28 February 2020
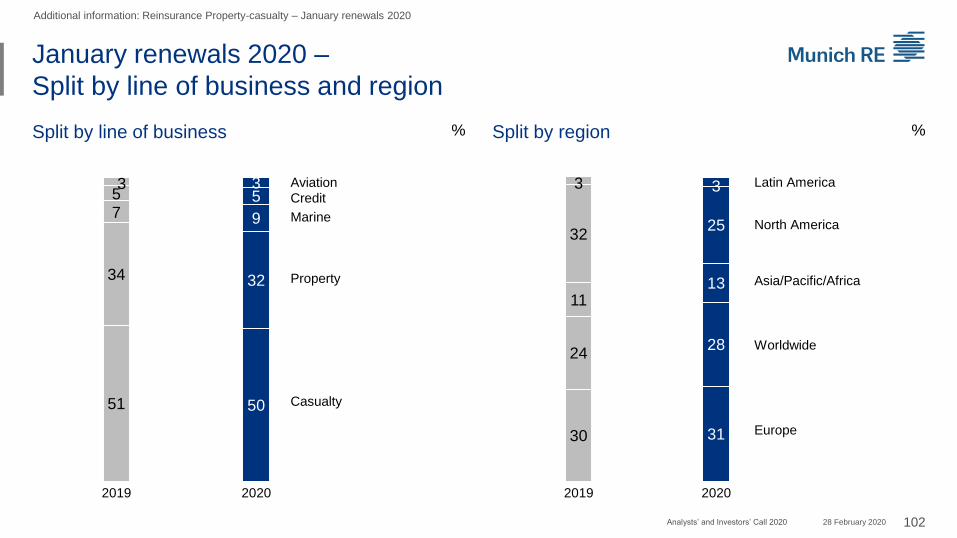
%
102Analysts’ and Investors’ Call 2020
January renewals 2020 –
Split by line of business and region
Split by line of business
Additional information: Reinsurance Property-casualty – January renewals 2020
% Split by region
51 50
34 32
7 9
5 53 3
2019 2020
30 31
2428
1113
3225
3 3
2019 2020
Worldwide
Latin America
Asia/Pacific/Africa
North America
Europe
Aviation
Credit
Marine
Casualty
Property
28 February 2020

%
1 Gross premiums written. Economic view – not fully comparable with IFRS figures. 2 Total refers to total P-C book, incl. remaining business. 103Analysts’ and Investors’ Call 2020
January renewals –
Almost half of total P-C book up for renewal
Total property-casualty book1 %
Remaining business
30
July renewals
16
January renewals
46
April renewals
8
Regional allocation of January renewals
TOTAL
€10bn
%Nat cat shares of renewable portfolio2
TOTAL
€22bn
North America
32
Asia/Pacific/Africa
11Worldwide
24
Europe
30
Latin America
3
Additional information: Reinsurance Property-casualty – January renewals 2020
10
26
20
14
90
74
80
86
January
April
July
Total
Nat cat Other perils
28 February 2020

104Analysts’ and Investors’ Call 2020
Cautiously optimistic outlook for upcoming renewals
Total P-C book1
1 Gross premiums written. Economic view – not fully comparable with IFRS figures. 2 NA = North America. 3 LA = Latin America.
Treaty business
April July
Rest of Asia/ Pacific/Africa
Europe
Worldwide
NA2
LA3
Australia/New Zealand
January2
46Worldwide
LA3
Europe TOTAL
€3.5bn
NA2
Claims experience in the individual market segments will
play a major role
Focus: USA, LA, AustraliaNat cat share: 20%
Focus: USA, EuropeNat cat share: 10%
Positive price change
of ~1.2%
TOTAL
€10.2bn
Rest of Asia/Pacific/Africa
Europe
LA3NA2
Worldwide
Japan
Focus: JapanNat cat share: 26%
TOTAL
€1.8bn
TOTAL
€22bn
Remaining
30
April
8
July
16
Nat cat share: 14%
~50% of total P-C book
renewed in January
Asia/Pacific/Africa
January
Additional information: Reinsurance Property-casualty – January renewals 2020
28 February 2020
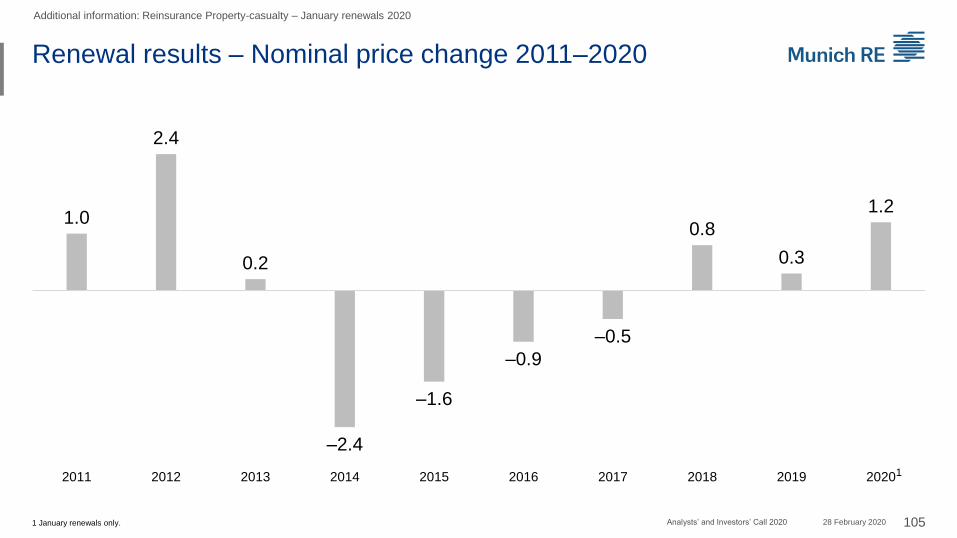
105Analysts’ and Investors’ Call 2020
Renewal results – Nominal price change 2011–2020
1 January renewals only.
Additional information: Reinsurance Property-casualty – January renewals 2020
1.0
2.4
0.2
–2.4
–1.6
–0.9
–0.5
0.8
0.3
1.2
2011 2012 2013 2014 2015 2016 2017 2018 2019 20201
28 February 2020

106Analysts’ and Investors’ Call 2020
Increased top line – Well-balanced diversified portfolio
Additional information: Reinsurance Property-casualty – Portfolio
Rounded figures. 1 Gross premiums written. Economic view – not fully comparable with IFRS figures, as at 31.12.2019 (31.12.2018).2 Aviation, marine and credit. 3 Incl. MSP, sold in 2018.
▪ Strong proportion of US business,
spread across all lines of business
▪ Stable portfolio composition
Total P-C book % %2 Risk Solutions
Tailor-made
solutions
25 (25)
Other
traditional business
52 (53)
Risk
Solutions
23 (21)
TOTAL1
€22bn
MR Specialty
Insurance
22 (24)
American Modern
21 (21)
Facultative &
Corporate Direct
15 (12)
Hartford
Steam Boiler
22 (22)
Aerospace
8 (11³)
TOTAL
€5bn
Munich Re
Syndicate
12 (10)
▪ Well-balanced traditional portfolio
▪ Slight move towards specialty
1 Traditional
TOTAL
€17bn
Casualty
49 (51)
Specialty2
8 (7)
Other property
34 (34)
Nat cat XL
9 (7)
%
28 February 2020
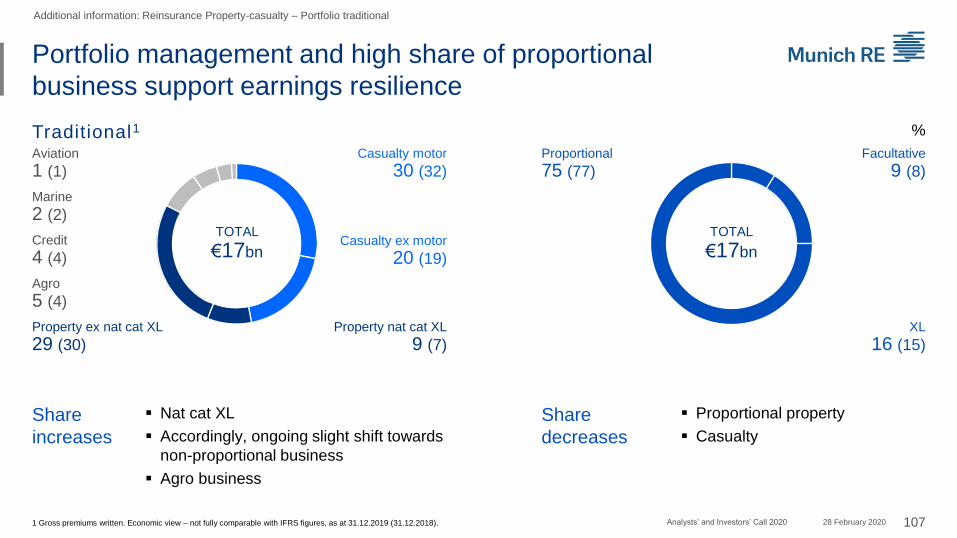
107Analysts’ and Investors’ Call 2020
Portfolio management and high share of proportional
business support earnings resilience
Traditional1
Additional information: Reinsurance Property-casualty – Portfolio traditional
1 Gross premiums written. Economic view – not fully comparable with IFRS figures, as at 31.12.2019 (31.12.2018).
Casualty motor
30 (32)
Aviation
1 (1)
Property ex nat cat XL
29 (30)
TOTAL
€17bn
Facultative
9 (8)
XL
16 (15)
Proportional
75 (77)
TOTAL
€17bn
Marine
2 (2)
Credit
4 (4)
Agro
5 (4)
Casualty ex motor
20 (19)
Property nat cat XL
9 (7)
%
28 February 2020
▪ Nat cat XL
▪ Accordingly, ongoing slight shift towards
non-proportional business
▪ Agro business
▪ Proportional property
▪ Casualty
Share
increases
Share
decreases
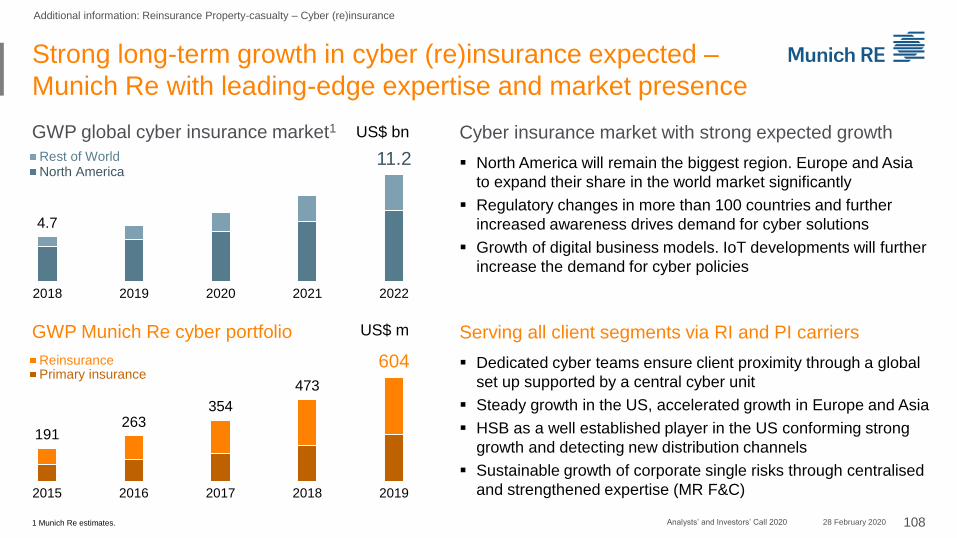
108Analysts’ and Investors’ Call 2020
GWP global cyber insurance market1 US$ bn
4.7
11.2
2018 2019 2020 2021 2022
Rest of WorldNorth America
GWP Munich Re cyber portfolio US$ m
191263
354
473
604
2015 2016 2017 2018 2019
ReinsurancePrimary insurance
Cyber insurance market with strong expected growth
▪ North America will remain the biggest region. Europe and Asia
to expand their share in the world market significantly
▪ Regulatory changes in more than 100 countries and further
increased awareness drives demand for cyber solutions
▪ Growth of digital business models. IoT developments will further
increase the demand for cyber policies
Serving all client segments via RI and PI carriers
▪ Dedicated cyber teams ensure client proximity through a global
set up supported by a central cyber unit
▪ Steady growth in the US, accelerated growth in Europe and Asia
▪ HSB as a well established player in the US conforming strong
growth and detecting new distribution channels
▪ Sustainable growth of corporate single risks through centralised
and strengthened expertise (MR F&C)
Strong long-term growth in cyber (re)insurance expected –
Munich Re with leading-edge expertise and market presence
Additional information: Reinsurance Property-casualty – Cyber (re)insurance
1 Munich Re estimates. 28 February 2020

2020
18 March Annual report (Group), Annual report (Company)
29 April Annual General Meeting 2020
7 May Quarterly statement as at 31 March 2020
6 August Half-year financial report as at 30 June 2020
5 November Quarterly statement as at 30 September 2020
8 December Investor Day, Munich
109Analysts’ and Investors’ Call 2020
Financial calendar
Additional information: Shareholder information
28 February 2020
110Analysts’ and Investors’ Call 2020
For information, please contact
Additional information: Shareholder information
Investor Relations Team
Christian Becker-Hussong
Head of Investor & Rating Agency Relations
Tel.: +49 (89) 3891-3910
E-mail: [email protected]
Thorsten Dzuba
Tel.: +49 (89) 3891-8030
E-mail: [email protected]
Christine Franziszi
Tel.: +49 (89) 3891-3875
E-mail: [email protected]
Ralf Kleinschroth
Tel.: +49 (89) 3891-4559
E-mail: [email protected]
Andreas Silberhorn (Rating agencies)
Tel.: +49 (89) 3891-3366
E-mail: [email protected]
Ingrid Grunwald (ESG)
Tel.: +49 (89) 3891-3517
E-mail: [email protected]
Maximiliane Hörl (ERGO)
Tel.: +49 (211) 477-7483
E-mail: [email protected]
Münchener Rückversicherungs-Gesellschaft | Investor & Rating Agency Relations | Königinstraße 107 | 80802 München, Germany
Fax: +49 (89) 3891-9888 | E-mail: [email protected] | Internet: www.munichre.com
28 February 2020

111Analysts’ and Investors’ Call 2020
Disclaimer
This presentation contains forward-looking statements that are based on current assumptions and forecasts
of the management of Munich Re. Known and unknown risks, uncertainties and other factors could lead to
material differences between the forward-looking statements given here and the actual development, in
particular the results, financial situation and performance of our Company. The Company assumes no
liability to update these forward-looking statements or to make them conform to future events or
developments.
28 February 2020