Analysts: 45 650 - stjohns.edu · It had no case, monitor or keyboard ... Apple Inc. sells its...
37
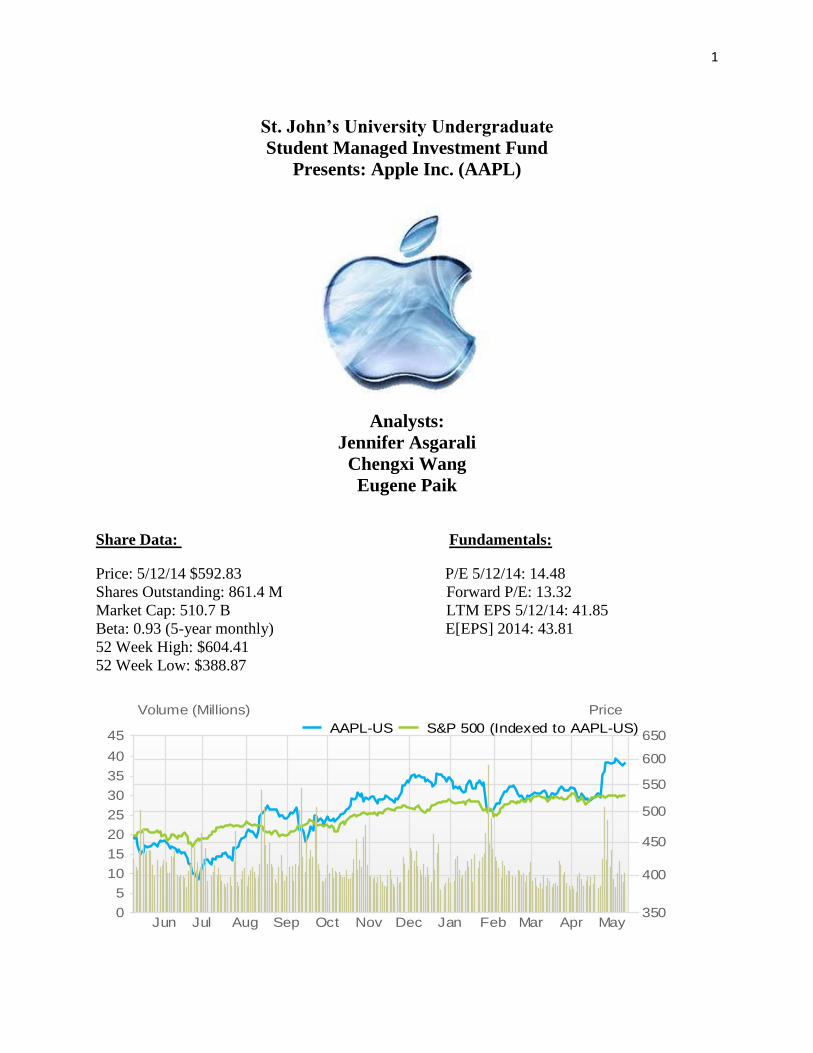
1 St. John’s University Undergraduate Student Managed Investment Fund Presents: Apple Inc. (AAPL) Analysts: Jennifer Asgarali Chengxi Wang Eugene Paik Share Data: Fundamentals: Price: 5/12/14 $592.83 P/E 5/12/14: 14.48 Shares Outstanding: 861.4 M Forward P/E: 13.32 Market Cap: 510.7 B LTM EPS 5/12/14: 41.85 Beta: 0.93 (5-year monthly) E[EPS] 2014: 43.81 52 Week High: $604.41 52 Week Low: $388.87 Jun Jul Aug Sep Oct Nov Dec Jan Feb Mar Apr May 350 400 450 500 550 600 650 0 5 10 15 20 25 30 35 40 45 Volume (Millions) Price AAPL-US S&P 500 (Indexed to AAPL-US)
Transcript of Analysts: 45 650 - stjohns.edu · It had no case, monitor or keyboard ... Apple Inc. sells its...
1
St. John’s University Undergraduate
Student Managed Investment Fund
Presents: Apple Inc. (AAPL)
Analysts:
Jennifer Asgarali
Chengxi Wang
Eugene Paik
Share Data: Fundamentals:
Price: 5/12/14 $592.83 P/E 5/12/14: 14.48
Shares Outstanding: 861.4 M Forward P/E: 13.32
Market Cap: 510.7 B LTM EPS 5/12/14: 41.85
Beta: 0.93 (5-year monthly) E[EPS] 2014: 43.81
52 Week High: $604.41
52 Week Low: $388.87
Jun Jul Aug Sep Oct Nov Dec Jan Feb Mar Apr May
350
400
450
500
550
600
650
0
5
10
15
20
25
30
35
40
45
Volume (Millions) Price
AAPL-US S&P 500 (Indexed to AAPL-US)

2
Table of Contents
Executive Summary 3
Company Overview 4
Industry Overview 11
Fundamental Analysis 12
Income Statement 24
Relative Valuation 27
Absolute Valuation 30
Conclusion/ Recommendation 35

3
Executive Summary
As a result of analyzing Apple Inc. as firm and its position within the personal computer and consumer
electronics industry, we are recommending to sell 35 shares of Apple Inc.’s stock. This decision is based on the
following:
1. According to the Relative Valuation as of 5/5/14, Apple Inc.’s stock should be selling at $538.79.
However, on that date, Apple’s stock was actually priced at $600.96 so Apple’s stock is overpriced.
2. According to our forecasted income statements for 2014 and 2015, Apple’s net income is projected to be
$35.13 B and $35.82 B respectively. Both of these numbers are lower than the net income of $37.04 B
in 2013. Hence, we are expecting Apple’s incomes to fall in the next two years and by extension,
Apple’s profitability.
3. According to the Absolute Valuation Apple must maintain a growth rate of 10.25% post 2020 for Apple
to be fairly valued today. However, we do not expect that Apple’s growth rate will be this high in the
future. Consequently, Apple’s stock is overvalued.
4. Apple has been facing more competition in recent years, from Samsung especially and it is expected that
Apple will experience even more competition in the future from other companies in the information
technology industry. Hence, Apple’s market share will decline and by extension their revenues.
5. Apple has not introduced any real new products since it launched the iPad in 2010. Apple has just been
innovating existing products. This is rather disappointing and based on this trend we are not expecting
much from the company for 2014 and 2015 in terms of new products (except for the iWatch).

4
I. Company Overview
History
Apple Computer was founded on April 1st 1976 by Steven Wozniak, Steven Jobs and Ronald Wayne in
Cupertino, California. Both Wozniak and Jobs attended high school together and also dropped out of college.
Jobs and Wayne had worked together at Atari (a company that created entertainment software), while Wozniak
had worked at Hewlett-Packard. Both Wozniak and Jobs had a dream to make computers user friendly but
Wayne had different intentions since he sold his share of the company for a mere $800 just three months after it
was founded.
“Apple I”, the first computer created by the company was designed by Wozniak in Jobs’ parents’ garage in
1976. It had no case, monitor or keyboard and did not make much of an impact in the computer industry.
However, the company’s fortunes changed in 1977 with the introduction of the “Apple II”. The Apple II was
the first personal computer to have color graphics and enclosed in a plastic case. Sales increased significantly
and the company grew in size. That same year (1977), the company was incorporated as Apple Computer Inc.
In 1980, the company went public and Apple Computer launched “Apple III”. The Macintosh (also known as
the “Mac”) was introduced by Jobs in 1984 and has evolved significantly over the years. On January 9, 2007,
the company became “Apple Inc.” as it dropped the word “computer” since it aimed to expand its presence in
the consumer electronics market.
Today Apple Inc. is an American multinational corporation that is headquartered in Cupertino California.
The company “designs, manufactures, and markets mobile communication and media devices, personal
computers, portable digital music players, and sells a variety of related software, services, peripherals,
networking solutions, and third-party digital content and applications.” 1
Apple Inc.’s hardware products include Macintosh computers, the ipod, the iphone, the ipad and the Apple
TV. Software products include Mac OS X operating system, itunes, ilife (a suite of software applications for
photos, movies and music), iwork (an office suite of applications), Aperture (professional photography software
package), Final Cut Studio (a suite of professional video and audio production software) and Logic Studio (a
suite of audio software).
Apple Inc. sells its products and services worldwide through retail stores, online stores, third party cellular
network carriers and wholesalers. In the U.S. Apple, has approximately 26,000 store employees serving at 250
stores in 44 states. For 2003, Apple Inc. ranked at number 6 on the Fortune 500 list of companies in terms of
revenues.
1 Factset

5
Geographical Locations
Apple Inc. operates literal retail stores in the following 14 countries:
Austrialia
Canada
China
France
Germany
Hong Kong
Italy
Japan
Netherlands
Spain
Sweden
Switzerland
United Kingdom
United States
Outside of those countries listed above, Apple Inc. also operates internet shopping websites in 24 other countries
as of July 2013. These countries are Austria, Belgium, Brazil, Czech Republic, Denmark, Finland, Hungary,
Indonesia, Ireland, Luxembourg, Malaysia, Mexico, New Zealand, Mexico, Philippines, Poland, Portugal,
Russia, Singapore, South Korea, Taiwan, Thailand, United Arab Emirates and Vietnam.
Most of Apple Inc.’s sales for their fiscal year September 2013 came from the Americas. The pie chart below
shows the geographical revenue distribution for Apple Inc. as of September 2013. Please note that the numbers
are all in billions of dollars.
62,739
37,883
25,417
20,228
13,462
11,181
Americas
Europe
Greater China
Retail
Japan
Rest of Asia Pacific

6
Products The chart below shows Apple Inc.’s major revenue earning products/services for the fiscal year September
2013. The numbers shown are in billions of dollars.
91,279
31,980
21,483
16,051
5,706 4,411
iPhone
iPad
Mac
iTunes, Software & Services
Accessories
iPod

7
Corporate Structure
Below is a list of the members on Apple Inc.’s management board.
Chief Executive Officer and Director: Timothy Donald Cook
Senior Vice President Operations: Jeffrey Williams
Chief Financial Officer & Senior Vice President: Peter Oppenheimer
Secretary, Senior Vice President & General Counsel: D. Bruce Sewell
Vice President: Paul Deneve
Treasurer & Vice President: Gary Wipfler
Senior Vice President-Software Engineering: Craig Federighi
Senior Vice President-Hardware Engineering: Daniel J. Riccio
Senior Vice President-Design: Jonathan P. Ive
Senior Vice President-Internet Software & Services: Eduardo H. Cue
Senior Director-Product Marketing, EMEA: Erik Stannow
Senior Vice President-Software Engineering: Guy Tribble
Vice President-Sales: Zane C. Rowe
Manager-Public Relations & Buzz Marketing: Christina Caballero
Senior Vice President-Worldwide Marketing: Philip W. Schiller
Vice President-Finance & Corporate Controller: Luca Maestri
Director-Investor Relations: Joan Hoover
Director-Mac Public Relations: Bill Evans
Director-Public Relations: Colin Smith
Director-Public Relations: Natalie N. Kerris
Director-Public Relations: Trudy Muller
Head-iPod, iBookstore & Apple TV Public Relations: Jennifer Ramsay Newhart
Head-Public Relations: Monica Sarkar
Head-Public Relations: Lizzie Garlinghouse
Manager-Public Relations: Tom Neumayr
Manager-Public Relations: Kristin Huguet
Senior Director-Corporate Public Relations: Steve R. Dowling
Senior Director-Investor Relations: Nancy Paxton
Vice President-Communications: Katie Cotton
Head-Human Resources: Denise Young Smith
8
Recent News
Stock Repurchase
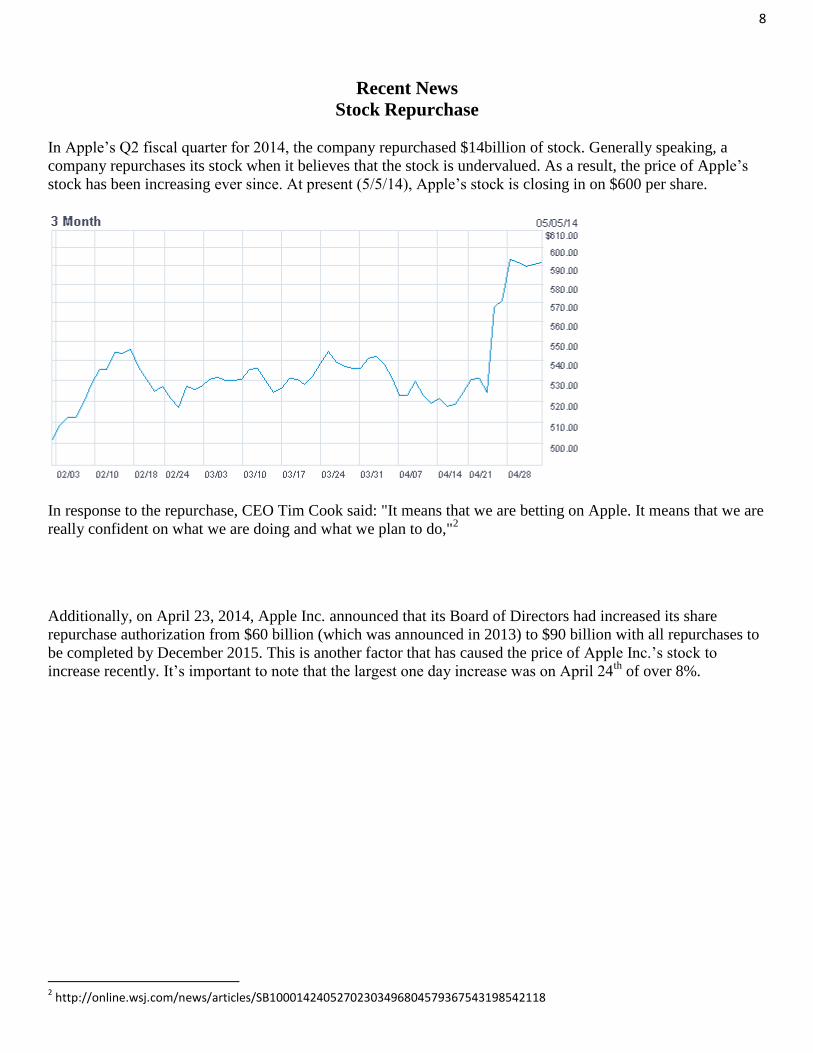
In Apple’s Q2 fiscal quarter for 2014, the company repurchased $14billion of stock. Generally speaking, a
company repurchases its stock when it believes that the stock is undervalued. As a result, the price of Apple’s
stock has been increasing ever since. At present (5/5/14), Apple’s stock is closing in on $600 per share.
In response to the repurchase, CEO Tim Cook said: "It means that we are betting on Apple. It means that we are
really confident on what we are doing and what we plan to do,"2
Additionally, on April 23, 2014, Apple Inc. announced that its Board of Directors had increased its share
repurchase authorization from $60 billion (which was announced in 2013) to $90 billion with all repurchases to
be completed by December 2015. This is another factor that has caused the price of Apple Inc.’s stock to
increase recently. It’s important to note that the largest one day increase was on April 24th
of over 8%.
2 http://online.wsj.com/news/articles/SB10001424052702303496804579367543198542118

9
Dividends
On April 23, 2014 Apple Inc. declared that it will increase its quarterly dividend by 7.79% from $3.05 to $3.29.
The first payment date of this higher dividend will be May 15, 2014. The increased dividend has also
contributed to the increasing price of Apple Inc.’s stock. Since Apple, began paying dividends in 2012, it has
consistently been growing its dividend payments to shareholders.
According to an analyst from S&P Indices: “the 8% dividend increase pushes Apple to the top of the list of
dividend stock payers in the world”3
The diagram below shows Apple Inc. leading the list with the highest announced dividend payout for 2014 as of
April 24, 2014.
The bar chart clearly shows that as of this moment Apple Inc. is ranked as the company to pay out the most cash
dividends to its stock holders this year (2014).
3 http://qz.com/202630/apple-just-became-the-worlds-biggest-dividend-stock/#/h/63658,2/

10
Stock Split
Apple Inc. announced a 7-for-1 stock split which will come into effect on June 6, 2014 after the close of
business. As a result, the price of Apple Inc.’s stock is going to be 1/7th
the pre-split price, while maintaining
the market value of the company. Consequently, Apple Inc.’s stock will become more affordable so it will be
financially easier for Apple investors to buy more shares in the company and for potential investors (those who
may have lacked the financial wherewithal to purchase Apple’s stock) to acquire holdings. In fact Apple Inc.
stated that its reason for the split is: “We want Apple stock to be more accessible to a larger number of
investors.”4
As we know the stock split should not have any effect on the total market value of Apple Inc.’s stock (unless the
split is conveying some information about the company to the market). However, the post-split price can cause
the demand for Apple’s stock to increase since more investors can afford to purchase the company’s stock and
as a result, the increased demand can cause the price per share to rise.
Competition
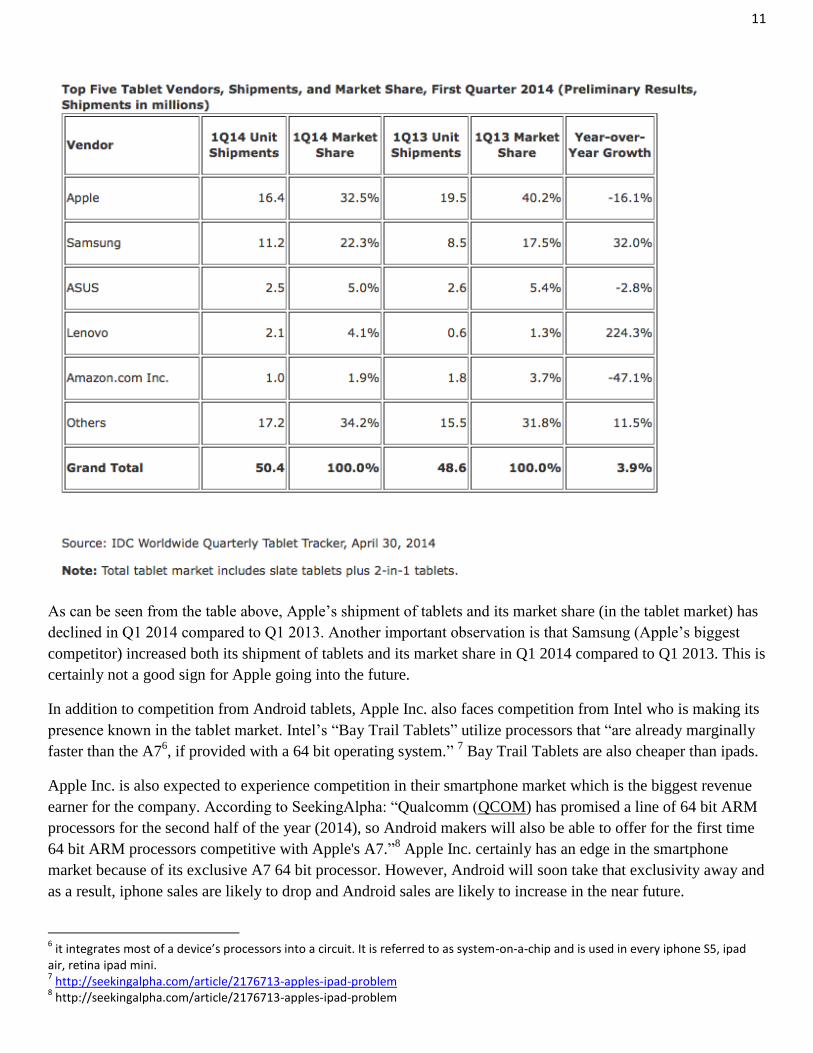
In an article dated 5/1/14, AppleInsider stated: “Apple is close to losing its dominance in tablet sales, as the ipad
slipped to less than a third of all tablet devices sold in Q1 2014, according to the research firm IDC. A year
earlier, Apple’s ipad was more than 40% of all tablets sold.”5 The 7.7% decline in market share, from 40.2 to
32.5 resulted in a16% decline in units shipped.
The table below shows Apple’s tablet shipments and share compared to its competitors for Q1 in 2013 and
2014.
4 http://investor.apple.com/faq.cfm?FaqSetID=2
5 http://appleinsider.com/articles/14/05/04/apples-ipad-business-isnt-collapsing-but-the-rest-of-the-tablet-industry-sure-is
11
As can be seen from the table above, Apple’s shipment of tablets and its market share (in the tablet market) has
declined in Q1 2014 compared to Q1 2013. Another important observation is that Samsung (Apple’s biggest
competitor) increased both its shipment of tablets and its market share in Q1 2014 compared to Q1 2013. This is
certainly not a good sign for Apple going into the future.
In addition to competition from Android tablets, Apple Inc. also faces competition from Intel who is making its
presence known in the tablet market. Intel’s “Bay Trail Tablets” utilize processors that “are already marginally
faster than the A76, if provided with a 64 bit operating system.”
7 Bay Trail Tablets are also cheaper than ipads.
Apple Inc. is also expected to experience competition in their smartphone market which is the biggest revenue
earner for the company. According to SeekingAlpha: “Qualcomm (QCOM) has promised a line of 64 bit ARM
processors for the second half of the year (2014), so Android makers will also be able to offer for the first time
64 bit ARM processors competitive with Apple's A7.”8 Apple Inc. certainly has an edge in the smartphone
market because of its exclusive A7 64 bit processor. However, Android will soon take that exclusivity away and
as a result, iphone sales are likely to drop and Android sales are likely to increase in the near future.
6 it integrates most of a device’s processors into a circuit. It is referred to as system-on-a-chip and is used in every iphone S5, ipad
air, retina ipad mini. 7 http://seekingalpha.com/article/2176713-apples-ipad-problem
8 http://seekingalpha.com/article/2176713-apples-ipad-problem
12
New Products
Apple Inc. has not introduced a new product since it launched the ipad in 2010.
On April 29 2014, Apple updated its MacBook Air laptops with faster processors and lower prices.
“According to a research note obtained by AppleInsider, KGI analyst Ming-Chi Kuo believes the third
quarter is going to be a big one for Apple as the company is primed to release revamped iPad Airs and
iPad minis, the iWatch in two sizes, an all-new 4.7-inch iPhone, an Apple TV upgrade, an all-new12-
inch MacBook and an update to the MacBook Pro lineup.”9
Interestingly, AppleInsider reports that it is rumored that the iWatch is supposed to be Apple’s most
important product this year (even more important than the iPhone 6).
II. Industry Overview
Apple Inc. belongs to the Information Technology Industry, but specifically consumer electronics and personal
computing. Its biggest competitors are Samsung, Google and Microsoft. This industry’s target is the younger
generation, specifically within the age group of 16-25 years old. Generally speaking the industry markets
products to all ages, from children to adults but the early adapters come from the 16-25 age group.
Back in 2010 when Apple Inc. introduced the iPad, it held an exclusive position in this area. However, now
there are many rivals in this market-Samsung, Intel, Microsoft, Hewlett Packard, etc. Basically the industry is
becoming saturated with many tablet competitors (most of which are offering lower prices than Apple Inc.)
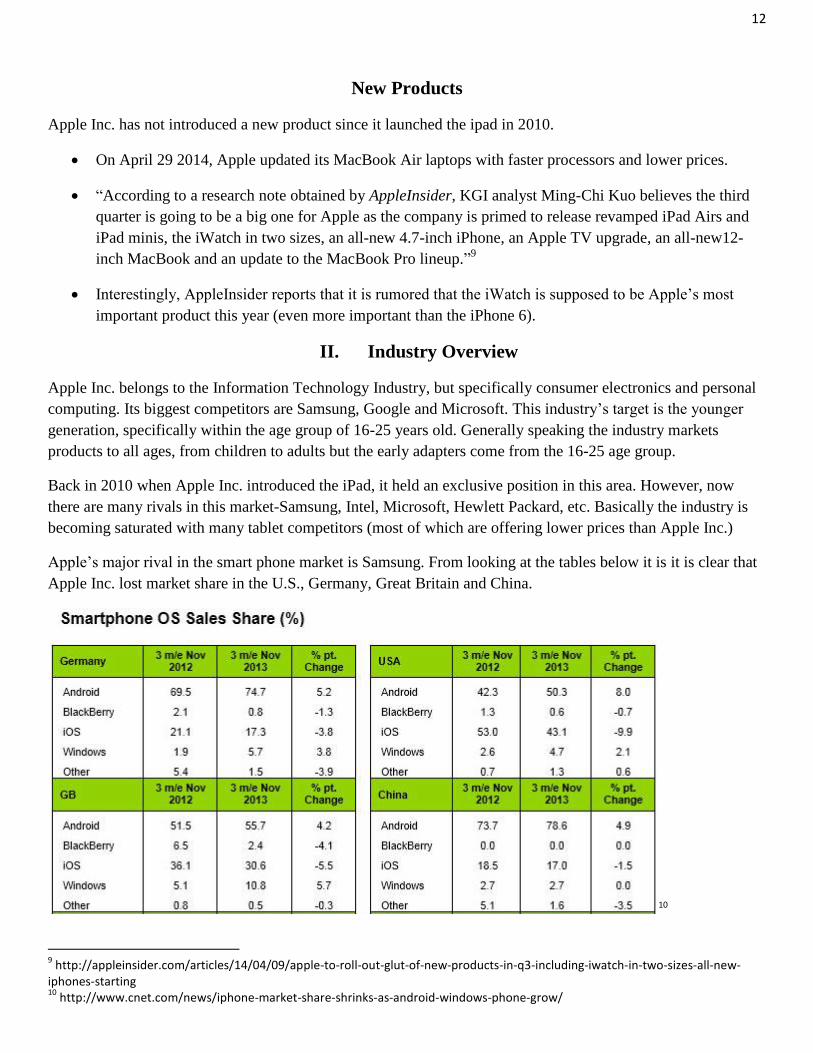
Apple’s major rival in the smart phone market is Samsung. From looking at the tables below it is it is clear that
Apple Inc. lost market share in the U.S., Germany, Great Britain and China.
10
9 http://appleinsider.com/articles/14/04/09/apple-to-roll-out-glut-of-new-products-in-q3-including-iwatch-in-two-sizes-all-new-
iphones-starting 10
http://www.cnet.com/news/iphone-market-share-shrinks-as-android-windows-phone-grow/

13
Unfortunately, it appears that Apple Inc. could possibly lose even more market share in this industry in the near
future as Android is expected to offer smart phones with 64 bit processors that is competitive with Apple’s A7.
Generally speaking Apple Inc. is expected to face more competition in its industry in the near future. Most of
Apple’s competitors have a price advantage over Apple Inc. since Apple’s products are highly priced compared
to that of other companies in the industry. In fact Apple Inc. seems to cater to the middle and upper classes
since low income earners often cannot afford, for example a MacBook Air which costs $900+.
III. Fundamental Analysis
A) Ratio Analysis
In the ratio analysis, we include Google, Intel, Microsoft, Samsung, HP, IBM, Research in Motion and Dell as
Apple’s major comparables. The industry average refers to the average performance of the above comparables.
However, in order to give a clear visual chart presentation, we select a few Apple’s major competitors, Google,
Intel, Microsoft and Samsung, to do the chart analysis.
Income & Cash Flow: with regard to Revenue, EBIT, CFO, Industry leadership is threatened by its competitors,
especially Samsung.
Sales Growth
Apple’s sales growth slowed significantly from 2010 to 2013. And in 2013, it was below Google, Intel and
Samsung. One explanation for the trend is since 2010 Apple has not introduced any new products. Its major
product strategy is innovation of existing products. In comparison, its competitors such as Samsung and Google
are introducing new products to create new market.
44.830%
65.830%
27.739% 28.132% 24.676% 26.521%
82.737%
67.242%
28.651%
5.725%
-20.000%
0.000%
20.000%
40.000%
60.000%
80.000%
100.000%
120.000%
140.000%
2004 2005 2006 2007 2008 2009 2010 2011 2012 2013
to to to to to to to to to to
2003 2004 2005 2006 2007 2008 2009 2010 2011 2012
Apple
Intel
Microsoft

14
EBIT Growth
From 2012-2013, Apple experienced a decrease in EBIT, when its EBIT yearly growth rate was -11.945%,
which was below industry average. In contrast, Google, Samsung were positive. The fierce competition was
from Samsung, which from 2012-2013 had high growth rate around 30%. And in view of recent 5 years’
average, while Apple’s recent 5 years’ average is lower than its 10 years’ average, Samsung had a significant
increase of 20% in its 5 years’ average compared to its 10 years’ performance.
EBIT Growth: 2003-2013 average vs. 2008-2013 average
2003-2013 2008-2013
Apple 83.28% 50.43%
Google 44.92% 16.11%
Intel 4.39% 5.38%
Microsoft 9.33% 3.48%
Samsung 20.32% 43.73%
HPQ 7.27% -4.81%
IBM 6.43% 3.29%
Research in
Motion
54.43% -7.95%
Dell -3.76% -7.02%
500.000%
194.543%
51.477% 72.331% 20.372%
58.629%
119.017% 98.706%
26.734% -11.945%
-100.000%
0.000%
100.000%
200.000%
300.000%
400.000%
500.000%
600.000%
2004 2005 2006 2007 2008 2009 2010 2011 2012 2013
to to to to to to to to to to
2003 2004 2005 2006 2007 2008 2009 2010 2011 2012
Apple
Intel
Microsoft
Samsung

15
Industry
Average
14.11% 13.89%
Cash Flow from Operations
Cash Flow from Operations indicates whether a company is able to generate sufficient positive cash flow to
maintain and grow its operations, or whether it may require external financing. Apple experienced a decrease in
CFO from 2012-2013 (CFO yearly growth rate was -7.374% from 2012 to 2013, below industry).
274.372%
37.114%
83.554% 71.840% 66.775%
11.678%
88.194% 100.602%
25.200%
-7.374%
-50.000%
0.000%
50.000%
100.000%
150.000%
200.000%
250.000%
300.000%
2004 2005 2006 2007 2008 2009 2010 2011 2012 2013
to to to to to to to to to to
2003 2004 2005 2006 2007 2008 2009 2010 2011 2012
Apple
Intel
Microsoft
Samsung
16
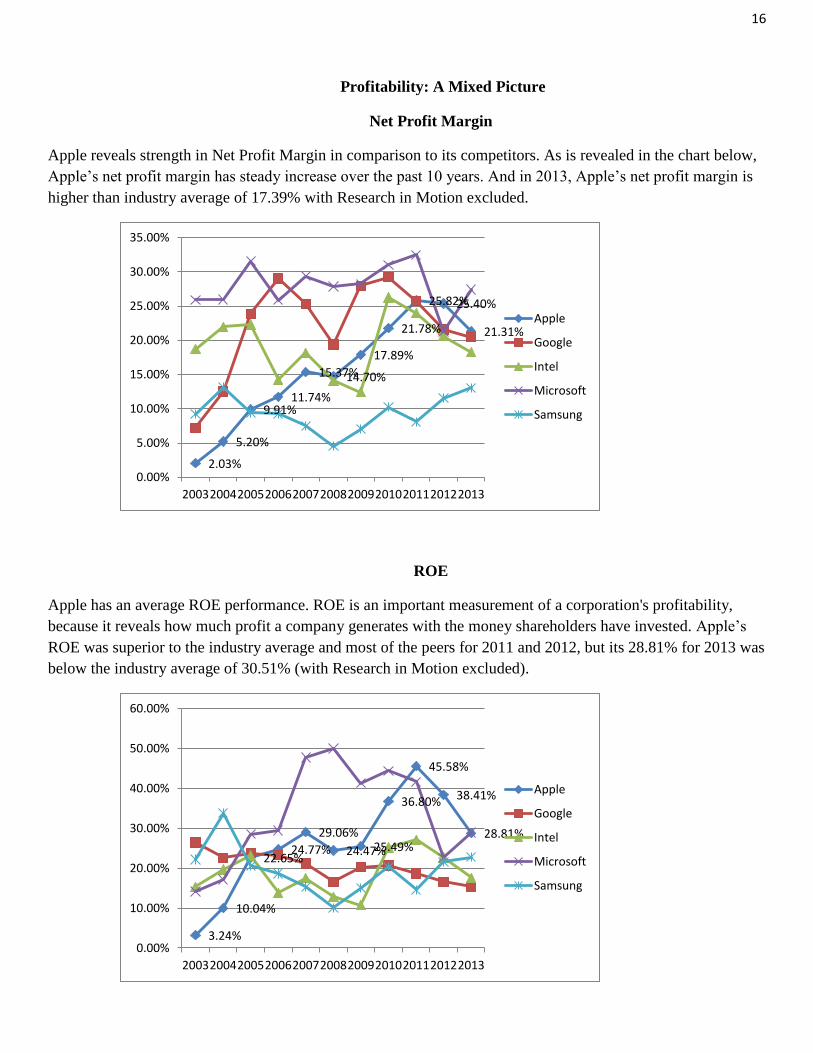
Profitability: A Mixed Picture
Net Profit Margin
Apple reveals strength in Net Profit Margin in comparison to its competitors. As is revealed in the chart below,
Apple’s net profit margin has steady increase over the past 10 years. And in 2013, Apple’s net profit margin is
higher than industry average of 17.39% with Research in Motion excluded.
ROE
Apple has an average ROE performance. ROE is an important measurement of a corporation's profitability,
because it reveals how much profit a company generates with the money shareholders have invested. Apple’s
ROE was superior to the industry average and most of the peers for 2011 and 2012, but its 28.81% for 2013 was
below the industry average of 30.51% (with Research in Motion excluded).
2.03%
5.20%
9.91% 11.74%
15.37% 14.70%
17.89%
21.78%
25.82% 25.40%
21.31%
0.00%
5.00%
10.00%
15.00%
20.00%
25.00%
30.00%
35.00%
2003 2004 2005 2006 2007 2008 2009 2010 2011 2012 2013
Apple
Intel
Microsoft
Samsung
3.24%
10.04%
22.65% 24.77%
29.06%
24.47% 25.49%
36.80%
45.58%
38.41%
28.81%
0.00%
10.00%
20.00%
30.00%
40.00%
50.00%
60.00%
2003 2004 2005 2006 2007 2008 2009 2010 2011 2012 2013
Apple
Intel
Microsoft
Samsung

17
Gross Margin
Gross Margin represents the proportion of each dollar of revenue that the company retains as gross profit, and
its mark-up per dollar of sales. Apple’s gross margin reveals disadvantage. Although Apple showed trend of
slight increase, it’s still lower than industry average.
ROA
ROA is an indicator of how profitable a company is relative to its total assets. ROA gives an idea as
to how efficient management is at using its assets to generate earnings. As is indicated in the chart
below, since 2010, there has been an industry trend of ROA decrease, but Apple’s ROA still
managed to remain high above industry average.
27.27% 27.85% 28.48% 30.24% 34.97% 34.34%
37.60% 39.12% 42.46% 41.87%
36.94%
0.00%
10.00%
20.00%
30.00%
40.00%
50.00%
60.00%
70.00%
80.00%
90.00%
Apple
Intel
Microsoft
Samsung
Industry Average
2.07%
6.22%
13.63% 14.43% 16.46%
13.34% 15.46%
23.66%
29.26%
24.94%
17.58%
0.00%
5.00%
10.00%
15.00%
20.00%
25.00%
30.00%
35.00%
Apple
Intel
Microsoft
Samsung
Industry Average

18
Operating Efficiency: Slightly Positive
Average Performance: Asset Turnover and Receivables Turnover.
The Asset Turnover: an indicator of the efficiency with which a company is deploying its assets, since it
measure sales per dollar of assets. Apple’s Asset Turnover is around the industry average over the past
10 years.
Receivables Turnover: how quickly the firm collects on its credit sales, turning sales into cash.
Apple’s Receivables Turnover is around industry average over the past 10 years.
1.018 1.195
1.375 1.229
1.071 0.907 0.864
1.086 1.133 0.982
0.825
0.000
0.500
1.000
1.500
2.000
2.500
3.000
Apple
Intel
Microsoft
Samsung
Industry Average
10.500 9.842
8.970
7.485 7.034 8.433
10.080 9.700 9.340 8.646
7.44
0.000
2.000
4.000
6.000
8.000
10.000
12.000
14.000
16.000
18.000
20.000
Apple
Intel
Microsoft
Samsung
Industry Average
19
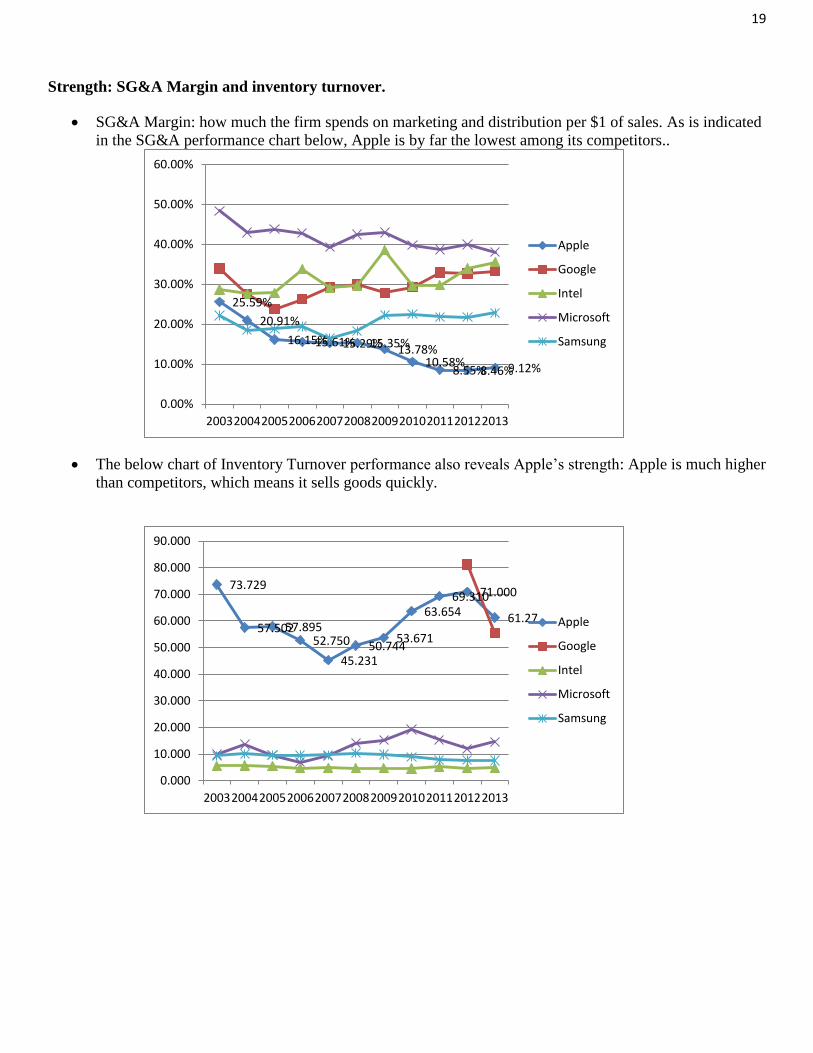
Strength: SG&A Margin and inventory turnover.
SG&A Margin: how much the firm spends on marketing and distribution per $1 of sales. As is indicated
in the SG&A performance chart below, Apple is by far the lowest among its competitors..
The below chart of Inventory Turnover performance also reveals Apple’s strength: Apple is much higher
than competitors, which means it sells goods quickly.
25.59%
20.91%
16.15% 15.61% 15.29% 15.35% 13.78% 10.58%
8.55% 8.46% 9.12%
0.00%
10.00%
20.00%
30.00%
40.00%
50.00%
60.00%
2003 2004 2005 2006 2007 2008 2009 2010 2011 2012 2013
Apple
Intel
Microsoft
Samsung
73.729
57.502 57.895 52.750
45.231 50.744
53.671
63.654 69.310 71.000
61.27
0.000
10.000
20.000
30.000
40.000
50.000
60.000
70.000
80.000
90.000
2003 2004 2005 2006 2007 2008 2009 2010 2011 2012 2013
Apple
Intel
Microsoft
Samsung
20
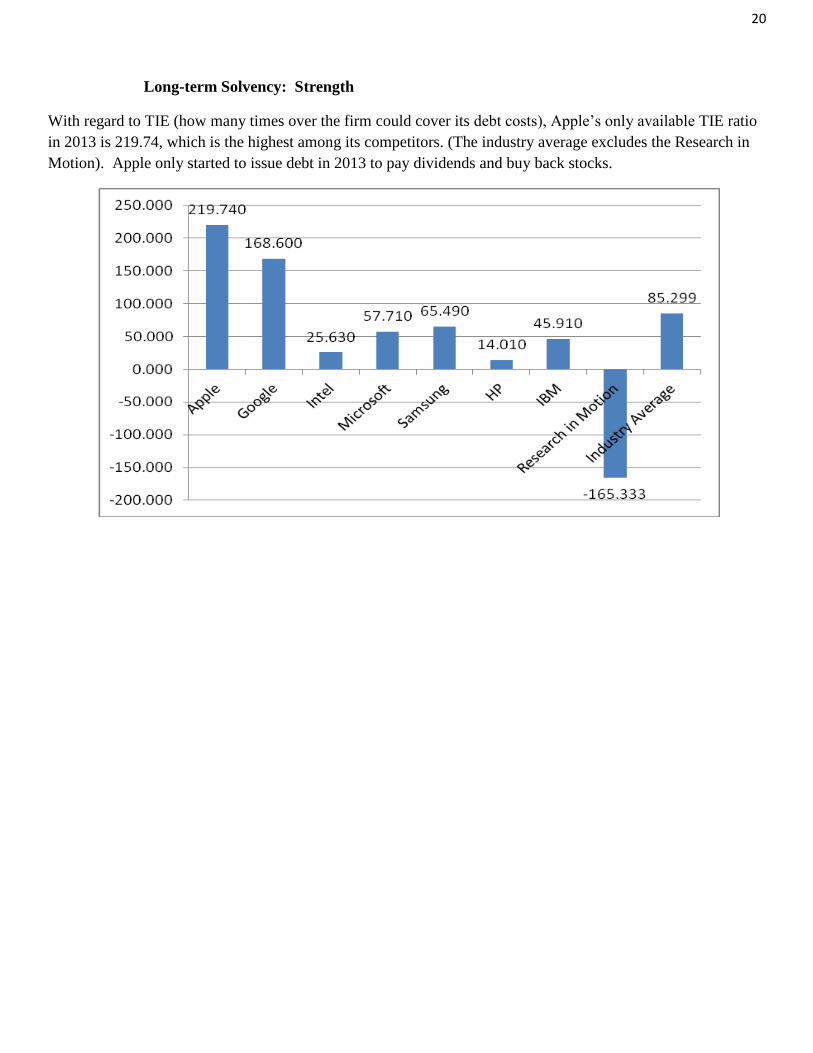
Long-term Solvency: Strength
With regard to TIE (how many times over the firm could cover its debt costs), Apple’s only available TIE ratio
in 2013 is 219.74, which is the highest among its competitors. (The industry average excludes the Research in
Motion). Apple only started to issue debt in 2013 to pay dividends and buy back stocks.

21
Short-term Liquidity
The Current ratio and Quick ratio 2 reveal that in comparison to the majority of its competitors, Apple’s ability
to pay its short-term obligations with its short-term assets is lower. As is indicated in the two charts below,
Apple’s current ratio and quick ratio 2 are below the industry average, and the firm shows decrease trend over
the past 10 years.
Current Ratio
Quick Ratio 2
2.531 2.581 2.404 2.271 2.486 2.219 2.545 1.846 1.583 1.543 1.49
0.000
2.000
4.000
6.000
8.000
10.000
12.000
14.000
2003 2004 2005 2006 2007 2008 2009 2010 2011 2012 2013
Apple
Intel
Microsoft
Samsung
2.342 2.371 2.198 2.042 2.171 1.969 2.266 1.591 1.348 1.309 1.226
0.000
2.000
4.000
6.000
8.000
10.000
12.000
14.000
2003 2004 2005 2006 2007 2008 2009 2010 2011 2012 2013
Apple
Intel
Microsoft
Samsung

22
DuPont Analysis
The DuPont identity breaks down Return on Equity (that is, the returns that investors receive from the firm) into
three distinct elements: ROE= (Profit Margin)*(Assets turnover)*(Financial Leverage-Averages). In Apple’s
case:
• Threat: Assets Turnover is around industry average.
• Uncertainty: Although Net Profit Margin is high, there’s uncertainty about its future profitability
considering its major product strategy of Innovating old products.
• Strength: Financial Leverage is low in comparison to Apple’s competitors. Apple only started to take on
debt in 2013.
1.018 1.195
1.375 1.229
1.071 0.907 0.864
1.086 1.133 0.982
0.825
0.000
0.500
1.000
1.500
2.000
2.500
3.000
Apple
Intel
Microsoft
Samsung
Industry Average
2.03%
5.20%
9.91% 11.74%
15.37% 14.70%
17.89%
21.78%
25.82% 25.40%
21.31%
0.00%
5.00%
10.00%
15.00%
20.00%
25.00%
30.00%
35.00%
2003 2004 2005 2006 2007 2008 2009 2010 2011 2012 2013
Apple
Intel
Microsoft
Samsung

23
1.568 1.614 1.661 1.716 1.766 1.834 1.648
1.555 1.558 1.540 1.639
0.000
0.500
1.000
1.500
2.000
2.500
3.000
Apple
Intel
Microsoft
Samsung
Industry Average
24
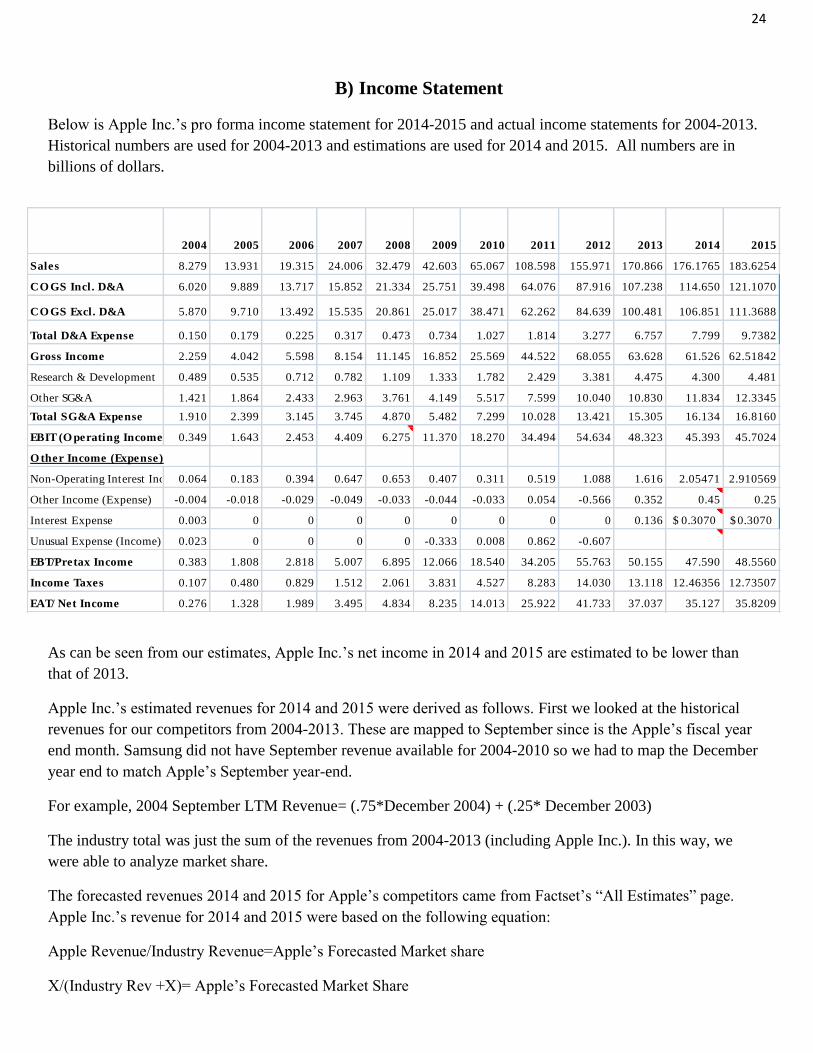
B) Income Statement
Below is Apple Inc.’s pro forma income statement for 2014-2015 and actual income statements for 2004-2013.
Historical numbers are used for 2004-2013 and estimations are used for 2014 and 2015. All numbers are in
billions of dollars.
As can be seen from our estimates, Apple Inc.’s net income in 2014 and 2015 are estimated to be lower than
that of 2013.
Apple Inc.’s estimated revenues for 2014 and 2015 were derived as follows. First we looked at the historical
revenues for our competitors from 2004-2013. These are mapped to September since is the Apple’s fiscal year
end month. Samsung did not have September revenue available for 2004-2010 so we had to map the December
year end to match Apple’s September year-end.
For example, 2004 September LTM Revenue= (.75*December 2004) + (.25* December 2003)
The industry total was just the sum of the revenues from 2004-2013 (including Apple Inc.). In this way, we
were able to analyze market share.
The forecasted revenues 2014 and 2015 for Apple’s competitors came from Factset’s “All Estimates” page.
Apple Inc.’s revenue for 2014 and 2015 were based on the following equation:
Apple Revenue/Industry Revenue=Apple’s Forecasted Market share
X/(Industry Rev +X)= Apple’s Forecasted Market Share
2004 2005 2006 2007 2008 2009 2010 2011 2012 2013 2014 2015
Sales 8.279 13.931 19.315 24.006 32.479 42.603 65.067 108.598 155.971 170.866 176.1765 183.6254
CO GS Incl. D&A 6.020 9.889 13.717 15.852 21.334 25.751 39.498 64.076 87.916 107.238 114.650 121.1070
CO GS Excl. D&A 5.870 9.710 13.492 15.535 20.861 25.017 38.471 62.262 84.639 100.481 106.851 111.3688
Total D&A Expense 0.150 0.179 0.225 0.317 0.473 0.734 1.027 1.814 3.277 6.757 7.799 9.7382
Gross Income 2.259 4.042 5.598 8.154 11.145 16.852 25.569 44.522 68.055 63.628 61.526 62.51842
Research & Development 0.489 0.535 0.712 0.782 1.109 1.333 1.782 2.429 3.381 4.475 4.300 4.481
Other SG&A 1.421 1.864 2.433 2.963 3.761 4.149 5.517 7.599 10.040 10.830 11.834 12.3345
Total SG&A Expense 1.910 2.399 3.145 3.745 4.870 5.482 7.299 10.028 13.421 15.305 16.134 16.8160
EBIT (O perating Income) 0.349 1.643 2.453 4.409 6.275 11.370 18.270 34.494 54.634 48.323 45.393 45.7024
O ther Income (Expense)
Non-Operating Interest Inc. 0.064 0.183 0.394 0.647 0.653 0.407 0.311 0.519 1.088 1.616 2.05471 2.910569
Other Income (Expense) -0.004 -0.018 -0.029 -0.049 -0.033 -0.044 -0.033 0.054 -0.566 0.352 0.45 0.25
Interest Expense 0.003 0 0 0 0 0 0 0 0 0.136 0.3070$ 0.3070$
Unusual Expense (Income) 0.023 0 0 0 0 -0.333 0.008 0.862 -0.607
EBT/Pretax Income 0.383 1.808 2.818 5.007 6.895 12.066 18.540 34.205 55.763 50.155 47.590 48.5560
Income Taxes 0.107 0.480 0.829 1.512 2.061 3.831 4.527 8.283 14.030 13.118 12.46356 12.73507
EAT/ Net Income 0.276 1.328 1.989 3.495 4.834 8.235 14.013 25.922 41.733 37.037 35.127 35.8209

25
The market share average in the table above is from 2004-2013 but it was much lower than the last three years
so we used the 2013 market share of 21.685% for 2014 and 2015.
Forecasted Depreciation and Amortization- Apple’s 2013 10K contained amortization estimates for 2014 and
2015. We used lagged depreciation on our income statement. For 2004-2013 we calculated depreciation
divided by prior year PPE. Then we found an average from 2010-2013 (23.66%) This average was used to
estimate depreciation for 2014 and 2015.
For example, 2014 depreciation= PPE in 2013 * 23.66%
The estimates for PPE in 2014 and 2015 came from Factset. Basically we just added the consensus estimates for
capital expenditures from the “All Estimates” page to the actual PPE from previous years.
For example, PPE 2014= Capital Expenditures 2014 + 2013 PPE
Research and Development for 2014 and 2015 were calculated as a percentage of sales.
For example, Research and Development 2014= (Average R&D % of Sales 2010-2013) * Forecasted Sales
2014.
Other SG&A Expense for 2014 and 2015 were also calculated as a percentage of sales.
R e v e nue
( in m illio ns ) 2 0 0 4 2 0 0 5 2 0 0 6 2 0 0 7 2 0 0 8 2 0 0 9 2 0 10 2 0 11 2 0 12 2 0 13 2 0 14 2 0 15
Go o gle as o f 09/xxxx 2670 5251 9319 14973 20921 22361 27369 35718 47339 56053 64419 74605
Inte l as o f 09/xxxx 33352 38223 35889 37316 40072 32784 42735 51569 53751 52351 53120 53909
Micro s o ft as o f 09/xxxx 37809 40340 45352 53905 61615 55243 65349 71260 72302 80191 85861 91825
Sams ung as o f 12/xxxx 71576.2 78722.6 89479.8 106019.3 110167.8 106,818.4 133724.1 148937.7 178499.3 208897 223413 232245
HP as o f 10/xxxx 79905 86696 91658 104286 118364 114077 125682 127854 119934 112250 111239.8 110583.3
IBM as o f 09/xxxx 94745 94168 89593 96178 105489 95535 98082 106448 104689 101356 97690 98352
Blackberry as o f 08/xxxx 944 1715 2393 4220 8375 13194 16801 20289 14954 10048 4143 3847
Apple as o f 09/xxxx 8279 13931 19315 24006 32479 42603 65067 108598 155971 170866 176176.52 183625.42
Indus try To ta l
Inc l. Apple (until 2013) 324986.93 357260 380309.5 436768.43 496445.68 483452.75 568082.68 665538 738246 787944 636257 663158
Indus try to ta l Inc l. Apple 812433 846784
Sams ung Sept. LTM 67282.925 76936 86790.5 101884.43 109130.68 107655.75 126997.68 143802 169306 204829 219784 230037
2 0 0 4 2 0 0 5 2 0 0 6 2 0 0 7 2 0 0 8 2 0 0 9 2 0 10 2 0 11 2 0 12 2 0 13 2 0 14 2 0 15
Indus try R e v e nue (billio ns ) 324986.925 357260 380309.5 436768.43 496445.7 483452.75 568082.675 665538 738246 787944 636256.8 663158.3
A pple 's M a rke t S ha re 0.025474871 0.038994 0.050788 0.0549628 0.065423 0.08812237 0.11453791 0.1631733 0.211272 0.21685 0.21685 0.21685044
M a rke t S ha re A v e ra g e 10.296%

26
Non-Operating Interest Income- Interest Rate Yield * (ST Investment + LT Marketable Securities)
Forecasted Interest Rate Yield- this was based on judgment. For example, for 2014 we used a yield of 1.4%
because interest rates are at an all time low and they can only go up so since the yield in 2012 = 1.334% and
2013= 1.333%, I predicted 1.4%.
To calculate forecasted ST investment we used a 2010-2013 growth rate to forecast 2014 and 2015.
To calculate forecasted LT marketable securities we used a 2011-2013 growth rate to forecast 2014 and 2015.
Other income expense - 2014 was difficult to estimate because the actual numbers in the previous years
fluctuated a lot. An average was not helpful (it actually resulted in negative numbers. The LTM March
preliminary number is .67 so I believe that the September 2014 number will also be positive. As a result, we
estimated 0.45. For 2015, we just used judgment to estimate 0.25.
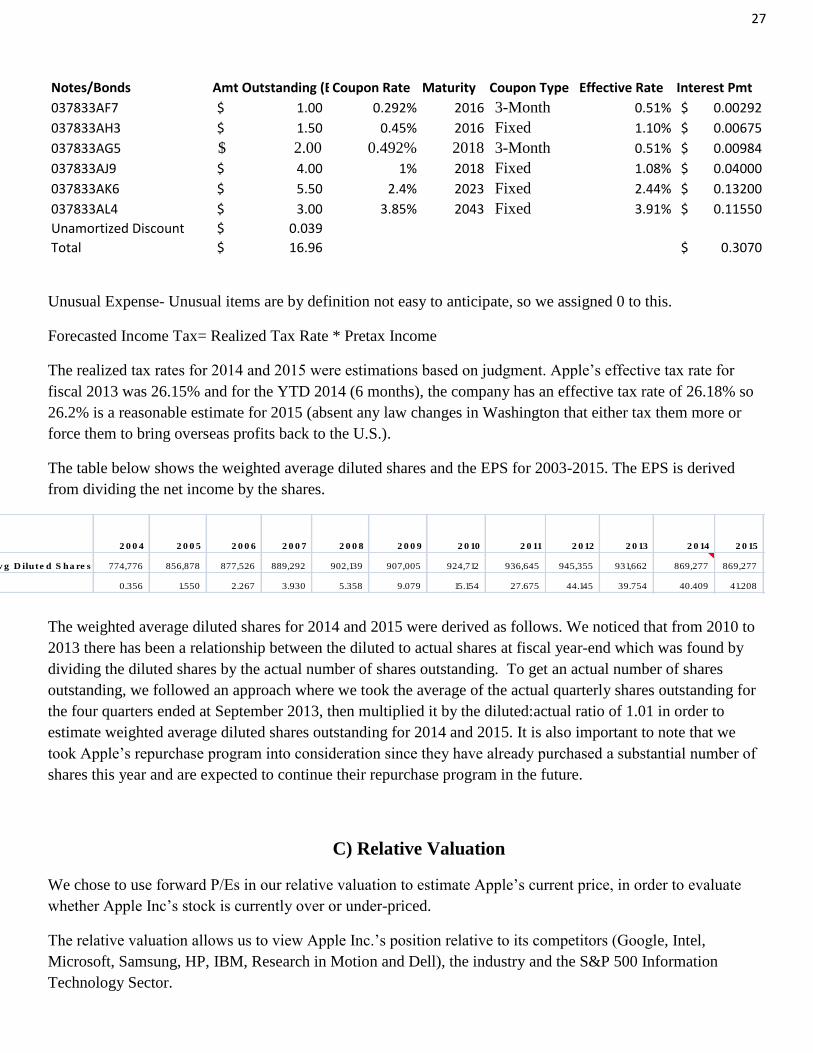
Interest Expense- This was based on notes and bonds that Apple Inc. issued. We found interest payment on each
individual note/bond as:
Interest Payment= Coupon Rate * Amount Outstanding.
All of the interest payments were summed to get a total of $0.3070 billion which is forecasted interest expense
for 2014 and 2015.
2 0 0 4 2 0 0 5 2 0 0 6 2 0 0 7 2 0 0 8 2 0 0 9 2 0 10 2 0 11 2 0 12 2 0 13
A v e ra g e
/
Gro wth
R a te
2 0 14 2 0 15
R &D a s a % o f S a le s 5.907% 3.840% 3.686% 3.258% 3.415% 3.129% 2.739% 2.237% 2.168% 2.619% 2.441% 4.300 4.4814
Othe r S G&A a s a % o f S a le s 17.164% 13.380% 12.596% 12.343% 11.580% 9.739% 8.479% 6.997% 6.437% 6.338% 6.72% 11.834 12.3345
D e pre c ia t io n a s a % o f P P E 0.00% 9.46% 8.65% 9.86% 11.47% 13.06% 13.28% 13.76% 11.88% 20.34% 15.33% 5.669 7.1905
P P E (Gro s s ) 1.300 1.480 2.080 2.840 3.750 4.670 7.230 11.770 21.890 28.520 36.989 46.9170
D e pre c ia t io n 0.140 0.180 0.280 0.430 0.610 0.960 1.620 2.600 5.800 6.749 8.7532
A m o rt iza t io n 0.192 0.605 0.96 1.05 0.985
To ta l C OGS Exc l. D &A a s
a % o f S a le s 70.90% 69.70% 69.85% 64.71% 64.23% 58.72% 59.13% 57.33% 54.27% 58.81% 60.65% 106.8511 111.3688
To ta l S G&A Expe ns e a s
a % o f R e v e nue 23.07% 17.22% 16.28% 15.60% 14.99% 12.87% 11.22% 9.23% 8.60% 8.96% 13.80%
R e a lize d Ta x R a te s 27.94% 26.55% 29.42% 30.20% 29.89% 31.75% 24.42% 24.22% 25.16% 26.15% 26.189% 26.228%
D e pre c ia t io n/ P rio r Ye a r P P E 10.77% 12.16% 13.46% 15.14% 16.27% 20.56% 22.41% 22.09% 26.50% 23.66% 6.74905 8.753177
2 0 0 3 2 0 0 4 2 0 0 5 2 0 0 6 2 0 0 7 2 0 0 8 2 0 0 9 2 0 10 2 0 11 2 0 12 2 0 13
Gro wth
R a te 2 0 14 2 0 15
Cas h & ST Inves tments 4.57 5.46 8.26 10.11 15.39 24.49 23.46 25.62 25.95 29.13 40.55 0.1654 47.2565 55.072148
Lo ng Term Marketable Securities 0 0 0 0 0 0 10.528 25.391 55.618 92.122 106.215 0.38193 146.781 202.84128
Interes t Inco me 0.064 0.183 0.394 0.647 0.653 0.407 0.311 0.519 1.088 1.616 2.05471 2.9105687
Interes t Yie ld 1.400% 3.352% 4.770% 6.400% 4.243% 1.662% 0.915% 1.017% 1.334% 1.333%
27
Notes/Bonds Amt Outstanding (BillionsCoupon Rate Maturity Coupon Type Effective Rate Interest Pmt
037833AF7 1.00$ 0.292% 2016 3-Month 0.51% 0.00292$
037833AH3 1.50$ 0.45% 2016 Fixed 1.10% 0.00675$
037833AG5 2.00$ 0.492% 2018 3-Month 0.51% 0.00984$
037833AJ9 4.00$ 1% 2018 Fixed 1.08% 0.04000$
037833AK6 5.50$ 2.4% 2023 Fixed 2.44% 0.13200$
037833AL4 3.00$ 3.85% 2043 Fixed 3.91% 0.11550$
Unamortized Discount 0.039$
Total 16.96$ 0.3070$
Unusual Expense- Unusual items are by definition not easy to anticipate, so we assigned 0 to this.
Forecasted Income Tax= Realized Tax Rate * Pretax Income
The realized tax rates for 2014 and 2015 were estimations based on judgment. Apple’s effective tax rate for
fiscal 2013 was 26.15% and for the YTD 2014 (6 months), the company has an effective tax rate of 26.18% so
26.2% is a reasonable estimate for 2015 (absent any law changes in Washington that either tax them more or
force them to bring overseas profits back to the U.S.).
The table below shows the weighted average diluted shares and the EPS for 2003-2015. The EPS is derived
from dividing the net income by the shares.
The weighted average diluted shares for 2014 and 2015 were derived as follows. We noticed that from 2010 to
2013 there has been a relationship between the diluted to actual shares at fiscal year-end which was found by
dividing the diluted shares by the actual number of shares outstanding. To get an actual number of shares
outstanding, we followed an approach where we took the average of the actual quarterly shares outstanding for
the four quarters ended at September 2013, then multiplied it by the diluted:actual ratio of 1.01 in order to
estimate weighted average diluted shares outstanding for 2014 and 2015. It is also important to note that we
took Apple’s repurchase program into consideration since they have already purchased a substantial number of
shares this year and are expected to continue their repurchase program in the future.
C) Relative Valuation
We chose to use forward P/Es in our relative valuation to estimate Apple’s current price, in order to evaluate
whether Apple Inc’s stock is currently over or under-priced.
The relative valuation allows us to view Apple Inc.’s position relative to its competitors (Google, Intel,
Microsoft, Samsung, HP, IBM, Research in Motion and Dell), the industry and the S&P 500 Information
Technology Sector.
2 0 0 4 2 0 0 5 2 0 0 6 2 0 0 7 2 0 0 8 2 0 0 9 2 0 10 2 0 11 2 0 12 2 0 13 2 0 14 2 0 15
Wg t A v g D ilute d S ha re s 774,776 856,878 877,526 889,292 902,139 907,005 924,712 936,645 945,355 931,662 869,277 869,277
EP S 0.356 1.550 2.267 3.930 5.358 9.079 15.154 27.675 44.145 39.754 40.409 41.208
28
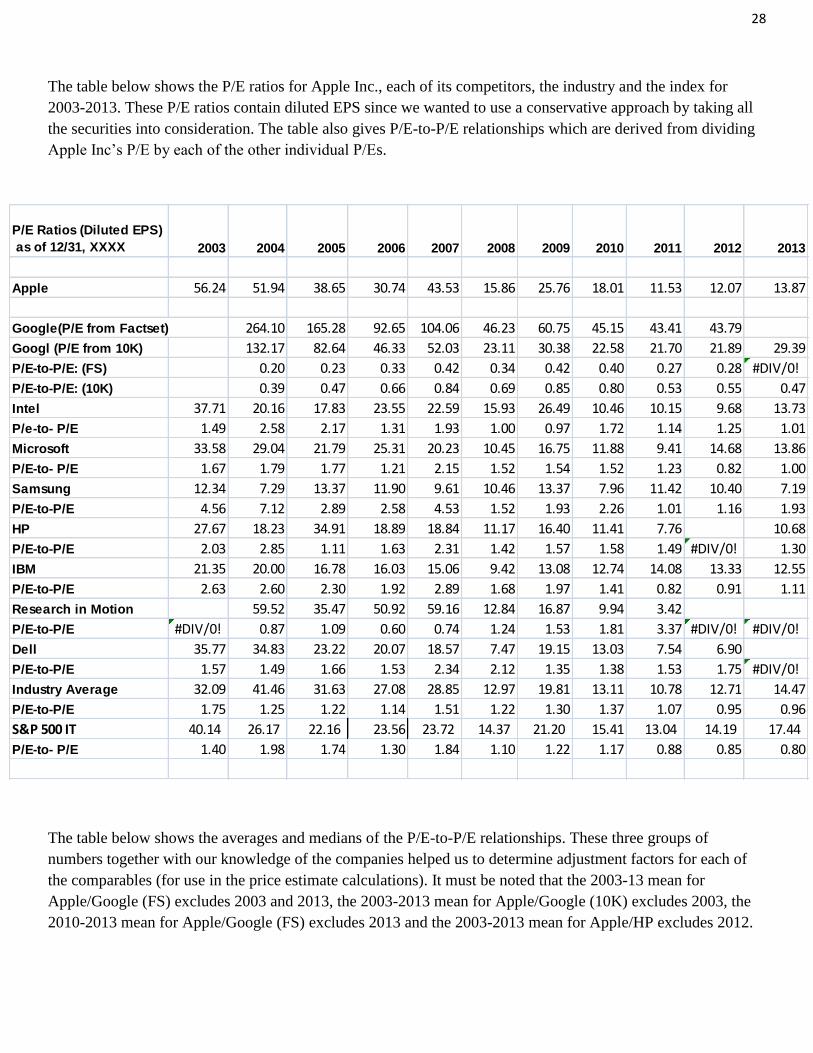
The table below shows the P/E ratios for Apple Inc., each of its competitors, the industry and the index for
2003-2013. These P/E ratios contain diluted EPS since we wanted to use a conservative approach by taking all
the securities into consideration. The table also gives P/E-to-P/E relationships which are derived from dividing
Apple Inc’s P/E by each of the other individual P/Es.
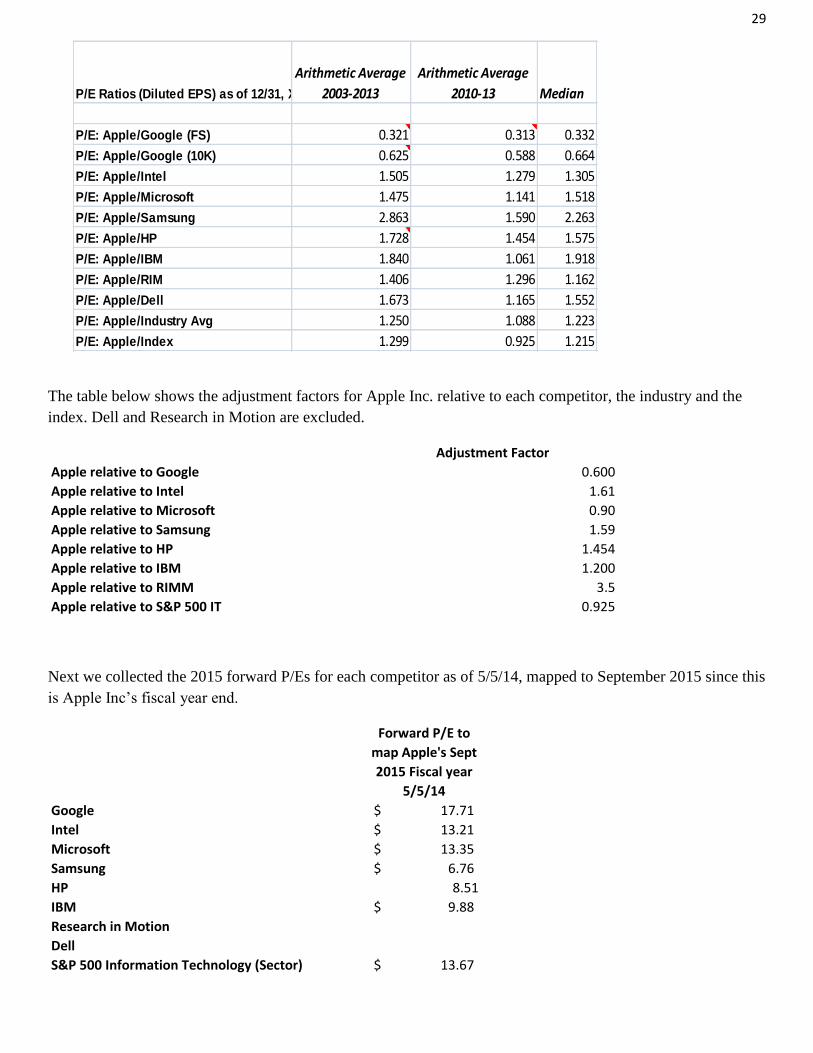
The table below shows the averages and medians of the P/E-to-P/E relationships. These three groups of
numbers together with our knowledge of the companies helped us to determine adjustment factors for each of
the comparables (for use in the price estimate calculations). It must be noted that the 2003-13 mean for
Apple/Google (FS) excludes 2003 and 2013, the 2003-2013 mean for Apple/Google (10K) excludes 2003, the
2010-2013 mean for Apple/Google (FS) excludes 2013 and the 2003-2013 mean for Apple/HP excludes 2012.
P/E Ratios (Diluted EPS)
as of 12/31, XXXX 2003 2004 2005 2006 2007 2008 2009 2010 2011 2012 2013
Apple 56.24 51.94 38.65 30.74 43.53 15.86 25.76 18.01 11.53 12.07 13.87
Google(P/E from Factset) 264.10 165.28 92.65 104.06 46.23 60.75 45.15 43.41 43.79
Googl (P/E from 10K) 132.17 82.64 46.33 52.03 23.11 30.38 22.58 21.70 21.89 29.39
P/E-to-P/E: (FS) 0.20 0.23 0.33 0.42 0.34 0.42 0.40 0.27 0.28 #DIV/0!
P/E-to-P/E: (10K) 0.39 0.47 0.66 0.84 0.69 0.85 0.80 0.53 0.55 0.47
Intel 37.71 20.16 17.83 23.55 22.59 15.93 26.49 10.46 10.15 9.68 13.73
P/e-to- P/E 1.49 2.58 2.17 1.31 1.93 1.00 0.97 1.72 1.14 1.25 1.01
Microsoft 33.58 29.04 21.79 25.31 20.23 10.45 16.75 11.88 9.41 14.68 13.86
P/E-to- P/E 1.67 1.79 1.77 1.21 2.15 1.52 1.54 1.52 1.23 0.82 1.00
Samsung 12.34 7.29 13.37 11.90 9.61 10.46 13.37 7.96 11.42 10.40 7.19
P/E-to-P/E 4.56 7.12 2.89 2.58 4.53 1.52 1.93 2.26 1.01 1.16 1.93
HP 27.67 18.23 34.91 18.89 18.84 11.17 16.40 11.41 7.76 10.68
P/E-to-P/E 2.03 2.85 1.11 1.63 2.31 1.42 1.57 1.58 1.49 #DIV/0! 1.30
IBM 21.35 20.00 16.78 16.03 15.06 9.42 13.08 12.74 14.08 13.33 12.55
P/E-to-P/E 2.63 2.60 2.30 1.92 2.89 1.68 1.97 1.41 0.82 0.91 1.11
Research in Motion 59.52 35.47 50.92 59.16 12.84 16.87 9.94 3.42
P/E-to-P/E #DIV/0! 0.87 1.09 0.60 0.74 1.24 1.53 1.81 3.37 #DIV/0! #DIV/0!
Dell 35.77 34.83 23.22 20.07 18.57 7.47 19.15 13.03 7.54 6.90
P/E-to-P/E 1.57 1.49 1.66 1.53 2.34 2.12 1.35 1.38 1.53 1.75 #DIV/0!
Industry Average 32.09 41.46 31.63 27.08 28.85 12.97 19.81 13.11 10.78 12.71 14.47
P/E-to-P/E 1.75 1.25 1.22 1.14 1.51 1.22 1.30 1.37 1.07 0.95 0.96
S&P 500 IT 40.14 26.17 22.16 23.56 23.72 14.37 21.20 15.41 13.04 14.19 17.44
P/E-to- P/E 1.40 1.98 1.74 1.30 1.84 1.10 1.22 1.17 0.88 0.85 0.80
29
The table below shows the adjustment factors for Apple Inc. relative to each competitor, the industry and the
index. Dell and Research in Motion are excluded.
Adjustment Factor
Apple relative to Google 0.600
Apple relative to Intel 1.61
Apple relative to Microsoft 0.90
Apple relative to Samsung 1.59
Apple relative to HP 1.454
Apple relative to IBM 1.200
Apple relative to RIMM 3.5
Apple relative to S&P 500 IT 0.925
Next we collected the 2015 forward P/Es for each competitor as of 5/5/14, mapped to September 2015 since this
is Apple Inc’s fiscal year end.
Forward P/E to
map Apple's Sept
2015 Fiscal year
5/5/14
Google 17.71$
Intel 13.21$
Microsoft 13.35$
Samsung 6.76$
HP 8.51
IBM 9.88$
Research in Motion
Dell
S&P 500 Information Technology (Sector) 13.67$
P/E Ratios (Diluted EPS) as of 12/31, XXXX
Arithmetic Average
2003-2013
Arithmetic Average
2010-13 Median
P/E: Apple/Google (FS) 0.321 0.313 0.332
P/E: Apple/Google (10K) 0.625 0.588 0.664
P/E: Apple/Intel 1.505 1.279 1.305
P/E: Apple/Microsoft 1.475 1.141 1.518
P/E: Apple/Samsung 2.863 1.590 2.263
P/E: Apple/HP 1.728 1.454 1.575
P/E: Apple/IBM 1.840 1.061 1.918
P/E: Apple/RIM 1.406 1.296 1.162
P/E: Apple/Dell 1.673 1.165 1.552
P/E: Apple/Industry Avg 1.250 1.088 1.223
P/E: Apple/Index 1.299 0.925 1.215

30
The Estimated EPS that was used in the price calculation was derived from the Income Statement. The E[EPS]
for Apple Inc. for 2015 is 41.21
The price estimates for Apple Inc. relative to each competitor was derived as follows.
Apple’s Price Estimate= Apple’s E[EPS] 2015 * Competitor Forward P/E Sept 2015 * Adjustment Factor
The table below shows Apple Inc’s price estimates relative to each competitor. The prices are then averaged to
give an estimate of Apple Inc.’s current price.
Price Estimate
Apple relative to Google 437.84$
Apple relative to Intel 876.13$
Apple relative to Microsoft 495.14$
Apple relative to Samsung 442.74$
Apple relative to HP 510.03$
Apple relative to IBM 488.71$
Apple relative to RIMM
Apple relative to S&P 500 IT 520.92$
Apple's Current Price 5/5/14 538.79$
However, Apple’s actual current price on 5/5/14 was $600.96. Therefore, Apple Inc.’s stock is overpriced.
D) Absolute Valuation
Absolute valuation is used to determine a company’s financial worth by finding the intrinsic value of the
company. Because Apple issues dividends, the Dividend Discount Model (DDM) will be calculated to find
future dividend payouts and be brought back to present value, to find the intrinsic value. Once we find the
intrinsic value, we will be able to analyze Apple by comparing it to today’s stock price.
Cost of Capital (k)
10-year 30-year
STRIP rates 2.859 3.681
Figure 1
To find the cost of capital, we first extracted data from Bloomberg, as you can see in figure 1. For the risk-free
rate, we used the 10-year and 30-year STRIP rates of 2.859% and 3.681%, respectively. We set the as of date to
be April 30, 2014.

31
5-year 10-year
Adjusted
BETA
0.952 1.179
Figure 2
If you look at figure 2, for the Beta, we decided to use 1.1 because we are taking a conservative approach. This
number is clearly closer to the 10-year adjusted beta than the 5- year. The reason why we decided in being
conservative is because it is expected that in the near future Apple will have much more competition in the
tablet and smartphone markets, which are their highest revenue earners.
Market Risk Premium 8.400%
Using Bloomberg market
return of 9.896% and
10-Year STRIP rate
7.037%
Using Bloomberg market
return of 9.896% and
30-year STRIP rate
6.215%
Market Return (Bloomberg) 9.896%
Figure 3
We used two different approaches to find the market risk premium for four different k calculations. The first
method, we used the arithmetic average of historical average we got in class of 8.4%,, to calculate the first two
set of k’s. For the second method, we used the formula, (E[rmkt] - rf), where E[rmkt] is the expected market return
and rf is the risk-free rate. Finally, the market return was pulled from Bloomberg and set the end date as April
30, 2014.
k1 12.099%
k2 12.921%
k3 10.600%
k4 10.518%
Figure 4
In finding the four k calculations, we used the Capital Asset Price Model (CAPM). For k1 and k2, we used the
10-year and 30-year STRIP rates, respectively, and first method for the market risk premium in solving the cost
of capital. For k3 and k4, we used the 10-year and 30-year STRIP rates, respectively, and the second method for
the market risk premium in solving the cost of capital. We decided to proceed with k1, 12.099%, and k2,
12.921%, to use for our dividend discount model and intrinsic value.

32
Dividend Discount Model (DDM)
From FactSet we were able to extract the diluted earnings per share (EPS) and dividends per share (DPS). The
reason why we only pulled data starting from 2012 was because Apple had recently issued dividends from the
fourth quarter of 2012. This is why the dividends per share for 2012, 2.65, is a lot lower than 2013, 11.40. The
dividend payout ratio was calculated by dividing the earnings per share by the dividends per share. This ratio
shows us how much of the earnings were paid to the shareholders in dividends.
For 2014, only two quarters have passed. The earnings per share were taken as an estimate from FactSet. For
the dividends per share, we multiplied the quarter dividend payouts, 3.05, by two. Apple stated that dividends
would increase to 3.29 starting from the third quarter onward. So we multiplied the new dividend, 3,29, by two,
again. We added both totals to get the dividends per share total for 2014.
2012 2013 2014 2015
EPS (diluted) 44.15 39.75 43.81 41.21
DPS 2.65 11.40 12.68 12.78
Dividend Payout Ratio 24.01% 28.68% 28.94% 31.00%
Figure 5
For 2015, we found the earnings per share from the income statement we had formulated, previously. We
estimated the dividend payout ratio, 31%, from looking at the previous dividend payout ratios and realized that
Apple has a history of increasing its annual dividends per share. The dividends per share was calculated by
multiplying earnings per share by our expected dividend payout ratio, 41.21 * 31% = 12.78.
The short history of paying dividends made it problematic for us to analyze the dividend growth rate for Apple.
Because of this we decided to assume that dividends were issued for the full year 2012. The adjusted dividends
per share total came out to 10.60 and the dividend payout ratio went up to 24.01%.
Growth
Rate
Average
DPS 6.42%
Dividend Payout
Ratio
9.80% 27.21%
Figure 6
The average annual growth rates for dividends per share came out to a total of 6.42% from year 2012 to 2015.
And the growth rate for dividend payout ratio was 9.80%, while the average was 27.21% from year 2012 to
2014.

33
2015 2016 2017 2018 2019 2020
E[DPS] $12.78 $13.60 $14.47 $15.40 $16.38 $17.44
Annual Growth
Rate
0.75% 6.42% 6.42% 6.42% 6.42% 6.42%
Figure 7
We took the recent historical growth rate of 6.42% and extended dividends per share from $12.78 in 2015,
estimate with a payout ratio and our EPS forecast, up to 2020. The growth rate was assumed that it would stay
constant yearly because we did not want to over or under evaluate the future growth rates. Dividends per share
will slowly rise yearly, just in case earnings per share drops. If dividends per share dropped, too, shareholders
will be suspicious about the firm. For obvious reasons, we are not able to measure year-to-year growth rates, so
we decided to be on the conservative side and keep the growth rate constant.
We then brought the expected dividends per share for each year back to present value, 2014. To get the present
value for the expected dividends we used k1, 12.099%. After each year was brought to present value, we
summed up the present values to get a total of $72.96. This total will be then calculated into the intrinsic value.
2014 2015 2016 2017 2018 2019 2020 Total
E[DPS] $12.68 $12.78 $13.60 $14.47 $15.40 $16.38 $17.44
PV ($12.68) ($11.40) ($10.82) ($10.27) ($9.75) ($9.26) ($8.79) ($72.96)
Figure 8
Terminal Value
To get the terminal value for Apple, we made two sensitivity analysis charts using different growth rates
between 1 to 9 percent and k1 and k2. For the first chart we used k1 and the second chart we used k2.
g
E(DPS2021)/
(k1-g) PV k1 IV k1
1.00% 158.6716127 ($79.96) ($152.92)
2.00% 176.1097956 ($88.75) ($161.71)
3.00% 197.3809674 ($99.47) ($172.43)
4.00% 223.9049288 ($112.84) ($185.80)

34
5.00% 257.9014812 ($129.97) ($202.93)
6.00% 303.0462717 ($152.72) ($225.68)
7.00% 365.8983737 ($184.40) ($257.35)
8.00% 459.4175174 ($231.52) ($304.48)
10.25% 1039.688884 ($523.95) ($596.91)
Figure 9
To get the intrinsic value, we first had to find the expected dividends per share for 2021 and divide that by (k1-
g). We then brought it back to present value at year 2014 and then added it to the total sum of the present value
of the dividends per share from years 2014 to 2020. If you see on the bottom line, the highlighted row, we
pumped in different growth rates so that the intrinsic value was matched to Apple’s stock price on May 05,
2014, which was $600.96. This shows that for Apple to be undervalued or fair valued the actual long-term
growth must exceed the expected long-term growth rate of 10.25%.
Before we start on the second sensitivity analysis chart, we had to bring back the expected dividends per share
from 2014 to 2020 using the k2, 12.921%. The sum of the present values came out to a total of $71.51.
2014 2015 2016 2017 2018 2019 2020 Total
E[DPS] $12.68 $12.78 $13.60 $14.47 $15.40 $16.38 $17.44
PV ($12.68) ($11.31) ($10.66) ($10.05) ($9.47) ($8.92) ($8.41) ($71.51)
Figure 10
g
E(DPS2021)/
(k2-g) PV k2 IV k2
1.00% 147.7305788 ($71.26) ($142.76)
2.00% 162.854393 ($78.55) ($150.06)
3.00% 181.027056 ($87.32) ($158.82)
4.00% 203.2738503 ($98.05) ($169.55)
5.00% 231.1378128 ($111.49) ($182.99)
6.00% 267.05378 ($128.81) ($200.32)
35
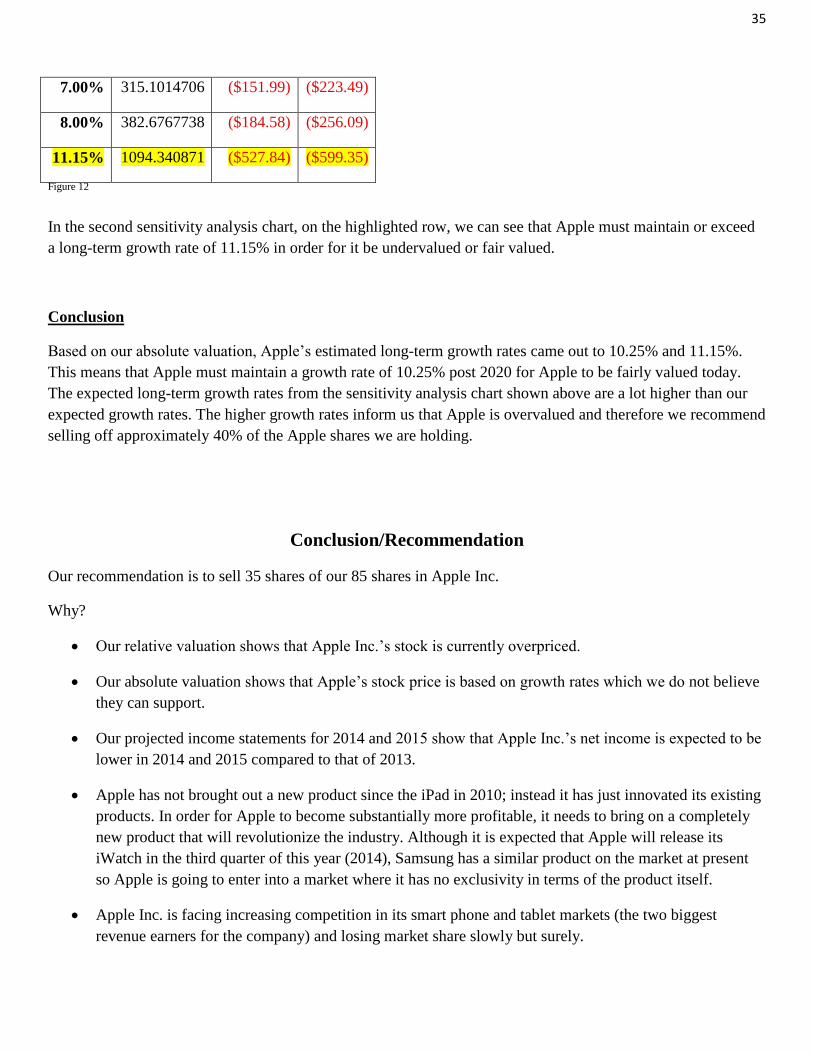
7.00% 315.1014706 ($151.99) ($223.49)
8.00% 382.6767738 ($184.58) ($256.09)
11.15% 1094.340871 ($527.84) ($599.35)
Figure 12
In the second sensitivity analysis chart, on the highlighted row, we can see that Apple must maintain or exceed
a long-term growth rate of 11.15% in order for it be undervalued or fair valued.
Conclusion
Based on our absolute valuation, Apple’s estimated long-term growth rates came out to 10.25% and 11.15%.
This means that Apple must maintain a growth rate of 10.25% post 2020 for Apple to be fairly valued today.
The expected long-term growth rates from the sensitivity analysis chart shown above are a lot higher than our
expected growth rates. The higher growth rates inform us that Apple is overvalued and therefore we recommend
selling off approximately 40% of the Apple shares we are holding.
Conclusion/Recommendation
Our recommendation is to sell 35 shares of our 85 shares in Apple Inc.
Why?
Our relative valuation shows that Apple Inc.’s stock is currently overpriced.
Our absolute valuation shows that Apple’s stock price is based on growth rates which we do not believe
they can support.
Our projected income statements for 2014 and 2015 show that Apple Inc.’s net income is expected to be
lower in 2014 and 2015 compared to that of 2013.
Apple has not brought out a new product since the iPad in 2010; instead it has just innovated its existing
products. In order for Apple to become substantially more profitable, it needs to bring on a completely
new product that will revolutionize the industry. Although it is expected that Apple will release its
iWatch in the third quarter of this year (2014), Samsung has a similar product on the market at present
so Apple is going to enter into a market where it has no exclusivity in terms of the product itself.
Apple Inc. is facing increasing competition in its smart phone and tablet markets (the two biggest
revenue earners for the company) and losing market share slowly but surely.

36
Bibliography
Alpha, Seeking. Every Dividend Income Investor Should Own Apple Now. 27 April 2014. 5 May 2014
<http://seekingalpha.com/article/2167923-every-dividend-income-investor-should-own-apple-now>.
Apple, About. Apple. 4 May 2014 <http://www.about-apple.com/>.
Ciaccia, Chris. Why Did Apple Buy Back $14B of Its Own Stock? 7 February 2014. 4 May 2014
<http://www.thestreet.com/story/12317347/1/why-did-apple-buy-back-14-billion-of-its-own-stock.html>.
Industry, About.Com Retail. Where are the locations of Apple Computer retail stores outside of the U.S.? 4 May 2014
<http://retailindustry.about.com/od/worldslargestretailers/f/Where-Are-The-Locations-Of-Apple-Computer-Retail-
Stores-Outside-Of-The-U-S.htm>.
Info, Apple Press. Apple Expands Capital Return Program to Over $130 Billion. 23 April 2014. 5 May 2014
<https://www.apple.com/pr/library/2014/04/23Apple-Expands-Capital-Return-Program-to-Over-130-Billion.html>.
Insider, Apple. Why Apple, Inc decided to split its stock 7-1. 29 April 2014. 5 May 2014
<http://appleinsider.com/articles/14/04/29/why-apple-inc-decided-to-split-its-stock-7-1->.
Money, CNN. Apple Inc.- Company Description. 4 May 2014
<http://money.cnn.com/quote/profile/profile.html?symb=AAPL>.
—. Fortune 500. 4 May 2014 <http://money.cnn.com/magazines/fortune/fortune500/>.
Nasdaq. Apple Inc. Dividend Date & History. 5 May 2014. 5 May 2014 <http://www.nasdaq.com/symbol/aapl/dividend-
history>.
—. Apple Inc. Stock Chart. 2 May 2014. 5 May 2014 <http://www.nasdaq.com/symbol/aapl/stock-
chart?intraday=off&timeframe=3m&charttype=line&splits=off&earnings=off&movingaverage=None&lowerstudy=volum
e&comparison=off&index=&drilldown=off&sDefault=true>.
Phillips, Matthew. Apple just became the world’s biggest-dividend stock. 24 April 2014. 5 May 2014
<http://qz.com/202630/apple-just-became-the-worlds-biggest-dividend-stock/>.
Ritchie, Rene. Apple A7. April 2014. 5 May 2014 <http://www.imore.com/apple-a7>.
Su, Reissa. Apple Inc Stock Split Decision May Cause Dramatic Fall in Stock Price to Below $100 Theoretically. 29 April
2014. 5 May 2014 <http://au.ibtimes.com/articles/549961/20140429/apple-inc-aapl-stock-buybacks-split.htm#.U2d-
HPldWSo>.
Terrell, Angelique Richardson & Ellen. Apple Computer Inc. April 2008. 4 May 2014
<http://www.loc.gov/rr/business/businesshistory/April/apple.html>.
Time. The Apple Revolution: 10 Key Moments. 4 May 2014
<http://content.time.com/time/specials/packages/article/0,28804,1873486_1873491_1873530,00.html>.
Whitney, Lance. iPhone market share shrinks as Android, Windows Phone grow. 6 January 2014. 7 May 2014
<http://www.cnet.com/news/iphone-market-share-shrinks-as-android-windows-phone-grow/>.
Factset

37
Bloomberg


![arXiv:1908.08984v1 [cs.CV] 12 Aug 2019 · provide correct details. Each E-commerce store has its own product taxonomy and a seller typically sells in multiple stores. This implies](https://static.fdocuments.in/doc/165x107/5eb38f1d32f7d33aa86e9c3d/arxiv190808984v1-cscv-12-aug-2019-provide-correct-details-each-e-commerce.jpg)


![Sh - [∫] [∫] She sells sea shells at the sea shore. The shells she sells are surely sea shells. So if she sells shells on the seashore, I'm sure she sells.](https://static.fdocuments.in/doc/165x107/56649f165503460f94c2b775/sh-she-sells-sea-shells-at-the-sea-shore-the-shells-she-sells.jpg)