Analyst presentation - Commonwealth Bank
143
13 FEBRUARY 2013 | COMMONWEALTH BANK OF AUSTRALIA | ACN 123 123 124
Transcript of Analyst presentation - Commonwealth Bank

13 FEBRUARY 2013 | COMMONWEALTH BANK OF AUSTRALIA | ACN 123 123 124
2
Notes
Disclaimer
The material that follows is a presentation of general background information about the Group’s activities
current at the date of the presentation, 13 February 2013. It is information given in summary form and
does not purport to be complete. It is not intended to be relied upon as advice to investors or potential
investors and does not take into account the investment objectives, financial situation or needs of any
particular investor. These should be considered, with or without professional advice when deciding if an
investment is appropriate.
Cash Profit
The Management Discussion and Analysis discloses the net profit after tax on both a ‘statutory basis’ and
a ‘cash basis’. The statutory basis is prepared in accordance with the Corporations Act 2001 and the
Australian Accounting Standards, which comply with International Financial Reporting Standards
(IFRS). The cash basis is used by management to present a clear view of the Group’s underlying
operating results, excluding a number of items that introduce volatility and/or one off distortions of the
Group’s current period performance. These items, such as hedging and IFRS volatility, are calculated
consistently year on year and do not discriminate between positive and negative adjustments. A list of
items excluded from statutory profit is provided in the reconciliation of the net profit after tax (“cash basis”)
on page 3 of the Profit Announcement (PA) and described in greater detail on page 15 of the PA and can
be accessed at our website http://www.commbank.com.au/about-us/shareholders/financial-
information/results/
3
Agenda
Ian Narev, CEO – Company Update
David Craig, CFO – Financial Overview
Ian Narev, CEO – Outlook and Summary
Questions and Answers
4
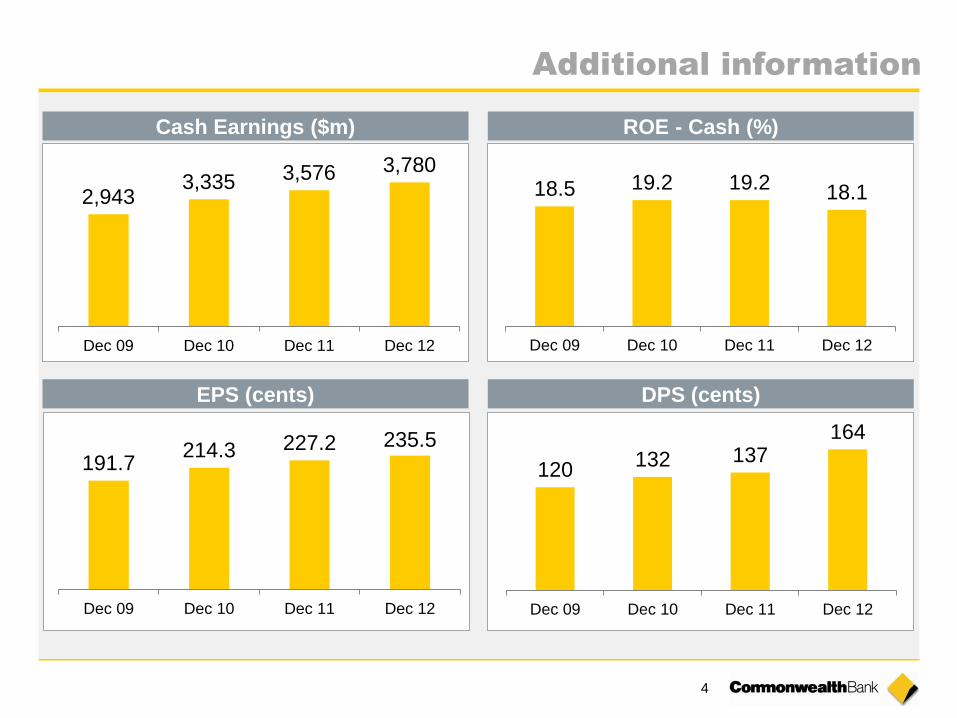
Cash Earnings ($m) ROE - Cash (%)
EPS (cents) DPS (cents)
18.1 19.2 19.2 18.5
Dec 12Dec 11Dec 10Dec 09
3,780 3,576 3,335 2,943
Dec 12Dec 11Dec 10Dec 09
235.5 227.2 214.3 191.7
Dec 12Dec 11Dec 10Dec 09
Additional information
120 132 137
164
Dec 09 Dec 10 Dec 11 Dec 12
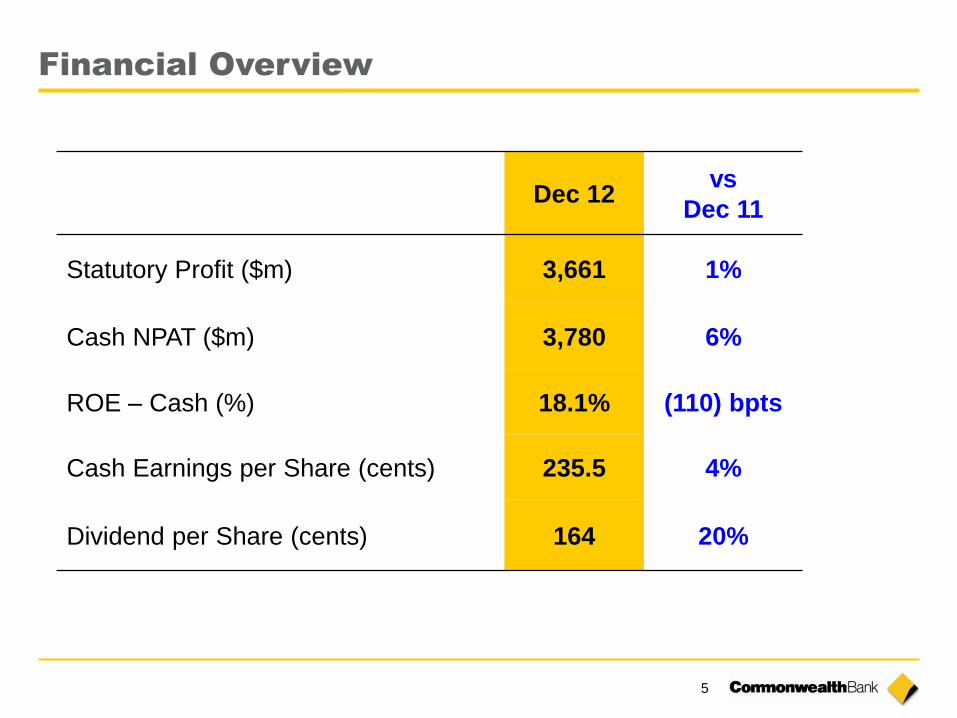
5
Dec 12 vs
Dec 11
Statutory Profit ($m) 3,661 1%
Cash NPAT ($m) 3,780 6%
ROE – Cash (%) 18.1% (110) bpts
Cash Earnings per Share (cents) 235.5 4%
Dividend per Share (cents) 164 20%
Financial Overview
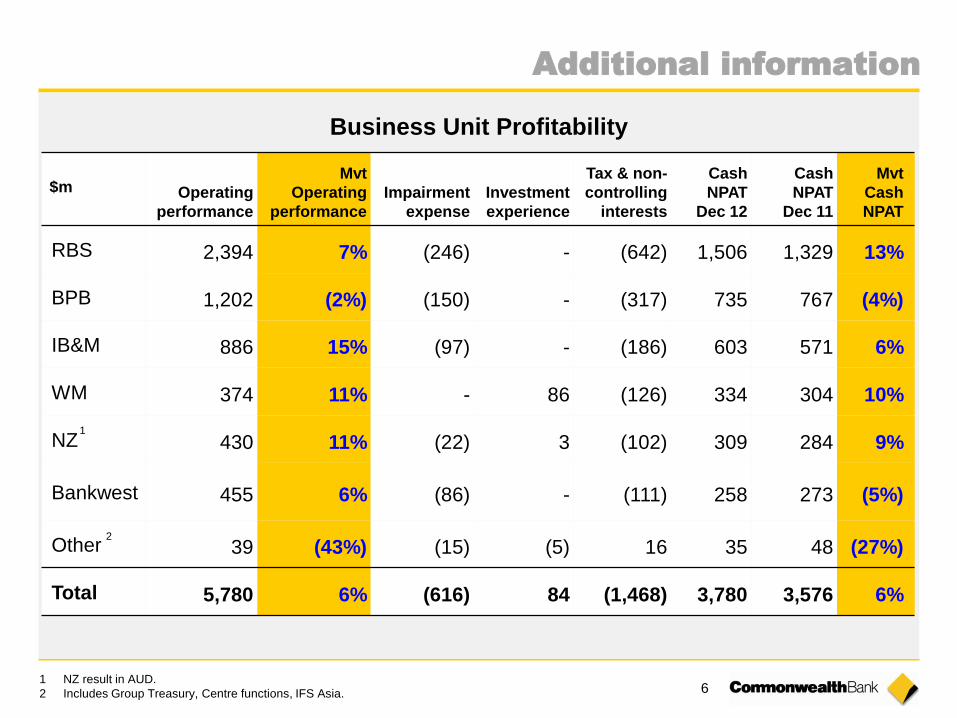
6 1 NZ result in AUD.
2 Includes Group Treasury, Centre functions, IFS Asia.
Additional information
Business Unit Profitability
$m Operating
performance
Mvt
Operating
performance
Impairment
expense
Investment
experience
Tax & non-
controlling
interests
Cash
NPAT
Dec 12
Cash
NPAT
Dec 11
Mvt
Cash
NPAT
RBS 2,394 7% (246) - (642) 1,506 1,329 13%
BPB 1,202 (2%) (150) - (317) 735 767 (4%)
IB&M 886 15% (97) - (186) 603 571 6%
WM 374 11% - 86 (126) 334 304 10%
NZ 430 11% (22) 3 (102) 309 284 9%
Bankwest 455 6% (86) - (111) 258 273 (5%)
Other 39 (43%) (15) (5) 16 35 48 (27%)
Total 5,780 6% (616) 84 (1,468) 3,780 3,576 6%
1
2
7
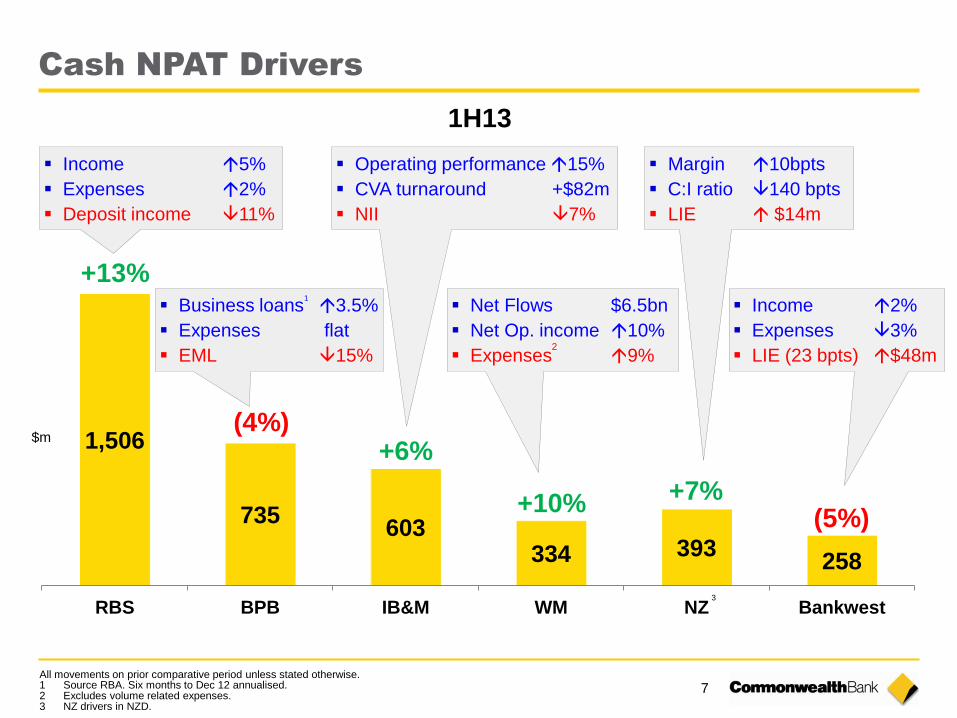
1,506
735 603
334 393 258
RBS BPB IB&M WM NZ Bankwest
+7%
Cash NPAT Drivers
All movements on prior comparative period unless stated otherwise. 1 Source RBA. Six months to Dec 12 annualised. 2 Excludes volume related expenses. 3 NZ drivers in NZD.
Income 5%
Expenses 2%
Deposit income 11%
Operating performance 15%
CVA turnaround +$82m
NII 7%
+13%
(4%)
+10% (5%)
+6%
Income 2%
Expenses 3%
LIE (23 bpts) $48m
Margin 10bpts
C:I ratio 140 bpts
LIE $14m
Net Flows $6.5bn
Net Op. income 10%
Expenses 9%
3
1H13
$m
Business loans 3.5%
Expenses flat
EML 15%
1
2
8
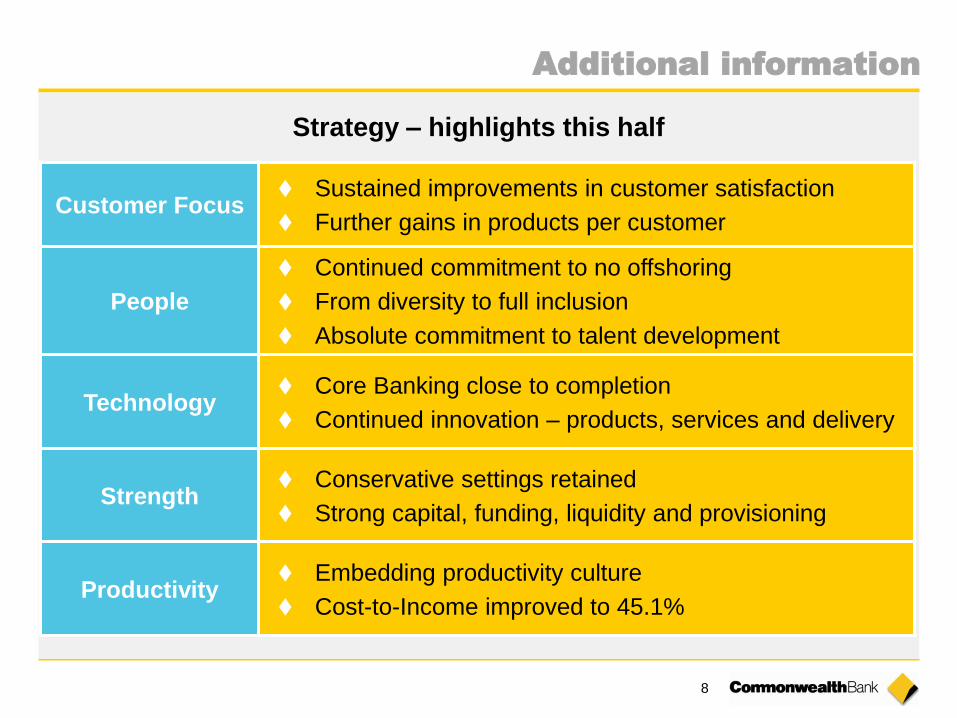
Strategy – highlights this half
Customer Focus Sustained improvements in customer satisfaction
Further gains in products per customer
People
Continued commitment to no offshoring
From diversity to full inclusion
Absolute commitment to talent development
Technology Core Banking close to completion
Continued innovation – products, services and delivery
Strength Conservative settings retained
Strong capital, funding, liquidity and provisioning
Productivity Embedding productivity culture
Cost-to-Income improved to 45.1%
Additional information
9
Gro
wth
op
po
rtu
nit
ies
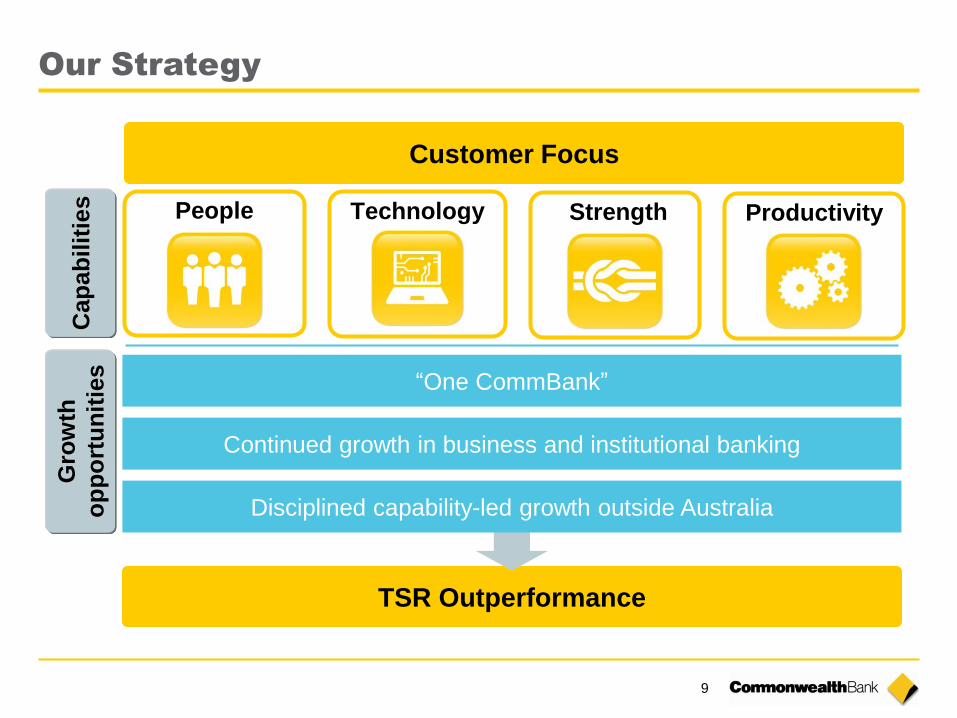
Customer Focus
Cap
ab
ilit
ies
TSR Outperformance
People Strength Technology Productivity
“One CommBank”
Continued growth in business and institutional banking
Disciplined capability-led growth outside Australia
Our Strategy
10
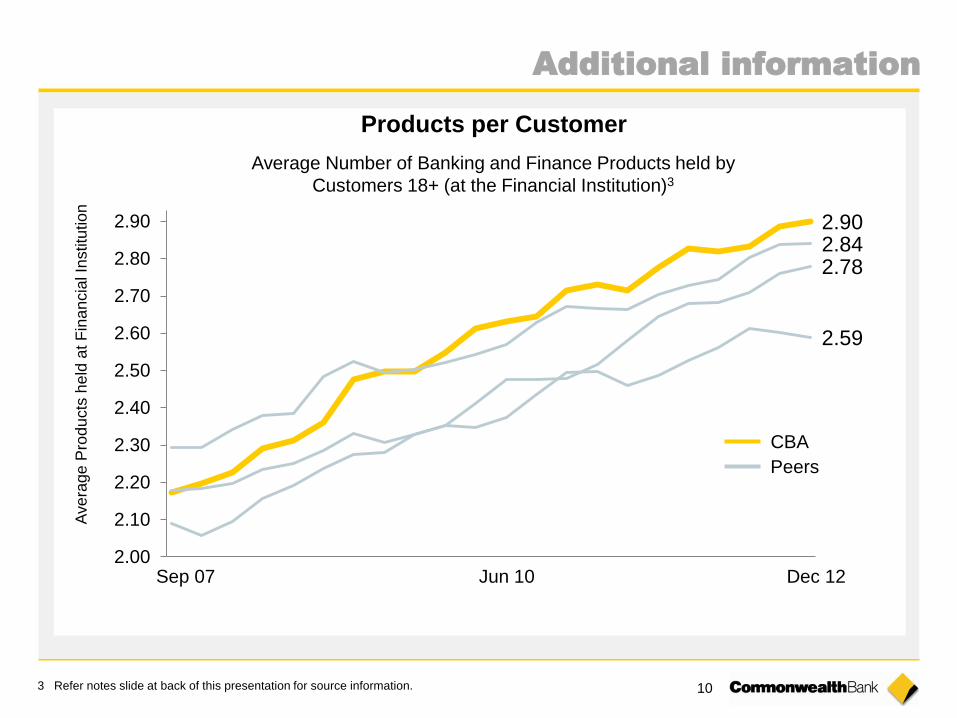
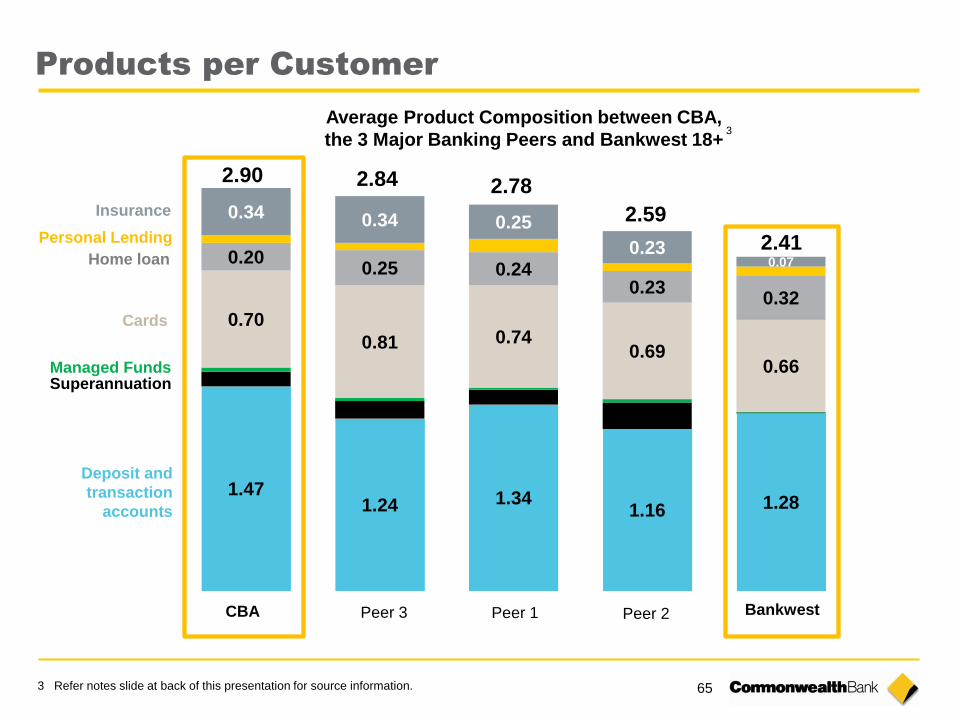
Products per Customer
2.90 2.84 2.78
2.59
2.00
2.10
2.20
2.30
2.40
2.50
2.60
2.70
2.80
2.90
Ave
rage
Pro
du
cts
he
ld a
t F
ina
ncia
l In
stitu
tio
n
Average Number of Banking and Finance Products held by
Customers 18+ (at the Financial Institution)3
Sep 07 Jun 10 Dec 12
CBA
Peers
Additional information
3 Refer notes slide at back of this presentation for source information.
11
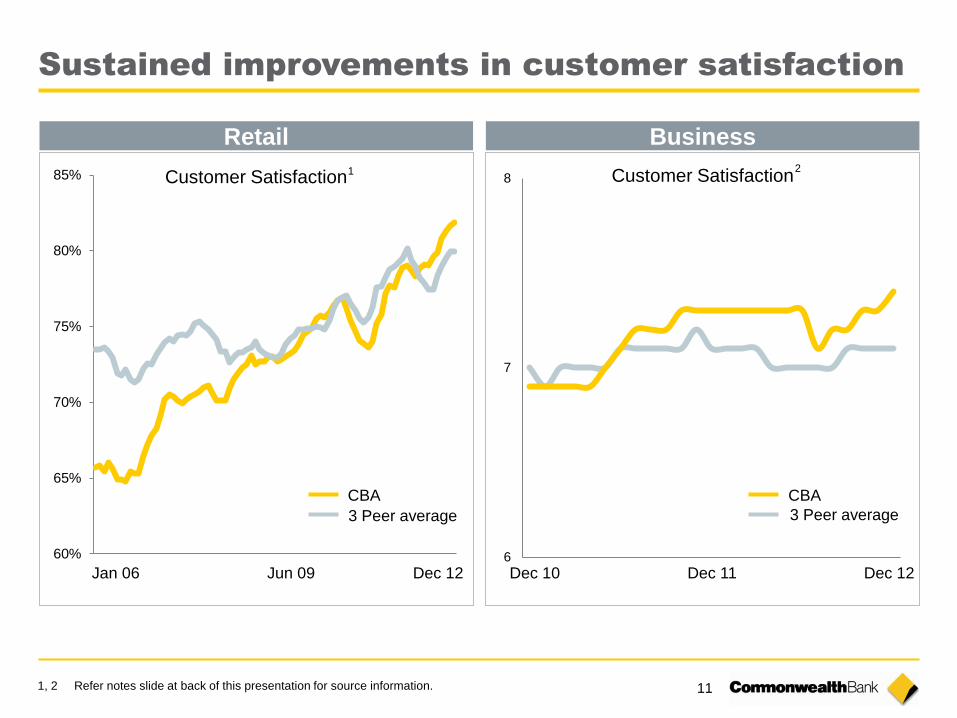
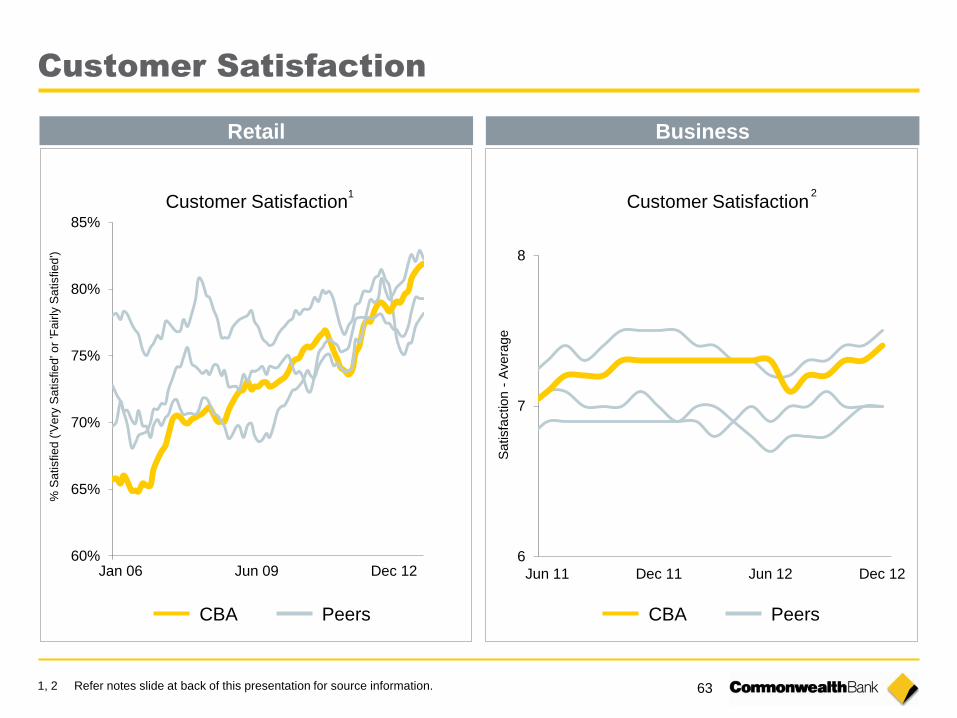
Sustained improvements in customer satisfaction
Retail
Jan 06 Jun 09 Dec 12
CBA
3 Peer average
Business
6
7
8
60%
65%
70%
75%
80%
85%
Dec 10 Dec 11 Dec 12
CBA
3 Peer average
Customer Satisfaction Customer Satisfaction 1 2
1, 2 Refer notes slide at back of this presentation for source information.
12
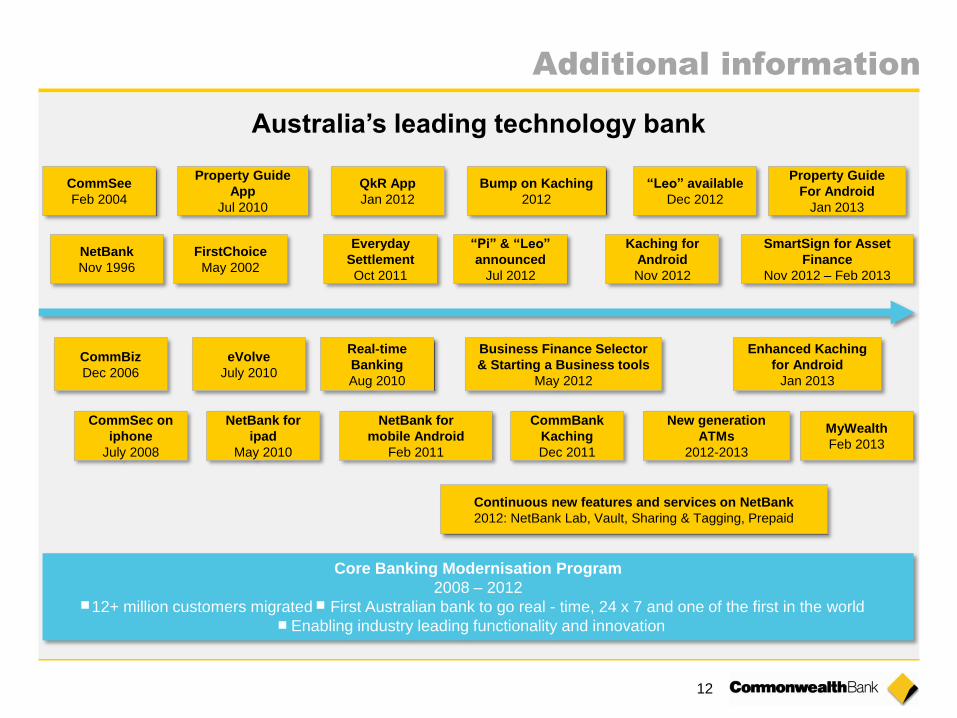
QkR App
Jan 2012
NetBank
Nov 1996
Business Finance Selector
& Starting a Business tools
May 2012
Real-time
Banking
Aug 2010
NetBank for
mobile Android
Feb 2011
Property Guide
App
Jul 2010
Everyday
Settlement
Oct 2011
CommBank
Kaching
Dec 2011
“Pi” & “Leo”
announced
Jul 2012
“Leo” available
Dec 2012
SmartSign for Asset
Finance
Nov 2012 – Feb 2013
MyWealth
Feb 2013
New generation
ATMs
2012-2013
Bump on Kaching
2012
Continuous new features and services on NetBank
2012: NetBank Lab, Vault, Sharing & Tagging, Prepaid
Core Banking Modernisation Program
2008 – 2012
12+ million customers migrated First Australian bank to go real - time, 24 x 7 and one of the first in the world
Enabling industry leading functionality and innovation
Kaching for
Android
Nov 2012
eVolve
July 2010
NetBank for
ipad
May 2010
CommSee
Feb 2004
CommBiz
Dec 2006
CommSec on
iphone
July 2008
Enhanced Kaching
for Android
Jan 2013
Property Guide
For Android
Jan 2013
Australia’s leading technology bank
Additional information
FirstChoice
May 2002
13
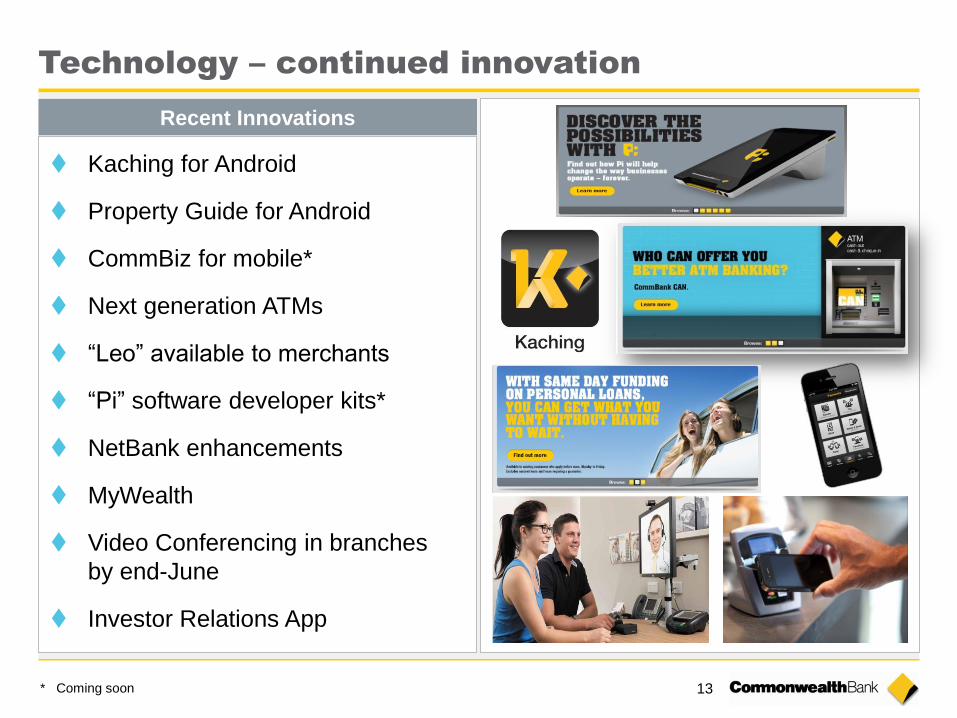
Kaching for Android
Property Guide for Android
CommBiz for mobile*
Next generation ATMs
“Leo” available to merchants
“Pi” software developer kits*
NetBank enhancements
MyWealth
Video Conferencing in branches
by end-June
Investor Relations App
Recent Innovations
* Coming soon
Technology – continued innovation

14
Notes
15
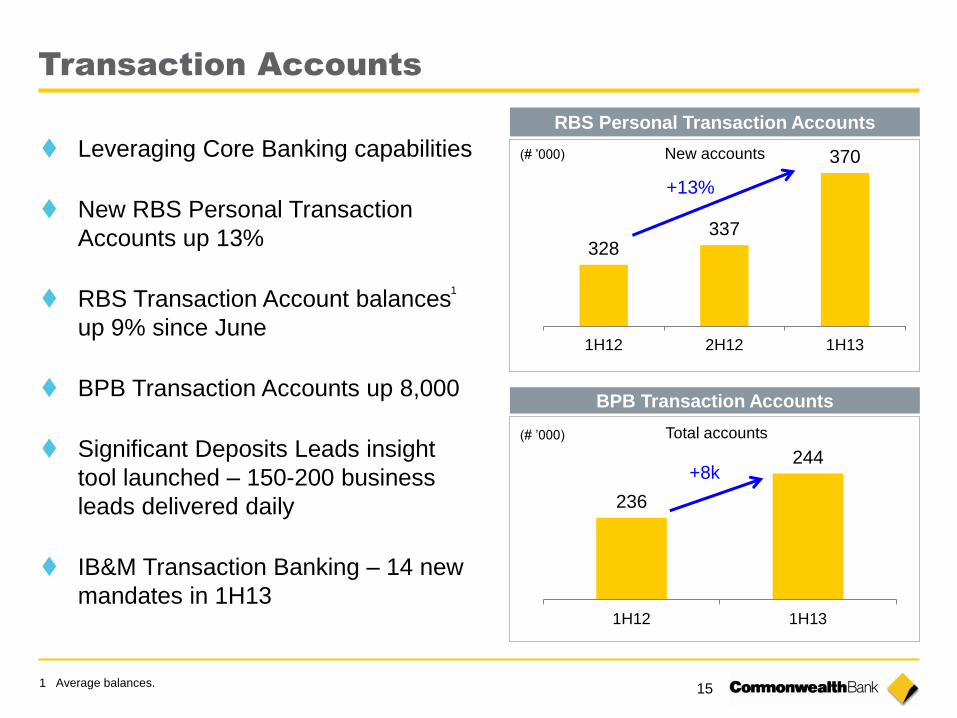
Transaction Accounts
Leveraging Core Banking capabilities
New RBS Personal Transaction
Accounts up 13%
RBS Transaction Account balances
up 9% since June
BPB Transaction Accounts up 8,000
Significant Deposits Leads insight
tool launched – 150-200 business
leads delivered daily
IB&M Transaction Banking – 14 new
mandates in 1H13
328 337
370
1H12 2H12 1H13
+13%
New accounts (# ’000)
236
244
1H12 1H13
RBS Personal Transaction Accounts
BPB Transaction Accounts
+8k
Total accounts (# ’000)
1
1 Average balances.
16
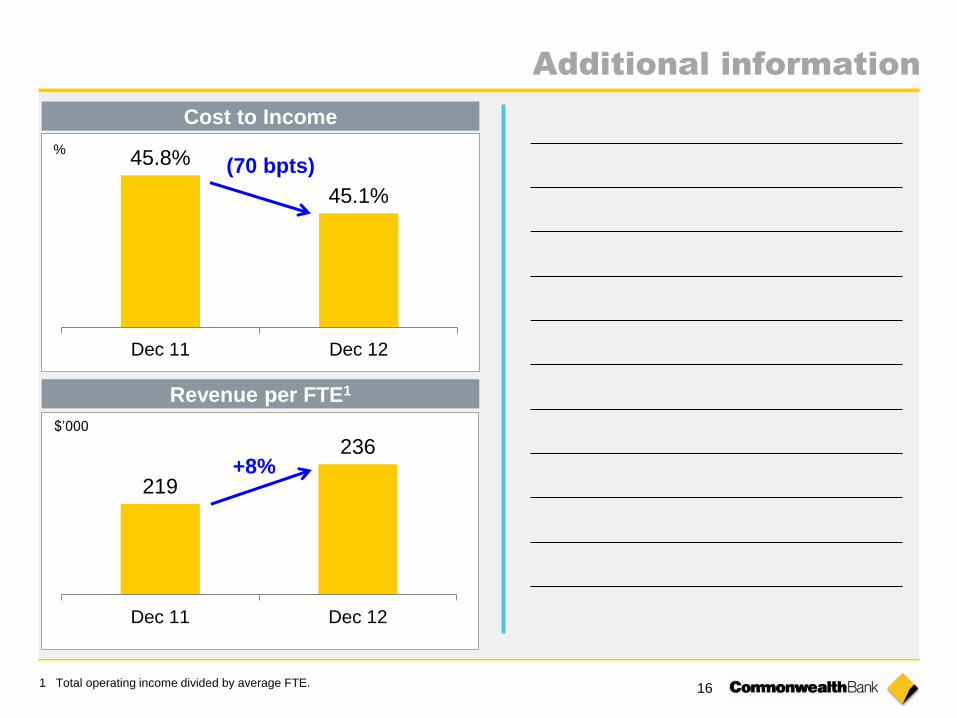
45.8%
45.1%
Dec 11 Dec 12
219
236
Dec 11 Dec 12
$’000
+8%
(70 bpts)
Cost to Income
Revenue per FTE1
Additional information
1 Total operating income divided by average FTE.
%
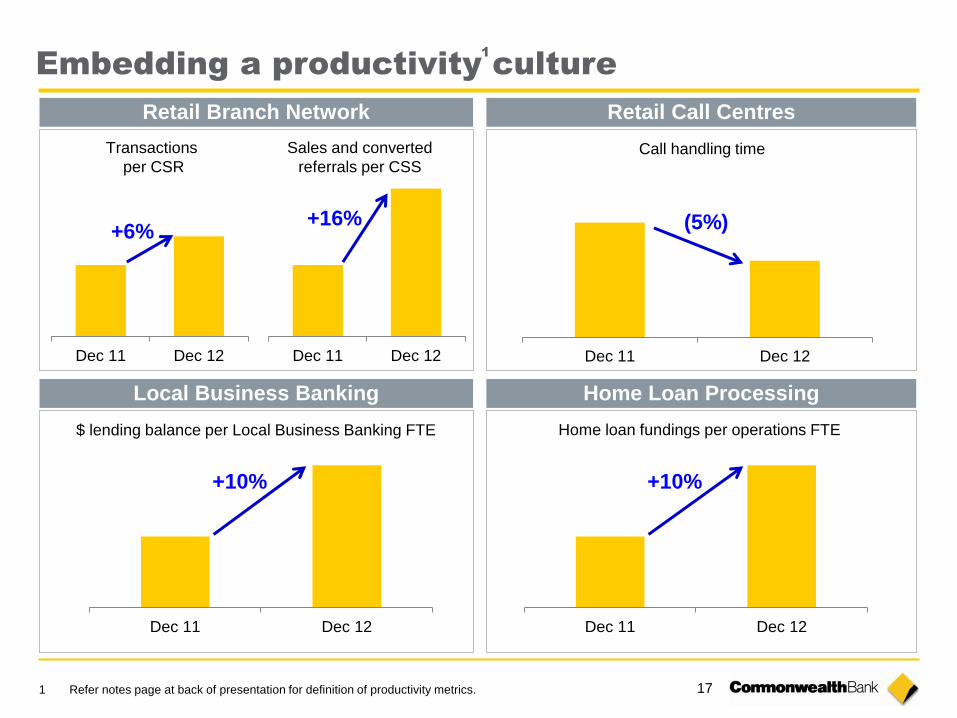
17
Retail Branch Network Retail Call Centres
Dec 11 Dec 12 Dec 11 Dec 12
Sales and converted
referrals per CSS
$ lending balance per Local Business Banking FTE
+6% (5%)
Home loan fundings per operations FTE
Local Business Banking Home Loan Processing
Dec 11 Dec 12
Transactions
per CSR
+16%
Call handling time
Embedding a productivity culture
1 Refer notes page at back of presentation for definition of productivity metrics.
Dec 11 Dec 12
+10%
Dec 11 Dec 12
+10%
1
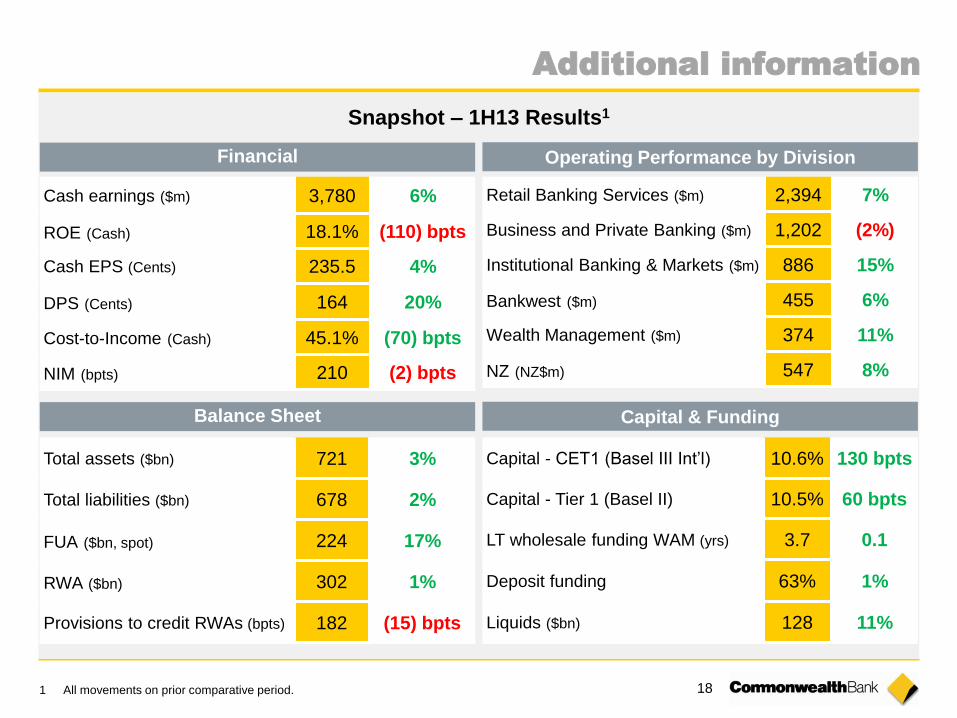
18
Cash earnings ($m) 3,780 6%
ROE (Cash) 18.1% (110) bpts
Cash EPS (Cents) 235.5 4%
DPS (Cents) 164 20%
Cost-to-Income (Cash) 45.1% (70) bpts
NIM (bpts) 210 (2) bpts
Retail Banking Services ($m) 2,394 7%
Business and Private Banking ($m) 1,202 (2%)
Institutional Banking & Markets ($m) 886 15%
Bankwest ($m) 455 6%
Wealth Management ($m) 374 11%
NZ (NZ$m) 547 8%
1 All movements on prior comparative period.
Snapshot – 1H13 Results1
Total assets ($bn) 721 3%
Total liabilities ($bn) 678 2%
FUA ($bn, spot) 224 17%
RWA ($bn) 302 1%
Provisions to credit RWAs (bpts) 182 (15) bpts
Financial Operating Performance by Division
Balance Sheet Capital & Funding
Capital - CET1 (Basel III Int’l) 10.6% 130 bpts
Capital - Tier 1 (Basel II) 10.5% 60 bpts
LT wholesale funding WAM (yrs) 3.7 0.1
Deposit funding 63% 1%
Liquids ($bn) 128 11%
Additional information
19
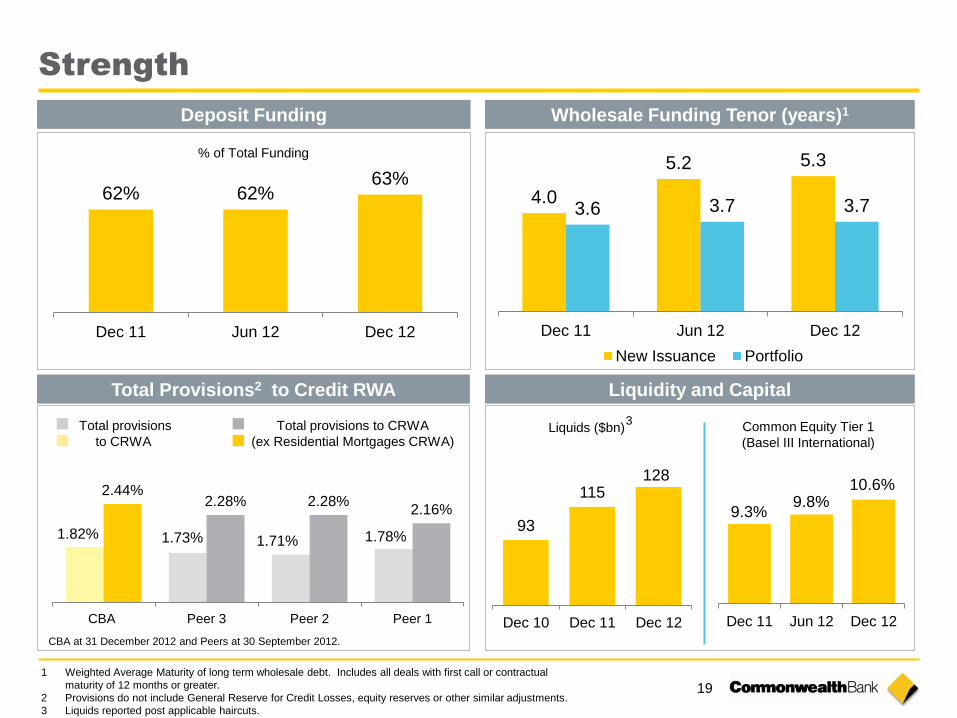
Strength
Wholesale Funding Tenor (years)1
Liquidity and Capital
1 Weighted Average Maturity of long term wholesale debt. Includes all deals with first call or contractual
maturity of 12 months or greater.
2 Provisions do not include General Reserve for Credit Losses, equity reserves or other similar adjustments.
3 Liquids reported post applicable haircuts.
Deposit Funding
% of Total Funding
Liquids ($bn)
Dec 11 Jun 12 Dec 12
Common Equity Tier 1
(Basel III International)
62% 62% 63%
Dec 11 Jun 12 Dec 12
93
115 128
Dec 10 Dec 11 Dec 12
9.3% 9.8%
10.6%
4.0
5.2 5.3
3.6 3.7 3.7
Dec 11 Jun 12 Dec 12
New Issuance Portfolio
3
Total Provisions2 to Credit RWA
Total provisions
to CRWA
Total provisions to CRWA
(ex Residential Mortgages CRWA)
CBA at 31 December 2012 and Peers at 30 September 2012.
1.82% 1.73% 1.71% 1.78%
2.44% 2.28% 2.28%
2.16%
CBA Peer 3 Peer 2 Peer 1

20
Notes

13 FEBRUARY 2013 | COMMONWEALTH BANK OF AUSTRALIA | ACN 123 123 124

22
Notes
23
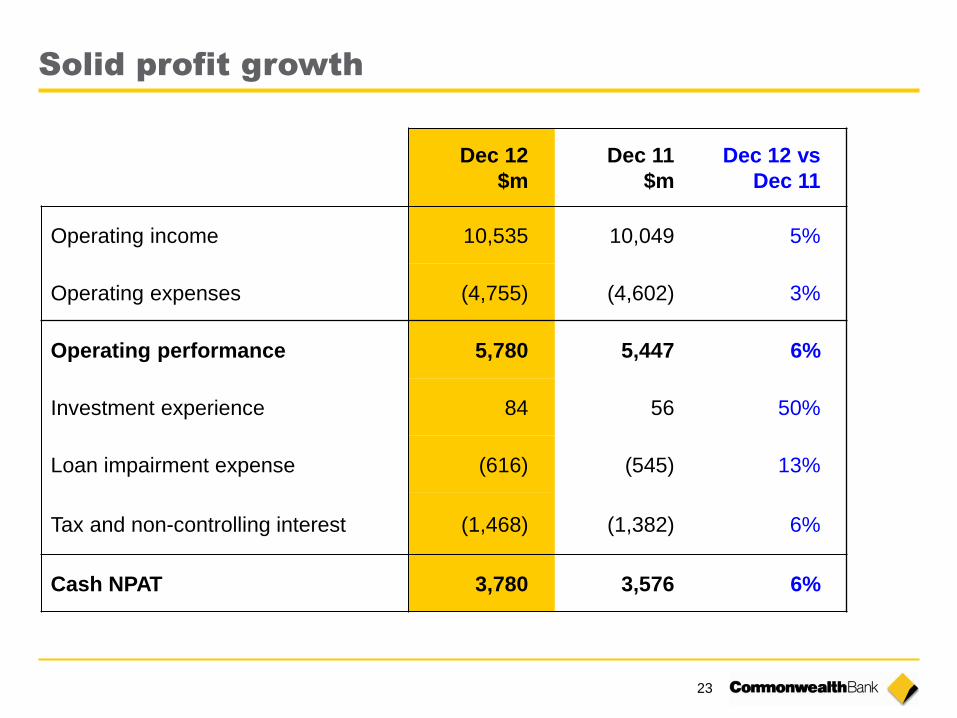
Solid profit growth
Dec 12
$m
Dec 11
$m
Dec 12 vs
Dec 11
Operating income 10,535 10,049 5%
Operating expenses (4,755) (4,602) 3%
Operating performance 5,780 5,447 6%
Investment experience 84 56 50%
Loan impairment expense (616) (545) 13%
Tax and non-controlling interest (1,468) (1,382) 6%
Cash NPAT 3,780 3,576 6%
24
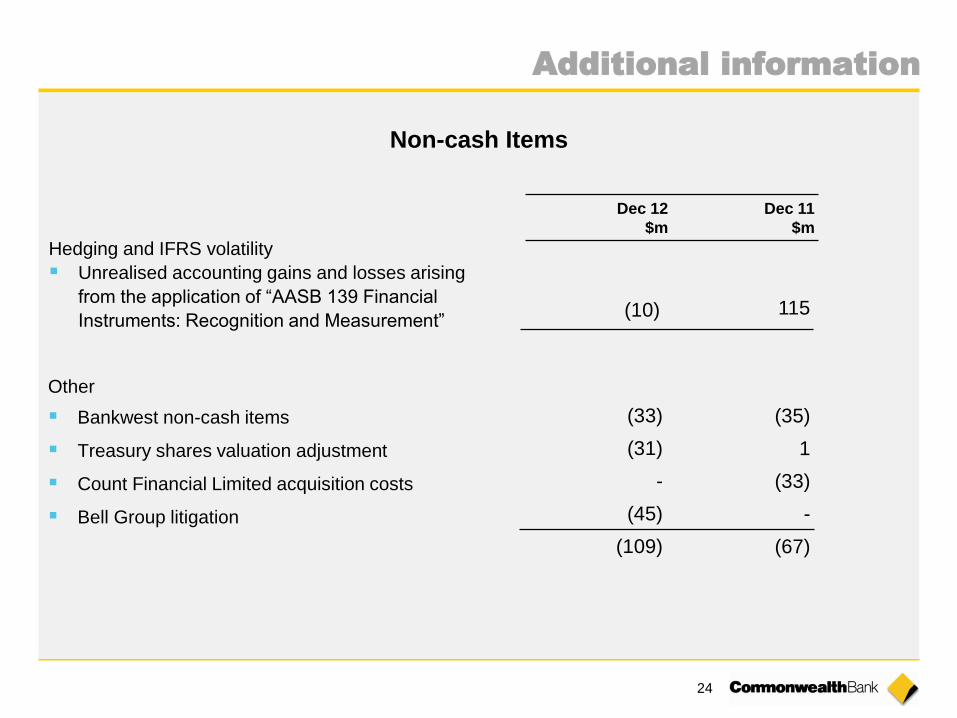
Hedging and IFRS volatility
Unrealised accounting gains and losses arising
from the application of “AASB 139 Financial
Instruments: Recognition and Measurement”
Dec 12
$m
Dec 11
$m
Other
Bankwest non-cash items
Treasury shares valuation adjustment
Count Financial Limited acquisition costs
Bell Group litigation
(10) 115
Non-cash Items
(33) (35)
(31) 1
- (33)
(45) -
(109) (67)
Additional information
25
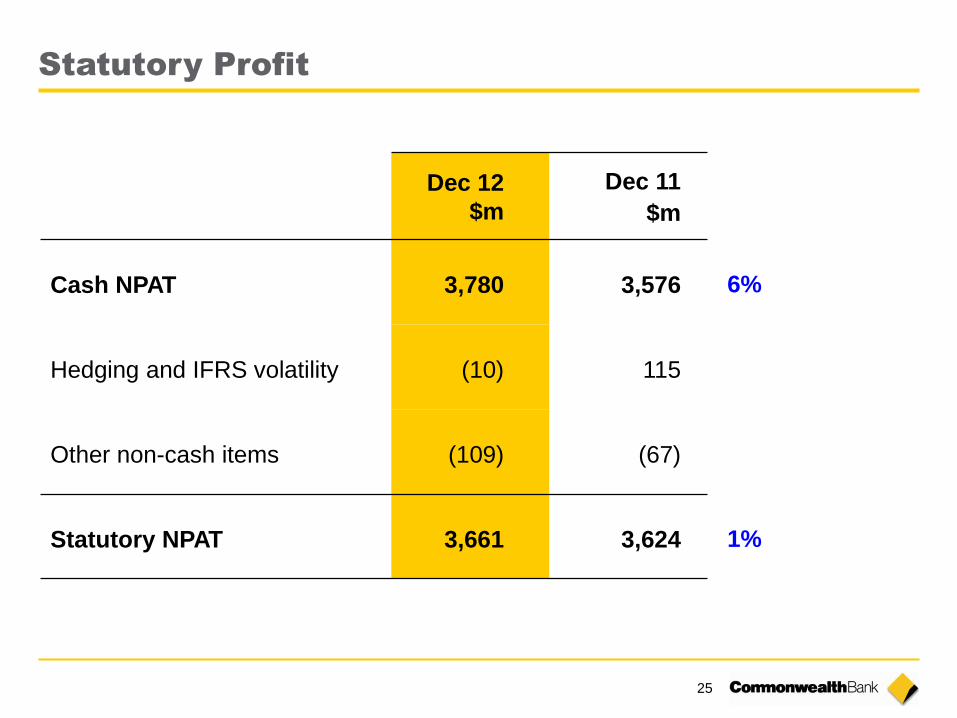
Statutory Profit
Dec 12
$m
Dec 11
$m
Cash NPAT 3,780 3,576
Hedging and IFRS volatility (10) 115
Other non-cash items (109) (67)
Statutory NPAT 3,661 3,624
6%
1%
26
Dec 12
$m
Dec 11
$m
Dec 12 vs
Dec 11
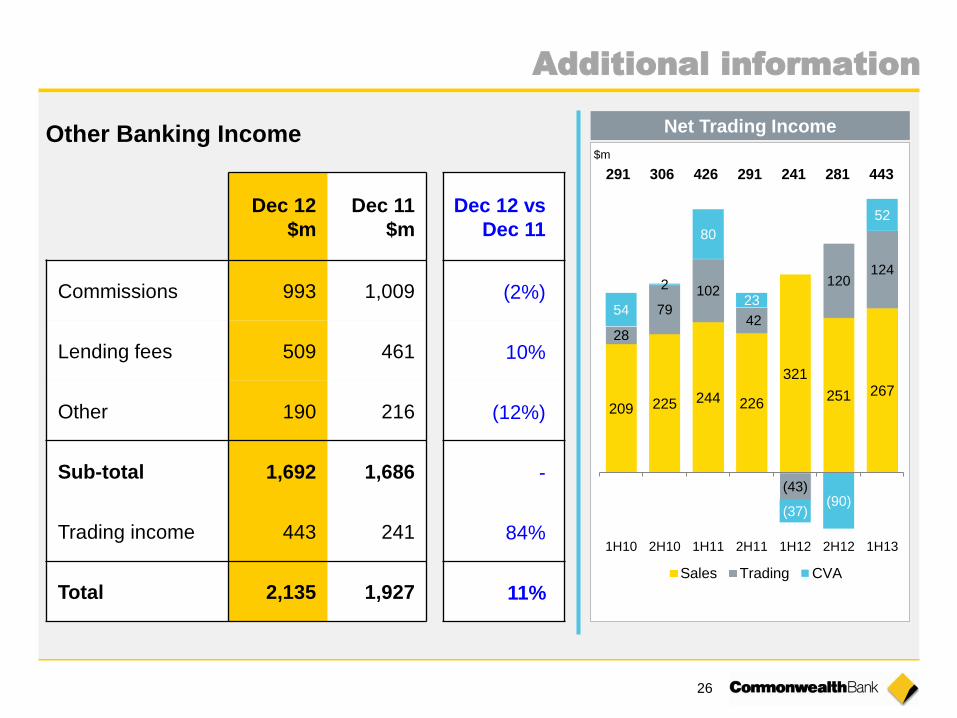
Commissions 993 1,009 (2%)
Lending fees 509 461 10%
Other 190 216 (12%)
Sub-total 1,692 1,686 -
Trading income 443 241 84%
Total 2,135 1,927 11%
Other Banking Income Net Trading Income
$m
443 281 241 291 426 306 291
209 225 244 226
321
251 267
28
79
102
42
(43)
120 124
54
2
80
23
(37) (90)
52
1H10 2H10 1H11 2H11 1H12 2H12 1H13
Sales Trading CVA
Additional information
27
1H12 1H13
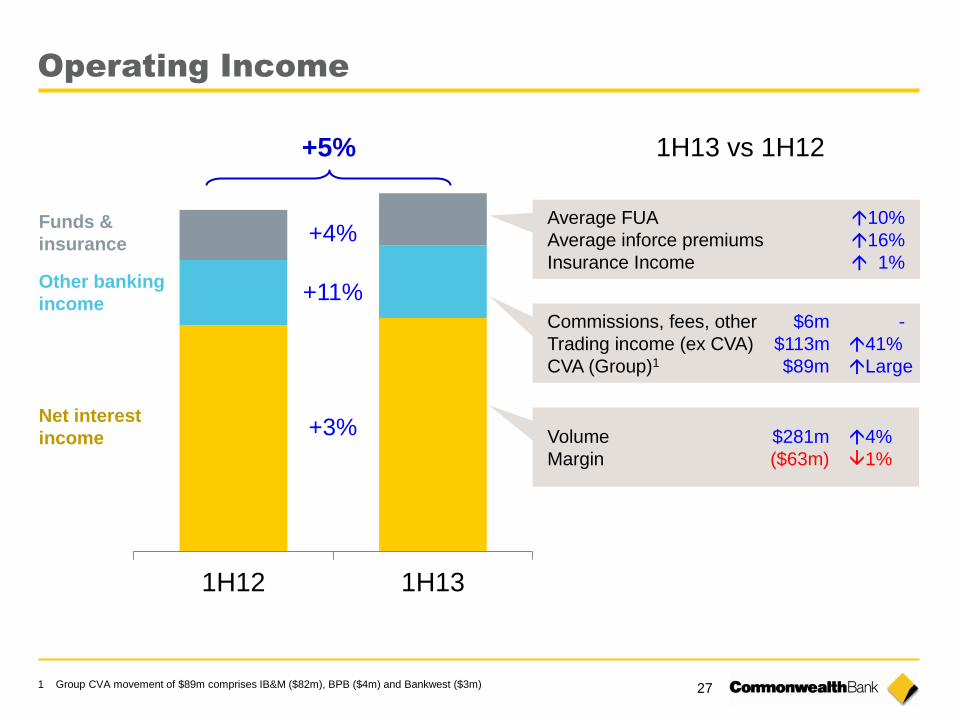
Operating Income
Funds &
insurance
Other banking
income
Net interest
income
+5%
Average FUA 10%
Average inforce premiums 16%
Insurance Income 1%
Commissions, fees, other $6m -
Trading income (ex CVA) $113m 41%
CVA (Group)1 $89m Large
Volume $281m 4%
Margin ($63m) 1%
+3%
+11%
+4%
1H13 vs 1H12
1 Group CVA movement of $89m comprises IB&M ($82m), BPB ($4m) and Bankwest ($3m)
28
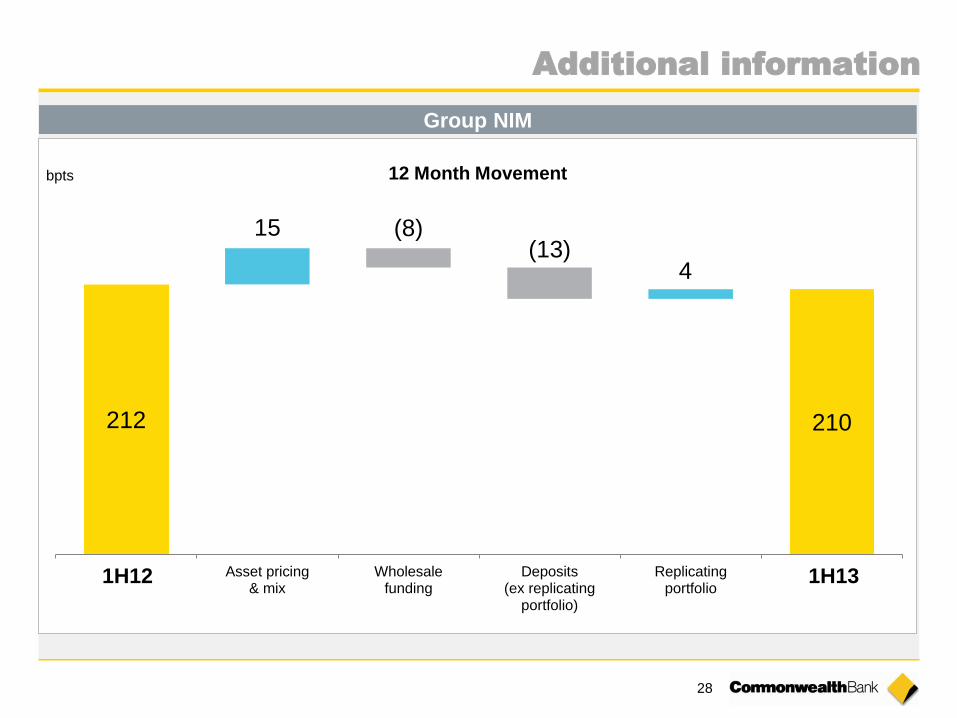
212 210
15 (8) (13)
4
1H12 Asset pricing& mix
Wholesalefunding
Deposits(ex replicating
portfolio)
Replicatingportfolio
1H13
bpts
Group NIM
Additional information
12 Month Movement
1H12 1H13
29
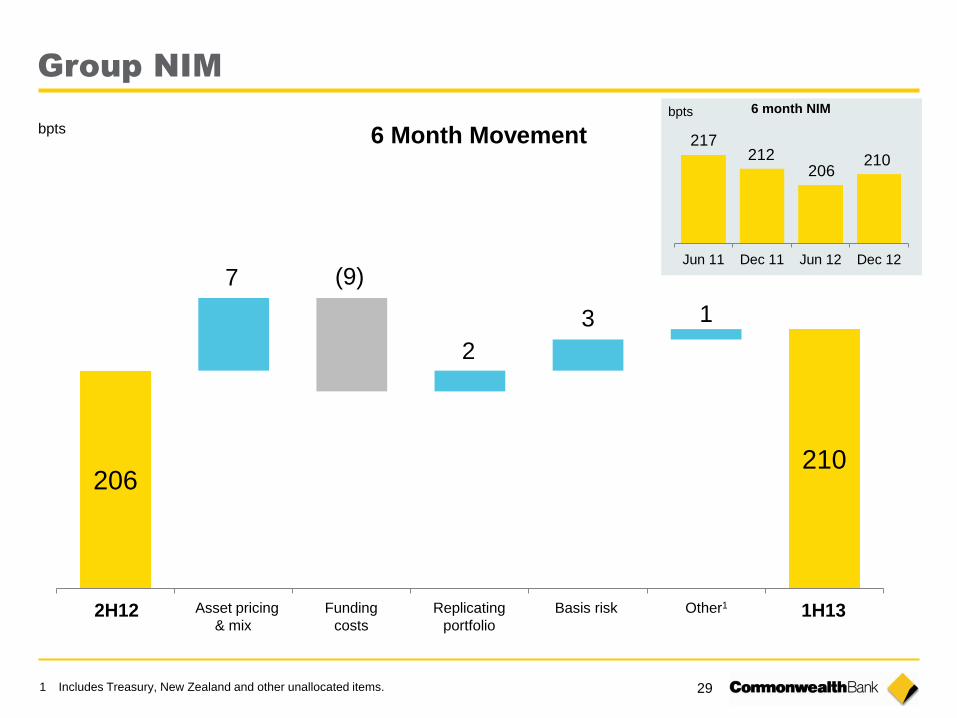
Group NIM
bpts 6 Month Movement
1 Includes Treasury, New Zealand and other unallocated items.
206 210
7 (9)
2
3 1
Other1 Basis risk Replicating
portfolio
Funding
costs
Asset pricing
& mix 2H12 1H13
Jun 11 Dec 11 Jun 12 Dec 12
217 212
206 210
bpts 6 month NIM
30
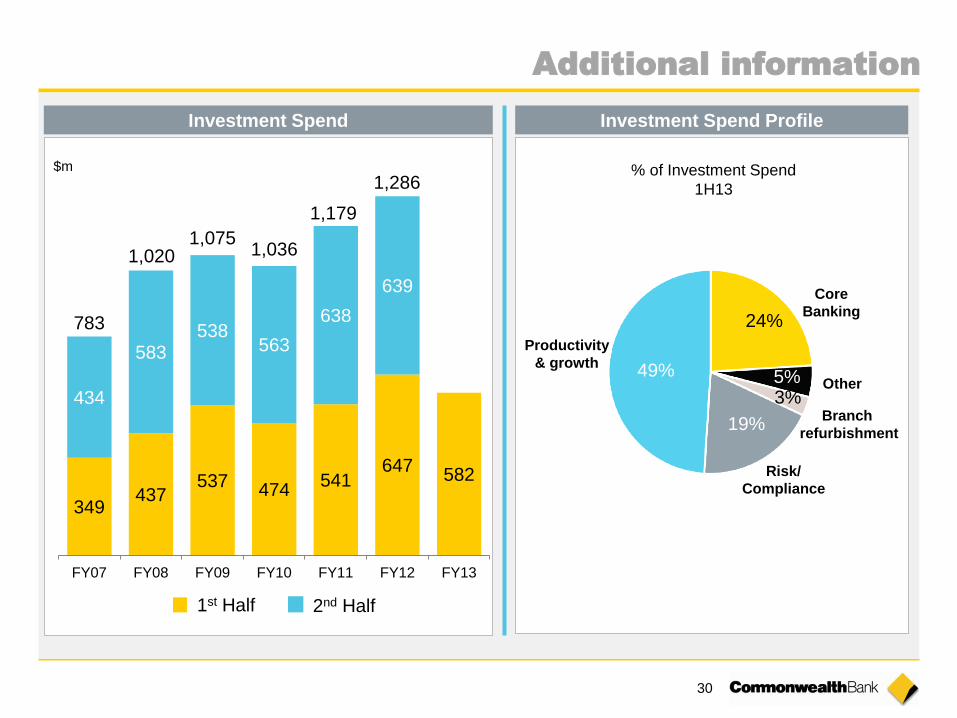
1st Half 2nd Half
Investment Spend
24%
5% 3%
19%
49%
Risk/
Compliance
Branch
refurbishment
Core
Banking
Other
Productivity
& growth
Investment Spend Profile
349 437
537 474
541 647
582
434
583 538
563
638
639
FY07 FY08 FY09 FY10 FY11 FY12 FY13
783
1,020 1,075
1,036
$m
1,179
1,286
Additional information
% of Investment Spend
1H13
31
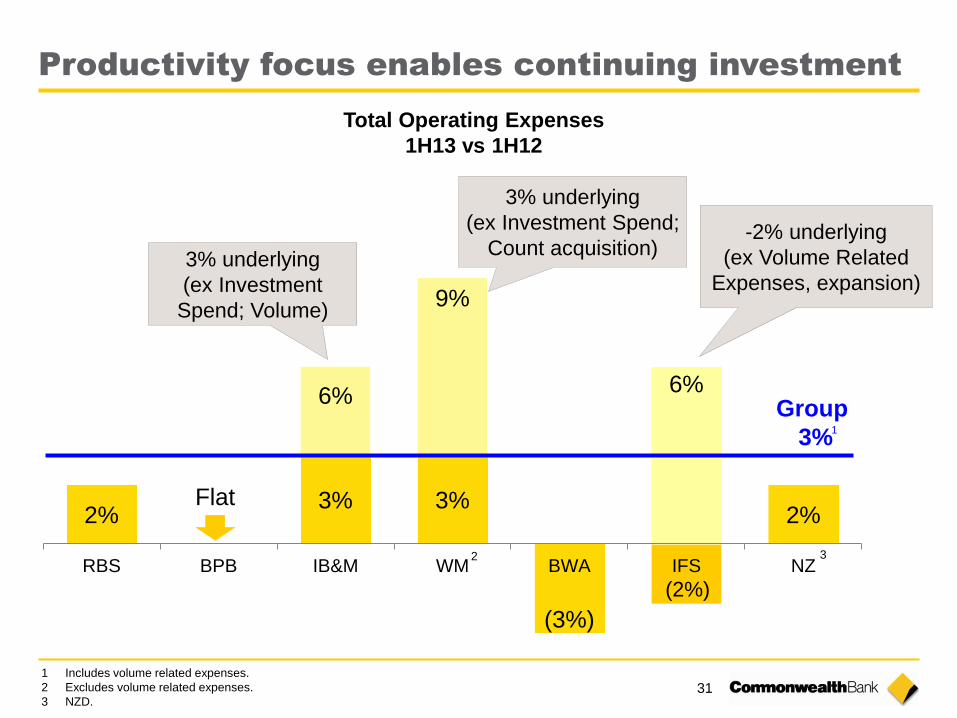
Productivity focus enables continuing investment
Total Operating Expenses
1H13 vs 1H12
2% 3% 3%
(3%)
6%
2%
6%
9%
RBS BPB IB&M WM BWA IFS NZ
Group
3%
1 Includes volume related expenses.
2 Excludes volume related expenses.
3 NZD.
Flat
1
2
(2%)
3
3% underlying
(ex Investment
Spend; Volume)
3% underlying
(ex Investment Spend;
Count acquisition) -2% underlying
(ex Volume Related
Expenses, expansion)
32
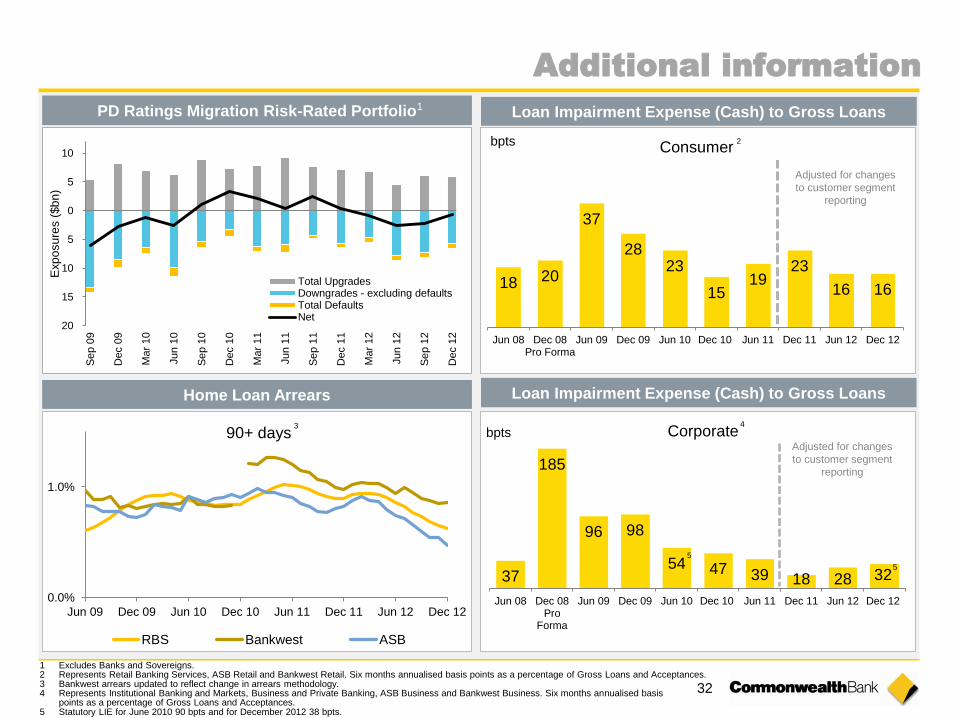
PD Ratings Migration Risk-Rated Portfolio
Additional information
20
15
10
5
0
5
10
Se
p 0
9
Dec 0
9
Ma
r 1
0
Jun
10
Se
p 1
0
Dec 1
0
Ma
r 1
1
Jun
11
Se
p 1
1
Dec 1
1
Ma
r 1
2
Jun
12
Se
p 1
2
Dec 1
2
Exp
osu
res (
$b
n)
Total UpgradesDowngrades - excluding defaultsTotal DefaultsNet
Home Loan Arrears
1 Excludes Banks and Sovereigns. 2 Represents Retail Banking Services, ASB Retail and Bankwest Retail. Six months annualised basis points as a percentage of Gross Loans and Acceptances. 3 Bankwest arrears updated to reflect change in arrears methodology. 4 Represents Institutional Banking and Markets, Business and Private Banking, ASB Business and Bankwest Business. Six months annualised basis
points as a percentage of Gross Loans and Acceptances. 5 Statutory LIE for June 2010 90 bpts and for December 2012 38 bpts.
0.0%
1.0%
Jun 09 Dec 09 Jun 10 Dec 10 Jun 11 Dec 11 Jun 12 Dec 12
90+ days
RBS Bankwest ASB
1
3
Loan Impairment Expense (Cash) to Gross Loans
18 20
37
28 23
15 19
23
16 16
Jun 08 Dec 08Pro Forma
Jun 09 Dec 09 Jun 10 Dec 10 Jun 11 Dec 11 Jun 12 Dec 12
bpts Consumer
Adjusted for changes
to customer segment
reporting
Loan Impairment Expense (Cash) to Gross Loans
37
185
96 98
54 47 39 18 28 32
Jun 08 Dec 08Pro
Forma
Jun 09 Dec 09 Jun 10 Dec 10 Jun 11 Dec 11 Jun 12 Dec 12
Adjusted for changes
to customer segment
reporting
bpts Corporate
5
5
4
2

33
Sound credit quality
Troublesome and Impaired Assets
6.2 7.2 8.5 7.7 6.8 6.2 5.8 5.6
4.2 4.8
5.2 5.2
5.3 4.7 4.5 4.3
10.4 12.0
13.7 12.9 12.1
10.9 10.3 9.9
Jun 09 Dec 09 Jun 10 Dec 10 Jun 11 Dec 11 Jun 12 Dec 12
Commercial troublesome Group impaired
$bn
Group Consumer Arrears Loan Impairment Expense (Cash) to Gross Loans
32
85
61
55
28 28
22 21 20 22
Jun 08 Dec 08Pro
Forma
Jun 09 Dec 09 Jun 10 Dec 10 Jun 11 Dec 11 Jun 12 Dec 12
0.4%
0.9%
1.4%
Dec 10 Jun 11 Dec 11 Jun 12 Dec 12
1 Includes ASB, and Bankwest from December 08. December 08 includes Bankwest on a pro forma basis.
Basis points as a percentage of average Gross Loans and Acceptances.
2 Statutory LIE for June 2010 40 bpts and for December 2012 25 bpts.
CBA Group1
Six months annualised
(basis points)
90+ days
Home loans Personal loans Credit cards
2
2
34
Additional information
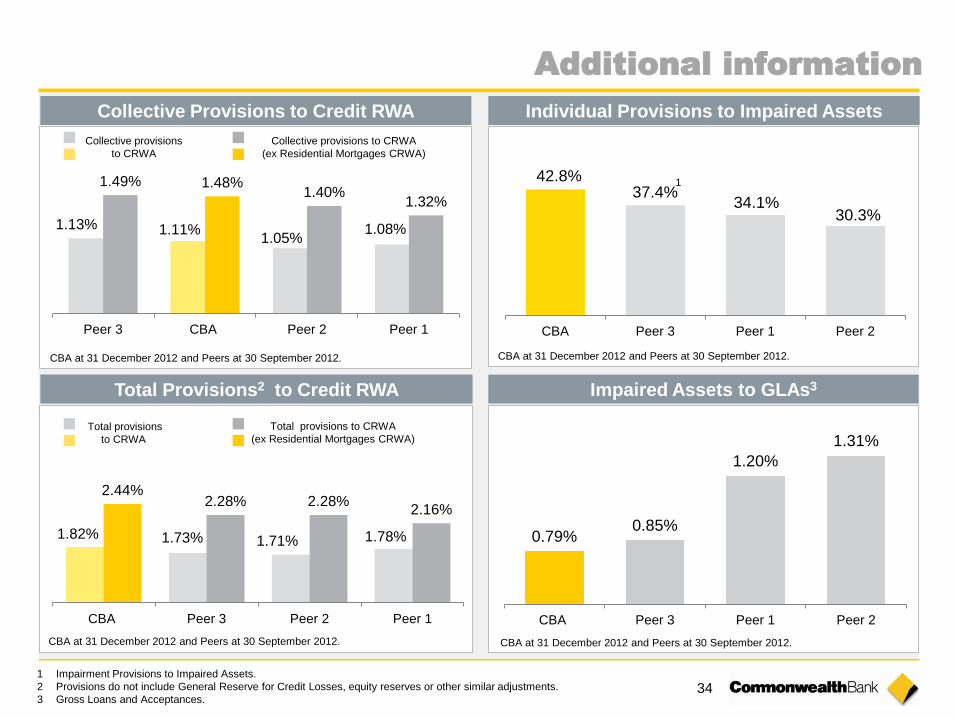
1 Impairment Provisions to Impaired Assets.
2 Provisions do not include General Reserve for Credit Losses, equity reserves or other similar adjustments.
3 Gross Loans and Acceptances.
42.8% 37.4%
34.1% 30.3%
CBA Peer 3 Peer 1 Peer 2
1
Individual Provisions to Impaired Assets
Impaired Assets to GLAs3
0.79% 0.85%
1.20%
1.31%
CBA Peer 3 Peer 1 Peer 2
CBA at 31 December 2012 and Peers at 30 September 2012.
CBA at 31 December 2012 and Peers at 30 September 2012.
Collective Provisions to Credit RWA
Collective provisions
to CRWA
Collective provisions to CRWA
(ex Residential Mortgages CRWA)
Total Provisions2 to Credit RWA
1.82% 1.73% 1.71% 1.78%
2.44% 2.28% 2.28%
2.16%
CBA Peer 3 Peer 2 Peer 1
Total provisions
to CRWA
Total provisions to CRWA
(ex Residential Mortgages CRWA)
CBA at 31 December 2012 and Peers at 30 September 2012.
1.13% 1.11% 1.05%
1.08%
1.49% 1.48% 1.40%
1.32%
Peer 3 CBA Peer 2 Peer 1
CBA at 31 December 2012 and Peers at 30 September 2012.
35
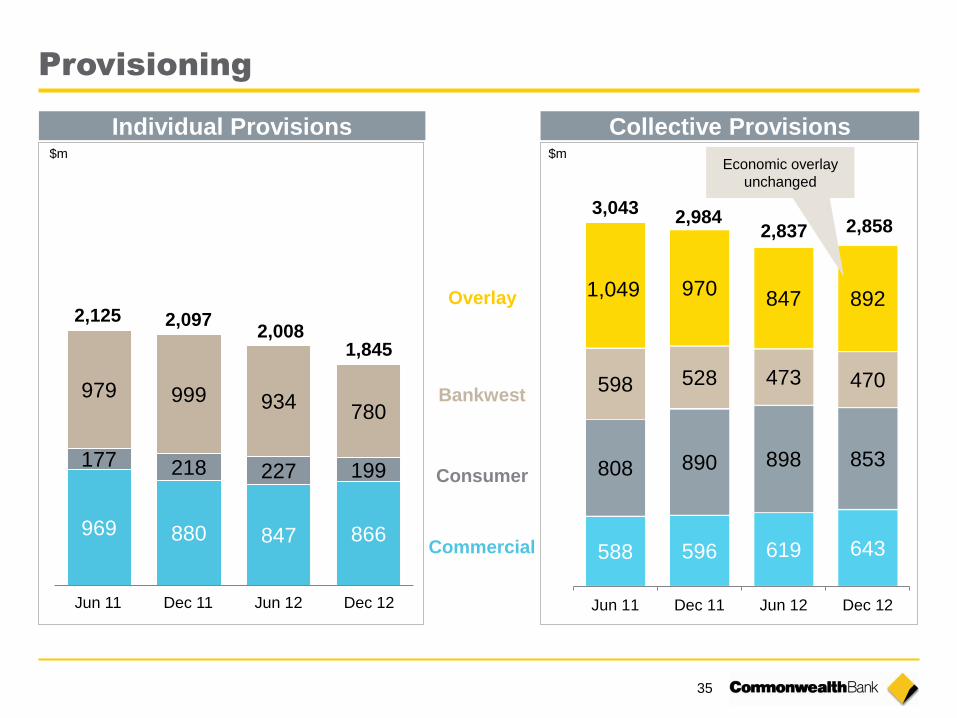
Provisioning
Individual Provisions
588 596 619 643
808 890 898 853
598 528 473 470
970 847 892
Jun 11 Dec 11 Jun 12 Dec 12
3,043 2,984
969 880 847 866
177 218 227 199
979 999 934 780
Jun 12 Jun 11
2,125
Bankwest
Consumer
Commercial
Dec 11
2,008
Overlay
$m $m
2,097
2,837
1,049
1,845
2,858
Dec 12
Economic overlay
unchanged
Collective Provisions
36
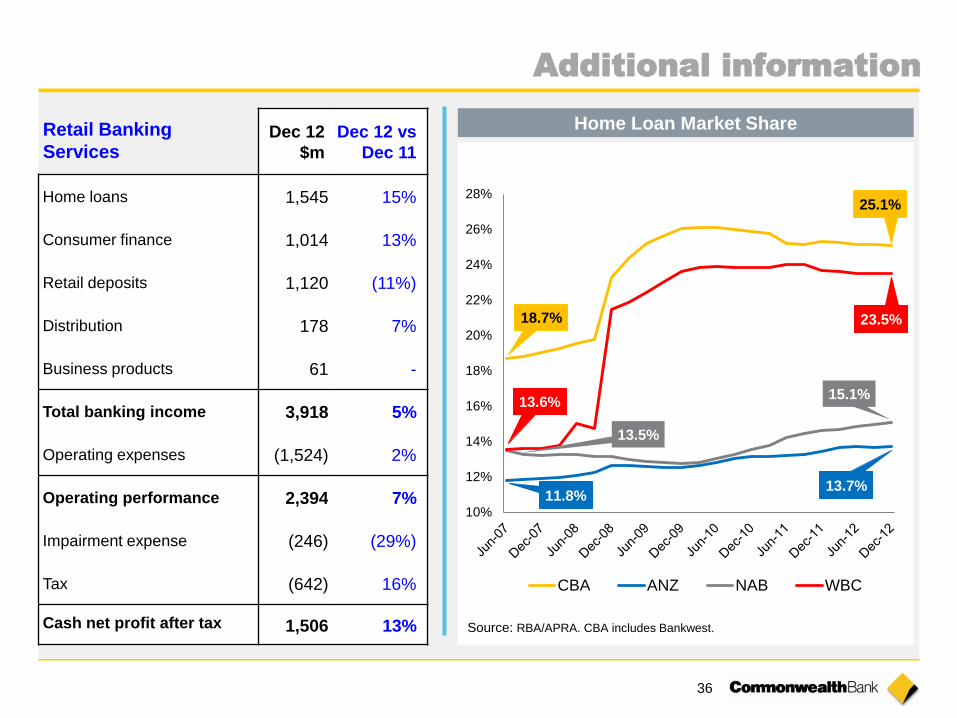
Retail Banking
Services
Additional information
Dec 12
$m
Dec 12 vs
Dec 11
Home loans 1,545 15%
Consumer finance 1,014 13%
Retail deposits 1,120 (11%)
Distribution 178 7%
Business products 61 -
Total banking income 3,918 5%
Operating expenses (1,524) 2%
Operating performance 2,394 7%
Impairment expense (246) (29%)
Tax (642) 16%
Cash net profit after tax 1,506 13% Source: RBA/APRA. CBA includes Bankwest.
Home Loan Market Share
10%
12%
14%
16%
18%
20%
22%
24%
26%
28%
CBA ANZ NAB WBC
18.7%
13.6%
13.5%
11.8%
25.1%
23.5%
15.1%
13.7%

37
Retail Banking Services
bpts
15% 13%
(11%)
Home
loans
Consumer
finance
Retail
deposits
5%
2%
7%
Income Costs Operating
performance
$bn
NBS & Goal Saver Investment accounts Savings deposits
Business Online Saver Transaction accounts
32 62
$bn
34
89
25
3 19 31
81
23
3 18
Dec 11 Dec 12
1H13 vs 1H12
Retail Deposit Mix
RBS Margin
1
1 Refer notes slide at back of this presentation for source information.
Segment Income
+8%
1 Retail MFI Customer Satisfaction - Gap to No 1
1
283 270
253 248 247 237
253 244 239
249
1H06 1H07 1H08 1H09 1H10 1H11 2H11 1H12 2H12 1H13
Jun 06 Jun 11 Jun 12 Dec 12
Number 1
Gap
12.5%
Gap
0.4%
Operating Performance
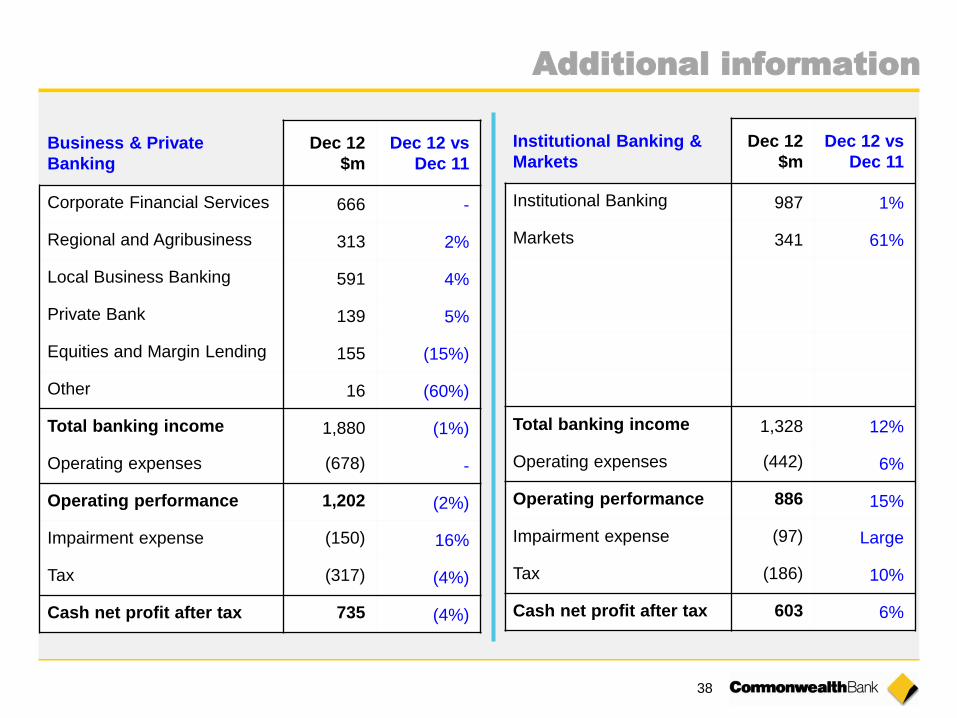
38
Institutional Banking &
Markets
Dec 12
$m
Dec 12 vs
Dec 11
Institutional Banking 987 1%
Markets 341 61%
Total banking income 1,328 12%
Operating expenses (442) 6%
Operating performance 886 15%
Impairment expense (97) Large
Tax (186) 10%
Cash net profit after tax 603 6%
Business & Private
Banking
Dec 12
$m
Dec 12 vs
Dec 11
Corporate Financial Services 666 -
Regional and Agribusiness 313 2%
Local Business Banking 591 4%
Private Bank 139 5%
Equities and Margin Lending 155 (15%)
Other 16 (60%)
Total banking income 1,880 (1%)
Operating expenses (678) -
Operating performance 1,202 (2%)
Impairment expense (150) 16%
Tax (317) (4%)
Cash net profit after tax 735 (4%)
Additional information
39
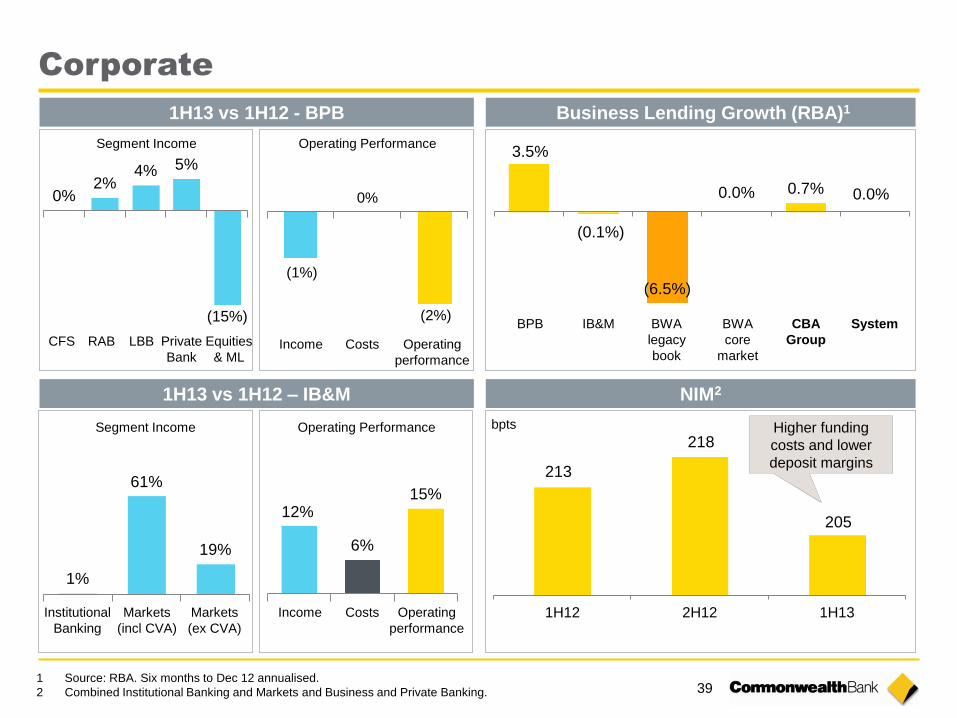
3.5%
(0.1%)
(6.5%)
0.0% 0.7% 0.0%
Corporate
NIM2 1H13 vs 1H12 – IB&M
bpts
1 Source: RBA. Six months to Dec 12 annualised.
2 Combined Institutional Banking and Markets and Business and Private Banking.
1%
61%
19%
Institutional
Banking
Markets
(ex CVA)
Income Costs Operating
performance
Markets
(incl CVA)
12%
6%
15%
213
218
205
1H12 2H12 1H13
(1%)
0%
(2%)
0% 2%
4% 5%
(15%)
CFS RAB LBB Private
Bank
Equities
& ML Income Costs Operating
performance
Segment Income
1H13 vs 1H12 - BPB
Higher funding
costs and lower
deposit margins
BPB IB&M BWA
legacy
book
CBA
Group
System
Business Lending Growth (RBA)1
BWA
core
market
Operating Performance
Segment Income Operating Performance
40
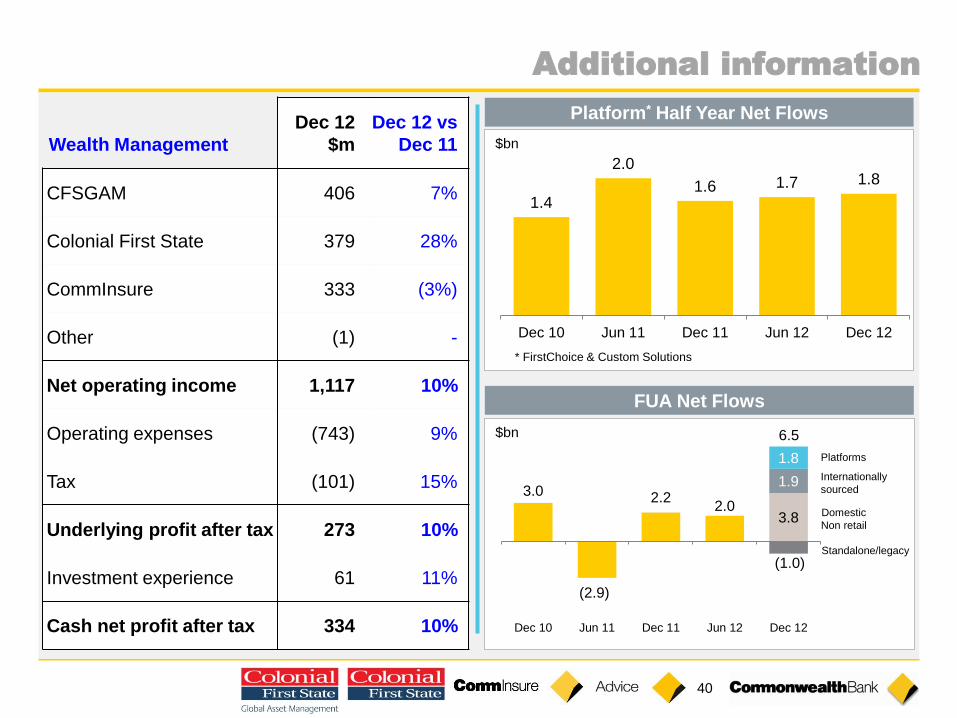
Wealth Management
Dec 12
$m
Dec 12 vs
Dec 11
CFSGAM 406 7%
Colonial First State 379 28%
CommInsure 333 (3%)
Other (1) -
Net operating income 1,117 10%
Operating expenses (743) 9%
Tax (101) 15%
Underlying profit after tax 273 10%
Investment experience 61 11%
Cash net profit after tax 334 10%
Additional information
FUA Net Flows
Platform* Half Year Net Flows
1.4
2.0
1.6 1.7 1.8
Dec 10 Jun 11 Dec 11 Jun 12 Dec 12
* FirstChoice & Custom Solutions
$bn
3.0
(2.9)
2.2 2.0
(1.0)
3.8
1.9
1.8
Dec 10 Jun 11 Dec 11 Jun 12 Dec 12
Domestic
Non retail
Standalone/legacy
6.5 $bn
Platforms
Internationally
sourced
41
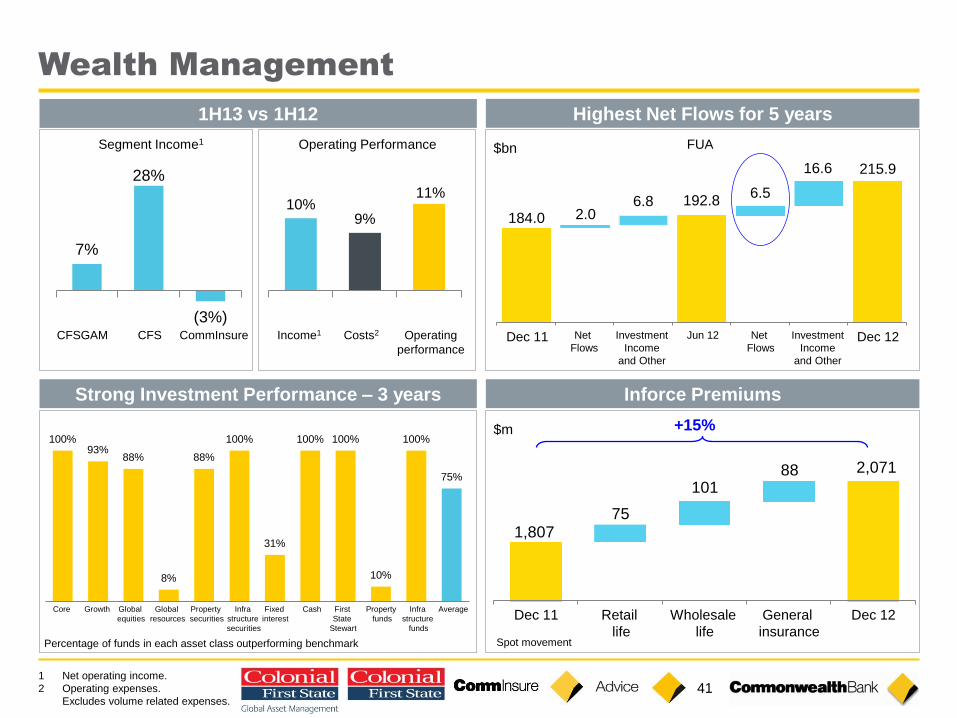
1,807 75
101 88 2,071
Wealth Management
Percentage of funds in each asset class outperforming benchmark
CFSGAM CFS CommInsure Income1 Costs2 Operating
performance
1H13 vs 1H12
Strong Investment Performance – 3 years Inforce Premiums
Segment Income1
+15% $m
Dec 11 Dec 12 Retail
life
Wholesale
life
General
insurance
100% 93%
88%
8%
88%
100%
31%
100% 100%
10%
100%
75%
Core Growth Global
equities
Global
resources
Property
securities
Infra
structure
securities
Fixed
interest
Cash First
State
Stewart
Property
funds
Infra
structure
funds
Average
10% 9%
11%
7%
28%
(3%)
1 Net operating income.
2 Operating expenses.
Excludes volume related expenses.
Spot movement
Highest Net Flows for 5 years
$bn
184.0 2.0 6.8 192.8
6.5
16.6 215.9
FUA
Dec 11 Dec 12 Net
Flows
Investment
Income
and Other
Jun 12 Net
Flows
Investment
Income
and Other
Operating Performance

42
Term Maturity Profile1
Term Issuance
1 Maturity profile includes all long term wholesale debt. Weighted Average Maturity of 3.7 years includes all deals with first call or
maturity of 12 months or greater.
2 CBA Group Treasury estimated blended wholesale funding costs.
Funding Costs2
bpts Indicative Long Term Wholesale Funding Costs
3 8 13 14 17
43
106
137 153
169
25
54
74 92
109
0
50
100
150
200
1 year 2 year 3 year 4 year 5 year
Marg
in t
o B
BS
W
9 16
22 17
9
18 1
14 5
7
7
2013 2014 2015 2016 2017 >2017
Weighted Average maturity 3.7yrs $bn
Unsecured debt Government Guaranteed Covered Bonds
$bn Six-Monthly
Dec 09 Jun 10 Dec 10 Jun 11 Dec 11 Jun 12 Dec 12
Domestic Offshore Private Offshore Public
FY
Dec 12
Jun 12
Jun 07
FY10
$54bn
FY11
$23bn
FY12
$29bn
6mths
$13bn
Additional information
Australian Deposits
168 134 85 87
168 163
156 117
CBA Peer 3 Peer 2 Peer 1
204 241
297 336
Total Deposits
(excl CD’s)
$bn
Source : APRA Household deposits Other deposits
43
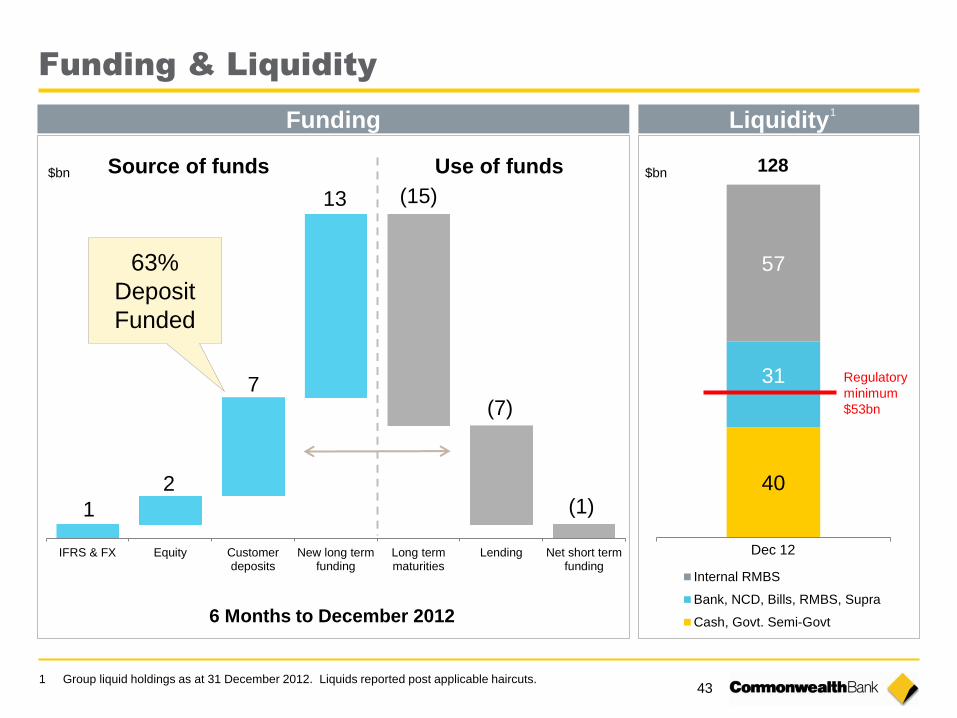
Funding & Liquidity
Liquidity
$bn
40
31
57
Internal RMBS
Bank, NCD, Bills, RMBS, Supra
Cash, Govt. Semi-Govt
128
Regulatory
minimum
$53bn
Dec 12
1
2
7
13 (15)
(7)
(1)
IFRS & FX Equity Customerdeposits
New long termfunding
Long termmaturities
Lending Net short termfunding
$bn
63%
Deposit
Funded
Source of funds Use of funds
Funding
6 Months to December 2012
1 Group liquid holdings as at 31 December 2012. Liquids reported post applicable haircuts.
1
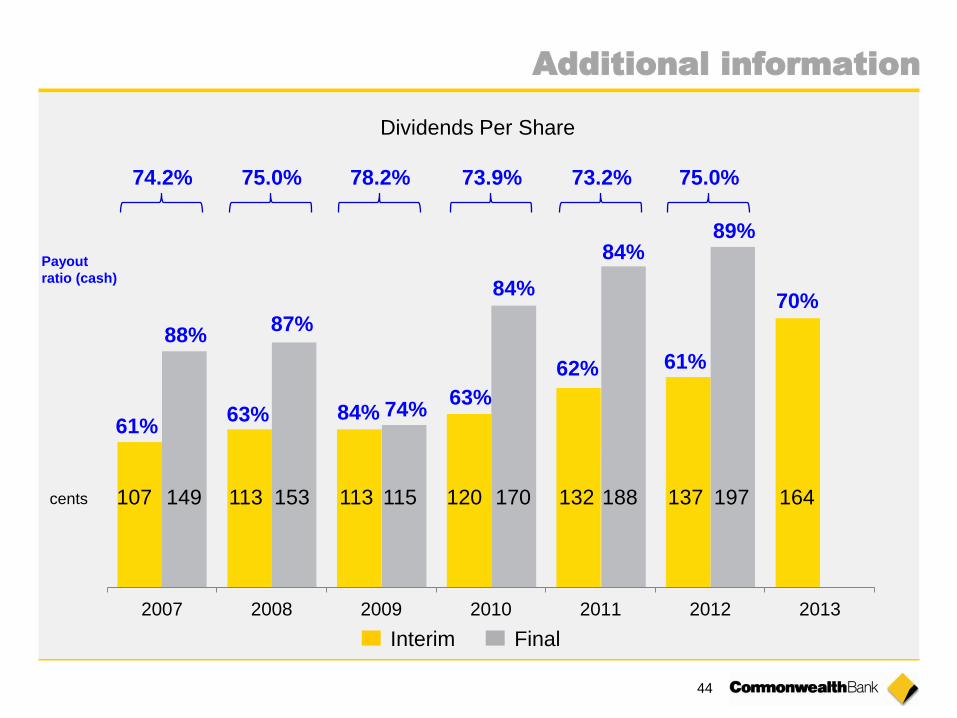
44
Dividends Per Share
2007 2008 2009 2010 2011 2012 2013
62%
63% 84% 63%
84%
74%
87%
Payout
ratio (cash)
61%
Interim Final
88%
cents
84%
61%
89%
74.2% 75.0% 78.2% 73.9% 73.2% 75.0%
107 149 113 153 113 115 120 170 132 188 137 197 164
70%
Additional information
45
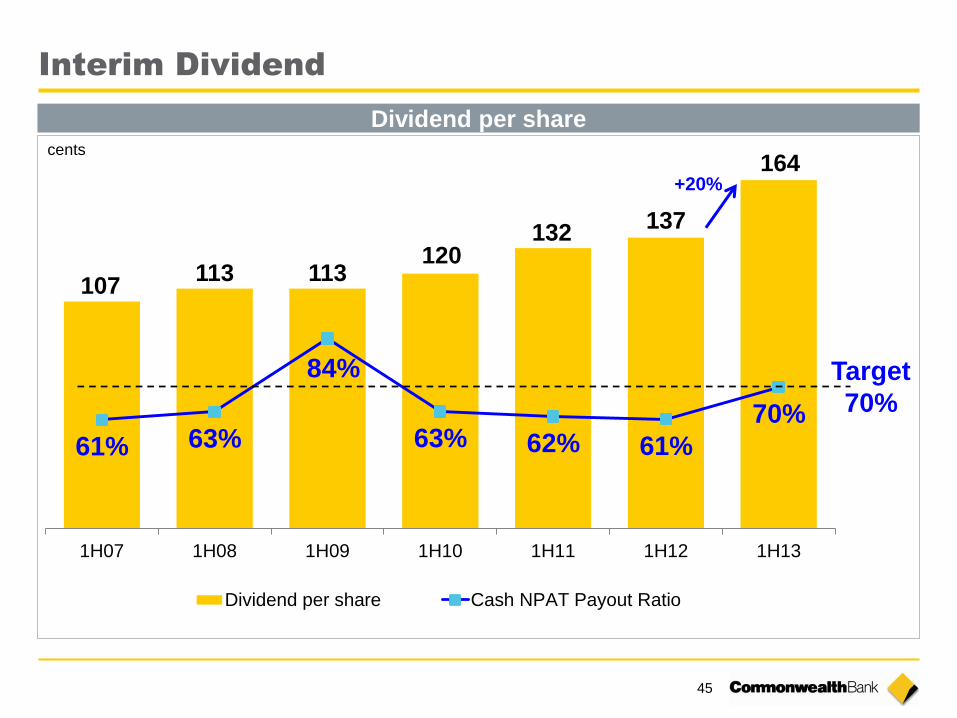
Interim Dividend
Dividend per share
107 113 113
120 132
137
164
61% 63%
84%
63% 62% 61%
70%
0%
20%
40%
60%
80%
100%
120%
140%
1H07 1H08 1H09 1H10 1H11 1H12 1H13
Dividend per share Cash NPAT Payout Ratio
Target
70%
cents
+20%
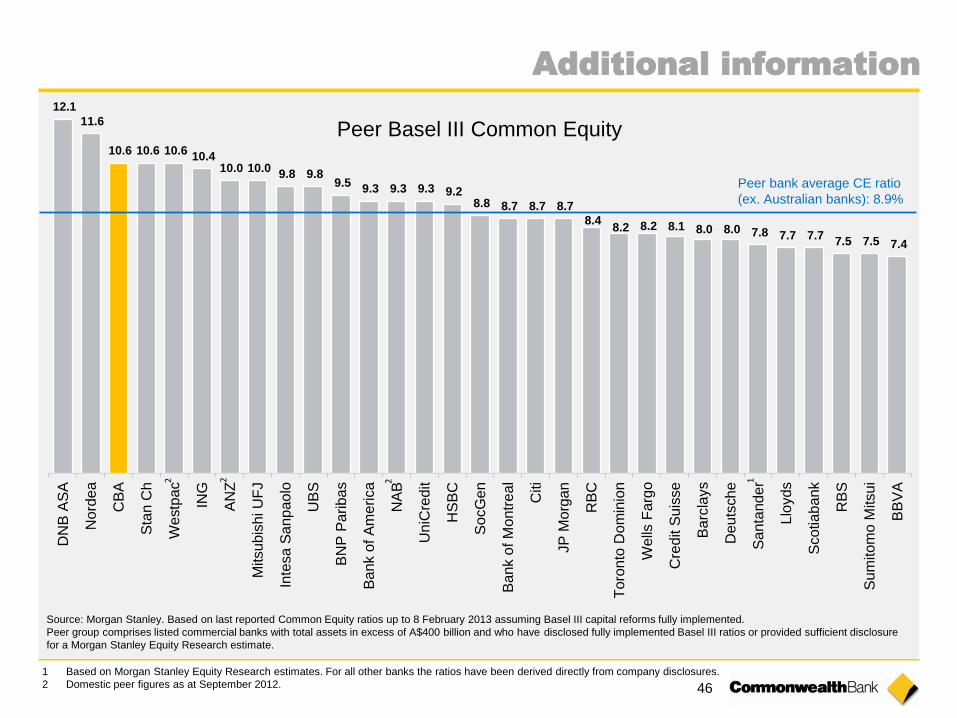
46
12.1
11.6
10.6 10.6 10.6 10.4
10.0 10.0 9.8 9.8
9.5 9.3 9.3 9.3 9.2
8.8 8.7 8.7 8.7
8.4 8.2 8.2 8.1 8.0 8.0 7.8 7.7 7.7
7.5 7.5 7.4
DN
B A
SA
No
rde
a
CB
A
Sta
n C
h
We
stp
ac
ING
AN
Z
Mitsu
bis
hi U
FJ
Inte
sa
Sa
np
ao
lo
UB
S
BN
P P
ariba
s
Ba
nk o
f A
me
rica
NA
B
Un
iCre
dit
HS
BC
So
cG
en
Ba
nk o
f M
ontr
eal
Citi
JP
Mo
rgan
RB
C
Toro
nto
Do
min
ion
We
lls F
arg
o
Cre
dit S
uis
se
Ba
rcla
ys
De
uts
ch
e
Sa
nta
nd
er
Llo
yds
Sco
tia
ba
nk
RB
S
Su
mito
mo
Mitsu
i
BB
VA
Peer Basel III Common Equity
Peer bank average CE ratio
(ex. Australian banks): 8.9%
Source: Morgan Stanley. Based on last reported Common Equity ratios up to 8 February 2013 assuming Basel III capital reforms fully implemented.
Peer group comprises listed commercial banks with total assets in excess of A$400 billion and who have disclosed fully implemented Basel III ratios or provided sufficient disclosure
for a Morgan Stanley Equity Research estimate.
2 2 2
1 Based on Morgan Stanley Equity Research estimates. For all other banks the ratios have been derived directly from company disclosures.
2 Domestic peer figures as at September 2012.
1
Additional information
47
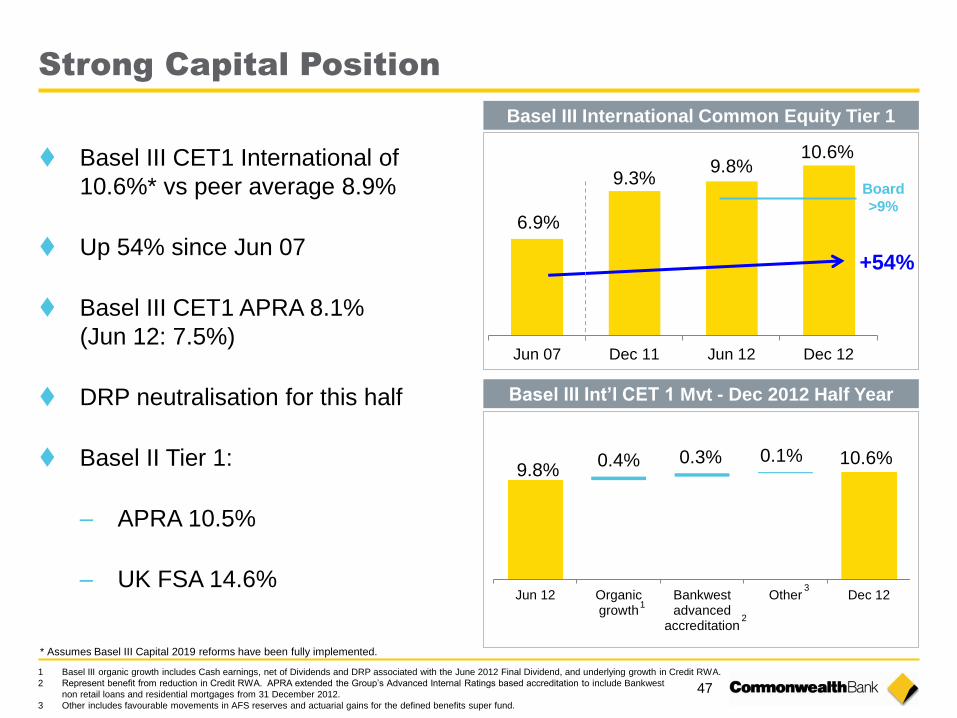
Strong Capital Position
Basel III International Common Equity Tier 1
6.9%
9.3% 9.8%
10.6%
Jun 07 Dec 11 Jun 12 Dec 12
Basel III CET1 International of
10.6%* vs peer average 8.9%
Up 54% since Jun 07
Basel III CET1 APRA 8.1%
(Jun 12: 7.5%)
DRP neutralisation for this half
Basel II Tier 1:
– APRA 10.5%
– UK FSA 14.6%
* Assumes Basel III Capital 2019 reforms have been fully implemented.
Board
>9%
+54%
1 Basel III organic growth includes Cash earnings, net of Dividends and DRP associated with the June 2012 Final Dividend, and underlying growth in Credit RWA.
2 Represent benefit from reduction in Credit RWA. APRA extended the Group’s Advanced Internal Ratings based accreditation to include Bankwest
non retail loans and residential mortgages from 31 December 2012.
3 Other includes favourable movements in AFS reserves and actuarial gains for the defined benefits super fund.
Basel III Int’l CET 1 Mvt - Dec 2012 Half Year
9.8% 10.6% 0.4% 0.3% 0.1%
Jun 12 Organicgrowth
Bankwestadvanced
accreditation
Other Dec 121
3
2
48
Notes
49
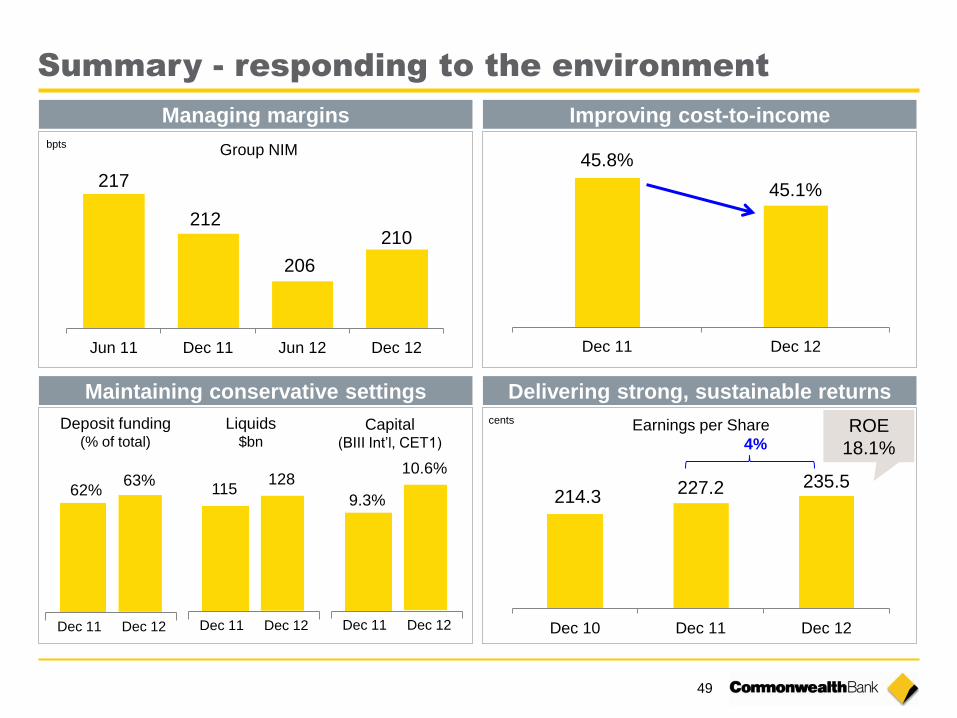
Summary - responding to the environment
Managing margins
Maintaining conservative settings Delivering strong, sustainable returns
Group NIM
217
212
206
210
Jun 11 Dec 11 Jun 12 Dec 12
bpts
Improving cost-to-income
Deposit funding (% of total)
Dec 11 Dec 12
Liquids $bn
62% 63%
Dec 11 Dec 12
115 128
Dec 11 Dec 12
9.3%
10.6%
Capital (BIII Int’l, CET1)
214.3 227.2 235.5
Dec 10 Dec 11 Dec 12
4%
Earnings per Share cents ROE
18.1%
45.8%
45.1%
Dec 11 Dec 12

50
Notes

13 FEBRUARY 2013 | COMMONWEALTH BANK OF AUSTRALIA | ACN 123 123 124
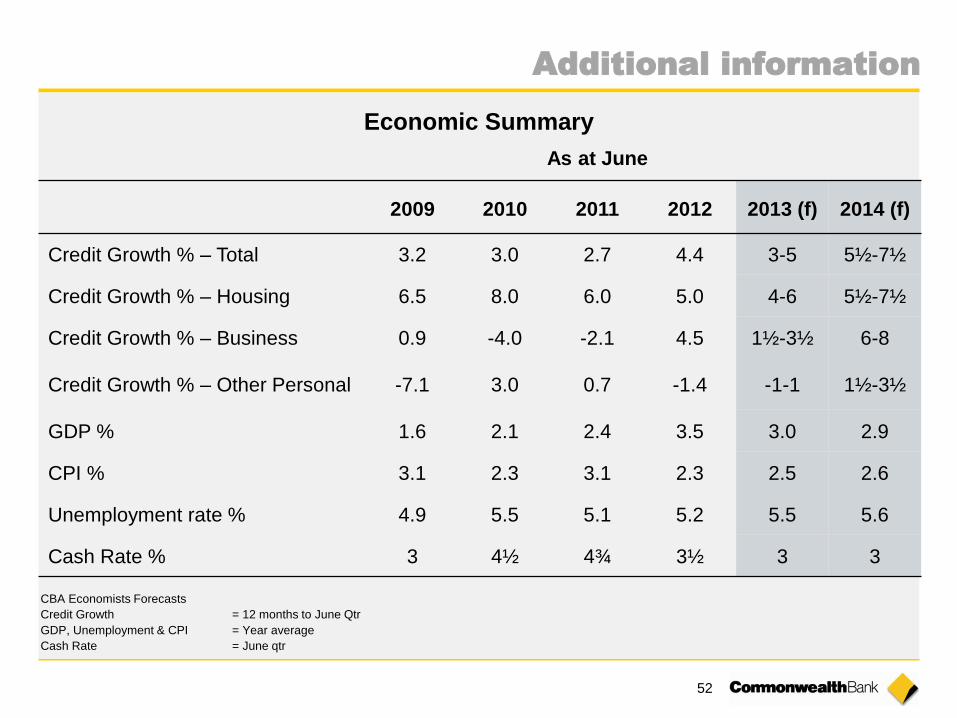
52
Economic Summary
As at June
2009 2010 2011 2012 2013 (f) 2014 (f)
Credit Growth % – Total 3.2 3.0 2.7 4.4 3-5 5½-7½
Credit Growth % – Housing 6.5 8.0 6.0 5.0 4-6 5½-7½
Credit Growth % – Business 0.9 -4.0 -2.1 4.5 1½-3½ 6-8
Credit Growth % – Other Personal -7.1 3.0 0.7 -1.4 -1-1 1½-3½
GDP % 1.6 2.1 2.4 3.5 3.0 2.9
CPI % 3.1 2.3 3.1 2.3 2.5 2.6
Unemployment rate % 4.9 5.5 5.1 5.2 5.5 5.6
Cash Rate % 3 4½ 4¾ 3½ 3 3
CBA Economists Forecasts
Credit Growth = 12 months to June Qtr
GDP, Unemployment & CPI = Year average
Cash Rate = June qtr
Additional information
53
Outlook
Current operating environment
– Some improvements in global macro economy
– Increased stability and lower volatility
– Positive for global debt and equity markets
Going forward
– Still some downside risk which dictates continued
caution
– Slow but steady rebuild of confidence

54
Notes
55
Summary
Consistent execution of long-term strategic priorities
Good revenue growth in a subdued environment
Productivity focus enabling investment
Stable credit quality reflecting long-term conservatism
Strong ROE notwithstanding significantly stronger capital position
Strategy delivering results; positioning for the long term

13 FEBRUARY 2013 | COMMONWEALTH BANK OF AUSTRALIA | ACN 123 123 124
Index
Strategy 57
Business Performance 80
Risk and Credit Quality 98
Capital, Funding & Liquidity 111
Economic Indicators 125
58
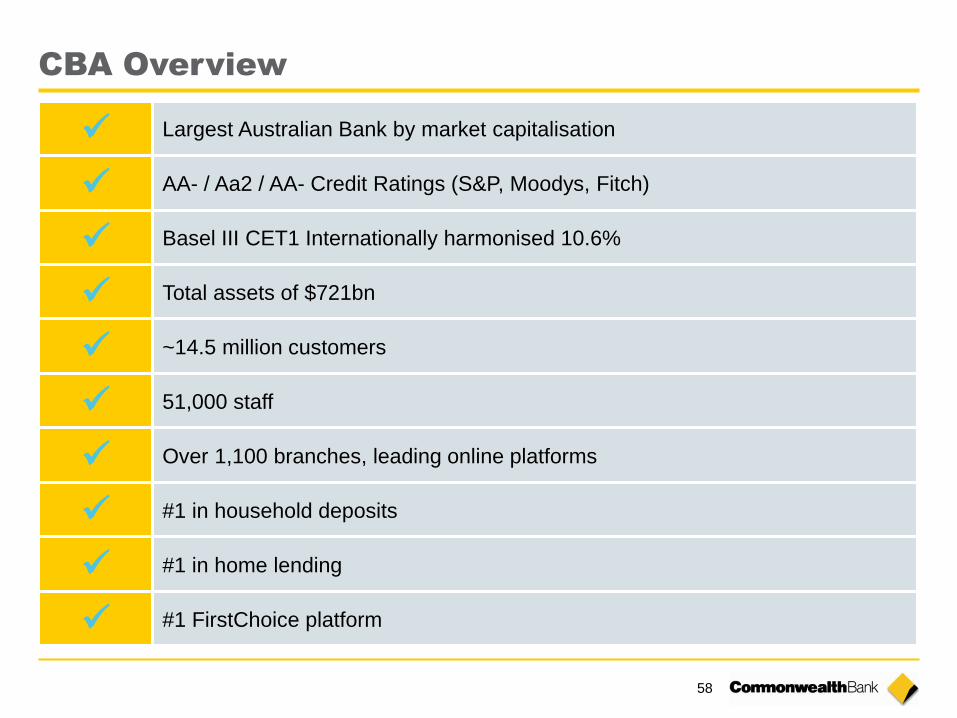
CBA Overview
Largest Australian Bank by market capitalisation
AA- / Aa2 / AA- Credit Ratings (S&P, Moodys, Fitch)
Basel III CET1 Internationally harmonised 10.6%
Total assets of $721bn
~14.5 million customers
51,000 staff
Over 1,100 branches, leading online platforms
#1 in household deposits
#1 in home lending
#1 FirstChoice platform
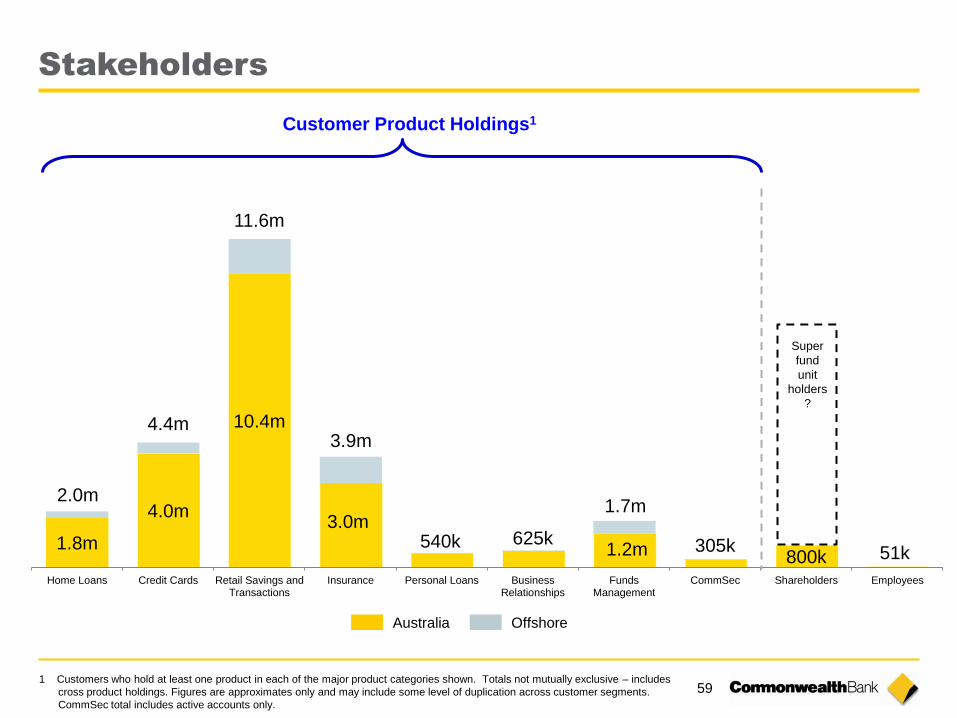
59
1.8m
4.0m
10.4m
3.0m 540k 625k
1.7m
305k 800k 51k
Home Loans Credit Cards Retail Savings andTransactions
Insurance Personal Loans BusinessRelationships
FundsManagement
CommSec Shareholders Employees
Customer Product Holdings1
Super
fund
unit
holders
?
1 Customers who hold at least one product in each of the major product categories shown. Totals not mutually exclusive – includes
cross product holdings. Figures are approximates only and may include some level of duplication across customer segments.
CommSec total includes active accounts only.
Australia Offshore
2.0m
4.4m
11.6m
Stakeholders
3.9m
1.2m
60
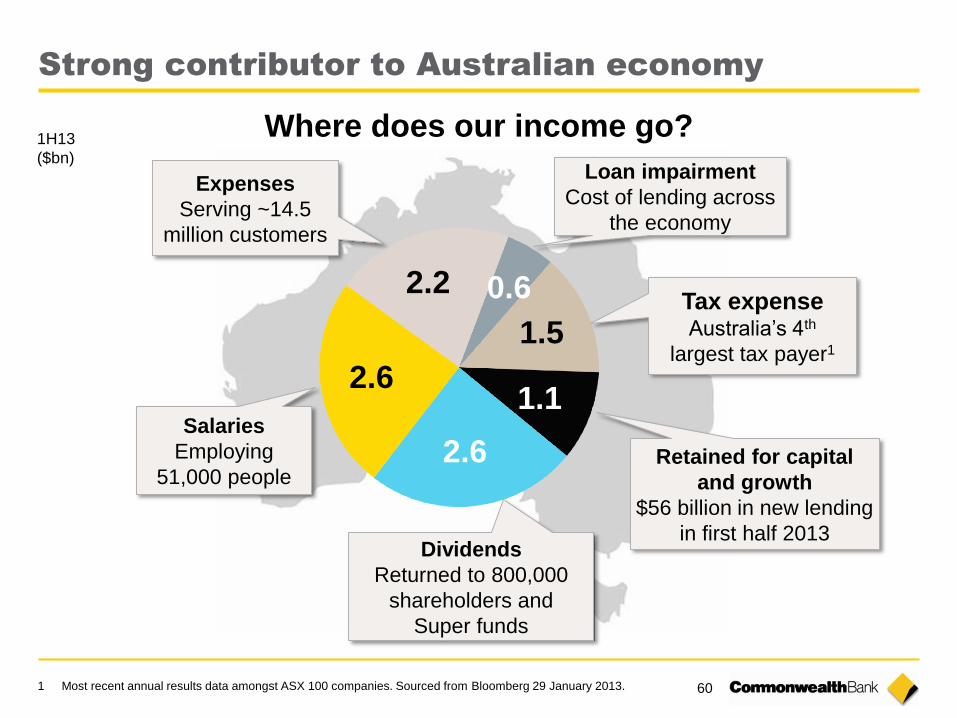
Where does our income go?
2.6
2.6
1.5
Salaries
Employing
51,000 people
Expenses
Serving ~14.5
million customers
Tax expense Australia’s 4th
largest tax payer1
Dividends
Returned to 800,000
shareholders and
Super funds
1H13
($bn) Loan impairment
Cost of lending across
the economy
1.1
Retained for capital
and growth
$56 billion in new lending
in first half 2013
2.2 0.6
1 Most recent annual results data amongst ASX 100 companies. Sourced from Bloomberg 29 January 2013.
Strong contributor to Australian economy
61
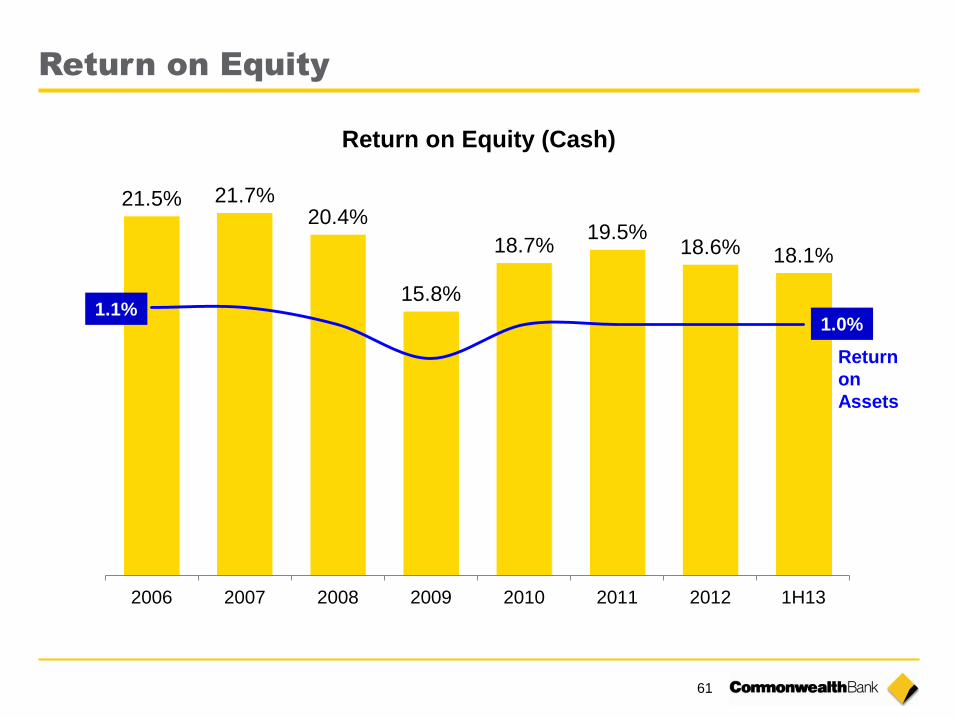
Return on Equity (Cash)
21.5% 21.7% 20.4%
15.8%
18.7% 19.5%
18.6% 18.1%
100
150
200
250
300
350
400
450
500
550
600
2006 2007 2008 2009 2010 2011 2012 1H13
1.1% 1.0%
Return
on
Assets
Return on Equity
62
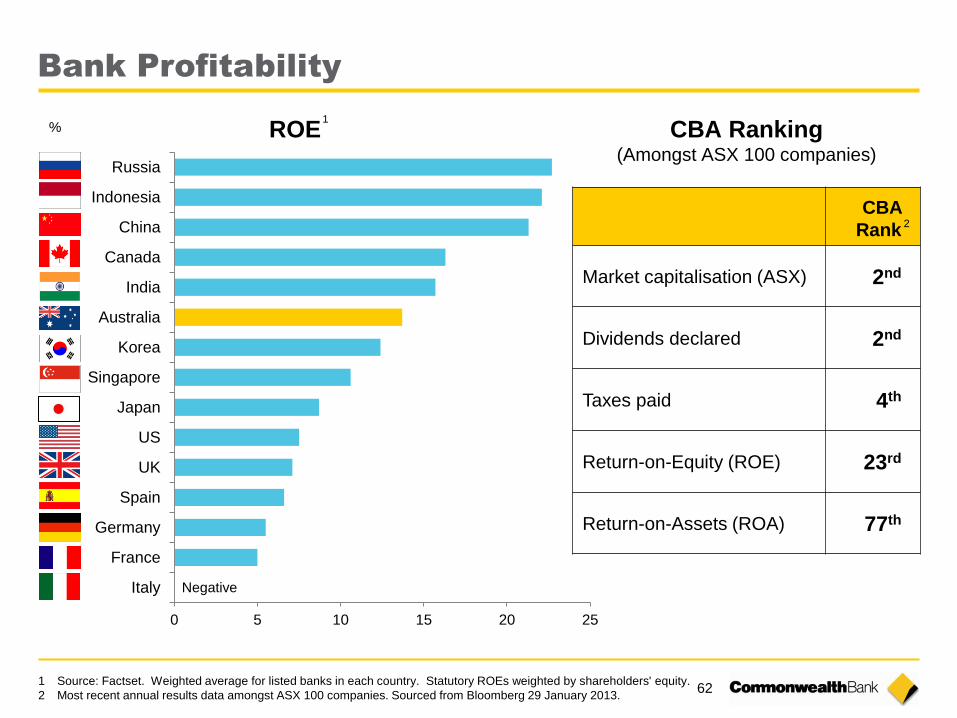
Bank Profitability
CBA
Rank
Market capitalisation (ASX) 2nd
Dividends declared 2nd
Taxes paid 4th
Return-on-Equity (ROE) 23rd
Return-on-Assets (ROA) 77th
CBA Ranking (Amongst ASX 100 companies)
2
1 Source: Factset. Weighted average for listed banks in each country. Statutory ROEs weighted by shareholders' equity.
2 Most recent annual results data amongst ASX 100 companies. Sourced from Bloomberg 29 January 2013.
0 5 10 15 20 25
Italy
France
Germany
Spain
UK
US
Japan
Singapore
Korea
Australia
India
Canada
China
Indonesia
Russia
ROE 1
%
Negative
63 1, 2 Refer notes slide at back of this presentation for source information.
60%
65%
70%
75%
80%
85%
% S
atisfie
d (
'Ve
ry S
atisfie
d' o
r 'F
air
ly S
atisfie
d')
CBA Peers
Jan 06 Jun 09 Dec 12
Retail Business
6
7
8
Jun 11 Dec 11 Jun 12 Dec 12
Satisfa
ction -
Avera
ge
CBA Peers
Customer Satisfaction Customer Satisfaction 2 1
Customer Satisfaction
64
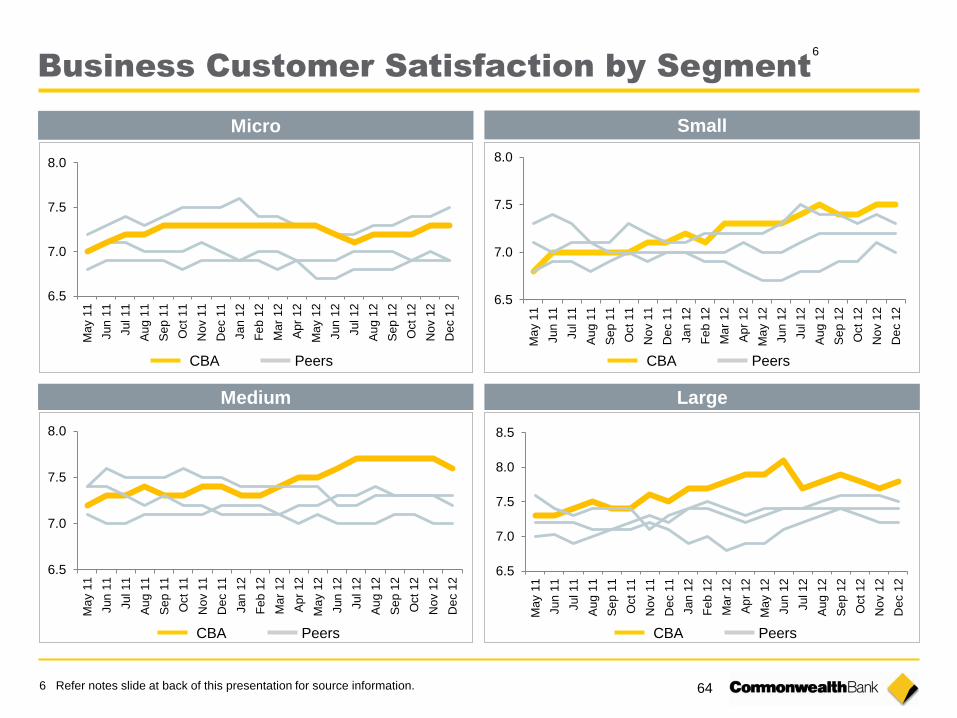
Micro Small
Medium Large
6.5
7.0
7.5
8.0
Ma
y 1
1
Jun
11
Jul 11
Au
g 1
1
Se
p 1
1
Oct
11
Nov 1
1
Dec 1
1
Jan
12
Fe
b 1
2
Ma
r 1
2
Ap
r 12
Ma
y 1
2
Jun
12
Jul 12
Au
g 1
2
Se
p 1
2
Oct
12
Nov 1
2
Dec 1
2
6.5
7.0
7.5
8.0
Ma
y 1
1
Jun
11
Jul 11
Au
g 1
1
Se
p 1
1
Oct
11
Nov 1
1
Dec 1
1
Jan
12
Fe
b 1
2
Ma
r 1
2
Ap
r 12
Ma
y 1
2
Jun
12
Jul 12
Au
g 1
2
Se
p 1
2
Oct
12
Nov 1
2
Dec 1
2
6.5
7.0
7.5
8.0
8.5
Ma
y 1
1
Jun
11
Jul 11
Au
g 1
1
Se
p 1
1
Oct
11
Nov 1
1
Dec 1
1
Jan
12
Fe
b 1
2
Ma
r 1
2
Ap
r 12
Ma
y 1
2
Jun
12
Jul 12
Au
g 1
2
Se
p 1
2
Oct
12
Nov 1
2
Dec 1
2
6 Refer notes slide at back of this presentation for source information.
6
CBA Peers CBA Peers
CBA Peers CBA Peers
6.5
7.0
7.5
8.0
Ma
y 1
1
Jun
11
Jul 11
Au
g 1
1
Se
p 1
1
Oct
11
No
v 1
1
De
c 1
1
Jan
12
Fe
b 1
2
Ma
r 1
2
Ap
r 12
Ma
y 1
2
Jun
12
Jul 12
Au
g 1
2
Se
p 1
2
Oct
12
No
v 1
2
De
c 1
2
Business Customer Satisfaction by Segment
65
Average Product Composition between CBA,
the 3 Major Banking Peers and Bankwest 18+
Peer 3 Peer 1 Bankwest CBA Peer 2
Insurance
Personal Lending
Home loan
Cards
Managed Funds Superannuation
Deposit and
transaction
accounts
3
3 Refer notes slide at back of this presentation for source information.
1.47 1.24 1.34
1.16 1.28
0.70
0.81 0.74 0.69
0.66
0.20 0.25 0.24
0.23 0.32
0.34 0.34 0.25
0.23 0.07
2.90 2.84 2.78
2.59
2.41
Products per Customer
66
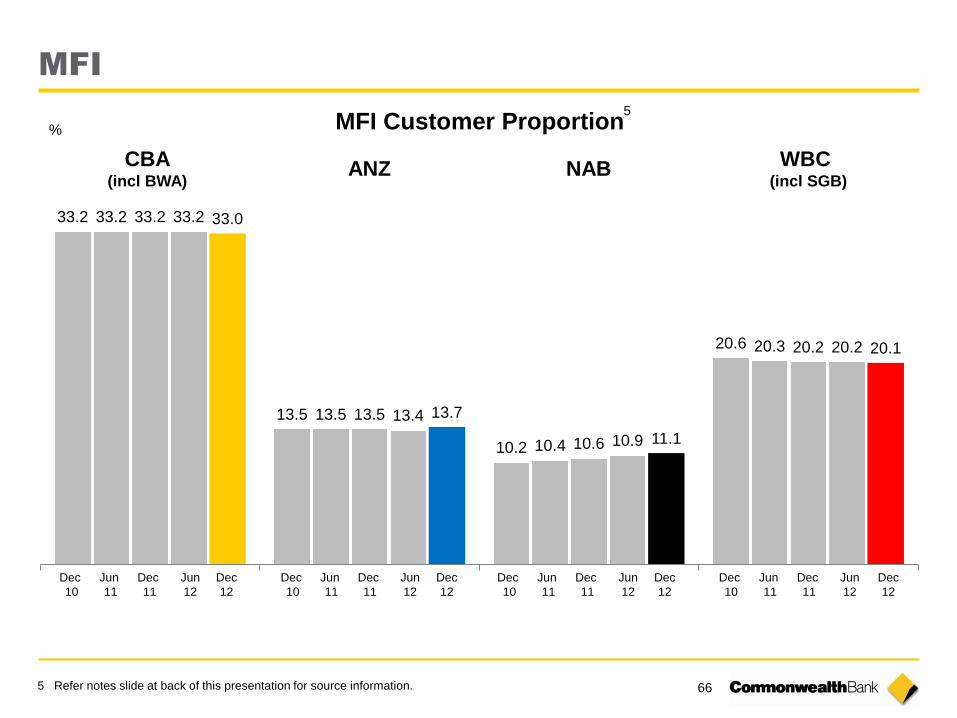
33.2
13.5
10.2
20.6
33.2
13.5
10.4
20.3
33.2
13.5
10.6
20.2
33.2
13.4
10.9
20.2
33.0
13.7
11.1
20.1
Dec
10
Jun
11
Dec
11
Jun
12
Dec
10
Jun
11
Dec
11
Jun
12
Dec
10
Jun
11
Dec
11
Jun
12
Dec
10
Jun
11
Dec
11
Jun
12
%
CBA (incl BWA)
ANZ NAB WBC (incl SGB)
MFI Customer Proportion
MFI
Dec
12
Dec
12
Dec
12
Dec
12
5 Refer notes slide at back of this presentation for source information.
5
67
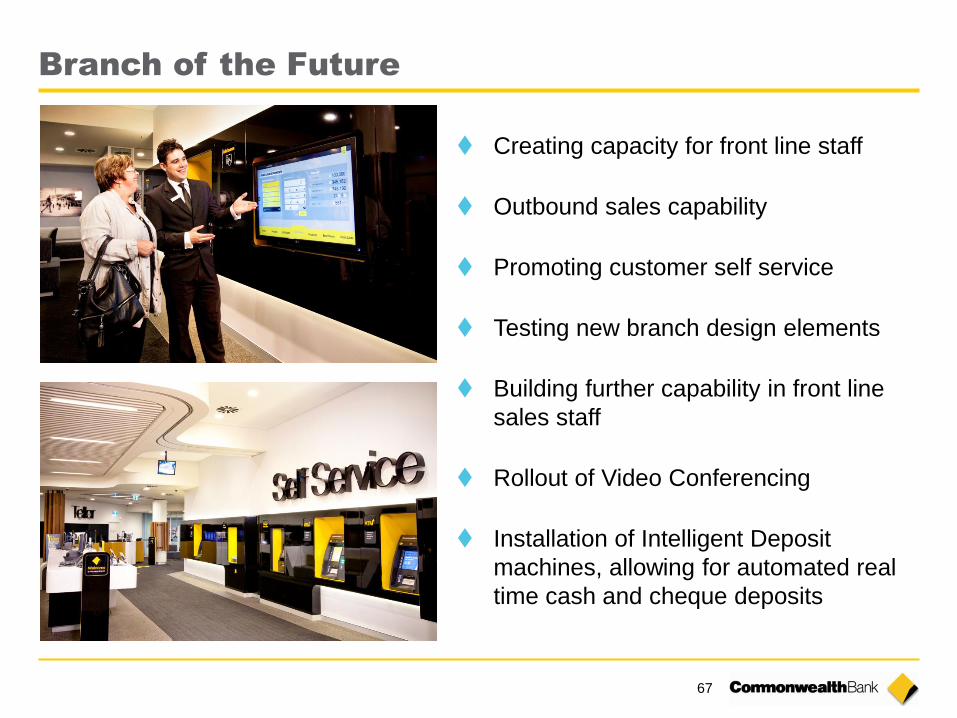
Branch of the Future
Creating capacity for front line staff
Outbound sales capability
Promoting customer self service
Testing new branch design elements
Building further capability in front line
sales staff
Rollout of Video Conferencing
Installation of Intelligent Deposit
machines, allowing for automated real
time cash and cheque deposits
68
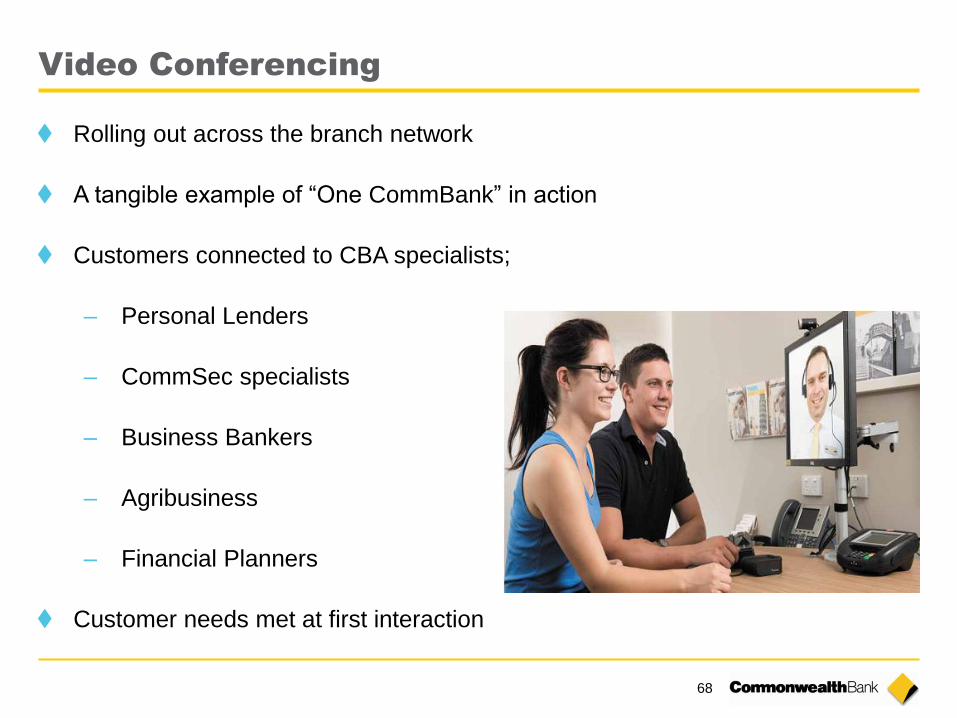
Video Conferencing
Rolling out across the branch network
A tangible example of “One CommBank” in action
Customers connected to CBA specialists;
– Personal Lenders
– CommSec specialists
– Business Bankers
– Agribusiness
– Financial Planners
Customer needs met at first interaction
69
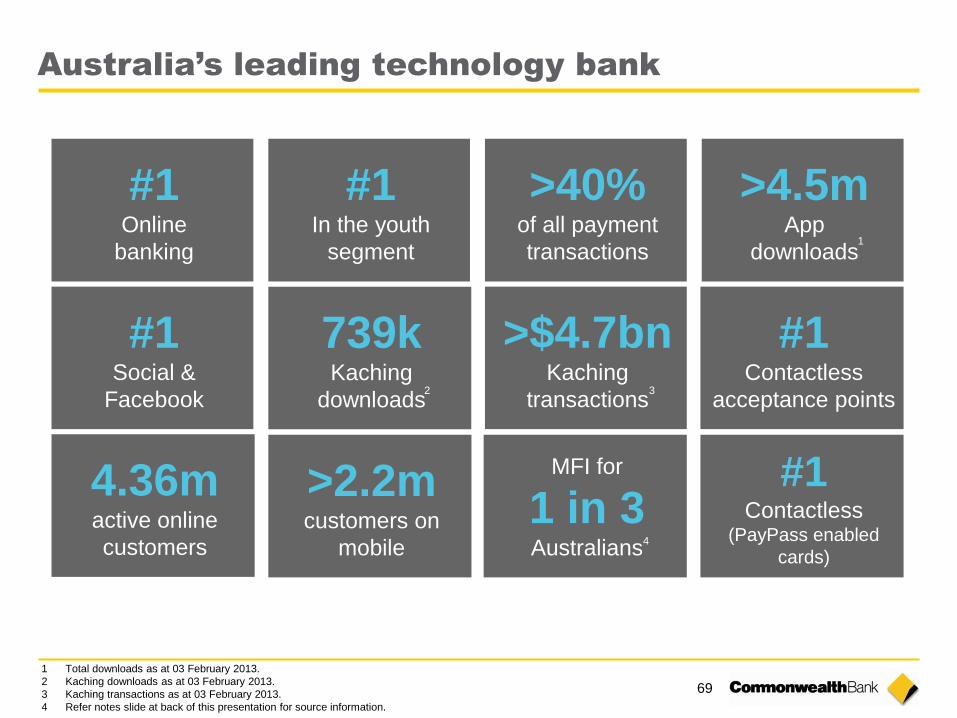
#1 Online
banking
#1 In the youth
segment
>40% of all payment
transactions
>4.5m App
downloads
#1 Social &
>$4.7bn Kaching
transactions
4.36m active online
customers
>2.2m customers on
mobile
#1 Contactless
acceptance points
MFI for
1 in 3 Australians
739k
Kaching
downloads
#1 Contactless
(PayPass enabled
cards)
1 Total downloads as at 03 February 2013.
2 Kaching downloads as at 03 February 2013.
3 Kaching transactions as at 03 February 2013.
4 Refer notes slide at back of this presentation for source information.
Australia’s leading technology bank
1
3 2
4
70
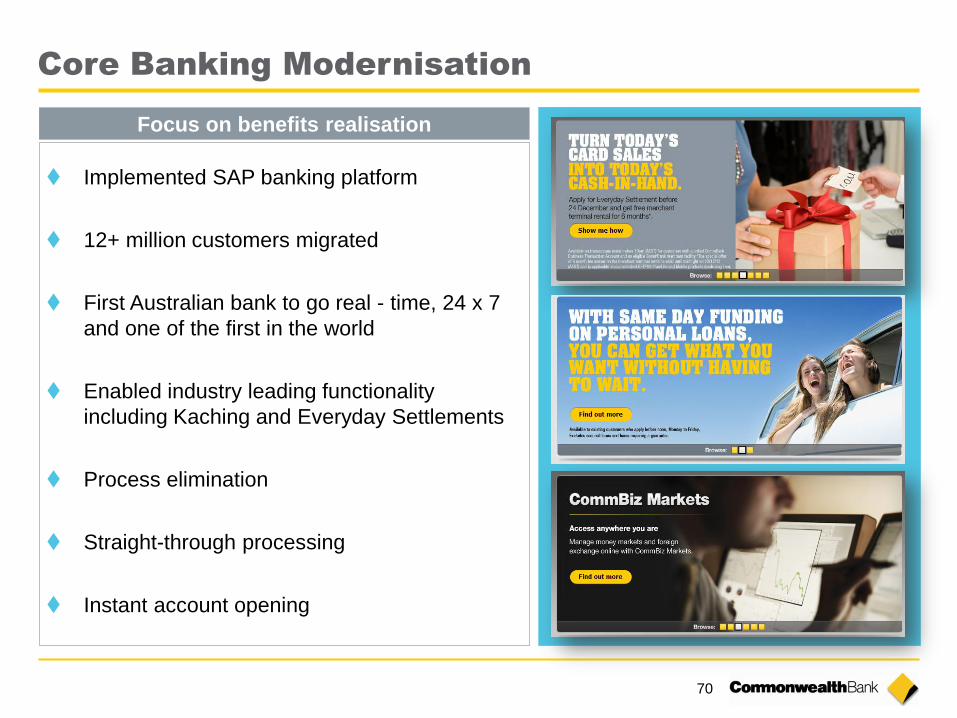
Core Banking Modernisation
Focus on benefits realisation
Implemented SAP banking platform
12+ million customers migrated
First Australian bank to go real - time, 24 x 7
and one of the first in the world
Enabled industry leading functionality
including Kaching and Everyday Settlements
Process elimination
Straight-through processing
Instant account opening
71
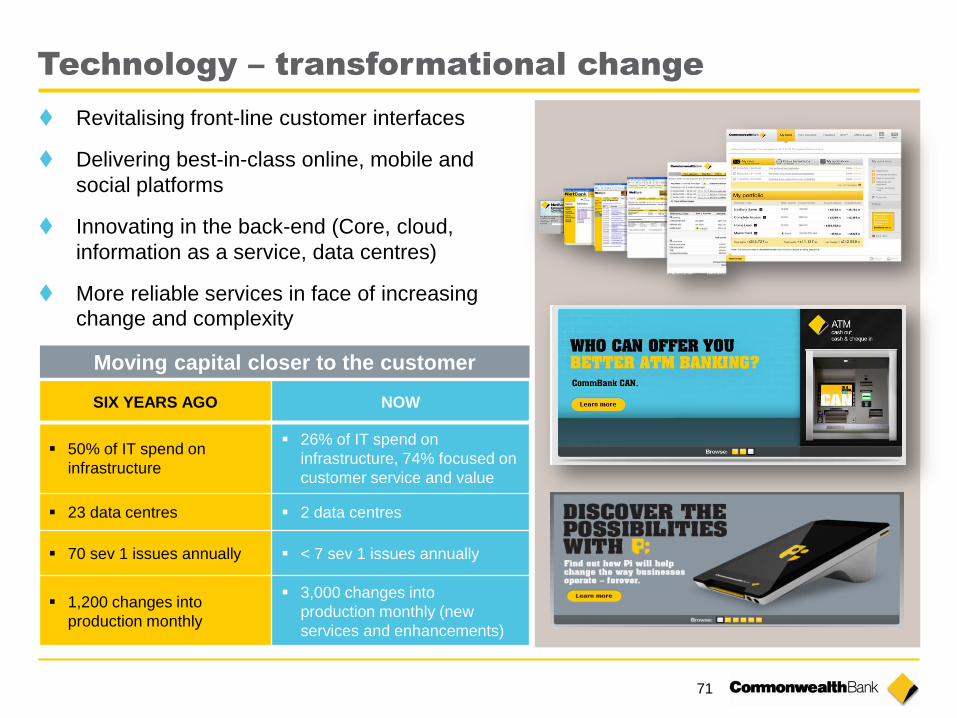
Technology – transformational change
SIX YEARS AGO NOW
50% of IT spend on
infrastructure
26% of IT spend on
infrastructure, 74% focused on
customer service and value
23 data centres 2 data centres
70 sev 1 issues annually < 7 sev 1 issues annually
1,200 changes into
production monthly
3,000 changes into
production monthly (new
services and enhancements)
Revitalising front-line customer interfaces
Delivering best-in-class online, mobile and
social platforms
Innovating in the back-end (Core, cloud,
information as a service, data centres)
More reliable services in face of increasing
change and complexity
Moving capital closer to the customer
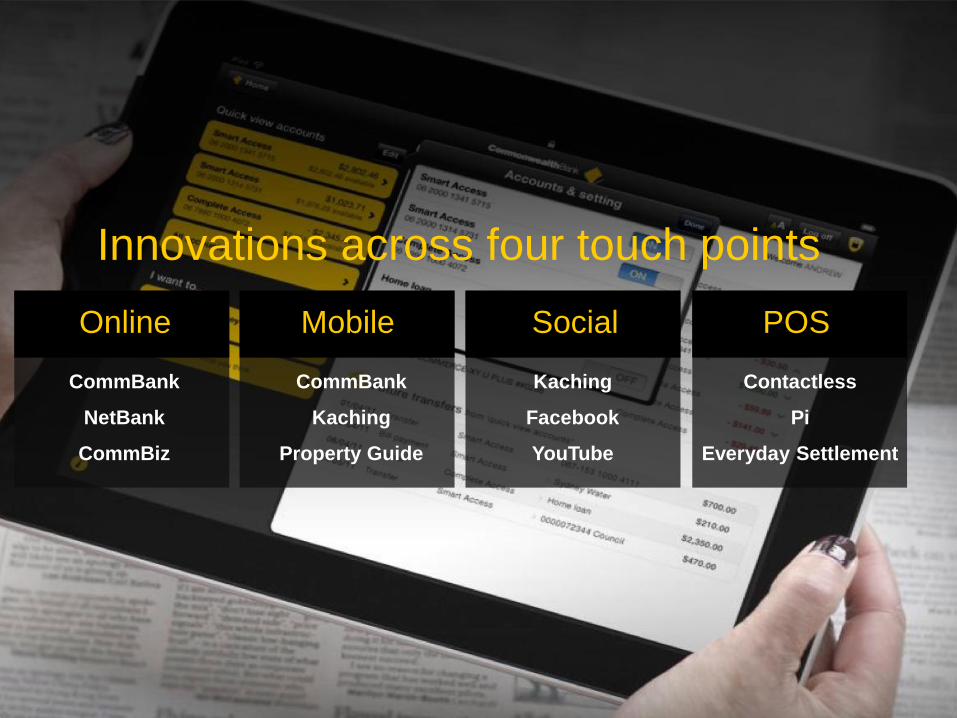
Innovations across four touch points
CommBank
NetBank
CommBiz
CommBank
Kaching
Property Guide
Kaching
YouTube
Contactless
Pi
Everyday Settlement
Online Mobile Social POS
73
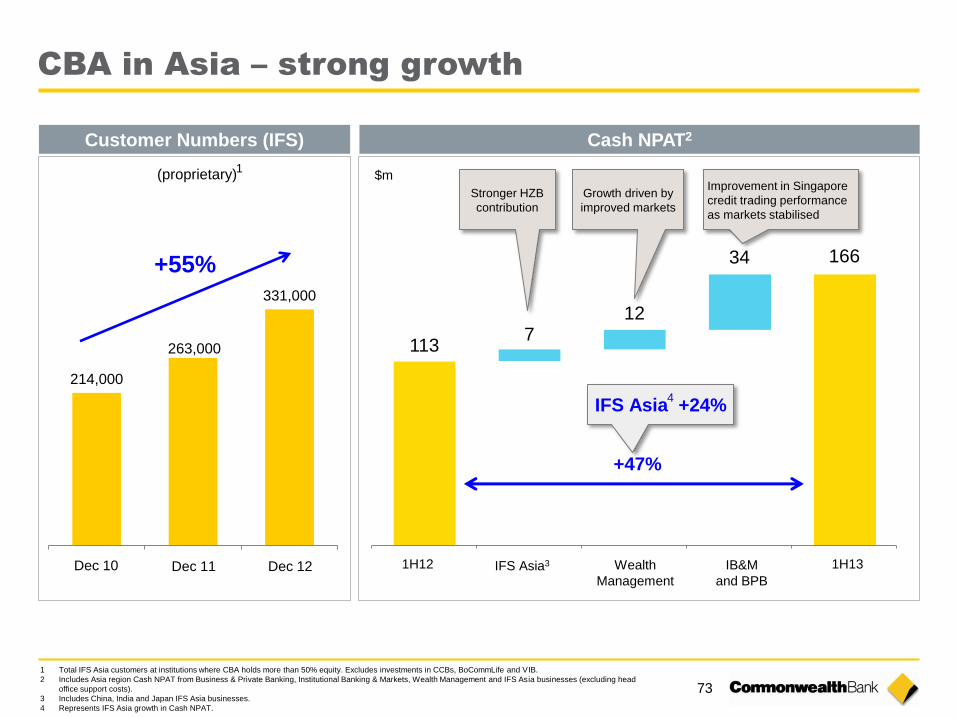
CBA in Asia – strong growth
+55%
(proprietary) 1
Customer Numbers (IFS) Cash NPAT2
$m
1 Total IFS Asia customers at institutions where CBA holds more than 50% equity. Excludes investments in CCBs, BoCommLife and VIB.
2 Includes Asia region Cash NPAT from Business & Private Banking, Institutional Banking & Markets, Wealth Management and IFS Asia businesses (excluding head
office support costs).
3 Includes China, India and Japan IFS Asia businesses.
4 Represents IFS Asia growth in Cash NPAT.
214,000
263,000
331,000
Improvement in Singapore
credit trading performance
as markets stabilised
Wealth
Management
IB&M
and BPB
+47%
Growth driven by
improved markets
IFS Asia +24%
Stronger HZB
contribution
IFS Asia3
4
1H12 1H13
113
166
7 12
34
Dec 10 Dec 11 Dec 12
74
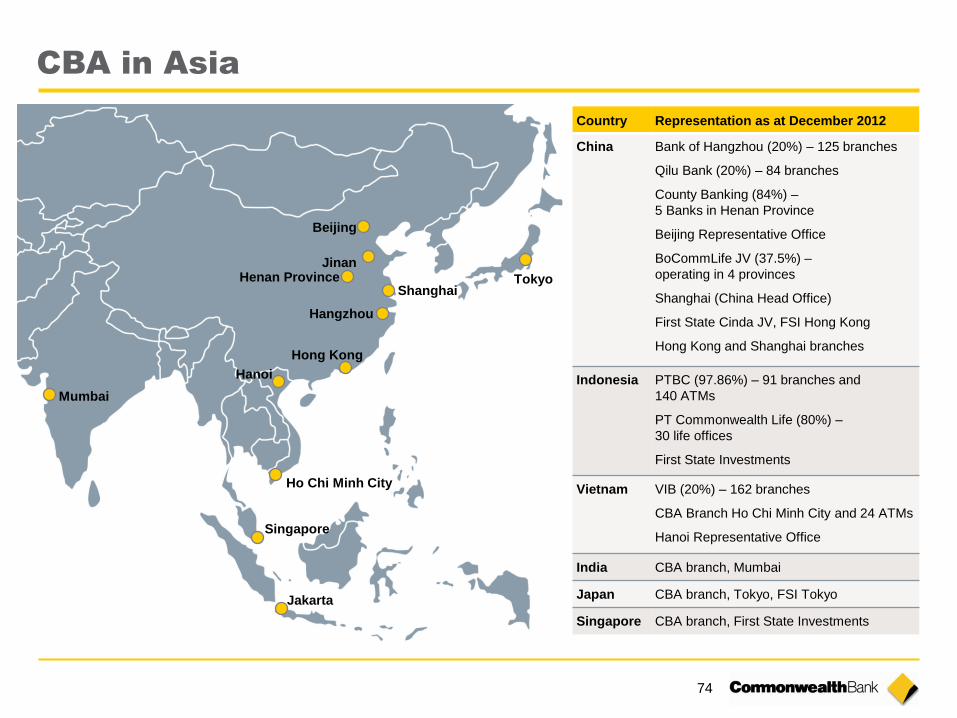
CBA in Asia
Mumbai
Ho Chi Minh City
Hanoi
Hong Kong
Hangzhou
Henan Province Jinan
Beijing
Shanghai Tokyo
Singapore
Jakarta
Country Representation as at December 2012
China Bank of Hangzhou (20%) – 125 branches
Qilu Bank (20%) – 84 branches
County Banking (84%) –
5 Banks in Henan Province
Beijing Representative Office
BoCommLife JV (37.5%) –
operating in 4 provinces
Shanghai (China Head Office)
First State Cinda JV, FSI Hong Kong
Hong Kong and Shanghai branches
Indonesia PTBC (97.86%) – 91 branches and
140 ATMs
PT Commonwealth Life (80%) –
30 life offices
First State Investments
Vietnam VIB (20%) – 162 branches
CBA Branch Ho Chi Minh City and 24 ATMs
Hanoi Representative Office
India CBA branch, Mumbai
Japan CBA branch, Tokyo, FSI Tokyo
Singapore CBA branch, First State Investments
75
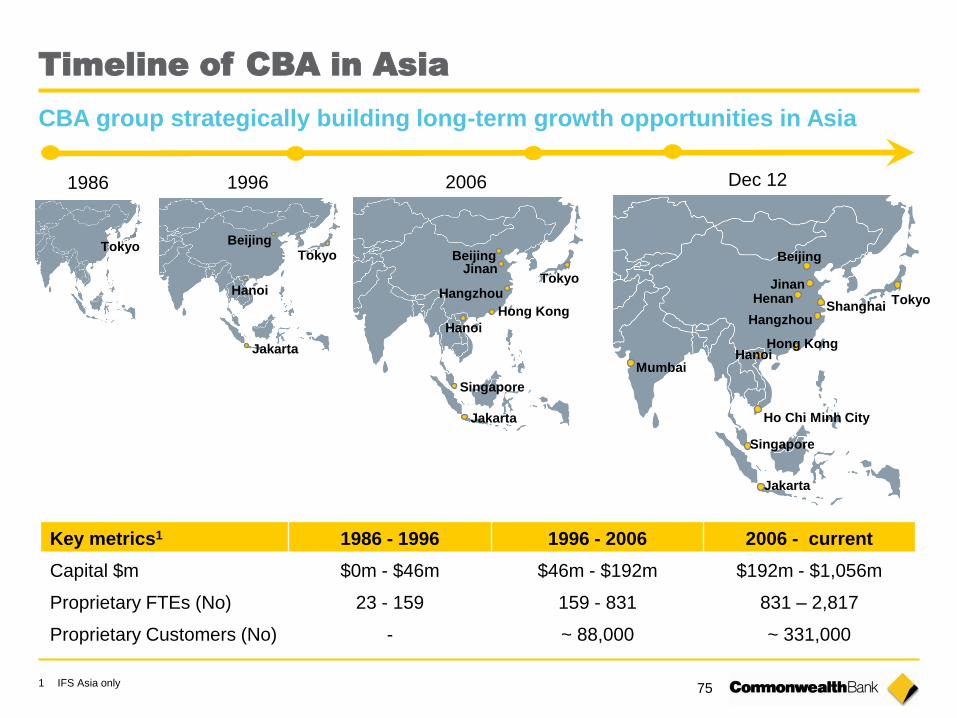
1986
Tokyo
Dec 12 1996
Hanoi
Beijing Tokyo
Jakarta
2006
Hanoi
Hong Kong
Hangzhou
Jinan Beijing
Tokyo
Singapore
Jakarta
Timeline of CBA in Asia
Key metrics1 1986 - 1996 1996 - 2006 2006 - current
Capital $m $0m - $46m $46m - $192m $192m - $1,056m
Proprietary FTEs (No) 23 - 159 159 - 831 831 – 2,817
Proprietary Customers (No) - ~ 88,000 ~ 331,000
CBA group strategically building long-term growth opportunities in Asia
Mumbai
Ho Chi Minh City
Hanoi Hong Kong
Hangzhou
Henan Jinan
Beijing
Shanghai Tokyo
Singapore
Jakarta
1 IFS Asia only
76
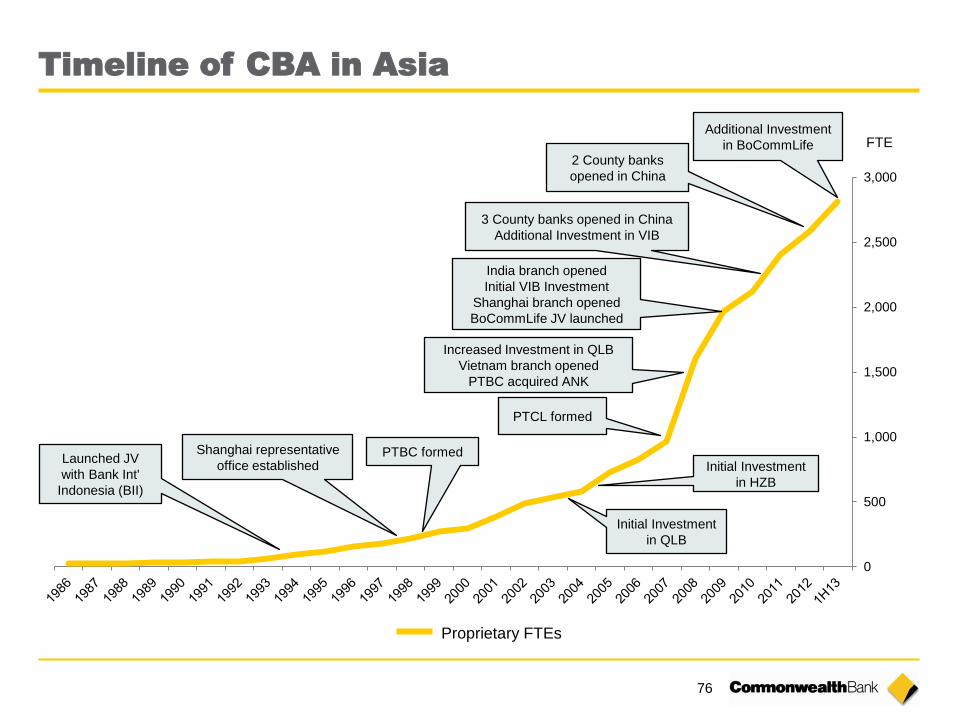
Timeline of CBA in Asia
0
500
1,000
1,500
2,000
2,500
3,000
Launched JV
with Bank Int'
Indonesia (BII)
Shanghai representative
office established PTBC formed
Initial Investment
in QLB
Initial Investment
in HZB
PTCL formed
Increased Investment in QLB
Vietnam branch opened
PTBC acquired ANK
India branch opened
Initial VIB Investment
Shanghai branch opened
BoCommLife JV launched
2 County banks
opened in China
Additional Investment
in BoCommLife
3 County banks opened in China
Additional Investment in VIB
Proprietary FTEs
FTE
77
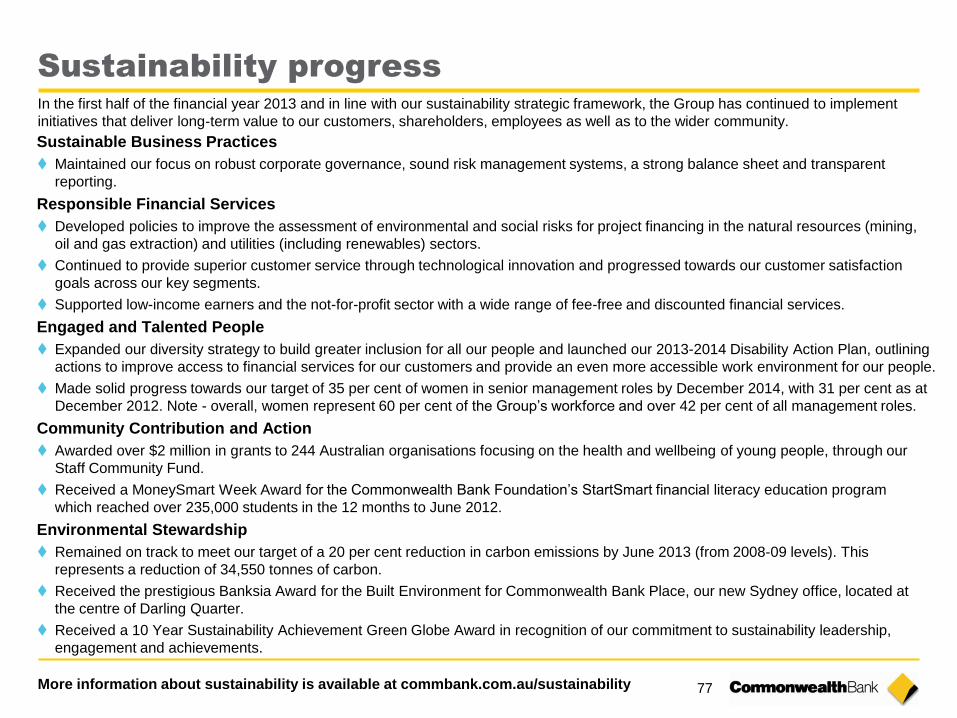
Sustainability progress
Sustainable Business Practices
Maintained our focus on robust corporate governance, sound risk management systems, a strong balance sheet and transparent
reporting.
Responsible Financial Services
Developed policies to improve the assessment of environmental and social risks for project financing in the natural resources (mining,
oil and gas extraction) and utilities (including renewables) sectors.
Continued to provide superior customer service through technological innovation and progressed towards our customer satisfaction
goals across our key segments.
Supported low-income earners and the not-for-profit sector with a wide range of fee-free and discounted financial services.
Engaged and Talented People
Expanded our diversity strategy to build greater inclusion for all our people and launched our 2013-2014 Disability Action Plan, outlining
actions to improve access to financial services for our customers and provide an even more accessible work environment for our people.
Made solid progress towards our target of 35 per cent of women in senior management roles by December 2014, with 31 per cent as at
December 2012. Note - overall, women represent 60 per cent of the Group’s workforce and over 42 per cent of all management roles.
Community Contribution and Action
Awarded over $2 million in grants to 244 Australian organisations focusing on the health and wellbeing of young people, through our
Staff Community Fund.
Received a MoneySmart Week Award for the Commonwealth Bank Foundation’s StartSmart financial literacy education program
which reached over 235,000 students in the 12 months to June 2012.
Environmental Stewardship
Remained on track to meet our target of a 20 per cent reduction in carbon emissions by June 2013 (from 2008-09 levels). This
represents a reduction of 34,550 tonnes of carbon.
Received the prestigious Banksia Award for the Built Environment for Commonwealth Bank Place, our new Sydney office, located at
the centre of Darling Quarter.
Received a 10 Year Sustainability Achievement Green Globe Award in recognition of our commitment to sustainability leadership,
engagement and achievements.
More information about sustainability is available at commbank.com.au/sustainability
In the first half of the financial year 2013 and in line with our sustainability strategic framework, the Group has continued to implement
initiatives that deliver long-term value to our customers, shareholders, employees as well as to the wider community.
78
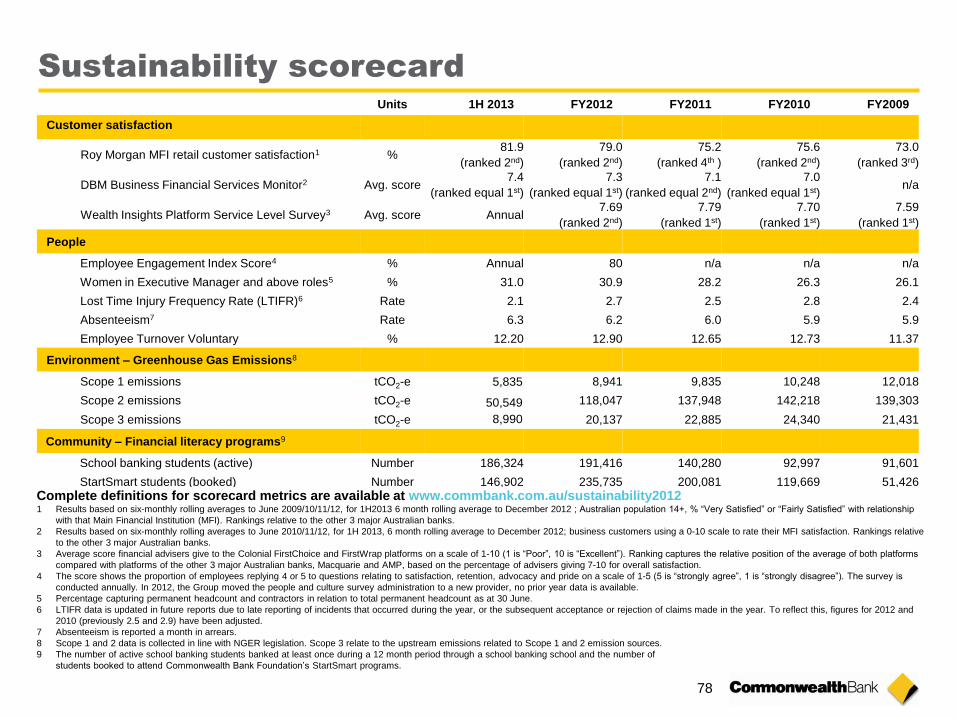
Sustainability scorecard
Units 1H 2013 FY2012 FY2011 FY2010 FY2009
Customer satisfaction
Roy Morgan MFI retail customer satisfaction1 % 81.9
(ranked 2nd)
79.0
(ranked 2nd)
75.2
(ranked 4th )
75.6
(ranked 2nd)
73.0
(ranked 3rd)
DBM Business Financial Services Monitor2 Avg. score 7.4
(ranked equal 1st)
7.3
(ranked equal 1st)
7.1
(ranked equal 2nd)
7.0
(ranked equal 1st) n/a
Wealth Insights Platform Service Level Survey3 Avg. score Annual 7.69
(ranked 2nd)
7.79
(ranked 1st)
7.70
(ranked 1st)
7.59
(ranked 1st)
People
Employee Engagement Index Score4 % Annual 80 n/a n/a n/a
Women in Executive Manager and above roles5 % 31.0 30.9 28.2 26.3 26.1
Lost Time Injury Frequency Rate (LTIFR)6 Rate 2.1 2.7 2.5 2.8 2.4
Absenteeism7 Rate 6.3 6.2 6.0 5.9 5.9
Employee Turnover Voluntary % 12.20 12.90 12.65 12.73 11.37
Environment – Greenhouse Gas Emissions8
Scope 1 emissions tCO2-e 5,835 8,941 9,835 10,248 12,018
Scope 2 emissions tCO2-e 50,549 118,047 137,948 142,218 139,303
Scope 3 emissions tCO2-e 8,990 20,137 22,885 24,340 21,431
Community – Financial literacy programs9
School banking students (active) Number 186,324 191,416 140,280 92,997 91,601
StartSmart students (booked) Number 146,902 235,735 200,081 119,669 51,426
Complete definitions for scorecard metrics are available at www.commbank.com.au/sustainability2012 1 Results based on six-monthly rolling averages to June 2009/10/11/12, for 1H2013 6 month rolling average to December 2012 ; Australian population 14+, % “Very Satisfied” or “Fairly Satisfied” with relationship
with that Main Financial Institution (MFI). Rankings relative to the other 3 major Australian banks.
2 Results based on six-monthly rolling averages to June 2010/11/12, for 1H 2013, 6 month rolling average to December 2012; business customers using a 0-10 scale to rate their MFI satisfaction. Rankings relative
to the other 3 major Australian banks.
3 Average score financial advisers give to the Colonial FirstChoice and FirstWrap platforms on a scale of 1-10 (1 is “Poor”, 10 is “Excellent”). Ranking captures the relative position of the average of both platforms
compared with platforms of the other 3 major Australian banks, Macquarie and AMP, based on the percentage of advisers giving 7-10 for overall satisfaction.
4 The score shows the proportion of employees replying 4 or 5 to questions relating to satisfaction, retention, advocacy and pride on a scale of 1-5 (5 is “strongly agree”, 1 is “strongly disagree”). The survey is
conducted annually. In 2012, the Group moved the people and culture survey administration to a new provider, no prior year data is available.
5 Percentage capturing permanent headcount and contractors in relation to total permanent headcount as at 30 June.
6 LTIFR data is updated in future reports due to late reporting of incidents that occurred during the year, or the subsequent acceptance or rejection of claims made in the year. To reflect this, figures for 2012 and
2010 (previously 2.5 and 2.9) have been adjusted.
7 Absenteeism is reported a month in arrears.
8 Scope 1 and 2 data is collected in line with NGER legislation. Scope 3 relate to the upstream emissions related to Scope 1 and 2 emission sources.
9 The number of active school banking students banked at least once during a 12 month period through a school banking school and the number of
students booked to attend Commonwealth Bank Foundation’s StartSmart programs.
79
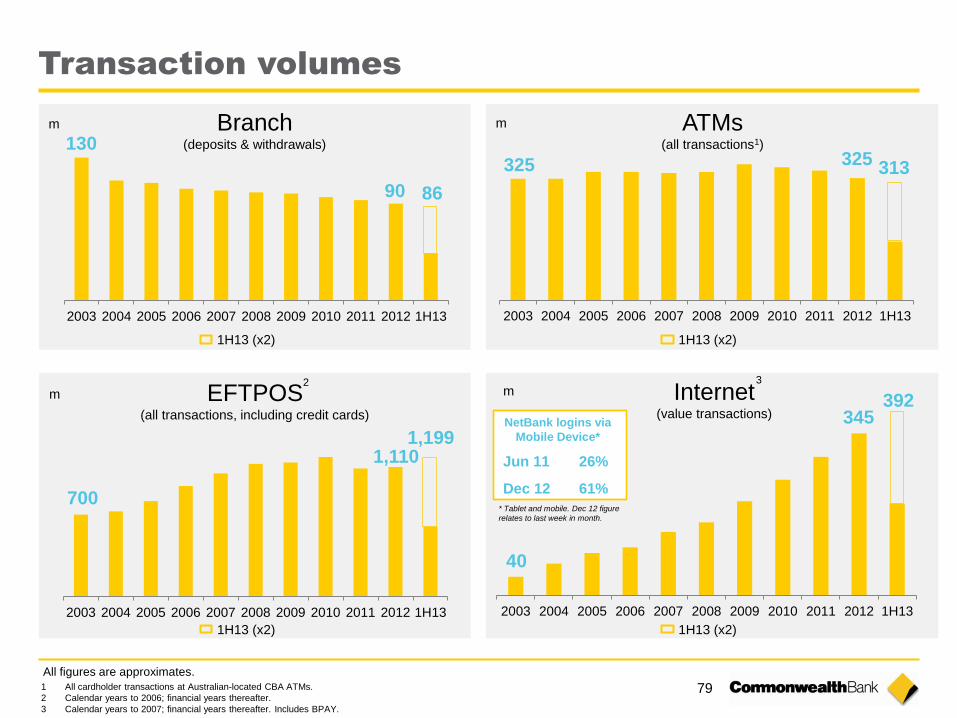
2003 2004 2005 2006 2007 2008 2009 2010 2011 2012 1H13
ATMs (all transactions1)
EFTPOS (all transactions, including credit cards)
Internet (value transactions)
40
392 m m
700
1,199
325 313
m
Transaction volumes
NetBank logins via
Mobile Device*
* Tablet and mobile. Dec 12 figure
relates to last week in month.
2003 2004 2005 2006 2007 2008 2009 2010 2011 2012 1H13
1 All cardholder transactions at Australian-located CBA ATMs.
2 Calendar years to 2006; financial years thereafter.
3 Calendar years to 2007; financial years thereafter. Includes BPAY.
2003 2004 2005 2006 2007 2008 2009 2010 2011 2012 1H13
Jun 11 26%
Dec 12 61%
2003 2004 2005 2006 2007 2008 2009 2010 2011 2012 1H13
130
86
Branch (deposits & withdrawals)
m
All figures are approximates.
1H13 (x2)
90
1,110
345
325
2 3
1H13 (x2)
1H13 (x2) 1H13 (x2)
Index
Strategy 57
Business Performance 80
Risk and Credit Quality 98
Capital, Funding & Liquidity 111
Economic Indicators 125
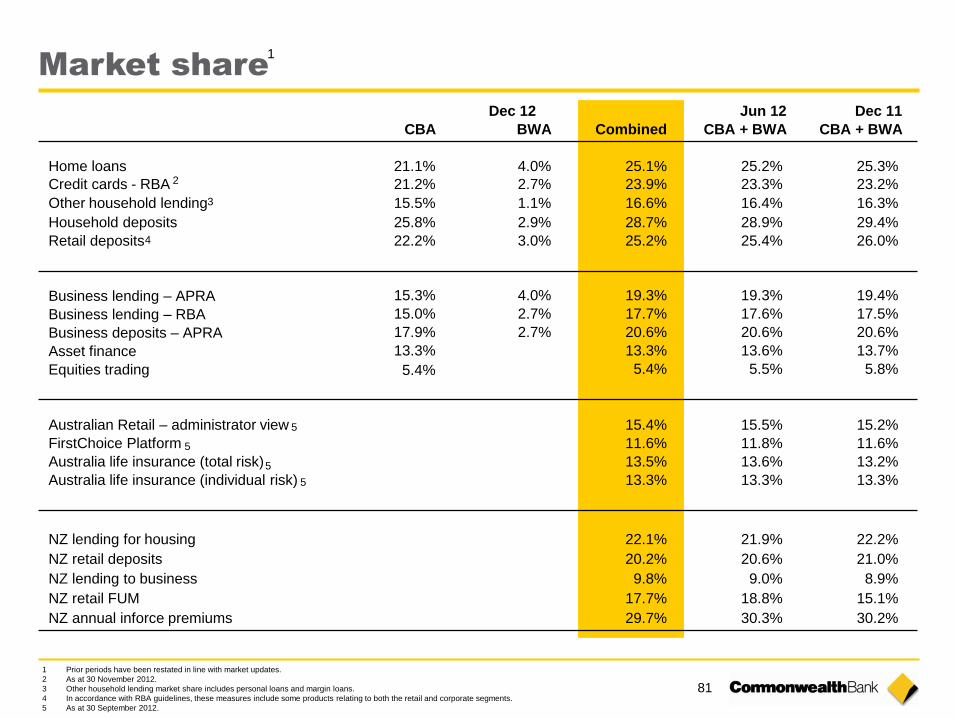
81
Market share
Dec 12 Jun 12 Dec 11
CBA BWA Combined CBA + BWA CBA + BWA
Home loans 21.1% 4.0% 25.1% 25.2% 25.3%
Credit cards - RBA 21.2% 2.7% 23.9% 23.3% 23.2%
Other household lending 15.5% 1.1% 16.6% 16.4% 16.3%
Household deposits 25.8% 2.9% 28.7% 28.9% 29.4%
Retail deposits 22.2% 3.0% 25.2% 25.4% 26.0%
Business lending – APRA 15.3% 4.0% 19.3% 19.3% 19.4%
Business lending – RBA 15.0% 2.7% 17.7% 17.6% 17.5%
Business deposits – APRA 17.9% 2.7% 20.6% 20.6% 20.6%
Asset finance 13.3% 13.3% 13.6% 13.7%
Equities trading 5.4% 5.4% 5.5% 5.8%
Australian Retail – administrator view 15.4% 15.5% 15.2%
FirstChoice Platform 11.6% 11.8% 11.6%
Australia life insurance (total risk) 13.5% 13.6% 13.2%
Australia life insurance (individual risk) 13.3% 13.3% 13.3%
NZ lending for housing 22.1% 21.9% 22.2%
NZ retail deposits 20.2% 20.6% 21.0%
NZ lending to business 9.8% 9.0% 8.9%
NZ retail FUM 17.7% 18.8% 15.1%
NZ annual inforce premiums 29.7% 30.3% 30.2%
1 Prior periods have been restated in line with market updates.
2 As at 30 November 2012.
3 Other household lending market share includes personal loans and margin loans.
4 In accordance with RBA guidelines, these measures include some products relating to both the retail and corporate segments.
5 As at 30 September 2012.
5
3
5
5
5
4
1
2
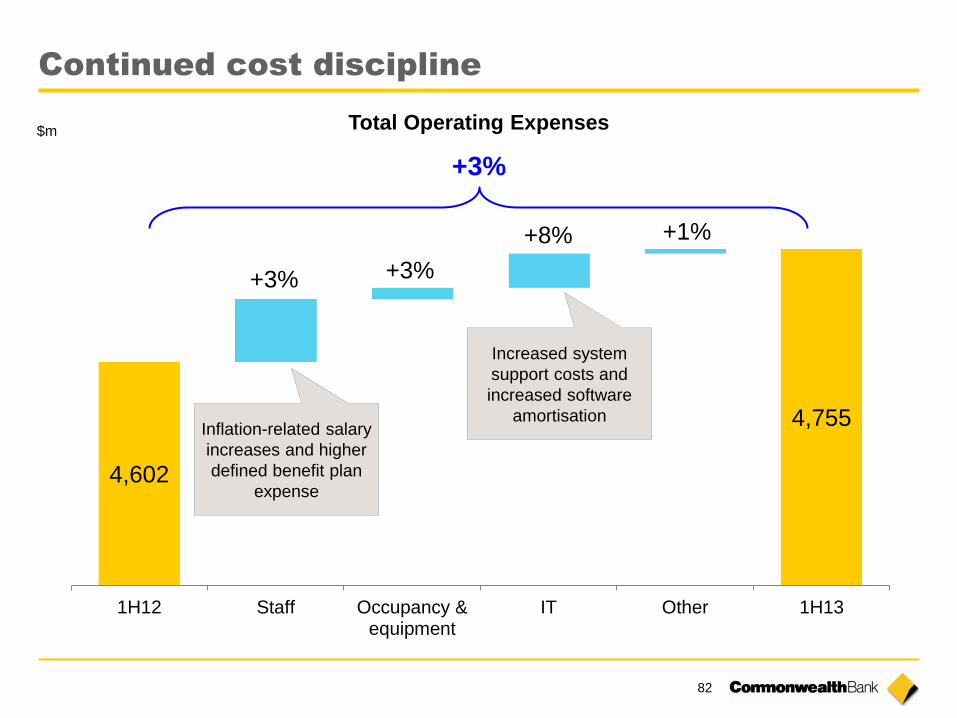
82
Continued cost discipline
4,602
4,755
1H12 Staff Occupancy &equipment
IT Other 1H13
$m
+3%
+8% +1%
+3%
Inflation-related salary
increases and higher
defined benefit plan
expense
+3%
Total Operating Expenses
Increased system
support costs and
increased software
amortisation
83
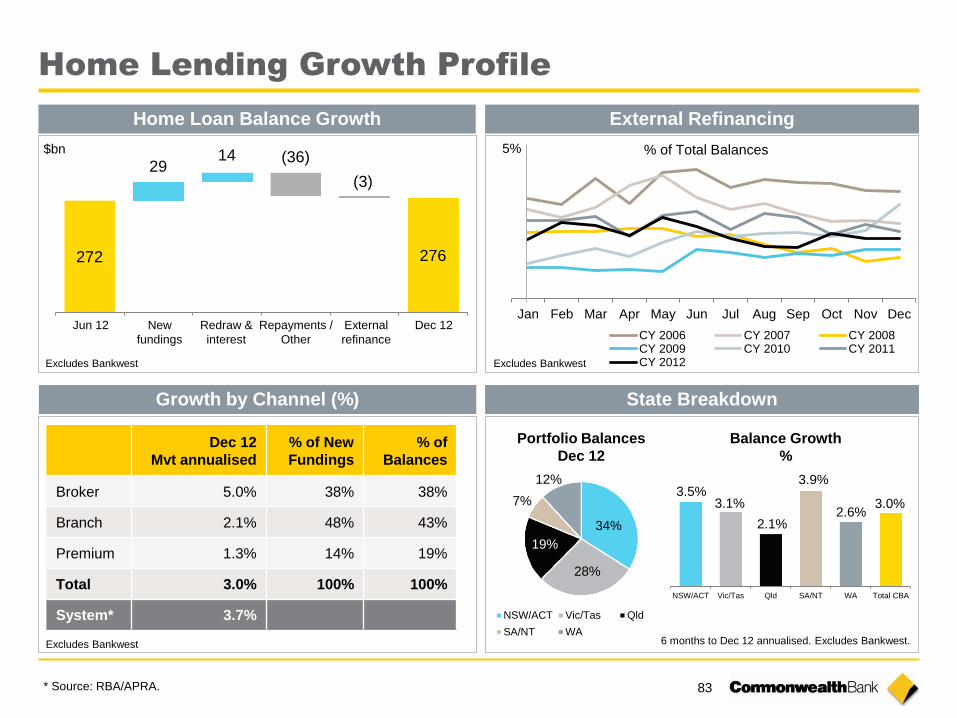
Home Lending Growth Profile
* Source: RBA/APRA.
272 276
29 14 (36)
(3)
$bn
Jan Feb Mar Apr May Jun Jul Aug Sep Oct Nov Dec
CY 2006 CY 2007 CY 2008CY 2009 CY 2010 CY 2011CY 2012
5% % of Total Balances
Jun 12 New
fundings
Redraw &
interest
Repayments /
Other
External
refinance
Dec 12
3.5% 3.1%
2.1%
3.9%
2.6% 3.0%
NSW/ACT Vic/Tas Qld SA/NT WA Total CBA
6 months to Dec 12 annualised. Excludes Bankwest.
Excludes Bankwest
Excludes Bankwest
Excludes Bankwest
Home Loan Balance Growth External Refinancing
Growth by Channel (%) State Breakdown
Balance Growth
%
Portfolio Balances
Dec 12
34%
28%
19%
7%
12%
NSW/ACT Vic/Tas Qld
SA/NT WA
Dec 12
Mvt annualised
% of New
Fundings
% of
Balances
Broker 5.0% 38% 38%
Branch 2.1% 48% 43%
Premium 1.3% 14% 19%
Total 3.0% 100% 100%
System* 3.7%
84
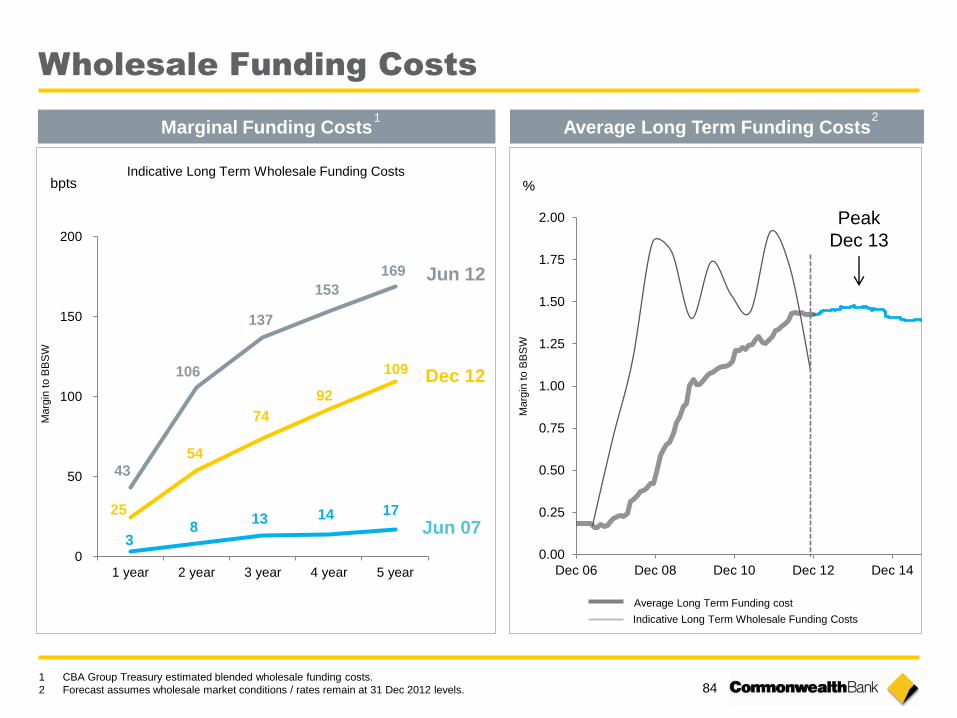
3 8
13 14 17
43
106
137
153
169
25
54
74
92
109
0
50
100
150
200
1 year 2 year 3 year 4 year 5 year
Marg
in t
o B
BS
W
Average Long Term Funding Costs
Marg
in t
o B
BS
W
Peak
Dec 13
Marginal Funding Costs
bpts Indicative Long Term Wholesale Funding Costs
Dec 12
Jun 12
Jun 07
1 CBA Group Treasury estimated blended wholesale funding costs.
2 Forecast assumes wholesale market conditions / rates remain at 31 Dec 2012 levels.
1 2
Average Long Term Funding cost
Indicative Long Term Wholesale Funding Costs
0.00
0.25
0.50
0.75
1.00
1.25
1.50
1.75
2.00
Dec 06 Dec 08 Dec 10 Dec 12 Dec 14
%
Wholesale Funding Costs
85
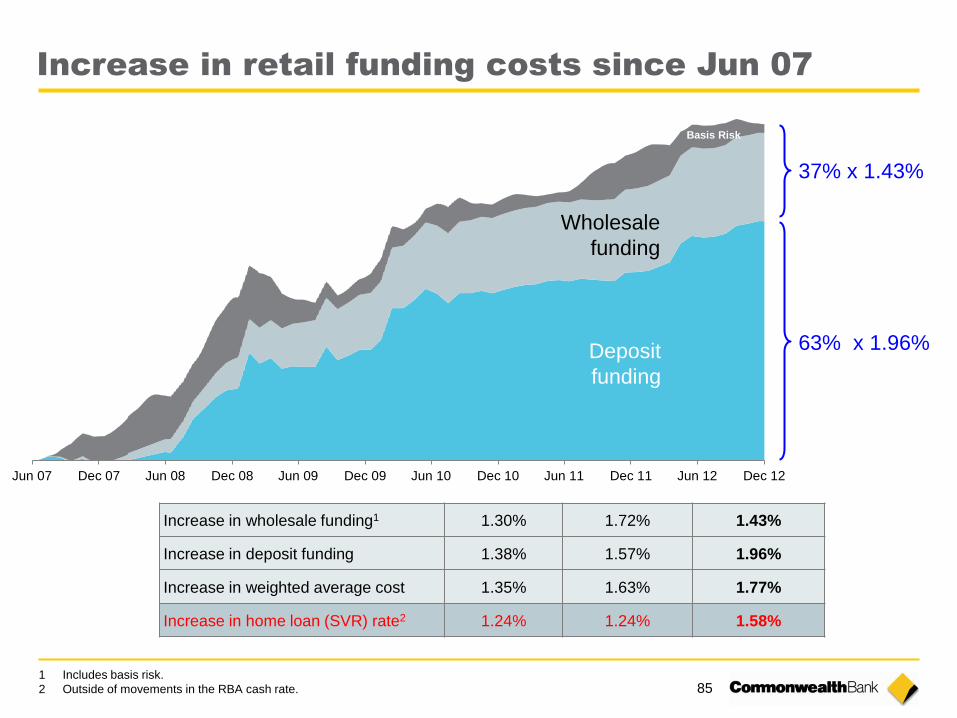
Deposit Funding
Increase in wholesale funding1 1.30% 1.72% 1.43%
Increase in deposit funding 1.38% 1.57% 1.96%
Increase in weighted average cost 1.35% 1.63% 1.77%
Increase in home loan (SVR) rate2 1.24% 1.24% 1.58%
Jun 07 Dec 07 Jun 08 Dec 08 Jun 09 Dec 09 Jun 10 Dec 10 Jun 11 Dec 11 Jun 12 Dec 12
Basis Risk
37% x 1.43%
63% x 1.96%
1 Includes basis risk.
2 Outside of movements in the RBA cash rate.
Increase in retail funding costs since Jun 07
Deposit
funding
Wholesale
funding
86
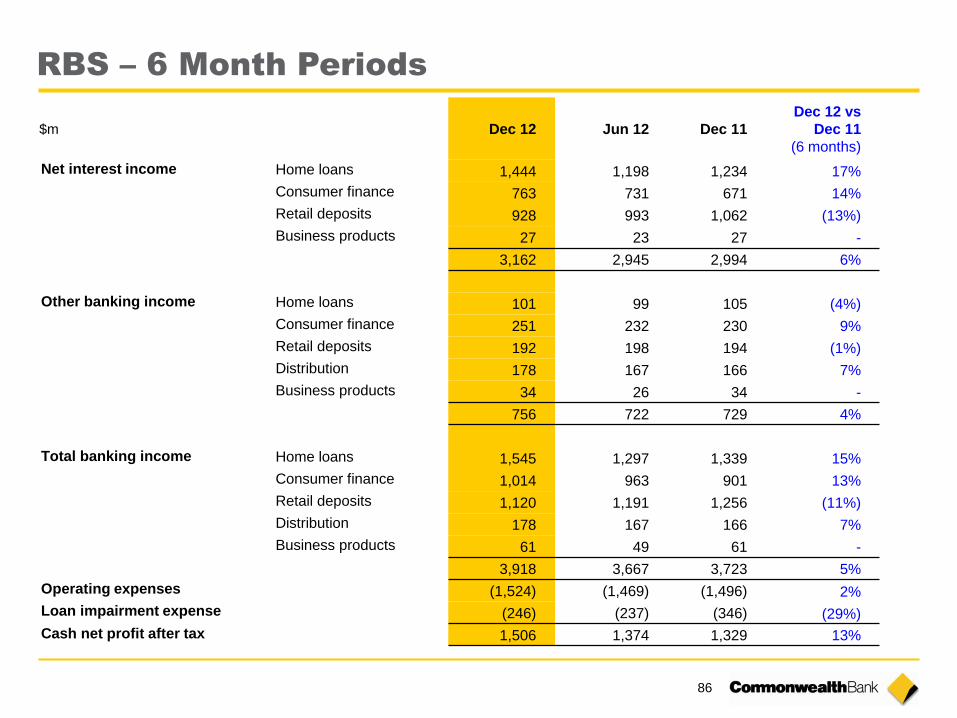
RBS – 6 Month Periods
Dec 12 Jun 12 Dec 11
Dec 12 vs
Dec 11
(6 months)
Net interest income Home loans 1,444 1,198 1,234 17%
Consumer finance 763 731 671 14%
Retail deposits 928 993 1,062 (13%)
Business products 27 23 27 -
3,162 2,945 2,994 6%
Other banking income Home loans 101 99 105 (4%)
Consumer finance 251 232 230 9%
Retail deposits 192 198 194 (1%)
Distribution 178 167 166 7%
Business products 34 26 34 -
756 722 729 4%
Total banking income Home loans 1,545 1,297 1,339 15%
Consumer finance 1,014 963 901 13%
Retail deposits 1,120 1,191 1,256 (11%)
Distribution 178 167 166 7%
Business products 61 49 61 -
3,918 3,667 3,723 5%
Operating expenses (1,524) (1,469) (1,496) 2%
Loan impairment expense (246) (237) (346) (29%)
Cash net profit after tax 1,506 1,374 1,329 13%
$m
87
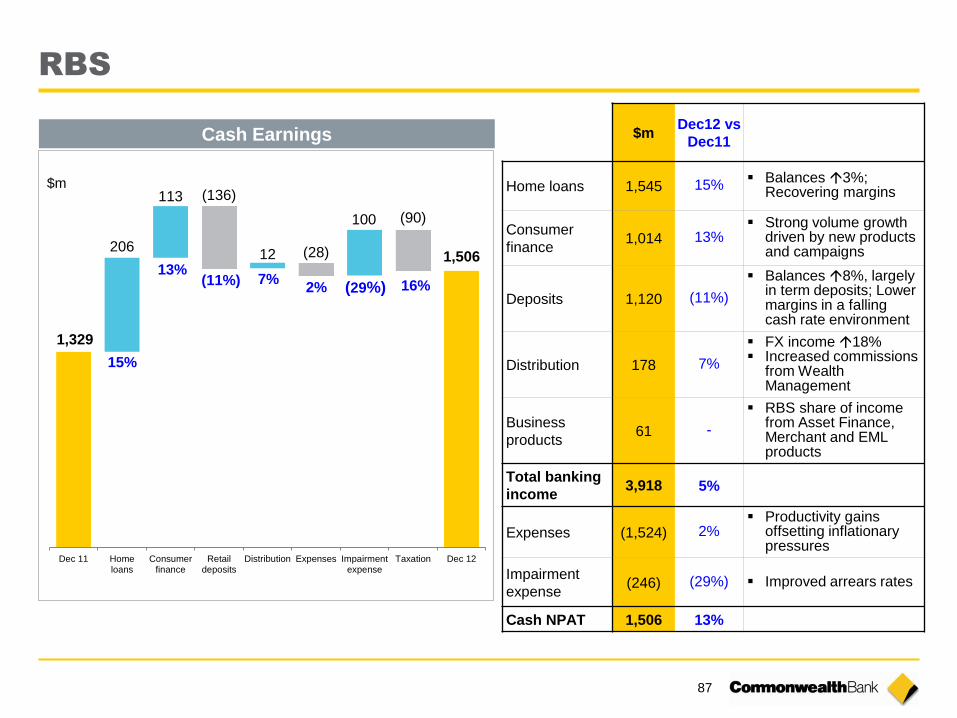
RBS
(136)
(28)
(90)
206
113
12
100
1,329
1,506
Dec 11 Homeloans
Consumerfinance
Retaildeposits
Distribution Expenses Impairmentexpense
Taxation Dec 12
15%
13% 7%
(29%) (11%)
2% 16%
$m
$m Dec12 vs
Dec11
Home loans 1,545 15% Balances 3%;
Recovering margins
Consumer
finance 1,014 13%
Strong volume growth driven by new products and campaigns
Deposits 1,120 (11%)
Balances 8%, largely in term deposits; Lower margins in a falling cash rate environment
Distribution 178 7%
FX income 18% Increased commissions
from Wealth Management
Business
products 61 -
RBS share of income from Asset Finance, Merchant and EML products
Total banking
income 3,918 5%
Expenses (1,524) 2% Productivity gains
offsetting inflationary pressures
Impairment
expense (246) (29%) Improved arrears rates
Cash NPAT 1,506 13%
Cash Earnings
88
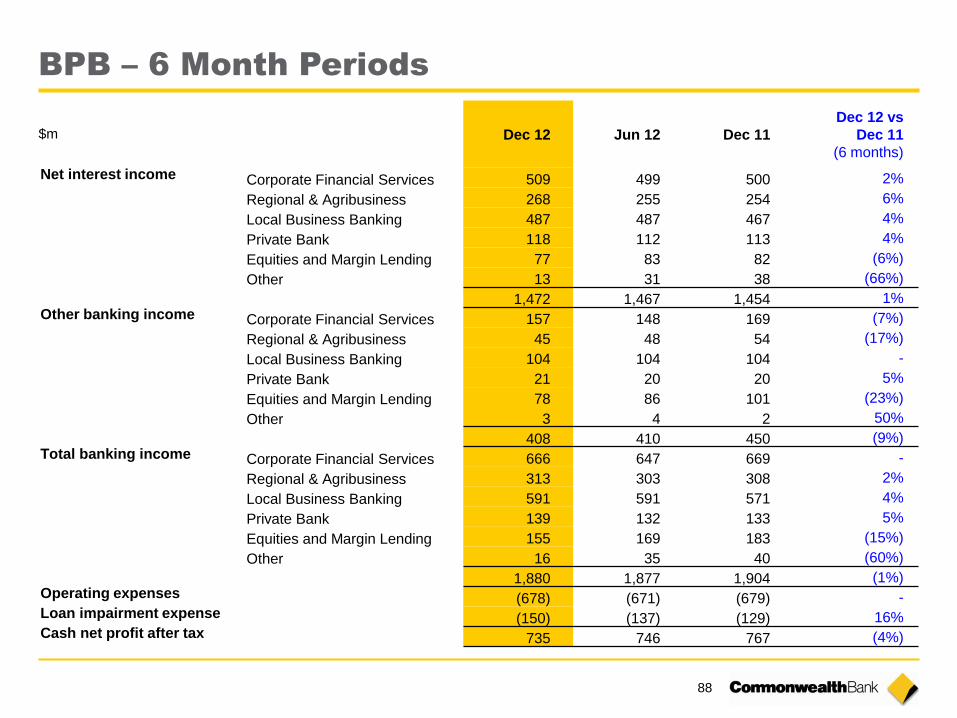
BPB – 6 Month Periods
Dec 12 Jun 12 Dec 11
Dec 12 vs
Dec 11
(6 months)
Net interest income Corporate Financial Services 509 499 500 2%
Regional & Agribusiness 268 255 254 6%
Local Business Banking 487 487 467 4%
Private Bank 118 112 113 4%
Equities and Margin Lending 77 83 82 (6%)
Other 13 31 38 (66%)
1,472 1,467 1,454 1% Other banking income Corporate Financial Services 157 148 169 (7%)
Regional & Agribusiness 45 48 54 (17%)
Local Business Banking 104 104 104 -
Private Bank 21 20 20 5%
Equities and Margin Lending 78 86 101 (23%)
Other 3 4 2 50%
408 410 450 (9%) Total banking income Corporate Financial Services 666 647 669 -
Regional & Agribusiness 313 303 308 2%
Local Business Banking 591 591 571 4%
Private Bank 139 132 133 5%
Equities and Margin Lending 155 169 183 (15%)
Other 16 35 40 (60%)
1,880 1,877 1,904 (1%) Operating expenses (678) (671) (679) - Loan impairment expense (150) (137) (129) 16% Cash net profit after tax 735 746 767 (4%)
$m
89
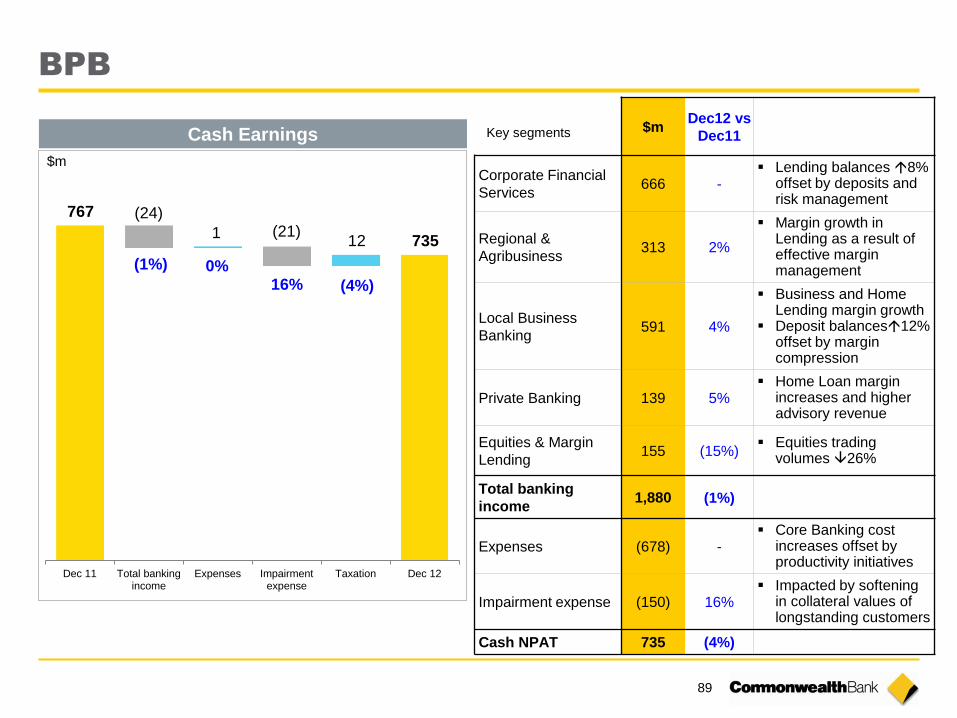
BPB
767
735
(24)
1 (21) 12
Dec 11 Total bankingincome
Expenses Impairmentexpense
Taxation Dec 12
(1%) 0% 16% (4%)
$m Dec12 vs
Dec11
Corporate Financial
Services 666 -
Lending balances 8% offset by deposits and risk management
Regional &
Agribusiness 313 2%
Margin growth in Lending as a result of effective margin management
Local Business
Banking 591 4%
Business and Home Lending margin growth
Deposit balances12% offset by margin compression
Private Banking 139 5% Home Loan margin
increases and higher advisory revenue
Equities & Margin
Lending 155 (15%)
Equities trading volumes 26%
Total banking
income 1,880 (1%)
Expenses (678) - Core Banking cost
increases offset by productivity initiatives
Impairment expense (150) 16% Impacted by softening
in collateral values of longstanding customers
Cash NPAT 735 (4%)
Cash Earnings
$m
Key segments
90
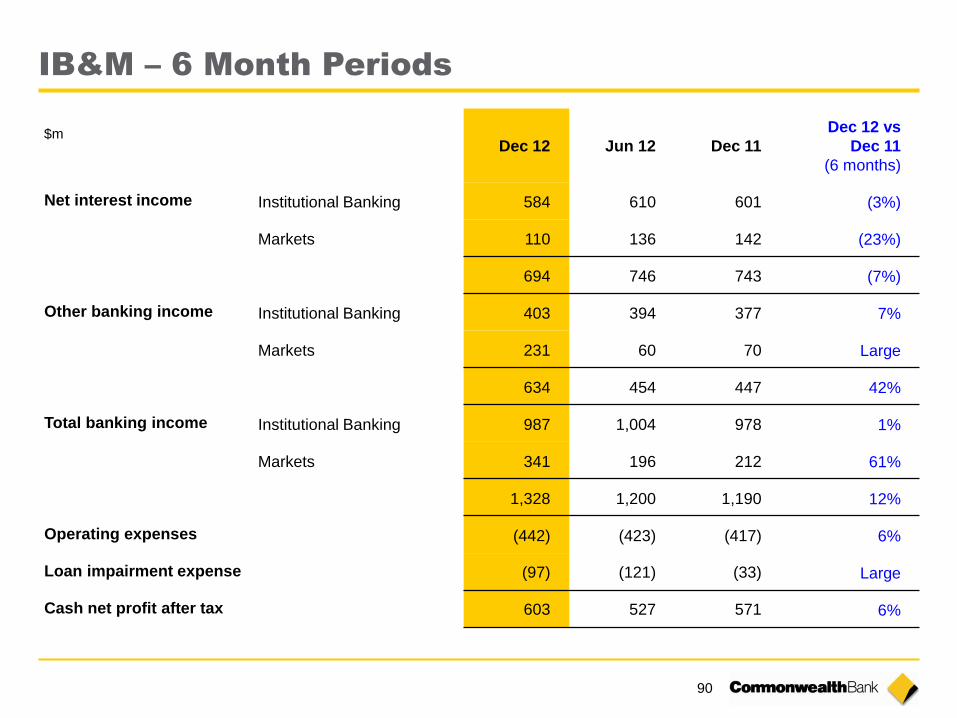
IB&M – 6 Month Periods
Dec 12 Jun 12 Dec 11
Dec 12 vs
Dec 11
(6 months)
Net interest income Institutional Banking 584 610 601 (3%)
Markets 110 136 142 (23%)
694 746 743 (7%)
Other banking income Institutional Banking 403 394 377 7%
Markets 231 60 70 Large
634 454 447 42%
Total banking income Institutional Banking 987 1,004 978 1%
Markets 341 196 212 61%
1,328 1,200 1,190 12%
Operating expenses (442) (423) (417) 6%
Loan impairment expense (97) (121) (33) Large
Cash net profit after tax 603 527 571 6%
$m
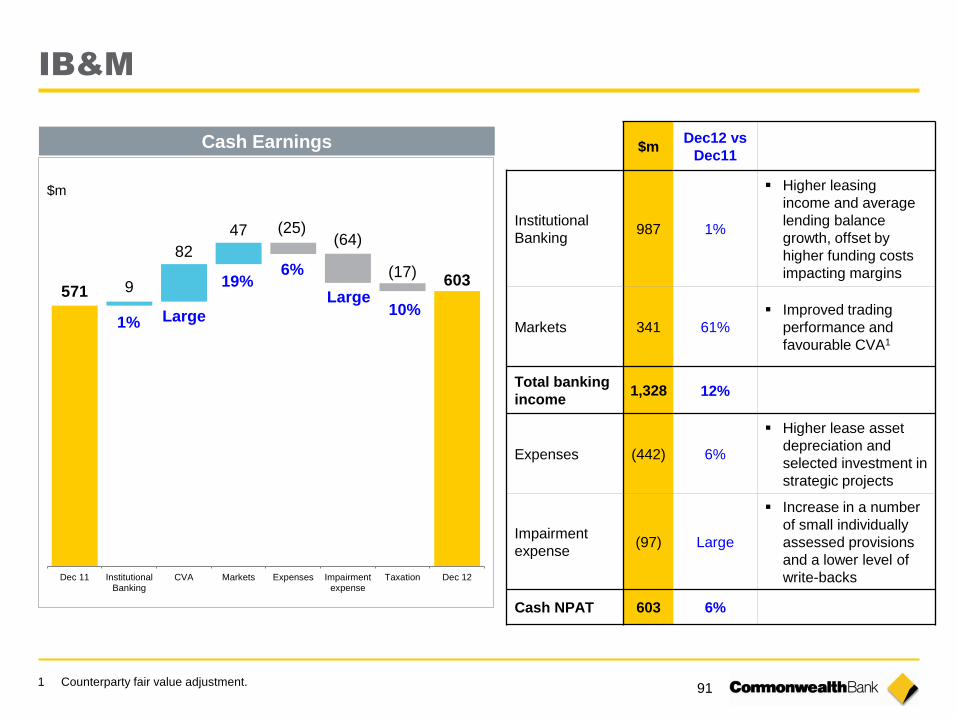
91
IB&M
$m Dec12 vs
Dec11
Institutional
Banking 987 1%
Higher leasing
income and average
lending balance
growth, offset by
higher funding costs
impacting margins
Markets 341 61%
Improved trading
performance and
favourable CVA1
Total banking
income 1,328 12%
Expenses (442) 6%
Higher lease asset
depreciation and
selected investment in
strategic projects
Impairment
expense (97) Large
Increase in a number
of small individually
assessed provisions
and a lower level of
write-backs
Cash NPAT 603 6%
1 Counterparty fair value adjustment.
Cash Earnings
$m
571 603 9
82
47 (25) (64)
(17)
Dec 11 InstitutionalBanking
CVA Markets Expenses Impairmentexpense
Taxation Dec 12
1% Large
19% 6%
Large 10%
92
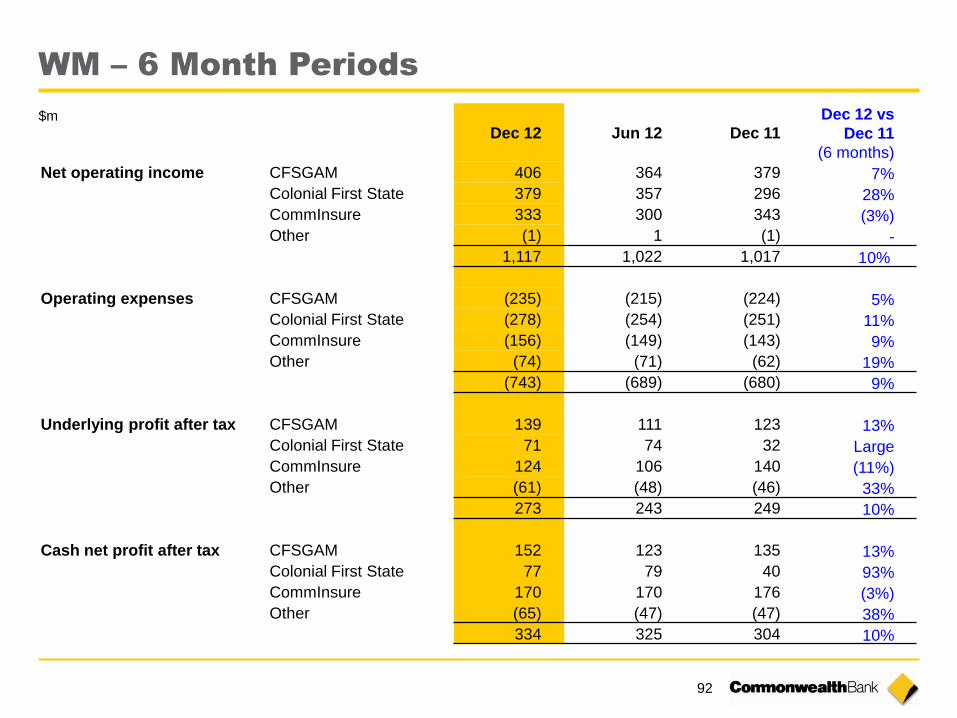
WM – 6 Month Periods
Dec 12 Jun 12 Dec 11
Dec 12 vs
Dec 11
(6 months)
Net operating income CFSGAM 406 364 379 7%
Colonial First State 379 357 296 28%
CommInsure 333 300 343 (3%)
Other (1) 1 (1) -
1,117 1,022 1,017 10%
Operating expenses CFSGAM (235) (215) (224) 5%
Colonial First State (278) (254) (251) 11%
CommInsure (156) (149) (143) 9%
Other (74) (71) (62) 19%
(743) (689) (680) 9%
Underlying profit after tax CFSGAM 139 111 123 13%
Colonial First State 71 74 32 Large
CommInsure 124 106 140 (11%)
Other (61) (48) (46) 33%
273 243 249 10%
Cash net profit after tax CFSGAM 152 123 135 13%
Colonial First State 77 79 40 93%
CommInsure 170 170 176 (3%)
Other (65) (47) (47) 38%
334 325 304 10%
$m
93
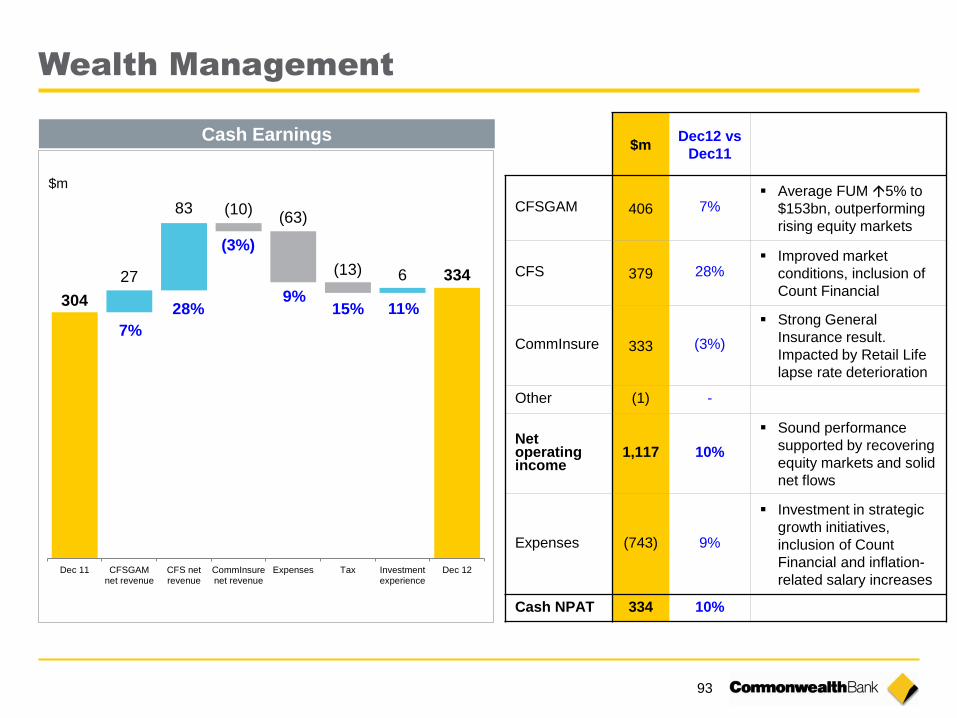
Wealth Management
$m
$m Dec12 vs
Dec11
CFSGAM 406 7% Average FUM 5% to
$153bn, outperforming
rising equity markets
CFS 379 28% Improved market
conditions, inclusion of
Count Financial
CommInsure 333 (3%)
Strong General
Insurance result.
Impacted by Retail Life
lapse rate deterioration
Other (1) -
Net operating income
1,117 10%
Sound performance
supported by recovering
equity markets and solid
net flows
Expenses (743) 9%
Investment in strategic
growth initiatives,
inclusion of Count
Financial and inflation-
related salary increases
Cash NPAT 334 10%
Cash Earnings
1H12 1H13
304
334 27
83 (10) (63)
(13) 6
Dec 11 CFSGAMnet revenue
CFS netrevenue
CommInsurenet revenue
Expenses Tax Investmentexperience
Dec 12
7%
28%
(3%)
9% 15% 11%
94
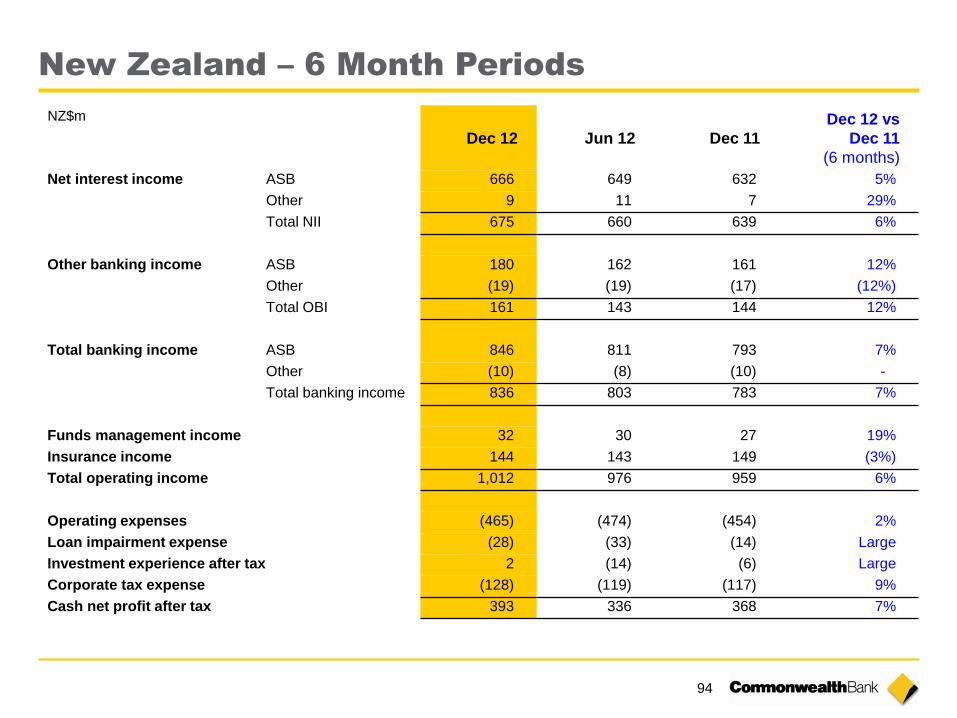
New Zealand – 6 Month Periods
Dec 12 Jun 12 Dec 11
Dec 12 vs
Dec 11
(6 months)
Net interest income ASB 666 649 632 5%
Other 9 11 7 29%
Total NII 675 660 639 6%
Other banking income ASB 180 162 161 12%
Other (19) (19) (17) (12%)
Total OBI 161 143 144 12%
Total banking income ASB 846 811 793 7%
Other (10) (8) (10) -
Total banking income 836 803 783 7%
Funds management income 32 30 27 19%
Insurance income 144 143 149 (3%)
Total operating income 1,012 976 959 6%
Operating expenses (465) (474) (454) 2%
Loan impairment expense (28) (33) (14) Large
Investment experience after tax 2 (14) (6) Large
Corporate tax expense (128) (119) (117) 9%
Cash net profit after tax 393 336 368 7%
NZ$m
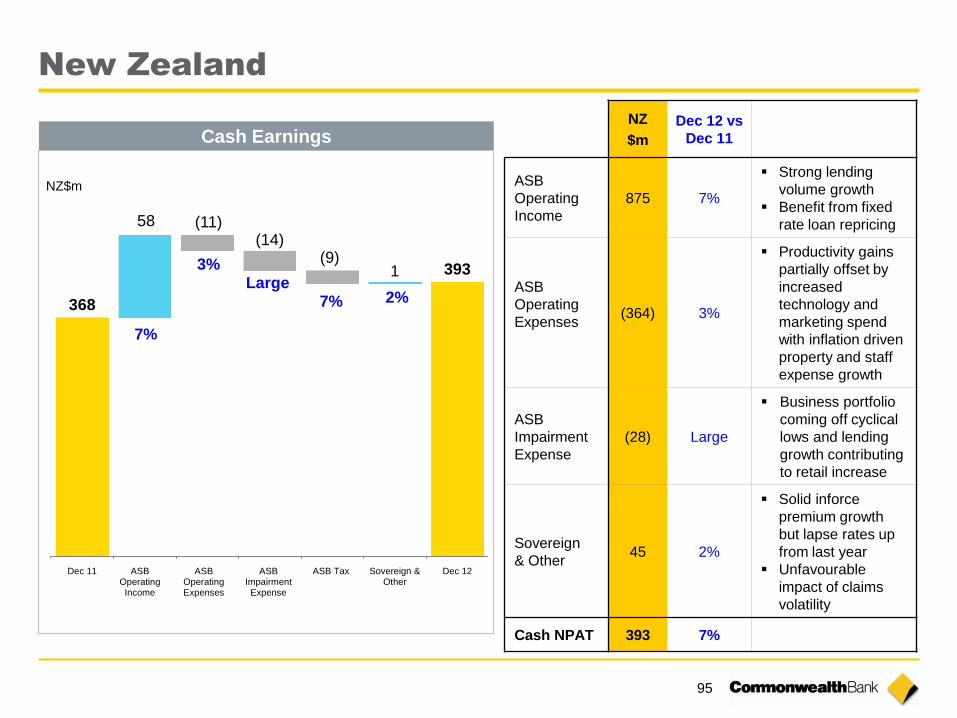
95
New Zealand
368
393
58 (11) (14)
(9) 1
Dec 11 ASBOperatingIncome
ASBOperatingExpenses
ASBImpairmentExpense
ASB Tax Sovereign &Other
Dec 12
2%
7%
7% Large
3%
NZ$m
NZ
$m
Dec 12 vs
Dec 11
ASB
Operating
Income
875 7%
Strong lending
volume growth
Benefit from fixed
rate loan repricing
ASB
Operating
Expenses
(364) 3%
Productivity gains
partially offset by
increased
technology and
marketing spend
with inflation driven
property and staff
expense growth
ASB
Impairment
Expense
(28) Large
Business portfolio
coming off cyclical
lows and lending
growth contributing
to retail increase
Sovereign
& Other 45 2%
Solid inforce
premium growth
but lapse rates up
from last year
Unfavourable
impact of claims
volatility
Cash NPAT 393 7%
Cash Earnings

96
Bankwest – 6 Month Periods
Dec 12 Jun 12 Dec 11
Dec 12 vs
Dec 11
(6 months)
Net interest income 761 707 755 1%
Other banking income 110 100 101 9%
Total banking income 871 807 856 2%
Operating expenses (416) (420) (428) (3%)
Loan impairment expense (86) (23) (38) Large
Net profit before tax 369 364 390 (5%)
Corporate tax expense (111) (110) (117) (5%)
Cash net profit after tax 258 254 273 (5%)
$m
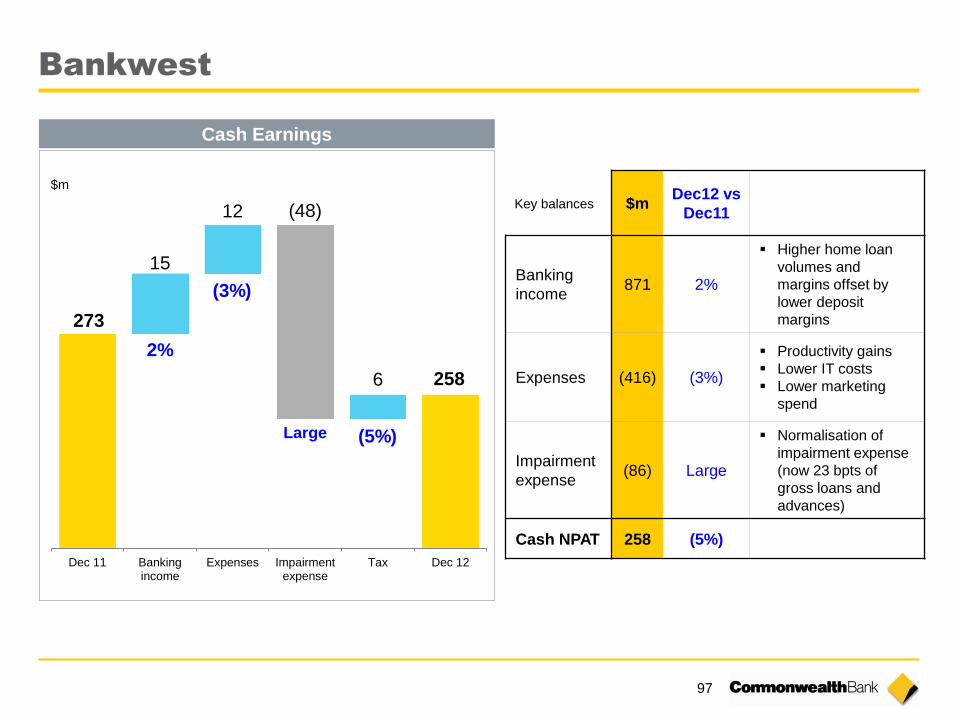
97
273
258
15
12 (48)
6
Dec 11 Bankingincome
Expenses Impairmentexpense
Tax Dec 12
Bankwest
2%
Large (5%)
$m
$m Dec12 vs
Dec11
Banking
income 871 2%
Higher home loan
volumes and
margins offset by
lower deposit
margins
Expenses (416) (3%)
Productivity gains
Lower IT costs
Lower marketing
spend
Impairment
expense (86) Large
Normalisation of
impairment expense
(now 23 bpts of
gross loans and
advances)
Cash NPAT 258 (5%)
(3%)
Cash Earnings
Key balances
Index
Strategy 57
Business Performance 80
Risk and Credit Quality 98
Capital, Funding & Liquidity 111
Economic Indicators 125
99
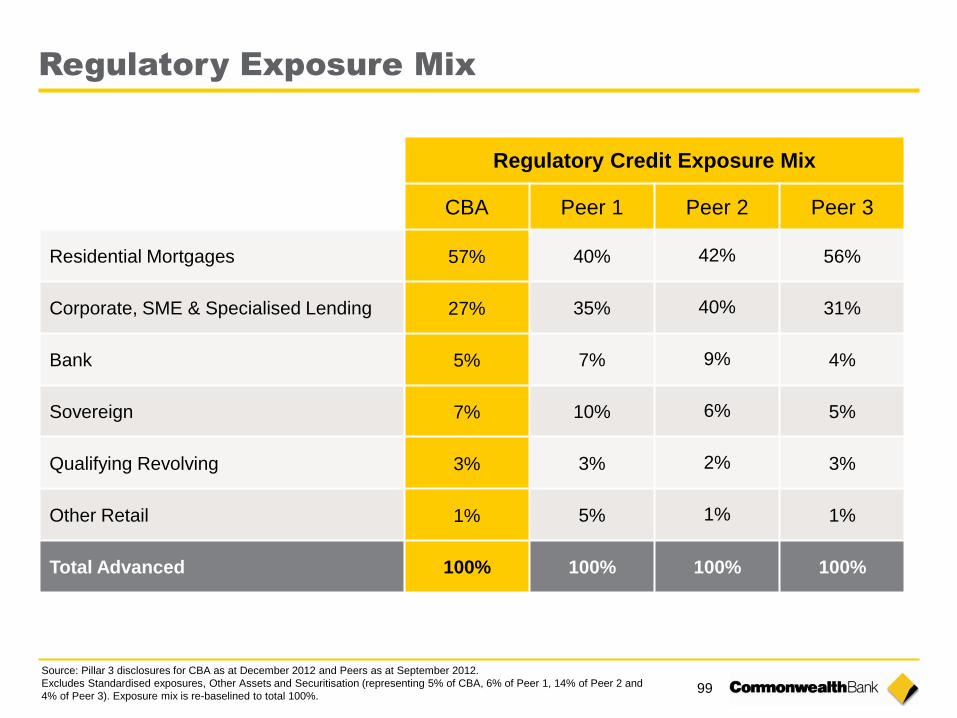
Regulatory Exposure Mix
Regulatory Credit Exposure Mix
CBA Peer 1 Peer 2 Peer 3
Residential Mortgages 57% 40% 42% 56%
Corporate, SME & Specialised Lending 27% 35% 40% 31%
Bank 5% 7% 9% 4%
Sovereign 7% 10% 6% 5%
Qualifying Revolving 3% 3% 2% 3%
Other Retail 1% 5% 1% 1%
Total Advanced 100% 100% 100% 100%
Source: Pillar 3 disclosures for CBA as at December 2012 and Peers as at September 2012.
Excludes Standardised exposures, Other Assets and Securitisation (representing 5% of CBA, 6% of Peer 1, 14% of Peer 2 and
4% of Peer 3). Exposure mix is re-baselined to total 100%.
100
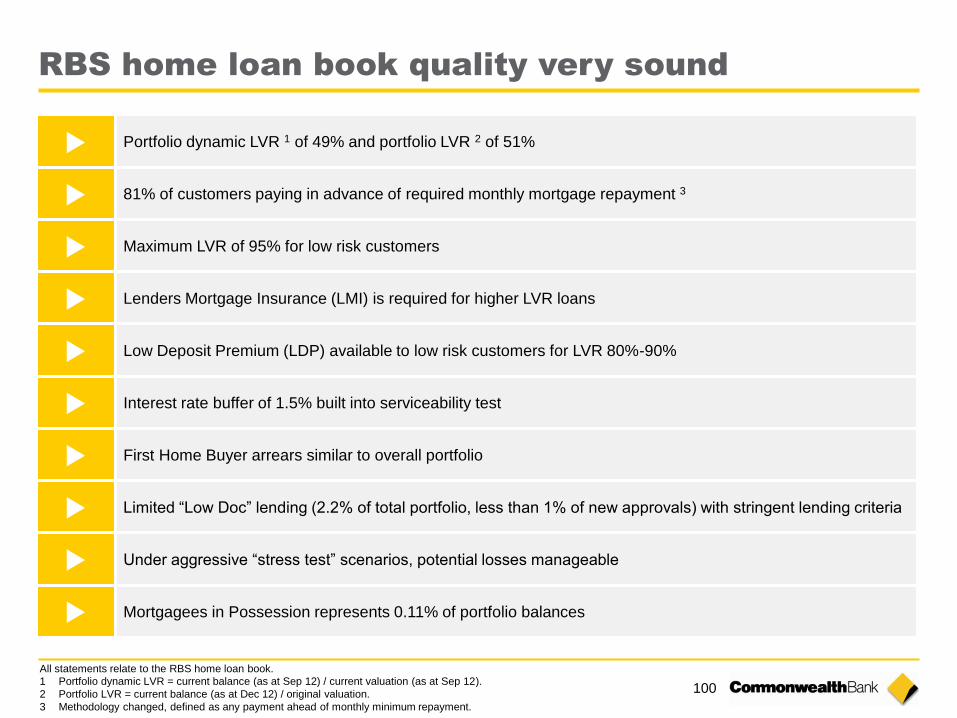
RBS home loan book quality very sound
Portfolio dynamic LVR 1 of 49% and portfolio LVR 2 of 51%
81% of customers paying in advance of required monthly mortgage repayment 3
Maximum LVR of 95% for low risk customers
Lenders Mortgage Insurance (LMI) is required for higher LVR loans
Low Deposit Premium (LDP) available to low risk customers for LVR 80%-90%
Interest rate buffer of 1.5% built into serviceability test
First Home Buyer arrears similar to overall portfolio
Limited “Low Doc” lending (2.2% of total portfolio, less than 1% of new approvals) with stringent lending criteria
Under aggressive “stress test” scenarios, potential losses manageable
Mortgagees in Possession represents 0.11% of portfolio balances
All statements relate to the RBS home loan book.
1 Portfolio dynamic LVR = current balance (as at Sep 12) / current valuation (as at Sep 12).
2 Portfolio LVR = current balance (as at Dec 12) / original valuation.
3 Methodology changed, defined as any payment ahead of monthly minimum repayment.
101
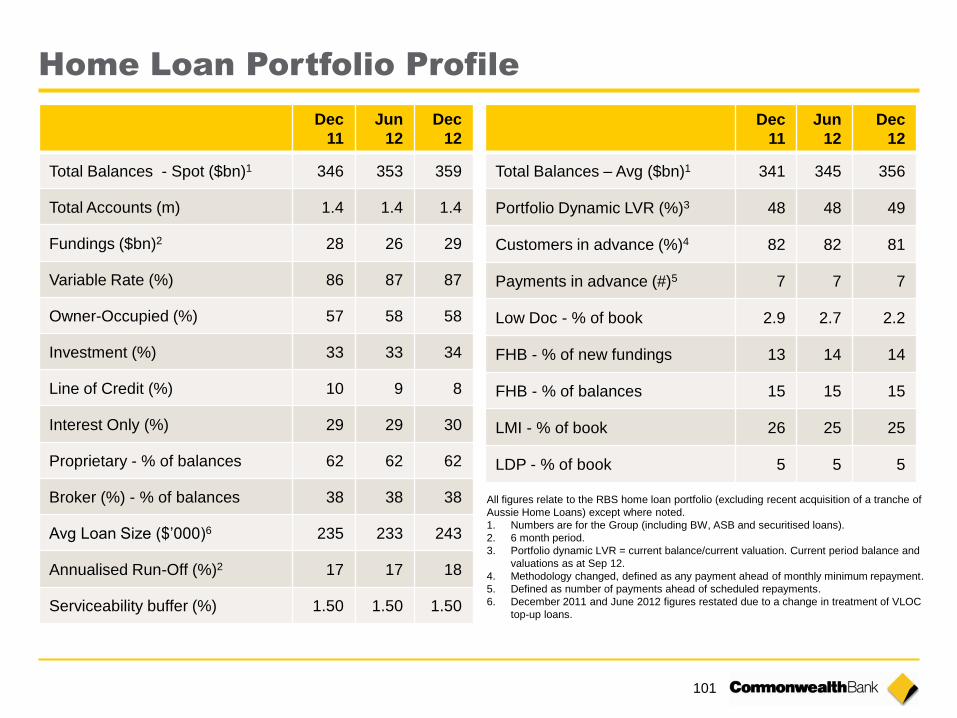
Home Loan Portfolio Profile
Dec
11
Jun
12
Dec
12
Total Balances - Spot ($bn)1 346 353 359
Total Accounts (m) 1.4 1.4 1.4
Fundings ($bn)2 28 26 29
Variable Rate (%) 86 87 87
Owner-Occupied (%) 57 58 58
Investment (%) 33 33 34
Line of Credit (%) 10 9 8
Interest Only (%) 29 29 30
Proprietary - % of balances 62 62 62
Broker (%) - % of balances 38 38 38
Avg Loan Size ($’000)6 235 233 243
Annualised Run-Off (%)2 17 17 18
Serviceability buffer (%) 1.50 1.50 1.50
Dec
11
Jun
12
Dec
12
Total Balances – Avg ($bn)1 341 345 356
Portfolio Dynamic LVR (%)3 48 48 49
Customers in advance (%)4 82 82 81
Payments in advance (#)5 7 7 7
Low Doc - % of book 2.9 2.7 2.2
FHB - % of new fundings 13 14 14
FHB - % of balances 15 15 15
LMI - % of book 26 25 25
LDP - % of book 5 5 5
All figures relate to the RBS home loan portfolio (excluding recent acquisition of a tranche of
Aussie Home Loans) except where noted.
1. Numbers are for the Group (including BW, ASB and securitised loans).
2. 6 month period.
3. Portfolio dynamic LVR = current balance/current valuation. Current period balance and
valuations as at Sep 12.
4. Methodology changed, defined as any payment ahead of monthly minimum repayment.
5. Defined as number of payments ahead of scheduled repayments.
6. December 2011 and June 2012 figures restated due to a change in treatment of VLOC
top-up loans.
102
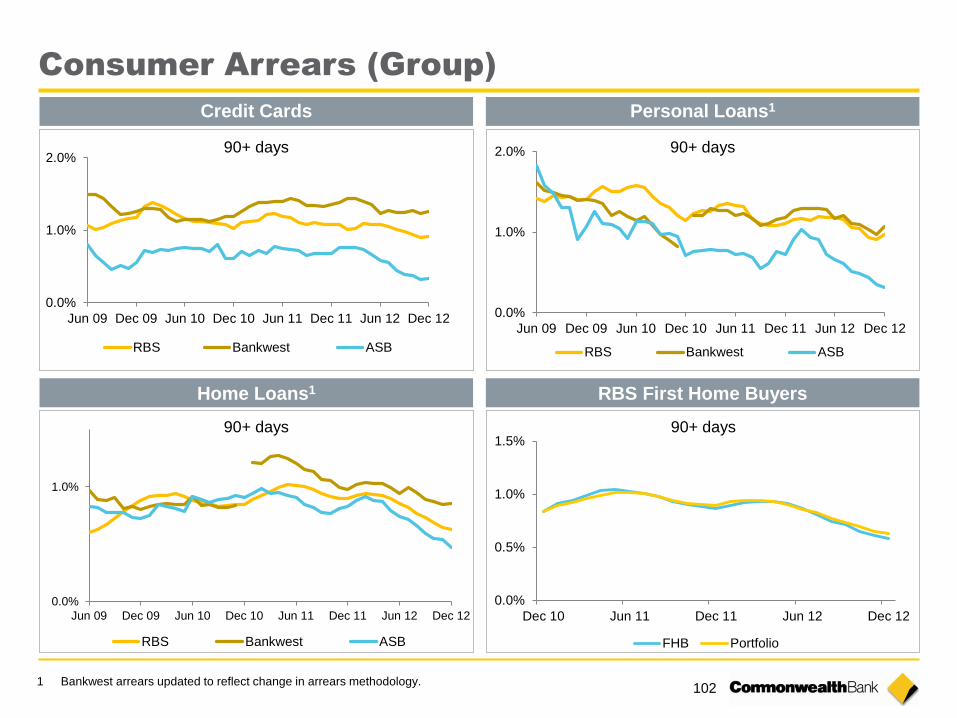
Consumer Arrears (Group)
Credit Cards
Home Loans1
Personal Loans1
0.0%
1.0%
2.0%
Jun 09 Dec 09 Jun 10 Dec 10 Jun 11 Dec 11 Jun 12 Dec 12
RBS Bankwest ASB
0.0%
1.0%
Jun 09 Dec 09 Jun 10 Dec 10 Jun 11 Dec 11 Jun 12 Dec 12
RBS Bankwest ASB
1 Bankwest arrears updated to reflect change in arrears methodology.
RBS First Home Buyers
0.0%
0.5%
1.0%
1.5%
Dec 10 Jun 11 Dec 11 Jun 12 Dec 12
FHB Portfolio
0.0%
1.0%
2.0%
Jun 09 Dec 09 Jun 10 Dec 10 Jun 11 Dec 11 Jun 12 Dec 12
RBS Bankwest ASB
90+ days
90+ days
90+ days
90+ days
103
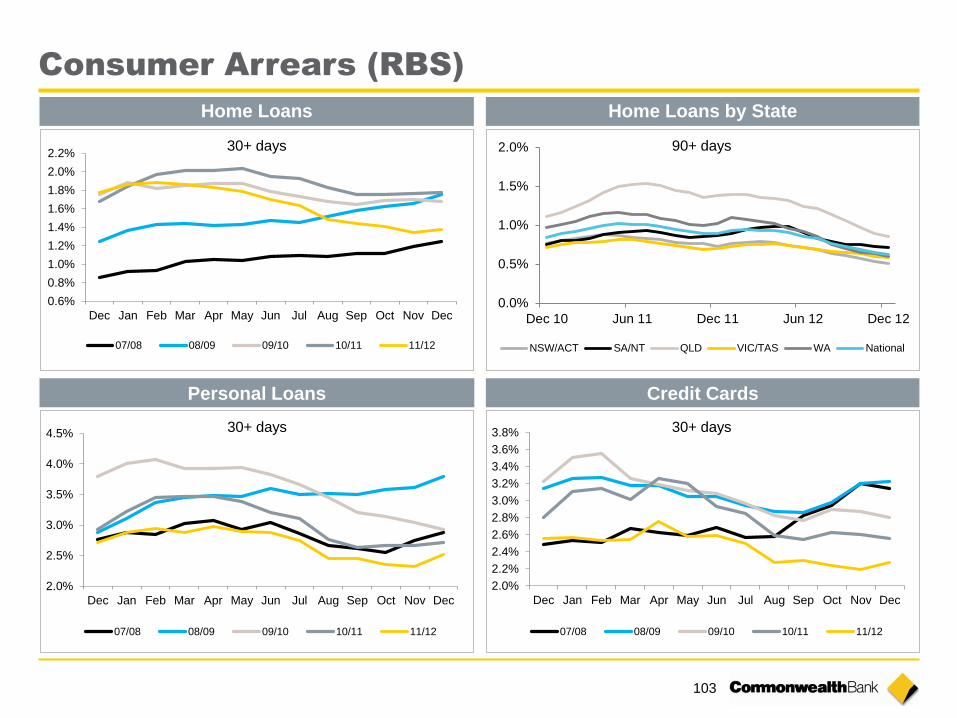
Consumer Arrears (RBS)
2.0%
2.2%
2.4%
2.6%
2.8%
3.0%
3.2%
3.4%
3.6%
3.8%
Dec Jan Feb Mar Apr May Jun Jul Aug Sep Oct Nov Dec
07/08 08/09 09/10 10/11 11/12
2.0%
2.5%
3.0%
3.5%
4.0%
4.5%
Dec Jan Feb Mar Apr May Jun Jul Aug Sep Oct Nov Dec
07/08 08/09 09/10 10/11 11/12
30+ days 30+ days
Home Loans
Personal Loans Credit Cards
0.6%
0.8%
1.0%
1.2%
1.4%
1.6%
1.8%
2.0%
2.2%
Dec Jan Feb Mar Apr May Jun Jul Aug Sep Oct Nov Dec
07/08 08/09 09/10 10/11 11/12
Home Loans by State
30+ days 90+ days
0.0%
0.5%
1.0%
1.5%
2.0%
Dec 10 Jun 11 Dec 11 Jun 12 Dec 12
NSW/ACT SA/NT QLD VIC/TAS WA National
104
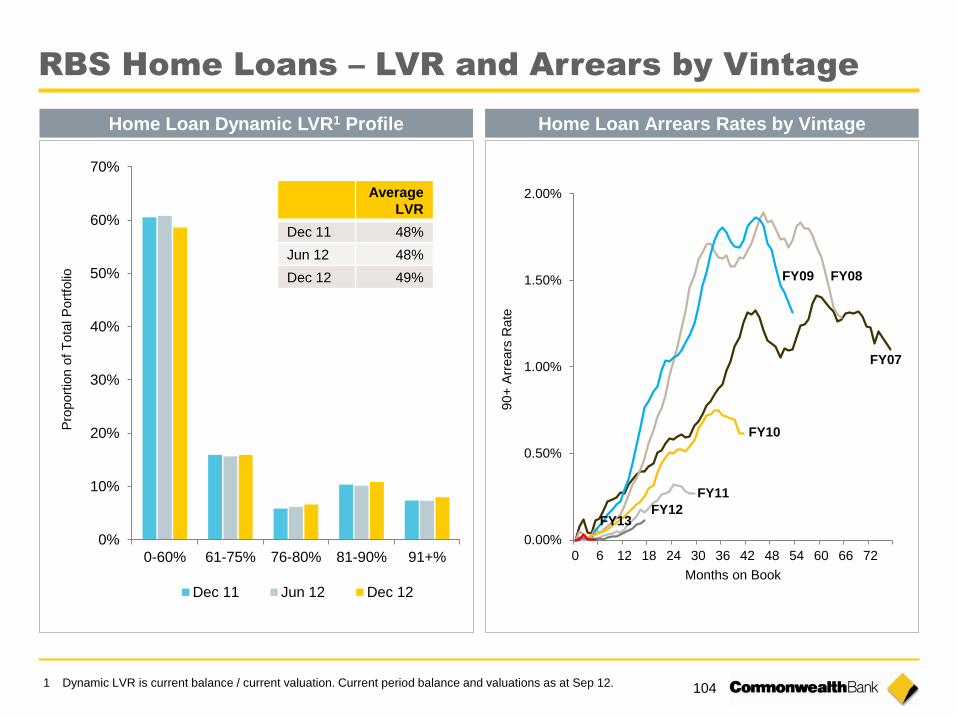
RBS Home Loans – LVR and Arrears by Vintage
Home Loan Dynamic LVR1 Profile
0%
10%
20%
30%
40%
50%
60%
70%
0-60% 61-75% 76-80% 81-90% 91+%
Pro
port
ion o
f T
ota
l P
ort
folio
Dec 11 Jun 12 Dec 12
Home Loan Arrears Rates by Vintage
0.00%
0.50%
1.00%
1.50%
2.00%
0 6 12 18 24 30 36 42 48 54 60 66 72
90+
Arr
ears
Rate
Months on Book
FY09 FY08
FY07
FY13
FY10
FY11
FY12
1 Dynamic LVR is current balance / current valuation. Current period balance and valuations as at Sep 12.
Average
LVR
Dec 11 48%
Jun 12 48%
Dec 12 49%
105
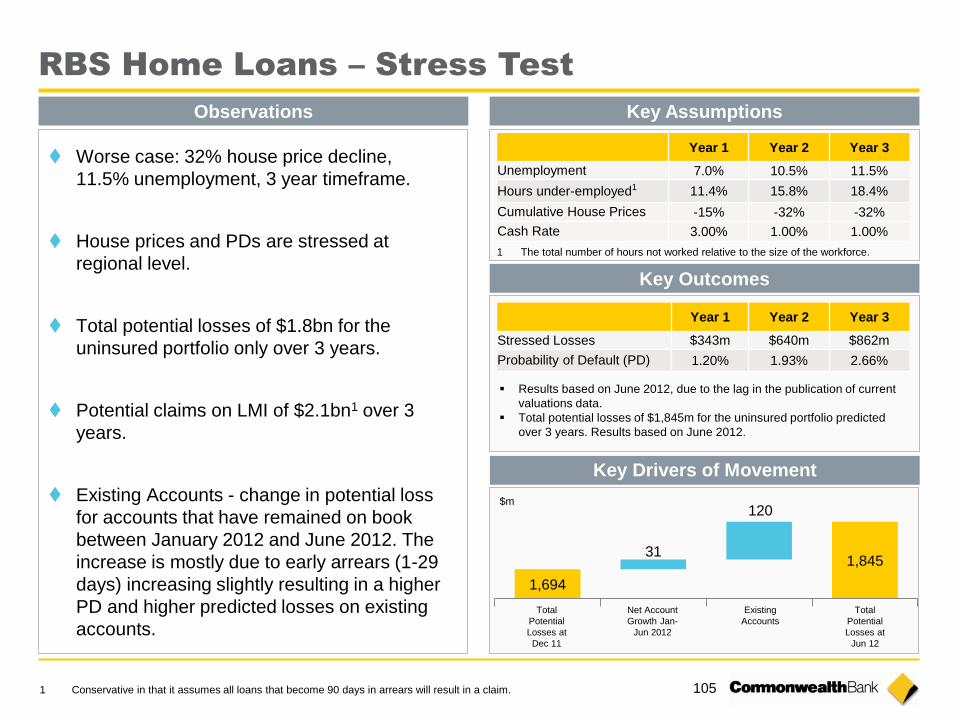
RBS Home Loans – Stress Test
1 The total number of hours not worked relative to the size of the workforce.
Results based on June 2012, due to the lag in the publication of current
valuations data.
Total potential losses of $1,845m for the uninsured portfolio predicted
over 3 years. Results based on June 2012.
Observations Key Assumptions
Key Outcomes
1 Conservative in that it assumes all loans that become 90 days in arrears will result in a claim.
Year 1 Year 2 Year 3
Unemployment 7.0% 10.5% 11.5%
Hours under-employed1 11.4% 15.8% 18.4%
Cumulative House Prices -15% -32% -32%
Cash Rate 3.00% 1.00% 1.00%
Year 1 Year 2 Year 3
Stressed Losses $343m $640m $862m
Probability of Default (PD) 1.20% 1.93% 2.66%
Key Drivers of Movement
1,694
1,845 31
120
Net Account
Growth Jan-
Jun 2012
Existing
Accounts
Total
Potential
Losses at
Jun 12
$m
Total
Potential
Losses at
Dec 11
Worse case: 32% house price decline,
11.5% unemployment, 3 year timeframe.
House prices and PDs are stressed at
regional level.
Total potential losses of $1.8bn for the
uninsured portfolio only over 3 years.
Potential claims on LMI of $2.1bn1 over 3
years.
Existing Accounts - change in potential loss
for accounts that have remained on book
between January 2012 and June 2012. The
increase is mostly due to early arrears (1-29
days) increasing slightly resulting in a higher
PD and higher predicted losses on existing
accounts.

106
Credit Exposure by Industry 1
Jun 12 Dec 12
Consumer 52.8% 53.4%
Agriculture 2.1% 2.1%
Mining 1.0% 1.3%
Manufacturing 2.1% 1.9%
Energy 1.1% 1.0%
Construction 0.9% 0.9%
Retail & Wholesale 2.4% 2.5%
Transport 1.5% 1.6%
Banks 11.1% 10.4%
Finance – other 3.5% 3.4%
Business Services 1.0% 1.0%
Property 6.5% 6.7%
Sovereign 7.5% 7.4%
Health & Community 0.7% 0.8%
Culture & Recreation 1.0% 0.9%
Other 4.8% 4.7%
Total 100% 100%
Australia 80.0%
New Zealand 8.4%
Europe 4.7%
Other International 6.9%
Jun 12 Dec 12
1 Total committed credit exposure (TCE) = balance for uncommitted facilities or greater of limit or balance for committed facilities.
Calculated before collateralisation. Includes ASB and Bankwest. Excludes settlement risk.
Australia 79.7%
New Zealand 8.1%
Europe 5.2%
Other International 7.0%
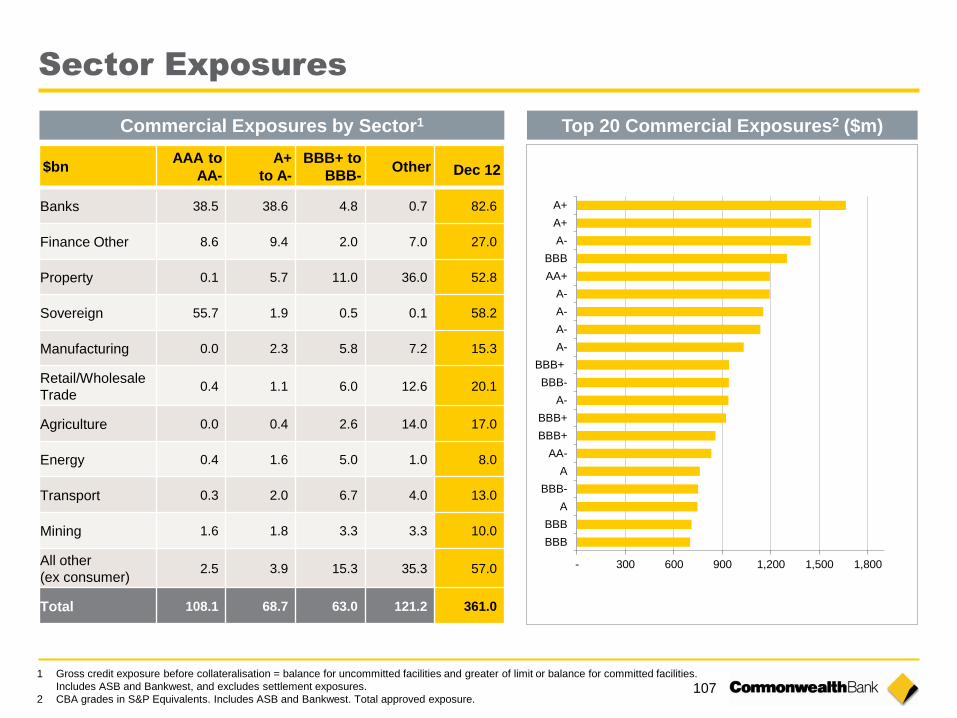
107
Sector Exposures
Commercial Exposures by Sector1 Top 20 Commercial Exposures2 ($m)
$bn AAA to
AA-
A+
to A-
BBB+ to
BBB- Other Dec 12
Banks 38.5 38.6 4.8 0.7 82.6
Finance Other 8.6 9.4 2.0 7.0 27.0
Property 0.1 5.7 11.0 36.0 52.8
Sovereign 55.7 1.9 0.5 0.1 58.2
Manufacturing 0.0 2.3 5.8 7.2 15.3
Retail/Wholesale
Trade 0.4 1.1 6.0 12.6 20.1
Agriculture 0.0 0.4 2.6 14.0 17.0
Energy 0.4 1.6 5.0 1.0 8.0
Transport 0.3 2.0 6.7 4.0 13.0
Mining 1.6 1.8 3.3 3.3 10.0
All other
(ex consumer) 2.5 3.9 15.3 35.3 57.0
Total 108.1 68.7 63.0 121.2 361.0
- 300 600 900 1,200 1,500 1,800
A+
A+
A-
BBB
AA+
A-
A-
A-
A-
BBB+
BBB-
A-
BBB+
BBB+
AA-
A
BBB-
A
BBB
BBB
1 Gross credit exposure before collateralisation = balance for uncommitted facilities and greater of limit or balance for committed facilities.
Includes ASB and Bankwest, and excludes settlement exposures.
2 CBA grades in S&P Equivalents. Includes ASB and Bankwest. Total approved exposure.
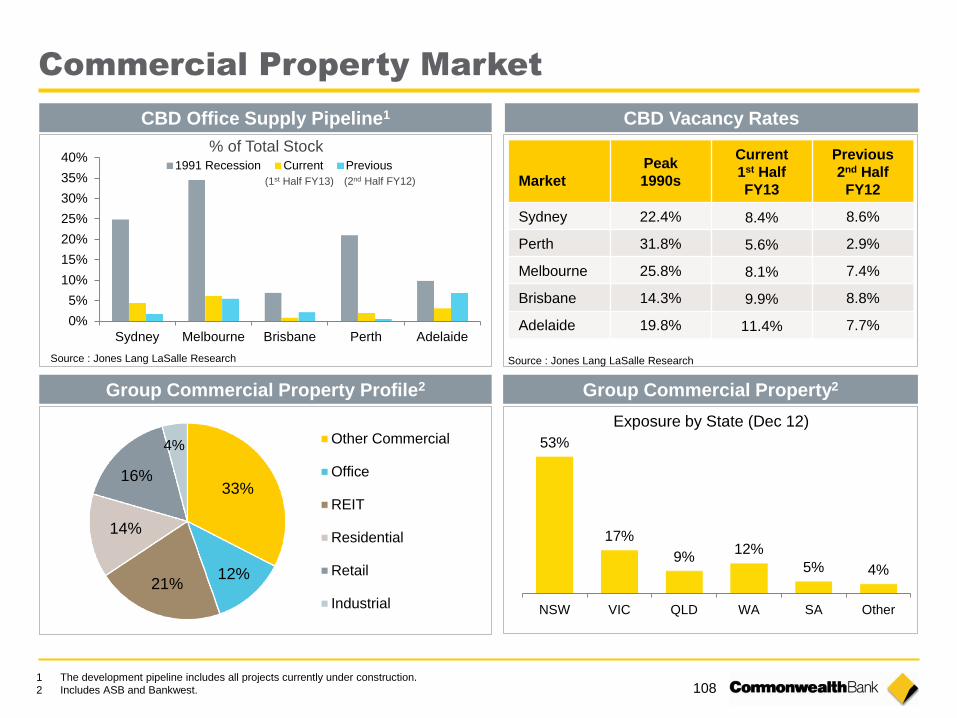
108
Commercial Property Market
53%
17%
9% 12%
5% 4%
NSW VIC QLD WA SA Other
0%
5%
10%
15%
20%
25%
30%
35%
40%
Sydney Melbourne Brisbane Perth Adelaide
1991 Recession Current Previous
Source : Jones Lang LaSalle Research
% of Total Stock
Exposure by State (Dec 12)
1 The development pipeline includes all projects currently under construction.
2 Includes ASB and Bankwest.
(2nd Half FY12) (1st Half FY13)
CBD Office Supply Pipeline1 CBD Vacancy Rates
Group Commercial Property2
33%
12% 21%
14%
16%
4% Other Commercial
Office
REIT
Residential
Retail
Industrial
Group Commercial Property Profile2
Source : Jones Lang LaSalle Research
Market
Peak
1990s
Current
1st Half
FY13
Previous
2nd Half
FY12
Sydney 22.4% 8.4% 8.6%
Perth 31.8% 5.6% 2.9%
Melbourne 25.8% 8.1% 7.4%
Brisbane 14.3% 9.9% 8.8%
Adelaide 19.8% 11.4% 7.7%
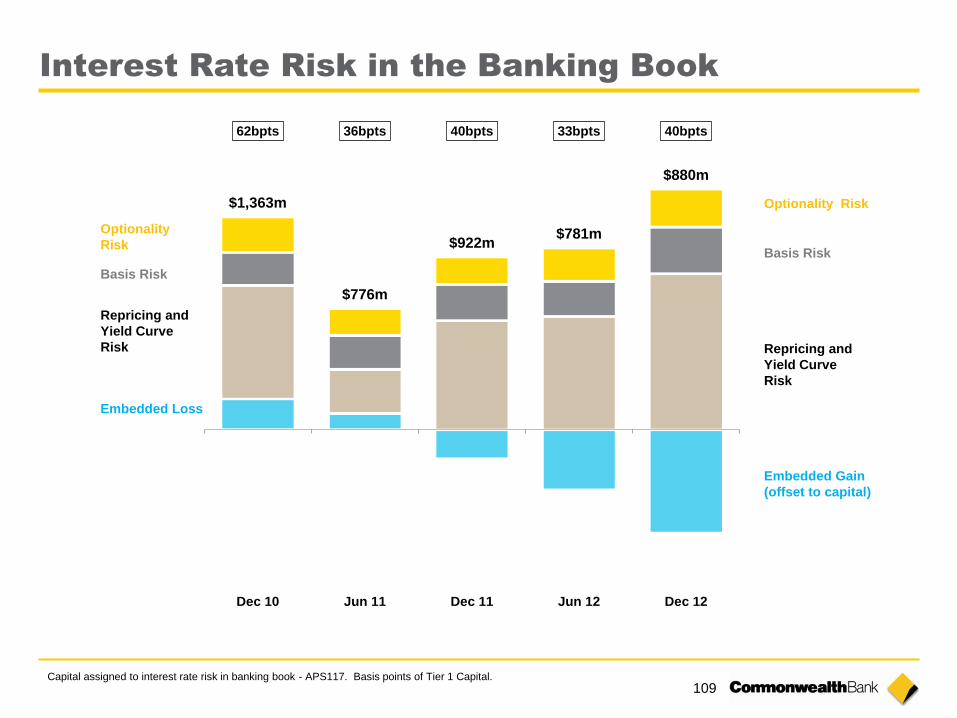
109
Interest Rate Risk in the Banking Book
Capital assigned to interest rate risk in banking book - APS117. Basis points of Tier 1 Capital.
$1,363m
$776m
$922m $781m
$880m
62bpts 36bpts 40bpts 33bpts 40bpts 0
20
40
60
80
100
120 -1,000
-500
-
500
1,000
1,500
2,000
Dec 10 Jun 11 Dec 11 Jun 12 Dec 12
Repricing and
Yield Curve
Risk
Basis Risk
Optionality
Risk
Embedded Loss
Repricing and
Yield Curve
Risk
Basis Risk
Optionality Risk
Embedded Gain
(offset to capital)
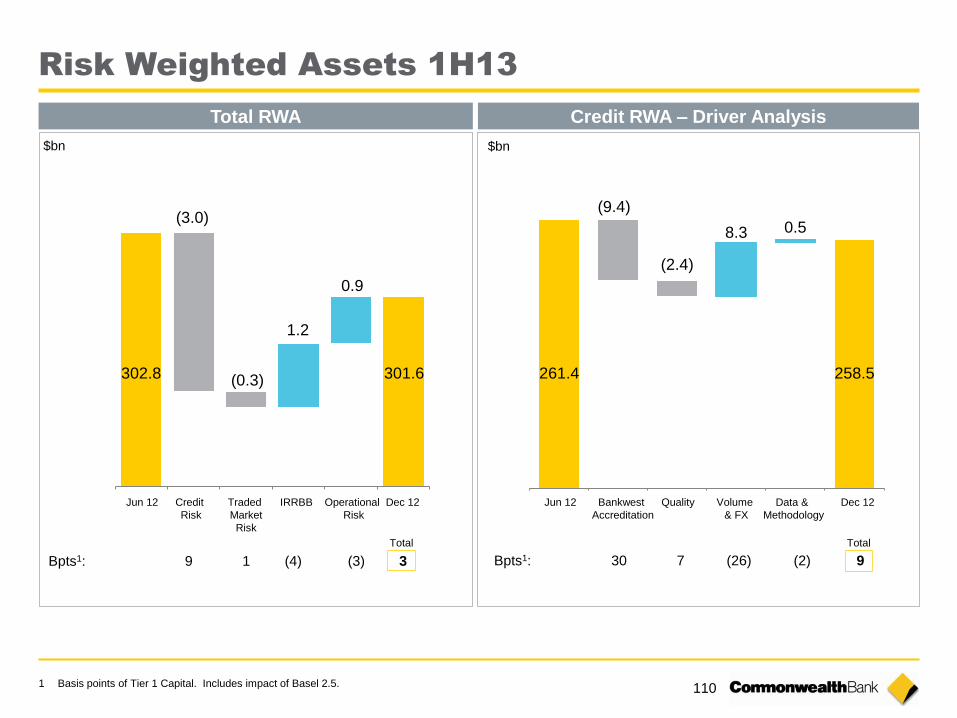
110
Risk Weighted Assets 1H13
1 Basis points of Tier 1 Capital. Includes impact of Basel 2.5.
Total RWA
(3.0)
(0.3)
1.2
0.9
Credit RWA – Driver Analysis
8.3 0.5
(9.4)
(2.4)
Bpts1: 9 1 (4) (3) 3
Total Total
$bn $bn
Jun 12 Credit
Risk
Traded
Market
Risk
IRRBB Operational
Risk
Dec 12 Jun 12 Bankwest
Accreditation
Quality Volume
& FX
Data &
Methodology
Dec 12
Bpts1: 30 7 (26) (2) 9
302.8 301.6 261.4 258.5
Index
Strategy 57
Business Performance 80
Risk and Credit Quality 98
Capital, Funding & Liquidity 111
Economic Indicators 125
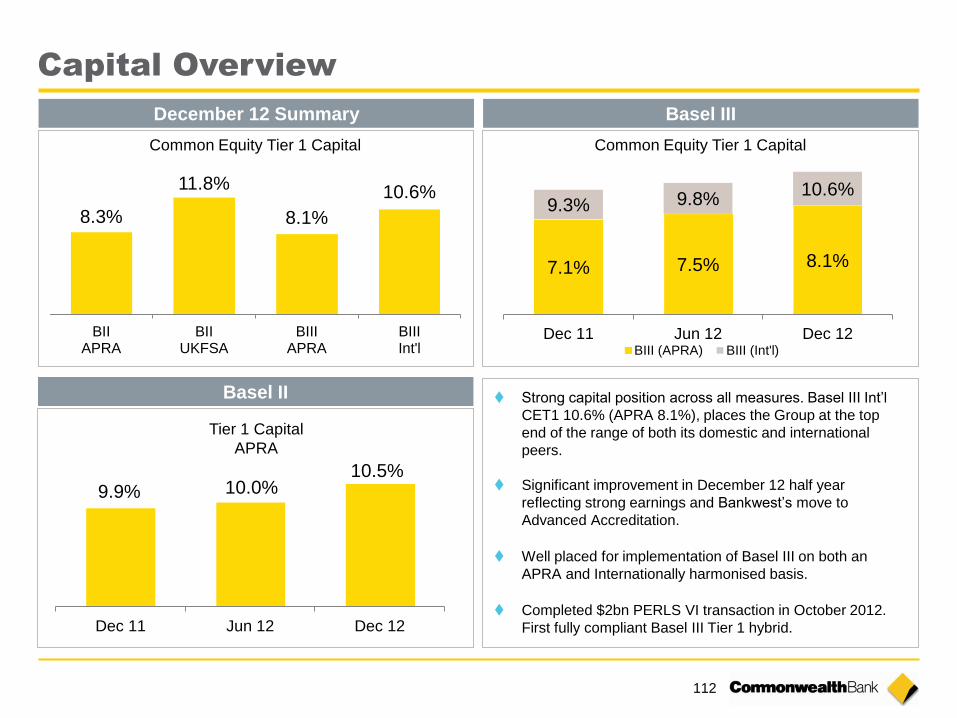
112
Basel II
Tier 1 Capital
APRA
9.9% 10.0% 10.5%
Dec 11 Jun 12 Dec 12
December 12 Summary
8.3%
11.8%
8.1%
10.6%
BIIAPRA
BIIUKFSA
BIIIAPRA
BIIIInt'l
Common Equity Tier 1 Capital
Basel III
Common Equity Tier 1 Capital
7.1% 7.5% 8.1%
9.3% 9.8% 10.6%
Dec 11 Jun 12 Dec 12BIII (APRA) BIII (Int'l)
Capital Overview
Strong capital position across all measures. Basel III Int’l
CET1 10.6% (APRA 8.1%), places the Group at the top
end of the range of both its domestic and international
peers.
Significant improvement in December 12 half year
reflecting strong earnings and Bankwest’s move to
Advanced Accreditation.
Well placed for implementation of Basel III on both an
APRA and Internationally harmonised basis.
Completed $2bn PERLS VI transaction in October 2012.
First fully compliant Basel III Tier 1 hybrid.
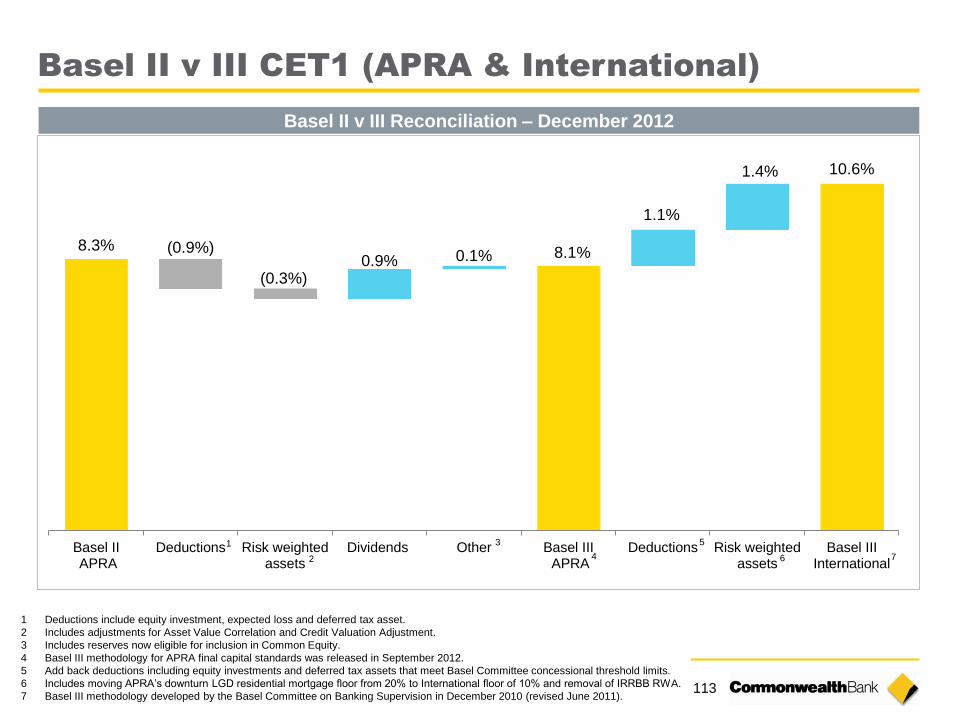
113
8.3% 8.1%
10.6%
0.9% 0.1%
1.1%
1.4%
(0.9%)
(0.3%)
Basel II APRA
Deductions Risk weightedassets
Dividends Other Basel III APRA
Deductions Risk weightedassets
Basel IIIInternational
1 Deductions include equity investment, expected loss and deferred tax asset.
2 Includes adjustments for Asset Value Correlation and Credit Valuation Adjustment.
3 Includes reserves now eligible for inclusion in Common Equity.
4 Basel III methodology for APRA final capital standards was released in September 2012.
5 Add back deductions including equity investments and deferred tax assets that meet Basel Committee concessional threshold limits.
6 Includes moving APRA’s downturn LGD residential mortgage floor from 20% to International floor of 10% and removal of IRRBB RWA.
7 Basel III methodology developed by the Basel Committee on Banking Supervision in December 2010 (revised June 2011).
1
7 2
3
4
5
6
Basel II v III Reconciliation – December 2012
Basel II v III CET1 (APRA & International)

114
7.5% 8.1%
9.8%
10.6% 132
34 11
(77)
(20)
Jun 12 Dividend(net of DRP)
CashEarnings
CreditRWA
BankwestAdvanced
Accreditation
Other Dec 12
APRA International
1
2
3
1 Dividend net of DRP relates to the June 12 half year (declared August 2012). 2 Represent benefit from reduction in Credit RWA. APRA extended the Group’s Advanced Internal Ratings based
accreditation to include Bankwest non retail loans and residential mortgages from 31 December 2012. 3 Other includes favourable movements in AFS reserves and actuarial gains for the defined benefits super fund.
Basel III CET1 (APRA & Int’l) – Dec 2012 Half Year
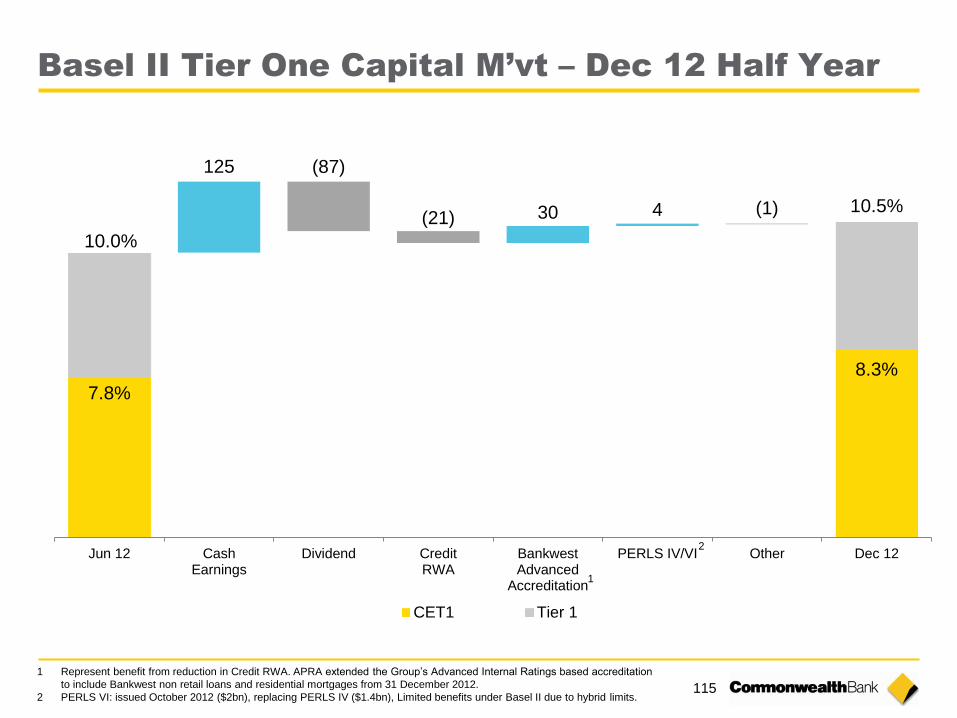
115
7.8%
8.3%
10.0%
10.5%
125
30 4
(87)
(21) (1)
Jun 12 CashEarnings
Dividend CreditRWA
BankwestAdvanced
Accreditation
PERLS IV/VI Other Dec 12
CET1 Tier 1
1 Represent benefit from reduction in Credit RWA. APRA extended the Group’s Advanced Internal Ratings based accreditation
to include Bankwest non retail loans and residential mortgages from 31 December 2012.
2 PERLS VI: issued October 2012 ($2bn), replacing PERLS IV ($1.4bn), Limited benefits under Basel II due to hybrid limits.
1
2
Basel II Tier One Capital M’vt – Dec 12 Half Year
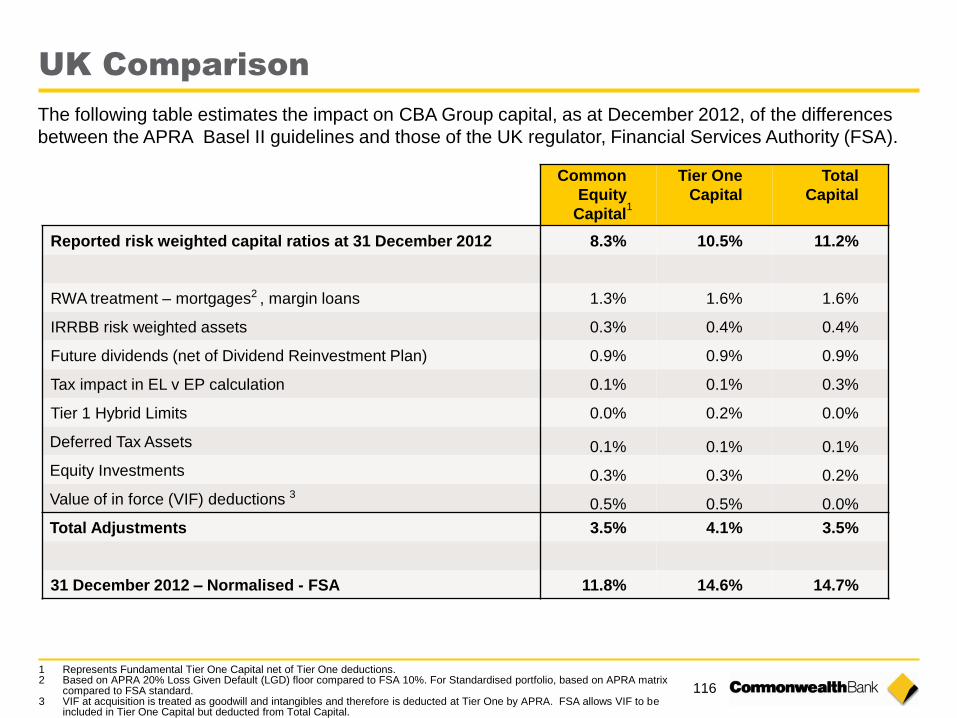
116
UK Comparison
Common
Equity
Capital
Tier One
Capital
Total
Capital
Reported risk weighted capital ratios at 31 December 2012 8.3% 10.5% 11.2%
RWA treatment – mortgages2 , margin loans 1.3% 1.6% 1.6%
IRRBB risk weighted assets 0.3% 0.4% 0.4%
Future dividends (net of Dividend Reinvestment Plan) 0.9% 0.9% 0.9%
Tax impact in EL v EP calculation 0.1% 0.1% 0.3%
Tier 1 Hybrid Limits 0.0% 0.2% 0.0%
Deferred Tax Assets 0.1% 0.1% 0.1%
Equity Investments 0.3% 0.3% 0.2%
Value of in force (VIF) deductions 3 0.5% 0.5% 0.0%
Total Adjustments 3.5% 4.1% 3.5%
31 December 2012 – Normalised - FSA 11.8% 14.6% 14.7%
1
The following table estimates the impact on CBA Group capital, as at December 2012, of the differences
between the APRA Basel II guidelines and those of the UK regulator, Financial Services Authority (FSA).
1 Represents Fundamental Tier One Capital net of Tier One deductions. 2 Based on APRA 20% Loss Given Default (LGD) floor compared to FSA 10%. For Standardised portfolio, based on APRA matrix
compared to FSA standard. 3 VIF at acquisition is treated as goodwill and intangibles and therefore is deducted at Tier One by APRA. FSA allows VIF to be
included in Tier One Capital but deducted from Total Capital.
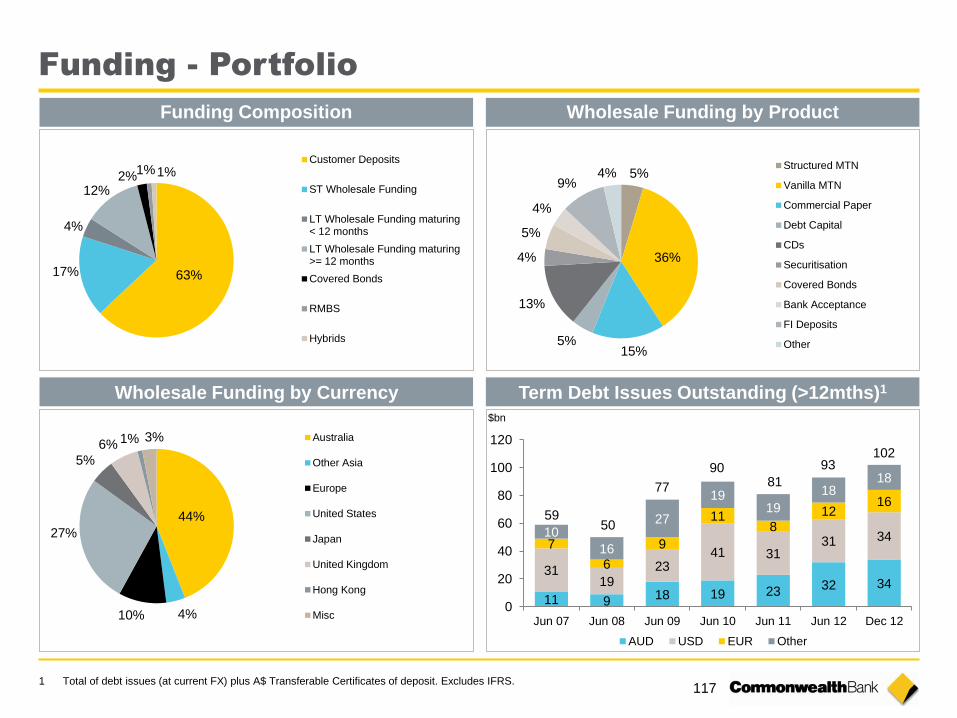
117
Funding - Portfolio
44%
4% 10%
27%
5%
6% 1% 3% Australia
Other Asia
Europe
United States
Japan
United Kingdom
Hong Kong
Misc
5%
36%
15% 5%
13%
4%
5%
4%
9% 4%
Structured MTN
Vanilla MTN
Commercial Paper
Debt Capital
CDs
Securitisation
Covered Bonds
Bank Acceptance
FI Deposits
Other
63% 17%
4%
12% 2%
1% 1% Customer Deposits
ST Wholesale Funding
LT Wholesale Funding maturing< 12 months
LT Wholesale Funding maturing>= 12 months
Covered Bonds
RMBS
Hybrids
Funding Composition
Wholesale Funding by Currency
Wholesale Funding by Product
11 9 18 19 23
32 34 31
19 23
41 31 31 34
7
6
9
11 8
12 16
10
16
27
19 19
18 18
0
20
40
60
80
100
120
Jun 07 Jun 08 Jun 09 Jun 10 Jun 11 Jun 12 Dec 12
AUD USD EUR Other
Term Debt Issues Outstanding (>12mths)1
1 Total of debt issues (at current FX) plus A$ Transferable Certificates of deposit. Excludes IFRS.
59 50
77
90 81
93 102
$bn
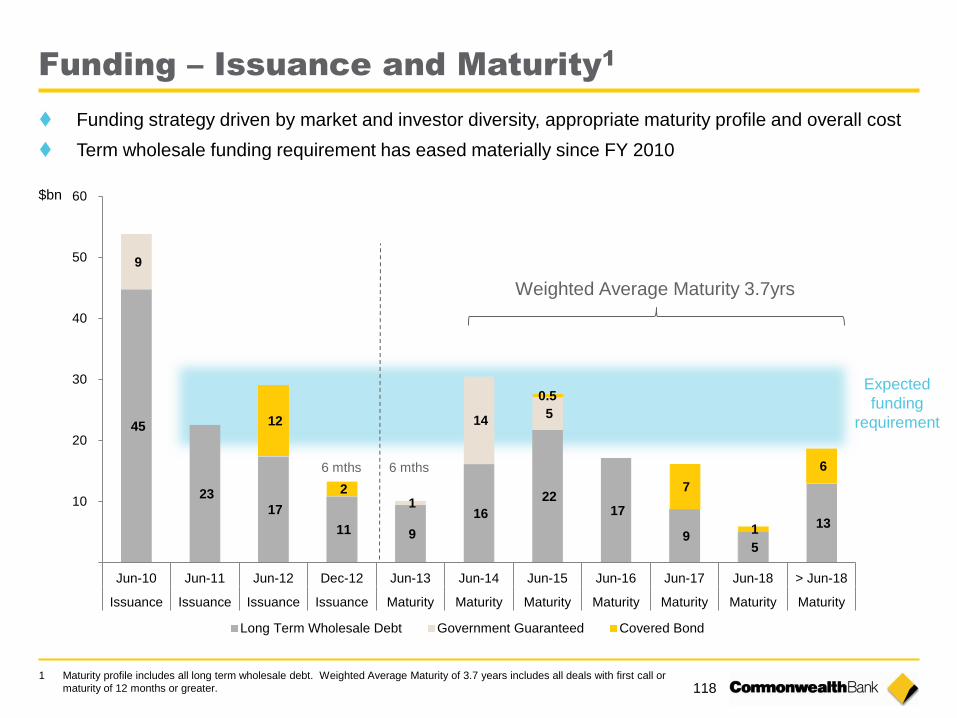
118
45
23
17
11 9
16
22 17
9 5
13
9
1
14 5
12
2
0.5
7
1
6
10
20
30
40
50
60
Jun-10 Jun-11 Jun-12 Dec-12 Jun-13 Jun-14 Jun-15 Jun-16 Jun-17 Jun-18 > Jun-18
Issuance Issuance Issuance Issuance Maturity Maturity Maturity Maturity Maturity Maturity Maturity
Long Term Wholesale Debt Government Guaranteed Covered Bond
Weighted Average Maturity 3.7yrs
Funding – Issuance and Maturity1
1 Maturity profile includes all long term wholesale debt. Weighted Average Maturity of 3.7 years includes all deals with first call or
maturity of 12 months or greater.
Funding strategy driven by market and investor diversity, appropriate maturity profile and overall cost
Term wholesale funding requirement has eased materially since FY 2010
Expected
funding
requirement
$bn
6 mths 6 mths
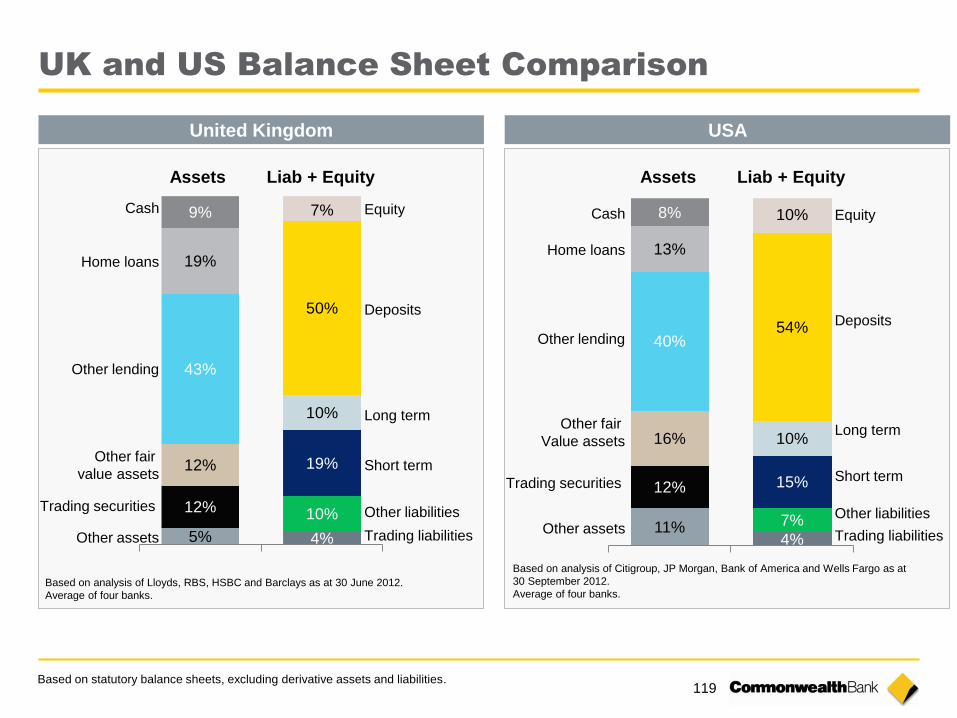
119
UK and US Balance Sheet Comparison
United Kingdom USA
5% 4%
12% 10%
12% 19%
43%
10%
19%
50%
9% 7%
Other assets
Other fair
value assets
Other lending
Home loans
Trading securities
Cash Equity
Deposits
Long term
Short term
Other liabilities
Trading liabilities
Assets Liab + Equity
Based on analysis of Lloyds, RBS, HSBC and Barclays as at 30 June 2012.
Average of four banks.
11% 4%
12%
7%
16%
15%
40%
10%
13%
54%
8% 10%
Other assets
Other lending
Home loans
Trading securities
Cash Equity
Deposits
Long term
Short term
Other liabilities
Trading liabilities
Assets Liab + Equity
Based on analysis of Citigroup, JP Morgan, Bank of America and Wells Fargo as at
30 September 2012.
Average of four banks.
Other fair
Value assets
Based on statutory balance sheets, excluding derivative assets and liabilities.
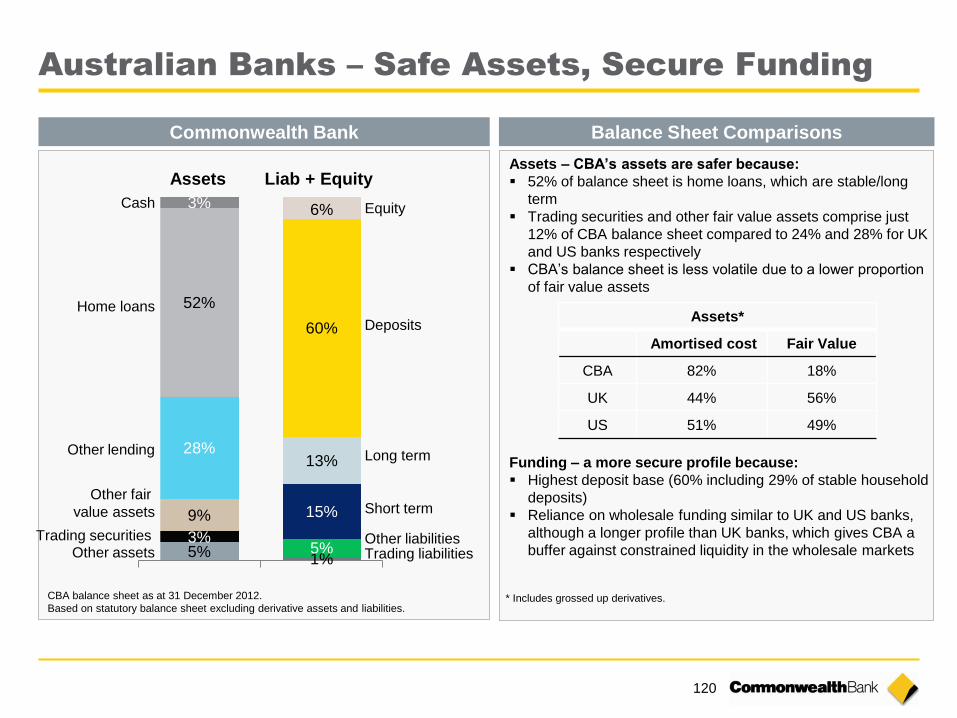
120
Australian Banks – Safe Assets, Secure Funding
Other assets
Other lending
Home loans
Trading securities
Cash Equity
Deposits
Long term
Short term
Other liabilities Trading liabilities
CBA balance sheet as at 31 December 2012.
Based on statutory balance sheet excluding derivative assets and liabilities.
Assets Liab + Equity
Other fair
value assets
5% 1%
3% 5%
9% 15%
28% 13%
52%
60%
3% 6%
Assets – CBA’s assets are safer because:
52% of balance sheet is home loans, which are stable/long
term
Trading securities and other fair value assets comprise just
12% of CBA balance sheet compared to 24% and 28% for UK
and US banks respectively
CBA’s balance sheet is less volatile due to a lower proportion
of fair value assets
Funding – a more secure profile because:
Highest deposit base (60% including 29% of stable household
deposits)
Reliance on wholesale funding similar to UK and US banks,
although a longer profile than UK banks, which gives CBA a
buffer against constrained liquidity in the wholesale markets
Assets*
Amortised cost Fair Value
CBA 82% 18%
UK 44% 56%
US 51% 49%
* Includes grossed up derivatives.
Commonwealth Bank Balance Sheet Comparisons
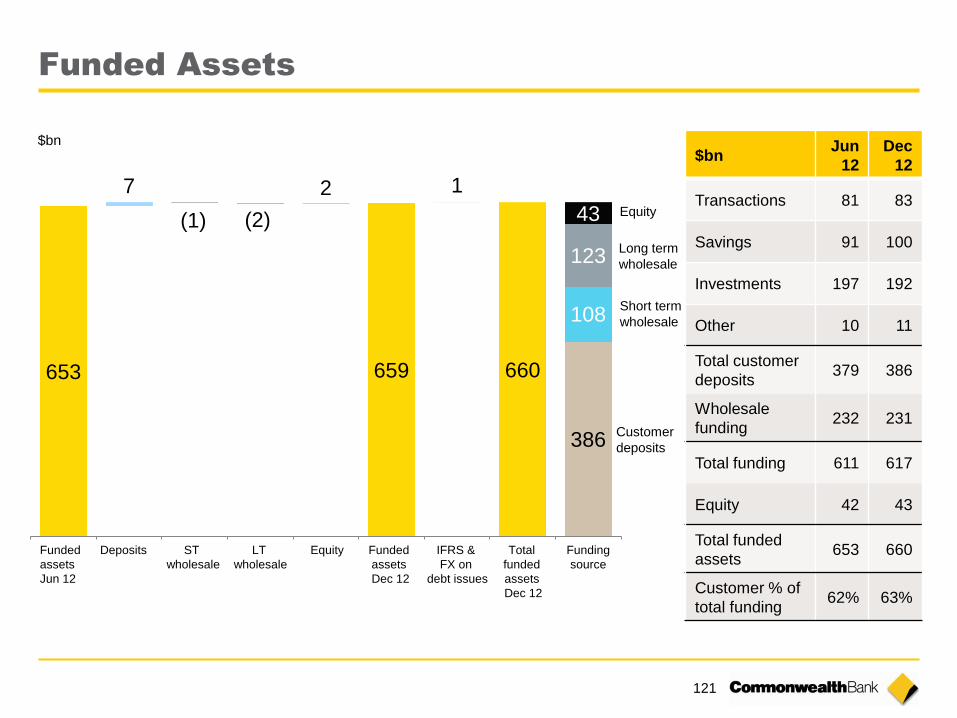
121
Funded Assets
$bn Jun
12
Dec
12
Transactions 81 83
Savings 91 100
Investments 197 192
Other 10 11
Total customer
deposits 379 386
Wholesale
funding 232 231
Total funding 611 617
Equity 42 43
Total funded
assets 653 660
Customer % of
total funding 62% 63%
653 659 660
386
7 2 1
108
(1) (2)
123
43
Funded
assets
Jun 12
Deposits ST
wholesale
LT
wholesale
Equity Funded
assets
Dec 12
IFRS &
FX on
debt issues
Total
funded
assets
Dec 12
Funding
source
Equity
Long term
wholesale
Customer
deposits
Short term
wholesale
$bn
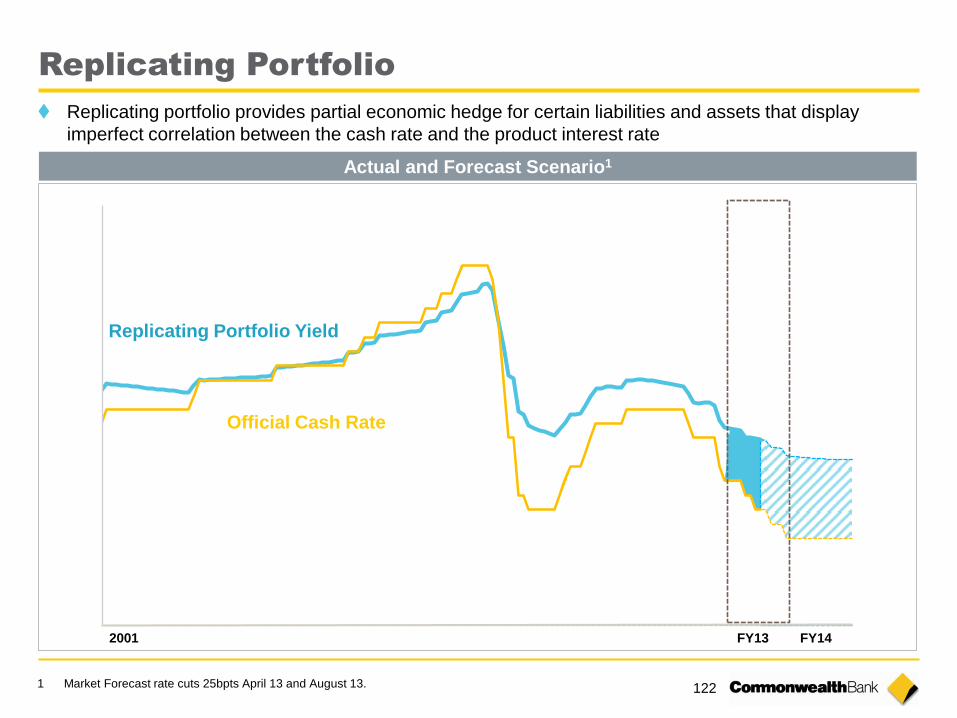
122
Replicating portfolio provides partial economic hedge for certain liabilities and assets that display
imperfect correlation between the cash rate and the product interest rate
1%
2%
3%
4%
5%
6%
7%
8%
1 Market Forecast rate cuts 25bpts April 13 and August 13.
2001 FY14 FY13
Replicating Portfolio
Actual and Forecast Scenario1
Official Cash Rate
Replicating Portfolio Yield
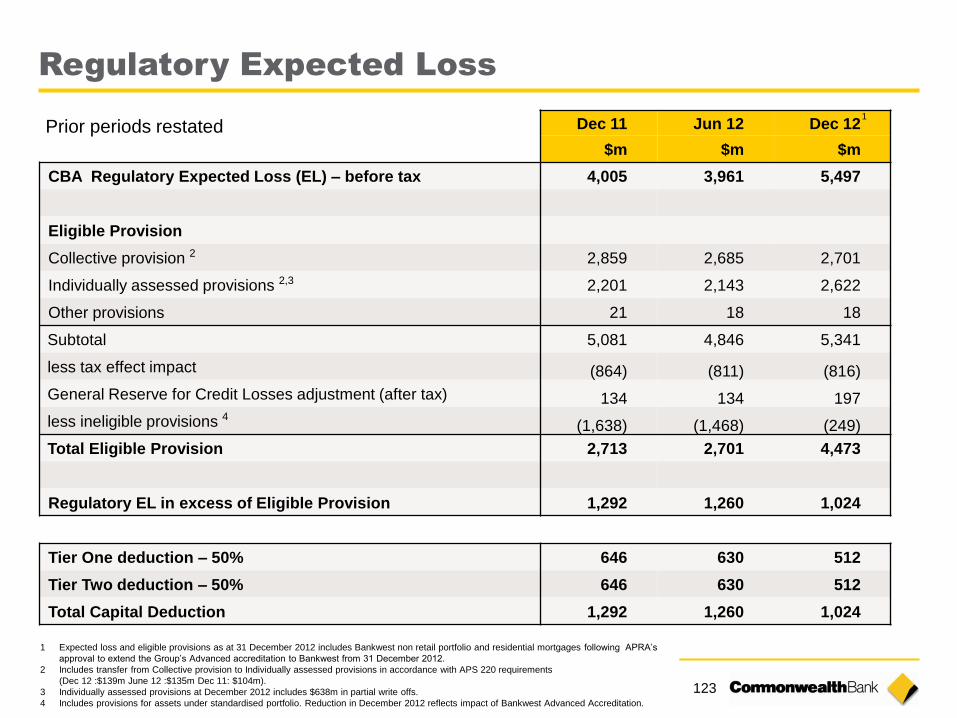
123
Regulatory Expected Loss
Dec 11 Jun 12 Dec 12
$m $m $m
CBA Regulatory Expected Loss (EL) – before tax 4,005 3,961 5,497
Eligible Provision
Collective provision 2 2,859 2,685 2,701
Individually assessed provisions 2,3 2,201 2,143 2,622
Other provisions 21 18 18
Subtotal 5,081 4,846 5,341
less tax effect impact (864) (811) (816)
General Reserve for Credit Losses adjustment (after tax) 134 134 197
less ineligible provisions 4 (1,638) (1,468) (249)
Total Eligible Provision 2,713 2,701 4,473
Regulatory EL in excess of Eligible Provision 1,292 1,260 1,024
Tier One deduction – 50% 646 630 512
Tier Two deduction – 50% 646 630 512
Total Capital Deduction 1,292 1,260 1,024
1 Expected loss and eligible provisions as at 31 December 2012 includes Bankwest non retail portfolio and residential mortgages following APRA’s
approval to extend the Group’s Advanced accreditation to Bankwest from 31 December 2012.
2 Includes transfer from Collective provision to Individually assessed provisions in accordance with APS 220 requirements
(Dec 12 :$139m June 12 :$135m Dec 11: $104m).
3 Individually assessed provisions at December 2012 includes $638m in partial write offs.
4 Includes provisions for assets under standardised portfolio. Reduction in December 2012 reflects impact of Bankwest Advanced Accreditation.
Prior periods restated 1
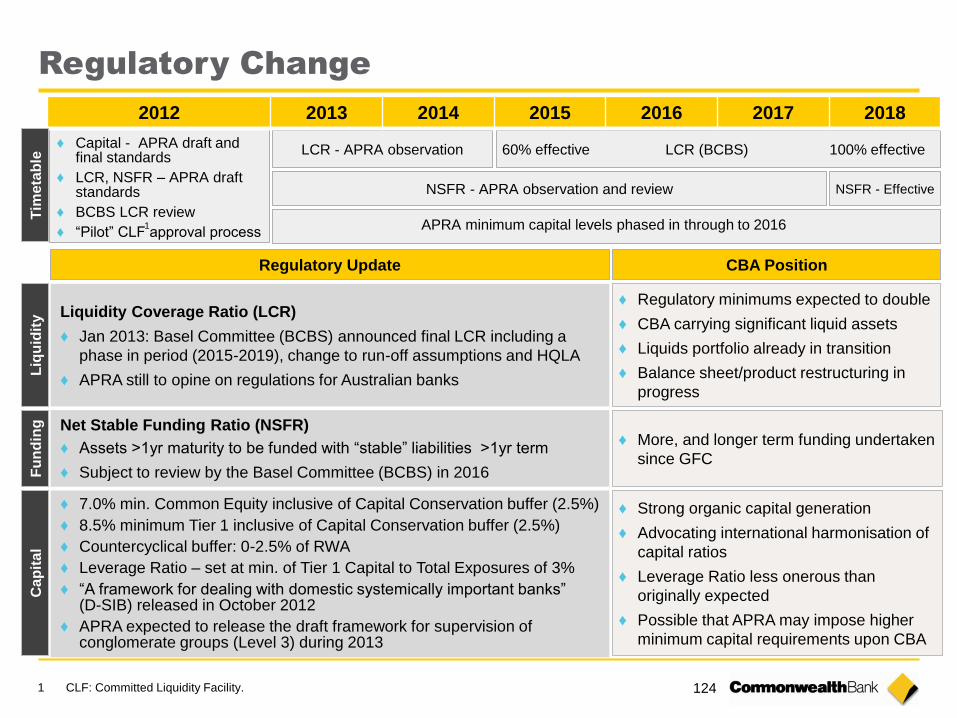
124
Regulatory Change
NSFR - APRA observation and review NSFR - Effective
LCR - APRA observation 60% effective LCR (BCBS) 100% effective
Regulatory Update
Liq
uid
ity
Fu
nd
ing
C
ap
ita
l
Liquidity Coverage Ratio (LCR)
♦ Jan 2013: Basel Committee (BCBS) announced final LCR including a
phase in period (2015-2019), change to run-off assumptions and HQLA
♦ APRA still to opine on regulations for Australian banks
Net Stable Funding Ratio (NSFR)
♦ Assets >1yr maturity to be funded with “stable” liabilities >1yr term
♦ Subject to review by the Basel Committee (BCBS) in 2016
CBA Position
♦ More, and longer term funding undertaken
since GFC
♦ Regulatory minimums expected to double
♦ CBA carrying significant liquid assets
♦ Liquids portfolio already in transition
♦ Balance sheet/product restructuring in
progress
♦ 7.0% min. Common Equity inclusive of Capital Conservation buffer (2.5%)
♦ 8.5% minimum Tier 1 inclusive of Capital Conservation buffer (2.5%)
♦ Countercyclical buffer: 0-2.5% of RWA
♦ Leverage Ratio – set at min. of Tier 1 Capital to Total Exposures of 3%
♦ “A framework for dealing with domestic systemically important banks” (D-SIB) released in October 2012
♦ APRA expected to release the draft framework for supervision of conglomerate groups (Level 3) during 2013
♦ Strong organic capital generation
♦ Advocating international harmonisation of
capital ratios
♦ Leverage Ratio less onerous than
originally expected
♦ Possible that APRA may impose higher
minimum capital requirements upon CBA
2012 2013 2014 2015 2016 2017 2018
APRA minimum capital levels phased in through to 2016
Tim
eta
ble
♦ Capital - APRA draft and final standards
♦ LCR, NSFR – APRA draft standards
♦ BCBS LCR review
♦ “Pilot” CLF approval process
1 CLF: Committed Liquidity Facility.
1
Index
Strategy 57
Business Performance 80
Risk and Credit Quality 98
Capital, Funding & Liquidity 111
Economic Indicators 125
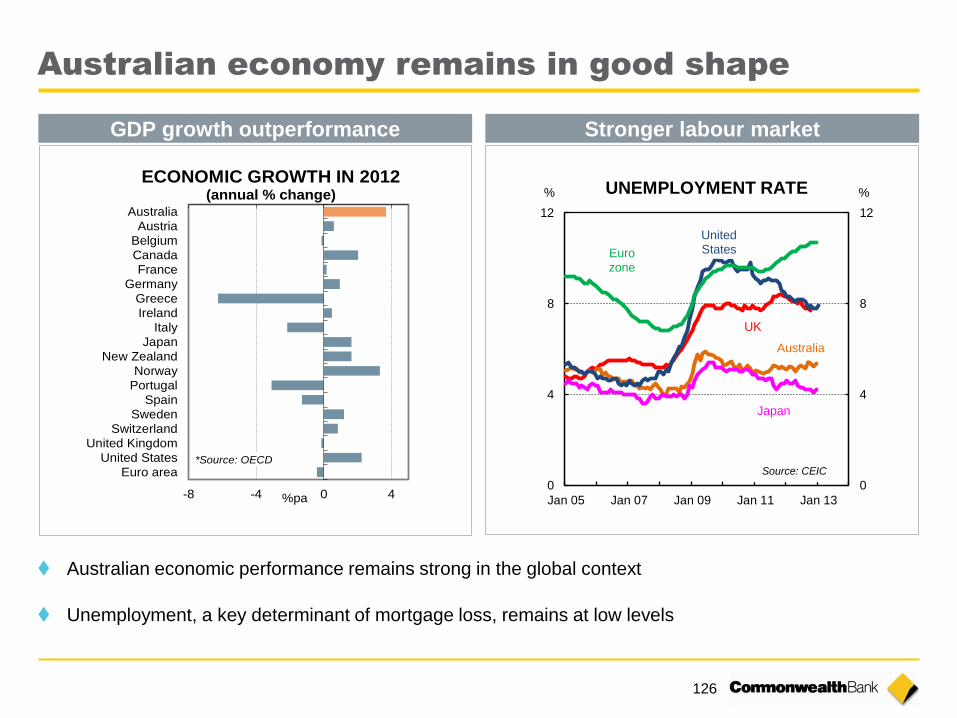
126
Australian economy remains in good shape
GDP growth outperformance Stronger labour market
Australian economic performance remains strong in the global context
Unemployment, a key determinant of mortgage loss, remains at low levels
0
4
8
12
0
4
8
12
Jan 05 Jan 07 Jan 09 Jan 11 Jan 13
%%
UK
Eurozone
Source: CEIC
UNEMPLOYMENT RATE
UnitedStates
Japan
Australia
-8 -4 0 4
Australia
Austria
Belgium
Canada
France
Germany
Greece
Ireland
Italy
Japan
New Zealand
Norway
Portugal
SpainSweden
Switzerland
United Kingdom
United StatesEuro area
ECONOMIC GROWTH IN 2012(annual % change)
%pa
*Source: OECD
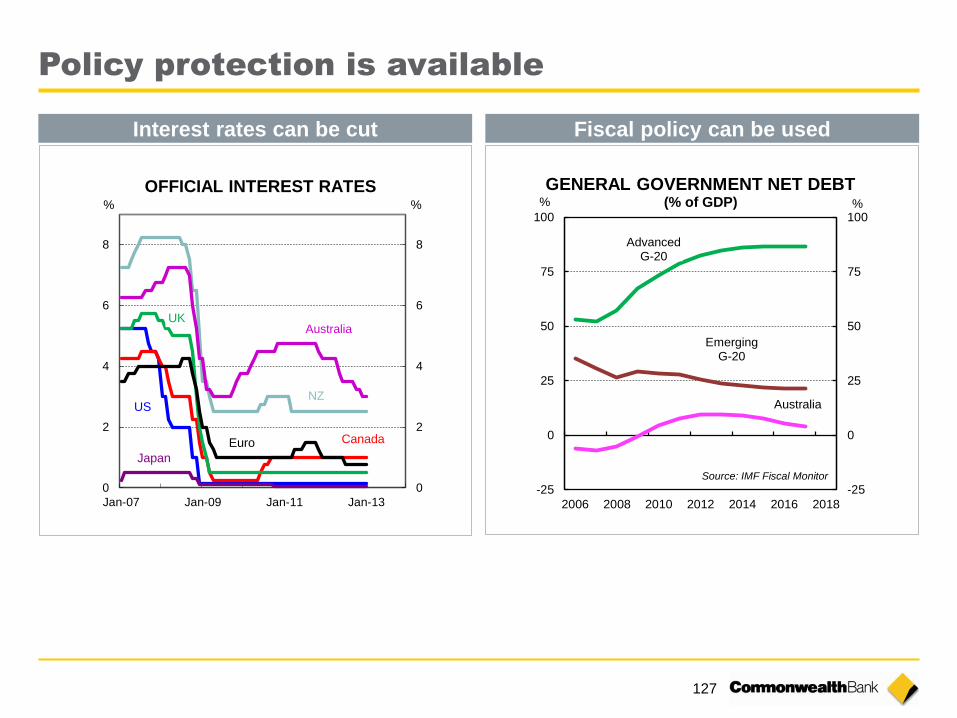
127
Policy protection is available
-25
0
25
50
75
100
-25
0
25
50
75
100
2006 2008 2010 2012 2014 2016 2018
%%
Australia
Source: IMF Fiscal Monitor
GENERAL GOVERNMENT NET DEBT(% of GDP)
EmergingG-20
AdvancedG-20
0
2
4
6
8
0
2
4
6
8
Jan-07 Jan-09 Jan-11 Jan-13
OFFICIAL INTEREST RATES% %
Canada
US
UK
Euro
Japan
NZ
Australia
Interest rates can be cut Fiscal policy can be used
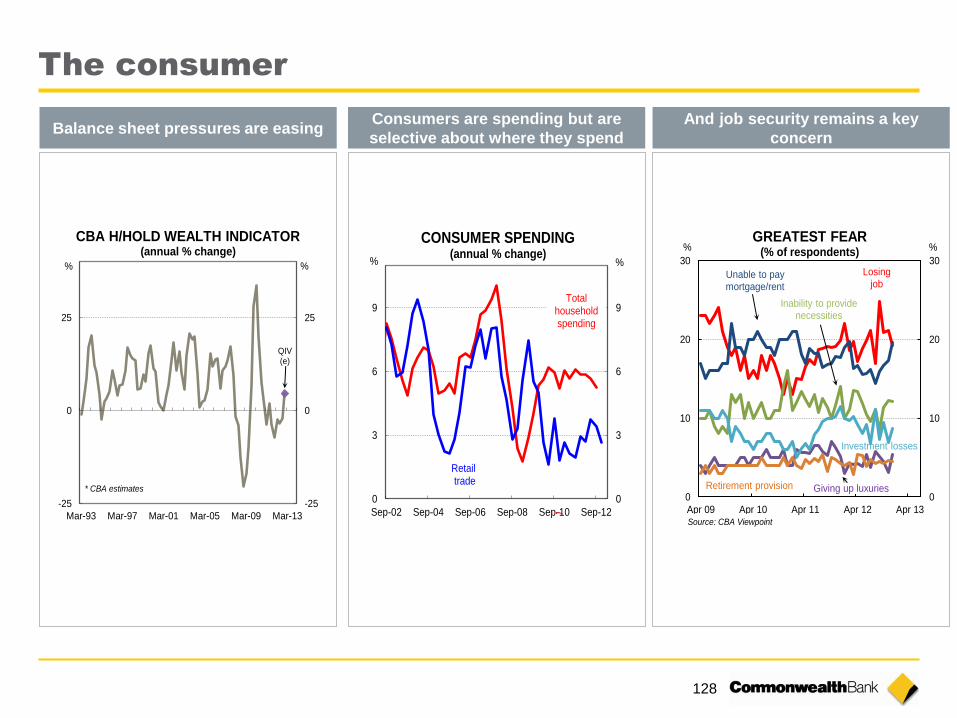
128
The consumer
Balance sheet pressures are easing Consumers are spending but are
selective about where they spend
And job security remains a key
concern
0
10
20
30
0
10
20
30
Apr 09 Apr 10 Apr 11 Apr 12 Apr 13
%%
Unable to pay mortgage/rent
Source: CBA Viewpoint
GREATEST FEAR(% of respondents)
Losingjob
Inability to provide necessities
Investment losses
Retirement provision Giving up luxuries
-25
0
25
-25
0
25
Mar-93 Mar-97 Mar-01 Mar-05 Mar-09 Mar-13
% %
CBA H/HOLD WEALTH INDICATOR(annual % change)
* CBA estimates
QIV(e)
0
3
6
9
0
3
6
9
Sep-02 Sep-04 Sep-06 Sep-08 Sep-10 Sep-12
CONSUMER SPENDING(annual % change)
%%
US
Total household spending
Retail trade

129
Labour market
The labour market is soft Some indicators suggest stronger jobs growth
-60
-30
0
30
60
90
3.5
4.0
4.5
5.0
5.5
6.0
Jan-08 Jan-09 Jan-10 Jan-11 Jan-12 Jan-13
LABOUR MARKET
Employmentgrowth
(3mnth average, rhs)
Unemployment rate(lhs)
% '000
-10
0
10
20
-1
1
3
5
Jan-04 Jan-06 Jan-08 Jan-10 Jan-12
TAXES & JOBS(annual % change)% %
Gross PAYGrevenue
(smoothed)(rhs)
Employment(lhs)
Payroll tax(rhs)
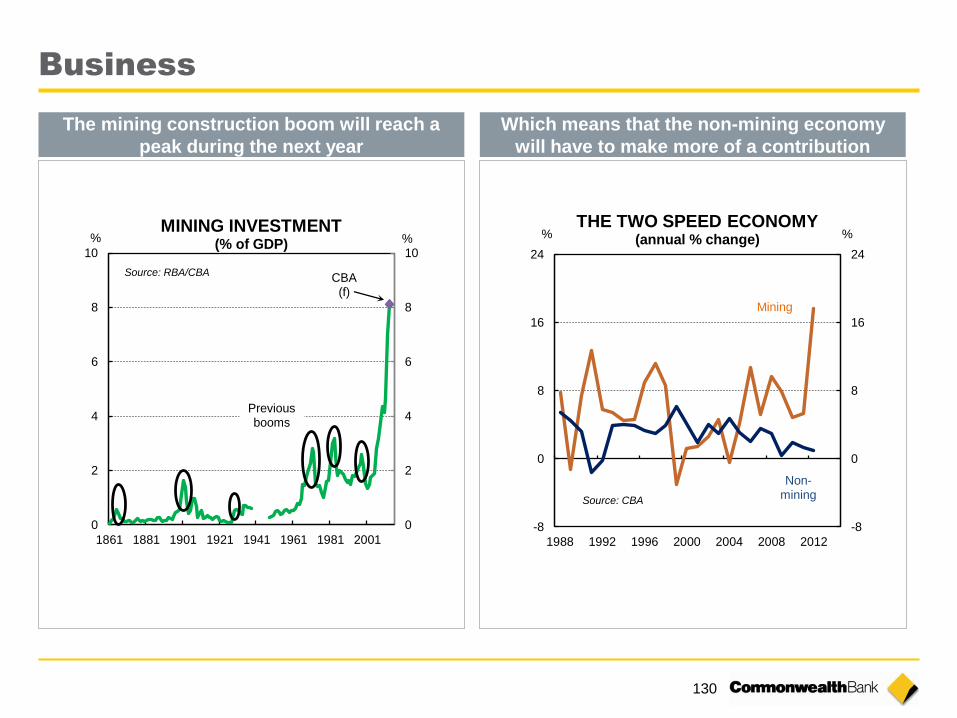
130
Business
The mining construction boom will reach a
peak during the next year
Which means that the non-mining economy
will have to make more of a contribution
0
2
4
6
8
10
0
2
4
6
8
10
1861 1881 1901 1921 1941 1961 1981 2001
%
CBA(f)
Source: RBA/CBA
MINING INVESTMENT(% of GDP) %
Previousbooms
-8
0
8
16
24
-8
0
8
16
24
1988 1992 1996 2000 2004 2008 2012
%%
Mining
Non-mining
Source: CBA
THE TWO SPEED ECONOMY(annual % change)
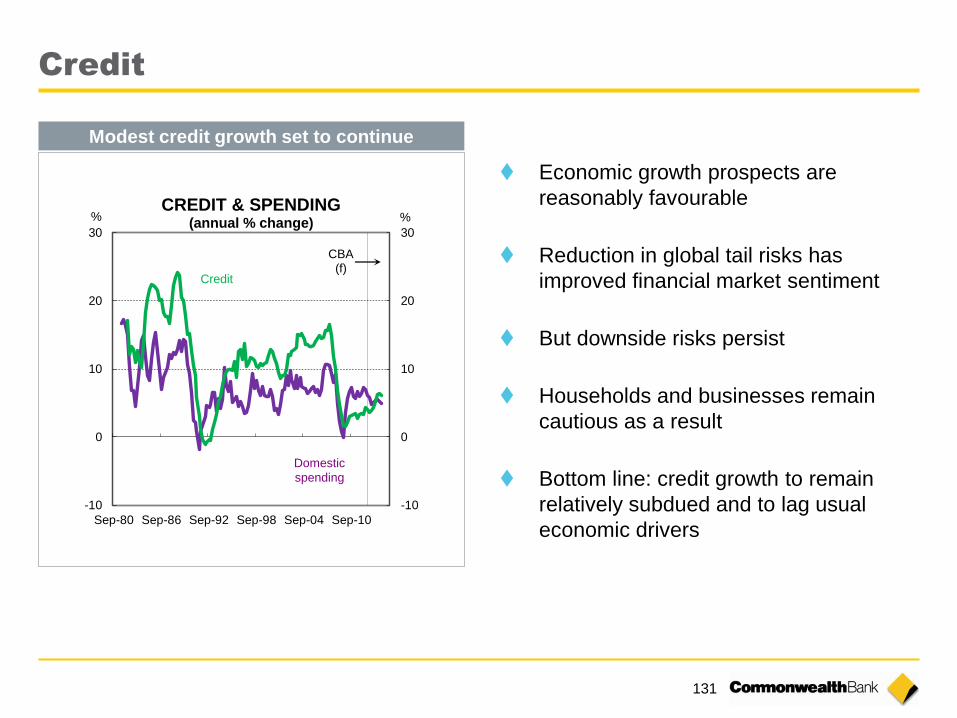
131
Credit
Economic growth prospects are
reasonably favourable
Reduction in global tail risks has
improved financial market sentiment
But downside risks persist
Households and businesses remain
cautious as a result
Bottom line: credit growth to remain
relatively subdued and to lag usual
economic drivers
Modest credit growth set to continue
-10
0
10
20
30
-10
0
10
20
30
Sep-80 Sep-86 Sep-92 Sep-98 Sep-04 Sep-10
CREDIT & SPENDING (annual % change)
% %
Credit
Domesticspending
CBA(f)
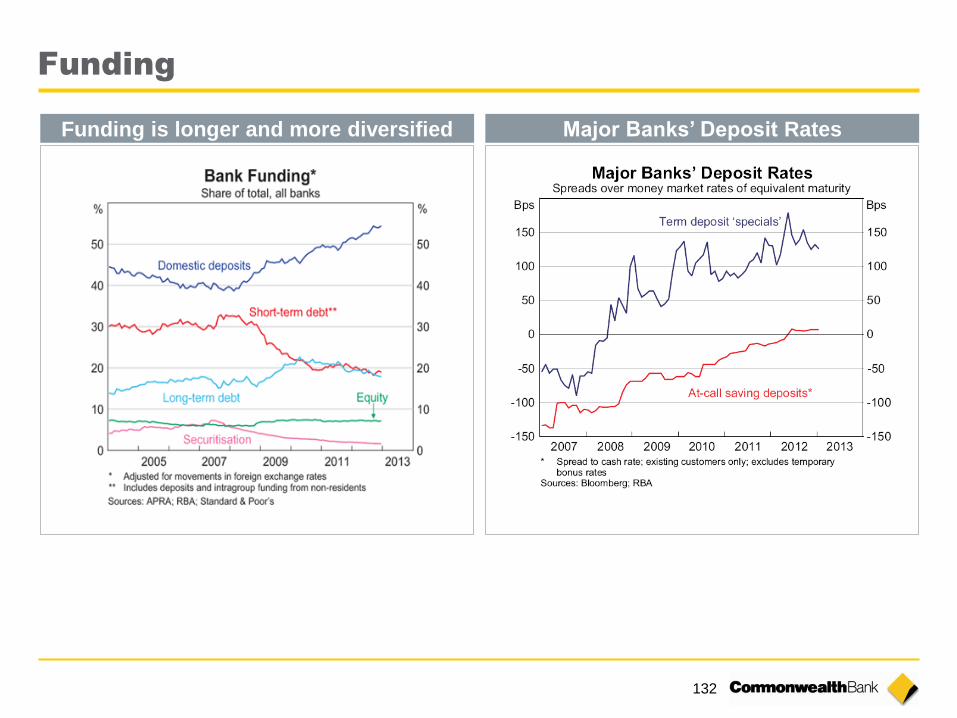
132
Funding
Funding is longer and more diversified Major Banks’ Deposit Rates
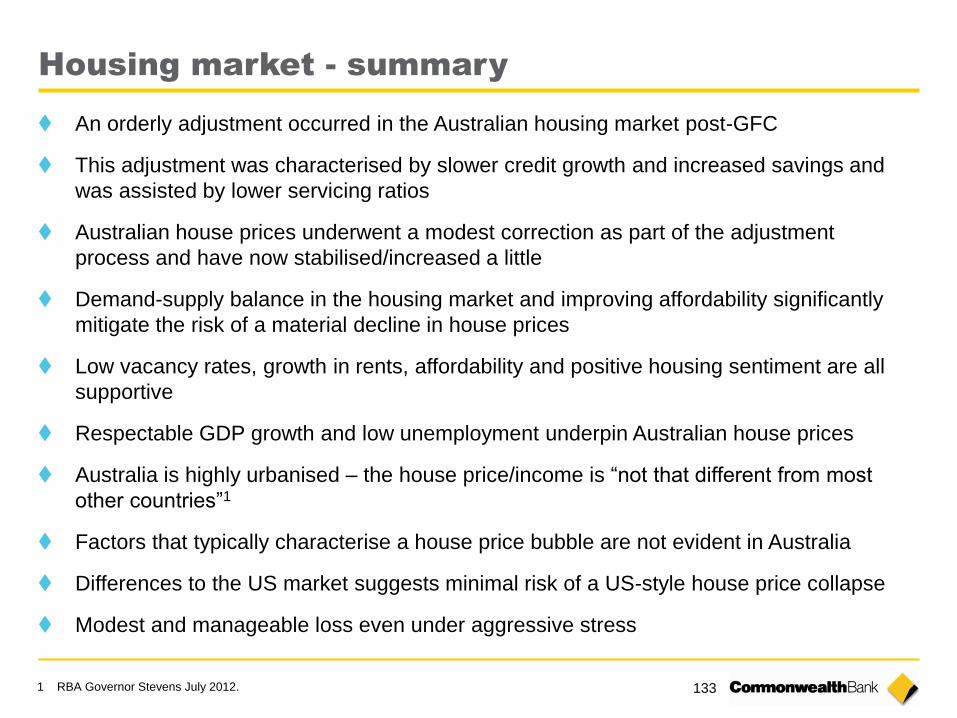
133
Housing market - summary
1 RBA Governor Stevens July 2012.
An orderly adjustment occurred in the Australian housing market post-GFC
This adjustment was characterised by slower credit growth and increased savings and
was assisted by lower servicing ratios
Australian house prices underwent a modest correction as part of the adjustment
process and have now stabilised/increased a little
Demand-supply balance in the housing market and improving affordability significantly
mitigate the risk of a material decline in house prices
Low vacancy rates, growth in rents, affordability and positive housing sentiment are all
supportive
Respectable GDP growth and low unemployment underpin Australian house prices
Australia is highly urbanised – the house price/income is “not that different from most
other countries”1
Factors that typically characterise a house price bubble are not evident in Australia
Differences to the US market suggests minimal risk of a US-style house price collapse
Modest and manageable loss even under aggressive stress
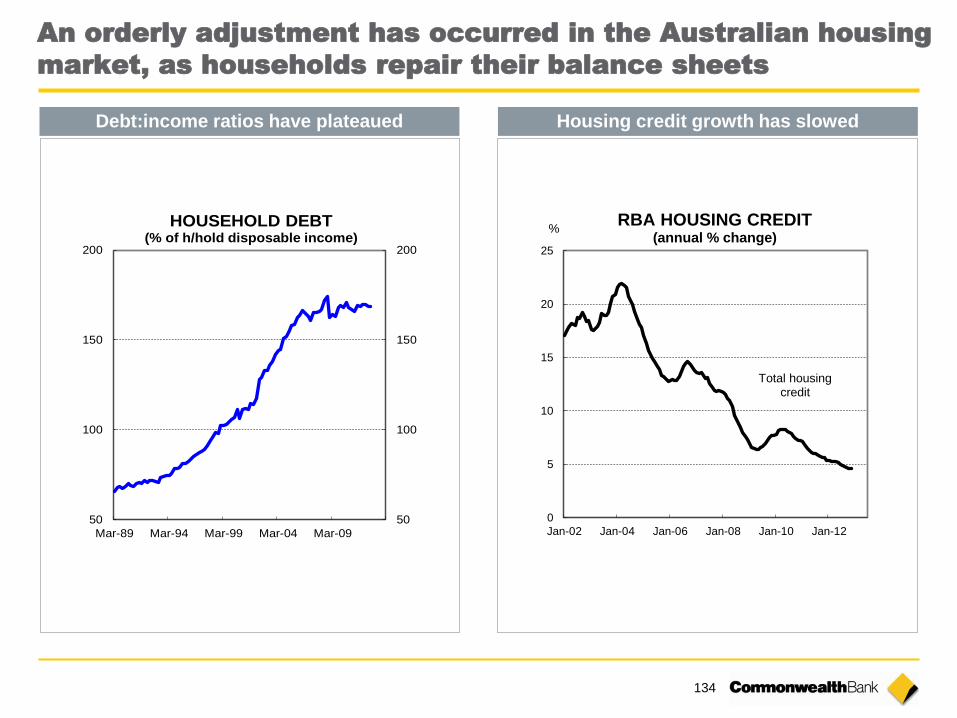
134
An orderly adjustment has occurred in the Australian housing
market, as households repair their balance sheets
Debt:income ratios have plateaued Housing credit growth has slowed
0
5
10
15
20
25
Jan-02 Jan-04 Jan-06 Jan-08 Jan-10 Jan-12
RBA HOUSING CREDIT(annual % change)
%
Total housingcredit
50
100
150
200
50
100
150
200
Mar-89 Mar-94 Mar-99 Mar-04 Mar-09
HOUSEHOLD DEBT(% of h/hold disposable income)
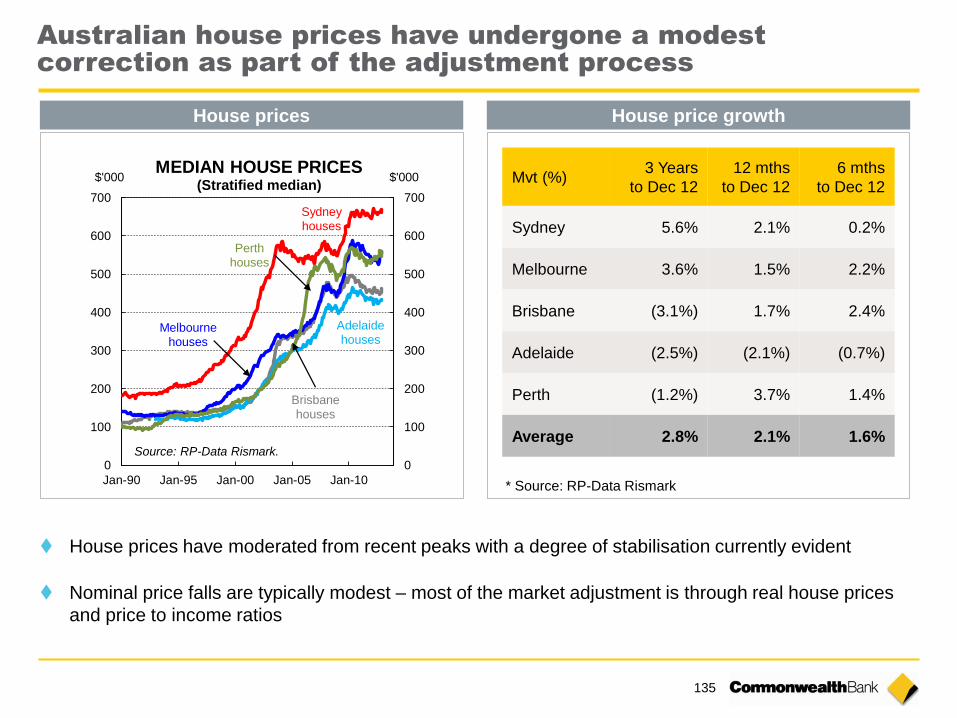
135
Australian house prices have undergone a modest
correction as part of the adjustment process
House prices have moderated from recent peaks with a degree of stabilisation currently evident
Nominal price falls are typically modest – most of the market adjustment is through real house prices
and price to income ratios
House prices House price growth
Mvt (%) 3 Years
to Dec 12
12 mths
to Dec 12
6 mths
to Dec 12
Sydney 5.6% 2.1% 0.2%
Melbourne 3.6% 1.5% 2.2%
Brisbane (3.1%) 1.7% 2.4%
Adelaide (2.5%) (2.1%) (0.7%)
Perth (1.2%) 3.7% 1.4%
Average 2.8% 2.1% 1.6%
* Source: RP-Data Rismark
0
100
200
300
400
500
600
700
0
100
200
300
400
500
600
700
Jan-90 Jan-95 Jan-00 Jan-05 Jan-10
MEDIAN HOUSE PRICES(Stratified median)
Sydneyhouses
Melbournehouses
$'000$'000
Source: RP-Data Rismark.
Brisbanehouses
Adelaidehouses
Perthhouses
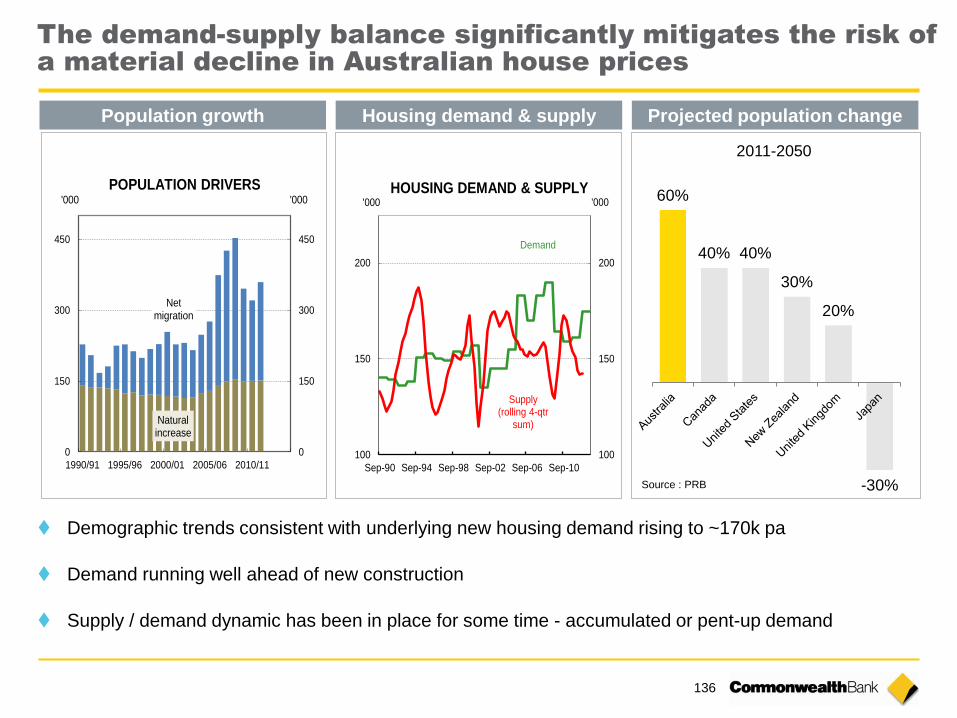
136
The demand-supply balance significantly mitigates the risk of
a material decline in Australian house prices
Demographic trends consistent with underlying new housing demand rising to ~170k pa
Demand running well ahead of new construction
Supply / demand dynamic has been in place for some time - accumulated or pent-up demand
Population growth Housing demand & supply Projected population change
60%
40% 40%
30%
20%
-30%
2011-2050
Source : PRB
0
150
300
450
0
150
300
450
1990/91 1995/96 2000/01 2005/06 2010/11
POPULATION DRIVERS'000 '000
Netmigration
Naturalincrease
100
150
200
100
150
200
Sep-90 Sep-94 Sep-98 Sep-02 Sep-06 Sep-10
HOUSING DEMAND & SUPPLY
Demand
Supply(rolling 4-qtr
sum)
'000'000
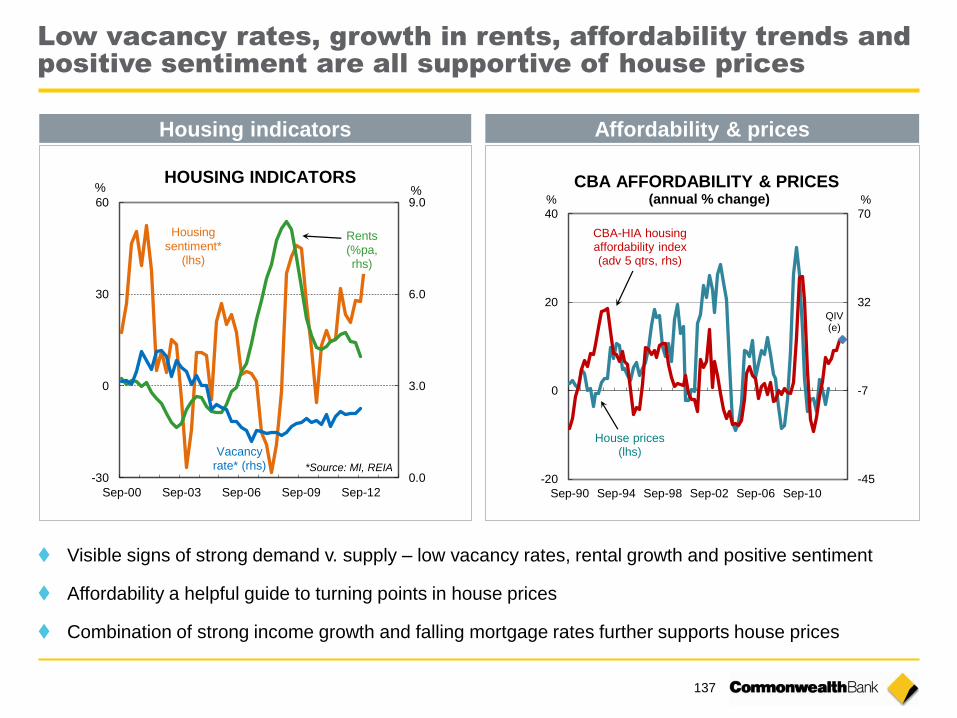
137
Low vacancy rates, growth in rents, affordability trends and
positive sentiment are all supportive of house prices
Housing indicators Affordability & prices
Visible signs of strong demand v. supply – low vacancy rates, rental growth and positive sentiment
Affordability a helpful guide to turning points in house prices
Combination of strong income growth and falling mortgage rates further supports house prices
0.0
3.0
6.0
9.0
-30
0
30
60
Sep-00 Sep-03 Sep-06 Sep-09 Sep-12
HOUSING INDICATORS
*Source: MI, REIA
% %
Vacancy rate* (rhs)
Rents(%pa, rhs)
Housingsentiment*
(lhs)
-45
-7
32
70
-20
0
20
40
Sep-90 Sep-94 Sep-98 Sep-02 Sep-06 Sep-10
House prices(lhs)
CBA-HIA housing affordability index(adv 5 qtrs, rhs)
%%
CBA AFFORDABILITY & PRICES (annual % change)
QIV(e)
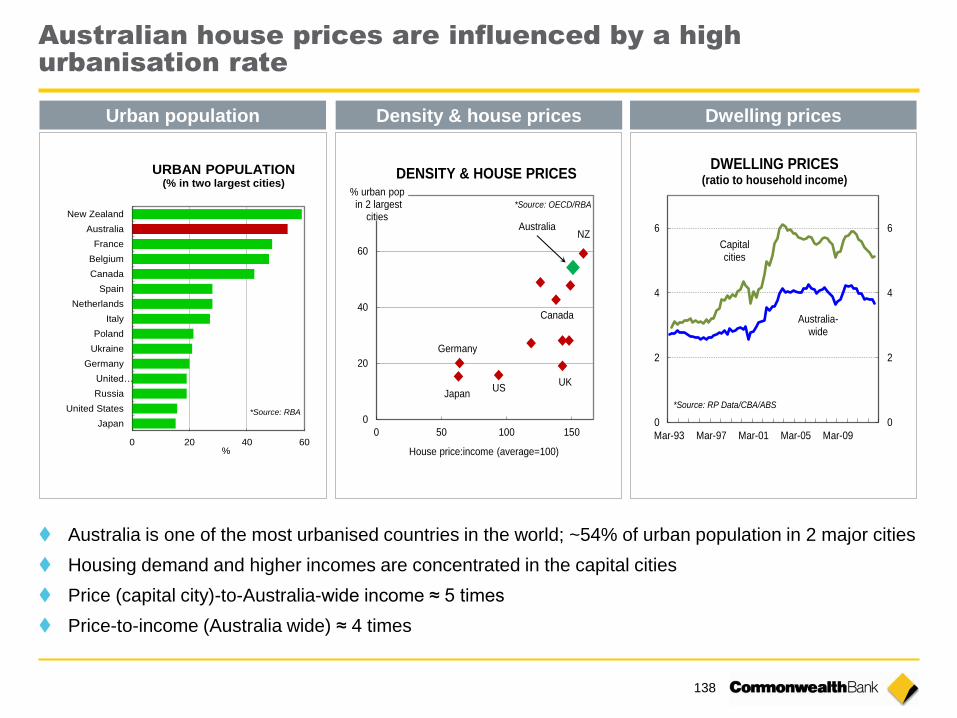
138
Australian house prices are influenced by a high
urbanisation rate
Australia is one of the most urbanised countries in the world; ~54% of urban population in 2 major cities
Housing demand and higher incomes are concentrated in the capital cities
Price (capital city)-to-Australia-wide income ≈ 5 times
Price-to-income (Australia wide) ≈ 4 times
Urban population Density & house prices Dwelling prices
0 20 40 60
Japan
United States
Russia
United…
Germany
Ukraine
Poland
Italy
Netherlands
Spain
Canada
Belgium
France
Australia
New Zealand
URBAN POPULATION(% in two largest cities)
%
*Source: RBA0
20
40
60
80
0 50 100 150
DENSITY & HOUSE PRICES
House price:income (average=100)
*Source: OECD/RBA
% urban popin 2 largest
citiesAustralia
NZ
USUK
Canada
Japan
Germany
0
2
4
6
0
2
4
6
Mar-93 Mar-97 Mar-01 Mar-05 Mar-09
DWELLING PRICES(ratio to household income)
*Source: RP Data/CBA/ABS
Australia-wide
Capitalcities
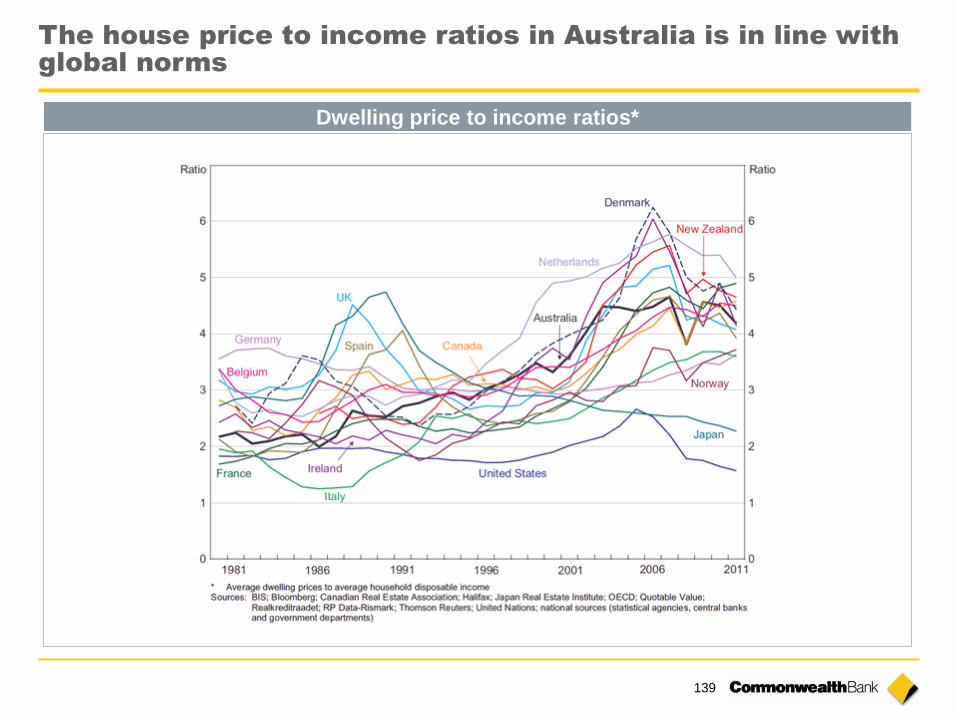
139
The house price to income ratios in Australia is in line with
global norms
Dwelling price to income ratios*
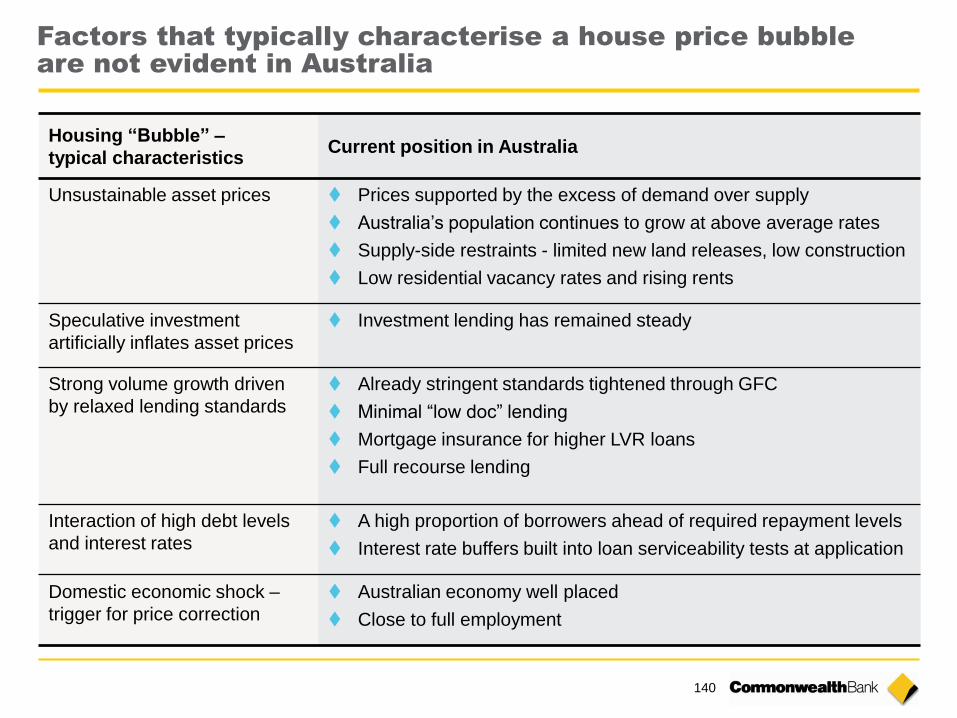
140
Housing “Bubble” –
typical characteristics Current position in Australia
Unsustainable asset prices Prices supported by the excess of demand over supply
Australia’s population continues to grow at above average rates
Supply-side restraints - limited new land releases, low construction
Low residential vacancy rates and rising rents
Speculative investment
artificially inflates asset prices
Investment lending has remained steady
Strong volume growth driven
by relaxed lending standards
Already stringent standards tightened through GFC
Minimal “low doc” lending
Mortgage insurance for higher LVR loans
Full recourse lending
Interaction of high debt levels
and interest rates
A high proportion of borrowers ahead of required repayment levels
Interest rate buffers built into loan serviceability tests at application
Domestic economic shock –
trigger for price correction
Australian economy well placed
Close to full employment
Factors that typically characterise a house price bubble
are not evident in Australia
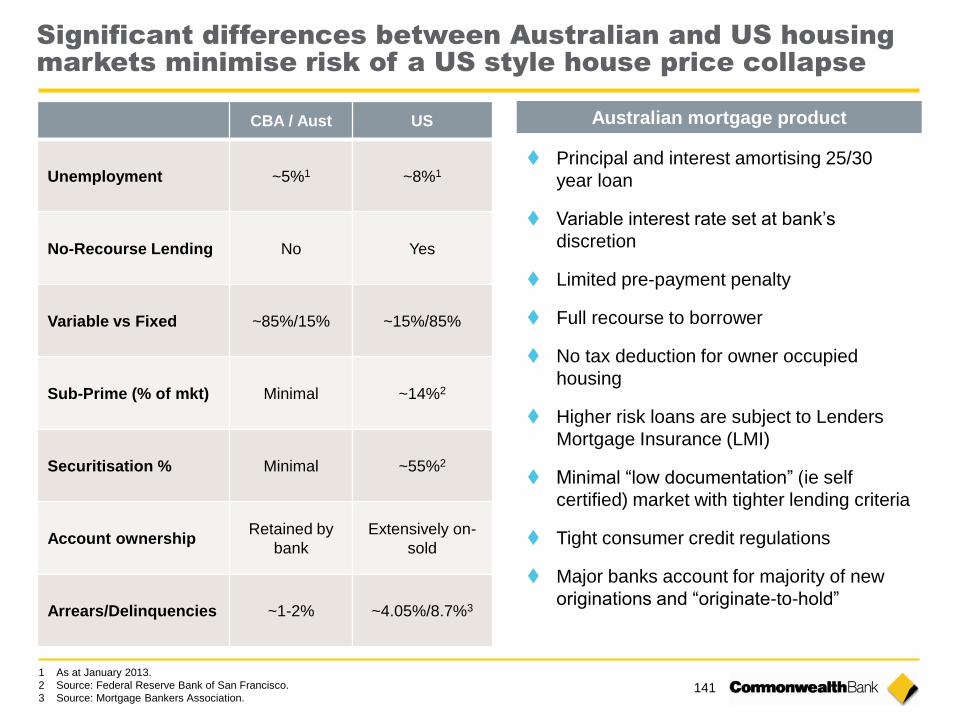
141
1 As at January 2013.
2 Source: Federal Reserve Bank of San Francisco.
3 Source: Mortgage Bankers Association.
Significant differences between Australian and US housing
markets minimise risk of a US style house price collapse
CBA / Aust US
Unemployment ~5%1 ~8%1
No-Recourse Lending No Yes
Variable vs Fixed ~85%/15% ~15%/85%
Sub-Prime (% of mkt) Minimal ~14%2
Securitisation % Minimal ~55%2
Account ownership Retained by
bank
Extensively on-
sold
Arrears/Delinquencies ~1-2% ~4.05%/8.7%3
Principal and interest amortising 25/30
year loan
Variable interest rate set at bank’s
discretion
Limited pre-payment penalty
Full recourse to borrower
No tax deduction for owner occupied
housing
Higher risk loans are subject to Lenders
Mortgage Insurance (LMI)
Minimal “low documentation” (ie self
certified) market with tighter lending criteria
Tight consumer credit regulations
Major banks account for majority of new
originations and “originate-to-hold”
Australian mortgage product
142
Notes
1 Roy Morgan Research Main Financial Institution (MFI) Retail Customer Satisfaction. Australian population 14+, % “Very Satisfied” or “Fairly Satisfied” with relationship with that MFI. 6-month rolling average. CBA excludes Bankwest.
2 DBM Business Financial Services Monitor (December 2012), average satisfaction rating of each financial institution’s MFI business customers across all Australian businesses, 6 month rolling average.
3 Products per Customer – Roy Morgan Research. Australian Population 18+ , Banking and Finance products per Banking and Finance customer at financial institution. 6 month rolling average. CBA excludes Bankwest.
4 Roy Morgan Research, Australians 14+, Proportion of Banking and Finance MFI Customers that nominated each bank as their
Main Financial Institution, 12 month rolling data to reporting month. CBA includes BankWest.
5 Roy Morgan Research, Australians 14+, Proportion of Banking and Finance MFI Customers that nominated each bank as their Main Financial Institution, 12 month rolling data to reporting month. CBA includes BankWest. Westpac includes Bank of Melbourne, St George Bank and BankSA.
6 DBM Business Financial Services Monitor, measured micro business with turnover up to $1 million, small business with turnover of $1 million up to $5 million, medium business with turnover of $5 million up to $50 million and large business with turnover of over $50 million, 6 month rolling average.
Customer Satisfaction - Sources
Productivity Metrics - Definitions Retail Branch Network Transactions per CSR/Sales and Converted Referrals per CSS - Average number of transactions completed
per week in branch by Customer Service Representatives / Average number of sales & converted referrals completed per week in
branch by Customer Service & Savings Specialists.
Retail Call Centres call handing time - Average call handling time in Retail Direct Bank Call Centres in each half.
Local Business Banking $ lending balance per Local Business Banking FTE - Average dollar commercial lending balance per Local
Business Banking FTE in each half.
Home Loan Processing Home loan fundings per operations FTE - Average number of home loan fundings per Enterprise Services
Service Delivery home loans operations FTE in each half.

13 FEBRUARY 2013 | COMMONWEALTH BANK OF AUSTRALIA | ACN 123 123 124