ANALYSIS OF TUNA FISH PRODU TION VALUE ING AT PPS …€¦ · INTRODUTION . Ocean Fisheries Port...
11
GSJ: Volume 7, Issue 1, January 2019, Online: ISSN 2320-9186 www.globalscientificjournal.com ANALYSIS OF TUNA FISH PRODUCTION VALUE LAND- ING AT PPS NIZAM ZACHMAN JAKARTA Hana Dimas Khoironnisa 1 , Asep Agus Handaka 2 , Isni Nurruhwati 2 , Atikah Nurhayati 2 1 Student at Faculty of Fisheries and Marine Science, Padjadjaran University, Bandung – Sumedang KM. 21 Jatinangor 45363, Indonesia E-mail address: [email protected] 2 Lecturer at Faculty of Fisheries and Marine Science, Padjadjaran University, Bandung – Sumedang KM. 21 Jatinangor 45363, Indonesia E-mail address: [email protected] KeyWords Tuna, Value, Production, PPS, Nizam Zachman Jakarta, Factor, Export. ABSTRACT This study aims to analyze the value of tuna production, analyze the factors that influence the value of tuna production and the value of tuna export production landed at PPS Nizam Zachman Jakarta. The method used is the survey method and production value index analysis. The results showed that in the last five years in 2015 a value of less than 1 was obtained, that is 0.04, which means that the value of tuna production in Nizam Zachman PPS Jakarta was lower than the value of all fish produced at PPS Nizam Zachman Jakarta. Factors that influence the value of tuna production landed at Nizam Zachman PPS Jakarta, namely the frequency of tuna longline vessels that land tuna, tuna quality and fishing gear are used, while the factors that influence the value of tuna production at PPS Nizam Zachman in export to Japan, namely the exchange rate of the rupiah against the importing country's currency, used fishing gear, the quality of tuna exported, Indonesian government policies and government policies applied by importing countries. GSJ: Volume 7, Issue 1, January 2019 ISSN 2320-9186 27 GSJ© 2019 www.globalscientificjournal.com
-
Upload
truongnguyet -
Category
Documents
-
view
218 -
download
0
Transcript of ANALYSIS OF TUNA FISH PRODU TION VALUE ING AT PPS …€¦ · INTRODUTION . Ocean Fisheries Port...
GSJ: Volume 7, Issue 1, January 2019, Online: ISSN 2320-9186 www.globalscientificjournal.com
ANALYSIS OF TUNA FISH PRODUCTION VALUE LAND-ING AT PPS NIZAM ZACHMAN JAKARTA Hana Dimas Khoironnisa1, Asep Agus Handaka2, Isni Nurruhwati2, Atikah Nurhayati2
1Student at Faculty of Fisheries and Marine Science, Padjadjaran University, Bandung – Sumedang KM. 21 Jatinangor 45363, Indonesia
E-mail address: [email protected]
2Lecturer at Faculty of Fisheries and Marine Science, Padjadjaran University, Bandung – Sumedang KM. 21 Jatinangor 45363, Indonesia
E-mail address: [email protected]
KeyWords
Tuna, Value, Production, PPS, Nizam Zachman Jakarta, Factor, Export.
ABSTRACT
This study aims to analyze the value of tuna production, analyze the factors that influence the value of tuna production and the value of tuna export production landed at PPS Nizam Zachman Jakarta. The method used is the survey method and production value index analysis. The results showed that in the last five years in 2015 a value of less than 1 was obtained, that is 0.04, which means that the value of tuna production in Nizam Zachman PPS Jakarta was lower than the value of all fish produced at PPS Nizam Zachman Jakarta. Factors that influence the value of tuna production landed at Nizam Zachman PPS Jakarta, namely the frequency of tuna longline vessels that land tuna, tuna quality and fishing gear are used, while the factors that influence the value of tuna production at PPS Nizam Zachman in export to Japan, namely the exchange rate of the rupiah against the importing country's currency, used fishing gear, the quality of tuna exported, Indonesian government policies and government policies applied by importing countries.
GSJ: Volume 7, Issue 1, January 2019 ISSN 2320-9186
27
GSJ© 2019 www.globalscientificjournal.com
INTRODUCTION
Ocean Fisheries Port (PPS) Nizam Zachman Jakarta is a Technical Implementation Unit (UPT) of the Ministry of Mari-time Affairs and Fisheries which is under the scope of and responsible to the Directorate General of Capture Fisher-ies. PPS Nizam Zachman Jakarta began to be built in 1980 and was inaugurated on July 17, 1984 under the name of the Jakarta Ocean Fisheries Port (PPSJ).
In accordance with the Minister of Maritime Affairs and Fisheries Decree Number Kep.04 / Men / 2004 concerning the name change of the PPS Jakarta to become the Ocean Fisheries Port of Nizam Zachman Jakarta, the name of the Jakarta Ocean Fisheries Port (PPSJ) has changed to Ocean Fisheries Port of Nizam Zachman Jakarta (PPS Nizam Zachman Jakarta).
The fishing port is a fishery activity place that is equipped with various facilities that support activities at the port itself. The functions of fishing ports include mooring and anchoring of fishing vessels, loading and unloading, quality guidance and processing, marketing and distribution of fish, collection of catch data and fishery products, environ-mental control and others (Hutapea 2017). One of the catches obtained at the fishing port is pelagic fish, both large pelagic and small pelagic. According to Ilhamdi et al. (2016), the demand for pelagic fish continues to increase both domestically and abroad.
Tuna is one of the most desirable fishery commodities with high economic value both in export and domestic activi-ties. This can be seen in the value of tuna production in 2014 amounting to 37,456.58 tons, with details of yellow fin tuna of 20,617,442 tons and large eye tuna of 16,839,134 tons (Hutapea 2017).
In 2014, the Ministry of Maritime Affairs and Fisheries issued a policy on capture fisheries, namely the prohibition of loading and unloading in the middle of the sea or better known as transhipment. The impact of the policy regard-ing the ban on transhipment has begun to be felt at PPS Nizam Zachman Jakarta. The total fish production at Nizam Zachman's PPS in 2015 decreased by 30.67% (Directorate General of Capture Fisheries 2016). In addition, after the issuance of the transhipment ban, the frequency of ships landing at Nizam Zachman PPS also began to decline, in-cluding the frequency of landing of fish from tuna longline vessels. In 2015, the frequency of ships landing fish ex-perienced a significant decline of 1,133 units or equal to 28.27% compared to the previous year (DJPT 2016).
Tuna marketing activities at PPS Nizam Zachman Jakarta, are more focused on meeting the export market. One of the export destination countries in Nizam Zachman Jakarta PPS in meeting tuna demand is Japan. Japan is one of the main buyers of tuna from Indonesia. In 2013, exports of tuna to Japan reached US $ 170 million (Indonesia Trade Promotion Center Osaka 2016).
The value of tuna production landed at Nizam Zachman PPS is very important to know and study so that port man-agers can compare the tuna fish landed at Nizam Zachman's PPS to all marine fisheries production in Nizam Zach-man PPS Jakarta, and can know the factors that cause the ups and downs tuna production at the port and also can find out further actions that should be taken on tuna production activities after the policy of prohibiting tranship-ment.
METHODS
The research was conducted from April to January 2019 at the Ocean Fisheries Port of Nizam Zachman Jakarta which included data collection, data analysis up to the writing of the final report. The data sources used are primary data and secondary data. Primary data, namely data originating directly from the object of the research in the form of direct observation or interviews with factors that influence the value of catch production. Secondary data, name-ly data obtained through documents such as literature books, PPS Nizam Zachman Jakarta statistical books from 2013-2017, and journals relating to this research.
GSJ: Volume 7, Issue 1, January 2019 ISSN 2320-9186
28
GSJ© 2019 www.globalscientificjournal.com

The sampling technique used in this study was purposive sampling. Purposive sampling is the selection of non-random samples whose information is obtained using certain considerations which are generally tailored to the purpose or problem of the study. Respondents who were the samples of this study were enumerators at PPS Nizam Zachman Jakarta. Research methods include observation, interviews, documentation, filling in questionnaires. The analytical method used in this study is the analysis of the production value index. According to Lubis (1989) that the value of the production of catches at Fisheries Ports (PP) can be determined by comparing the value of the produc-tion of catches in a port with the value of catch production in a region and the volume of production of catches in a port with the production volume of catches in a region. Calculations are carried out for the last 5 years using the formula:
𝐼 =
𝑁𝑝 𝑥 100𝑁𝑡
𝑄𝑝 𝑥 100𝑄𝑡
Description: I = Index of relative value of production Np = Value of tuna production in PPS Nizam Zachman Jakarta (Rp.) Nt = Value of production of all fish in PPS Nizam Zachman Jakarta (Rp.) Qp = Quantity or volume of production tuna fish at PPS Nizam Zachman Jakarta (tons) Qt = Quantity or production volume all fish in the Nizam PPS Zachman Jakarta (tons) 100 = Represents a percentage of volume of fisheries production and percentage of production value
fishery. The index value obtained illustrates the relative value of a port's production against the value of national produc-tion, namely: a) The value of I = 1 then the relative value of tuna production from Nizam Zachman's PPS is the same as the val-
ue of all fish production from PPS Nizam Zachman, which also means that the average value of tuna produc-tion at the Nizam Zachman PPS is as good as the value of all fish production at PPS Nizam Zachman.
b) The value of I> 1 then the relative value of tuna production from Nizam Zachman's PPS is better than the aver-age value of all fish production at PPS Nizam Zachman which means that the value of tuna production at PPS Nizam Zachman is higher than the value of all fish production at PPS Nizam Zachman.
c) The value of I <1 then the relative value of tuna production from Nizam Zachman's PPS is lower than the aver-age value of all fish production at PPS Nizam Zachman, which means that the value of tuna production at Ni-zam Zachman PPS is lower than the value of all fish produced at PPS Nizam Zachman.
This index value can then be presented in the form of a graph of the index or can be found in the percentage of production volume and the percentage of production value for several years.
RESULT AND DISCUSSION Distribution of tuna markets in PPS Nizam Zachman Jakarta
The tuna export market mechanism at Nizam Zachman's PPS (Figure 1) is the route that was passed in the market-ing process from starting fish landed on the dock via the tuna longline ship. Tuna landed at PPS Nizam Zachman Jakarta, was arrested by ABK who had been employed by boat owners / ship owners. Therefore, all catches in the form of tuna caught after being landed, will be brought directly by several companies (consumers). Each company already has a quota for the entry of frozen tuna because this system of fulfilling the quota caught tuna must meet the domestic quota first, then if there are remaining tuna fish shipped for export activities.
Tuna occupies the second position in fish production in PPS Nizam Zahman Jakarta, while in the first position is skip-jack. The fishing gear used in tuna fishing activities is dominated by longline tuna fishing, purse seine, and stretching fishing rods. Tuna caught in fresh (fresh) form in its marketing, when landed at the port dock will be directly han-dled and packaged in TLC to be directly flown to the importing country so that the quality of fish is maintained
GSJ: Volume 7, Issue 1, January 2019 ISSN 2320-9186
29
GSJ© 2019 www.globalscientificjournal.com
through the airport. Tuna fish that do not meet export requirements such as the presence of abrasions or missing parts, will be marketed domestically at a price lower than the export price to be made into various processed fish-ery products.
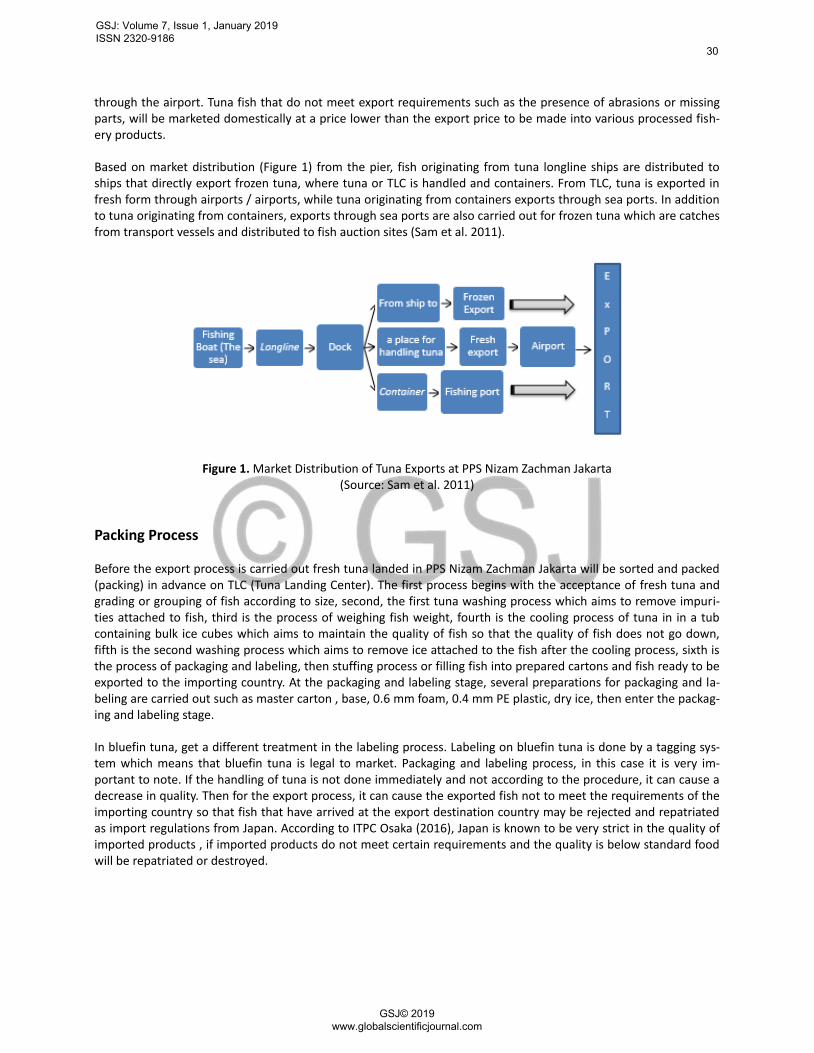
Based on market distribution (Figure 1) from the pier, fish originating from tuna longline ships are distributed to ships that directly export frozen tuna, where tuna or TLC is handled and containers. From TLC, tuna is exported in fresh form through airports / airports, while tuna originating from containers exports through sea ports. In addition to tuna originating from containers, exports through sea ports are also carried out for frozen tuna which are catches from transport vessels and distributed to fish auction sites (Sam et al. 2011).
Figure 1. Market Distribution of Tuna Exports at PPS Nizam Zachman Jakarta (Source: Sam et al. 2011)
Packing Process
Before the export process is carried out fresh tuna landed in PPS Nizam Zachman Jakarta will be sorted and packed (packing) in advance on TLC (Tuna Landing Center). The first process begins with the acceptance of fresh tuna and grading or grouping of fish according to size, second, the first tuna washing process which aims to remove impuri-ties attached to fish, third is the process of weighing fish weight, fourth is the cooling process of tuna in in a tub containing bulk ice cubes which aims to maintain the quality of fish so that the quality of fish does not go down, fifth is the second washing process which aims to remove ice attached to the fish after the cooling process, sixth is the process of packaging and labeling, then stuffing process or filling fish into prepared cartons and fish ready to be exported to the importing country. At the packaging and labeling stage, several preparations for packaging and la-beling are carried out such as master carton , base, 0.6 mm foam, 0.4 mm PE plastic, dry ice, then enter the packag-ing and labeling stage.
In bluefin tuna, get a different treatment in the labeling process. Labeling on bluefin tuna is done by a tagging sys-tem which means that bluefin tuna is legal to market. Packaging and labeling process, in this case it is very im-portant to note. If the handling of tuna is not done immediately and not according to the procedure, it can cause a decrease in quality. Then for the export process, it can cause the exported fish not to meet the requirements of the importing country so that fish that have arrived at the export destination country may be rejected and repatriated as import regulations from Japan. According to ITPC Osaka (2016), Japan is known to be very strict in the quality of imported products , if imported products do not meet certain requirements and the quality is below standard food will be repatriated or destroyed.
GSJ: Volume 7, Issue 1, January 2019 ISSN 2320-9186
30
GSJ© 2019 www.globalscientificjournal.com
Export Tuna Distribution
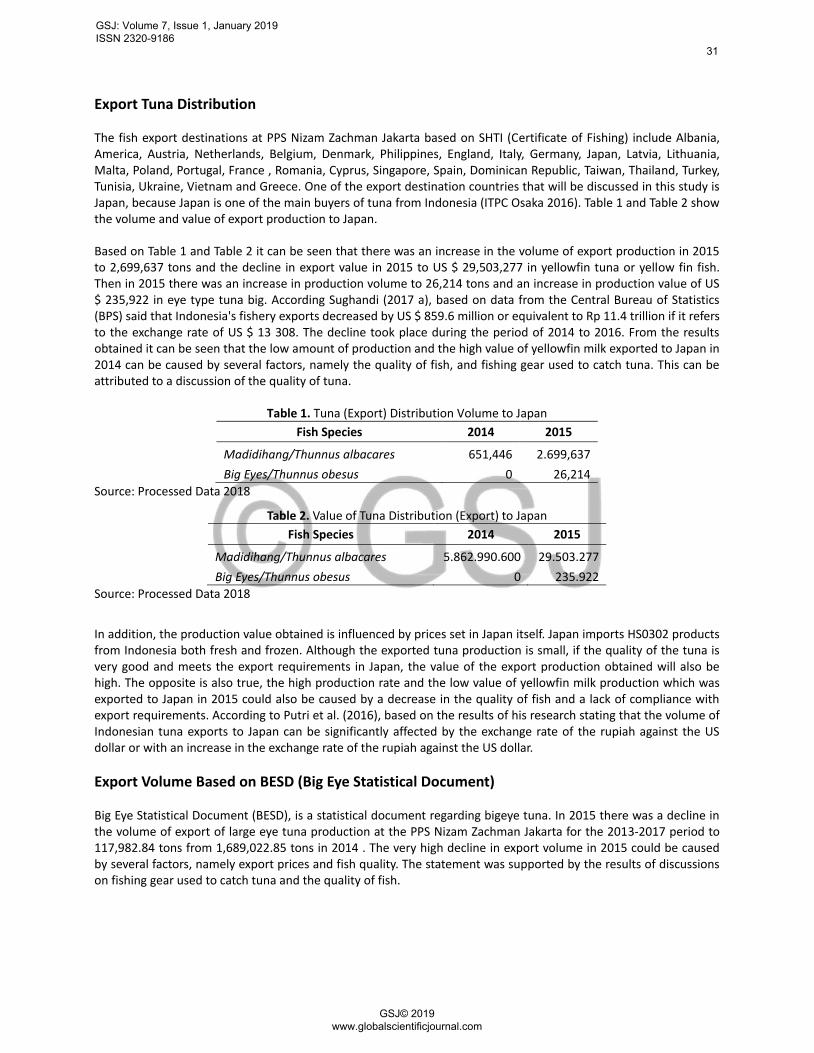
The fish export destinations at PPS Nizam Zachman Jakarta based on SHTI (Certificate of Fishing) include Albania, America, Austria, Netherlands, Belgium, Denmark, Philippines, England, Italy, Germany, Japan, Latvia, Lithuania, Malta, Poland, Portugal, France , Romania, Cyprus, Singapore, Spain, Dominican Republic, Taiwan, Thailand, Turkey, Tunisia, Ukraine, Vietnam and Greece. One of the export destination countries that will be discussed in this study is Japan, because Japan is one of the main buyers of tuna from Indonesia (ITPC Osaka 2016). Table 1 and Table 2 show the volume and value of export production to Japan.
Based on Table 1 and Table 2 it can be seen that there was an increase in the volume of export production in 2015 to 2,699,637 tons and the decline in export value in 2015 to US $ 29,503,277 in yellowfin tuna or yellow fin fish. Then in 2015 there was an increase in production volume to 26,214 tons and an increase in production value of US $ 235,922 in eye type tuna big. According Sughandi (2017 a), based on data from the Central Bureau of Statistics (BPS) said that Indonesia's fishery exports decreased by US $ 859.6 million or equivalent to Rp 11.4 trillion if it refers to the exchange rate of US $ 13 308. The decline took place during the period of 2014 to 2016. From the results obtained it can be seen that the low amount of production and the high value of yellowfin milk exported to Japan in 2014 can be caused by several factors, namely the quality of fish, and fishing gear used to catch tuna. This can be attributed to a discussion of the quality of tuna.
Table 1. Tuna (Export) Distribution Volume to Japan
Fish Species 2014 2015
Madidihang/Thunnus albacares 651,446 2.699,637
Big Eyes/Thunnus obesus 0 26,214
Source: Processed Data 2018
Table 2. Value of Tuna Distribution (Export) to Japan
Fish Species 2014 2015
Madidihang/Thunnus albacares 5.862.990.600 29.503.277
Big Eyes/Thunnus obesus 0 235.922
Source: Processed Data 2018
In addition, the production value obtained is influenced by prices set in Japan itself. Japan imports HS0302 products from Indonesia both fresh and frozen. Although the exported tuna production is small, if the quality of the tuna is very good and meets the export requirements in Japan, the value of the export production obtained will also be high. The opposite is also true, the high production rate and the low value of yellowfin milk production which was exported to Japan in 2015 could also be caused by a decrease in the quality of fish and a lack of compliance with export requirements. According to Putri et al. (2016), based on the results of his research stating that the volume of Indonesian tuna exports to Japan can be significantly affected by the exchange rate of the rupiah against the US dollar or with an increase in the exchange rate of the rupiah against the US dollar.
Export Volume Based on BESD (Big Eye Statistical Document)
Big Eye Statistical Document (BESD), is a statistical document regarding bigeye tuna. In 2015 there was a decline in the volume of export of large eye tuna production at the PPS Nizam Zachman Jakarta for the 2013-2017 period to 117,982.84 tons from 1,689,022.85 tons in 2014 . The very high decline in export volume in 2015 could be caused by several factors, namely export prices and fish quality. The statement was supported by the results of discussions on fishing gear used to catch tuna and the quality of fish.
GSJ: Volume 7, Issue 1, January 2019 ISSN 2320-9186
31
GSJ© 2019 www.globalscientificjournal.com
Determination of the price of tuna
One of the countries that most import tuna from Indonesia is Japan. According to the source, based on the results of the interview, that the export of tuna in the PPS Nizam Zachman was dominated by Japan. In trading tuna activi-ties in the Japanese country, payment systems and the pricing determined at the time already landed in the market tuna fish auction and sold to the buyer by the auctioneer. Before determining the price to the buyer , the auc-tioneer will ask the exporter whether the specified price is appropriate for the tuna to be sold or not. To get a high selling price, exporters must be more selective in choosing the auctioneers on the Japanese market . This is in ac-cordance with the explanation from ITPC Osaka (2016) which states that the system for purchasing products from Indonesia in Japan is carried out through an auction or auction system .
The auction is through an auctioneer (auctioner) that notifies the fair price of an item and provides an upper and lower limit on the price of the product. The highest selling value of tuna from Indonesia in Japan costs up to 2,000 yen / kg or equivalent to Rp 214,000 / kg and the lowest is 900 yen / kg or equivalent to Rp 96,300 / kg. Tuna from Indonesia exported to Japan usually measures 25 kg (ITPC Osaka 2016).
Identification of Factors Affecting Tuna Production Value Marine Production According to Fishing Gear
The origin of fish production that goes into PPS Nizam Zachman Jakarta by sea is from Bouke Ami fishing gear, Hu-hate, Jala Falling Ship, Gill Net, Squid Fishing Line, Ulur Fishing Line, Pukat Cincin, Tuna Rawai, Transport Ships and other fishing equipment. In this discussion, fishing tools are analyzed in tuna production is only longline tuna and purse seine . Based on the results obtained, the volume of marine production according to fishing gear in 2014-2015 tuna production from tuna longline fishing equipment decreased by 1.09% and 57.68%, and increased in 2016-2017 by 28.89% and 28 , 73%. Whereas in 2014 the trawl fishing gear increased in 2014 and 2017 by 14.33% and 37.63%, and the decline in 2015-2016 was 15.47% and 23.08%. It can be seen that the dominating factor in tuna fishing in the period 2013-2017 is purse seine. After the 2014 transhipment ban was issued , it affected 2015 longline tuna production which decreased by half the production volume in 2014, which was 57.68%. These results are in accordance with previous studies by Hudayana and Utami (2017), namely in 2014 the volume of yellow fin tuna was 20,617 tons, then a decrease in the volume of yellow fin tuna in 2015 was 8,645 tons to 11,972 tons or a decrease of 27%. In 2014 the volume of big eye tuna was 16,839, then in 2015 it decreased by 8,292 tons to 8,547 tons or a decrease of 33%. One of the reasons for the decline in marine production in 2015 was due to the issuance of a new policy on capture fisheries . The new regulation issued is Permen KP Number 57/Permen-KP/ 2014. This regulation contains rules re-garding the Prohibition of Fish Landing from the Catch of Fishing Vessels through Transhipment in the Sea. Tran-shipment activities are very well applied to fishing activities with longline tuna fishing equipment because they can prolong the trip time in tuna fishing activities, maintain the quality of fish quality for export, obtain more produc-tion results and can meet operational costs. Tuna is not HTU (Main Catch) from purse seine . Purse seine captures more HTS (by-products) compared to HTU. This is supported by the results of previous research conducted by the Minister of Religion on the Selective Selectiv-ity of the Seine Purse at the Muara Angke Fish Landing Base (PPI) Jakarta. According to Pamenan et al. (2016), that purse seines catch a lot of fish by- catch, it can be seen from the weight of the by-catch catch amounting to 7,153 kg (78.7%) of the total catch and the number of by-catches is 64,292 (84.7%). Based on sources from respondents, currently the production of fresh tuna is decreasing and tuna production which is currently increasing is the production of baby tuna or tuna babies which are then frozen. According to Sughandi (2017b), stated that in 2016 and 2017 purse seine fishing devices still dominated. In fact, according to environmen-tal organization Greenpeace , purse seine is not sustainable because it can catch babies of yellowfin or big eye tuna . In addition, to maintain the sustainability of tuna in the future, efforts to control fishing by limiting the number of catching units and fishing gear such as purse seine used to catch tuna are very necessary. According to Nurhayati (2012), actions that are controlling the arrest effort are those that are oriented towards the future by limiting the
GSJ: Volume 7, Issue 1, January 2019 ISSN 2320-9186
32
GSJ© 2019 www.globalscientificjournal.com
number of fishing units through restrictions on permits issued, limiting the number of fishing units.
Quality Based Sea Production
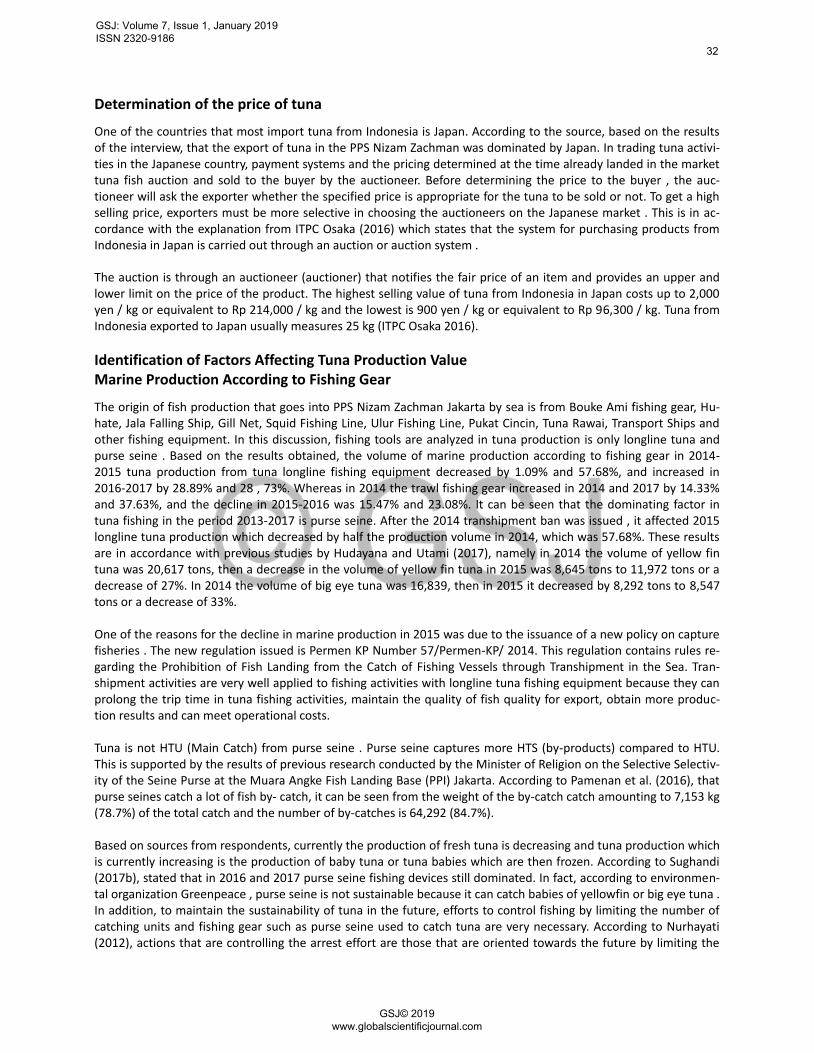
Tuna is classified into 3 quality criteria, namely one quality, two quality and three quality. In addition to the length of the trip , transhipment restrictions and the use of fishing gear instead of tuna long lines also affect the decline in tuna quality. Based on the results in Figure 2 , it shows that in the period 2013-2017, tuna at one quality was the highest at 22076.378 tons in 2014. In 2015-2017 fish with one quality decreased by 44.91%, 12.13% and 59.73%, which means the quality of fish decreases. In 2017 fish at quality two dominated and exceeded the amount of pro-duction in fish with one quality which was equal to 23231,461 tons, while quality one fish drastically declined from 2016 which was 59.73% or 4302,345 tons. The decline in the quality of tuna causes the production of tuna to meet export demand also decreases, as a result of the tuna selling price obtained by shipowners decreases with the tran-sition of sales to the local market. According to Hudayana and Utami (2017), said that within a maximum period of 8 hours - 2 weeks tuna longline vessels must race to land their catches to meet the classification of tuna eligible for export. If you pass 2 weeks, you have to freeze your catch and reduce the sale value.
Figure 2. Production Volume Based on Quality
(Source: Processed Data 2018)
When associated with the fishing gear used, the decline in fish quality can be caused by the use of reduced longline tuna fishing equipment which causes tuna fish caught not to come from tuna longline fishing gear but instead from other fishing gear such as ring trawls . Ring trawls are less selective in fishing operations for tuna species because the construction of trawl fishing gear which is included in the net fishing gear, is less environmentally friendly and unsustainable which causes caught tuna to be caught in abrasion conditions even to the presence of missing parts of fish.
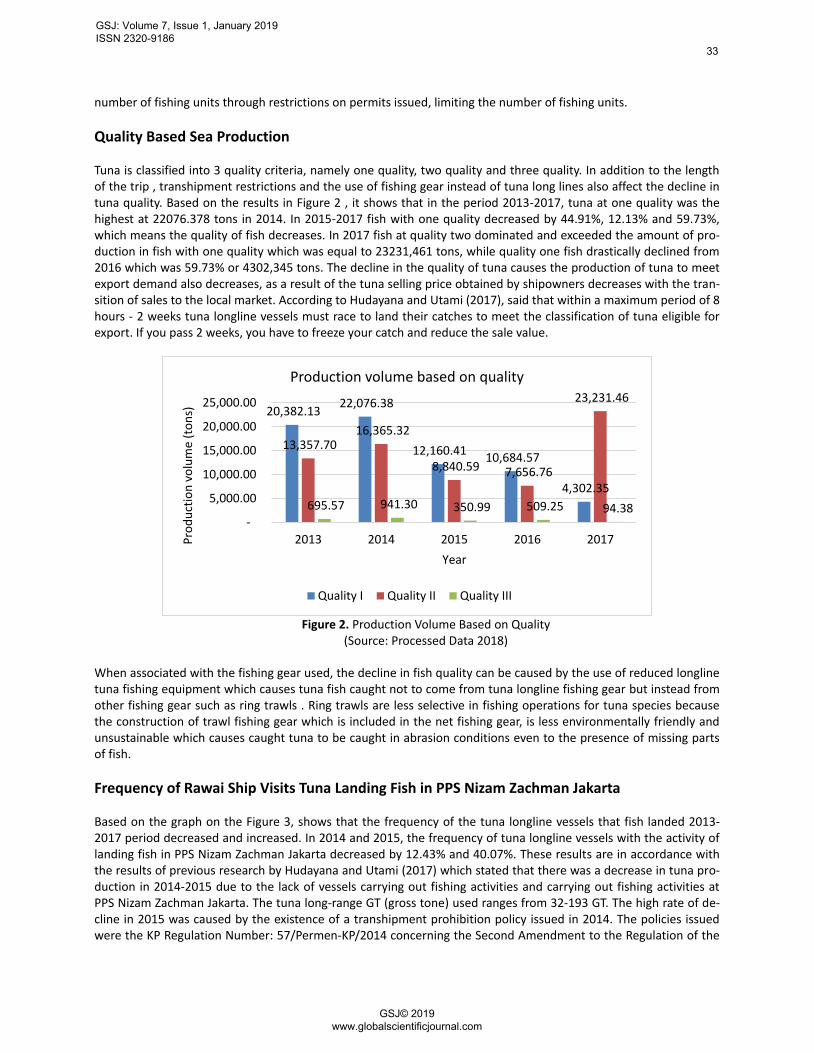
Frequency of Rawai Ship Visits Tuna Landing Fish in PPS Nizam Zachman Jakarta
Based on the graph on the Figure 3, shows that the frequency of the tuna longline vessels that fish landed 2013-2017 period decreased and increased. In 2014 and 2015, the frequency of tuna longline vessels with the activity of landing fish in PPS Nizam Zachman Jakarta decreased by 12.43% and 40.07%. These results are in accordance with the results of previous research by Hudayana and Utami (2017) which stated that there was a decrease in tuna pro-duction in 2014-2015 due to the lack of vessels carrying out fishing activities and carrying out fishing activities at PPS Nizam Zachman Jakarta. The tuna long-range GT (gross tone) used ranges from 32-193 GT. The high rate of de-cline in 2015 was caused by the existence of a transhipment prohibition policy issued in 2014. The policies issued were the KP Regulation Number: 57/Permen-KP/2014 concerning the Second Amendment to the Regulation of the
20,382.13 22,076.38
12,160.41 10,684.57
4,302.35
13,357.70 16,365.32
8,840.59 7,656.76
23,231.46
695.57 941.30 350.99 509.25 94.38 -
5,000.00
10,000.00
15,000.00
20,000.00
25,000.00
2013 2014 2015 2016 2017Pro
du
ctio
n v
olu
me
(to
ns)
Year
Production volume based on quality
Quality I Quality II Quality III
GSJ: Volume 7, Issue 1, January 2019 ISSN 2320-9186
33
GSJ© 2019 www.globalscientificjournal.com

Minister of Marine and Fisheries Number: Per.30/Men/2012 concerning Capture Fisheries in the Fisheries Man-agement Region of the Republic of Indonesia. The existence of a policy regarding the prohibition of transhipment has a major influence on the sustainability of the use of longline tuna fishing equipment in Indonesia, because de-clining tuna production results in the use of longline fishing gear tuna also decreases. The decrease in the frequency of tuna longline vessels that landed fish in the PPSNZJ was caused by the high operational costs that have not been covered by the tuna longline catches obtained so that many fishermen who previously used the tuna longline ves-sels, turned to other fishing gear. Therefore, ships whose operational costs do not return capital only rely on the port. Based on previous research by Hudayana and Utami (2017) mentioning that before the enactment of Ministe-rial Regulation No. 57 of 2014, the majority of tuna longline vessels have a trip period of 6 to 12 months that landed fish with the help of collecting vessels up to 2 to 3 times, while after the implementation of the trip period only around 2-4 months. The decrease in the number of tuna longline vessels is due to the high operational costs that are not covered after the arrest operation.
In addition, the frequency of declining tuna longships also caused a reduction in TLC operating at PPS Nizam Zachman Jakarta. According to sources from respondents, TLC in PPSNZJ originally amounted to 30 TLC, but until now the ones who are still actively operating are only around 3-4 TLC, the rest are underutilized for tuna industrial activities so that they are converted into warehouses.
Figure 3. Frequency of tuna longline vessels that land fish in PPSNZJ
(Source: Processed Data 2018)
Production of Sea-Based Tuna at PPS Nizam Zachman Jakarta
The volume and value of tuna production from the sea lane has fluctuated up and down in the period 2013-2017. According to sources from interviews with respondents, production in PPSNZJ was dominated by skipjack tuna, fol-lowed by yellow fin tuna, big eyes, albakor and bluefin tuna. In this study, the data of tuna fish processed were al-bakor tuna, yellow fin tuna, and big eye tuna. Based on the results obtained, it was shown that tuna production at PPS Nizam Zachman Jakarta experienced an increase in production after the issuance of a prohibition on tranship-ment but experienced a decline in production value after the issuance of a ban on transhipment. In 2015 there was an increase in the highest tuna production with an increase in the number of production by 149.53% and a drastic decline in 2016 of 85.75% , while the value of production in 2015 was 92.77%. In the produc-tion and value of tuna production in 2015, the result is inversely proportional. Many factors affecting the value of tuna production declined in 2015. When associated with the previous discussion about the volume of tuna produc-tion based on fishing gear, it is clear that this decline was caused by the decline in use of tuna longline vessels after the issuance of the transhipment ban policy . Based on previous research conducted by Hudayana and Utami (2017), mentioning that before the implementation of the transhipment ban , longline tuna vessels over 50 GT with a range of 50-70 tons could produce 100 tons of fish per trip , while after the ban on transhipment, the results the catch obtained is only according to the hold area. The tuna longline vessels have not carried out transhipment activities after the transhipment ban was issued. As a result, the quality of fish quality and fish prices have decreased, because the length of tuna longline trips while op-
587 514
308 364 380
0
200
400
600
800
2013 2014 2015 2016 2017
Tim
es
Year
Frequency of tuna longline vessels that land fish in PPSNZJ
GSJ: Volume 7, Issue 1, January 2019 ISSN 2320-9186
34
GSJ© 2019 www.globalscientificjournal.com

erating at sea so that tuna do not get immediate treatment on land. According to Sughandi (2017c), the policy cur-rently implemented by the Minister of Maritime Affairs and Fisheries is too focused on tuna conservation and the waters where tuna populations live, but forgets the empowerment of fishermen and business actors fisheries which have been dependent on tuna fishing. This can increase unemployment. A limitation of input on the characteristics of fisheries and Indonesian fishermen will have an impact on the number of unemployed which results in potential conflicts and social instability (Anna et al. 2017).
Analysis of Tuna Production Value Index
Analysis of the index of production value is obtained by comparing the value of the production of catches in a port with the value of production of catches in an area, and the volume of production of catches in a port with the vol-ume of production of catches in a region. The relative index of tuna fish production value in PPS Nizam Zachman Jakarta was obtained from the comparison between the volume and value of tuna production in PPS Nizam Zach-man Jakarta with the volume and value of all fish production at PPS Nizam Zachman Jakarta for 5 years, from 2013-2017 (Table 3). Based on the results in Table 3 showed that in 2013, 2014, 2016 and 2017 the relative index of tuna fish production value in PPS Nizam Zachman Jakarta showed more than Figure 1, which meant that the value of tuna production at Nizam Zachman's PPS was higher than the value of all fish production at PPS Nizam Zachman Jakarta . Whereas in 2015 showed a value of less than 1 which is equal to 0.04, which means that the value of tuna production in PPS Nizam Zachman Jakarta is lower than the value of all fish production at PPS Nizam Zachman Jakarta. The results of previous studies conducted by An Najah et al (2015), stated that in 2012 the volume of catches at the PPS Nizam Zachman Jakarta decreased, but the value of the catch did not decrease, this was due to Fish production in PPS Ni-zam Zachman is dominated by economically important fish. 2015 was a year of beginning of the implementation of fisheries policies issued in 2014 on a moratorium ship e ks foreigners and ban transhipment. This greatly affects the value of tuna production at the PPS Nizam Zachman Jakarta which shows that there has been a drastic decline in the value of production. According to the Directorate General of Capture Fisheries (2016), in 2015 skipjack fish be-come the most type of fish with a percentage of 34.64% of the total catch type landed in PPSNZJ, then followed by squid with a percentage of 14.51%, yellow fin tuna 13.63%, 12.07% flyovers and bigeye tuna 9,73%. It can be seen that tuna is in the third and fifth position in 2015, whereas in 2013 tuna production was in the second position (DJPT 2014), so in 2014 tuna production was also in second place (DJPT 2015).
Table 3. Production Value Index for Tuna from Catches in PPS Nizam Zachman Jakarta for the 2013-2017 Period
Year Qp/Qt x 100% Np/Nt x 100% Production Value Index
2013 30.38160673 47.83006253 1.574309843
2014 32.92809281 56.54538142 1.717238279
2015 111.8704536 5.28076974 0.047204329
2016 18.28664197 41.02455914 2.243416763
2017 31.94680636 35.04376637 1.096941146
Source: Processed Data 2018
The relationship between the production value index and the factors that influence it, can use multiple linear re-gression analysis. Based on the multiple linear analysis, the result coefficient of determination (R2) of 0.494, which means 49.4% variabe l index value of tuna production in PPS Nizam Zachman Jakarta is affected by the variable vol-ume of production, production value, and the fishing gear, while the remaining 50, 6% of the variable value of tuna fish production index in PPS Nizam Zachman Jakarta is influenced by other variables not discussed in this study. Ac-cording Nurhayati (2013), explains that n use values of determination or R square is used to measure the goodness of fit from the regression model and to compare the validity of the results of regression to the variabe l dependent on the model, in which the greater the value of R square indicates that the model is getting better. Fishing gear is one of the variables that affect the production value index. This can be seen from the number of tuna longline ves-sels that landed fish in PPS Nizam Zachman Jakarta using tuna longline fishing gear with different GT sizes. In ac-
GSJ: Volume 7, Issue 1, January 2019 ISSN 2320-9186
35
GSJ© 2019 www.globalscientificjournal.com

cordance with the results of a study conducted by Suryana et al. (2013), that the size of fishing vessels (GT) signifi-cantly affects the number of catches. The bigger the GT of the ship, the greater the number of catches.
CONCLUSIONS
The conclusions obtained from this study, namely the analysis of the production value index in the last five years showed that in 2015 a value of less than 1 was obtained, namely 0.04, which means the value of tuna fish produc-tion in Nizam Zachman PPS Jakarta was lower than the production value of all fish in PPS Nizam Zachman Jakarta. Factors influencing the value of tuna production landed at Nizam Zachman PPS Jakarta, namely the frequency of tuna longline vessels that landed fish, the quality of tuna and fishing equipment used, while the factors that influ-enced the value of tuna production at PPS Nizam Zachman in exporting to Japan , namely the exchange rate of the rupiah against the importing country's currency, used fishing gear, the quality of tuna exported, Indonesian gov-ernment policies and government policies applied by the importing country.
Acknowledgment
We would like to thank Faculty of Marine Science, Universitas Padjadjaran, Indonesia for making this research
possible
References
[1] An Najah, R., E. Lubis, I. Solihin, A. B. Pane. 2015. Kajian Nilai Pasar Produksi Hasil Tangkapan di PPS Nizam Zachman dan
PPI Muara Angke. Marine Fisheries, 6 (2): 155-167.
[2] Anna, Z., A. A. H. Suryana, I. Maulina, A. Rizal, P. Hindayani. 2017. Biological parameters of fish stock estimation in Cirata
Reservoir (West Java, Indonesia): A comparative analysis of bio-economic models. Biodiveristas, 18 (4): 1468-1474.
[3] [DJPT] Direktorat Jenderal Perikanan Tangkap. 2014. Buku Statistik Pelabuhan Perikanan Samudera Nizam Zachman
Jakarta 2013. Kementerian Kelautan dan Perikanan. Jakarta. 130 hlm.
[4] [DJPT] Direktorat Jenderal Perikanan Tangkap. 2015. Buku Statistik Pelabuhan Perikanan Samudera Nizam Zachman
Jakarta 2014. Kementerian Kelautan dan Perikanan. Jakarta. 256 hlm.
[5] Direktorat Jenderal Perikanan Tangkap. 2016. Buku Statistik Pelabuhan Perikanan Samudera Nizam Zachman Jakarta 2015.
Kementerian Kelautan dan Perikanan. Jakarta. 258 hlm.
[6] Hudayana, A., dan T. N. Utami. 2017. Analisis Kebijakan Larangan Transhipment (Alih Muat) Tangkapan Perikanan
Terhadap Kinerja Usaha Penangkapan Ikan Kapal Longline (Studi Kasus Pelabuhan Perikanan Samudera Nizam Zachman
DKI Jakarta). Journal of Economic and Social of Fisheries and Marine, 5 (1): 78-79.
[7] Hutapea, R. Y. F. 2017. Peran Pelabuhan Perikanan Samudera Nizam Zachman Jakarta dalam Mendukung Industri
Perikanan Tuna. Tesis. Program Studi Teknologi Perikanan Laut. Institut Pertanian Bogor. Bogor. 94 hlm.
[8] Ilhamdi. H., R. Telussa, D. Ernanigsih. 2016. Analisis Tingkat Pemanfaatan dan Musim Penangkapan Ikan Pelagis di
Perairan Prigi Jawa Timur. Jurnal Ilmiah Satya Mina Bahari, 1 (1): 52-64.
[9] ITPC Osaka. 2016. Market Intlligence: HS0302 Fish Fresh or Chilled. 52 hlm.
[10] Lubis E. 1989. L’organisation Et L’ Aménagement Des Ports De Peche Indonesiens-Comparison Avec L’Organisation Et L’
Aménagement Des Ports De Peche Français et Européens. Disertasi. Perancis (EU): Universitas Nantes.
[11] Nurhayati, A. 2012. Analisis Kebijakan Pemerintah Daerah dalam Mendukung Tingkat Keberlanjutan Sumber Daya
Perikanan (Studi Kasus di Kawasan Pangandaran, Kabupaten Ciamis). Jurnal Kebijakan Sosial Ekonomi dan Perikanan, 2(2):
163-173.
[12] Nurhayati, A. 2013. Analisis Potensi Lestari Perikanan Tangkap di Kawasan Pangandaran. Jurnal Akuatika, 4 (2): 195-209.
GSJ: Volume 7, Issue 1, January 2019 ISSN 2320-9186
36
GSJ© 2019 www.globalscientificjournal.com
[13] Pamenan, A. R., Sunarto, I. Nurruhwati. 2016. Selektivitas Alat Tangkap Purse Seine di Pangkalan Pendaratan Ikan (PPI)
Muara Angke Jakarta. Jurnal Perikanan Kelautan, 7 (2): 97-102.
[14] Sam, A. R., S. H. Wisudo, B. Murdiyanto, B. H. Iskandar. 2011. Strategi Pengembangan Pelabuhan Perikanan Samudera
Nizam Zachman Jakarta (PPSNZJ) Sebagai Pusat Pemasaran Perikanan. Jurnal Marine Fisheries, 2(2): 129-139.
[15] Sughandi, H. 2017a. Penurunan Ekspor Perikanan Indonesia Capai Rp11 Triliun. http://astuin.org/content/penurunan-
ekspor-perikanan-indonesia-capai-rp11-triliun. Diakses tanggal 8 Oktober 2018 pukul 13:42 WIB.
[16] Sughandi, H. 2017b. Pengusaha Tuna Minta Pemerintah Adil Terhadap Industri. http://astuin.org/content/pengusaha-tuna-
minta-pemerintah-adil-terhadap-industri. Diakses tanggal 8 Oktober 2018 pukul 13:20 WIB.
[17] Sughandi, H. 2017c. Menelusuri Keberadaan Tuna yang Terancam Punah di Indonesia. http://astuin.org/content/menelusuri-
keberadaan-tuna-yang-terancam-punah-di-Indonesia. Diakses tanggal 8 Oktober 2018 pukul 13:15 WIB.
[18] Suryana, S. A., I. P. Rahardjo, Sukandar. 2013. Pengaruh Panjang Jaring, Ukuran Kapal, PK Mesin dan Jumlah ABK terhadap
Produksi Ikan pada Alat Tangkap Purse Seine di Perairan Prigi Kabupaten Trenggalek, Jawa Timur. Jurnal Mahasiswa
Pemanfaatan Sumberdaya Perikanan dan Kelautan, 1 (1): 36-43.
GSJ: Volume 7, Issue 1, January 2019 ISSN 2320-9186
37
GSJ© 2019 www.globalscientificjournal.com