Analysis of Three Different Regression Models to Estimate ... · February 2011 U.S. Department of...
51
NISTIR 7760 Analysis of Three Different Regression Models to Estimate the Ballistic Performance of New and Environmentally Conditioned Body Armor Diane Mauchant, Kirk D. Rice, Michael A. Riley, Dennis Leber, Daniel Samarov, and Amanda L. Forster x -6 -4 -2 0 2 4 6 Probability 0.0 0.1 0.2 0.3 0.4 0.5 Standard Extreme Value Distribution (Type I) Standard Normal Distribution Standard Logistic Distribution
-
Upload
trinhxuyen -
Category
Documents
-
view
214 -
download
0
Transcript of Analysis of Three Different Regression Models to Estimate ... · February 2011 U.S. Department of...
NISTIR 7760
Analysis of Three Different Regression
Models to Estimate the Ballistic
Performance of New and Environmentally
Conditioned Body Armor
Diane Mauchant, Kirk D. Rice, Michael A. Riley, Dennis Leber,
Daniel Samarov, and Amanda L. Forster
x
-6 -4 -2 0 2 4 6
Pro
babi
lity
0.0
0.1
0.2
0.3
0.4
0.5
Standard Extreme Value Distribution (Type I)Standard Normal Distribution Standard Logistic Distribution


NISTIR 7760
Analysis of Three Different Regression
Models to Estimate the Ballistic
Performance of New and Environmentally
Conditioned Body Armor
Diane Mauchant, Michael A. Riley,
Kirk D. Rice, and Amanda L. Forster
Law Enforcement Standards Office
Special Programs Office
Dennis Leber and Daniel Samarov
Statistical Engineering Division
Information Technology Laboratory
February 2011
U.S. Department of CommerceGary Locke, Secretary
National Institute of Standards and TechnologyPatrick D. Gallagher, Director

Abstract
The performance standard for ballistic-resistant body armor published bythe National Institute of Justice (NIJ), NIJ Standard–0101.06, recommendsestimating the perforation performance of body armor by performing a sta-tistical analysis on V50 ballistic limit testing data. The logistic regressionmodel is the statistical regression model recommended in the NIJ standard,but depending on the armor system and the amount of ballistic data col-lected for that system, other regression models may be more appropriate.Thus, the first objective of this study is to evaluate and compare the esti-mates of the performance provided by different statistical methods appliedto ballistic data generated in the laboratory. Three different distributionmodels that are able to describe the relationship between the projectile ve-locity and the probability of perforation are considered: the logistic, theprobit and the complementary log-log response models. In this work, eachregression model will be discussed and applied to the ballistic limit data,using the method of maximum likelihood to estimate regression parameters.Then the model estimation results will be compared and evaluated. Differentcriteria for assessing the goodness-of-fit for each model will be investigatedto identify criteria that can best distinguish which regression method pro-duces the most accurate estimate of the performance of a particular armormodel and to understand how an armor model’s performance changes asit ages, either through field or laboratory aging. A secondary objective ofthis study is to apply the different methods to a new body armor modelwith unusual ballistic limit results, leading one to suspect that it may notbe best described by a symmetric model, to determine if this data can bebetter fitted by a model other than the logistic model.
v

Analysis of Regression Models to Estimate the Ballistic
Performance of Body Armor
This page intentionally left blank.
vi
Acknowledgments
Financial support for this research effort was provided by the National In-stitute of Justice under Interagency Agreement Numbers 2003-IJ-R-029 and2008-DN-R-121. Their support is gratefully acknowledged.
vii

Analysis of Regression Models to Estimate the Ballistic
Performance of Body Armor
This page intentionally left blank.
viii

Disclaimer
Certain commercial equipment, instruments, or materials are identified inthis paper in order to specify the experimental procedure adequately. Suchidentification is not intended to imply recommendation or endorsement bythe National Institute of Standards and Technology, nor is it intended toimply that the materials or equipment identified are necessarily the bestavailable for this purpose.
ix

Analysis of Regression Models to Estimate the Ballistic
Performance of Body Armor
This page intentionally left blank.
x
Contents
1 Introduction 1
2 V50 Ballistic Limit Data Analysis 32.1 Experimental . . . . . . . . . . . . . . . . . . . . . . . . . . . 32.2 The Regression Models . . . . . . . . . . . . . . . . . . . . . . 4
2.2.1 Background . . . . . . . . . . . . . . . . . . . . . . . . 42.2.2 Presentation of the Three GLMs . . . . . . . . . . . . 5
2.3 Application of the Different Models to Fit V50 . . . . . . . . . 72.3.1 R Software . . . . . . . . . . . . . . . . . . . . . . . . 72.3.2 Comparison of the GLM Estimates . . . . . . . . . . . 8
3 Generalized Linear Model Estimation Evaluation 133.1 Assessment Criteria . . . . . . . . . . . . . . . . . . . . . . . 13
3.1.1 Akaike’s Information Criterion . . . . . . . . . . . . . 133.1.2 Log-Likelihood . . . . . . . . . . . . . . . . . . . . . . 143.1.3 Deviance of the Model . . . . . . . . . . . . . . . . . . 143.1.4 Prediction Error Rate . . . . . . . . . . . . . . . . . . 143.1.5 Cross-Validation Method . . . . . . . . . . . . . . . . 14
3.2 Model Diagnostics Results . . . . . . . . . . . . . . . . . . . . 153.3 Results of Theoretical Analysis . . . . . . . . . . . . . . . . . 16
4 Application to New and Conditioned Armor Analysis 174.1 Armor Comparison . . . . . . . . . . . . . . . . . . . . . . . . 174.2 Model Selection . . . . . . . . . . . . . . . . . . . . . . . . . . 194.3 Summary . . . . . . . . . . . . . . . . . . . . . . . . . . . . . 20
5 Application of the GLMs to an Unusual Data Set 215.1 Global Analysis of the Armor . . . . . . . . . . . . . . . . . . 215.2 Examination of the Armor Data by Panel . . . . . . . . . . . 25
5.2.1 Estimation of Individual Panel V50s . . . . . . . . . . 255.2.2 Bullet Fragmentation Phenomenon . . . . . . . . . . . 26
5.3 Effect of Alternative Data Sampling . . . . . . . . . . . . . . 285.3.1 Effect of Panel B Back . . . . . . . . . . . . . . . . . . 285.3.2 Effect of Shots with Velocities above 541 m/s . . . . . 28
6 Summary and Conclusions 31
7 References 33
xi

Analysis of Regression Models to Estimate the Ballistic
Performance of Body Armor
This page intentionally left blank.
xii
List of Tables
2.1 Comparison of distributions. . . . . . . . . . . . . . . . . . . . 82.2 Summary of estimates for new UD-PPTA body armor. . . . . 10
3.1 V50 estimates and selection criteria for new UD-PPTA armor. 15
4.1 The best models for new and conditioned PBO armors. . . . 20
5.1 Summary of estimates for a new hybrid body armor. . . . . . 235.2 Summary of selection criteria for a new hybrid body armor. . 245.3 V50 estimates for each armor panel. . . . . . . . . . . . . . . . 265.4 Results, excluding Panel B Back. . . . . . . . . . . . . . . . . 285.5 Results, excluding shots above 541 m/s. . . . . . . . . . . . . 29
xiii

Analysis of Regression Models to Estimate the Ballistic
Performance of Body Armor
This page intentionally left blank.
xiv

List of Figures
2.1 Cumulative density functions for the three GLMs. . . . . . . 62.2 Probability density functions for the three GLMs. . . . . . . . 72.3 Estimated response curves for a new UD-PPTA body armor . 9
4.1 Estimated logistic response curves for PBO armors. . . . . . . 184.2 Estimated probit response curves for PPTA armors. . . . . . 19
5.1 Logit estimated response curves for a new hybrid armor. . . . 225.2 Probit estimated response curves for a new hybrid armor. . . 225.3 C-log-log estimated response curves for a new hybrid armor. . 235.4 Estimates of V50 using the three different models. . . . . . . . 245.5 Probability of perforation at the NIJ reference velocity. . . . 255.6 Photograph of de-constructed armor. . . . . . . . . . . . . . . 275.7 Photograph of shattered bullet removed from armor. . . . . . 27
xv

Analysis of Regression Models to Estimate the Ballistic
Performance of Body Armor
This page intentionally left blank.
xvi

1 Introduction
The performance standard for ballistic-resistant body armor published bythe National Institute of Justice (NIJ), NIJ Standard–0101.06 [1], recom-mends estimating the performance of body armor by performing a statisti-cal analysis on V50 ballistic limit testing data. During a V50 ballistic limittest, bullet velocity is varied up and down to obtain mixed outcomes wheresome shots are stopped by the armor, but other shots yield perforations ofthe armor. From these results, the ballistic performance of the armor canbe estimated using a statistical regression model. The logistic regressionmodel is commonly used in many binary response systems, such as the in-vestigation of a relationship between age and the presence or absence of adisease for medical applications [2], and is therefore recommended in NIJStandard-0101.06 [1]; but depending on the armor system and the amountof ballistic data collected, other regression models may be more appropriate.Unfortunately, one does not usually have enough ballistic data to determinewhich model best describes the armor’s physical situation. Thus, this studyhas applied a number of regression models to the data for the purpose ofbetter understanding how well the various models fit the data.
In this work, each regression model will be applied to the ballistic limitdata, using the method of maximum likelihood [2, 3] to estimate the regres-sion parameters. Then, estimation results from the model will be comparedand evaluated. Different criteria for assessing the goodness of each modelwill be investigated. The objective is to identify criteria that can distinguishwhich regression method produces the best estimate of the performance ofa particular armor model. Another objective of this work is to apply thesemodels to different V50 data sets to better understand how an armor model’sperformance changes as it ages, either through field or laboratory aging.Ballistic limit methods have been commonly applied to provide insight intofield-aged armor performance, and many questions still remain regardingwhether the initial distribution model, deemed appropriate for new armor,continues to describe the armor as it ages. Results will be presented to ex-plore the selection of an appropriate distribution model for both new andenvironmentally conditioned armor samples. Three models are considered:the logistic, the probit and the complementary log-log (extreme value typeI) response models. The logistic and probit are the two most commonly usedmethods. The difference between these two symmetrical and asymptotical
1

Analysis of Regression Models to Estimate the Ballistic
Performance of Body Armor
distributions is known to be small. The extreme value distribution (com-plementary log-log model), which is asymmetric, produces slightly differentestimates than the previous two. Finally, an analysis will be performed ona new armor with atypical V50 test results to evaluate and compare the esti-mations of performance provided by the three different distribution models.
2

2 V50 Ballistic Limit DataAnalysis
2.1 Experimental
For the first part of the study, ballistic limit data was generated in the NIST-OLES (National Institute of Standards and Technology - Law EnforcementStandards Office) ballistic testing laboratory on new armor and environmen-tally conditioned armor [4]. For the second part of this study, ballistic limitdata was generated at a NVLAP(National Voluntary Laboratory Accredita-tion Program)-accredited ballistic testing laboratory on new armor. Duringa V50 ballistic limit test, the propellant charge weight of each bullet is var-ied in order to control the bullet velocity. This test procedure is designedto obtain mixed outcomes where the armor stops some shots, but yieldsperforations on other shots. For each shot, the bullet velocity is recordedand the armor panel is examined to determine whether or not a perforationoccurred; the shot outcome is then codified 1 or 0 respectively. All panelswere tested according to the procedures detailed in NIJ Standard–0101.06,Section 7 [1]. From these results, the ballistic performance of the armor canbe estimated using a statistical regression model and the V50 value can beapproximated. The V50 is the velocity at which a given bullet type has aprobability of perforation of 50 %, which is a useful property for comparingdifferent types of armor systems.
The first part of this study focuses on datasets generated from fourdifferent body armor models. For each armor model there are test datafrom both new and environmentally conditioned armor. The four armortypes that are considered are body armors containing poly-p-phenylenebenzobisoxazole (PBO), p-phenylene terephtalamide (PPTA), unidirectionalp-phenylene terephtalamide (UD-PPTA) and ultra high molecular weightpolyethylene (UHMWPE). These acronyms are used to identify the armorsin this work. The second part of the study focuses on datasets generatedfrom a hybrid body armor model which combined PPTA and UHMWPEand had an unusual ballistic limit response as compared to the other armorsin the study.
3

Analysis of Regression Models to Estimate the Ballistic
Performance of Body Armor
2.2 The Logistic, Probit and Complementary Log-
Log Regression Models
2.2.1 Background
Once the ballistic limit testing has been completed, the test results areanalyzed for each threat by performing a regression to estimate the perfor-mance of the armor over a range of velocities. During ballistic limit testingonly a limited number of shots can practically be taken, and from thosedata the full performance of the body armor can be estimated. In particu-lar, the analysis attempts to estimate the velocity where the probability ofperforation becomes reasonably small. As previously mentioned, the shotoutcome of the ballistic limit tests is a perforation or a stop, codified as 1and 0, respectively. This type of outcome data is commonly called binaryresponse data. A vast literature in statistics, biometrics, and econometricsis concerned with the analysis of binary response data and the classical ap-proach fits a binomial regression model using maximum likelihood [5]. Thebinomial regression model is a special case of an important family of sta-tistical models, namely Generalized Linear Models [6, 7, 8, 9] (originallydue to Nelder and Wedderburn [10]). The acronym GLM is a shorthandfor generalized linear model [11]. The binomial family is associated withseveral links; among the common binomial links there are the probit, thelogit and the complementary log-log link functions. The probit model [12]was the first model of binary regression used. It was originally developedfor analyzing dose-response data from bioassays [12, 13]. This model is stillused by researchers for biological assay analysis, and often used to modelother data situations. Logistic regression was developed later and not usedmuch until the 1970s, but it is now more popular than the probit model[11, 14]. Indeed, in recent decades, the logistic regression model has becomethe standard method of analysis for binary response data to model the re-lationship between the binary outcomes (shot outcome in this case) andthe independent variable (the velocity of the bullet) in many fields, such asbiomedical [2, 11, 15, 16, 17] or economical research [14, 18]. Alternatives tothe traditional logistic approach using the probit and complementary log-loglink functions were studied [19, 20, 21].
Current opinion regarding the selection of link function in binary re-sponse models is that the probit and logistic links give essentially similarresults [2, 8, 11, 22, 23]. Long [24] wrote that the choice between the lo-gistic and probit models is largely one of convenience and convention, sincethe substantive results are generally indistinguishable. Moreover, Gill [7]discussed link functions including the complementary log-log and indicatedthat any of these three link functions can be used and will provide identicalsubstantive conclusions. The close proximity of the probit and logistic linkfunctions is frequently extrapolated to imply that all links are essentially in-distinguishable, but this can be a misconception. Conversely, other studieshave shown that in many cases this most commonly used logistic regressionmodel may be not always the most appropriate, and that alternative modelscan also provide good results in this context of binary response data [19, 25].
4
2. V50 Ballistic Limit Data Analysis
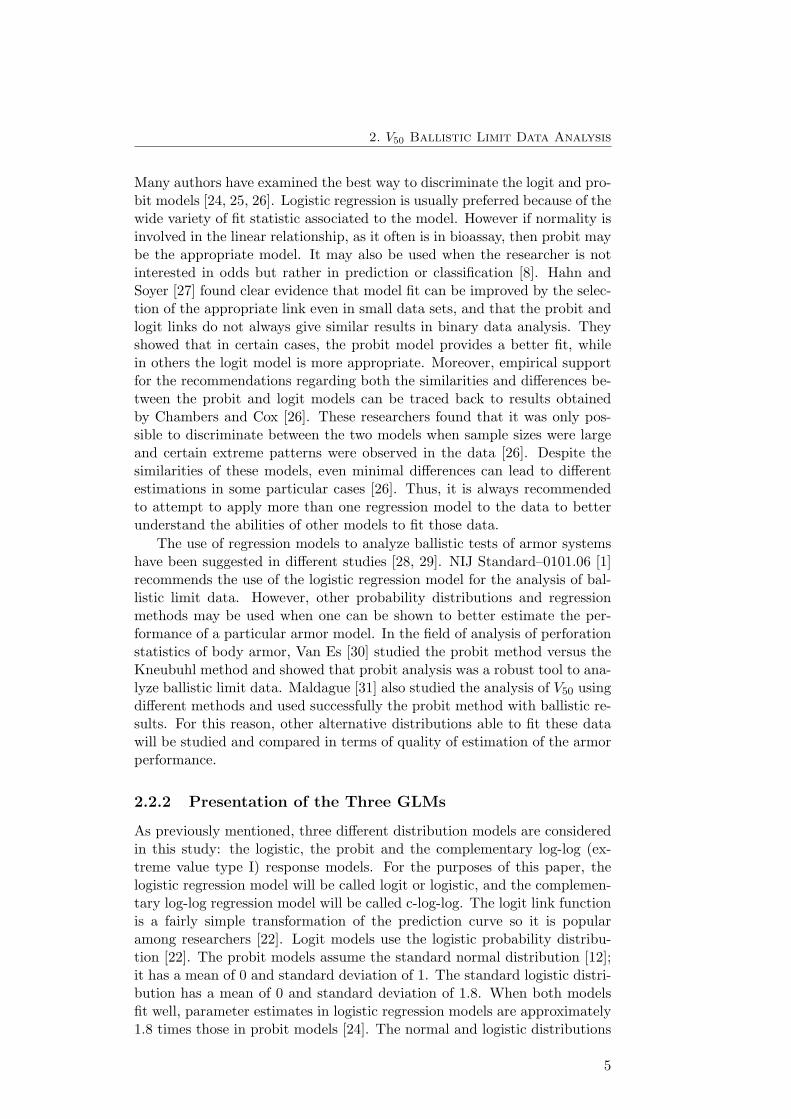
Many authors have examined the best way to discriminate the logit and pro-bit models [24, 25, 26]. Logistic regression is usually preferred because of thewide variety of fit statistic associated to the model. However if normality isinvolved in the linear relationship, as it often is in bioassay, then probit maybe the appropriate model. It may also be used when the researcher is notinterested in odds but rather in prediction or classification [8]. Hahn andSoyer [27] found clear evidence that model fit can be improved by the selec-tion of the appropriate link even in small data sets, and that the probit andlogit links do not always give similar results in binary data analysis. Theyshowed that in certain cases, the probit model provides a better fit, whilein others the logit model is more appropriate. Moreover, empirical supportfor the recommendations regarding both the similarities and differences be-tween the probit and logit models can be traced back to results obtainedby Chambers and Cox [26]. These researchers found that it was only pos-sible to discriminate between the two models when sample sizes were largeand certain extreme patterns were observed in the data [26]. Despite thesimilarities of these models, even minimal differences can lead to differentestimations in some particular cases [26]. Thus, it is always recommendedto attempt to apply more than one regression model to the data to betterunderstand the abilities of other models to fit those data.
The use of regression models to analyze ballistic tests of armor systemshave been suggested in different studies [28, 29]. NIJ Standard–0101.06 [1]recommends the use of the logistic regression model for the analysis of bal-listic limit data. However, other probability distributions and regressionmethods may be used when one can be shown to better estimate the per-formance of a particular armor model. In the field of analysis of perforationstatistics of body armor, Van Es [30] studied the probit method versus theKneubuhl method and showed that probit analysis was a robust tool to ana-lyze ballistic limit data. Maldague [31] also studied the analysis of V50 usingdifferent methods and used successfully the probit method with ballistic re-sults. For this reason, other alternative distributions able to fit these datawill be studied and compared in terms of quality of estimation of the armorperformance.
2.2.2 Presentation of the Three GLMs
As previously mentioned, three different distribution models are consideredin this study: the logistic, the probit and the complementary log-log (ex-treme value type I) response models. For the purposes of this paper, thelogistic regression model will be called logit or logistic, and the complemen-tary log-log regression model will be called c-log-log. The logit link functionis a fairly simple transformation of the prediction curve so it is popularamong researchers [22]. Logit models use the logistic probability distribu-tion [22]. The probit models assume the standard normal distribution [12];it has a mean of 0 and standard deviation of 1. The standard logistic distri-bution has a mean of 0 and standard deviation of 1.8. When both modelsfit well, parameter estimates in logistic regression models are approximately1.8 times those in probit models [24]. The normal and logistic distributions
5

Analysis of Regression Models to Estimate the Ballistic
Performance of Body Armor
x
-6 -4 -2 0 2 4 6
Pro
babi
lity
0.0
0.2
0.4
0.6
0.8
1.0Standard Extreme Value Distribution (Type I )Standard Normal DistributionStandard Logistic Distribution
Figure 2.1: Cumulative density functions for the three GLMs.
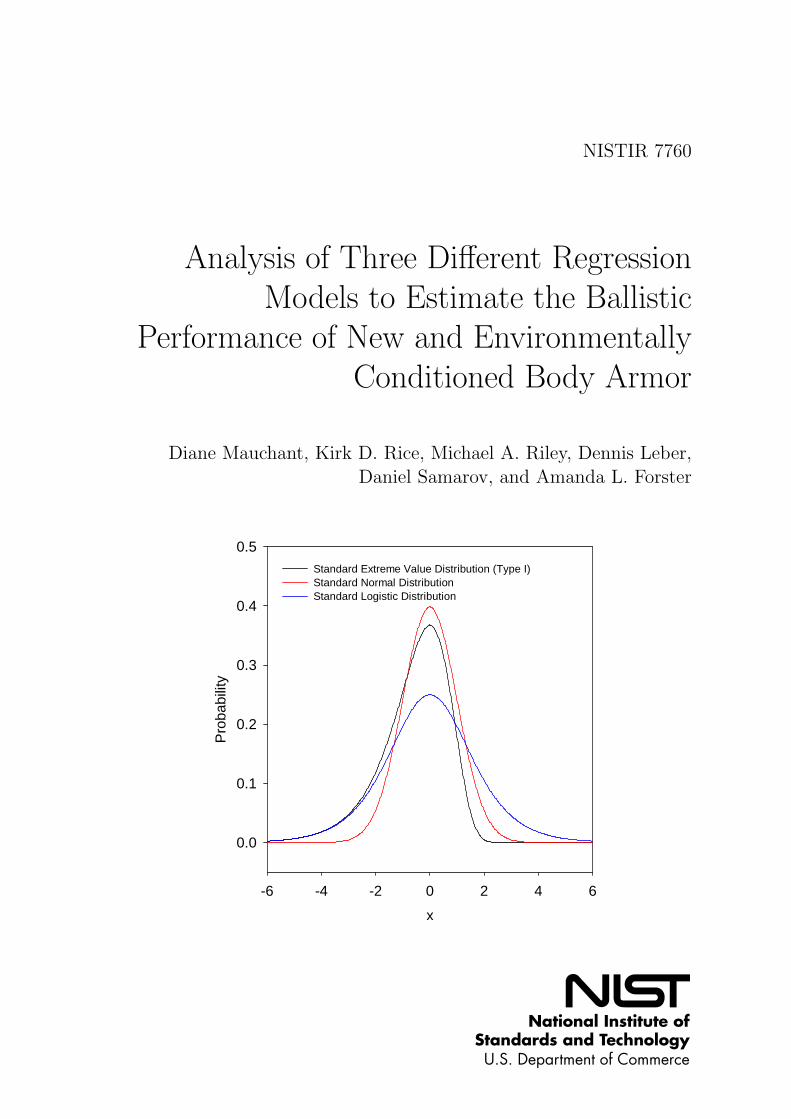
are both symmetric [12, 22]. The logit and probit links are very similar; inparticular, both approach 0 and 1 symmetrically and asymptotically. Be-cause of this similarity, they usually lead to analogous results [12, 22]. Thec-log-log analysis is an alternative to logit and probit analysis. The c-log-log model is based on the extreme value type I distribution, also referredto as the Gumbel distribution [32, 33], which is asymmetric in contrast tothe logistic or standard normal distribution of the logit and probit models,respectively. All of the three model transforms produce a sigmoidal (or S-shaped) response curve. However, since the extreme value distribution isasymmetric, the results are slightly different from those of the two othersymmetrical models. To illustrate this difference, idealized curves for allthree models are presented in Figures 2.1 and 2.2. The reason why Cumu-lative Distribution Functions (CDF) are used as link functions for binarydata is because the CDF is always between 0 and 1.
The cumulative density function of the standard normal distribution issteeper in the middle than that of the standard logistic distribution andquickly approaches 0 on the left and 1 on the right. From Figure 2.2 itcan be noted that the logit link has heavier tails than the probit or c-log-log, i.e. this link assigns a greater probability to observations which falloutside the mean. The implication of this is that in the event that thereis a lot of variability in the measurements the parameter estimates usingthe logit link will capture this as a result of the heavier tails whereas theother distributions may not. From this observation one could assume that
6

2. V50 Ballistic Limit Data Analysis
x
-6 -4 -2 0 2 4 6
Pro
babi
lity
0.0
0.1
0.2
0.3
0.4
0.5
Standard Extreme Value Distribution (Type I)Standard Normal Distribution Standard Logistic Distribution
Figure 2.2: Probability density functions for the three GLMs.
it is generally safer to use the logit link as it is less susceptible to outliersor to data with a lot of variability than the two other links. The three linkfunctions and their corresponding distributions are summarized in Table 2.1.
Table 2.1 contains the probability of a complete perforation occurringat velocity v : π(v); and also the velocity at which the probability of per-foration is π %: Vπ. The calculation of V50 is determined from the esti-mated regression parameters β0 and β1, which are the estimated constantand the estimated velocity coefficient, respectively. The formula of this esti-mated V50 is also shown in Table 2.1 for each model. The explanation andthe calculation of the confidence intervals of the estimates can be found inRef. [2, 34]. The different regressions are performed on the data using themethod of maximum likelihood [2, 3] to estimate the logistic, the probit orthe c-log-log parameters β0 and β1. The confidence intervals of the estimatesare calculated using the Wald test [2, 34]. Fieller’s theorem [12] is used toestimate the confidence intervals of V50.
2.3 Application of the Different Models to Fit V50
2.3.1 R Software
The three regression models are performed on the ballistic limit data usingthe method of maximum likelihood to estimate the regression parameters.The R statistical software package [35] was used to execute the different
7

Analysis of Regression Models to Estimate the Ballistic
Performance of Body Armor
Probability Velocity where
Link Name of perforation probability of Estimated
(distribution) π(v) perforation is π, Vπ V50
Logit(Logistic)
eβ0+β1v
1 + eβ0+β1v
ln
(
π
1− π
)
− β0
β1
−β0
β1
Probit(Normal)
Φ(
β0 + β1v) Φ−1 (π)− β0
β1
−β0
β1
Complementarylog-log
(Extreme value)1− e−e
(β0+β1v) ln (− ln(1− π))− β0
β1
ln (− ln(0.5))− β0
β1
Table 2.1: Comparison of distributions.
regressions and estimate the regression coefficients. R is a free software en-vironment for statistical computing. It provides a wide variety of statisticaltechniques, such as data analysis using regression models. The R statisticalsoftware allows computing and fitting each of the three different regres-sion models (logistic, probit and c-log-log) to the data. The generalizedlinear model (GLM) procedure [36], with the parameters family=binomialand link=logit, probit, or cloglog, as appropriate, to specify the model isused to fit the different regression models to the binary response data usingmaximum likelihood estimation. After the regression computation, R out-puts provide the regression coefficients estimates and their standard errors,as well as all the information needed to calculate the confidence interval(variance matrix), and also some useful statistics like deviance and Akaike’sInformation Criterion. Both statistics will be discussed further later in thiswork.
2.3.2 Comparison of the GLM Estimates
To illustrate the application of the different regression analysis and theirresults in terms of estimations, a typical example is presented in Figure 2.3:the analysis of the ballistic performance of a new UD-PPTA body armorwhich shows the estimated response curve of this body armor given by thethree different models.
The estimated response curves of the logistic, probit and c-log-log regres-sion models and their 95 % confidence intervals as presented in Figure 2.3are very similar. However, the confidence interval generated using the c-log-log model is not comparable with those obtained from logistic and probitmodels because of the asymmetrical shape of the c-log-log distribution func-tion. The three function curves are all S-shaped. As previously discussed,the logit and probit curves are very similar; in particular, both approach0 and 1 symmetrically and asymptotically. However the c-log-log distribu-tion is asymmetric, it approaches 1 much more rapidly than it approaches0, accordingly, the results obtained with this model are different. The lo-gistic and probit functions are almost linearly related over the interval ofprobabilities of perforation between 0.1 and 0.9. These two models perform
8

2. V50 Ballistic Limit Data Analysis
velocity (m/s)
350 400 450 500 550
prob
abili
ty o
f per
fora
tion
0.0
0.2
0.4
0.6
0.8
1.0
logistic fit95% CLUD-PPTA datalogistic V50probit fit95% CLprobit V50c-log-log fit95% CL c-log-log V50
Figure 2.3: Estimated response curves for a new UD-PPTA body armorgiven by the three GLMs.
9

Analysis of Regression Models to Estimate the Ballistic
Performance of Body Armor
Logit Probit C-log-log
V50 (m/s) 505 505 508Upper 95 % CL on V50 (m/s) 518 517 518Lower 95 % CL on V50 (m/s) 496 497 498
CI width (m/s) 22 21 19
Predicted prob. at 350 m/s 0.0000044 5.63 E -14 0.0000653Upper 95 % CL at 350 m/s 0.002392 0.000034 0.005925Lower 95 % CL at 350 m/s 0 0 0
CI width 0.002392 0.000034 0.005924
V02 (m/s) 457 462 448Upper 95 % CL on V02 (m/s) 473 477 469Lower 95 % CL on V02 (m/s) 406 426 390
CI width (m/s) 67 50 78
CI is confidence interval.CL is confidence level.350 m/s is the NIJ reference velocity.V02 is the velocity at which a bullet has a 2 % chance of perforating the armor.
Table 2.2: Summary of estimates for a new UD-PPTA body armor.
similarly at the center (at V50). The primary difference between the logitand probit response curves is that probit has slightly flatter lower and upperasymptotes, which means the probit curve approaches the axes more quicklythan the logistic curve. Therefore, the two GLMs give different estimationsof armor perforation for low and high bullet velocities, which are importantin ballistic limit analysis. As expected, the asymmetrical c-log-log responsecurve approaches much more quickly the high probability of perforation (i.e.,probability of 1) than either the logit or probit function. For small valuesof probability of perforation, the c-log-log function is close to the logistic.The preceding discussion of the differences and similarities between the re-sponse curves given by the three regression models considered herein areconfirmed by further examining the V50 and V02 estimate values directly.This information is presented in Table 2.2.
While the estimates of parameters differ in size due to the different scal-ing of the normal and logistic distributions, the substantive conclusions (andthe predicted probabilities of perforation for the armor) are very similar. Theestimated V50 value is the same for the logit and probit models. Becauseof its asymmetry, the estimations of the high and low velocities related tothe logistic and probit models are different from the ones obtained by thec-log-log model. Generally, the estimated V50 provided by the logit andprobit regression models are similar but the V50 estimated by c-log-log isslightly higher. In the case of the V02 estimate, the c-log-log model pro-vides the lowest value for V02, while the probit provides the highest value.In most applications, results from the c-log-log model are not very differentfrom logit and probit, however, occasionally the estimate results can suggestqualitatively different conclusions.
Even if differences and similarities between estimates given by the threeregression models can be discerned, it is difficult to discriminate between
10

2. V50 Ballistic Limit Data Analysis
these three models on the basis of the quality of the armor performanceestimation. The three regression models lead to very similar results, espe-cially for the estimation of V50. For the estimation of V02 and the predictedprobability of perforation at the NIJ reference velocity (350 m/s), the differ-ence between the estimates given by the diverse models is larger, but theyare still similar. Moreover, the binary nature of the analyzed data does notallow a visual comparison. From Figure 2.3 it is not possible to identify thebest model. Consequently, some criteria of goodness-of-fit are required toassist in the determination of which model could better estimate the armorperformance from the available ballistic data. The next section will examinethis issue.
11

Analysis of Regression Models to Estimate the Ballistic
Performance of Body Armor
This page intentionally left blank.
12
3 Generalized Linear ModelEstimation Evaluation
Different criteria for assessing the goodness-of-fit of each model will be ap-plied to the ballistic limit data. The objective of this analysis is to identifycriteria that can distinguish which regression method produces the best esti-mate of the performance of a particular armor model, since the estimationsgiven by the three models were shown to be analogous.
3.1 Assessment Criteria
Once a model has been fitted to the observed values of a binary response vari-able, it is essential to check that the fitted model is actually valid. Goodness-of-fit statistics given by the R software can be used to compare fits usingdifferent link functions. The significance test of the regression coefficients isprovided after every regression and allows one to verify the significance ofeach coefficient. The R outputs also indicate the estimates of the regressioncoefficients and are accompanied by the standard errors.
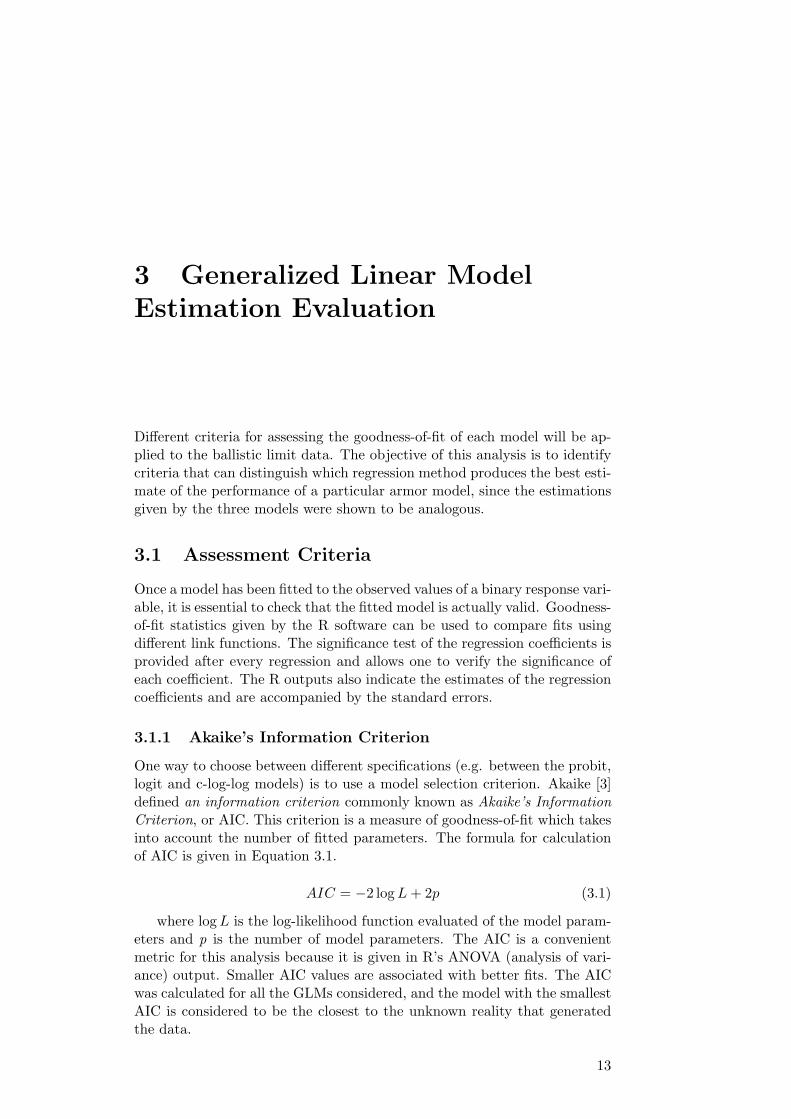
3.1.1 Akaike’s Information Criterion
One way to choose between different specifications (e.g. between the probit,logit and c-log-log models) is to use a model selection criterion. Akaike [3]defined an information criterion commonly known as Akaike’s InformationCriterion, or AIC. This criterion is a measure of goodness-of-fit which takesinto account the number of fitted parameters. The formula for calculationof AIC is given in Equation 3.1.
AIC = −2 logL+ 2p (3.1)
where logL is the log-likelihood function evaluated of the model param-eters and p is the number of model parameters. The AIC is a convenientmetric for this analysis because it is given in R’s ANOVA (analysis of vari-ance) output. Smaller AIC values are associated with better fits. The AICwas calculated for all the GLMs considered, and the model with the smallestAIC is considered to be the closest to the unknown reality that generatedthe data.
13

Analysis of Regression Models to Estimate the Ballistic
Performance of Body Armor
3.1.2 Log-Likelihood
As a quick and simple way to compare the performance across the differentmodels, one can simply look at the maximized log-likelihood of each specifi-cation, since the models contain an equal number of parameters. However,Akaike [3] showed that the maximized log-likelihood is biased upward as anestimator of the model selection criterion and then defined the AIC as abetter criterion for measuring goodness-of-fit.
3.1.3 Deviance of the Model
Huettmann and Linke [21] presented two methods of assessing which linkfunction performs best for inferences and for predictions. The first decisioncriterion is centered on the model deviance, e.g. relevant for inferences.A measure of discrepancy between the observed and fitted values is thedeviance statistic. In a perfect fit the deviance is zero. Thus, the mostpreferable model can be found on the basis of the minimum-deviance crite-rion for model selection. For example, if the deviance of a probit model issignificantly lower than the one of the corresponding logit model, then theformer is preferred. This postulate holds when comparing any of the linkswithin the binomial family [8]. Conversely, the model that provides the leastdesirable fit to the data can also be found. The deviance criterion is alsogiven in the R output as an indicator of goodness-of-fit.
3.1.4 Prediction Error Rate
The second criterion presented by Huettmann and Linke [21] is based onprediction errors. It uses the differences between expected and predictedvalues as an indication of the fit. Once the regression model analysis isperformed, the resulting regression coefficients estimates are used to predictthe data and provide predictive probabilities of perforation. If the probabil-ities of perforation are greater than 50 %, these probabilities are classifiedin the perforation group, if they are less than 50 %, they are classified in thenon-perforation group. Then the observed and predicted responses can becross-tabulated and the proportion of cases predicted correctly can be cal-culated. The lower the misclassification rate, the better the model fits thedata. However, this misclassification rate is not independent of the model(since it is based on the data used to build the model) and therefore couldunderestimate the real error rate.
3.1.5 Cross-Validation Method
The cross-validation method avoids this problem of dependence; therefore, itgives a better calculated error rate than the usual prediction error rate. In k-fold cross-validation, one divides the data into k subsets of (approximately)equal size. One trains the net k times, each time leaving out one of thesubsets from training, but using only the omitted subset to compute theerror criterion of interest, in this case the prediction error rate. This way, it
14

3. Generalized Linear Model Estimation Evaluation
Logit Probit C-log-log
V50 (m/s) 505 505 508Upper 95 % CL on V50 (m/s) 518 517 518Lower 95 % CL on V50 (m/s) 496 497 498
AIC 51.94 51.40 52.07Misclassified Data (%) 23.3 23.3 21.7
Error Rate by Cross-Validation (%) 23.3 23.3 21.7
Table 3.1: V50 estimates and selection criteria for new UD-PPTA armor.
avoids the problem of dependence of the model observed previously. Cross-validation can be used simply for model selection by choosing the modelthat has the smallest estimated generalization error.
In this study, where the ballistic performance of an armor type is esti-mated by testing several armor panels and combining their ballistic results,this training/testing set method uses the ballistic data of n-1 panels toestimate the model and uses the data of the nth panel to test the predic-tion of the model. Then the model is trained n times, each time leavingout one panel to calculate the error rate. Finally the average error rate ofre-substitution is calculated and used as a model selection criterion.
Among all of the model selection criteria previously presented, the AICand the average error rate calculated by cross-validation, also called averageerror rate of training/testing sets method, will be used as criteria to tryto distinguish which regression method produces the best estimate of theperformance of a particular armor model. However, in case of few differ-ences between the model results, the optimal model could be at the endchosen by the user, regarding mostly its specifications, its estimations andits applications in a practical way.
3.2 Model Diagnostics Results
Some general observations about the results of these model diagnostics canbe noted. First, the lack of fit tests given by the R software output do not in-dicate a significant lack of fit for any of the three models, for all the datasetstested, and the criteria values for all three models are similar. Furthermore,the prediction error rate is, as expected, lower when it is calculated fromthe whole set of data used to create the model, and the average error rateof cross-validation method is higher. These misclassification rate criteriahave the same values for logit and probit. The comparison of the predictedvalues, previously made in Figure 2.3 showing the predicted values given bythe three models and the observed data, did not indicate strong evidence fordistinguishing models on the basis of link. Therefore, the model selectioncriteria given in Table 3.1 will be the focus of the rest of this work.
In Table 3.1, the best criteria are shown in bold. Thus the AIC statisticfor the probit model is lower than for the logistic and c-log-log models, sug-gesting a slight, but probably insignificant, preference for the probit model.
15

Analysis of Regression Models to Estimate the Ballistic
Performance of Body Armor
The criteria based on the two error rates show that the c-log-log model isbetter for prediction. However the difference between the error rates for thedifferent models is small.
3.3 Results of Theoretical Analysis
A regression model can be fitted to the ballistic limit data to estimate theoverall response of particular body armor. Different possible models wereconsidered and compared in terms of quality of estimation of the body ar-mor’s performance. Comparisons were made only between models that havebeen applied to the same dataset, so with the same number of data pointsand the same number of parameters. The comparison was made at the levelof estimation of the V50. The estimation given by each model was evaluatedon its confidence interval (CI) width, the percentage of misclassified data,the estimation of V50 and other parameters like AIC. The results show thatthe logistic analysis generally gives a good overall estimation of the bodyarmor’s performance, but other regression models could be better. For aparticular armor, a model can be shown to better estimate its performanceon the basis of a selection criteria. However, the difference between thethree models examined herein is relatively small in terms of estimation. Ad-ditionally, the values of the different criteria studied are too close to make ameaningful determination among the various models. Even if some criteriaindicate a slight preference for one model, the others cannot be necessar-ily considered bad models to fit the ballistic data. Thus, the commonlyused logistic regression model specified in NIJ Standard–0101.06 can still beconsidered an appropriate choice for V50 ballistic limit analysis.
16

4 Application to New andConditioned Armor Analysis
Within the body armor community, many questions still remain regardingwhether the initial distribution model deemed appropriate for new armorcontinues to describe the armor as it ages. Therefore, the analysis of newand environmentally conditioned armors is examined, with the objective ofselecting an appropriate distribution model for both new and environmen-tally conditioned armor samples. Further details about the environmentalconditioning of the body armor discussed herein can be found in Forsterand al [4]. Using the three different regression models and their specificitiesin terms of data fitting presented previously, and the criteria able to helpidentify the best model for a particular armor, the focus is made on theaspect of body armor conditioning and the fitting of ballistic data from newand environmentally conditioned body armor. Data generated from the V50
ballistic limit testing of the new and conditioned samples of the same modelof armor are considered.
To facilitate an understanding of the effects of conditioning on the bal-listic performance of a particular armor, the estimates provided by the sameregression model on new and environmentally conditioned armor data arecompared.
4.1 Comparison of New and Conditioned Armors
If the results from the new armors are compared to the environmentally con-ditioned armors, the armor model’s performance appears to decrease afterconditioning. Whatever the regression model applied, the estimates for V50
and V02 decrease, while the size of their associated confidence intervals in-crease. This indicates a reduced confidence in the armor response curve andtherefore an increase in the probability of perforation for these velocities.The probability of perforation at the NIJ reference velocity also increases,as well as its confidence interval. The observed shifts in values for V50 andV02 are of the same range, regardless of which regression model is used. Toillustrate these observations, the observed data and the predicted probabilityof perforation given by the logistic regression for new and environmentallyconditioned PBO armors are presented in Figure 4.1. The new armor is
17

Analysis of Regression Models to Estimate the Ballistic
Performance of Body Armor
velocity (m/s)
300 350 400 450 500
prob
abili
ty o
f per
fora
tion
0.0
0.2
0.4
0.6
0.8
1.0logistic fit95% CLnew PBOlogistic V50 logistic fit95% CLconditioned PBOlogistic V50
Figure 4.1: Estimated logistic response curves for new and conditioned PBOarmors.
represented in blue and the environmentally conditioned armor in red. Theshape of the ballistic response curves of new and environmentally condi-tioned armors look similar, but as previously mentioned, it appears that theresponse curve has shifted to the left when the armor is environmentallyconditioned.
Obviously the PPTA armor is made from a different material than thePBO armor, subsequently the ballistic performances of new and environ-mentally conditioned PPTA armors are different. The point estimates forV50 of conditioned PPTA armor are higher than those for new PPTA armor,though the size of the linked confidence intervals increases as well. However,the V02 decreases and the probability of perforation at NIJ reference veloc-ity increases in the PPTA armor, as was seen in the PBO armor, and theconfidence intervals associated with the analysis also increase. Figure 4.1illustrates these observations. Note the shape of estimated response curvechanges between the new and the environmentally conditioned armors. Thecurve of environmentally conditioned armor is more elongated and its slopeis less steep. The confidence interval of the environmentally conditionedarmor response curve is much wider, so the uncertainty in the ballistic per-formance increases as the PPTA armor is conditioned.
18

4. Application to New and Conditioned Armor Analysis
velocity (m/s)
350 400 450 500 550
prob
abili
ty o
f per
fora
tion
0.0
0.2
0.4
0.6
0.8
1.0logistic fit95% CLnew PPTAlogistic V50 logistic fit95% CLconditioned PPTAlogistic V50
Figure 4.2: Estimated probit response curves for new and conditioned PPTAarmors.
4.2 Selection of an Appropriate Model for Newand Environmentally Conditioned Body Ar-
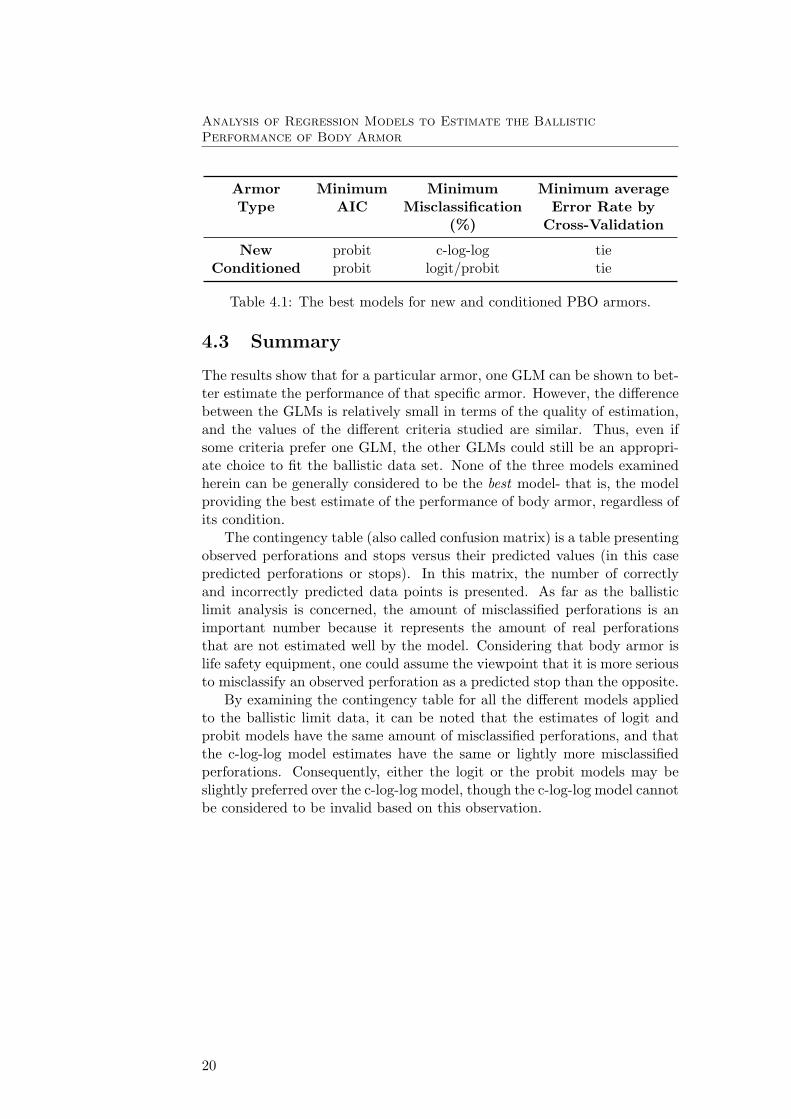
mors
This study seeks to answer the question of whether or not the initial distri-bution model deemed appropriate for new armor continues to describe thearmor as it ages, and the goal is to try to find an appropriate distributionmodel for both new and environmentally conditioned armor samples. Typi-cal results of the selection model criteria for PBO new and environmentallyconditioned armors are shown in Table 4.1. Using the prediction perfor-mance as a criterion, the three models behave similarly. Using the modelAIC as a decision criterion, the findings indicate that for the V50 ballisticdata studied, the probit model would best fit the data. On the basis ofthe minimum AIC and the minimum average error rate criteria for modelselection, the probit model could be slightly preferable to the others and isdeemed appropriate for both new and environmentally conditioned armors.However, as previously noted, the difference between the models is minimal,especially between the probit and logistic models.
19
Analysis of Regression Models to Estimate the Ballistic
Performance of Body Armor
Armor Minimum Minimum Minimum averageType AIC Misclassification Error Rate by
(%) Cross-Validation
New probit c-log-log tieConditioned probit logit/probit tie
Table 4.1: The best models for new and conditioned PBO armors.
4.3 Summary
The results show that for a particular armor, one GLM can be shown to bet-ter estimate the performance of that specific armor. However, the differencebetween the GLMs is relatively small in terms of the quality of estimation,and the values of the different criteria studied are similar. Thus, even ifsome criteria prefer one GLM, the other GLMs could still be an appropri-ate choice to fit the ballistic data set. None of the three models examinedherein can be generally considered to be the best model- that is, the modelproviding the best estimate of the performance of body armor, regardless ofits condition.
The contingency table (also called confusion matrix) is a table presentingobserved perforations and stops versus their predicted values (in this casepredicted perforations or stops). In this matrix, the number of correctlyand incorrectly predicted data points is presented. As far as the ballisticlimit analysis is concerned, the amount of misclassified perforations is animportant number because it represents the amount of real perforationsthat are not estimated well by the model. Considering that body armor islife safety equipment, one could assume the viewpoint that it is more seriousto misclassify an observed perforation as a predicted stop than the opposite.
By examining the contingency table for all the different models appliedto the ballistic limit data, it can be noted that the estimates of logit andprobit models have the same amount of misclassified perforations, and thatthe c-log-log model estimates have the same or lightly more misclassifiedperforations. Consequently, either the logit or the probit models may beslightly preferred over the c-log-log model, though the c-log-log model cannotbe considered to be invalid based on this observation.
20

5 Application of the GLMs to anUnusual Data Set
In the previous sections, the analysis with the different regression modelsdid not show much difference between the models. However, if an armorhad an atypical ballistic limit response, then perhaps one of the GLMscould be shown to better describe that particular armor. To investigatethis possibility, a dataset from an armor in which one panel had a highnumber of stops or perforations was of interest in determining if any of thethree different models could be determined to be more appropriate than theothers for such a system.
5.1 Global Analysis of the Armor
Data from a new hybrid armor model with a large number of high veloc-ity stops on one panel were selected for this analysis. The estimated re-sponse curves for all three regression models are presented in Figures 5.1, 5.2,and 5.3. As in the previous analysis, the estimated response curves of thelogistic, probit and c-log-log regression models and their 95 % confidenceintervals presented in Figures 5.1 through 5.3 are very similar. However,the confidence interval generated using the c-log-log model is not compa-rable with those obtained from logistic and probit models because of theasymmetrical shape of the c-log-log distribution function. As previouslydiscussed, the logit and probit curves are very similar; in particular, bothapproach 0 and 1 symmetrically and asymptotically. However the c-log-logis asymmetric, meaning that it approaches 1 much more rapidly than itapproaches 0.
It is important to note that this particular armor model has a very largezone of mixed results (ZMR) of 76.2 m/s (250 ft/s). This is due to a largenumber of stops on one particular armor panel at high velocities. This largezone of mixed results makes it difficult for any model to accurately predictthe armor performance at low velocities by reducing the slope of the curve.These results are presented in Table 5.1.
While the estimates of parameters differ in size due to different scaling ofthe normal and logistic distributions, the estimated V50 values predicted byall three models are very similar (Figure 5.4). The calculation of the error
21

Analysis of Regression Models to Estimate the Ballistic
Performance of Body Armor
velocity (m/s)
350 400 450 500 550 600
prob
abili
ty o
f per
fora
tion
0.0
0.2
0.4
0.6
0.8
1.0
logistic fit95% CLshot datalogistic V50
Figure 5.1: Logit estimated response curves for a new hybrid armor.
velocity (m/s)
350 400 450 500 550 600
prob
abili
ty o
f per
fora
tion
0.0
0.2
0.4
0.6
0.8
1.0
probit fit95% CLshot dataprobit V50
Figure 5.2: Probit estimated response curves for a new hybrid armor.
22

5. Application of the GLMs to an Unusual Data Set
velocity (m/s)
350 400 450 500 550 600
prob
abili
ty o
f per
fora
tion
0.0
0.2
0.4
0.6
0.8
1.0
c-log-log fit95% CLshot datac-log-log V50
Figure 5.3: C-log-log estimated response curves for a new hybrid armor.
Logit Probit C-log-log
V50 (m/s) 509 509 513Upper 95 % CL on V50 (m/s) 525 525 527Lower 95 % CL on V50 (m/s) 497 498 500
CI width (m/s) 28 27 28
Predicted probability at 436 m/s 0.069745 0.055381 0.103460Upper 95 % CL at 436 m/s 0.181378 0.163059 0.214941Lower 95 % CL at 436 m/s 0.024743 0.013636 0.048092
CI width 0.156636 0.149423 0.166848
V05 (m/s) 426 434 405Upper 95 % CL on V05 (m/s) 450 455 437Lower 95 % CL on V05 (m/s) 365 386 326
CI width (m/s) 86 69 111
Table 5.1: Summary of estimates for a new hybrid body armor.
23

Analysis of Regression Models to Estimate the Ballistic
Performance of Body Armor
Vel
ocity
(m
/s)
450
475
500
525
550
Logit Probit C-log-log
Figure 5.4: Estimates of V50 using the three different models. Note that theestimates are similar.
Logit Probit C-log-log
AIC 139.61 139.15 141.06Misclassified Data (%) 30.0 30.8 32.5
Error Rate by Cross-Validation (%) 31.7 31.7 31.7
Table 5.2: Summary of selection criteria for a new hybrid body armor.
bars of the V50 estimates are based on the Fieller’s theorem [12].
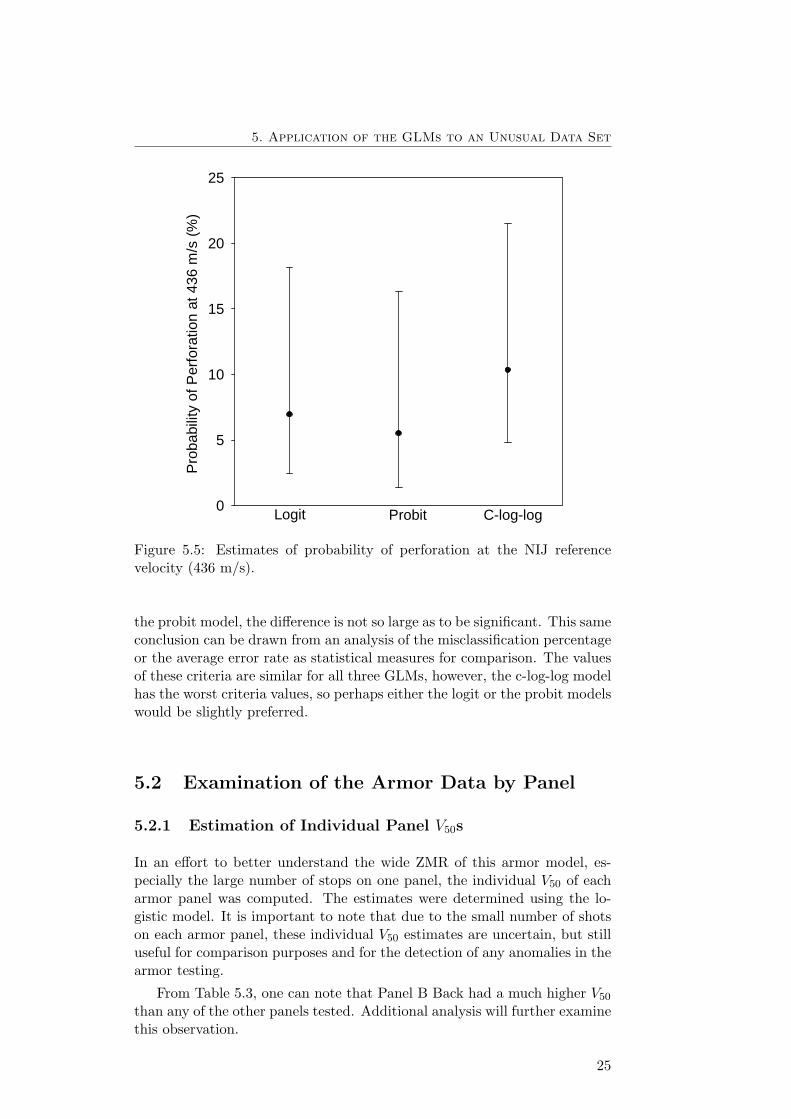
However, the probabilities of perforation at the NIJ reference velocity(436 m/s) predicted by the three different models are very different (Fig-ure 5.5). Note that the estimates shown in Figure 5.5 are different and thatthe error bars (indicating the range of the estimate), calculated using theWald test [2, 34], are large. This means that, when the error of the esti-mate is taken into account, all three estimates are probably within the samerange. This phenomenon is attributed to the large ZMR for this sample.
Analysis with the c-log-log asymmetric model indicated that the proba-bility of perforation at the NIJ reference velocity was approximately 10 %for this armor. This is higher than the 7 % that was predicted by the lo-gistical model used in the NIJ Standard–0101.06 ballistic limit calculation,and much higher than the 5.5 % that was predicted by the probit model.
Table 5.2 shows the values of the different goodness-of-fit criteria foreach model. As in the previous analysis, an assessment of how well thedifferent link functions fit the data using the AIC does not indicate oneGLM is a better fit than the others. While there is a slight preference for
24
5. Application of the GLMs to an Unusual Data Set
Pro
babi
lity
of P
erfo
ratio
n at
436
m/s
(%
)
0
5
10
15
20
25
Logit Probit C-log-log
Figure 5.5: Estimates of probability of perforation at the NIJ referencevelocity (436 m/s).
the probit model, the difference is not so large as to be significant. This sameconclusion can be drawn from an analysis of the misclassification percentageor the average error rate as statistical measures for comparison. The valuesof these criteria are similar for all three GLMs, however, the c-log-log modelhas the worst criteria values, so perhaps either the logit or the probit modelswould be slightly preferred.
5.2 Examination of the Armor Data by Panel
5.2.1 Estimation of Individual Panel V50s
In an effort to better understand the wide ZMR of this armor model, es-pecially the large number of stops on one panel, the individual V50 of eacharmor panel was computed. The estimates were determined using the lo-gistic model. It is important to note that due to the small number of shotson each armor panel, these individual V50 estimates are uncertain, but stilluseful for comparison purposes and for the detection of any anomalies in thearmor testing.
From Table 5.3, one can note that Panel B Back had a much higher V50
than any of the other panels tested. Additional analysis will further examinethis observation.
25

Analysis of Regression Models to Estimate the Ballistic
Performance of Body Armor
Armor Panel V50 (ft/s) V50 (m/s)
A Front * 1583.56 482.7
A Back * 1584.04 482.8
B Front * 1577.24 480.7
B Back ** 1810.75 551.9
C Front ** 1689.61 515.0
C Back ** 1689.21 514.9
D Front ** 1614.10 492.0
D Back ** 1708.64 520.8
E Front ** 1646.14 501.7
E Back ** 1681.76 512.6* indicates test was conducted on Day 1.**indicates test was performed on Day 2.
Table 5.3: Logistic V50 estimates for each armor panel.
5.2.2 Bullet Fragmentation Phenomenon
Another possible explanation for the high V50 for Panel B Back may be theunique combination of bullet and target leading to unusual bullet behavior.When this phenomenon occurs, the bullet behavior changes as a functionof velocity. For example, at lower velocities, the bullet may deform in apredictable manner as we typically see in armor testing; while at highervelocities, the bullet may fragment upon impact before significant deforma-tion, or perhaps components of the bullet may not remain intact [37, 38].Because the bullet behavior is different, its penetrative characteristics maybe different. This behavior is more typically encountered when testing hardplate armors, but may be possible to encounter when testing at high bulletvelocities. Due to the two different competing mechanisms that dominatepenetration mechanics, bullet fragmentation effectively leads to more thanone ballistic penetration curve for a particular armor-bullet system. In onecase, bullet properties dominate (when the bullet breaks up instead of de-forming); in another, armor properties dominate (typical armor testing).The armor community typically focuses on finding the lowest V50 of the ar-mor system, since that is the one of most practical importance to the personwearing the armor, which is what the test methods in NIJ Standard–0101.06are intended to do. Note that very high velocities resulted in stops, leadingone to suspect that the bullets may either fracturing or losing their copperjackets at these very high velocities. To examine this possibility, the armorpanel was de-constructed, and bullets were recovered from the armor andexamined. These bullets (Figures 5.6 and 5.7) show evidence of bullet failuredue to bullet fragmentation. Therefore, additional analysis was performedto examine the effect of this panel on the large ZMR and the outcome ofthis analysis is the subject of the next section.
26

5. Application of the GLMs to an Unusual Data Set
Figure 5.6: Photograph of de-constructed armor with shattered bullet inside.
Figure 5.7: Photograph of shattered bullet removed from armor.
27
Analysis of Regression Models to Estimate the Ballistic
Performance of Body Armor
Logit Probit C-log-log
V50 (m/s) 502 502 505Upper 95 % CL on V50 (m/s) 514 514 516Lower 95 % CL on V50 (m/s) 492 493 494
CI width (m/s) 22 21 22
Predicted probability at 436 m/s 0.042333 0.029177 0.073777Upper 95 % CL at 436 m/s 0.143464 0.124872 0.182044Lower 95 % CL at 436 m/s 0.011532 0.004206 0.028807
CI width 0.131932 0.120666 0.153237
V05 (m/s) 440 445 423Upper 95 % CL on V05 (m/s) 458 461 448Lower 95 % CL on V05 (m/s) 393 408 363
CI width (m/s) 65 54 85
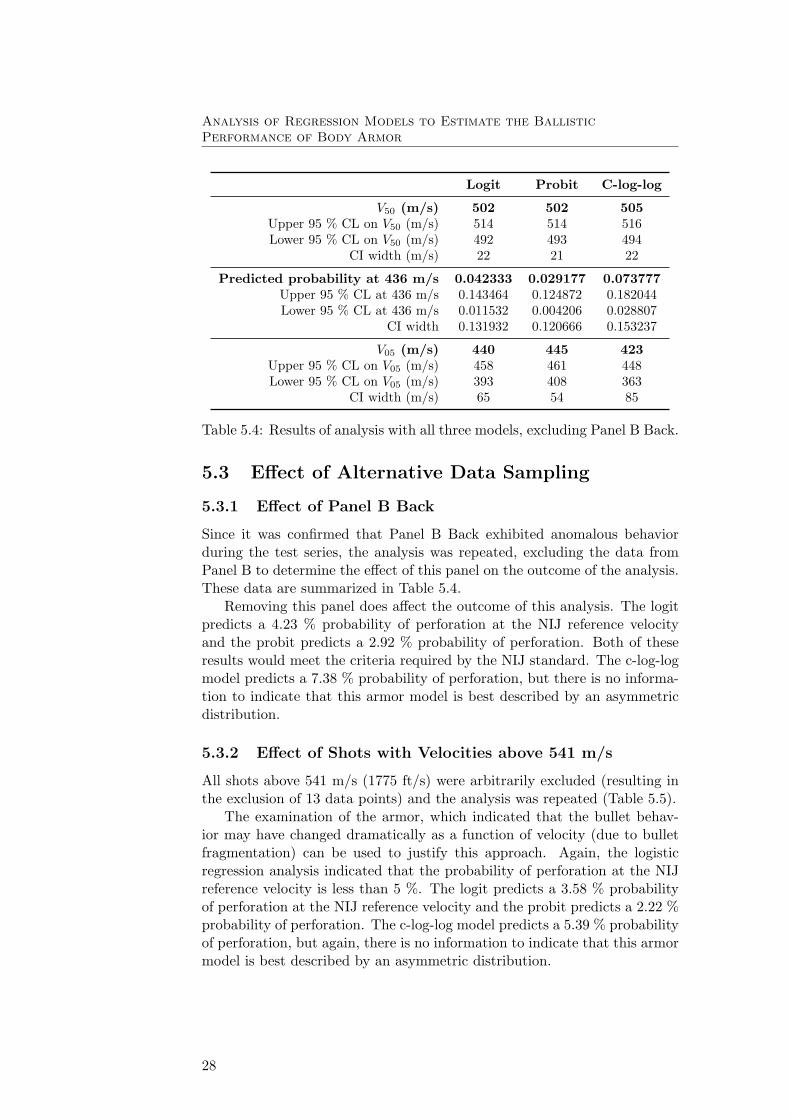
Table 5.4: Results of analysis with all three models, excluding Panel B Back.
5.3 Effect of Alternative Data Sampling
5.3.1 Effect of Panel B Back
Since it was confirmed that Panel B Back exhibited anomalous behaviorduring the test series, the analysis was repeated, excluding the data fromPanel B to determine the effect of this panel on the outcome of the analysis.These data are summarized in Table 5.4.
Removing this panel does affect the outcome of this analysis. The logitpredicts a 4.23 % probability of perforation at the NIJ reference velocityand the probit predicts a 2.92 % probability of perforation. Both of theseresults would meet the criteria required by the NIJ standard. The c-log-logmodel predicts a 7.38 % probability of perforation, but there is no informa-tion to indicate that this armor model is best described by an asymmetricdistribution.
5.3.2 Effect of Shots with Velocities above 541 m/s
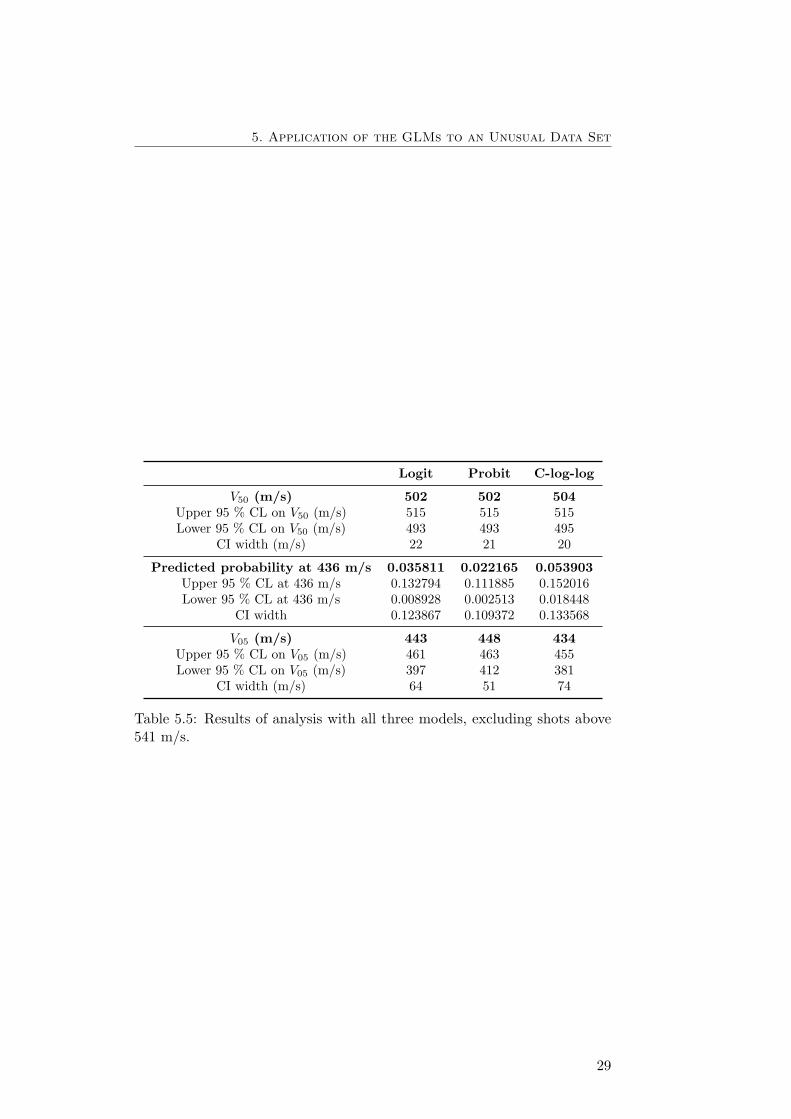
All shots above 541 m/s (1775 ft/s) were arbitrarily excluded (resulting inthe exclusion of 13 data points) and the analysis was repeated (Table 5.5).
The examination of the armor, which indicated that the bullet behav-ior may have changed dramatically as a function of velocity (due to bulletfragmentation) can be used to justify this approach. Again, the logisticregression analysis indicated that the probability of perforation at the NIJreference velocity is less than 5 %. The logit predicts a 3.58 % probabilityof perforation at the NIJ reference velocity and the probit predicts a 2.22 %probability of perforation. The c-log-log model predicts a 5.39 % probabilityof perforation, but again, there is no information to indicate that this armormodel is best described by an asymmetric distribution.
28
5. Application of the GLMs to an Unusual Data Set
Logit Probit C-log-log
V50 (m/s) 502 502 504Upper 95 % CL on V50 (m/s) 515 515 515Lower 95 % CL on V50 (m/s) 493 493 495
CI width (m/s) 22 21 20
Predicted probability at 436 m/s 0.035811 0.022165 0.053903Upper 95 % CL at 436 m/s 0.132794 0.111885 0.152016Lower 95 % CL at 436 m/s 0.008928 0.002513 0.018448
CI width 0.123867 0.109372 0.133568
V05 (m/s) 443 448 434Upper 95 % CL on V05 (m/s) 461 463 455Lower 95 % CL on V05 (m/s) 397 412 381
CI width (m/s) 64 51 74
Table 5.5: Results of analysis with all three models, excluding shots above541 m/s.
29

Analysis of Regression Models to Estimate the Ballistic
Performance of Body Armor
This page intentionally left blank.
30

6 Summary and Conclusions
This work shows that the choice of link function, between the logit, theprobit and the complementary log-log link functions, is not the most impor-tant issue in V50 ballistic limit performance estimation, since the differentGLMs examined all gave similar results. The three regression models havebeen applied to the ballistic data and then evaluated, but none of themdistinguished itself from the others in terms of armor performance estima-tion. Findings indicate that for all the ballistic data studied, all three linkfunctions behave similarly, even if the model selection criteria prefer a par-ticular regression model. The diverse criteria calculated for all three modelswere of the same magnitude; therefore, even if one model has a lower valuefor a criterion, the two other models’ criterion values are close. Overall, itcan be concluded that for the ballistic data sets examined herein, the logitand probit link functions performed well and seemed to give more accurateestimation of the ballistic performances than the c-log-log function.
The primary objective of this study was to analyze the three regressionmodels to determine which model produces a good estimate of the perfor-mance of a body armor model, and to understand how an armor model’sperformance changes with environmental conditioning. Slight preference canbe assigned to the probit and logistic models for new armor, because theygave consistently good results. The comparison of V50 ballistic performanceresults of new and environmentally conditioned armors shows that in generalthe armor’s model performance decreases as it is conditioned. Moreover, allthree regression models are appropriate distribution models for both newand aged armor samples. If an initial distribution model is deemed appro-priate for new armor, it will continue to describe well the armor as it ages.
The second objective of this study was to examine the usefulness of ap-plying different models to ballistic limit data analysis of a new armor withballistic limit test results that may indicate that the logistic model is not theappropriate model for this armor. The detailed analysis of V50 data from anew hybrid armor, to examine the effect of symmetric and asymmetric re-gression models (logit, probit, c-log-log) on the predicted performance of thearmor at the NIJ reference velocity, showed no effect on the test outcome.Furthermore, there is no evidence to indicate that this armor model is betterdescribed by an asymmetric regression model than a symmetric one. How-ever, in the course of completing this analysis, one panel, Armor Panel B
31

Analysis of Regression Models to Estimate the Ballistic
Performance of Body Armor
back, appeared to have a high number of high velocity stops. Possible expla-nations of this observation were discussed, including a bullet fragmentationphenomenon, or test anomalies occurring during the test in the laboratory.The high velocity stops observed on this panel contribute to a wide ZMR inthe ballistic limit calculations, causing the probability of perforation at theNIJ reference velocity to be higher than the acceptable (5 %) criteria. Inan effort to better understand the effect of this panel on the test outcome,analysis was repeated with all three models in two different ways: excludingPanel B back from the calculation, and excluding shots above 541 m/s fromthe calculation. However, the exclusion of either data set is justifiable onlyif it can be shown that the tests or test conditions were different from whatis specified in the NIJ standard.
32

7 References
[1] National Institute of Justice. Ballistic Resistance of Body Armor. NIJStandard–0101.06. U.S. Department of Justice, Office of Justice Pro-grams, Washington, DC, July 2008.
[2] D. W. Hosmer and S. Lemeshow. Applied Logistic Regression. JohnWiley & Sons, NY, 2nd edition, 2000.
[3] H. Akaike. Information theory and an extension of the maximum likeli-hood principle. In Proceedings of the Second International Symposiumon Information Theory, pages 610–624, New York, 1973.
[4] A. L. Forster, K. D. Rice, M. A. Riley, G. Messin, S. Petit, C. Clerici,G. Holmes, and J. W. Chin. Development of soft armor conditioningprotocols for NIJ–0101.06: Analytical results. NISTIR 7627, 2009.
[5] J. S. Albert and S. Chib. Bayesian analysis of binary and polychotomousresponse data. Journal of the American Statistical Association, 88(422):669–679, 1993.
[6] A. J. Dobson. An Introduction to Generalized Linear Models. Chapman& Hall, Boca Raton, FL, 2nd edition, 2001.
[7] J. Gill. Generalized linear models: a unified approach. In Sage Univer-sity Papers Series Volume 134, Thousand Oaks, CA, 2001.
[8] J. W. Hardin and J. M. Hilbe. Generalized Linear Models and Exten-sions. Stat Press Publication, College Station, TX, 2nd edition, 2007.
[9] P. McCullagh and J. A. Nelder. Generalized Linear Models. Chapman& Hall, London, 2nd edition, 1989.
[10] J. A. Nelder and R. W. M. Wedderburn. Generalized linear models.Journal of The Royal Statistical Society. Series A (General), 135(3):370–384, 1972.
[11] A. Agresti. Introduction to Categorical Data Analysis. John Wiley &Sons, 2nd edition, 2007.
[12] D. J. Finney. Probit Analysis. Cambridge University Press, Cambridge,UK, 3rd edition, 1971.
33

Analysis of Regression Models to Estimate the Ballistic
Performance of Body Armor
[13] B. G. Greenberg. Chester I. Bliss, 1899-1979. International StatisticalReview, 8(1):135–136, 1980.
[14] J. S. Cramer. Logit Models from Economics and Other Fields, Chapter9: Origin and Development of the Probit and Logit Models. CambridgeUniversity Press, Cambridge, UK, 1971.
[15] D. G. Altman. Practical Statistics for Medical Research. Chapman &Hall, 1991.
[16] P. Armitage, G. Berry, and J.N.S. Matthews. Statistical Methods inMedical Research. Blackwell, Oxford, 4th edition, 2002.
[17] F. E. Jr Harrell. Regression Modeling Strategies: with Applications toLinear Models, Logistic Regression, and Survival Analysis. Springer,2001.
[18] J. L. Horowitz and N. E. Savin. Binary response models: Logits, pro-bits and semiparametrics. Journal of Economic Perspectives, AmericanEconomic Association, 15(4):43–56, Fall 2001.
[19] A. Agresti. Categorical Data Analysis, chapter 6: Building and Apply-ing Logistic Regression Models. John Wiley & Sons, Hoboken, NJ, 2ndedition, 2002.
[20] D. Collett. Modelling Binary Data. Chapman & Hall, Boca Raton, FL,2nd edition, 2003.
[21] F. Huettmann and J. Linke. Assessment of Different Link Functionsfor Modeling Binary Data to Derive Sound Inferences and Predictions.Springer, Berlin, 2003.
[22] D. R. Cox and E. J. Snell. Analysis of Binary Data. Chapman & Hall,NY, 2nd edition, 1989.
[23] W. H. Greene. Econometric Analysis. Prentice Hall, Upper SaddleRiver, NJ, 3rd edition, 1997.
[24] S. J. Long. Regression Models for Categorical and Limited DependentVariables (Advanced Quantitative Techniques in the Social Sciences).Sage Publications, Thousand Oaks, CA, 1997.
[25] A. C. Cameron and P. K. Trivedi. Microeconomics Using Stata. StataPress, College Station, TX, 2009.
[26] E. A. Chambers and D. R. Cox. Discrimination between alternativebinary response models. Biometrika, 54:573–578, 1967.
[27] E. D. Hahn and R. Soyer. Probit and logit models: Differences in a mul-tivariate realm. The Journal of the Royal Statistical Society, Series B,2005. URL http://home.gwu.edu/~soyer/mv1h.pdf. Working Paper.
34

REFERENCES
[28] B. P. Kneubuhl. Improved test procedures for body armour. In Pro-ceedings of the Personal Armour Systems Symposium, Colchester, UK,1996.
[29] P. L. Gotts, P. M. Fenne, and D. W. Leeming. The application of criticalperformance analysis to UK military and police personal armour. InProceedings of the Personal Armour Systems Symposium, The Hague,Netherlands, 2004.
[30] M. Van Es. Improved method to determine the stop velocity of armour.In Proceedings of the Personal Armour Systems Symposium, Leeds, UK,2006.
[31] M. Maldague. Evaluation of some methods in order to determine v50.In Proceedings of the Personal Armour Systems Symposium, Brussels,Belgiums, 2008.
[32] E. J. Gumbel. Statistical Theory of Extreme Values and Some Practi-cal Applications. National Bureau of Standards Applied MathematicsSeries 33, Washington, DC, 1954.
[33] NIST/SEMATECH e-Handbook of Statistical Methods, 2010. URLhttp://www.itl.nist.gov/div898/handbook/.
[34] D. Leber. Assessment of body armor characteristics. National Instituteof Standards and Technology internal communication, March 2006.
[35] R Development Core Team. R: A Language and Environment for Sta-tistical Computing. R Foundation for Statistical Computing, Vienna,Austria, 2009. URL http://www.R-project.org.
[36] W. N. Venables and B. D. Ripley. Modern Applied Statistics with S.Springer, 4th edition, 2002.
[37] Department of Defense. Test Method Standard for Performance Re-quirements and Testing of Body Armor. MIL-STD-3027. U.S. Depart-ment of Defense, Washington, DC, January 2007.
[38] NATO Standardization Agency, Draft STANAG. Procedures for Eval-uating the Protection Levels of Logistic and Light Armoured Vehicles.AEP-55. NATO/PFP Unclassified, 1st edition, January 2004.
35