Analysis of the General Trends in the 15th Lok Sabhacs1110239/download/report.pdfAnalysis of the...
48
Analysis of the General Trends in the 15th Lok Sabha A PROJECT REPORT for the course CSP 301: DESIGN PRACTICES IN COMPUTER SCIENCE INDIAN INSTITUTE OF TECHNOLOGY Submitted by – Palas (2011CS10239) Abhishek Nimesh (2011CS10203) Lokesh Yadav (2011CS10226) Viswateja G (2011CS10260)
Transcript of Analysis of the General Trends in the 15th Lok Sabhacs1110239/download/report.pdfAnalysis of the...

Analysis of the General Trends in the 15th Lok
Sabha
A PROJECT REPORT
for the course
CSP 301: DESIGN PRACTICES IN COMPUTER SCIENCE
INDIAN INSTITUTE OF TECHNOLOGY
Submitted by –
Palas (2011CS10239)
Abhishek Nimesh (2011CS10203)
Lokesh Yadav (2011CS10226)
Viswateja G (2011CS10260)
BONAFIDE CERTIFICATE
Certified that this Project Report
“Analysis of the General Trends in the 15th Lok Sabha”
is the bonafide work of
“PALAS,ABHISHEK NIMESH,VISWA TEJA,
LOKESH YADAV” ,
who carried out the project work under my supervision.
Signature: …………………………….
Name: ……………………………. Date: …………………………….

Table of Contents
Section I – The Home Page
Section II – Parliamentry composition Analysis
Section III – Do Your Own Analysis
Section IV – Clashing State and Political parties on the
same Visualisation
Section V – Find Your MP
Section VI – Hypothesis Corner

Introduction
Governance is a development issue and good governance is a key requirement for effective and inclusive development. Governance is about the way that decisions are made in villages, towns, cities, provinces, and countries. For those in government, it is the exercise of authority to manage the affairs of a constituency. While the government normally has the final say when it comes to public policies, programs, laws, and regulations, it is not the only player. Citizens, civil society organisations, and the private sector also have a role to play. Governance is about how government, civil society, and the private sector work together. Governance tells us HOW the government functions, WHO is involved in the policy process, and WHERE the effects, both positive and negative, of political activity, are distributed in a society. Which is why, the analysis of the governmental body that shapes the future of our nation is of supreme importance. Change stems from awareness, and awareness through information. This report is a modest attempt to analyze, without bias, and with accuracy, the trends in the composition of the Indian Parliament.
Structure of the analysis
We built a complete website, that enables the viewer to both see the findings
with a quick glance and to do his/her own analysis , if preferred. Using Google
Charts and Java Applets, we made an interactive and attractive environment to
attract the user to discover the patterns in the Parliament and hence make
informed conclusions.
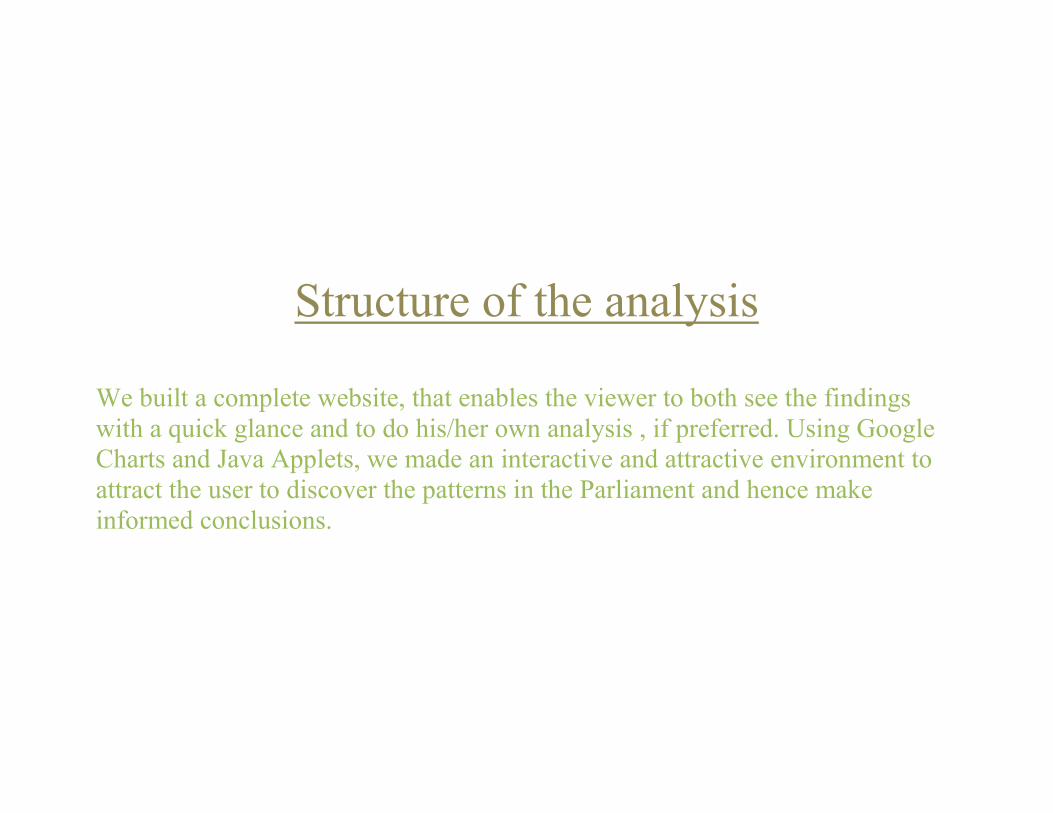
Section I
THE HOME PAGE

Key Features :
- A side-scrollable galley of
images and interesting facts, to capture the attention of the
user, and to present main findings succinctly.
- The sidebar has links to the
report and references and also the contact details.


Section 2
Parliamentry Composition Analysis
In this section, we analyse the composition of the Indian
Parliament – how the members of the parliament are distributed
age-wise, gender-wise and according to a plethora of other factors.

State wise distribution of the MP’s – Uttar Pradesh, Maharashtra , West Bengal, Andhra Pradesh and
Bihar are at the forefront. This measure is directly linked to the size of the states – the bigger the
state, the more the number of constituencies, and hence, more MP’s.

An overwhelming majority of only two parties – Indian National Congress and Bharatiya Janata
Party. The parties that immediately follow are state parties, pointing to the large electoral power of
these states.

In almost all states, the orange bar representing the age group of 50-60 peaks. Clearly, the average
age composition of the Parliament is on the higher side.

A massive contrast in the Gender Composition – Male MP’s predominate. A single way to empower
the stand of women in the parliament is by the means of a reservation for them but that bill has
also not received any justice till now even after been circling around in the parliament for last 10
years just because for the bill to pass in the parliament there is a requirement of 2/3rd majority and
which is very hard to get when the lok sabha is already dominated by male members.

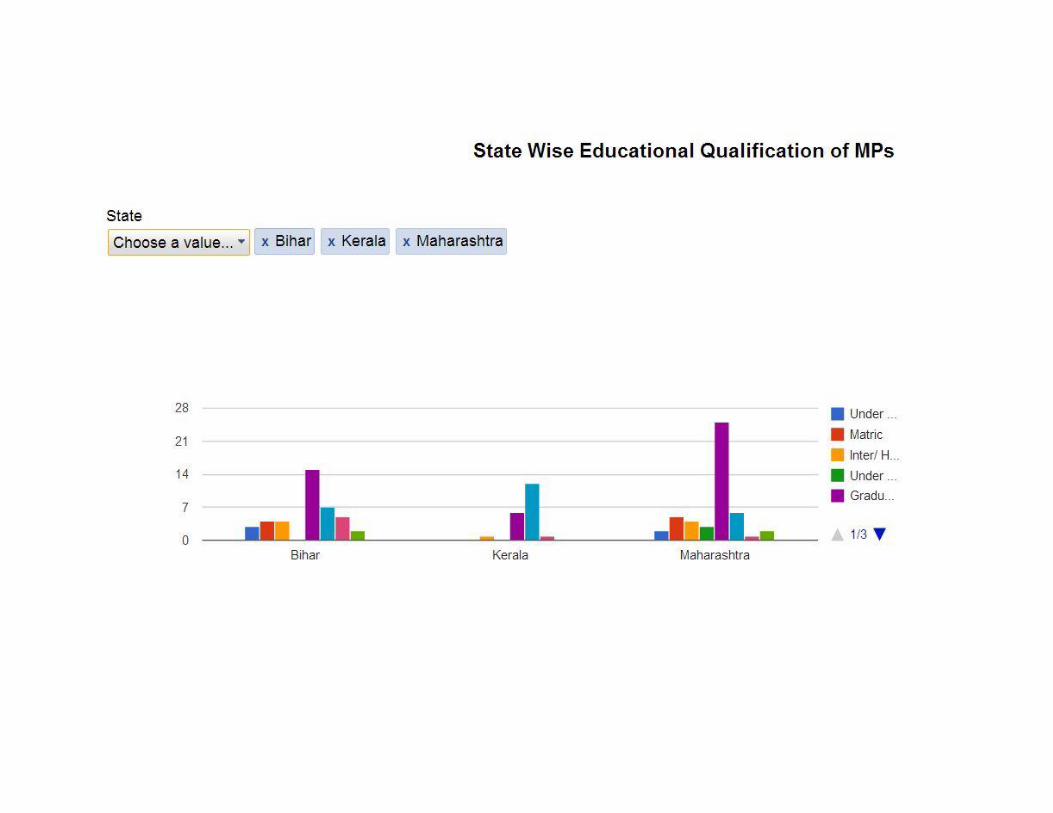
Graduate level is the most common level of education among MP’s. However , a significant portion
have meager educational qualifications , bringing up the question as to if they are knowledgable
enough to do their task of running the whole country.
Section III
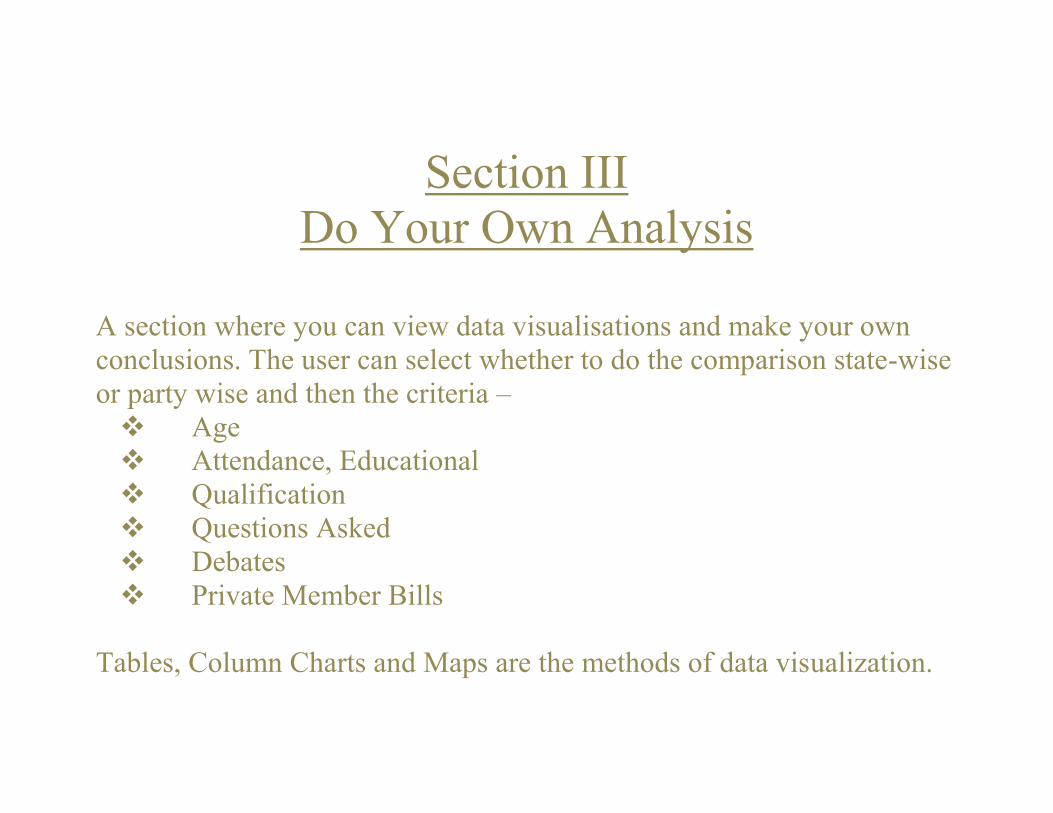
Do Your Own Analysis
A section where you can view data visualisations and make your own
conclusions. The user can select whether to do the comparison state-wise
or party wise and then the criteria –
Age
Attendance, Educational
Qualification
Questions Asked
Debates
Private Member Bills
Tables, Column Charts and Maps are the methods of data visualization.

State-Wise Comparison

Intensity map of age distribution. Darker areas represent higher average age.
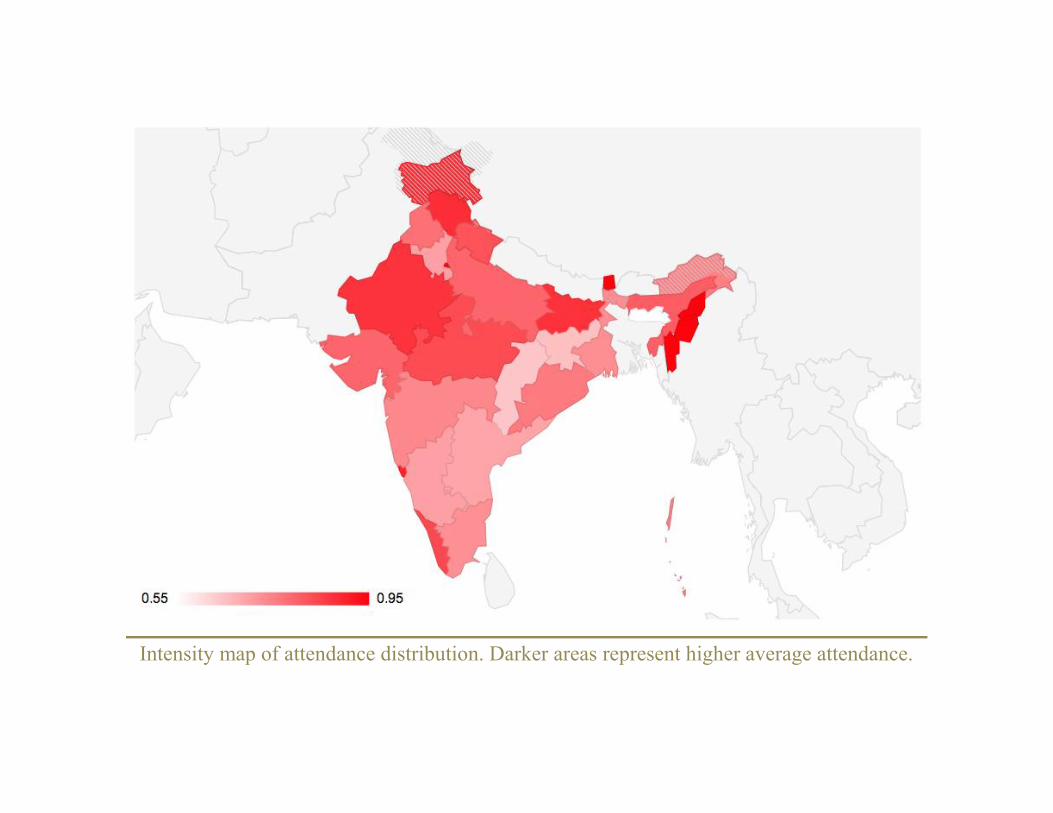
Intensity map of attendance distribution. Darker areas represent higher average attendance.

Intensity map of educational qualification distribution. Darker areas represent states with better
education levels.
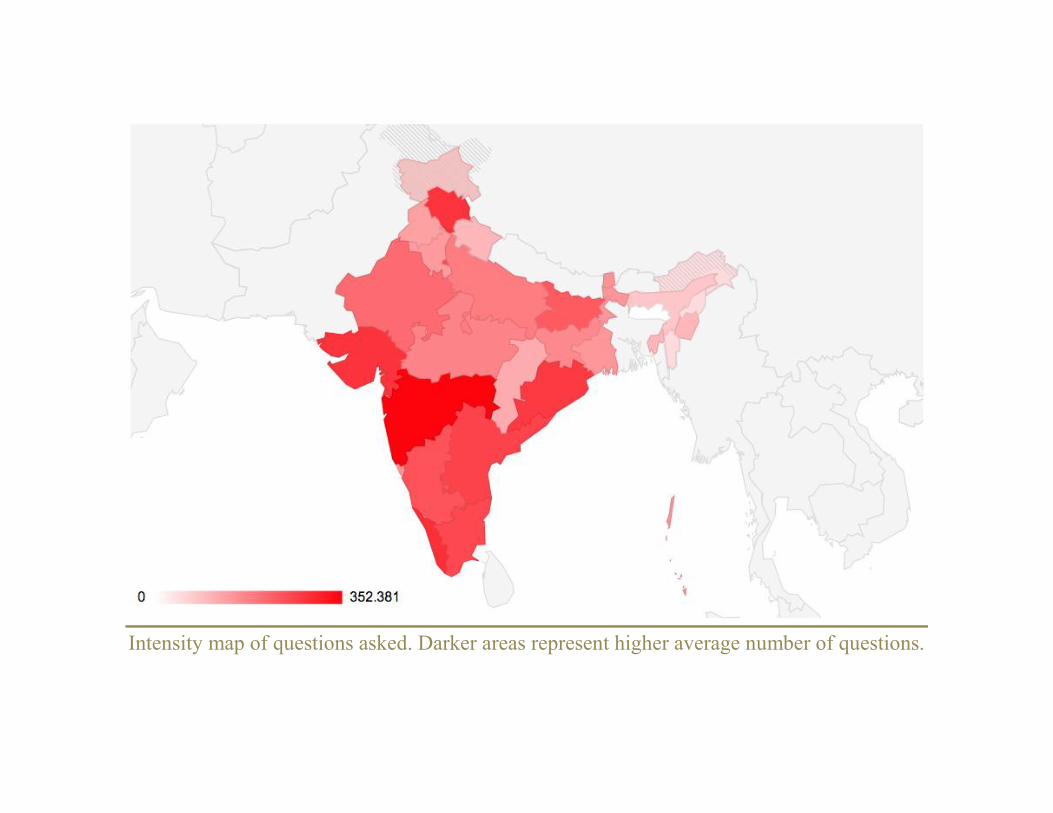
Intensity map of questions asked. Darker areas represent higher average number of questions.

Intensity map of private members bills. Darker areas represent higher number of bills passed.

Intensity map of debates. Darker areas represent higher number of debates.

Other Methods of Data Visualisation - Table and Chart
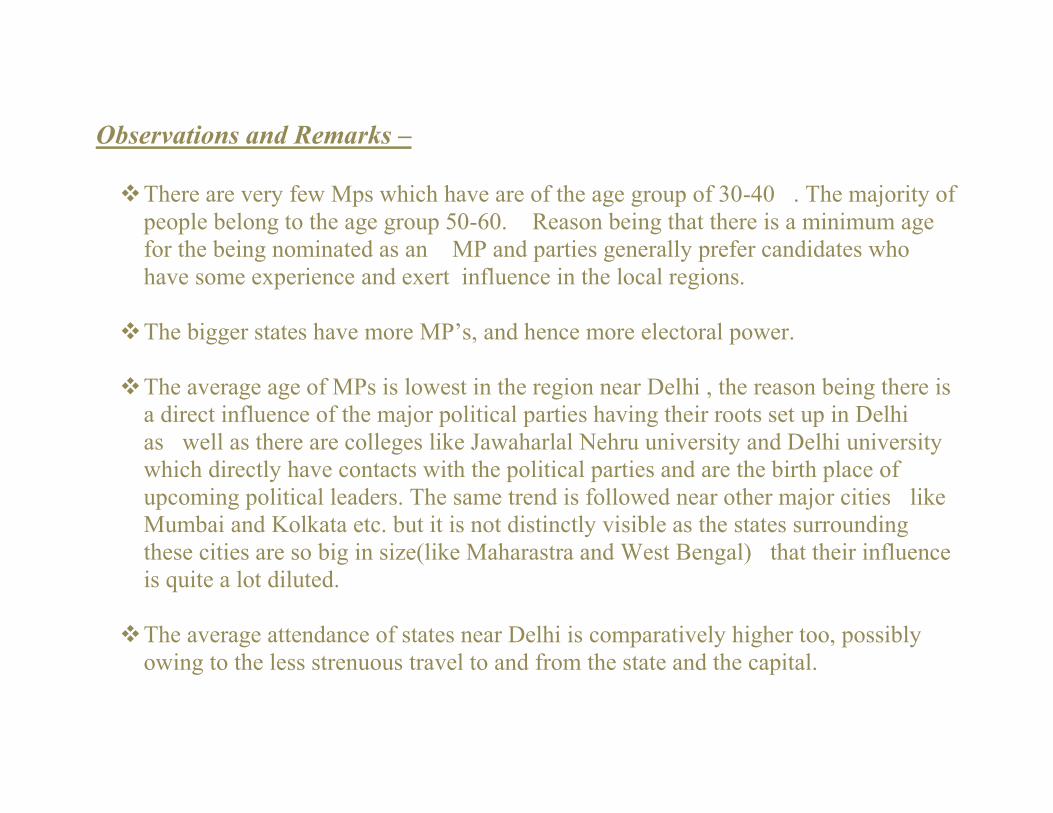
Observations and Remarks –
There are very few Mps which have are of the age group of 30-40 . The majority of
people belong to the age group 50-60. Reason being that there is a minimum age
for the being nominated as an MP and parties generally prefer candidates who
have some experience and exert influence in the local regions.
The bigger states have more MP’s, and hence more electoral power.
The average age of MPs is lowest in the region near Delhi , the reason being there is
a direct influence of the major political parties having their roots set up in Delhi
as well as there are colleges like Jawaharlal Nehru university and Delhi university
which directly have contacts with the political parties and are the birth place of
upcoming political leaders. The same trend is followed near other major cities like
Mumbai and Kolkata etc. but it is not distinctly visible as the states surrounding
these cities are so big in size(like Maharastra and West Bengal) that their influence
is quite a lot diluted.
The average attendance of states near Delhi is comparatively higher too, possibly
owing to the less strenuous travel to and from the state and the capital.

Party-Wise Comparison


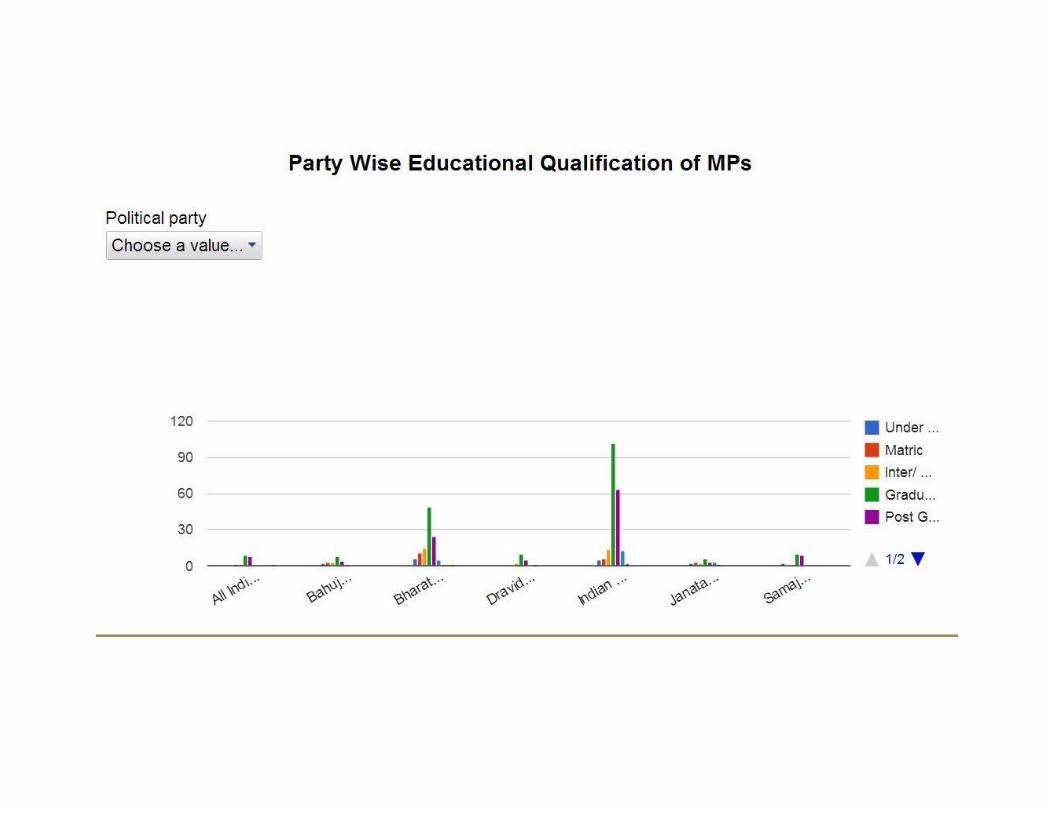


Observations and Remarks –
The overall trends follow the same pattern as in the country- the age group of
50-60 is dominant in each political party, the attendance and education levels are
largely similar too. There is not much contrast between political parties on these
grounds.

Section IV
COMPILATION – CLASHING
TOGETHER STATE AND PARTIES ON
THE SAME VISUALISATION


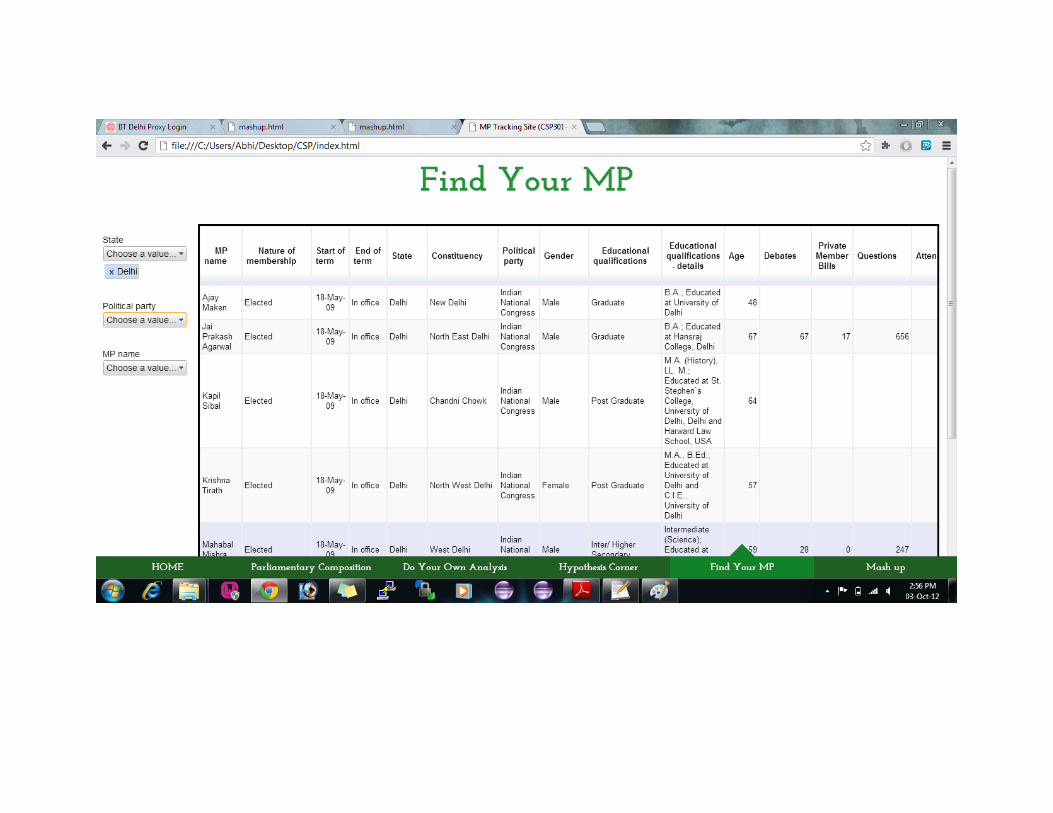
SECTION V –
FIND YOUR MP
A tool to easily find out your electoral representative and
track his/her performance.


Section VI -
Hypothesis Corner

Hypothesis – MP’s above a certain age have low attendance.

Hypothesis – Smaller states have better attendance statistics.

Hypothesis – Female MP’s are more educated than male MP’s.