Analysis of Salvador and El Centro School Boundaries SEPTEMBER 16, 2015.
16
Analysis of Salvador and El Centro School Boundaries SEPTEMBER 16, 2015
-
Upload
gwendolyn-robertson -
Category
Documents
-
view
217 -
download
0
Transcript of Analysis of Salvador and El Centro School Boundaries SEPTEMBER 16, 2015.

Analysis of Salvador and El Centro School
Boundaries
SEPTEMBER 16, 2015

KEY POINTS Elementary Enrollment in North Napa is declining Potential Growth in South Napa Middle Schools are Projected to Grow Harvest and Silverado need growth capacity to accommodate planned development
El Centro and Salvador are recommended to be combined 240 + 240 Consolidation is recommended for August, 2018 The District will be asking for staff and parent input for the design of the consolidated school
9/16/2015 2
Parameters of the Demographic Analysis
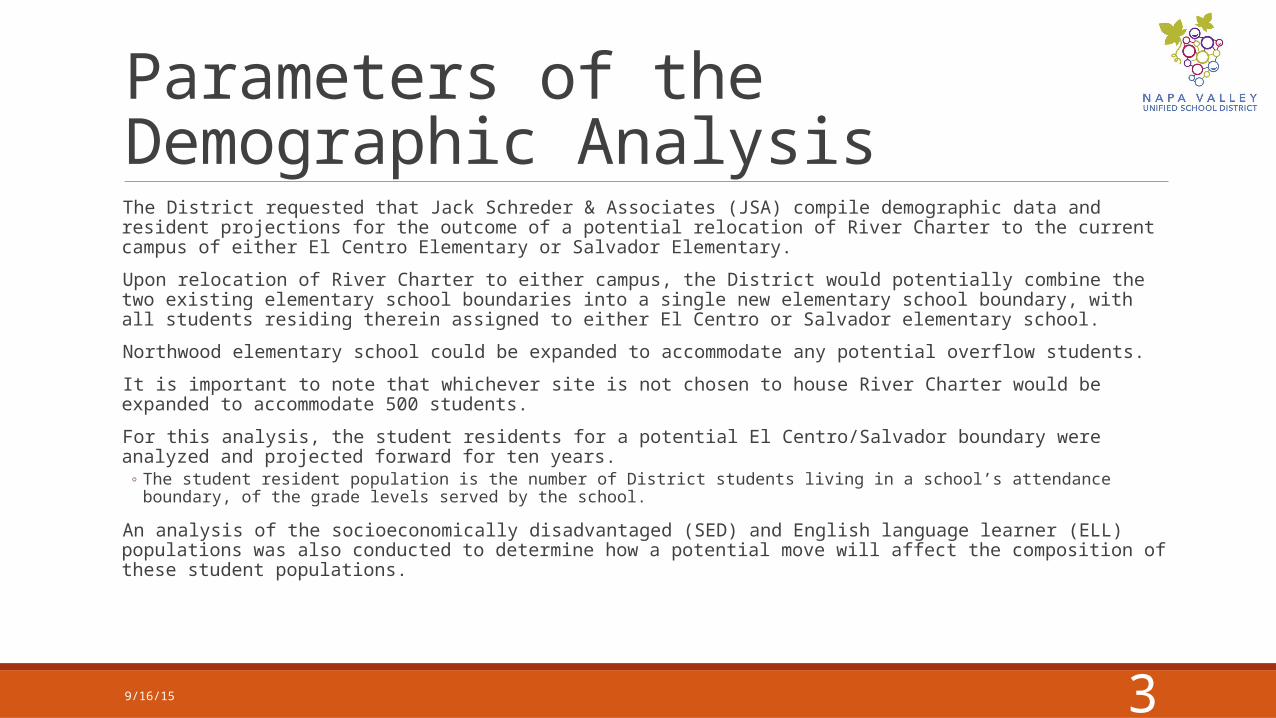
The District requested that Jack Schreder & Associates (JSA) compile demographic data and resident projections for the outcome of a potential relocation of River Charter to the current campus of either El Centro Elementary or Salvador Elementary.
Upon relocation of River Charter to either campus, the District would potentially combine the two existing elementary school boundaries into a single new elementary school boundary, with all students residing therein assigned to either El Centro or Salvador elementary school.
Northwood elementary school could be expanded to accommodate any potential overflow students.
It is important to note that whichever site is not chosen to house River Charter would be expanded to accommodate 500 students.
For this analysis, the student residents for a potential El Centro/Salvador boundary were analyzed and projected forward for ten years.
◦ The student resident population is the number of District students living in a school’s attendance boundary, of the grade levels served by the school.
An analysis of the socioeconomically disadvantaged (SED) and English language learner (ELL) populations was also conducted to determine how a potential move will affect the composition of these student populations.
9/16/15 3
Potential Residential Development
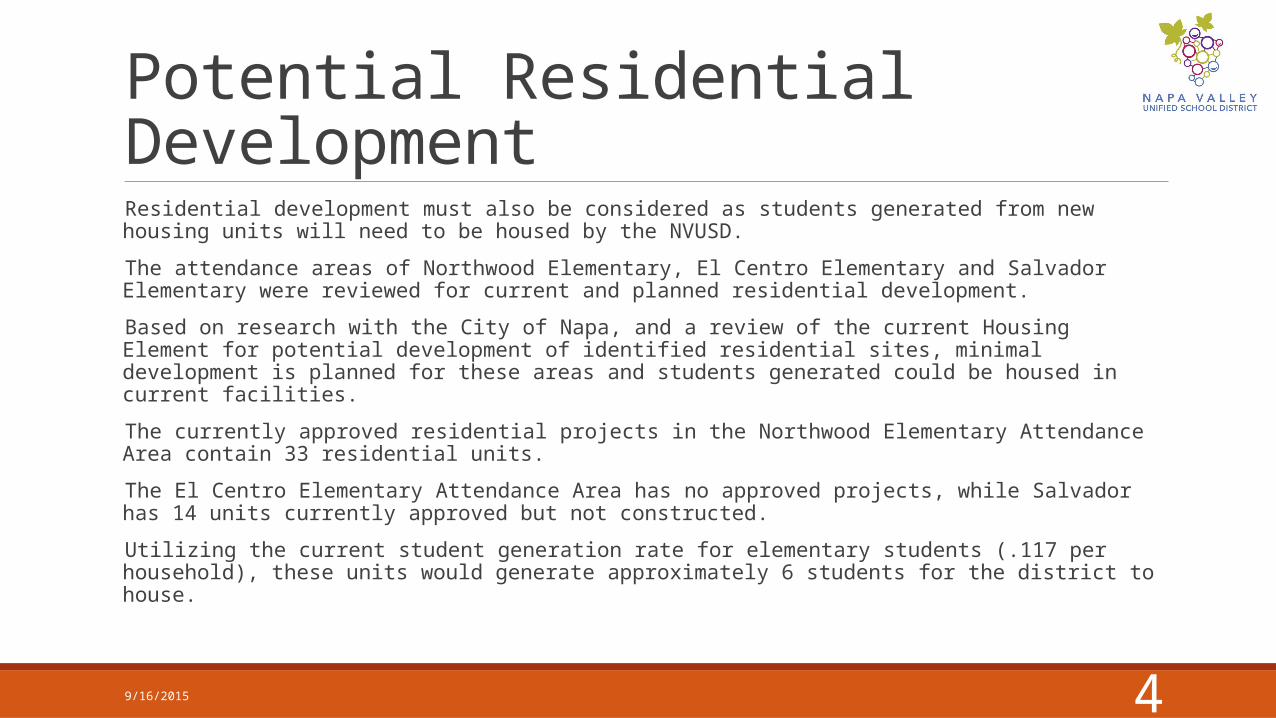
Residential development must also be considered as students generated from new housing units will need to be housed by the NVUSD.
The attendance areas of Northwood Elementary, El Centro Elementary and Salvador Elementary were reviewed for current and planned residential development.
Based on research with the City of Napa, and a review of the current Housing Element for potential development of identified residential sites, minimal development is planned for these areas and students generated could be housed in current facilities.
The currently approved residential projects in the Northwood Elementary Attendance Area contain 33 residential units.
The El Centro Elementary Attendance Area has no approved projects, while Salvador has 14 units currently approved but not constructed.
Utilizing the current student generation rate for elementary students (.117 per household), these units would generate approximately 6 students for the district to house.
9/16/2015 4
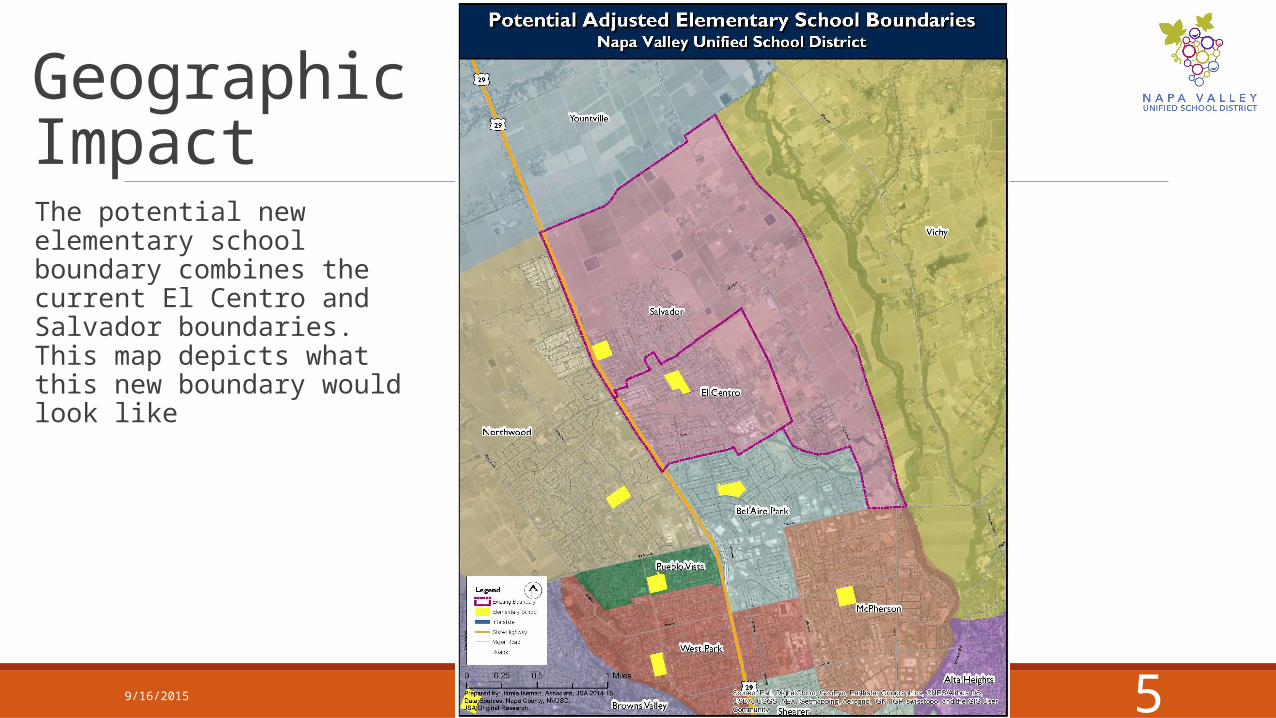
Geographic ImpactThe potential new elementary school boundary combines the current El Centro and Salvador boundaries. This map depicts what this new boundary would look like
9/16/2015 5

Current Resident Projections El Centro’s existing student resident population of TK-5th grade student residents is projected to decline until 2018, then remain stable for the rest of the projection period.
Salvador’s existing student resident population of TK-5th grade student residents is projected to decline gradually until 2017, after which time it also stabilizes for the remainder of the projection period.
Actual Residents
Projected Residents in El Centro Boundary
2014-15
2015-16
2016-17
2017-18
2018-19
2019-20
2020-21
2021-22
2022-23
2023-24
2024-25
TK 7 9 9 8 8 9 9 9 9 9 9
K 34 35 37 33 33 34 34 35 35 36 37
1 41 36 37 39 35 35 36 36 37 37 38
2 46 44 39 39 42 38 38 38 39 40 40
3 55 47 45 40 41 43 39 39 40 40 41
4 57 56 48 46 41 41 44 40 40 40 41
5 41 60 58 51 49 44 44 47 43 42 43
Total 281 286 274 257 248 243 244 244 242 245 249
9/16/2015 6
Actual Residents
Projected Residents in Salvador Boundary
2014-15
2015-16
2016-17
2017-18
2018-19
2019-20
2020-21
2021-22
2022-23
2023-24
2024-25
TK 6 8 8 7 7 7 7 8 8 8 8
K 21 23 24 22 21 22 22 23 23 23 24
1 21 20 22 23 21 20 21 21 22 22 23
2 23 18 17 19 21 18 18 18 19 19 19
3 30 26 21 21 22 24 21 21 21 22 22
4 25 31 27 22 21 23 25 22 22 22 23
5 34 29 34 31 26 25 26 28 25 25 26
Total 160 154 154 144 139 139 140 140 139 141 144

Combined Resident Projections The result of combining the two boundaries is a boosted student resident population of TK-5th grade students that declines until 2018, then stabilizes.
Actual Residents Projected Residents in Combined Boundary
2014-15 2015-16 2016-17 2017-18 2018-19 2019-20 2020-21 2021-22 2022-23 2023-24 2024-25
TK 13 16 18 16 15 16 16 16 17 17 17K 55 57 62 55 54 55 56 57 58 59 601 62 56 58 63 56 55 57 58 59 60 612 69 62 56 58 63 56 55 56 58 59 603 85 74 67 61 63 67 60 60 61 62 634 82 86 75 68 62 64 69 62 61 62 645 75 88 93 81 74 68 71 75 68 67 69Total 441 440 428 401 387 382 384 384 382 387 393
9/16/2015 7
Impact to SED and ELL Populations
9/16/2015 8
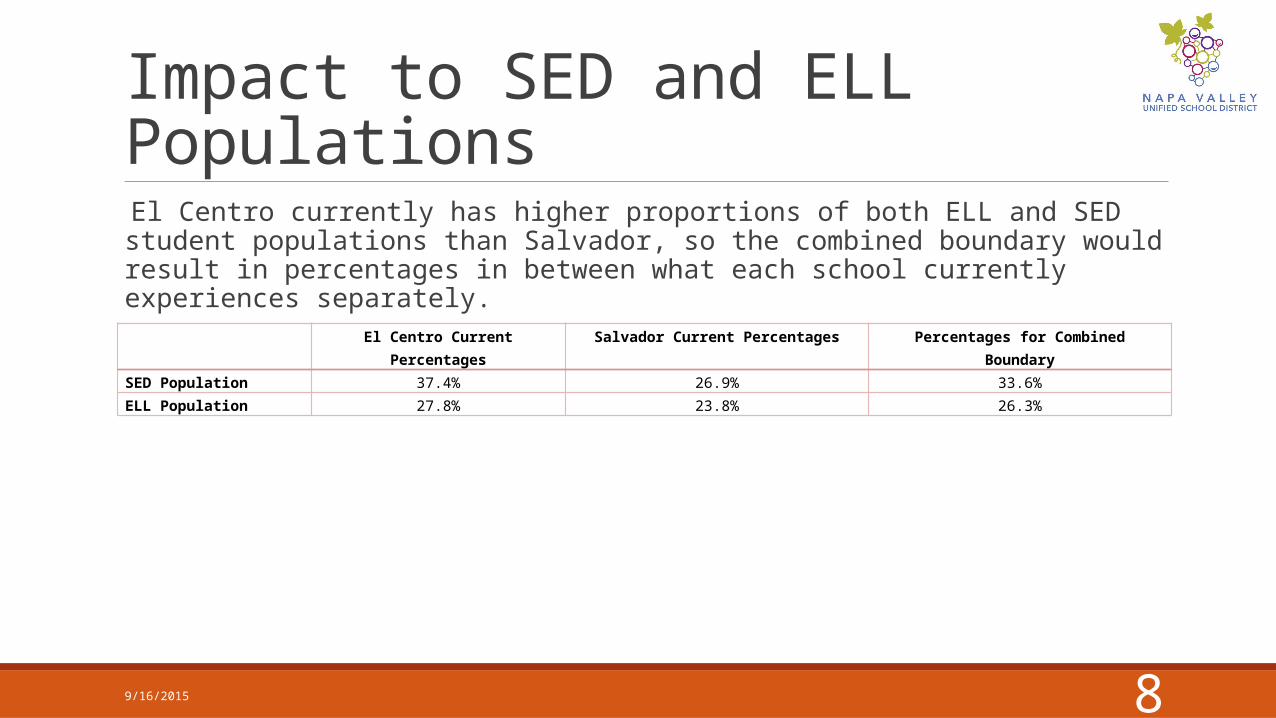
El Centro currently has higher proportions of both ELL and SED student populations than Salvador, so the combined boundary would result in percentages in between what each school currently experiences separately.
El Centro Current Percentages Salvador Current Percentages Percentages for Combined BoundarySED Population 37.4% 26.9% 33.6%ELL Population 27.8% 23.8% 26.3%
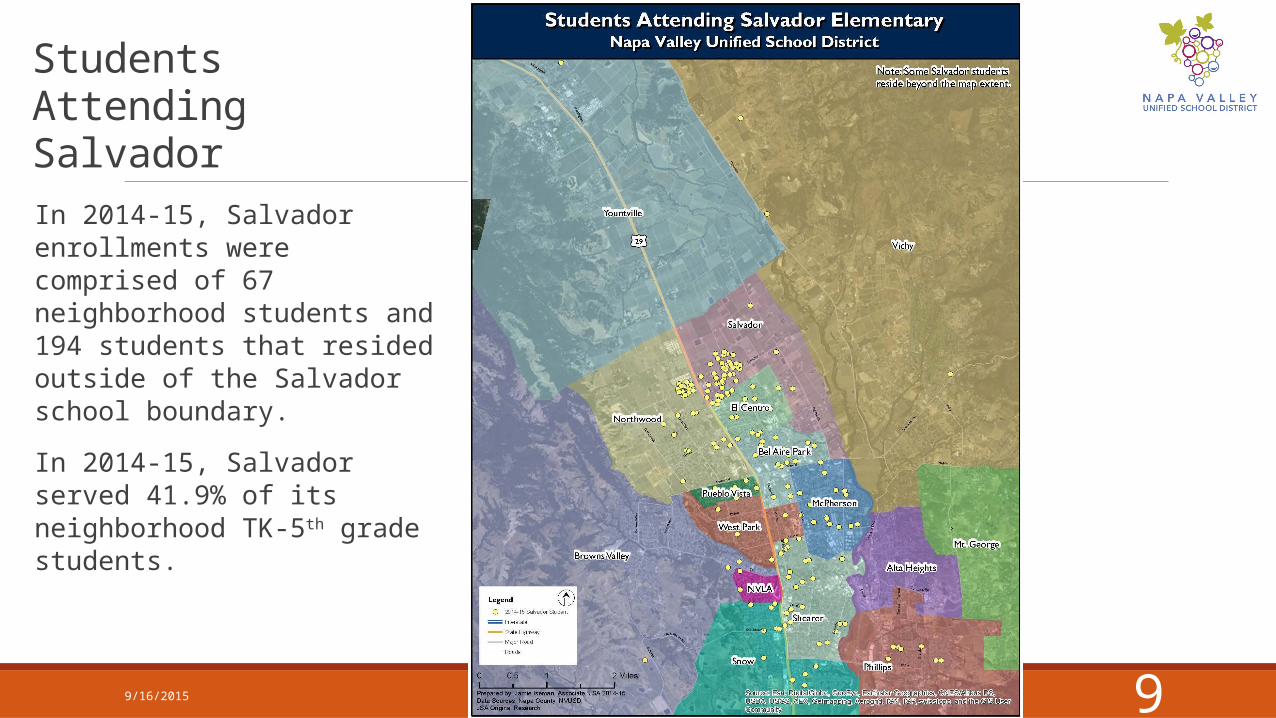
Students Attending SalvadorIn 2014-15, Salvador enrollments were comprised of 67 neighborhood students and 194 students that resided outside of the Salvador school boundary.
In 2014-15, Salvador served 41.9% of its neighborhood TK-5th grade students.
9/16/2015 9
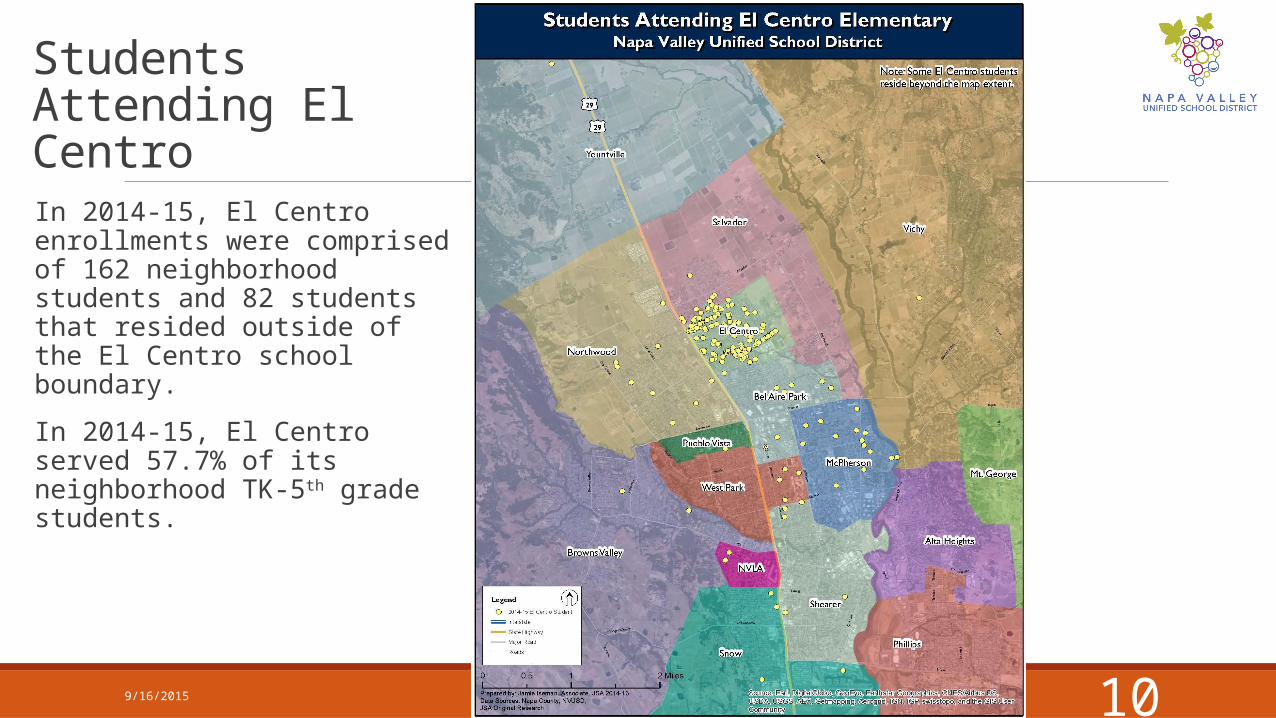
Students Attending El CentroIn 2014-15, El Centro enrollments were comprised of 162 neighborhood students and 82 students that resided outside of the El Centro school boundary.
In 2014-15, El Centro served 57.7% of its neighborhood TK-5th grade students.
9/16/2015 10

Map of StudentsMigrating from/toEl Centro and Salvador
9/16/2015 11
In 2014-15, 11 students attended El Centro who lived in the Salvador boundary. This equaled 6.9% of Salvador’s student residents.
In 2014-15, 21 students attended Salvador who lived in the El Centro boundary. This equaled 7.5% of Salvador’s student residents.
9/16/2015 12

9/16/2015 13

9/16/2015 14
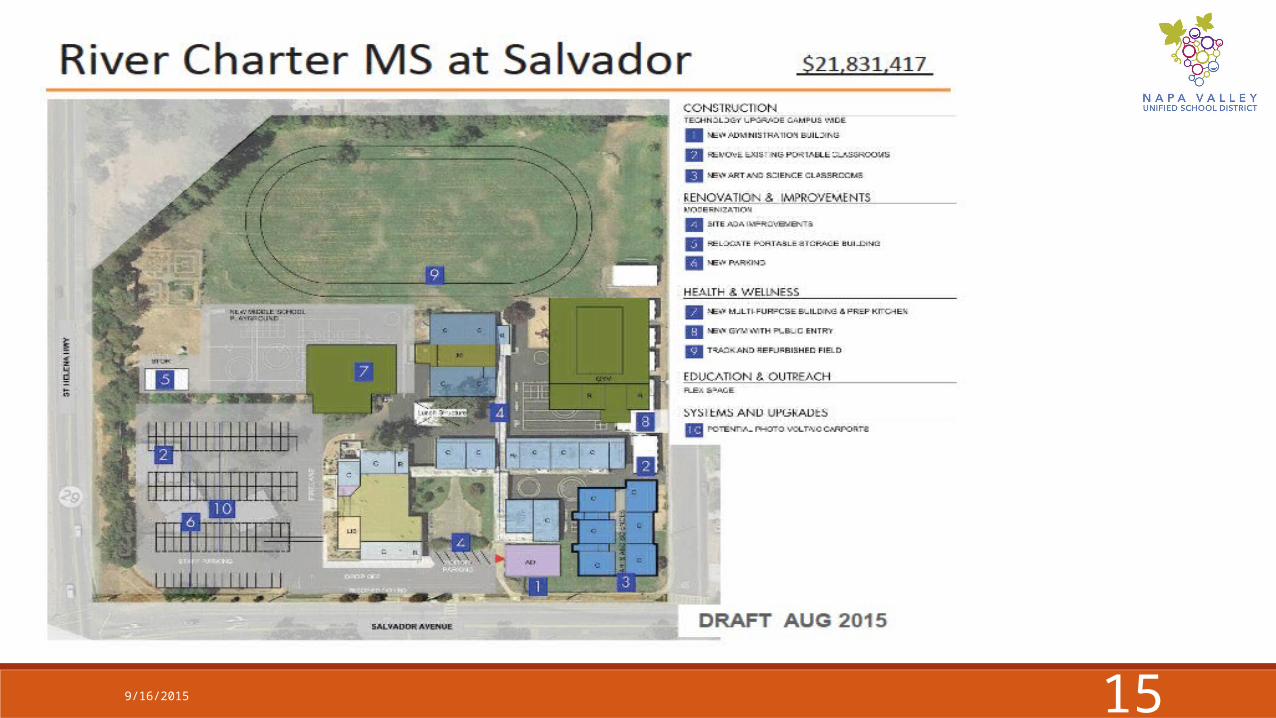
9/16/2015 15
Questions?THANK YOU.
169/16/2015