Analysis of Multi-Pollutant Initiatives in Electricity … of Multi-Pollutant Initiatives in...
23
Analysis of Multi-Pollutant Initiatives in Electricity Markets Presented to the 25 th USA/IAEE North American Conference By Robert T Eynon Energy Information Administration U.S. Department of Energy September 19, 2005
Transcript of Analysis of Multi-Pollutant Initiatives in Electricity … of Multi-Pollutant Initiatives in...

Analysis of Multi-Pollutant Initiatives in Electricity Markets
Presented to the
25th USA/IAEE North American Conference
ByRobert T Eynon
Energy Information AdministrationU.S. Department of Energy
September 19, 2005

Emission Targets in S.366, S.843, and S.1844
No cap2,332 million metric tons CO2 (636 million metric tons carbon equivalent) in 20092,244 million metric tons CO2 (612 million metric tons carbon equivalent) in 2013f
1,863 million metric tons CO2 (508 million metric tons carbon equivalent) in 2009e
Carbon Dioxide (CO2)
34 tons in 201015 tons in 2018
24 tons in 200910 tons in 2013d
5 tons in 2008cMercury (Hg)
4.4 million tons in 20103.0 million tons in 2018
4.5 million tons in 20093.5 million tons in 20132.25 million tons in 2016
2.25 million tons in 2009b
Sulfur Dioxide (SO2)
2.19 million tons in 20081.79 million tons in 2018a
1.87 million tons in 20091.7 million tons in 2013
1.51 million tons in 2009
Nitrogen Oxides (NOx)
S. 1844, Clear Skies Act (Inhofe)
S. 843, Clean Air Planning Act (Carper)
S. 366, Clean Power Act (Jeffords)
Emission

Oil and Gas
Supply Module
Natural Gas
Transmission
and Distribution
Module
Coal Market
Module
Renewable
Fuels Module
Supply
Residential
Demand Module
Commercial
Demand
Module
Transportation
Demand Module
Industrial
Demand Module
Demand
Electricity
Market
Module
Petroleum
Market
Module
Conversion
Macroeconomic
Activity
Module
International
Energy
Module
Integrating
Module
National Energy System Modeling

Clear Skies Act
• Emissions cap and trade• Safety valve • Grandfathering (based on fuel consumption)• Covers plants 25 megawatts and larger

Clean Air Planning Act
• Covers facilities 25 megawatt and greater• Minimum removal rate for mercury• Emissions cap and trade• Grandfathering (output based)

Clean Power Act
• Covers facilities 15 megawatts and larger• Emissions cap and trade except for Hg• Maximum emissions rate specified• Birthday provision (best available control
technology)
Analysis of Clear Skies Act (Inhofe)
• Add emissions control equipment• Use early credit program for mercury• Emissions targets not met for SO2 or Hg• Lowest resource cost and smallest price increase• CO2 emissions increase over time

Analysis of Clean Air Planning Act (Carper)
• Additions of emissions control equipment• Switch into natural gas and renewables• Sensitive to availability and cost of offsets• Higher resource costs than Clear Skies Act• CO2 Emissions increase

Analysis of Clean Power Act (Jeffords)
• Switching to gas, renewables, and nuclear• Birthday provision causes emissions for NOx, Hg
and SO2 to fall below targets• Has highest resource costs

Nitrogen Oxide Emissions in Alternative Cases(million tons)
0 .0
0 .5
1 .0
1 .5
2 .0
2 .5
3 .0
3 .5
4 .0
4 .5
5 .0
2 0 0 2 2 0 1 0 2 0 2 0 2 0 2 5
R e fe re n c eIn h o feC a rp e r In te rn a t io n a lC a rp e r D o m e s t icJ e ffo rd s
T a rg e ts
C a rp e r J e ffo rd sIn h o fe

Electricity Sector Mercury Emissions in Alternative Cases
(tons)
0
10
20
30
40
50
60
2002 2010 2020 2025
Reference Inhofe Carper International Carper Dom estic Jeffords
T argetsCarper JeffordsInhofe

Electricity Sector Carbon and Carbon Dioxide Emissions in Alternative Cases
0
20
40
60
80
100
120
140
2010 2020 2025
2002
Dol
lars
per
Met
ricTo
n C
arbo
n Eq
uiva
lent
0
5
11
16
22
27
33
38
2002
Dol
lars
per
Met
ric T
on C
O2 E
quiv
alen
t
Reference Inhofe Carper International Carper Dom estic Jeffords

Nitrogen Oxide Allowance Price in the East(2002 dollars per ton)
0
500
1,000
1,500
2,000
2,500
3,000
2010 2020 2025
Reference Inhofe Carper International Carper Domestic Jeffords

Sulfur Dioxide Allowance Price in the East(2002 dollars per ton)
0
500
1,000
1,500
2,000
2,500
2010 2020 2025
Reference Inhofe Carper International Carper Domestic Jeffords

Mercury Allowance Price(thousand 2002 dollars per pound)
0
10
20
30
40
50
60
70
80
2010 2020 2025
Reference Inhofe Carper International Carper Domestic Jeffords
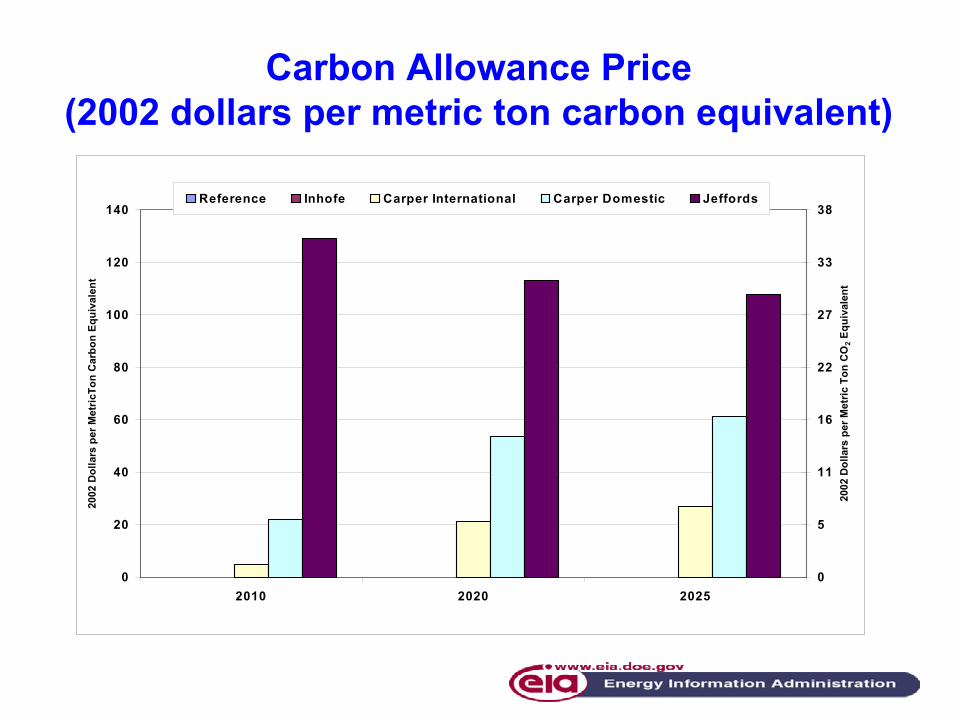
Carbon Allowance Price(2002 dollars per metric ton carbon equivalent)
0
20
40
60
80
100
120
140
2010 2020 2025
2002
Dol
lars
per
Met
ricTo
n C
arbo
n Eq
uiva
lent
0
5
11
16
22
27
33
38
2002
Dol
lars
per
Met
ric T
on C
O2 E
quiv
alen
t
Reference Inhofe Carper International Carper Domestic Jeffords

Coal-Fired Generation in Alternative Cases(billion kilowatthours)
0
500
1,000
1,500
2,000
2,500
3,000
3,500
2002 2010 2020 2025
ReferenceInhofeCarper InternationalCarper Dom esticJeffords

Natural Gas-Fired Generation in Alternative Cases
(billion kilowatthours)
0
200
400
600
800
1,000
1,200
1,400
1,600
1,800
2002 2010 2020 2025
ReferenceInhofeCarper InternationalCarper DomesticJeffords

Renewable Generation in Alternative Cases(billion kilowatthours)
0
200
400
600
800
1,000
1,200
1,400
2002 2010 2020 2025
ReferenceInhofeCarper InternationalCarper DomesticJeffords

Electricity Prices in Alternative Cases(2002 cents per kilowatthour)
0
2
4
6
8
10
12
2002 2010 2020 2025
Reference Inhofe Carper International Carper Dom estic Jeffords

Change in Resource Cost(billion 2002 dollars)
0
50
100
150
200
250
300
Inho fe C arp er In te rnatio na l C arp er D o m estic Je ffo rd s

Electricity Market Impacts
• Emission targets aren’t met in 2010 for Hg (Inhofe) or CO2 (Carper)
• Emissions decline more in the Jeffords Case
• Coal generation declines in all cases.
• Electricity prices increase more rapidly in the Jeffords Case.