
Analysis of fundamental physical factors influencing ...
18
ORIGINAL ARTICLE Analysis of fundamental physical factors influencing channel bank erosion: results for contrasting catchments in England and Wales V. J. J. Janes 1,2 • A. P. Nicholas 1 • A. L. Collins 3 • T. A. Quine 1 Received: 9 March 2016 / Accepted: 24 March 2017 / Published online: 12 April 2017 Ó The Author(s) 2017. This article is an open access publication Abstract Channel bank erosion processes are controlled by numerous factors and as such are both temporally and spatially variable. The significance of channel bank erosion to the sediment budget is difficult to quantify without extensive fieldwork/data analysis. In this study, the importance of key physical factors controlling channel bank erosion, including channel slope, upstream catchment area, channel confinement, and sinuosity, was explored using regression analysis. The resulting analysis can be used in practical studies to provide a first approximation of bank erosion rates (in catchments similar to those investi- gated). A data set of channel bank erosion rates covering eight contrasting river catchments across England and Wales, over a time period of up to 150 years, was created using a modified GIS methodology. The best predictors were found to be upstream area, channel confinement, and sinuosity with respect to dimensionless width-averaged retreat rates (m m -1 yr -1 ). Notwithstanding these rela- tionships, the results highlight the variability of the mag- nitude of sediment production by channel bank erosion both within and between catchments. Keywords Channel bank erosion Sediment Channel confinement Sinuosity Introduction Channel bank erosion processes are a source of sediment within river catchments and have been shown to represent a significant component of the catchment sediment budget (Collins et al. 1997; Owens et al. 2000; Wilkinson et al. 2005; De Rose et al. 2005; Walling and Collins 2005; Walling 2005; Walling et al. 1999, 2008; Collins et al. 2012; Kronvang et al. 2013; Lu et al. 2015; Neal and Andera 2015). Bank erosion may entrain fine-grained sediment with high loading of pollutants (e.g. nutrients including phosphorus and heavy metals). Additionally, enhanced sediment mobilisation and delivery can result in detrimental biological and ecological impacts in river systems such as a reduction in biodiversity (e.g. decreased salmon spawning success as observed by Theurer et al. 1998 and Soulsby et al. 2001), and lowering of productivity due to a reduction in the depth of the photic zone (Devlin et al. 2008). The EU Water Framework Directive (WFD) requires Member States to achieve chemical and ecological standards for rivers, and these are strongly influenced by fine sediment mobilisation and transport. Therefore, whilst explicit sediment thresholds are not defined in the WFD, there is growing recognition of the need for improved understanding of sediment generation mechanisms for supporting the development of river basin management plans aimed at controlling diffuse pollution problems (Collins et al. 2011). Rates of channel bank erosion are influenced by numerous factors such as the composition of bank material (Hooke 1980; Bull 1997; Couper 2003; Julian and Torres 2006), bank geometry (Micheli and Kirchner 2002; Laubel et al. 2003; Walling 2005; Walling et al. 2006), discharge magnitude (Knighton 1973; Gautier et al. 2007; Hooke 2008), and riparian vegetation (Micheli and Kirchner 2002; & V. J. J. Janes [email protected] 1 Department of Geography, University of Exeter, Exeter EX4 4RG, UK 2 Lancaster Environment Centre, University of Lancaster, Lancaster LA1 4YQ, UK 3 Sustainable Soils and Grassland Systems Department, Rothamsted Research, North Wyke, Okehampton EX20 2SB, UK 123 Environ Earth Sci (2017) 76:307 DOI 10.1007/s12665-017-6593-x
Transcript of Analysis of fundamental physical factors influencing ...

ORIGINAL ARTICLE
Analysis of fundamental physical factors influencing channel bankerosion: results for contrasting catchments in England and Wales
V. J. J. Janes1,2 • A. P. Nicholas1 • A. L. Collins3 • T. A. Quine1
Received: 9 March 2016 / Accepted: 24 March 2017 / Published online: 12 April 2017
� The Author(s) 2017. This article is an open access publication
Abstract Channel bank erosion processes are controlled
by numerous factors and as such are both temporally and
spatially variable. The significance of channel bank erosion
to the sediment budget is difficult to quantify without
extensive fieldwork/data analysis. In this study, the
importance of key physical factors controlling channel
bank erosion, including channel slope, upstream catchment
area, channel confinement, and sinuosity, was explored
using regression analysis. The resulting analysis can be
used in practical studies to provide a first approximation of
bank erosion rates (in catchments similar to those investi-
gated). A data set of channel bank erosion rates covering
eight contrasting river catchments across England and
Wales, over a time period of up to 150 years, was created
using a modified GIS methodology. The best predictors
were found to be upstream area, channel confinement, and
sinuosity with respect to dimensionless width-averaged
retreat rates (m m-1 yr-1). Notwithstanding these rela-
tionships, the results highlight the variability of the mag-
nitude of sediment production by channel bank erosion
both within and between catchments.
Keywords Channel bank erosion � Sediment � Channelconfinement � Sinuosity
Introduction
Channel bank erosion processes are a source of sediment
within river catchments and have been shown to represent a
significant component of the catchment sediment budget
(Collins et al. 1997; Owens et al. 2000; Wilkinson et al.
2005; De Rose et al. 2005; Walling and Collins 2005;
Walling 2005; Walling et al. 1999, 2008; Collins et al.
2012; Kronvang et al. 2013; Lu et al. 2015; Neal and
Andera 2015). Bank erosion may entrain fine-grained
sediment with high loading of pollutants (e.g. nutrients
including phosphorus and heavy metals). Additionally,
enhanced sediment mobilisation and delivery can result in
detrimental biological and ecological impacts in river
systems such as a reduction in biodiversity (e.g. decreased
salmon spawning success as observed by Theurer et al.
1998 and Soulsby et al. 2001), and lowering of productivity
due to a reduction in the depth of the photic zone (Devlin
et al. 2008). The EU Water Framework Directive (WFD)
requires Member States to achieve chemical and ecological
standards for rivers, and these are strongly influenced by
fine sediment mobilisation and transport. Therefore, whilst
explicit sediment thresholds are not defined in the WFD,
there is growing recognition of the need for improved
understanding of sediment generation mechanisms for
supporting the development of river basin management
plans aimed at controlling diffuse pollution problems
(Collins et al. 2011).
Rates of channel bank erosion are influenced by
numerous factors such as the composition of bank material
(Hooke 1980; Bull 1997; Couper 2003; Julian and Torres
2006), bank geometry (Micheli and Kirchner 2002; Laubel
et al. 2003; Walling 2005; Walling et al. 2006), discharge
magnitude (Knighton 1973; Gautier et al. 2007; Hooke
2008), and riparian vegetation (Micheli and Kirchner 2002;
& V. J. J. Janes
1 Department of Geography, University of Exeter,
Exeter EX4 4RG, UK
2 Lancaster Environment Centre, University of Lancaster,
Lancaster LA1 4YQ, UK
3 Sustainable Soils and Grassland Systems Department,
Rothamsted Research, North Wyke, Okehampton EX20 2SB,
UK
123
Environ Earth Sci (2017) 76:307
DOI 10.1007/s12665-017-6593-x

Simon and Collison 2002; Laubel et al. 2003; Mattia et al.
2005). The effects of anthropogenic factors include,
amongst others, removal of bank vegetation increasing
bank erosion (Allan et al. 1997), trampling and poaching
by livestock (Kondolf et al. 2002; Collins et al. 2013), the
influence of flood control structures reducing peak flows
(Michalkova et al. 2011), and increased bank erosion in
urban areas due to flashier run-off (Neller 1988). As such,
bank erosion rates are highly spatially and temporally
variable (Hooke 1980; Bull 1997; Lawler et al. 1999; Leys
and Werritty 1999; Couper et al. 2002; Collins and
Anthony 2008; Collins et al. 2009a, b).
The influence of channel radius of curvature on bank
erosion rates has been noted in several studies (Hickin and
Nanson 1975; Thorne 1991; Hooke 2003) as a result of
changes to flow geometry within the channel with changes
in curvature. As radius of curvature decreases, high
velocity flow is directed towards the outer channel bank,
increasing bank erosion rates. Below a threshold value,
bank erosion rates decline with further lowering of radius
of curvature due to the formation of secondary cells, pro-
tecting the bank (Hey and Thorne 1975; Bathurst et al.
1977). Knighton (1998) also noted the change in shear
stress distribution within channels of low radius of curva-
ture resulting in accelerated downstream migration. This is
due to the point of maximum flow velocity (and hence
maximum shear stress) being located downstream of the
bend apex in highly sinuous channels. Channel curvature
(and curvature ratio; radius of curvature divided by channel
width) is inversely related to sinuosity up to sinuosities of
approximately 1.5; above this value, channel curvature
ratio decreases with increasing sinuosity (Julien 2002). A
relationship between bank erosion and channel sinuosity
has also been noted (Abam 1993; Schilling and Wolter
1999).
Channel bank erosion (and therefore lateral migration)
may also be restricted by valley walls. Lewin and Brindle
(1977) first identified channel confinement and described
three degrees of confinement based on decreasing valley
width relative to channel width: (1) wide-floored valleys
with infrequent contact with valley walls, (2) floodplains
narrower than the amplitude of meander bends, and (3)
well-developed meandering restricting further meander
development. Links between channel sinuosity and con-
finement have been observed; lower values of sinuosity are
found within confined sections of river channel (Milne
1983; Tooth et al. 2002; Nicoll and Hickin 2010). How-
ever, little has been done to investigate the influence of
confinement on channel bank erosion rates.
Previous empirical studies have observed bank erosion
rates over timescales of months to years using a range of
field techniques (Collins and Walling 2004) such as erosion
pin monitoring (Lawler 1993; Ashbridge 1995), repeated
cross-channel surveys (Hickin and Nanson 1975), and
aerial photographs (Hooke 1980; Micheli and Kirchner
2002). Photo-electronic erosion pin (PEEP) monitoring
(Lawler 1991) is based on a development of standard
erosion pin measurements and provides information
regarding the temporal variability of bank erosion during
the monitoring period (Bull 1997; Lawler et al. 1997).
Consecutive cross-channel surveys provide a measurement
of total channel bank erosion and deposition (Lawler 1993;
Julian and Torres 2006). Although labour-intensive, these
methodologies are capable of quantifying bank erosion
over relatively small spatial scales (channel reaches of a
few kilometres, to single channels). Aerial photogramme-
try (Kondolf et al. 2002; Michalkova et al. 2011) in con-
junction with LIDAR data (De Rose and Basher 2011) has
also been used to observe planimetric changes. However,
these methods are limited by the availability and temporal
coverage of both photogrammetric and LIDAR data.
Against this context, predictive models are required to
help estimate river bank erosion rates over large spatial
scales and representative and meaningful time periods.
This paper aims to (1) provide a data set of observed
channel bank erosion rates for several contrasting catch-
ments across England and Wales and timescales of up to
150 years, (2) establish the significance of key physical
controls on bank erosion rates including slope, sinuosity,
upstream catchment area, and channel confinement for
developing simple predictive tools. The control variables
selected for analysis within this study can be efficiently
calculated across river catchments, and corresponding
input parameter values can be incorporated within catch-
ment scale sediment models. It is thus envisaged that the
findings from this study will provide a basis for further
development of simple bank erosion modelling tools and a
data set to validate such models over long timescales.
Methods
A GIS methodology, similar to ‘polygon overlay’, as
reported by Gurnell et al. (1994) was used within this study
covering seven catchments (65 WFD cycle 1 sub-catch-
ment) from England and Wales. River channels were
digitised using historical Ordnance Survey (OS) maps (for
scales, see Table 2), thereby allowing observation of
channel migration over a period of up to 150 years. The
desktop data collection and analysis were conducted on the
65 sub-catchments located within the seven study catch-
ments (Fig. 1); Avon (Hampshire), Exe (Devon), Test and
Itchen (Hampshire), Stour (Kent), Ouse (Yorkshire), Eye
(Leicestershire), and Wye (Herefordshire). The main
channels and tributaries within each of these catchments
were digitised (Table 1). The study catchments were
307 Page 2 of 18 Environ Earth Sci (2017) 76:307
123

selected to represent a range of different catchment types
(i.e. underlying geologies, channel characteristics, and land
use) and to cover the range of annual precipitation totals
across England and Wales since rainfall/run-off has iden-
tified as a key driver for channel bank erosion (Collins and
Anthony 2008). See Table 1 for further details. Collec-
tively, the study catchments are more representative of
permeable than impermeable geologies and associated soils
and of rural areas dominated by different types of mixed
farming. This should be considered in terms of the scope
for extrapolation.
Historical Ordnance Survey maps were downloaded for
various years (taken from different mapping series, see
Table 2) for each of the study catchments. As the dates and
coverage varies between mapping series, the corresponding
dates of maps varied between the study catchments
(Table 1). Neighbouring maps within the same map edition
also have different survey and revision dates. Therefore, an
estimate of the date of one map layer was taken from the
range of years of map creation (often up to 15 years).
Channel bank lines at each time period were manually
digitised and the corresponding polygons created. Channel
polygons of 2 consecutive time periods were overlain (i.e.
1890–1940, 1940–1970, 1970–2010) providing an area of
channel erosion between these two time periods (as per
Table 3). It was noted that this method of erosion calcu-
lation would underestimate bank erosion in any areas
where the channel had migrated to a degree that the
polygons from the two time periods represented did not
overlap (and no channel is present at either time period, see
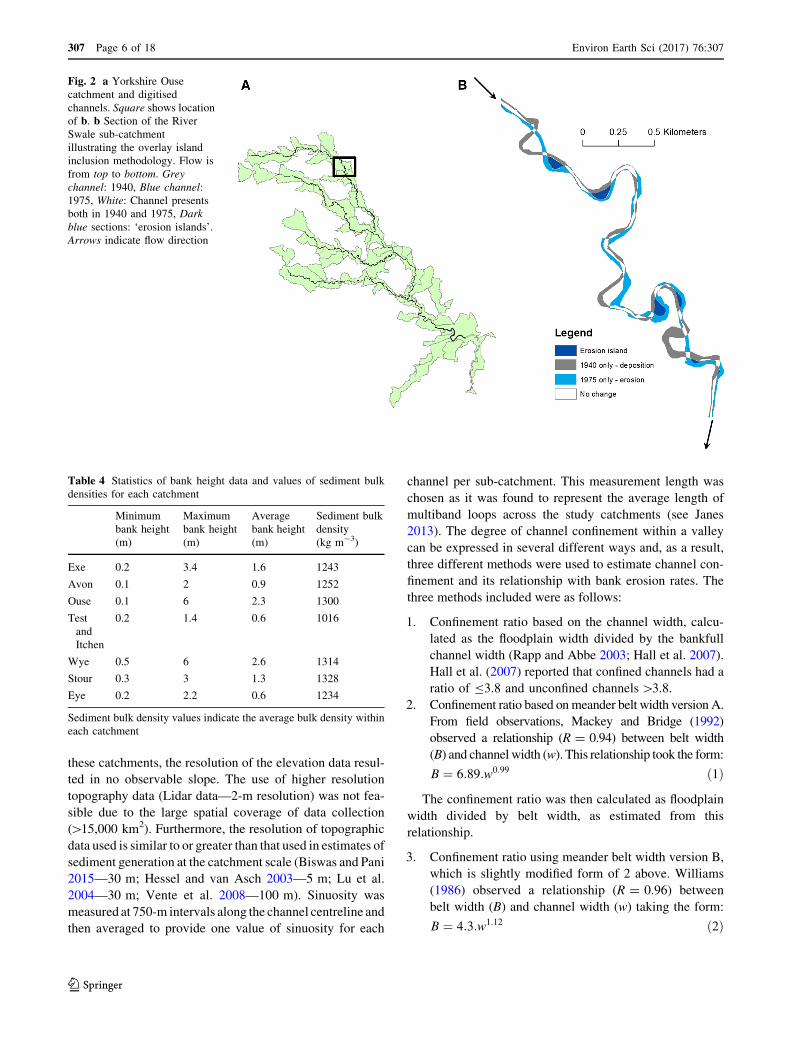
Fig. 2). In such cases, an ‘erosion island’ would be omitted
from the estimation. Consequently, each overlay was
examined individually for areas where channel migration
between the time periods of the two digitised channels was
sufficient to result in a gap between the positioning of both
channels. These gaps were digitised and their area added to
Fig. 1 Location of the study catchments. The channels digitised and WFD sub-catchments are also shown
Environ Earth Sci (2017) 76:307 Page 3 of 18 307
123
the erosion area calculated for the corresponding sub-
catchment from the overlay process. However, it was also
noted that this methodology would overestimate bank
erosion where channel movement has occurred by cut-off
rather than lateral migration. As erosion island digitisation
was conducted manually, channel cut-offs were not inclu-
ded (see Fig. 2).
The polygon overlay and ‘erosion island’ method was
used to calculate a total area of bank erosion (m2) within
each of the digitised 65 sub-catchments comprising the
seven study catchments. This was converted into a lateral
retreat rate (m) and a corresponding yield of sediment
(kg yr-1). Retreat rates were calculated by dividing the
erosion area polygon of each sub-catchment by the length
of the channel network therein. This was converted into an
annual retreat rate (m yr-1) by dividing by the number of
years covered by the time period between maps, and a
width-averaged retreat rate (m m-1 yr-1) by dividing by
the average river channel width.
To convert the area of bank erosion to a mass of sedi-
ment, values of bulk density and bank height were required
(to estimate a volume of bank-eroded sediment; m3).
Estimates of river bank height from 175 locations across
the 65 sub-catchments were taken from the UK River
Habitat Survey database (RHS, Environment Agency
2008). As RHS survey points are located randomly within
individual WFD sub-catchments, the values of bank height
within any individual sub-catchment were averaged to
produce a spatially averaged estimate. As bank heights may
vary considerably within individual sub-catchments (see
Table 4), this method of bank height estimation will
inevitably introduce errors. Although bank height may
influence bank erosion rates (through changes to shear
stress acting on the bank face), the influence of this factor
was not considered within this study due to the errors
associated with the estimation of this variable. Sediment
volume was then converted to a corresponding mass by
multiplying by bulk sediment density (Table 4). An aver-
age sediment bulk density was estimated for each of the 65
sub-catchments using LandIS (2014) soil association data.
As in the estimation of bank height, the estimation of
sediment bulk density using this method is associated with
unavoidable uncertainty.
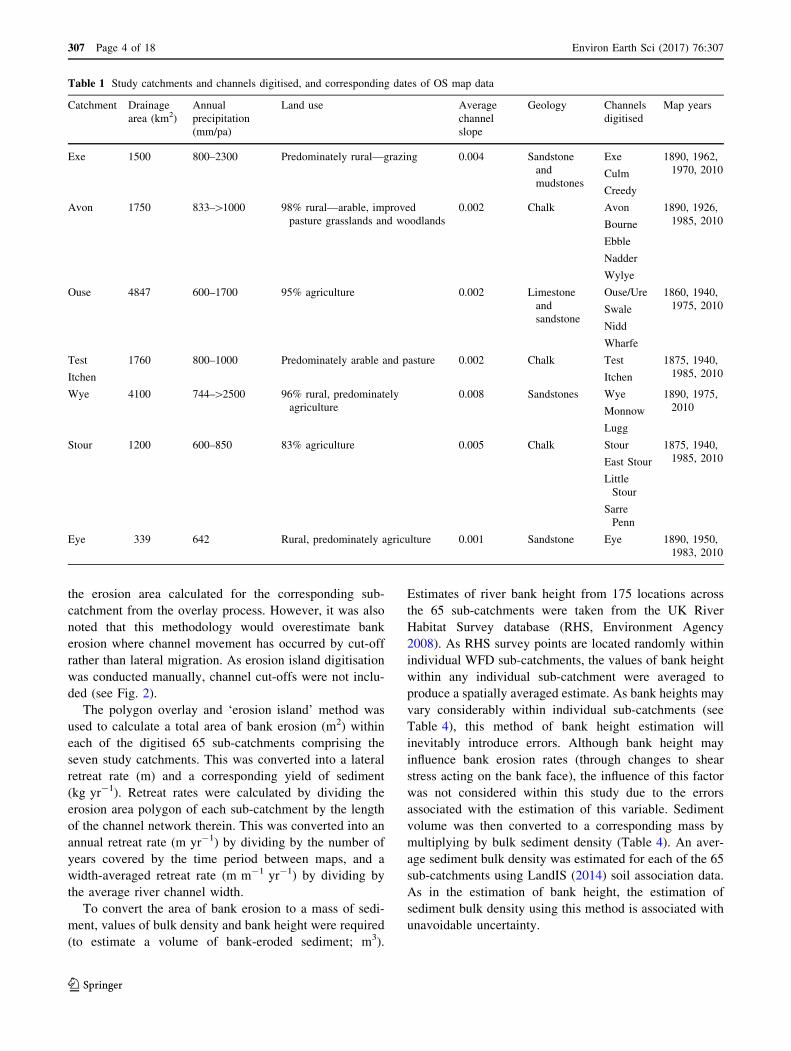
Table 1 Study catchments and channels digitised, and corresponding dates of OS map data
Catchment Drainage
area (km2)
Annual
precipitation
(mm/pa)
Land use Average
channel
slope
Geology Channels
digitised
Map years
Exe 1500 800–2300 Predominately rural—grazing 0.004 Sandstone
and
mudstones
Exe 1890, 1962,
1970, 2010Culm
Creedy
Avon 1750 833–[1000 98% rural—arable, improved
pasture grasslands and woodlands
0.002 Chalk Avon 1890, 1926,
1985, 2010Bourne
Ebble
Nadder
Wylye
Ouse 4847 600–1700 95% agriculture 0.002 Limestone
and
sandstone
Ouse/Ure 1860, 1940,
1975, 2010Swale
Nidd
Wharfe
Test 1760 800–1000 Predominately arable and pasture 0.002 Chalk Test 1875, 1940,
1985, 2010Itchen Itchen
Wye 4100 744–[2500 96% rural, predominately
agriculture
0.008 Sandstones Wye 1890, 1975,
2010Monnow
Lugg
Stour 1200 600–850 83% agriculture 0.005 Chalk Stour 1875, 1940,
1985, 2010East Stour
Little
Stour
Sarre
Penn
Eye 339 642 Rural, predominately agriculture 0.001 Sandstone Eye 1890, 1950,
1983, 2010
307 Page 4 of 18 Environ Earth Sci (2017) 76:307
123

Potential sources of error within the GIS ‘erosion island’
overlay methodology include inaccuracies within the geo-
referencing of historical Ordnance Survey maps. Down-
ward et al. (1994) outlined a methodology where ground
control points (GCPs) are used to quantify the error asso-
ciated with the geo-rectification processes. Previous studies
have illustrated the use of buffers around digitised channels
to ensure the magnitude of measured channel change using
the overlay methodology is greater than the mapping error;
RMSE of geo-rectifying errors is used to inform the
magnitude of buffers (cf. Hughes et al. 2006—5 m buffer;
Rhoades et al. 2009—2 m buffer). Therefore, as geo-ref-
erencing of historical OS maps has been completed prior to
download, a similar buffer methodology was used to
account for potential geo-referencing errors. Channel
overlays and erosion estimation were carried out in two
ways: (1) using no buffers and (2) with a 3.5 m buffer
(median value from the existing literature) applied to the
older channel within the overlay. With the buffer applied,
any channel migration less than 3.5 m during the overlay
time period was not included within the estimation of bank
erosion. This method therefore provides a minimum esti-
mate of channel bank erosion. Additionally, the digitised
channel overlays were checked manually for geo-refer-
encing errors and any obvious problems.
For each WFD sub-catchment (n = 65) and for each
time overlay (of which there were up to three, depending
on data availability), bank erosion rate was calculated as a
yield (kg ha-1 yr-1) and a width-averaged retreat rate
(m m-1 yr-1) both with and without a buffer applied to
produce a lower and upper estimate of each. Time periods
of channel overlays may coincide with flood-rich/flood-
poor years, or particular high-magnitude geomorphic
events. As this study sought to investigate the influence of
physical characteristics on channel bank erosion rates, as
opposed to the specific influence of high flows, bank ero-
sion rates across all time periods were averaged for each
study sub-catchment.
Estimation of variables potentially controlling river
bank erosion
The potential controlling variables, such as upstream
catchment area, slope, sinuosity, and channel confinement,
were measured within each study sub-catchment using GIS.
Upstream catchment area was calculated by summing the
area of upstream sub-catchments using GIS shapefiles
(provided by the EnvironmentAgency). Slopewasmeasured
using OS contours (at 5-m intervals) with a single value of
slope calculated for each sub-catchment. In some catch-
ments, the value of slope was 0 (6 of 65 sub-catchments). In
Table 2 Historical mapping series, and scales used for each time period digitised
Catchment Historical maps
Time period 1 Time period 2 Time period 3 Time period 4
Year Map series and
scale
Year Map series and scale Year Map series and scale Year Map series and
scale
Exe 1890 County Series
1:2500
1962 National Grid 1:10560 1970 National Grid 1:2500 2010 Mastermap
1:2500
Avon 1890 County Series
1:2500
1926 County Series 2nd revision
1:10560
1985 National Grid (latest)
1:10000
2010 Mastermap
1:2500
Ouse 1890 County Series
1:10560
1940 County Series 3rd revision
1:10560
1975 National Grid 1:2500 2010 Mastermap
1:2500
Test and
Itchen
1875 County Series
1:10560
1940 County Series 3rd revision
1:10560
1985 National Grid (latest)
1:10000
2010 Mastermap
1:2500
Wye 1890 County Series
1:10560
No data 1975 National Grid 1:2500 2010 Mastermap
1:2500
Stour 1875 County Series
1:10560
1950 County Series 3rd revision
1:10560
1983 National Grid (latest)
1:10000
2010 Mastermap
1:2500
Eye 1890 County Series
1:10560
1950 County Series 3rd revision
1:10560
1983 National Grid (latest)
1:10000
2010 Mastermap
1:2500
Table 3 Simple polygon overlay analysis method used to estimate
bank erosion
Year 1
Channel No channel
Year 2 Channel No change Erosion
No channel Deposition No change
Environ Earth Sci (2017) 76:307 Page 5 of 18 307
123
these catchments, the resolution of the elevation data resul-
ted in no observable slope. The use of higher resolution
topography data (Lidar data—2-m resolution) was not fea-
sible due to the large spatial coverage of data collection
([15,000 km2). Furthermore, the resolution of topographic
data used is similar to or greater than that used in estimates of
sediment generation at the catchment scale (Biswas and Pani
2015—30 m; Hessel and van Asch 2003—5 m; Lu et al.
2004—30 m; Vente et al. 2008—100 m). Sinuosity was
measured at 750-m intervals along the channel centreline and
then averaged to provide one value of sinuosity for each
channel per sub-catchment. This measurement length was
chosen as it was found to represent the average length of
multiband loops across the study catchments (see Janes
2013). The degree of channel confinement within a valley
can be expressed in several different ways and, as a result,
three different methods were used to estimate channel con-
finement and its relationship with bank erosion rates. The
three methods included were as follows:
1. Confinement ratio based on the channel width, calcu-
lated as the floodplain width divided by the bankfull
channel width (Rapp and Abbe 2003; Hall et al. 2007).
Hall et al. (2007) reported that confined channels had a
ratio of B3.8 and unconfined channels[3.8.
2. Confinement ratio based onmeander belt width version A.
From field observations, Mackey and Bridge (1992)
observed a relationship (R = 0.94) between belt width
(B) and channel width (w). This relationship took the form:
B ¼ 6:89:w0:99 ð1Þ
The confinement ratio was then calculated as floodplain
width divided by belt width, as estimated from this
relationship.
3. Confinement ratio using meander belt width version B,
which is slightly modified form of 2 above. Williams
(1986) observed a relationship (R = 0.96) between
belt width (B) and channel width (w) taking the form:
B ¼ 4:3:w1:12 ð2Þ
Fig. 2 a Yorkshire Ouse
catchment and digitised
channels. Square shows location
of b. b Section of the River
Swale sub-catchment
illustrating the overlay island
inclusion methodology. Flow is
from top to bottom. Grey
channel: 1940, Blue channel:
1975, White: Channel presents
both in 1940 and 1975, Dark
blue sections: ‘erosion islands’.
Arrows indicate flow direction
Table 4 Statistics of bank height data and values of sediment bulk
densities for each catchment
Minimum
bank height
(m)
Maximum
bank height
(m)
Average
bank height
(m)
Sediment bulk
density
(kg m-3)
Exe 0.2 3.4 1.6 1243
Avon 0.1 2 0.9 1252
Ouse 0.1 6 2.3 1300
Test
and
Itchen
0.2 1.4 0.6 1016
Wye 0.5 6 2.6 1314
Stour 0.3 3 1.3 1328
Eye 0.2 2.2 0.6 1234
Sediment bulk density values indicate the average bulk density within
each catchment
307 Page 6 of 18 Environ Earth Sci (2017) 76:307
123
Again, the confinement ratio was calculated as flood-
plain width divided by belt width as estimated from this
empirical relationship.
Channel width was measured using the digitised chan-
nels at 5-km intervals within each sub-catchment and an
average channel width was calculated on this basis.
Floodplain width was measured using shapefiles for the
Environment Agency’s flood zone 3, representing the
inundated floodplain area for an annual flood with [1%
probability (up to 100 year return period). The floodplain
width for each sub-catchment was derived from this area
by dividing by the corresponding sub-catchment valley
length.
The relationship between channel bank erosion rate
(m m-1 yr-1) and the study catchment characteristics
(upstream catchment area, slope, sinuosity, and channel
confinement) was analysed using Pearson’s correlation and
regression analysis. The distribution of all input variables
was assessed prior to statistical analysis to ensure nor-
mality for parametric testing. Normality was assessed by
checking similar values of mean, median, and mode, a
skewness statistic between ?1 and -1, and kurtosis
between ?3 and -3. Non-normally distributed variables
were log-transformed. Correlation analysis was used ini-
tially to assess relationships between bank erosion rate and
each of the independent variables individually. Indepen-
dent variables were then correlated to ensure no multi-
collinearity. Multiple regression analysis was performed to
investigate the proportion of channel bank erosion that can
be explained by the combination of independent variables.
Due to uncertainty associated with channel bank height and
sediment bulk density estimates, the annual mass of bank-
eroded sediment (kg ha-1 yr-1) within each catchment was
calculated, but not included within the regression analysis.
Results
Table 5 presents the estimates of mean rates of bank ero-
sion for both overlay methodologies (with and without
buffers) calculated for each of the seven study catchments
for which data were collated. The results suggest that the
highest erosion rate calculated as a yield of sediment
(kg ha-1 yr-1) was observed in the River Exe catchment,
and the corresponding lowest rate in the Rivers Test and
Itchen catchment. The highest annual retreat rates were
observed in the River Avon catchment, the largest width-
averaged retreat rate in the River Stour catchment, and the
lowest retreat rates were estimated for the River Wye
catchment. The data presented here are the average values
of all time period overlays for each sub-catchment (Fig. 1).
The histograms in Fig. 3 show the variability of estimated
channel bank erosion rates between all 65 WFD sub-
catchments comprising the seven study areas.
The range of estimates of the annual mass of sediment
produced by bank erosion calculated for each of the
channels digitised within this study (see Table 1) is pre-
sented in Table 6. These values are the maximum and
minimum estimates from the individual overlay time
periods for each channel network (as opposed to the
average of all overlay time periods) and are from overlay
methodologies with and without buffers applied, respec-
tively. The uncertainty within these estimates is large (as
indicated by the magnitude of difference between the
upper and lower estimates). This uncertainty is due to
both error and uncertainty within the methodology,
including error within the mapping process (accounted for
by the buffers). Lower estimates are from the overlay
methodology with 3.5 m buffers applied, and upper esti-
mates are from the overlay methodology without buffers.
It is possible that inter-annual variability of bank erosion
(primarily a result of annual variability in rainfall and
resulting river discharge) may also account for some of
this uncertainty. As these values are taken from individual
overlay time periods (as opposed to the averaged value
from the three overlay time periods), variation between
upper and lower estimates will increase due to temporal
variation of bank erosion rates across the time periods;
flood-rich periods would be expected to produce higher
rates of bank erosion than flood-poor periods. These
values represent the gross yield of sediment released by
channel bank erosion, and therefore incorporate bank-
eroded sediment that will be subsequently re-deposited
within the channel network. The range of values shown in
Table 6 therefore accounts for error associated with the
mapping process but do not account for errors associated
with the channel bank height and sediment bulk density
estimation. The limitations associated with the accuracy
of these data will introduce further uncertainty into these
estimates of mass of bank-eroded sediment that has not
been accounted for explicitly. The estimates in Table 6
provide a good illustration of the variability of channel
bank erosion not only between, but also within, the
individual study catchments. Data generated by other
studies are presented in Table 7.
All independent variables showed non-normal distribu-
tions. Width-averaged retreat rate without buffers was the
only normally distributed variable. Log10 transformation
achieved normal distributions for all independent variables
except slope. As the independent variable slope contained
some 0 values, a standard log10 transformation alone was
unsuitable; therefore, a constant of 0.0001 was added to all
values before log10 transformation (similarly to previous
studies; Berry 1987; Yamamura 1999).
Environ Earth Sci (2017) 76:307 Page 7 of 18 307
123

Correlations between each of the independent vari-
ables and each dependent variable were then calculated
(Table 8). As no statistically significant correlations
were observed between retreat rate and any of the
independent variables, no further statistical analysis of
this dependent variable was conducted. Scatterplots were
used to assess linearity of the relationships the remaining
dependent variables and all independent variables indi-
vidually (Fig. 4). The two methods of channel confine-
ment estimation using meander belt (CC2 and CC3)
width were more normally distributed than methodology
1; therefore, these two variables used were chosen for
further analysis.
Table 9 shows the correlation matrix for the transformed
independent variables. All independent variables entered
into a regression model should be independent from each
other (i.e. there should be no significant correlations
between pairs of independent variables) to avoid statistical
redundancy. Variables were assumed independent where
the statistical significance of the relationship was less than
the 95% level.
Table 9 indicates that the variables CC2 and CC3 are
significantly correlated (at the 99% level) and therefore
should not be included in the regression analysis together.
This is to be expected as all these variables represent
channel confinement, so are characterising the same
potential control on bank erosion. On this basis, only one of
the channel confinement variables was selected for each
regression analysis. Table 9 also indicates a significant
relationship between upstream area and sinuosity at the
95% level and therefore, these two variables were not
included within the same final regression models. Addi-
tionally, the tolerance statistic (output from the regression
models) should be[0.1, confirming that multicollinearity
is not an issue within the statistical model.
Stepwise regression was used; all independent variables
were entered into the initial regression models. Although
individual variables may not be statistically significant,
when combined with other variables, they may show a
significant relationship and enhance the R and R2 values
associated with the model. The contribution of each vari-
able to the model is shown by the t statistic, and any
independent variables that did not show a statistically
significant contribution at the 95% level or above were
removed from the final regression model.
Width-averaged retreat
The variables upstream area and channel confinement
showed statistically significant relationships with width-
averaged bank retreat rate (at the 99% level) both with and
without buffers applied. Sinuosity and slope showed weak
relationships with width-averaged retreat rate (sinuosity:
R = 0.289, R = *-0.120, slope: R = 0.219, R = -0.013
without and with buffers, respectively).
The regression model was initially run with all 65 data
points (i.e. for all WFD sub-catchments comprising the
seven study areas). One data point 61 (River Monnow)
showed a disproportionate influence on the corresponding
regression coefficients; centred leverage value of 0.175.
Centred leverage values indicate the influence of each
individual data point on the regression equation, high-
lighting points with a disproportionate influence. High
leverage values can be identified as greater than.
2p
Nð3Þ
where p is the number of independent variables and N is the
number of cases. This point has the smallest value of
upstream area within the data set, which could partially
Table 5 Mean channel bank erosion rates for each of the study catchments
No buffer With 3.5 m buffer
Erosion
(kg ha-1yr-1)
Retreat rate
(m yr-1)
Width-averaged
retreat
rate (m m-1yr-1)
Erosion
(kg ha-1yr-1)
Retreat rate
(m yr-1)
Width-averaged
retreat
rate (m m-1yr-1)
Exe 907 0.114 0.0078 388 0.051 0.0035
Avon 322 0.117 0.0082 298 0.129 0.0080
Test and
Itchen
65 0.090 0.0059 32 0.047 0.0032
Stour 113 0.075 0.0091 52 0.039 0.0049
Wye 732 0.074 0.0039 347 0.040 0.0023
Eye 570 0.086 0.0072 302 0.046 0.0038
Ouse 701 0.105 0.0049 447 0.066 0.0030
Lower and upper estimates (with and without 3.5 m buffer used in overlay methodology) shown
307 Page 8 of 18 Environ Earth Sci (2017) 76:307
123

explain this influence. This data point was therefore
removed prior to the final regression model presented here.
Additionally, the variable sinuosity was found to not con-
tribute significantly to either regression model (t statistic
1.739, p = 0.087). Sinuosity was therefore not included
within the final regression model of width-averaged bank
retreat rate presented here. The independent variables that
were entered into the regression model for dependent
variable width-averaged retreat rate (m m-1 yr-1) without
buffers were therefore upstream area, slope, and channel
confinement version 3. The regression output is shown in
Table 10. The absolute correlation and percentage of
variance explained are 0.812 and 65.9%, respectively. The
R2 and adjusted R2 values indicated that the model gener-
alises well (0.659 and 0.642, respectively) (Fig. 5).
The regression model produced the following predictive
equation:
Width averaged retreat rate ¼ 0:017
þ 0:001� Log10 Sþ 0:0001ð Þð Þ � 0:003� Log10UAð Þþ 0:005� Log10CC3ð Þ ð4Þ
where S is the channel slope and UA is the upstream area.
High residuals were classified as a standardised residual
\-2.58 or[2.58 (Norusis 2005). The only residual was
data point number 5 (River Bourne), which had the highest
value of width-averaged retreat rate (0.0138 m m-1 yr-1).
Regression models often have less accuracy predicting
high and low values which explains this elevated residual
value. The low leverage value (0.012) indicates this data
point does not disproportionately influence the regression
coefficients, and removal will not have a significant impact
on regression coefficients (R = 0.837 R2 = 0.701). Con-
sequently, this data point was not removed on this basis.
Fig. 3 Histograms showing the variability of channel bank erosion
measured for all 65 WFD sub-catchments comprising the seven study
catchments. Blue bars indicate upper estimate (no buffer used in
overlay methodology) and red bars lower estimate (with 3.5 m buffer
overlay methodology). a—erosion rates (kg ha-1yr-1), b—retreat
rate (m yr-1), c—width-averaged retreat rate (m m-1yr-1)
Table 6 Upper and lower estimates of the annual mass of sediment
released by bank erosion (tonnes per year) for each channel digitised
within this study
Catchment Channel Annual bank erosion (t yr-1)
Exe Exe 5874–67627
Culm 2905–42486
Creedy 259–16955
Avon Avon 6654–18301
Bourne 673–2702
Ebble 668–1945
Nadder 2102–8876
Wylye 2402–7013
Test and Itchen Test 441–1763
Itchen 970–2811
Stour Stour 2570–7505
Little Stour 536–1044
East Stour 461–1632
Sarre Penn 54–510
Wye Wye 25666–73340
Monnow 1064–11032
Lugg 5949–13345
Eye Eye 91–10239
Ouse Ouse 26614–68359
Swale 7393–61232
Nidd 977–19507
Wharfe 6088–19874
Environ Earth Sci (2017) 76:307 Page 9 of 18 307
123
With buffers applied, the initial regression analysis
including all 65 data points indicated one high residual
value (River Wye = -2.67, number 58). This data point
also showed a high leverage value (0.097) and therefore
had a disproportionate influence on regression coefficients.
This point has the smallest value of width-averaged retreat
rate (0.00009 m m-1yr-1) within the data set, which could
partially explain this influence. This data point was there-
fore removed prior to the derivation of the final regression
model. Additionally, the variable slope was found to not
contribute significantly to the model and was therefore
removed (t statistic = -1.046, p = 0.300). The regression
output is provided in Table 11. The absolute correlation
and percentage of variance explained were 0.585 and
34.2%, respectively (Fig. 6).
One residual, River Wye no. 55 (-2.91), was observed
from the regression output. This data point had the lowest
value of width-averaged retreat rate (0.00018 m m-1yr-1).
This point did not have a disproportionate influence on the
regression coefficients (leverage value 0.061) and therefore
removal of this point did not have a significant impact on
the regression coefficient R and R2 values (0.620 and 0.385,
respectively). On this basis, it was therefore retained in the
final statistical model.
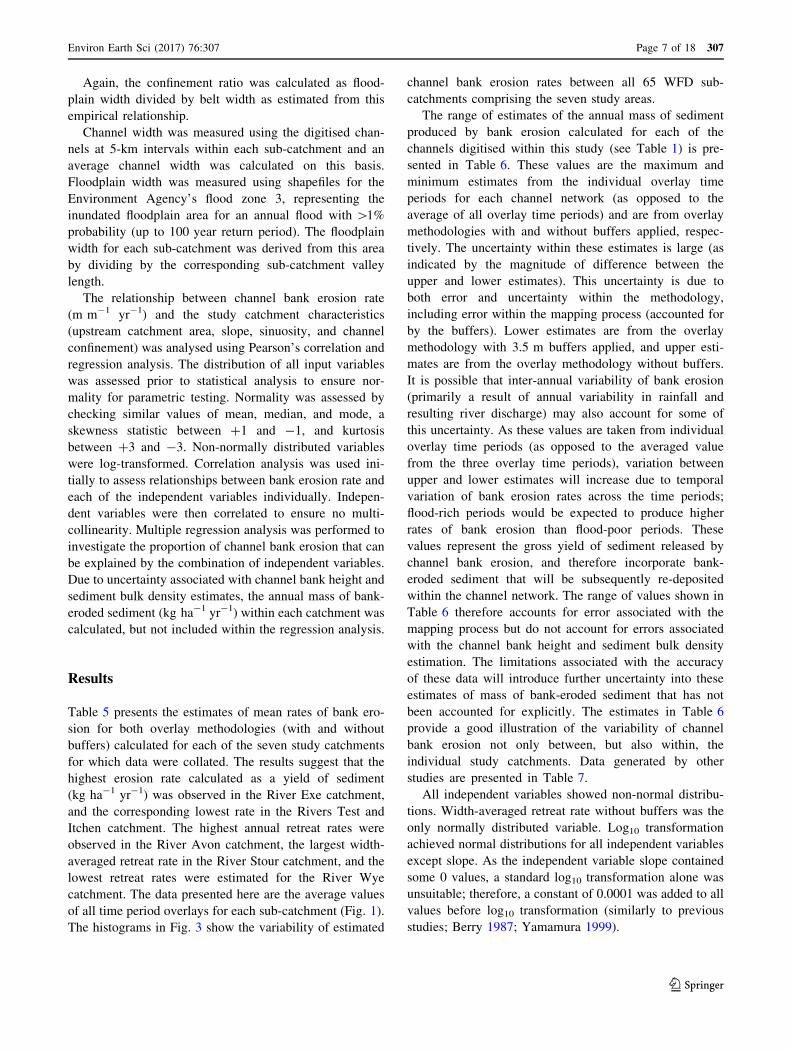
Table 7 Values of the mass of
bank-eroded sediment reported
by previous studies
Catchment Mass of bank erosion (t yr-1) Reference
Exe 1193 Collins et al. (1997)
Culm 3500? Ashbridge (1995)*
Culm 750 Walling and Woodward (1995)
Culm 900 He and Owens (1995)
Studies marked with an asterisk used erosion pin methodologies and all others are based on sediment source
fingerprinting. The percentages of sediment budgets within the Exe catchment from sediment fingerprinting
studies are converted to a mass of bank erosion using values of annual suspended sediment load measured
at the catchment outlet (Walling and Webb 1987; Walling and Bradley 1989)
Table 8 Correlations between all independent and dependent variables from all 65 sub-catchment
Without buffers With 3.5 m buffers
Erosion rate
(kg ha-1 yr-1)
Retreat rate
(m yr-1)
Width-averaged retreat
rate (m m-1 yr-1)
Erosion rate
(kg ha-1 yr-1)
Retreat rate
(m yr-1)
Width-averaged retreat
rate (m m-1 yr-1)
Sinuosity
(log10)
-0.114 0.124 0.289* -0.039 0.217 0.346**
Slope (log10) -0.054 0.052 0.219 -0.124 -0.129 -0.013
Upstream area
(log10)
0.305* -0.029 -0.507** 0.225 -0.140 -0. 430**
CC1 (log10) 0.069 -0.030 0.532** 0.120 0.111 0.437**
CC2 (log10) 0.072 -0.028 0.528** 0.123 0.112 0.434**
CC3 (log10) 0.031 -0.045 0.572** 0.084 0.104 0.464**
Statistically significant correlations are indicated by an asterisk; * at 95% level, and ** at 99% level
Table 9 Correlation matrix of all independent variables
Sinuosity (log10) Slope (log10) Upstream area (log10) CC2 (log10) CC3 (log10)
Slope (log10) 0.191
Upstream area (log10) -0.211* -0.179
CC2 (log10) -0.022 -0.102 0.066
CC3 (log10) -0.005 -0.082 0.014 0.997**
Significant correlations are indicated with an asterisk; * at 95% level, ** at 99% level. CC2 indicates channel confinement method 2, CC3
indicates channel confinement method 3
307 Page 10 of 18 Environ Earth Sci (2017) 76:307
123
Discussion
The results here have shown the potential for physical
factors to be used as predictors of catchment scale bank
erosion. Upstream catchment area showed a statistically
significant correlation at the 99% level with channel bank
erosion measured as a width-averaged retreat rate when
measured using overlay methodologies with and without
buffers (R = -0.507 and -0.430, respectively). Addi-
tionally, when measured as a yield of sediment (kg ha-1
yr-1) without buffers, a significant correlation at the 95%
level was observed with upstream catchment area (0.305).
The sign of the relationship switches from positive to
negative when measuring bank erosion as a width-averaged
retreat rate, as opposed to a sediment yield, because
dividing retreat rate by the width normalises the data. On
this basis, the data from this study therefore suggest that
bank erosion rates increase with upstream area. Hooke
(1980) noted that bank erosion rate was related to catch-
ment area, and this explained 53 and 39% of variation in
mean and maximum erosion rates, respectively. It is sug-
gested that this is because catchment area represents a
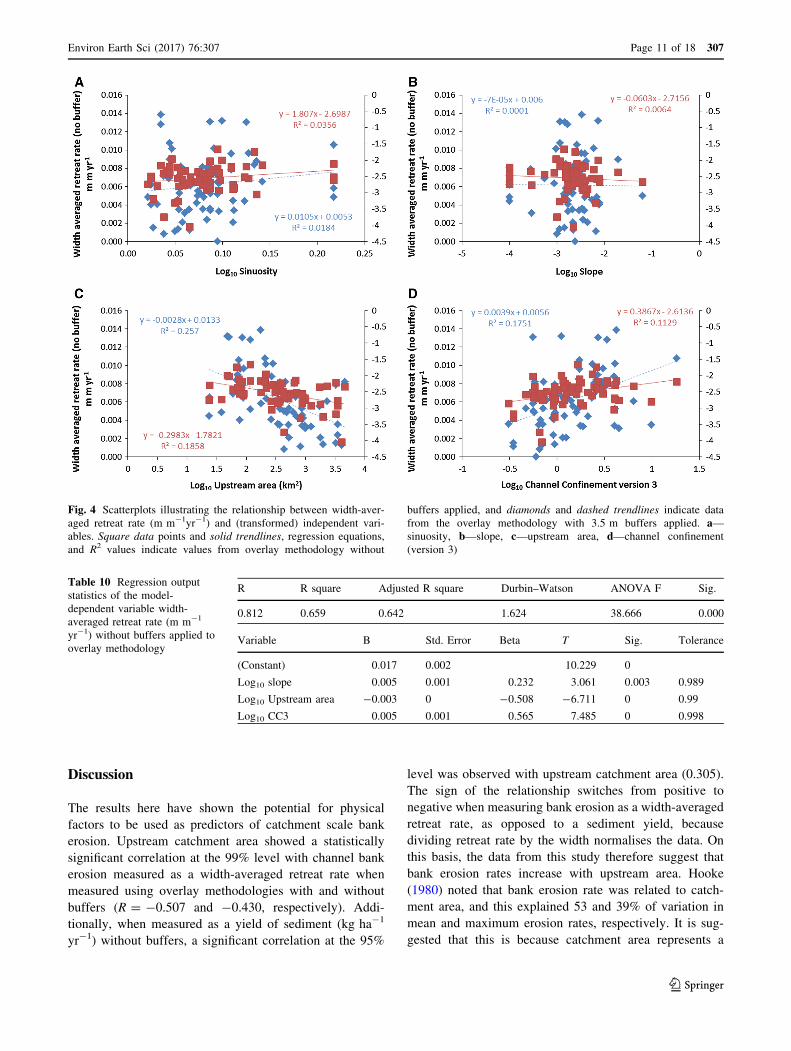
Fig. 4 Scatterplots illustrating the relationship between width-aver-
aged retreat rate (m m-1yr-1) and (transformed) independent vari-
ables. Square data points and solid trendlines, regression equations,
and R2 values indicate values from overlay methodology without
buffers applied, and diamonds and dashed trendlines indicate data
from the overlay methodology with 3.5 m buffers applied. a—sinuosity, b—slope, c—upstream area, d—channel confinement
(version 3)
Table 10 Regression output
statistics of the model-
dependent variable width-
averaged retreat rate (m m-1
yr-1) without buffers applied to
overlay methodology
R R square Adjusted R square Durbin–Watson ANOVA F Sig.
0.812 0.659 0.642 1.624 38.666 0.000
Variable B Std. Error Beta T Sig. Tolerance
(Constant) 0.017 0.002 10.229 0
Log10 slope 0.005 0.001 0.232 3.061 0.003 0.989
Log10 Upstream area -0.003 0 -0.508 -6.711 0 0.99
Log10 CC3 0.005 0.001 0.565 7.485 0 0.998
Environ Earth Sci (2017) 76:307 Page 11 of 18 307
123

surrogate of discharge and hence indicates the positive
relationship between bank erosion rate and river discharge;
as discharge increases, the shear stress acting on the
channel banks increases, causing increased bank erosion
(cf. the bank erosion index reported by Collins et al.
2009a, b). Furthermore, as bank height increases
Fig. 5 Scatterplot of observed
versus predicted values of
width-averaged retreat rate
(m m-1 yr-1) without buffers
applied and the regression line.
The wider dashed lines
represent the 95% prediction
intervals, and curved dotted
lines indicate 95% confidence
intervals of predicted values
Table 11 Regression output
statistics of the model-
dependent variable width-
averaged retreat rate (m m-1
yr-1) with buffers applied to
overlay methodology
R R square Adjusted R square Durbin–Watson ANOVA F Sig.
0.637 0.406 0.376 1.271 13.681 0.000
Variable B Std. Error Beta T Sig. Tolerance
(Constant) -2.204 0.192 -11.47 0
Log10 Upstream area -0.227 0.064 -0.361 -3.565 0.001 0.994
Log10 CC3 0.471 0.104 0.453 4.540 0 0.995
Log10 sinuosity 2.212 0.871 0.257 2.539 0.014 0.967
Fig. 6 Scatter plot of observed
versus predicted values of
width-averaged retreat rate
(m m-1 yr-1) with buffers
applied and the regression line.
The wider dashed lines
represent the 95% prediction
intervals and curved dotted lines
indicate 95% confidence
intervals of predicted values
307 Page 12 of 18 Environ Earth Sci (2017) 76:307
123
downstream, the shear stress acting on banks increases,
increasing the risk of bank failure (Bull 1997; Micheli and
Kirchner 2002; Walling et al. 2006) and the volume of
sediment yield from bank erosion processes. However,
Lawler et al. (1999) noted a nonlinear relationship between
bank erosion and upstream area within the Swale-Ouse
catchment and observed a peak in bank erosion rates in the
middle reaches. The middle reaches (in their study) were
surrounded by upland environments with a combination of
peak stream power and erodible bank materials, hence the
observed high flows. They also noted downstream sites
were more consistently seasonally active. The nonlinear
relationship that was observed in their study was based on
11 sites for 14–15 months. The lack of a nonlinear rela-
tionship observed within this study could be due to the
considerable difference in timescale of the observations; in
the Lawler et al. (1999) study, a large/sequence of events
may dominate the observations with particular areas of the
catchment being more sensitive to bank erosion than oth-
ers. In the present study, the effects of localised sensitivity
to individual events and within the catchment are not
observed due to the longer temporal scale.
Width-averaged retreat rate (m m-1 yr-1) showed a
significant relationship with channel sinuosity at the 99 and
95% level with without buffers applied, respectively. This
relationship is positive. However, closer scrutiny of the
scatterplot in Fig. 4a suggests that relationship between
bank erosion and sinuosity may not be completely linear;
bank erosion appears to increase with sinuosity up to a
point (equivalent to a sinuosity of approximately 1.5).
Channel sinuosity is inversely related to channel curvature
ratio (the radius of channel curvature divided by the
channel width) up to sinuosities of approximately 1.5.
Further data analysis could be undertaken by splitting the
data set to assess high and low curvature.
Channel confinement was measured as a ratio between
floodplain or meander belt width and channel width. For
each of the three methodologies used to estimate this
potential control on river bank erosion, a decrease in
channel confinement ratio represents an increase in con-
finement of the channel within the floodplain. Only a very
weak positive relationship between channel bank erosion
sediment yield (kg ha-1 yr-1) and channel confinement
was observed. However, none of these relationships were
statistically significant; all R values were\0.2 both with
and without buffers used in the overlay methodology. The
relationship between bank erosion and channel confine-
ment measured as a width-averaged retreat rate (m m-1 -
yr-1) was statistically significant at the 99% level for all
methods of channel confinement estimation, both with and
without buffers applied in the overlay methodology. This
positive relationship suggests that as channel confinement
decreases (channel confinement ratio increases), the width-
averaged retreat rate increases. Channels can migrate freely
where they are unconfined by valley margins and therefore
it follows that bank erosion/retreat rates will be higher in
these scenarios compared with confined channels where
lateral migration is restricted. It was noted that as this
measure of bank erosion is calculated using channel width,
as is channel confinement, this may lead to spurious cor-
relations as a result of collinearity. Although no statisti-
cally significant correlations were observed between bank
erosion measured as a retreat rate (m yr-1) and the channel
confinement, a slight positive relationship (0.104–0.112)
was observed between retreat rate and channel confinement
with buffers applied (with no buffers correlations were
extremely low; between -0.028 and -0.045). This sug-
gests that whilst some collinearity between these variables
is inevitable, a positive relationship between width retreat
rate and confinement ratio is genuine.
The level of channel confinement may indirectly influ-
ence bank erosion by influencing the sinuosity of the
channel. Milne (1983) found that low sinuosity in channels
was partly due to lateral confinement of the channel net-
work by valley walls preventing free meander develop-
ment. Additionally, Tooth et al. (2002) observed channel
sinuosities of *1.1-1.3 in areas confined by bedrock
geology, and *1.75 where channel migration was unre-
stricted. (Nicoll and Hickin 2010) observed that confined
channels had a higher wavelength and curvature than
unconfined rivers, with few channel cut-offs occurring.
Unconfined and freely meandering rivers migrate by
increasing bend amplitude, thereby decreasing channel-
bend radius and channel curvature ratio, and increasing
sinuosity. Within confined channels, sinuosity, channel
migration, and hence bank erosion are restricted. However,
in this study no statistically significant relationship was
observed between channel confinement and sinuosity (see
Table 9). Reasons for this could include the small number
of channels classified as confined within the study;
according to the definition of confined by method 1 (Hall
et al. 2007), only 8 of the 64 channels within this study are
classed as confined. The relationship between confinement
ratio and sinuosity may not be significant as the data set
here is largely of unconfined and freely migrating channels,
the sinuosity of which will be influenced by additional
factors.
Slope did not show a statistically significant relationship
with bank erosion measured as a sediment yield (kg ha-1
yr-1) or as a width-averaged retreat rate (m m-1 yr-1)
when considered individually. However, slope was inclu-
ded within the regression model of width-averaged retreat
rate (without buffers) and in combination with upstream
catchment area and channel confinement as independent
variables was found to significantly contribute to the
regression model (at the 95% level). Previous studies have
Environ Earth Sci (2017) 76:307 Page 13 of 18 307
123
noted the influence of slope on channel planform (Schumm
and Khan 1972; Montgomery and Buffington 1997). Slope
may indirectly influence bank erosion rates through the
influence on channel planform, which may explain the lack
of a significant correlation observed when considering
slope individually as an independent variable. However, in
this study, slope did not show a statistically significant
relationship with sinuosity (R = 0.191).
Several additional factors known to influence bank
erosion rates have not been considered within this analysis.
These include vegetation, lithology and underlying geol-
ogy, meteorological and climatic influences (e.g. freeze–
thaw cycles), flow regimes, channel bank geometry, and
anthropogenic influences (e.g. poaching by livestock
accessing rivers for drinking water). Therefore, it is
expected that the regression models would not completely
explain the variance within the observed bank erosion data.
For data points that the regression model predicts with a
lower accuracy (those with high residual values), additional
factors not considered within the regression are a likely
source of error.
The GIS-based data collection and analysis methodol-
ogy used within this study focuses on bank erosion
resulting in lateral migration of channels yet excludes
sediment generated through bank erosion processes that do
not result in lateral migration. The importance of subaerial
processes, such as freeze–thaw, has been observed, par-
ticularly in upper catchments during winter months (Law-
ler et al. 1999; Couper 2003). Fluvial entrainment and
incision resulting in bank retreat at the waterline level of
the bank has also been observed (Hooke 1979; Lawler et al.
1999). Where these forms of bank erosion are dominant,
the GIS methodology used here may underestimate bank-
eroded sediment yield. These processes form the prelimi-
nary stages of bank erosion and lead to undermining and
weakening of banks and later bank collapse, resulting in
channel migration. Due to the long timescales over which
bank erosion has been observed within this study, the errors
due to omission of these processes are likely to be small.
The catchments selected for this study differ signifi-
cantly in their geology and annual rainfall totals (see
Table 1) and therefore have very different flow regimes
and geomorphological histories. Differences in these local
factors that have previously been observed to influence
bank erosion rates (Henshaw et al. 2013) may also account
for some of the scatter within the data that are observed in
Figs. 5 and 6. For example, in study catchments with high
permeability (such as the Test and Itchen), bank erosion
rates are likely to be lower due to the dominance of
weathering processes as an erosion mechanism (Test and
Itchen annual retreat rate \0.1 m yr-1). Furthermore,
many of the catchments within this study have a history of
agricultural and flood management. Land use in has been
noted in several previous studies to influence bank erosion
rates through trampling and overgrazing by livestock
(Kondolf et al. 2002), removal of vegetation (Michalkova
et al. 2011), and construction of flood protection measures
(Winterbottom and Gilvear 2000; Michalkova et al. 2011).
The magnitude of influence of various land uses is indi-
vidual to channel type; therefore, these localised factors
have not been considered within the methodology devel-
oped here and may obscure any trends relating to the
physical factors analysed. Additional analysis of the tem-
poral variation of bank erosion using the data set could also
prove interesting.
The correlation and regression coefficients when bank
erosion rate is calculated as a width-averaged retreat rate
are higher than when bank erosion is calculated as a sed-
iment yield. This is likely to be due to the error introduced
to the calculation of bank erosion when calculating sedi-
ment volumes using estimates of bank height and sediment
density. The RHS data used for bank height estimation
included a total of 180 channel survey points across the 65
WFD sub-catchments for which bank erosion rates were
estimated. However, channel bank heights are likely to be
highly spatially variable, so estimates based on only one
bank height per sub-catchment will introduce an error
when estimating sediment mass released by bank erosion.
Additionally, the bank heights within the RHS data have
been recorded over a short time period (a few years).
Channel bank heights are also temporally variable, partic-
ularly in areas of active channel bank erosion; therefore,
whilst bank height may be representative for the digitisa-
tion period 2010, it is not possible to assess the accuracy of
bank height data across the catchments for the previous
digitised time periods. As the digitising covers up to
150 years, estimation of one bank height for all time
periods will introduce an error within the calculation of
bank erosion sediment yield. Any comparison of estimates
of sediment erosion masses generated by this study with
those reported by previous work (Table 7) should also bear
in mind the temporal inconsistencies of the data sets since
the latter were generally based on short-term studies using
sediment fingerprinting or erosion pins.
Previous studies have observed annual channel bank
retreat rates within the Exe catchment of 0.18–0.28 m yr-1
(Hooke 1980; Ashbridge 1995) and within the Ouse catch-
ment of 0.067–0.377 m yr-1 (Lawler et al. 1999). These are
broadly comparable to the average annual retreat rates
estimated within this study; Exe: 0.014–0.163 m yr-1,
Ouse: 0.026–0.229 m yr-1 (lower and upper estimates from
methodologies with and without buffers, respectively). Lit-
erature values from previous studies cited here were from
particularly dynamic reaches (Swale, Ouse catchment, and
Culm, Exe catchment) which could explain the slightly
lower bank retreat rates observed within this study. Table 7
307 Page 14 of 18 Environ Earth Sci (2017) 76:307
123

presents estimates of the annual mass of bank-eroded sedi-
ment reported by previous studies from the study catch-
ments, using sediment fingerprinting and erosion pin
methodologies. The values obtained from this study are of
similar magnitudes to these previous published estimates;
however, the significant methodological differences between
this study and literature values should be noted (both tem-
poral and scale differences).
The total mass of sediment generated through bank
erosion processes annually within this study showed a large
range of uncertainty. It is important to note that these
values represent the total mass of sediment generated
through bank erosion. A proportion of bank-derived sedi-
ment will be deposited either within the channel, or during
overbank floodplain sedimentation. Therefore, when com-
pared to estimates of net sediment loss from bank erosion
from studies using techniques such as sediment finger-
printing coupled with suspended sediment yields and sta-
tistical modelling (e.g. Collins and Anthony 2008; Collins
et al. 2009a, b, 2010) which focus on the clay- and silt-
sized fractions only, excluding sand-sized material, the
values presented in this paper can be expected to be con-
siderably higher. This study does not consider bank toe
deposition, again emphasising that the values reported
herein represent the gross rather than net release of bank-
eroded sediment. Finally, the analysis herein does not
consider the impact of channel margin protection or engi-
neering works in reducing the bank erosion in specific
reaches. Previous strategic predictive models for England
and Wales have also generated bank sediment loss esti-
mates without such corrections (e.g. Collins and Anthony
2008; Collins et al. 2009a, b). Comparison of bank erosion
estimates within the Ouse catchment generated by this
study with annual suspended sediment load estimates pre-
sented in Walling et al. 1999 indicates the estimate of bank
erosion contribution to the sediment budget as between 35
and 91%. This range in bank contribution is higher than
expected due to the total bank-eroded sediment being
compared with suspended sediment load at the catchment
outlet; some bank-eroded sediment will be deposited
elsewhere and will contain bedload sediments. The con-
trasting time periods covered by the estimates used in this
comparison should also be considered.
Conclusions
The channel bank erosion rates estimated by this study
from GIS data suggest that river bank erosion generates a
significant mass (representing gross sediment loss) of
sediment in several contrasting catchments across England
and Wales. Additionally, the variability of observed bank
erosion rates both within and between catchments has been
highlighted. Channel bank erosion rates vary both spatially
and temporally due to the numerous factors which influ-
ence bank retreat, and these factors are likely characterised
by complex interactions.
The statistical analysis performed by this study indicates
a significant correlation between upstream area, channel
confinement, sinuosity, and channel bank erosion when
calculated as a width-averaged retreat rate (m m-1 yr-1).
The analysis therefore suggests that these variables are
useful predictors of bank erosion. The regression model of
width-averaged retreat rate (without buffers) showed the
highest predictive accuracy, and this equation could be
used to estimate bank erosion rates within catchments
across England and Wales that share similar characteristics
to the basins examined here. Further investigation of the
relationships including variables influenced by climate
zone or projected change would be beneficial. Sediment
generation can be heavily influenced by gradients in rain-
fall and run-off responses across climate zones, as illus-
trated nationally for bank erosion across England and
Wales by Collins and Anthony (2008) and Collins et al.
(2009a, b). Sediment mobilisation is forecast to change
with future climate scenarios, and this change is likely to
impact on bank erosion as well as other sediment genera-
tion processes and sources.
The methodology used within this study has enabled
spatial coverage of data that are considerable in compar-
ison with similar previous studies (Hooke 1980, 2008;
Gurnell et al. 1994; Lawler et al. 1997) and therefore the
findings from this study build upon the existing literature.
The identification of key factors influencing bank erosion
and their relative significance can therefore be used to
identify catchments at risk of significant channel bank
erosion as a result of physical factors, and to inform future
bank erosion model development. The need to consider
bank erosion as a potentially important sediment source is
critical for the development of catchment sediment budget
models which can be used for scenario analysis to inform
improved management of sediment-related problems
impacting on water quality and ecological status.
Acknowledgements Thanks are extended to Cranfield University
and the Environment Agency for provision of data sets. The stu-
dentship during which this work was undertaken was co-funded by
ALC using ADAS central funding, and the University of Exeter, UK.
Open Access This article is distributed under the terms of the
Creative Commons Attribution 4.0 International License (http://crea
tivecommons.org/licenses/by/4.0/), which permits unrestricted use,
distribution, and reproduction in any medium, provided you give
appropriate credit to the original author(s) and the source, provide a
link to the Creative Commons license, and indicate if changes were
made.
Environ Earth Sci (2017) 76:307 Page 15 of 18 307
123
References
Abam T (1993) Factors affecting distribution of instability of river
banks in the Niger delta. Eng Geol 35:123–133
Allan D, Erickson D, Fay J (1997) The influence of catchment land
use on stream integrity across multiple spatial scales. Freshw
Biol 37:149–161
Ashbridge D (1995) Processes of river bank erosion and their
contribution to the suspended sediment load of the River Culm,
Devon. In: Foster I, Gurnell A, Webb B (eds) Sediment and
water quality in river catchments. Wiley, Chichester, pp 229–245
Bathurst JC, Thorne CR, Hey RD (1977) Direct measurements of
secondary currents in river bends. Nature 269:504–506
Berry DA (1987) Logarithmic transformations in ANOVA. Biomet-
rics 43:439–456
Biswas and Pani (2015) Estimation of soil erosion using RUSLE and
GIS techniques: a case study of Barakar River basin, Jharkhand,
India. Model Earth Syst Environ 1:42
Bull LJ (1997) Magnitude and variation in the contribution of bank
erosion to the suspended sediment load of the River Severn, UK.
Earth Surf Process Landf 22:1109–1123
Collins AL, Anthony SG (2008) Assessing the likelihood of
catchments across England and Wales meeting ‘good ecological
status’ due to sediment contributions from agricultural sources.
Environ Sci Policy 11:163–170
Collins AL, Walling DE (2004) Documenting catchment suspended
sediment sources: problems, approaches and prospects. Prog
Phys Geogr 28:159–196
Collins A, Walling D, Leeks G (1997) Fingerprinting the origin of
fluvial suspended sediment in larger river basins: combining
assessment of spatial provenance and source type. Geogr Anna
Ser A Phys Geogr 79:239–254
Collins AL, Anthony SG, Hawley J, Turner T (2009a) The potential
impact of projected change in farming by 2015 on the
importance of the agricultural sector as a sediment source in
England and Wales. Catena 79:243–250
Collins AL, Anthony SG, Hawley J, Turner T (2009b) Predicting
potential change in agricultural sediment inputs to rivers across
England and Wales by 2015. Mar Freshw Res 60:626–637
Collins AL, Walling DE, Webb L, King P (2010) Apportioning
catchment scale sediment sources using a modified composite
fingerprinting technique incorporating property weightings and
prior information. Geoderma 155:249–261
Collins AL, Naden PS, Sear DA, Jones JI, Foster IDL, Morrow K (2011)
Sediment targets for informing river catchment management: inter-
national experience and prospects. Hydrol Process 25:2112–2129
Collins AL, Zhang Y, Walling DE, Grenfell SE, Smith P, Grischeff J,
Locke A, Sweetapple A, Brogden D (2012) Quantifying fine-
grained sediment sources in the River Axe catchment, Southwest
England: application of a Monte Carlo numerical modelling
framework incorporating local and genetic algorithm optimisa-
tion. Hydrol Process 26:1962–1983
Collins AL, Zhang YS, Duethmann D, Walling DE, Black KS (2013)
Using a novel tracing-tracking framework to source fine-grained
sediment loss to watercourses at sub-catchment scale. Hydrol
Process 27:959–974
Couper P (2003) Effects of silt–clay content on the susceptibility of
river banks to subaerial erosion. Geomorphology 56:95–108
Couper P, Stott TIM, Maddock IAN (2002) Insights into river bank
erosion processes derived from analysis of negative erosion-pin
recordings: observations from three recent UK studies. Earth
Surf Process Landf 79:59–79
De Rose RC, Basher LR (2011) Measurement of river bank and cliff
erosion from sequential LIDAR and historical aerial photogra-
phy. Geomorphology 126:132–147
De Rose RC, Wilson DJ, Bartley R, Wilkinson SN (2005) Riverbank
erosion and its importance to uncertainties in large scale
sediment budgets. In: Walling DE, Horowitz JA (eds) Proceed-
ings of the international symposium on sediment budgets (S1)
held during the seventh scientific assembly of the IAHS at Foz
do Iguacu, Brazil, 3–9 April 2005, Sediment Budgets 1, IAHS
Publ., vol. 291, IAHS Press pp 85–92
Devlin MJ, Barry J, Mills DK, Gowen RJ, Foden J, Sivyer D, Tett P
(2008) Relationships between suspended particulate material,
light attenuation and Secchi depth in UK marine waters. Estuar
Coast Shelf Sci 79:429–439
Downward SR, Gurnell AM, Brookes A (1994) A methodology for
quantifying river channel planform using GIS. IAHS Publ. no
224
Environment Agency (2008) River habitat survey
Gautier E, Brunstein D, Vauchel P, Roulet M, Fuertes O, Guyot J,
Darozzes J, Bourrel L (2007) Temporal relations between
meander deformation, water discharge and sediment fluxes in
the floodplain of the Rio Beni (Bolivian Amazonia). Earth Surf
Process Landf 32:230–248
Gurnell A, Downward SR, Jones R (1994) Channel planform change
on the river Dee meanders, 1876–1992. Regul Rivers Res Manag
9:187–204
Hall JE, Holzer DM, Beechie TJ (2007) Predicting river floodplain
and lateral channel migration for salmon habitat conservation.
J Am Water Resour Assoc 43:786–797
He Q, Owens P (1995) Determination of suspended sediment
provenance using caesium-137, unsupported lead-210 and
radium-226: a numerical 388 mixing model approach. In: Foster
I, Gurnell A, Webb B (eds) Sediment and water quality in river
catchments. Wiley, Chichester
Henshaw AJ, Thorne CR, Clifford NJ (2013) Identifying causes and
controls of river bank erosion in a British upland catchment.
Catena 100:107–119
Hessel R, van Asch T (2003) Modelling gully erosion for a small
catchment on the Chinese Loess Plateau. Catena 54:131–146
Hey RD, Thorne CR (1975) Secondary flow in river channels. Area
7(3):191–195
Hickin E, Nanson G (1975) The character of channel migration on the
Beatton River, Northeast British. Geol Soc Am Bull 86:487–494
Hooke JM (1979) An analysis of the processes of river bank erosion.
J Hydrol 42:39–62
Hooke J (1980) Magnitude and distribution of rate of river bank
erosion. Earth Surf Process 5:143–157
Hooke J (2003) Coarse sediment connectivity in river channel
systems: a conceptual framework and methodology. Geomor-
phology 56:79–94
Hooke JM (2008) Temporal variations in fluvial processes on an
active meandering river over a 20-year period. Geomorphology
100:3–13
Hughes M, McDowell PF, Marcus WA (2006) Accuracy assessment
of georectified aerial photographs: implications for measuring
later channel movement in GIS. Geomorphology 74:1–16
JanesVJ (2013)An analysis of channel bank erosion and development of
a catchment sediment budgetmodel,Unpublished thesis,University
of Exeter. Available: http://hdl.handle.net/10871/14870Julian J, Torres R (2006) Hydraulic erosion of cohesive riverbanks.
Geomorphology 76:193–206
Julien PY (2002) River mechanic. Cambridge University Press,
Cambridge
Knighton AD (1973) Riverbank erosion in relation to streamflow
conditions, river Bollin-Dean, Cheshire. East Midland Geogr
5:416–426
Knighton D (1998) Fluvial forms and processes: a new Perspective.
Routledge, Oxford UK
307 Page 16 of 18 Environ Earth Sci (2017) 76:307
123

Kondolf G, Piegay H, Landon N (2002) Channel response to
increased and decreased bedload supply from land use change:
contrasts between two catchments. Geomorphology 45:35–51
Kronvang B, Andersen HE, Larsen SE, Audet J (2013) Importance of
bank erosion for sediment input, storages and export at the
catchment scale’. J Soils Sediment 13:230–241
Land IS (2014) Soils Data � Cranfield University (NSRI) and for the
Controller of HMSO
Laubel A, Kronvang B, Hald AB, Jensen C (2003) Hydromorpho-
logical and biological factors influencing sediment and phos-
phorus loss via bank erosion in small lowland rural streams in
Denmark. Hydrol Process 17:3443–3463
Lawler DM (1991) A new technique for the automatic monitoring of
erosion and deposition rates. Water Resour Res 27:2125–2128
Lawler DM (1993) Needle ice processes and sediment mobilization
on river banks: the river Ilston, West Glamorgan, UK. J Hydrol
150:81–114
Lawler DM, Couperthwaite J, Bull LJ, Harris NM (1997) Bank
erosion events and processes in the upper severn basin. Hydrol
Earth Syst Sci 1:523–534
Lawler DM, Grove JR, Couperthwaite JS, Leeks GL (1999)
Downstream change in river bank erosion rates in the Swale
and Ouse system, northern England. Hydrol Process 13:977–992
Lewin G, Brindle B (1977) Confined meanders. In: Gregory K (ed)
River channel changes. Wiley, Hoboken, pp 221–233
Leys KF, Werritty A (1999) River channel planform change: software
for historical analysis. Geomorphology 29:107–120
Lu D, Li G, Calladares GS, Batistella M (2004) Mapping soil erosion
risk in Rondonia, Brazilian Amazonia: using RUSLE, remote
sensing and GIS. Land Degredation Dev 15:499–512
Lu S, Kronvang B, Audet J, Trolle D, Andersen HE, Thodsen H, van
Griensven A (2015) Modelling sediment and total phosphorus
export from a lowland catchment: comparing sediment routing
methods. Hydrol Process 29:280–294
Mackey SD, Bridge JS (1992) A revised FORTRAN program to
simulate alluvial stratigraphy. Comput Geosci 18:119–181
Mattia C, Bischetti G, Gentile F (2005) Biotechnical characteristics of
root systems of typical Mediterranean species. Plant Soil
278:23–32
Michalkova M, Piegay H, Kondolf GM, Greco SE (2011) Lateral
erosion of the Sacramento River, California (1942–1999), and
responses of channel and floodplain lake to human influences.
Earth Surf Process Landf 36:257–272
Micheli E, Kirchner J (2002) Effects of wet meadow riparian
vegetation on streambank erosion. 1. Remote sensing measure-
ments of streambank migration and erodibility. Earth Surf
Process Landf 27:627–639
Milne J (1983) Patterns of confinement in some stream channels of
upland Britain. Geogr Ann Ser A Phys Geogr 65:67–83
Montgomery DR, Buffington JM (1997) Channel-reach morphology
in mountain drainage basins. Geol Soc Am Bull 109:596–611
Neal CWM, Andera AM (2015) Suspended sediment supply domi-
nated by bank erosion in a low-gradient agricultural watershed,
Wildcat Slough, Fisher, Illinois, United States. J Soil Water
Conserv 70:145–155
Neller R (1988) A comparison of channel erosion in small urban and
rural catchments, Armidale, New South Wales. Earth Surf
Process Landf 13:1–7
Nicoll TJ, Hickin EJ (2010) Planform geometry and channel
migration of confined meandering rivers on the Canadian
prairies. Geomorphology 116:37–47
Norusis M (2005) SPSS 13.0 guide to data analysis. Prentice Hall,
New Jersey
Owens PN, Walling DE, Leeks GJL (2000) Tracing fluvial suspended
sediment sources in the catchment of the River Tweed, Scotland
using composite fingerprints and a numerical mixing model. In:
Foster ID (ed) Tracers in Geomorphology. Wiley, Chichester,
pp 291–308
Rapp C, Abbe T (2003) A framework for delineating channel
migration zones. Ecology Publication
Rhoades EL, O’Neal MA, Pizzuoto JE (2009) Quantifying bank
erosion on the South River from 1937 to 2005 and its importance
in assessing Hg contamination. Appl Geogr 29:125–134
Schilling K, Wolter C (1999) Detailed GPS survey of Walnut Creek,
Iowa: channel characteristics and spatial relationships [WWW
Document]. Iowa Geological and Water Survey. URL http://
www.igsb.uiowa.edu/Mapping/WaterQualityAg/walnut/wntpost/
wntpost.htm. Accessed 26 Nov 13
Schumm S, Khan H (1972) Experimental study of channel patterns.
Geol Soc Am Bull 83:1755–1770
Simon A, Collison A (2002) Quantifying the mechanical and
hydrologic effects of riparian vegetation on streambank stability.
Earth Surf Process Landf 27:527–546
Soulsby C, Youngson A, Moir H, Malcolm IA (2001) Fine sediment
influence on salmonid spawning habitat in a lowland agricultural
stream: a preliminary assessment. Sci Total Environ 265:295–307
Theurer F, Harrod TR, Theurer M (1998) Sedimentation and
Salmonids in England and Wales. Environment Agency R&D
technical report P194, Swindon
Thorne C (1991) Bank erosion and meander migration of the Red and
Mississippi rivers, USA. IAHS PUBL WALLINGFOR-
D,(ENGL). pp 301–313
Tooth S, McCarthy TS, Brandt D, Hancox PJ, Morris R (2002)
Geological controls on the formation of alluvial meanders and
floodplain wetlands: the example of the Klip River, eastern Free
State, South Africa. Earth Surf Process Landf 27:797–815
Vente J, Poesen J, Verstraeten G, Van Rompaey A, Govers G (2008)
Spatially distributed modelling of soil erosion and sediment
yield at regional scales in Spain. Global Planet Change
60:393–415
Walling DE (2005) Tracing suspended sediment sources in catch-ments and river systems. Sci Total Environ 344:159–184
Walling DE, Bradley SB (1989) Rates and patterns of contemporary
floodplain sedimentation: a case study of the river Culm, Devon,
UK. GeoJournal 19:53–62
Walling DE, Collins AL (2005) Suspended sediment sources in
British rivers. In: Sediment Budgets 1 International Association
of Hydrological Sciences Publication No. 291, Wallingford,
pp 123–133
Walling DE, Webb BW (1987) Suspended load in gravel-bed rivers:
UK experience. In: Thorne CR, Bathurst JC, Hey RD (eds)
Gravel-bed rivers. Wiley, Hoboken, pp 291–732
Walling DE, Woodward J (1995) Tracing sources of suspended
sediment in river basins: a case study of the River Culm, Devon,
UK. Mar Freshw Res 46:327–336
Walling DE, Owens PPN, Leeks GJLG (1999) Fingerprinting
suspended sediment sources in the catchment of the River Ouse,
Yorkshire, UK. Hydrol Process 975:955–975
Walling DE, Collins AL, Jones PA, Leeks GJL, Old G (2006)
Establishing fine-grained sediment budgets for the Pang and
Lambourn LOCAR catchments, UK. J Hydrol 330:126–141
Walling DE, Collins AL, Stroud RW (2008) Tracing suspended
sediment and particulate phosphorus sources in catchments.
J Hydrol 350:274–289
Wilkinson SN, Olley JM, Prosser IP, Read AM (2005) Targeting
erosion control in large river systems using spatially distributed
Environ Earth Sci (2017) 76:307 Page 17 of 18 307
123

sediment budgets, Geomorphological Processes and Human
Impacts in River Basins. International Association of Hydrolog-
ical Sciences Publication No. 299IAHS Press, Wallingford, UK,
pp 56–64
Williams G (1986) River meanders and channel size. J Hydrol
88:147–164
Winterbottom SJ, Gilvear DJ (2000) A GIS-based approach to
mapping probabilities of river bank erosion: regulated river
Tummel, Scotland. Regul Rivers Res Manag 16:127–140
Yamamura K (1999) Transformation using (x ? 0.5) to stabilize the
variance of populations. Res Popul Ecol 41:229–234
307 Page 18 of 18 Environ Earth Sci (2017) 76:307
123


![Factors influencing[1]](https://static.fdocuments.in/doc/165x107/54be1c8d4a795948378b4597/factors-influencing1.jpg)