Household food insecurity among low-income Toronto families: Implications for social policy
IJAAR 5 (2017) 10-22 ISSN 2053-1265
Analysis of food insecurity status among farming households in North Central Nigeria
Amao, J. O.1* and Ayantoye K. 2
1Department of Agricultural Economics, Ladoke Akintola University of Technology, P. M. B. 4000. Ogbomoso, Nigeria.
2Department of Agricultural Economics and Extension, Kwara State University. Malete, Nigeria.
Article History ABSTRACT Received 21 October, 2015 Received in revised form 27 December, 2016 Accepted 03 January, 2017 Keywords: Food insecurity, Harvesting season, Planting season, Adult equivalent, Dependency ratio. Article Type: Full Length Research Article
Food insecurity has been attributed to many interconnected factors, hence this study was intended to analyse food insecurity status among farming households. Panel data survey method was used to collect relevant information from 283 rural households in North Central, Nigeria from September to December 2013 during food crops harvesting season (HS) and from April to June 2014, during food crops planting season (PS). Data were collected with well-structured questionnaire and were analyzed using descriptive statistics, FGT 1984 Food insecurity index and Probit regression model. Based on the recommended daily energy level (L) of 2250 kcal, the food insecurity line (Z) was estimated at ₦1652.38 per month per adult equivalent during the harvesting season, while the food insecurity line (Z) during the planting season was ₦1795.80 per month per adult equivalent. Forty-two and seventy-eight percent of the households were food insecure during the harvesting and planting seasons respectively. Probit regression analysis revealed that household size, educational status of head, age, asset ownership, remittances, occupational status of head, and access to credit and access to extension services are factors that significantly determine these movements. It is therefore concluded that there was high level of food insecurity during planting season in the study area.
©2017 BluePen Journals Ltd. All rights reserved
INTRODUCTION In 1996, world leaders met in Rome for the second World Food Summit (WFS) to discuss ways to end hunger and to challenge the global community to cut in half by the year 2015, the number of undernourished people worldwide (800 million), of whom 250 million are severely malnourished children. This goal was reiterated in the United Nations Millennium Declaration in September 2000. To achieve the goal, the number of undernourished people was to be reduced by at least 20 million every year between 1996 and 2015. However, the trend of the decline in the number of the undernourished (an average of 8 million each year), as observed by Food and Agriculture Organization (FAO, 2008), is grossly *Corresponding author. E-mail: [email protected].
inadequate to meet the 1996 World Food Summit target (Okuneye, 2002).
Food availability for the farm household means ensuring sufficient food is available for them through own production. The seasonal trends in food prices and wage rates have important implications on the food security status of Nigerian poor household, who according to the findings from the National Living Standard Survey (NLSS) in 2004 spent up to 90 percent of their income on food (World Bank, 2005). Statistics from the National Bureau of Statistics (NBS, 2007) indicated that poverty incidence in Nigeria rose from 28.1 percent in 1980 to 54.4 percent in 2004. With the estimated population figure of 140 million, this translates to 74 million Nigerians were living below poverty line. While 63 percent of this figure lives in the rural areas, 43 percent of the total population of the Southwest, Nigeria, is poor (NBS, 2007). Similarly,

Okunmadewa (2001) revealed that one major charac-teristic of the farming populace of Nigeria is food insecurity. The basic minimum requirement figure has been found to be 65 g of protein and 2500 kcal of energy per capita intake of which if consumed otherwise, leads to a state of malnutrition (Omonona and Agoi, 2007). The problem of food insecurity especially during the hungry period among rural households in Nigeria is long standing (Obamiro, 2005). Most times, they rely on market purchases since they do not have enough to subsist on the year round. This leads to inconsistent food availability thus contributing to food insecurity during the period (Adepoju and Adejare, 2013).
Food insecurity has been attributed to the following interconnected factors: income insecurity making an individual or household unable to purchase sufficient food or food with adequate nutrient content to assure food security; spatial factors such as living in a neighborhood without an affordable grocery store, markets or other outlets; disproportionate income allocation to other areas, such as rent, leaving an insufficient budget for food; and isolation, loss of autonomy or a lack of a social network (Olagunju et al., 2012). In addition, Adebayo (2010) noted that the factors that constrain food supply and food demand invariably affect food security. Studies (World Bank, 2001; Ribar and Hamrick, 2003) have revealed that rural people face a high risk of food insecurity due to poverty, income inadequacies, limited access to resources, underemployment, and unemployment, and many barriers to self-sufficiency, which create family frailty and crisis (Ayantoye et al., 2011). The main focus has shifted from global and national to household and individual food insecurity and from food availability to food accessibility and the security of access (Maxwell and Smith, 1996). The study sets out to analyse the food insecurity status among farming households in North central Nigeria. METHODOLOGY This study was carried out in the North Central Nigeria. The zone is one of the six geo political zones that the country is divided into. It comprises Nasarawa, Plateau, Benue, Kogi, Niger and Kwara States. Based on the contiguity and homogeneity nature of the zone, the study area was further divided into three sub-groups of two States each viz: Nasarawa/Plateau; Kogi/Kwara; Niger /Benue States. It was on this criterion that Kwara/Kogi States sub-group was purposively selected for the study. Kwara State was created on February 3
rd, 1976 with its
capital in Ilorin. The State is bounded in the North by Niger State, in the South by Osun and Ondo States, in the East by Kogi State and in the West by Oyo State. Kwara State shares an International boundary with the Republic of Benin. The 2006 national population census
Int. J. Adv. Agric. Res. 11 estimated the state population as 2,591,555. The state is made up of 16 Local Government Areas (LGAs).Similarly, Kogi State was created on August 27, 1991, out of the old Kwara and Niger States, with its capital in Lokoja. The 2006 provisional population figures put the State at 3,278,487 with an average of 172,000 farm families. It is located between Latitude 7°48ʹ North and Longitude 6°43ʹ East of Greenwich Meridian and sharing boundaries with Kwara, Ondo, Ekiti, Niger, Benue, Nasarawa, Anambra, Enugu, Edo as well as Federal Capital Territory It has 16 Local Government Areas.
Primary data were collected in two periods, during the harvesting season of 2013 and the planting season of 2014. The primary data were collected through the aid of a well-structured questionnaire, administered on rural households in the area of study. A multi-stage random sampling method was adopted in the selection of respondents. In the first stage, Kwara and Kogi States were selected among the six States in the North Central geo-political zone based on the homogeneity and contiguity nature of the two States. The second stage involved the random selection of two LGAs each from the three senatorial districts (the Central, the Southern and Northern areas) in Kwara and Kogi States. The third stage involved the random selection of villages (1-4) depending on the number of the villages in each LGA. The delineation of Kwara and Kogi States into villages and towns in 2006 by the Nigeria Population Commission (NPC) (2006) was adopted for this study. The study, however, excludes cosmopolitan areas since the study is strictly rural. The proportionality factor used in the selection of the villages is stated as: XI=
N/N*15 (1)
Where: XI = Number of villages to be sampled, N = Number of villages in the particular Local Government
Area, and N = Total number of villages in all the local government areas.
At the fourth stage, the number of households from each village was selected using another proportionality factor such that the number of households selected from each village is proportionate to the total number of households in all the villages. The proportionality factor is stated as follows: XJ=
P/P*150 (2)
Where: XJ = The number of households to be sampled from each village, P = the number of households in each village,
P = the sum of the number of households in the 16 villages selected.

Amao and Ayantoye 12 This led to 15 villages being proportionately selected in each of Kwara and Kogi States respectively based on the number of villages in the study area. And 150 respondents (these sample sizes were successfully drawn and the responses were satisfactory) each for the two states to give a total of 300 sample size. However 283 households were tracked in the second phase of data collection and were used for the study. DATA ANALYSIS Food Insecurity Status and Profile Detail methods adopted in the computation of the food insecurity line, profiling of food insecurity status and Probit regression model used in projecting the long run equilibrium state are well outlined. Specifically, the food insecurity line is gotten in the following steps: (a) The value of food (Fj) consumed by the j
th household:
Fj=G*j+C*j (3) The value of purchased food consumed G*j by j
th
household:
G*j = DijPij (4) The value of own output or donated food C*j consumed by the j
th household:
C*j = MijPij (5) (b) Total value of food consumed per adult equivalent:
Fj F*j= Hj
(6)
(c) The different types and quantities of foods consumed by the different households were converted to calories (Cj) using the calorie equivalents presented in Appendices 1 and 2. (d) A regression model was then fitted into Equation 7 to estimate parameters (a) and (b) to be used in determining food insecurity threshold (line).
InF*j = a+bCj (7)
(e) The food insecurity line, Z, which is the estimated cost of acquiring the calorie recommended daily allowance (RDA) was estimated as:
Z=e(a+bR)
(8)
(f) The decomposition of food insecurity status was based
on several socio-economic characteristics of households using:
Pα=
q
I Z
YiZ
N
I
1
(9)
The FGT 1984 measure for the group or population was obtained using:
nn
m
i
iiFF
1
(10)
The contribution (ci) of each subgroup’s weighted food insecurity measure to the whole group’s weighted food insecurity measure was determined by using:
iiii nFFnC (11)
Determinants of food insecurity status
Estimation of factors influencing food security transitions are best captured by using Probit model (Baulch and McCulloch, 1998). This study used Probit model for data analysis in determining factors that affect food insecurity status and then picked the model that best fitted and interpreted the data collected.
YIJ = Bo+BiXi+ei (12)
Where: Yij = the dependent variable for the food insecurity status, i = 1….. 283, j = 1 or 0 for food insecurity status, Y = f(X1, X8……….X15), Y = 1 if food secure 0 if otherwise, bo = constant term, Xi = the independent variables.
The independent variables, which are the socio-economic and demographic variables, are captured as: X1 = Household size, X2 = primary education dummy (D = 1 if households head has primary education, 0 If otherwise), X3 = secondary education dummy (D = 1 If households head has secondary education, 0 if otherwise) X4 = tertiary education dummy (D=1 If households head has tertiary education, 0 If otherwise) X5 = age of household head (year), X6 = marital status of the household head (D = 1 if married, 0 If otherwise), X7 = gender of the household head (D = 1 if male, 0 if otherwise), X8 = years of farming experience (Years), X9 = dependency ratio, X10 = farm size (Ha), X11 = access to extension services (1 If yes, 0 If otherwise) X12 = access to credit facilities (1 if yes, 0 if otherwise), X13 = occupation status of the head
(D =1 if household head is into farming as primary occupation, 0 if otherwise), X14 = access to remittance (D=1 if household has access to remittance, 0 if otherwise)and X15 = land ownership (D=1 if household own land, 0 if otherwise).
RESULTS AND DISCUSSION
Food insecurity profile of the rural household
This section decomposes food insecurity among rural households in the Southwestern Nigeria based on demo-graphic, occupational and socio-economic characteristics in order to see how food insecurity varies from one sub-group to another for the two years of study.
Food insecurity status and socio-economic and demographic characteristics of the households
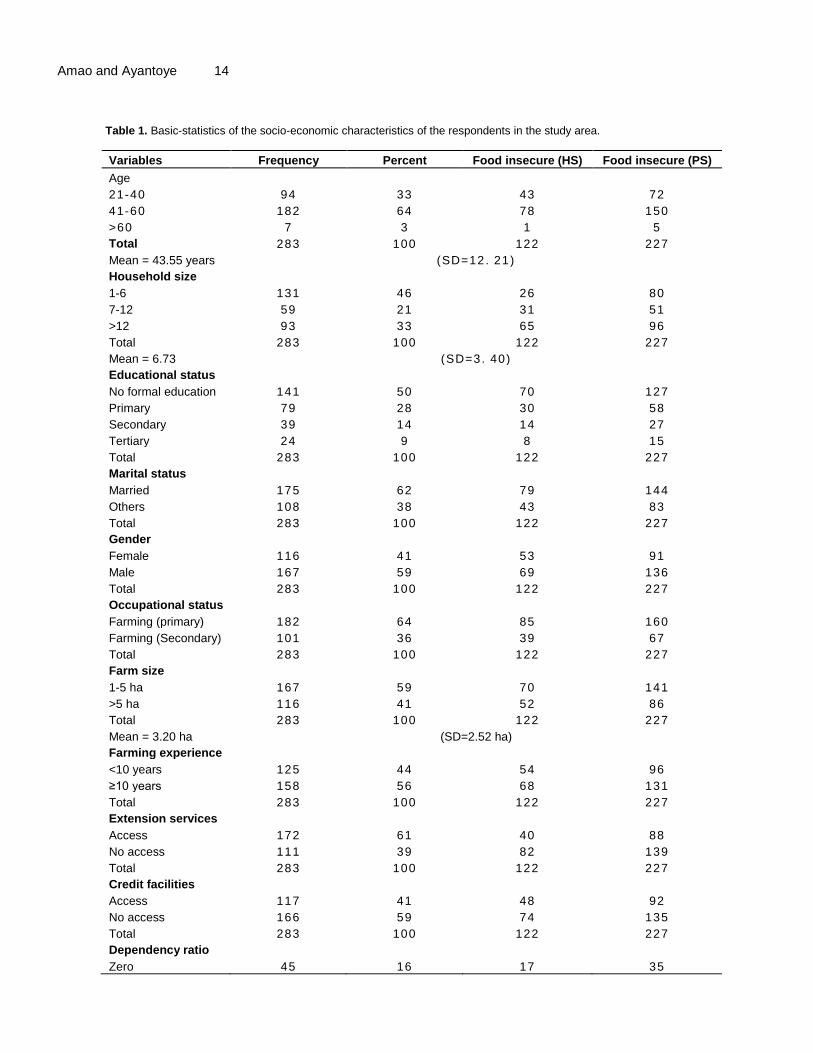
A listing of some selected socio-economic and demographic variables used in the estimation of food insecurity status were presented in Table 1. The mean age was 43.55. Marital status analysis revealed that most respondents (62 percent) were married while 59 percent of the sample sizes were male headed households. The average monthly income in the study area was ₦4066.71. Also, while on the average, households in the study area spent ₦2101.48 on food monthly and spent ₦1965.23 on non-food items. The percentage food expenditure to total household expenditure per month in the study area was 51.68 percent. Based on the recommended daily energy level (L) of 2250 kcal, the food insecurity line (Z) for the households was estimated at ₦1652.38 per month per adult equivalent during the harvesting season, while the food insecurity line (Z) during the planting season was estimated at ₦1795.80 per month per adult equivalent (Appendix 2). Based on the ₦1652.38 monthly food insecurity threshold, 42 percent of the households were food insecure during the harvesting season. During the planting season, when the food insecurity threshold was N1795.80 monthly, the percentage of households that were food insecure rose to 78 percent.
The mean age (43.55 years) reveals that majority of respondents were in their productive years, hence would be expected to be able to produce enough food for local consumption to be food secured. Also, the majority of the household heads were male and married with wives and children, with monthly income of ₦4066.71 should propel government to be more concern with the issue of food insecurity in the rural communities. The expenditure pattern also revealed the need to boost local food production in the study area.
Int. J. Adv. Agric. Res. 13 Food insecurity by household size, marital status, age and gender of the household heads in the study area
The size of rural households is a strong factor affecting the level of food insecurity in the rural households as depicted in Table 2. The result showed that food insecurity incidence increases as the household size increases. The result is in agreement with the findings of Alber (2003). The rural households were grouped into 3: small (1-6 persons), medium (7-12 persons) and large (12 persons and above). During HS, 19 percent of the small sized households were food insecure, 52% of the medium sized were food insecure and 68% of the large sized rural households were food insecure. In planting season (PS), the same trend was observed but at a higher rate. Fifty nine percent of the small sized households were food insecure, the medium sized households increased to 85% while the large sized households had 100% food insecurity. Similar trends were also observed for the food insecurity depth and severity, these increases with increase in household size. Also the food insecurity experienced by these rural households were higher during the planting season than during the harvesting season. Also from Table 2 it could be deduced that the contribution of the various households sub groups to the whole group’s food insecurity incidence in HS increases with household’s size. The contributions of the sub group to the whole group’s food insecurity depth and severity followed similar pattern. Similarly, during HS the contribution of the various sub groups to the whole group’s food insecurity incidence, depth and severity increases with household size.
During HS, food insecurity incidence of individuals belonging to married rural households was 43%, while it was 39% for households headed by unmarried persons. For the same period, the food insecurity depth was 15% respectively for both households headed by married and unmarried individuals. The severity for the two groups was 7 and 8.3%, respectively for households headed by married and unmarried individuals. Similar trend was observed during PS except for the food insecurity severity, which was 27% respectively for the households headed by married and unmarried individuals (Table 2).
The contribution of the subgroups to the whole group weighted food insecurity during PS showed a similar trend as HS. A higher incidence, depth and severity of food insecurity for households headed by married individual than the unmarried individual for the two years under study (Table 2). In addition, food insecurity indices were higher during (PS) than (HS). In general, rural households headed by unmarried persons were better than the households headed by married persons in the area of study. This result contradicted the findings of London and Scott (2005) that food insecurity was more
Amao and Ayantoye 14
Table 1. Basic-statistics of the socio-economic characteristics of the respondents in the study area.
Variables Frequency Percent Food insecure (HS) Food insecure (PS)
Age
21-40 94 33 43 72
41-60 182 64 78 150
>60 7 3 1 5
Total 283 100 122 227
Mean = 43.55 years (SD=12. 21)
Household size
1-6 131 46 26 80
7-12 59 21 31 51
>12 93 33 65 96
Total 283 100 122 227
Mean = 6.73 (SD=3. 40)
Educational status
No formal education 141 50 70 127
Primary 79 28 30 58
Secondary 39 14 14 27
Tertiary 24 9 8 15
Total 283 100 122 227
Marital status
Married 175 62 79 144
Others 108 38 43 83
Total 283 100 122 227
Gender
Female 116 41 53 91
Male 167 59 69 136
Total 283 100 122 227
Occupational status
Farming (primary) 182 64 85 160
Farming (Secondary) 101 36 39 67
Total 283 100 122 227
Farm size
1-5 ha 167 59 70 141
>5 ha 116 41 52 86
Total 283 100 122 227
Mean = 3.20 ha (SD=2.52 ha)
Farming experience
<10 years 125 44 54 96
≥10 years 158 56 68 131
Total 283 100 122 227
Extension services
Access 172 61 40 88
No access 111 39 82 139
Total 283 100 122 227
Credit facilities
Access 117 41 48 92
No access 166 59 74 135
Total 283 100 122 227
Dependency ratio
Zero 45 16 17 35

Int. J. Adv. Agric. Res. 15
Table 1. Contd.
0.01-0.99 193 68 99 167
1.0 20 7 33 35
>1.0 25 9 3 10
Total 283 100 122 227
Remittance
No 203 72 100 194
Yes 80 28 22 33
Total 283 100 122 227
Land ownership
No 171 60 82 153
Yes 112 40 40 74
Total 283 100 122 227
Source: Field survey, 2014. Table 2. Food insecurity by household size, marital status, age and gender of household heads in the study area.
Harvesting season (HS) Planting season (PS)
Po P1 P2 Po P1 P2
Household size
1 – 6 0.19(0.22) 0.06(0.18) 0.02(0.14) 0.59(0.35) 0.22(0.25) 0.21(0.21)
7 – 12 0.52(0.25) 0.19(0.27) 0.10(0.28) 0.85(0.22) 0.42(0.22) 0.22(0.22)
> 12 0.68(0.53) 0.25(0.55) 0.13(0.56) 1.00(0.43) 0.66(0.53) 0.48(0.57)
Total 0.44 0.17 0.09 0.73 0.38 0.25
Marital status
Married 0.43(0.65) 0.15(0.61) 0.07(0.58) 0.79(0.63) 0.42(0.63) 0.27(0.62)
Unmarried 0.39(0.35) 0.15(0.39) 0.08(0.42) 0.75(0.37) 0.40(0.37) 0.27(0.38)
Total 0.44 0.17 0.09 0.73 0.38 0.25
Age of Household Head
21 – 40 0.41(0.35) 0.14(0.37) 0.07(0.38) 0.75(0.32) 0.40(0.32) 0.27(0.32)
41 – 60 0.45(0.64) 0.17(0.62) 0.08(0.61) 0.80(0.66) 0.42(0.66) 0.28(0.66)
> 60 0.13(0.01) 0.11(0.01) 0.12(0.01) 0.63(0.02) 0.23(0.02) 0.11(0.11)
Total 0.44 0.17 0.09 0.73 0.38 0.25
Gender
Female 0.40(0.43) 0.14(0.44) 0.07(0.42) 0.76(0.40) 0.39(0.39) 0.26(0.39)
Male 0.45(0.57) 0.16(0.56) 0.08(0.58) 0.78(0.60) 0.42(0.61) 0.28(0.61)
Total 0.44 0.17 0.09 0.73 0.38 0.25
Source: Field Survey, 2014. prevalent among unmarried. This could be attributed to the fact that married rural households according to Omonona (2001) were always made up of large household size and polygamous in nature, which increases their dependency ratio and hence a lower welfare status than those household headed by unmarried person. The unmarried household heads even when they were divorced or separated usually have a smaller household size. In general, as household size
increases, food insecurity extent also increase and so their contributions to whole group food insecurity. This could be as a result of the fact that increased household size is synonymous with higher dependency that hardly contributed to the income of household. Also, the higher food insecurity experienced during the planting period of 2014 could be adduced to the fact that planting season coincides with the period of food scarcity when the stored food must have been depleted by the households.

Amao and Ayantoye 16 Table 3. Food insecurity by dependency ratio, years of farming experience, educational status and farm size of household heads in the study area.
Harvesting season (HS) Planting season (PS)
Po P1 P2 Po P1 P2
Dependency ratio
Zero 0.12(0.03) 0.04(0.02) 0.01(0.02) 0.38(0.04) 0.11(0.03) 0.06(0.01)
0.01 -0.999 0.16(0.02) 0.06(0.03) 0.02(0.02) 0.79(0.07) 0.28(0.04) 0.15(0.04)
1.0 0.36 0.14) 0.11(0.12) 0.05(0.11) 0.74(0.15) 0.37(0.15) 0.24(0.14)
> 1.0 0.50(0.81) 0.18(0.83) 0.09(0.85) 0.84(0.74) 0.47(0.78) 0.38(0.81)
Total 0.44 0.17 0.09 0.73 0.38 0.25
Years of farming experience
<10 years 0.42(0.44) 0.15(0.44) 0.07(0.42) 0.74(0.42) 0.41(0.44) 0.27(0.46)
≥10 years 0.42(0.56) 0.15(0.56) 0.08(0.58) 0.80(0.58) 0.41(0.56) 0.28(0.54)
Total 0.44 0.17 0.09 0.73 0.38 0.25
Educational status
No formal education 0.48(0.59) 0.17(0.59) 0.12(0.58) 0.87(0.55) 0.59(0.57) 0.43(0.57)
Primary school 0.37(0.20) 0.18(0.20) 0.09(0.20) 0.72(0.22) 0.47(0.17) 0.31(0.16)
Secondary school 0.35(0.12) 0.11(0.11) 0.04(0.15) 0.68(0.14) 0.39(0.13) 0.26(0.13)
Tertiary school 0.32(0.09) 0.11(0.10) 0.04(0.07) 0.60(0.09) 0.25(0.13) 0.15(0.14)
Total 0.44 0.17 0.09 0.73 0.38 0.25
Farm size
≤ 5 ha 0.43(0.57) 0.15(0.59) 0.08(0.57) 0.82(0.61) 0.43(0.60) 0.28(0.60)
Above 5 ha 0.41(0.43) 0.15(0.41) 0.07(0.43) 0.72(0.39) 0.39(0.40) 0.26(0.40)
Total 0.44 0.17 0.09 0.73 0.38 0.25
Source: Field Surveys, 2014. Three age classifications were used to profile food insecurity among rural households. These were 21–40 years, 41–60 years and above 60 years. The food insecurity incidence among the rural households increases with the age of the household heads (Table 2). In this context, 41% of households whose heads fell within the age group 21 and 40 years were food insecure and this increased to 45 percent for the age group 41–60 years during HS. The food insecurity depth and severity equally followed the same trend for these groups. Similarly, during PS, food insecurity incidence, depth and severity increased as the age of the heads of the household’s increases as observed during HS. The contributions of the sub groups to the whole group food insecurity incidence, depth and severity during HS and PS followed similar pattern of increasing with increase in age of household head. In summary, age of household head is directly related to households’ food insecurity and this result is in consonance with Agbola et al. (2004) and London and Scott (2005) that food insecurity of the households’ increases with the age of the household head. This pattern could be attributed to the fact that the ability to do hard and difficult work associated with rural
livelihood activities of which farming is one decreases with increase in age. During HS, Table 2 shows that 40% of female headed households were food insecure compared with 45% of male headed households who were food insecure. The food insecure among female headed and male headed households respectively increased to 76 and 78% during HS. The contributions of the sub groups to the whole group food insecurity indices follow that of food insecurity incidence for the two seasons. From the foregoing, food insecurity is higher among male headed households than female headed households, judging from the food insecurity incidence, depth and severity and their respective contributions to the whole group’s food insecurity. This result is in contrast to the findings of Ribar and Hamrick (2003) that female headed households were more likely to be food insecure than the male headed households. This may be due to the fact that in the study area, female headed rural households were always involved in other livelihood activities like trading in addition to farming thus allowing them to have diversified income source to augment food from own production. Other reasons could also be that they have

smaller household size and monogamous in nature unlike a male headed household that were polygamous with its attendant problem of large family size. Also the food insecurity incidence, depth and severity were higher during PS than HS. Food insecurity by dependency ratio, years of farming experience, educational status and farm size of household heads in the study area In Table 3 households with dependency ratio less than one have lower food insecurity indices while households with dependency ratio greater than one have higher food insecurity indices. Specifically, the food insecurity incidence increases with dependency ratio from 12 to 50% for households with dependency ratio zero and > 1.0 respectively during HS while similar movement was also recorded among the four groups of dependency but at high degree during PS. The same pattern of movement was observed in food security depth and severity in both seasons. The subgroup contribution to the whole group weighted food insecurity measure revealed a similar pattern as with the food insecurity incidence, depth and severity (Table 3). Overall, food insecurity increases with increase in dependency ratio; this is probably because more mouths were needed to be fed. This result is in tune with the findings of Ribar and Hamrick (2003) and London and Scott (2005) that households with higher number of children under the age of 18 years or higher number of dependants in their households were more likely to be food insecure. Two sub-groups of households farming experience were used to profile food insecurity among rural households. These were households whose heads had farming experience below 10 years and those whose heads had farming experience of 10 years and above as shown in Table 3. The analysis revealed that 42 percent of the households headed by persons having less than 10 years and, 10 years and above farming experience were food insecure during HS. Similar pattern of equality was shown by the sub-groups for both the food insecurity depth and severity. But in PS, the food insecurity incidences among the households headed by persons of below 10 years and, 10 years and above rose to 74 and 80%, respectively. In the same year, the food insecurity depth and severity followed a similar pattern of equality between the two sub-groups as experienced in HS. It is important to equally mention here that food insecurity incidence for the two sub-groups in PS were very high when compared with HS figure. However, there were no appreciable changes in the sub-groups contribution to the whole weighted measure of food insecurity incidence, depth and severity for both periods (Table 3). In summary, the food insecurity incidence, depth and severity among rural farming households’ increases as the years of farming experience increases.
Int. J. Adv. Agric. Res. 17 This is probably has to do with the increase in age of farmers as observed by London and Scott (2005). This is in agreement with the findings of Obamiro (2005). The high food insecurity incidence experience in both groups in PS could also be attributed to the period which coincides with the period of food scarcity.
Table 3 revealed that for the two seasons of study, food insecurity indices are higher among those rural house holds whose heads had no formal education and lowest among those family whose heads have attained one level of education or other. The food insecurity incidence almost doubled the HS figures in PS. The food security depth and severity followed similar pattern among the various sub-groups of educational status of household heads for the two years of study. Similar pattern of decrease in subgroups contributions to the whole weighted food insecurity depth and severity as the level of education increases were observed during the two years of study (Table 3). However, the PS indices were higher than HS. In conclusion, the extent of food insecurity decreases with increase in educational qualification of the heads of the rural households. This may not be unconnected with the fact that as educational status of the heads of households increases, their adoption and use of new improved farming inputs and practices provided by the extensions services increases, thereby raising their income and consequently reducing food insecurity. Higher education increases the likelihood of getting other paid jobs other than farming and equally regulates indiscriminate child birth that would have led to an increase in the dependency ratio of such a household (Omonona, 2001). Table 3 shows that 43% of the households whose farm sizes were not more than five hectares were food insecure while 41% of households whose farm sizes were more than five hectares were food insecure in HS. The food insecurity incidence in PS almost doubled the HS figure for the two sub-groups. The food insecurity depth and severity experienced by these two subgroups in HS and PS followed similar pattern as the food insecurity incidence. The contributions of the sub-group to the whole group food insecurity depth and severity for the two periods followed similar pattern with the food insecurity incidence. The result indicates that food insecurity decreases with increase in farm size. This result is in agreement with the findings of Obamiro (2005). The reason for this trend is that increase farm size will lead to increase in food available for household consumption and extra income could be generated from the sales of surplus farm produce. Food insecurity by access to extension services, credit, occupational status, remittances and land ownership of household heads in the study area Rural households were categorized into those without

Amao and Ayantoye 18 Table 4. Food insecurity by access to extension services, access to credit, occupational status, access to remittances and land ownership of household heads in the study area.
Harvesting season (HS) Planting season (PS)
Po P1 P2 Po P1 P2
Access to extension services
No access 0.46(0.61) 0.18(0.57) 0.08(0.56) 0.78(0.59) 0.42(0.59) 0.27(0.60)
Access 0.37(0.39) 0.15(0.43) 0.07(0.44) 0.76(0.41) 0.41(0.41) 0.27(0.40)
Total 0.44 0.17 0.09 0.73 0.38 0.25
Access to credit facilities
No access 0.43(0.61) 0.16(0.59) 0.08(0.56) 0.78(0.59) 0.41(0.59) 0.28(0.60)
Access 0.40(0.39) 0.14(0.43) 0.07(0.41) 0.76(0.41) 0.41(0.41) 0.26(0.40)
Total 0.44 0.17 0.09 0.73 0.38 0.25
Occupational status
Farming as primary occupation 0.34(0.59) 0.44(0.60) 0.27(0.58) 0.84(0.70) 0.62(0.52) 0.33(0.52)
Farming as secondary occupation 0.58(0.41) 0.26(0.40) 0.14(0.42) 0.66(0.30) 0.34(0.48) 0.19(0.48)
Total 0.44 0.17 0.09 0.73 0.38 0.25
Access to remittances
No 0.46(0.61) 0.32(0.75) 0.22(0.82) 0.93(0.55) 0.59(0.58) 0.41 (0.62)
Yes 0.27(0.52) 0.26(0.20) 0.18(0.70) 0.40(0.33) 0.51(0.36) 0.40(0.35)
Total 0.44 0.17 0.09 0.73 0.38 0.25
Land ownership
No 0.46(0.58) 0.22(0.90) 0.11(0.94) 0.87(0.63) 0.49(0.62) 0.31(0.65)
Yes 0.34(0.42) 0.15(0.10) 0.07(0.60) 0.63(0.37) 0.40(0.38) 0.29(0.35)
Total 0.44 0.17 0.09 0.73 0.38 0.25
Source: Field Surveys, 2014. access to extension services and those households whose heads had access to extension services (Table 4). The result of the analysis reveals that 46 and 37% respectively, of rural households whose heads had no access to extension services and rural households whose heads had access to extension services were food insecure in HS. The incidence of food insecurity increased to 78 and 76% respectively, for households whose heads have no access to extension services and households whose heads had access to extension services in PS. Similar pattern were also recorded for food insecurity depth and severity for the two years period. The contribution of the subgroups to the whole group food insecurity incidence, depth and severity for the two years followed similar pattern. This result is in agreement with Obamiro (2005). In summary, food insecurity among rural households in the study area is higher when households’ heads had no access to extension services than when the head had access to extension services. Also the food insecurity measures are very high in PS than in HS. This is because access to extension services, apart from leading to increased area cultivated where tractor hiring services were available, equally leads to increased yield as a result of the adoption of new improved biological and chemical inputs
and practices of agricultural production. Increased yield automatically translated to increased income which automatically leads to lowering the level of food insecurity.
Rural households were also categorized into those without access and those with access to credit (Table 4). Also, 43% of households whose heads had no access to credit facilities were food insecure in HS while the incidence increased to 78% in PS. Among the households whose heads had access to credit, 40% of them were food insecure in HS, but increased to 76% in PS. The food insecurity depth and severity for the two years of study followed similar pattern. The contributions of the sub-groups to the whole weighted food insecurity indices in both HS and PS show a similar pattern with the food insecurity incidence.
In summary, rural households whose heads had access to credit were less food insecure than those whose heads had no access. This result is in agreement with Obamiro (2005). This is so because loanable funds can be used to expand production through the purchase and use of modern improved inputs and consequently improve the food security of such households.
Furthermore, households whose heads engaged in farming as primary occupation and households whose

heads engaged in farming as secondary occupation were examined to profile rural households food insecurity. In HS, the food insecurity incidence is 34% among the households whose heads takes into farming as primary occupation, while it is 58% among households whose heads engaged in farming as secondary occupation (Table 4). In PS, food insecurity incidence rose to 84 and 66%, respectively for the households whose heads engaged in farming as primary occupation, and those households whose heads engaged in farming as secondary occupation. Similar pattern of higher food insecurity depth and severity among the households whose heads engaged in farming as primary occupation were observed in the two years of study. The contribution of the subgroups in HS and PS to the whole weighted food insecurity incidence depth and severity followed similar pattern like the food insecurity incidence. Generally, households whose heads engaged in farming as primary occupation are more vulnerable to food insecurity. This is because they had limited source of meeting their food needs during the planting season due to poor storage facilities and the pressure to sell off their excess food crops to meet other financial obligation (Jimoh, 2004). This factor and many more combine to bring about reduction in income of individuals belonging to this group of households. But for farming households that engaged in farming as secondary occupation were able to spread their risk over the different occupations whose income are not likely to be affected by adverse factors affecting the yield of agricultural production.
Table 4 shows that households with no access to remittances were more food insecure than those with access to remittances. The food insecurity incidence increases from 27% in HS to 40% in PS among households who had access to remittances, while the food insecurity incidence among households who had no access to remittances increases from 46% in HS to 93% in PS. This indicated that households who had no access to remittances were more vulnerable to food insecurity than the households who had access to remittances. This result is in agreement with a priori expectation that access to remittance decreases food insecurity (Agbola et al., 2004). The reason may be because access to remittances gives a kind of support to the households during the period of food scarcity normally experienced during the planting season. In addition, extra income and food is made available through remittance for such households to augment households’ food needs. The food insecurity depth and severity and their contributions for the two years of study follow similar pattern of increment.
The result of the analysis as shown in Table 4 reveals that in HS food insecurity incidence among households who own no land was 46 percent while it was 34% among land owning households. Their food insecurity depth and severity follow similar pattern. The respective
Int. J. Adv. Agric. Res. 19 contributions of sub group food insecurity to the whole group food insecurity measures follow similar pattern. Also, during PS, food insecurity incidence among households who own no land rose to 87%, while it rose to 63% among land owning households. Food insecurity depth, severity and their contributions followed similar pattern (Table 4).
In summary, the extent of food insecurity was more in those households who own no land than in the land owning households for the two seasons of study this pattern may be due to the fact that assets owning households were relatively well off, having income from farming and non-farming activities. And in most cases they received remittances from members of the family living outside the household. In addition, during the period of food shortage and scarcity period these assets can be commercialized in order to generate income for the household to survive or be out rightly sold. Determinants of household food insecurity status among households in the study area It should be noted that a positive sign of a coefficient indicated that an increase in the variable tend to increase the likelihood of the household moving into food insecurity. Similarly, a negative sign of a coefficient decreases the likelihood of the household moving into food insecurity. Out of the 15 variables, 8 significantly determined the probability of household’s food insecurity status in the area of study. These were household size (X1), the three educational status categories (X2, X3, X4), age of the household head (X5), access to credit (X12), farming as primary occupation (X13) and ownership of land (X15). Large household size had the likelihood increasing food insecurity by 12.4% at p<0.01 (Table 5). This agrees with Ribar and Hamrick (2003) that the larger the household size the higher the probability of moving into food insecurity. This could be as a result of the fact that increased household size is synonymous with higher dependency that hardly contributed to the income of household. Also, the negative and significant coefficients 0.2635 (p<0.1), 0.0205 (p<0.05) and 0.1481 (p<0.1) for primary, secondary and tertiary levels respectively, of educational attainment of the households heads indicated that households’ heads attainment of any of the levels decrease the probability of moving into food insecurity by 26, 2 and 15% respectively, for primary, secondary and tertiary educational attainment. This is in agreement with Ribar and Hamrick (2003) that the odd of moving into food insecurity decreases with increase in educational attainment of household head. An increase in the age of household head increases the probability of such a household into food insecurity by 1.5% at p<0.1. This is in agreement with Ribar and Hamrick (2003), that household headed by older person is more likely to move

Amao and Ayantoye 20
Table 5. Maximum likelihood estimate of the Probit regression of household food insecurity status among farming households in North Central, Nigeria.
Variable Coefficient Standard error
Constant -0.0654 0.2455
Household size (X1) 0.1238 0.0426***
Primary education (X2) -0.2635 0.1580*
Secondary education (X3) -0.0205 0.0109**
Tertiary education (X4) -0.1481 0.0874*
Age (X5) 0.0150 0.0078*
Marital status (X6) -0.0607 0.0821
Gender (X7) 0.0734 0.0591
Farming experience (X8) -0.0081 0.0164
Dependency ratio (X9) 0.0019 0.0250
Farm size (X10) -0.0010 0.0015
Access to extension (X11) -0.1745 0.2247
Access to credit (X12) -0.0330 0.0111***
Occupational status (X13) 0.0529 0.0303*
Access to remittance (X14) 0.1347 0.7460
Land ownership (X15) -0.0084 0.0031***
Chisqure = 59648.692 DF=453 P=0.00
***, Denotes significance at 1%; **, at 5%; *, at 10%. Source: 2014 Computer printout of Probit regression.
into food insecurity. This could be attributed to the fact that the ability to do hard and difficult work associated with rural livelihood activities of which farming is one decreases with increase in age. Access to credit had a coefficient of -0.0330. This indicated that access to credit reduces the probability of the household moving into food insecurity by 3% at p<0.01. This is so because loanable funds can be used to expand production through the purchase and use of modern improved inputs and consequently improve the food security of such households. Households whose heads engaged in farming as primary occupation had the likelihood of moving into food insecurity by 5% at p<0.1. Land ownership reduces the probability of household moving into food insecurity by 0.8% at p<0.01. This is in line with a priori expectation that asset ownership reduces the odd of household entering into food insecurity because the assets can be sold to meet food needs during the period of food scarcity. Conclusion Based on the empirical evidence emanating from this study, it was concluded that there was high level of food insecurity in the study area particularly during the PS. Food insecurity was influenced by household size, educational status, age, dependency ratio and occupa-tional status of the household head. The findings further
revealed that food insecurity status was influenced by household size, educational status, age, marital status, farming experience, farm size, dependency ratio, access to extension services, access to credit facilities and occupational status of the household head. The households with large size and high dependency ratio were worst hit by food insecurity. The very few that had fairly small household sizes were food secure. The food insecure households were more among households whose heads had no access to credit facilities. The following recommendations are made in order to ensure food security among rural households in the study area. The identified chronically food insecure households should be specifically targeted by the government for safety net such as provision of subsidized food crops, distribution of food crops as relief materials and special nutrition programme involving the provision of free meal for malnourished households. Since most of the rural households who engaged in farming as primary occupation are worst hit by food insecurity, special training to enable them acquire skills fully is being advocated. This will guarantee them more income to meet food needs during the planting period. This study suggests that efforts should be made to sensitize and encourage households to have children they can really cater for. It is also recommended that formation of cooperative societies should be encouraged and insti-tutionalized among rural households. In addition, government should encourage farmers to borrow money

at regular basis from micro finance banks through favorable lending terms. To ease access to credit, the difficulties and bureaucracies (like suitable collateral and education of applicant) involved in formal lending procedures must be removed. REFERENCES
Adebayo A. A. (2010). Food security status in Nigeria: Pre and post
economic deregulation review. Int. J. Econ. Dev. Res. Invest. 1(1):135-150.
Adepoju A. O. & Adejare K. A. (2013). Food insecurity status of rural household during the post-planting season in Nigeria. J. Agric. Sustain. 4(1):16-35.
Agbola P. O., Ikpi A. E. & Kormawa P. M. (2004). Factors influencing food insecurity among rural households in Africa: Results of analysis from Nigeria. http://www.freewebtown.com.
Alber J. (2003). Comparative analyses of nutritional effectiveness of food subsidies and other food – related interventions. Washington, D.C. International Food Policy Research Institute, 2003.
Ayantoye K., Yusuf S. A., Omonona B. T. & Amao J. O. (2011). Food insecurity dynamics and its correlates among rural households in South-western Nigeria. Int. J. Agric. Econ. Rural Dev. 4(1):43-55.
Baulch B. & McCulloch N. (1998). Being poor and becoming poor: Poverty status and poverty transitions in rural Pakistan. Preliminary material and interim research results circulated to stimulate discussion and critical comment. Institute of Development Studies, University of Sussex.
Food and Agriculture Organization, FAO (2008). The state of food insecurity in the world 2008. FAO’s Ninth Progress Report on world hunger since the 1996 World Food Summit (WFS), Rome.
Jimoh A. K. (2004). Perception and determinants of vulnerability to poverty among farming households in Kajola Local Government Area of Oyo state, Nigeria. Unpublished M.Sc. Thesis in the Department of Agricultural Economics, University of Ibadan, Ibadan.
London S. & Scott E. (2005). Food security, stability and change among low-income urban women. USDA Economic Reseach Service.
Maxwell S. & Smith M. (1996). Household food security: A conceptual review. In: S. Maxwell and T. R. Frankenberger, (eds). Household food security: Concepts, indicators, measurements. A technical review. Jointly sponsored by UNICEF and IFAD.
National Bureau of Statistics (NBS) (2007). Poverty profile for Nigeria 2004. NBS Abuja.
Int. J. Adv. Agric. Res. 21 National Population Commission (NPC) (2006). 2006 National
Provisional Population Figures. Obamiro E. O. (2005). Pillars of food insecurity in rural areas of Nigeria.
http//www.cigar.org. Oguntona E. B. & Akinyele I. O. (1995). Nutrients composition of
commonly eaten foods in nigeria- Raw, processed and prepared. food basket foundation series.
Okuneye R. A. (2002). Rising cost of food prices and food insecurity in Nigeria and its implication for poverty reduction. CBN Economic and Financial Review.
Okunmadewa F. (2001). Food insecurity and poverty in Nigeria: Breaking the jinx. Public lecture delivered at the National Association of Agricultural Students Week programme at University of Ibadan, August 2001.
Olagunju F. I., Oke J. T. O., Babatunde R. O. & Ajiboye A. (2012). Determinants of food insecurity in Ogbomoso Metropolis of Oyo State, Nigeria. Publication of Nasarawa State University, Keffi. Prod. Agric. Technol. J. 8(1):111-124.
Omonona B. T. & Agoi G. A. (2007). Analysis of food security situations among Nigerian urban households: Evidence from Lagos State. Journal of Central European Agriculture. 8(3): 397-406.
Omonona B. T. (2001). Poverty and its correlates among rural farming households in Kogi State, Nigeria. Unpublished Ph.D. Thesis, Department of Agriculture Economics, University of Ibadan.
Ribar D. C. & Hamrick K. S. (2003). Dynamics of poverty and food insufficiency. Food assistance and nutrition research report No. 36 FANRR Washington, DC: USDA.
World Health Organization, WHO (1985). Energy and protein requirements. Technical Report Series, 724. Geneva.
World Bank (2001). Poverty and hunger: Issues and options for food security in developing countries Washington DC, USA. World Bank. 22p.
World Bank (2005). World Bank Regional Database, www.worldbank.org (28 January, 2005).

Amao and Ayantoye 22 Appendix
Appendix 1. Nutrition (calorie based) equivalent scales.
Years of age Male Female
0-5 0.4875 0.4875
6-15 0.896 0.7800
16-64 1.060 0.8267
Above 65 0.840 0.7400
Source: Obtained from World Health Organisation (1985) and Omonona (2001).
Appendix 2. Nutrients composition of commonly eaten foods in Nigeria – raw, processed and prepared.
Food item Kcal/kg
Gari 3840
Cowpea 5920
Rice 1230
Soybean 4050
Melons (shelled) 5670
Groundnut 5950
Bread 2330
Sugar 3750
Orange 440
Mango 590
Powdered milk 4900
Agric egg 1400
Fish 2230
Meat 2370
Maize 4120
Okra 4550
Pepper 3930
Tomatoes 880
Plantain 770
Yam 3810
Cocoyam 3830
Cassava flour 3870
Leafy vegetable 4210
Oil 8750
Source: Oguntona and Akinyele (1995).