
Prevalence and Correlates of Food Insecurity among ... · 1 Prevalence and Correlates of Food...
37
1 Prevalence and Correlates of Food Insecurity among Children across the Globe Audrey L. Pereira, Sudhanshu Handa, and Goran Holmqvist Office of Research - Innocenti Working Paper WP-2017-09 | June 2017
Transcript of Prevalence and Correlates of Food Insecurity among ... · 1 Prevalence and Correlates of Food...
1
Prevalence and Correlates of
Food Insecurity among Children
across the Globe
Audrey L. Pereira, Sudhanshu Handa, and Goran Holmqvist
Office of Research - Innocenti Working Paper
WP-2017-09 | June 2017
2
INNOCENTI WORKING PAPERS
UNICEF Office of Research Working Papers are intended to disseminate initial research contributions within the programme of work, addressing social, economic and institutional aspects of the realization of the human rights of children.
The findings, interpretations and conclusions expressed in this paper are those of the authors and do not necessarily reflect the policies or views of UNICEF.
This paper has been peer reviewed both externally and within UNICEF.
The text has not been edited to official publications standards and UNICEF accepts no responsibility for errors.
Extracts from this publication may be freely reproduced with due acknowledgement. Requests to utilize larger portions or the full publication should be addressed to the Communication Unit at: [email protected].
For readers wishing to cite this document, we suggest the following form:
Pereira, A.L., Handa, S. and Holmqvist, G. Prevalence and Correlates of Food Insecurity Among Children Across the Globe, Innocenti Working Paper 2017-09, UNICEF Office of Research, Florence.
© 2017 United Nations Children’s Fund (UNICEF)
eISSN: 2520-6796

3
THE UNICEF OFFICE OF RESEARCH – INNOCENTI
The Office of Research – Innocenti is UNICEF’s dedicated research centre. It undertakes research on emerging or current issues in order to inform the strategic directions, policies and programmes of UNICEF and its partners, shape global debates on child rights and development, and inform the global research and policy agenda for all children, and particularly for the most vulnerable.
Publications produced by the Office are contributions to a global debate on children and may not necessarily reflect UNICEF policies or approaches. The views expressed are those of the authors.
The Office of Research – Innocenti receives financial support from the Government of Italy, while funding for specific projects is also provided by other governments, international institutions and private sources, including UNICEF National Committees.
For further information and to download or order this and other publications, please visit the website at www.unicef-irc.org.
Correspondence should be addressed to:UNICEF Office of Research - InnocentiPiazza SS. Annunziata, 1250122 Florence, ItalyTel: (+39) 055 20 330Fax: (+39) 055 2033 [email protected]: @UNICEFInnocentifacebook.com/UnicefOfficeofResearchInnocenti

4
PREVALENCE AND CORRELATES OF FOOD INSECURITY AMONG CHILDREN ACROSS THE GLOBE
Audrey L. Pereira1, Sudhanshu Handa2, and Goran Holmqvist1
1 UNICEF Office of Research—Innocenti, Florence, ITALY
2 Department of Public Policy, University of North Carolina at Chapel Hill, USA
Corresponding author is: [email protected]
Abstract: Target 2.1 of the Sustainable Development Goals calls to end hunger, in all its forms, by 2030. Measuring food security among children under age 15, who represent a quarter of the world’s population, remains a challenge and is unfeasible for global monitoring. The SDG framework has agreed to use the Food Insecurity Experience Scale (FIES) to measure moderate and severe food insecurity. The FIES is an experience-based metric that reports food-related behaviours on the inability to access food due to resource constraints. We present the first global estimates of the share and number of children below age 15, who live with a respondent who is food insecure.
Methodology: Using nationally-representative data from the Gallup World Poll (GWP) survey in 2014-15, we provide the first estimates of food insecurity among households with children under age 15, globally, and by region. In addition, we test the robustness of the FIES against 1) the GWP food insecurity indicator; 2) monetary poverty; and 3) a measure of well-being – the Negative Experience Index – to understand how well the FIES captures different aspects of food insecurity. Finally, we explore trends in per capita income as a determinant of food security (2006-2015), to observe how this relationship fluctuated during the Great Recession.
Results: Among 147 countries and four territories, 41% of children under age 15 live with a respondent who is moderately or severely food insecure, 19% live with a respondent who is severely food insecure, and 45% live with a respondent who reported not having enough money to buy food in the previous 12 months. These estimates translate into roughly 605 million, 260 million and 688 million children under age 15, respectively. The relationship between food insecurity and poverty, and well-being varies by region, demonstrating that definitions of food insecurity depend on regional context, and encompass more than monetary poverty alone. Finally, correlations of food insecurity and income per capita between 2006 and 2015, show that some regions were harder hit by the shocks in food prices and the Great Recession than others.
Conclusions: Our estimates are the first to quantify the extent of food insecurity among households with children across countries and ideally, will encourage and provide motivation for continued global efforts to address this issue and monitor progress towards SDGs. In addition, further research on how food insecurity differs between children and adults will be important for future efforts to address and reduce child hunger.
Acknowledgements: The authors thank Gallup for the data, without which, this analysis and manuscript would not have been possible. We also thank the Voices of the Hungry project of the Food and Agriculture Organization of the United Nations (FAO) for funding this project and the license to use the GWP data. Our thanks go to Terri Ballard, Andrew Rzepa and Sara Viviani for helpful technical advice throughout this project,
Laura Meucci for grant administration, and Amber Peterman for useful comments and editorial assistance.

5
TABLE OF CONTENTS
1. INTRODUCTION .............................................................................................................................. 6
2. DATA AND METHODOLOGY .......................................................................................................... 7
2a. Gallup World Poll ..................................................................................................................... 7
2b. The Voices of the Hungry (VoH) project and Food Insecurity Experience Scale (FIES) ...... 8
2c. Methodology ............................................................................................................................. 9
3. RESULTS ....................................................................................................................................... 10
3a. Descriptive statistics of sample............................................................................................. 10
3b. Comparing different measures of food insecurity .............................................................. 11
3c. How do food insecurity measures compare with monetary and non-monetary measures of well-being? ....................................................................................................... 13
3d. Prevalence and burden of food insecurity by region .......................................................... 14
3e. How do the FIES-M+ and GWP indicator estimates compare to national data? .............. 15
3f. Income as a determinant of food security over time (2006-2015)...................................... 17
4. DISCUSSION AND CONCLUSION ............................................................................................... 19
5. REFERENCES ................................................................................................................................. 21
APPENDIX ......................................................................................................................................... 23
APPENDIX 1. Regional groupings of countries/territories included in analysis (where data on households with at least one child under age 15 was available) ................... 23
APPENDIX 2: Food insecurity prevalence by region and country in 2014-15, among all households, and households with children under 15 years ................................... 24
APPENDIX 3: Weighted means of key variables for all countries by year ............................... 35
APPENDIX 4: Notes on sources and calculations ...................................................................... 37
6
Prevalence and Correlates of Food Insecurity among Children across the Globe
Innocenti Working Paper 2017-09
1. INTRODUCTION
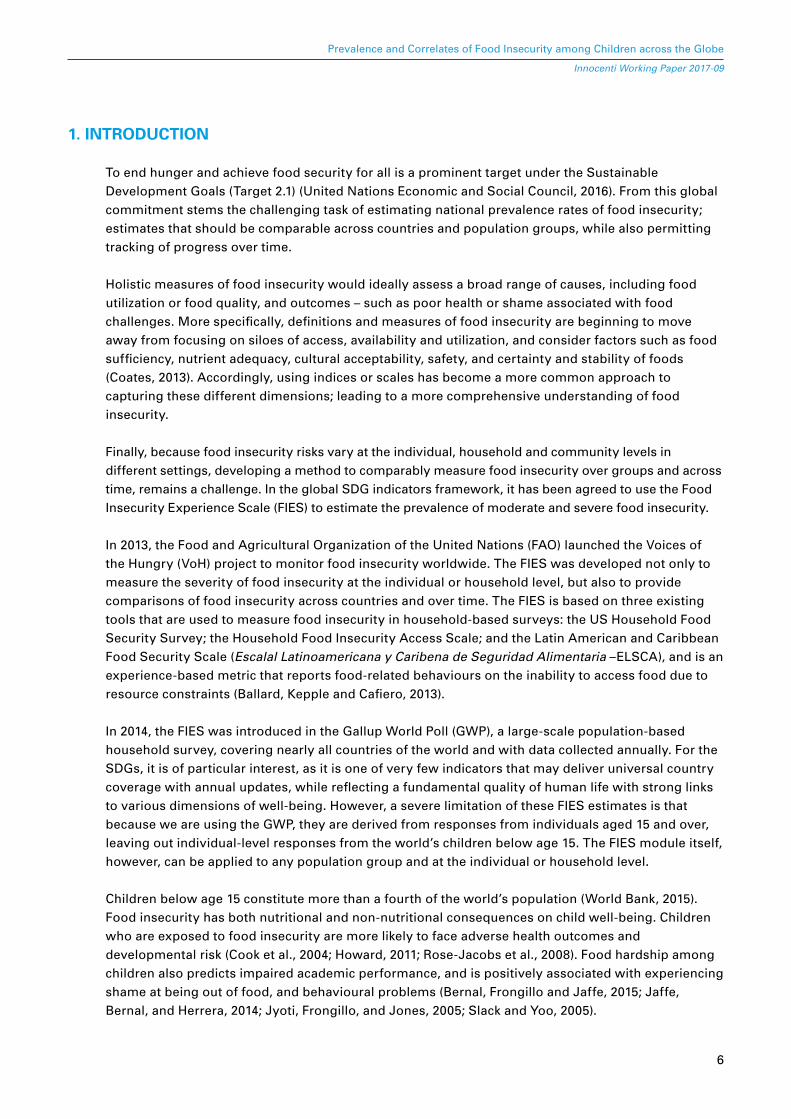
To end hunger and achieve food security for all is a prominent target under the Sustainable Development Goals (Target 2.1) (United Nations Economic and Social Council, 2016). From this global commitment stems the challenging task of estimating national prevalence rates of food insecurity; estimates that should be comparable across countries and population groups, while also permitting tracking of progress over time.
Holistic measures of food insecurity would ideally assess a broad range of causes, including food utilization or food quality, and outcomes – such as poor health or shame associated with food challenges. More specifically, definitions and measures of food insecurity are beginning to move away from focusing on siloes of access, availability and utilization, and consider factors such as food sufficiency, nutrient adequacy, cultural acceptability, safety, and certainty and stability of foods (Coates, 2013). Accordingly, using indices or scales has become a more common approach to capturing these different dimensions; leading to a more comprehensive understanding of food insecurity.
Finally, because food insecurity risks vary at the individual, household and community levels in different settings, developing a method to comparably measure food insecurity over groups and across time, remains a challenge. In the global SDG indicators framework, it has been agreed to use the Food Insecurity Experience Scale (FIES) to estimate the prevalence of moderate and severe food insecurity.
In 2013, the Food and Agricultural Organization of the United Nations (FAO) launched the Voices of the Hungry (VoH) project to monitor food insecurity worldwide. The FIES was developed not only to measure the severity of food insecurity at the individual or household level, but also to provide comparisons of food insecurity across countries and over time. The FIES is based on three existing tools that are used to measure food insecurity in household-based surveys: the US Household Food Security Survey; the Household Food Insecurity Access Scale; and the Latin American and Caribbean Food Security Scale (Escalal Latinoamericana y Caribena de Seguridad Alimentaria –ELSCA), and is an experience-based metric that reports food-related behaviours on the inability to access food due to resource constraints (Ballard, Kepple and Cafiero, 2013).
In 2014, the FIES was introduced in the Gallup World Poll (GWP), a large-scale population-based household survey, covering nearly all countries of the world and with data collected annually. For the SDGs, it is of particular interest, as it is one of very few indicators that may deliver universal country coverage with annual updates, while reflecting a fundamental quality of human life with strong links to various dimensions of well-being. However, a severe limitation of these FIES estimates is that because we are using the GWP, they are derived from responses from individuals aged 15 and over, leaving out individual-level responses from the world’s children below age 15. The FIES module itself, however, can be applied to any population group and at the individual or household level.
Children below age 15 constitute more than a fourth of the world’s population (World Bank, 2015). Food insecurity has both nutritional and non-nutritional consequences on child well-being. Children who are exposed to food insecurity are more likely to face adverse health outcomes and developmental risk (Cook et al., 2004; Howard, 2011; Rose-Jacobs et al., 2008). Food hardship among children also predicts impaired academic performance, and is positively associated with experiencing shame at being out of food, and behavioural problems (Bernal, Frongillo and Jaffe, 2015; Jaffe, Bernal, and Herrera, 2014; Jyoti, Frongillo, and Jones, 2005; Slack and Yoo, 2005).
7
Prevalence and Correlates of Food Insecurity among Children across the Globe
Innocenti Working Paper 2017-09
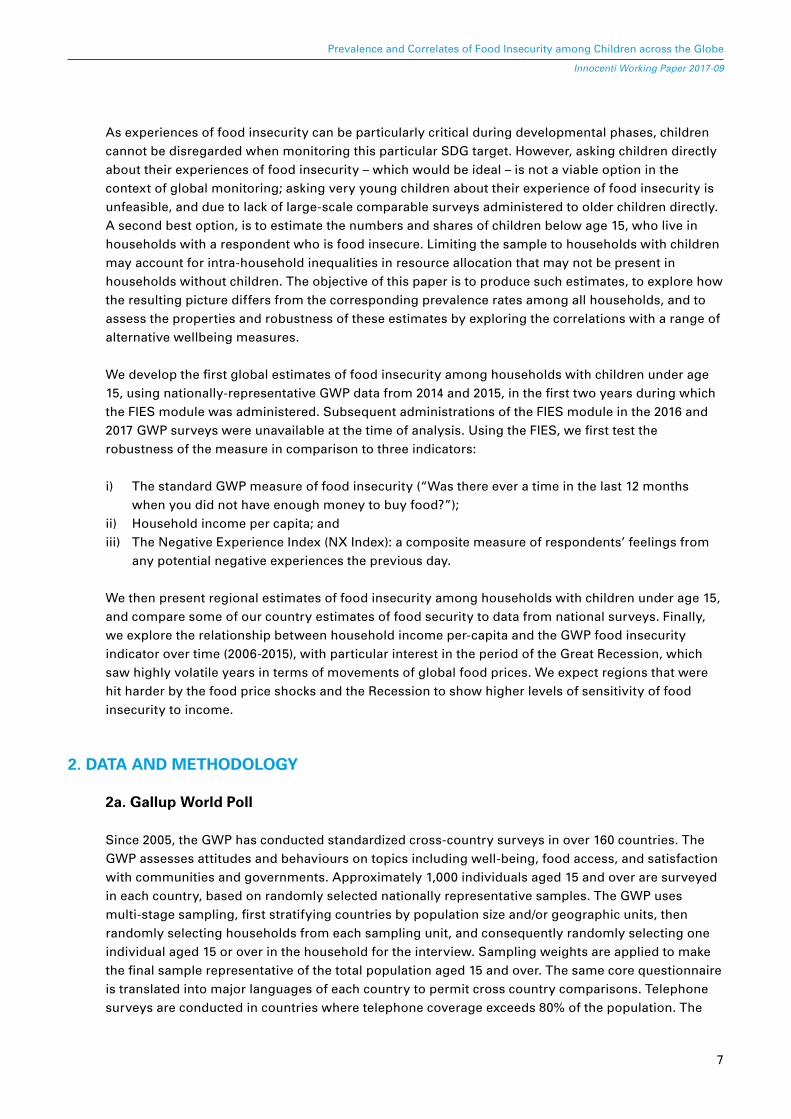
As experiences of food insecurity can be particularly critical during developmental phases, children cannot be disregarded when monitoring this particular SDG target. However, asking children directly about their experiences of food insecurity – which would be ideal – is not a viable option in the context of global monitoring; asking very young children about their experience of food insecurity is unfeasible, and due to lack of large-scale comparable surveys administered to older children directly. A second best option, is to estimate the numbers and shares of children below age 15, who live in households with a respondent who is food insecure. Limiting the sample to households with children may account for intra-household inequalities in resource allocation that may not be present in households without children. The objective of this paper is to produce such estimates, to explore how the resulting picture differs from the corresponding prevalence rates among all households, and to assess the properties and robustness of these estimates by exploring the correlations with a range of alternative wellbeing measures.
We develop the first global estimates of food insecurity among households with children under age 15, using nationally-representative GWP data from 2014 and 2015, in the first two years during which the FIES module was administered. Subsequent administrations of the FIES module in the 2016 and 2017 GWP surveys were unavailable at the time of analysis. Using the FIES, we first test the robustness of the measure in comparison to three indicators:
i) The standard GWP measure of food insecurity (“Was there ever a time in the last 12 months when you did not have enough money to buy food?”);
ii) Household income per capita; and iii) The Negative Experience Index (NX Index): a composite measure of respondents’ feelings from
any potential negative experiences the previous day.
We then present regional estimates of food insecurity among households with children under age 15, and compare some of our country estimates of food security to data from national surveys. Finally, we explore the relationship between household income per-capita and the GWP food insecurity indicator over time (2006-2015), with particular interest in the period of the Great Recession, which saw highly volatile years in terms of movements of global food prices. We expect regions that were hit harder by the food price shocks and the Recession to show higher levels of sensitivity of food insecurity to income.
2. DATA AND METHODOLOGY
2a. Gallup World Poll
Since 2005, the GWP has conducted standardized cross-country surveys in over 160 countries. The GWP assesses attitudes and behaviours on topics including well-being, food access, and satisfaction with communities and governments. Approximately 1,000 individuals aged 15 and over are surveyed in each country, based on randomly selected nationally representative samples. The GWP uses multi-stage sampling, first stratifying countries by population size and/or geographic units, then randomly selecting households from each sampling unit, and consequently randomly selecting one individual aged 15 or over in the household for the interview. Sampling weights are applied to make the final sample representative of the total population aged 15 and over. The same core questionnaire is translated into major languages of each country to permit cross country comparisons. Telephone surveys are conducted in countries where telephone coverage exceeds 80% of the population. The
8
Prevalence and Correlates of Food Insecurity among Children across the Globe
Innocenti Working Paper 2017-09
core GWP questionnaire includes one question on food security, “Was there ever a time in the past 12 months when you did not have enough money to buy food?” (For further details on methodology and questionnaire design, see: www.gallup.com).
2b. The Voices of the Hungry (VoH) project and Food Insecurity Experience Scale (FIES)
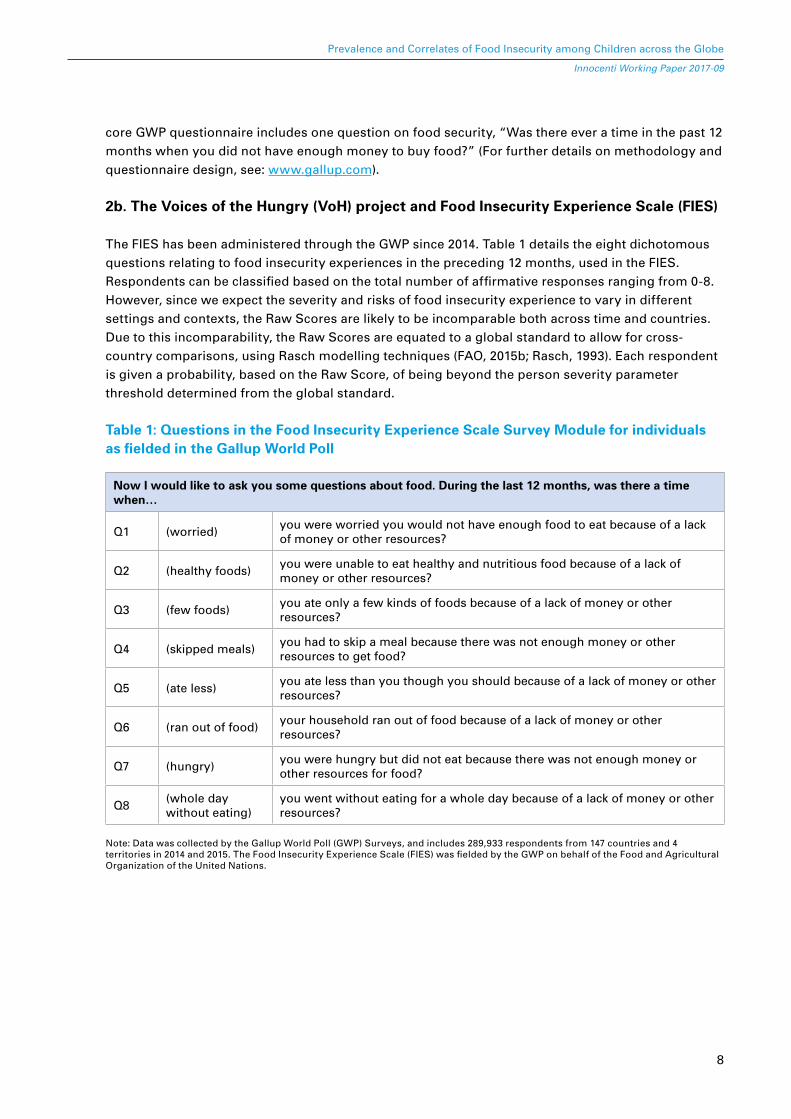
The FIES has been administered through the GWP since 2014. Table 1 details the eight dichotomous questions relating to food insecurity experiences in the preceding 12 months, used in the FIES. Respondents can be classified based on the total number of affirmative responses ranging from 0-8. However, since we expect the severity and risks of food insecurity experience to vary in different settings and contexts, the Raw Scores are likely to be incomparable both across time and countries. Due to this incomparability, the Raw Scores are equated to a global standard to allow for cross-country comparisons, using Rasch modelling techniques (FAO, 2015b; Rasch, 1993). Each respondent is given a probability, based on the Raw Score, of being beyond the person severity parameter threshold determined from the global standard.
Table 1: Questions in the Food Insecurity Experience Scale Survey Module for individuals as fielded in the Gallup World Poll
Now I would like to ask you some questions about food. During the last 12 months, was there a time when…
Q1 (worried) you were worried you would not have enough food to eat because of a lack of money or other resources?
Q2 (healthy foods) you were unable to eat healthy and nutritious food because of a lack of money or other resources?
Q3 (few foods) you ate only a few kinds of foods because of a lack of money or other resources?
Q4 (skipped meals) you had to skip a meal because there was not enough money or other resources to get food?
Q5 (ate less) you ate less than you though you should because of a lack of money or other resources?
Q6 (ran out of food) your household ran out of food because of a lack of money or other resources?
Q7 (hungry) you were hungry but did not eat because there was not enough money or other resources for food?
Q8 (whole day without eating)
you went without eating for a whole day because of a lack of money or other resources?
Note: Data was collected by the Gallup World Poll (GWP) Surveys, and includes 289,933 respondents from 147 countries and 4 territories in 2014 and 2015. The Food Insecurity Experience Scale (FIES) was fielded by the GWP on behalf of the Food and Agricultural Organization of the United Nations.
9
Prevalence and Correlates of Food Insecurity among Children across the Globe
Innocenti Working Paper 2017-09
Figure 1 – Proportions of respondents by FIES raw score, mean FIES-M+ and mean FIES-S
0.56
0.07 0.06 0.06 0.05 0.04 0.04 0.05 0.08
0
0.1
0.2
0.3
0.4
0.5
0.6
0.7
0.8
0.9
1
0
0.1
0.2
0.3
0.4
0.5
0.6
0.7
0.8
0.9
1
0 1 2 3 4 5 6 7 8
Pro
po
rtion
foo
d in
secure
)eroc
S wa
R S
EIF(
noitr
op
orP
Raw Score
Sample size per FIES Raw Score FIES-M+ (mean) FIES-S (mean)
Note: Figure shows proportions of respondents by FIES raw scores, and the corresponding mean proportions, for moderate or severe (FIES-M+) and severe (FIES-S) food insecurity, for the total sample. The proportion of the adult population at each raw score (sum of responses from Questions 1-8) is shown by the bar graphs, while the FIES-M+ and FIES-S for each raw score total are displayed by the dashed and dotted lines respectively. Thresholds for moderate and severe food insecurity have been set by the VoH project, based on the global standard. More information on the development and calculation of thresholds can be found in the VoH technical report (FAO, 2015b).
2c. Methodology
For the food insecurity estimates, we use 2014 and 2015 GWP data, and analyse it for 147 countries and four territories from 12 regions: Eastern and Southern Africa; Horn of Africa; West and Central Africa; Central America; North America; South America; East Asia and the Pacific (EAP); South Asia; Southeast Asia (SE Asia); European Union and non-Commonwealth of Independent States (EU/non-CIS); Commonwealth of Independent States (CIS); and Middle East and North Africa (MENA).
Household food insecurity estimates are calculated using household weights, for all three food insecurity indicators. We use child weights to estimate the share of children under 15 years living with a respondent who is food insecure, and calculate this among households with at least one child under age 15, in order to account for households that have more than one child. Data on numbers of adults age 15 years and over, and children under 15, are collected in the GWP. Population estimates of the number of food insecure children in our country sample are calculated using the proportion of children under 15 years in each country, from the World Bank Development Indicators and total population numbers retrieved from FAOSTAT (FAO, 2015a; World Bank, 2015).
The NX Index is in the core GWP questionnaire, and is a composite measure of respondents’ negative experiences from the day before the survey, relating to five feelings: physical pain; worry; sadness; stress; and anger (For more information, see the GWP methodology manual, accessible at: www.gallup.com). To estimate the relationship between food security and log of household income per

10
Prevalence and Correlates of Food Insecurity among Children across the Globe
Innocenti Working Paper 2017-09
capita over time (in International dollars), we used Ordinary Least Squares (OLS) regressions, controlling for age, gender, education (of the main respondent), log of household size, rural residence, and regional fixed effects. We present the results of the coefficient for the log of household income per capita and food security for 2006-2015 globally, and from 2007-2015 in Asia and Sub-Saharan Africa. For this part of the analysis, we use food security, measured in terms of, “had enough money to buy food in the past 12 months”, instead of food insecurity to better display the trends on the relationship between food security and income.
Qatar and Turkmenistan were excluded from the analysis because the FIES was not fielded there, although the GWP was implemented there in 2014. Afghanistan (2015) and Botswana (2014) were excluded from the analysis because of data missing on the number of adults in the household (GWP indicator: WP12) needed to create the appropriate child weights. Turkey (2014) was excluded for the same reason – because of data missing on the number of children in the household (GWP indicator: WP1230). Not all countries had available data for both years. (For a complete list of countries, regional groupings and years of data availability, see Appendix 1).
3. RESULTS
3a. Descriptive statistics of sample
The full sample included 289,933 respondents [approximately half (51% or 148,848 respondents) living in households with at least one child under age 15 from 147 countries and 4 territories (Hong Kong, Kosovo, Northern Cyprus, and Puerto Rico). The proportion of households with children under age 15, varies by region, ranging from 27% in the European Union/CIS to 80% in the Horn of Africa. Table 2 provides descriptive statistics of our samples of interest, households with at least one child under age 15 compared to all households. Globally, the FIES-M+, FIES-S and the GWP indicator are higher among households with children under age 15, averaging 41%, 19% and 45% respectively, compared to 27%, 11% and 32% respectively among all households. On average, compared to all households, respondents in households with children under age 15, were younger (36 years vs. 40 years), less likely to be male (46% vs. 49%), and less likely to have some secondary education or higher (57% vs. 73%). The log of household income per capita was slightly lower among households with children under age 15 (6.52 vs. 7.54), but higher for log of household size (1.77 versus 1.37), compared to all households. Households with children under age 15 were more likely to be rural (69% vs. 62%).

11
Prevalence and Correlates of Food Insecurity among Children across the Globe
Innocenti Working Paper 2017-09
Table 2: Descriptive statistics for respondents in households with at least one child under 15 years of age and all households
Variable Mean (Standard Error)
All HouseholdsHouseholds with
children under 15 years of age
FIES-M+ (Moderate or severe)0.27 0.41
(0.001) (0.001)
FIES-S (Severe)0.11 0.19
(0.000) (0.001)
GWP indicator: Not enough money to buy food in the last 12 months
0.32 0.45
(0.001) (0.001)
Age of respondent (years)39.50 35.58
(0.032) (0.036)
Male0.49 0.46
(0.001) (0.001)
Education: Secondary or higher0.73 0.57
(0.001) (0.002)
Log of per capita income7.54 6.52
(0.004) (0.006)
Log of household size1.37 1.77
(0.001) (0.001)
Rural household
0.62 0.69
(0.001) (0.001)
N 289,933 148,848 Note: Data was collected by the Gallup World Poll (GWP) Surveys, and includes 289,933 respondents (148,848 respondents with at least one child under age 15 years in the household) from 147 countries and 4 territories in 2014 and 2015. The Food Insecurity Experience Scale (FIES) was fielded by the GWP on behalf of the Food and Agricultural Organization of the United Nations.
The FIES was used to measure moderate or severe (FIES-M+), and severe (FIES-S) food insecurity. The GWP food insecurity indicator is, “Was there ever a time in the last 12 months when you did not have enough money to buy food?”
Estimates are weighted means and the corresponding standard errors.
3b. Comparing different measures of food insecurity
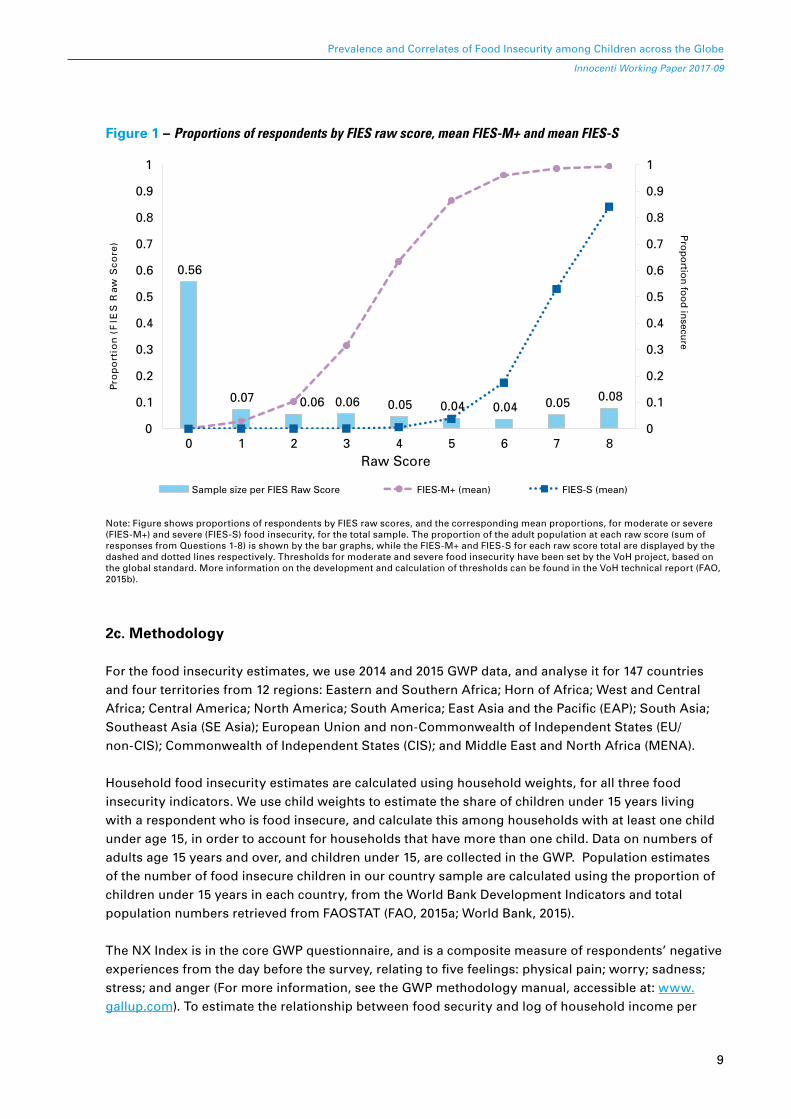
Figure 2 shows the global and regional prevalence of food insecurity for households with children under age 15, using the FIES-M+, FIES-S, and the GWP indicator, “Not enough money to buy food.” The FIES-M+ is the highest in Eastern and Southern Africa (68%), and the lowest in EAP (9%), while the FIES-S is highest in the Horn of Africa (41%) and lowest in EAP (2%). Similar to the FIES-M+, the GWP indicator is the highest in Eastern and Southern Africa (66%) and the lowest in EAP (15%).Across all regions, the magnitude of the estimates of the GWP indicator are more similar to that of the FIES-M+, than FIES-S measure, and show higher food insecurity than the FIES-M+ in all regions except East & Southern Africa, and the Horn of Africa.
12
Prevalence and Correlates of Food Insecurity among Children across the Globe
Innocenti Working Paper 2017-09
Sub-Saharan Africa has the highest rates of food insecurity, with the FIES-M+, FIES-S and GWP indicator all above the global average. In the Americas, Central America has the highest prevalence of food insecurity measured by all three indicators (FIES-M+: 49%; FIES-S: 20%; GWP: 55%), followed by South America (FIES-M+: 29%; FIES-S: 10%; GWP: 37%), and then North America (FIES-M+: 23%; FIES-S: 8%; GWP: 27%). In Asia, South Asia has higher rates of FIES-M+ (29% vs. 26%) and FIES-S (12 % vs. 9%) compared to SE Asia, but a lower rate for the GWP indicator (37% vs. 39%). Within Asia and globally, the EAP region has the lowest reported levels of food insecurity, as measured by all three indicators (FIES-M+: 9%; FIES-S: 2%; GWP: 15%). Food insecurity rates in MENA (FIES-M+: 29%; FIES-S: 10%; GWP: 34%), EU/non-CIS (FIES-M+: 14%; FIES-S: 4%; GWP: 20%) and the CIS region (FIES-M+: 15%; FIES-S: 2%; GWP: 28%) are lower than the global average. A list of prevalence estimates by country for all households and households with at least one child under 15 years of age is available in Appendix 2.
Figure 2 – Regional estimates of food insecurity prevalence among households with children under 15 years of age
3741
29
20
8 10
2
139
42
10
6865
59
49
23
29
9
3029
14 15
29
66
5760
55
27
37
15
38
45
20
28
34
0%
10%
20%
30%
40%
50%
60%
70%
80%
Eastern &Southern
Africa
Horn ofAfrica
West &CentralAfrica
CentralAmerica
NorthAmerica
SouthAmerica
EastAsia/Pacific
South Asia SoutheastAsia
EuropeanUnion/Non
CIS
CIS Middle East& NorthAfrica
FIES-S FIES-M+ "Not enough money to buy food"
Global GWP indicator: 45%
Global FIES -M+ indicator: 41%
Global FIES-S indicator: 19%
Note: Data were collected by the Gallup World Poll (GWP) Surveys, and include 289,933 respondents [148,848 respondents with at least one child under 15 years of age in the household (HHU15)] from 147 countries and 4 territories in 2014 and 2015. The Food Insecurity Experience Scale (FIES) was fielded by the GWP on behalf of the Food and Agricultural Organization of the United Nations.The FIES was used to measure moderate or severe (FIES-M+), and severe (FIES-S) food insecurity. The GWP food insecurity indicator is, “Was there ever a time in the last 12 months when you did not have enough money to buy food?”The GWP selects and surveys one respondent aged 15 years or over per household.Household weights are used for the estimates for all households, and child weights for the households with at least one child under 15 years of age are estimated. The food security indicator is, therefore, the share of children under 15 years of age living in food insecure households, among households with at least one child under 15 years of age.
13
Prevalence and Correlates of Food Insecurity among Children across the Globe
Innocenti Working Paper 2017-09
3c.How do food insecurity measures compare with monetary and non-monetary measures of well-being?
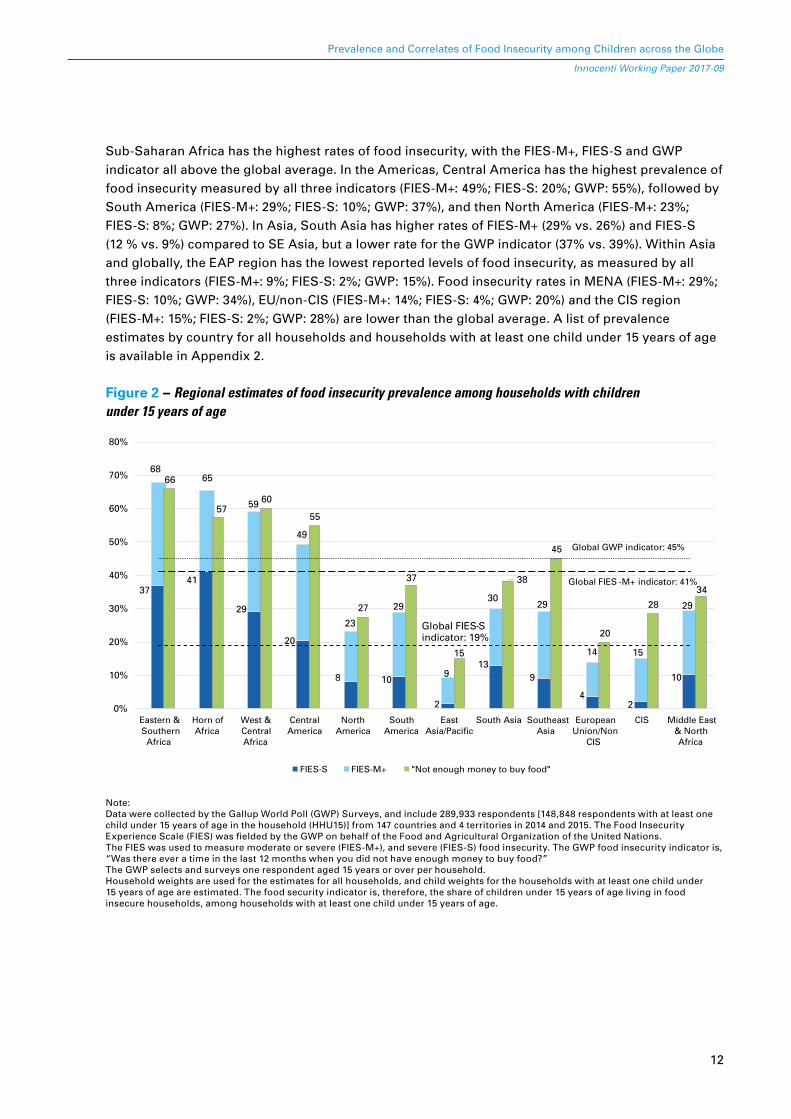
Since the GWP indicator appears to be closer to the FIES-M+ in magnitude, compared to the FIES-S, we correlate the FIES-M+ and the GWP indicator, with income per capita and the NX Index to understand how well the food security indicators capture monetary poverty and a non-monetary measure of well-being. Figure 3 shows results for correlation analysis, where symbols represent the strength of correlation (ranging from 0, no correlation to 1, perfect correlation). Dark blue circles represent the correlation between the NX Index and FIES-M+, and light blue circles with the GWP indicator. Dark purple triangles represent the correlation between household income per capita and FIES-M+, and light purple triangles with the GWP indicator. Globally and on average, the FIES-M+ and GWP indicator are more strongly correlated with the NX Index (0.30 and 0.23 respectively) compared to household income per capita (0.14 and 0.13 respectively) (Figure 3).
Results also indicate that the GWP indicator correlates more strongly than the FIES-M+ to household income per capita in all regions except EAP, EU/non-CIS, North America, and SE Asia. Correlations of income per capita with FIES-M+ are weakest in EAP (0.04), and strongest in South America (0.21), with an average of 0.14 globally. Correlations of income per capita with the GWP indicator, are weakest in the Horn of Africa (0.04), but highest in CIS (0.19), with an average of 0.13 globally.
Across all regions, the FIES-M+ is more strongly correlated than the GWP indicator to the NX Index. Correlations with the NX Index range from 0.25 in EAP to 0.36 in the Horn of Africa for the FIES-M+, and from 0.18 in the three Sub-Saharan African regions and EAP to 0.30 in SE Asia for the GWP indicator
Figure 3 – Correlation of food insecurity indicators with income per capita and the Negative Experience Index among households with children under age 15
0.00
0.05
0.10
0.15
0.20
0.25
0.30
0.35
0.40
Eastern &SouthernAfrica
Horn ofAfrica
Rest ofAfrica
CentralAmerica
NorthAmerica
SouthAmerica
EastAsia/Pacific
South Asia SoutheastAsia
EuropeanUnion/Non
CIS
CIS Middle East& NorthAfrica
Negative Experience Index - FIES-M+ Negative Experience Index - GWP indicator Income - FIES-M+ Income - GWP indicator
Note: Data were collected by the Gallup World Poll (GWP) Surveys, and include 148,848 respondents with at least one child under age 15 years in the household (HHU15) from 147 countries and 4 territories in 2014 and 2015. The Food Insecurity Experience Scale (FIES) was fielded by the GWP on behalf of the Food and Agricultural Organization of the United Nations.

14
Prevalence and Correlates of Food Insecurity among Children across the Globe
Innocenti Working Paper 2017-09
3d. Prevalence and burden of food insecurity by region
In our sample of 147 countries and four territories, approximately 41% of households with children under age 15 suffered from moderate or severe food insecurity as measured by the FIES-M+, 19% from severe food insecurity, as measured by the FIES-S and 45% reported not having enough money to buy food in the previous 12 months. These estimates translate to roughly 605 million children under age 15 living in households where the respondent is moderately or severely food insecure, 260 million children under age 15 living in households where the respondent is severely food insecure, and 688 million children under age 15 living in households that did not have enough money to buy food in the previous 12 months. Since we do not include countries without data, these estimates are likely to be underestimated at the global level.
Figure 4 presents regional food insecurity prevalence for households with children under age 15 (solid line) and all households (dashed line), the burden for children under age 15 who live in households with a food insecure respondent (purple bar), and the entire population (sum of purple and blue bar) estimates. Although, as seen earlier, the three regions of Sub-Saharan Africa have the highest prevalence of food insecurity as measured by the FIES, South Asia has the highest burden, with 436 million people who are moderately or severely food insecure (162 million children under age 15 living in households where the respondent is moderately or severely food insecure). West and Central Africa (259 million people; 120 million children under age 15 living in households where the respondent is moderately or severely food insecure), East and Southern Africa (200 million people; 93 million children under age 15 living in households where the respondent is moderately or severely food insecure), and the Middle East and North Africa (136 million people; 50 million children under age 15 living in households where the respondent is moderately or severely food insecure) follow close behind.
Figure 4 – Prevalence and burden of food insecurity by region
200
93
38
120
12
82
259
34
91
25 29 14 14 650
83 69
436
162 127
4265 30
136
0
10
20
30
40
50
60
70
80
0
50
100
150
200
250
300
350
400
450
500
Prevalen
ce
East & Southern Afric
a
Horn of Afric
a
West & Central Afric
a
Central America
North America
South America
East Asia/Pacific
South Asia
Southeast Asia
European Union/Non CIS CIS
Middle East & North
Africa
)snoillim( noitalupoP
Population under 15 Population over 15 FIES-M+ (All ages) FIES-M+ (U15)
Note: Data was collected by the Gallup World Poll (GWP) Surveys, and include 289,933 respondents [148,848 respondents with at least one child under 15 years in the household (HHU15)] from 147 countries and 4 territories in 2014 and 2015. The Food Insecurity Experience Scale (FIES) was fielded by the GWP, on behalf of the Food and Agricultural Organization of the United Nations (FAO).Total population estimates were taken from the Food and Agricultural Organization of the United Nations Statistics for 2014 and 2015, except for Hong Kong, Kosovo and Northern Cyprus, which was taken from Wikipedia. Proportions of population under age 15 were taken from the World Development Indicators, World Bank database, unless otherwise mentioned in Appendix 4.

15
Prevalence and Correlates of Food Insecurity among Children across the Globe
Innocenti Working Paper 2017-09
3e. How do the FIES-M+ and GWP indicator estimates compare to national data?
In this section, we provide some sensitivity analyses to understand how the GWP estimates compare to other national data. First, using data from Living Standards Measurement Study (LSMS) in East Africa (Malawi 2013, Uganda 2011-12, Tanzania 2012-13), we compare estimates of food insecurity in the last 12 months, the poverty rate, and the proportion who reported eating less than three meals a day among households with children under age 15 to the FIES-M+ and GWP indicator (Figure 5). The LSMS are conducted by national Governments in collaboration with the World Bank, are nationally-representative and routinely used for monitoring key indicators, including income poverty and human capital. These countries were chosen because comparable age-disaggregated data on food insecurity and poverty was available from the Multiple Overlapping Deprivation Analyses (De Neubourg et al., 2012), and were the latest available estimates at the time of this analysis. In all three countries, the under age 15 poverty rates are among the lowest of all indicators at 43%, 26% and 34% in Malawi, Tanzania and Uganda respectively, reflecting a narrowly defined proxy measure of food insecurity. In all countries, the FIES-M+ produced the highest estimates of food insecurity (87%, 60% and 72% in Malawi, Tanzania and Uganda respectively).
Figure 5 – Comparing age-specific measures of food insecurity and poverty in Sub-Saharan Africa
87
60
7272
58
6669
45
24
43
26
34
42
34
47
0
10
20
30
40
50
60
70
80
90
100
Malawi Tanzania Uganda
Pro
po
rtio
n
FIES-Moderate+ Not enough money to buy food Food insecurityin the last 12 months
Poverty rate <3 Meals per day
Note: Weighted means of FIES-M+ and the GWP indicator (“Not enough money to buy food”) come from the Gallup World Poll (2014/2015) and include 148,848 observations from households with children under 15, from 147 countries and 4 territories in 2014 and 2015. The Food Insecurity Experience Scale (FIES) was fielded by the GWP on behalf of the Food and Agricultural Organization of the United Nations. Under-15 data on food insecurity in the past 12 months, poverty rate and percent who had less than three meals per day come from the Living Standard Measurement Survey from each country [Malawi 2013 (N=8,817), Uganda 2011-12 (N=8,647) Tanzania 2012-13 (N=10,395)].

16
Prevalence and Correlates of Food Insecurity among Children across the Globe
Innocenti Working Paper 2017-09
Second, we use data from the European Union Statistics on Income and Living Conditions (EU-SILC) survey, to provide comparisons in Europe. The EU-SILC is a comparable cross-national survey that provides timely and longitudinal multidimensional microdata on income, poverty, social exclusion and living conditions. Among children under age 15 in Poland, Portugal and the United Kingdom (UK), we look at the proportion who did not eat three meals a day, and the under-18 poverty rate (Figure 6), compared to the FIES-M+ and GWP food security indicator (both are under age 15 estimates). Despite the differences in age-groups for the indicators, the GWP indicator is the highest in all three countries: 24% in Poland, 25% in Portugal and 20% in the UK. The FIES-M+ is similar to the poverty rate in Poland (FIES-M+: 14%; poverty rate: 15%) and Portugal (FIES-M+: 18%; poverty rate: 17%), but more than twice the poverty rate in the UK (FIES-M+: 19%; poverty rate: 9%). In all three countries, the proportion who did not eat three meals a day produced the lowest estimates of food insecurity, at 1%, 2% and 4% in Poland, Portugal and the UK respectively.
Figure 6 – Comparing age-specific measures of food insecurity and poverty in Europe
13
1819
24 25
20
15
18
10
12
4
0
5
10
15
20
25
30
Poland Portugal United Kingdom
Pre
vale
nce
FIES-M+ (under age 15) Not enough money to buy food (under age 15)
Poverty (under age 18) Did not eat 3 meals a day (under age 15)
Note: Weighted means of FIES-M+ and the GWP indicator (“not enough money to buy food”) come from the Gallup World Poll (2014/2015) and include 148,848 observations from households with children under 15, from 147 countries and 4 territories in 2014 and 2015. The Food Insecurity Experience Scale (FIES) was fielded by the GWP, on behalf of the Food and Agricultural Organization of the United Nations. Data on percent of children in households where at least one child age 1-15 years did not eat three meals per day (2009) come from the European Union Statistics on Income and Living Conditions (EU-SILC) from each country. Data on under-18 poverty rate are 2014 estimates from the Organisation for Economic Co-operation and Development (OECD) Income Distribution Database (IDD).
17
Prevalence and Correlates of Food Insecurity among Children across the Globe
Innocenti Working Paper 2017-09
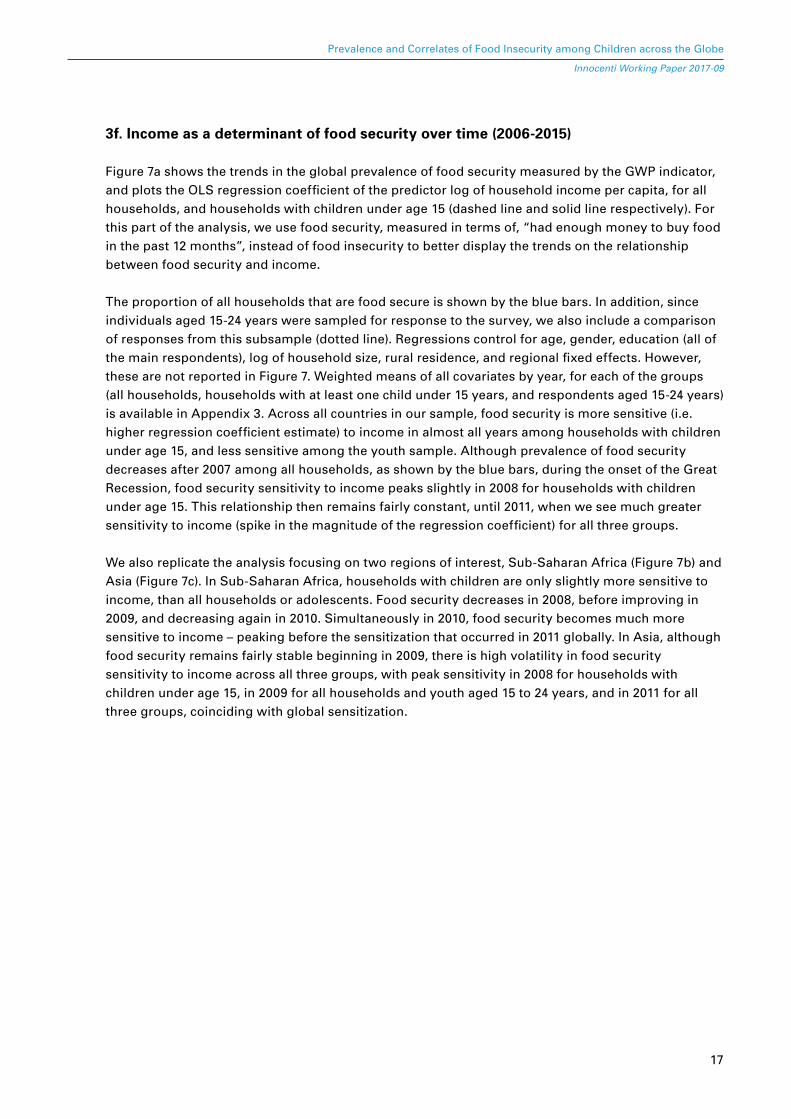
3f. Income as a determinant of food security over time (2006-2015)
Figure 7a shows the trends in the global prevalence of food security measured by the GWP indicator, and plots the OLS regression coefficient of the predictor log of household income per capita, for all households, and households with children under age 15 (dashed line and solid line respectively). For this part of the analysis, we use food security, measured in terms of, “had enough money to buy food in the past 12 months”, instead of food insecurity to better display the trends on the relationship between food security and income.
The proportion of all households that are food secure is shown by the blue bars. In addition, since individuals aged 15-24 years were sampled for response to the survey, we also include a comparison of responses from this subsample (dotted line). Regressions control for age, gender, education (all of the main respondents), log of household size, rural residence, and regional fixed effects. However, these are not reported in Figure 7. Weighted means of all covariates by year, for each of the groups (all households, households with at least one child under 15 years, and respondents aged 15-24 years) is available in Appendix 3. Across all countries in our sample, food security is more sensitive (i.e. higher regression coefficient estimate) to income in almost all years among households with children under age 15, and less sensitive among the youth sample. Although prevalence of food security decreases after 2007 among all households, as shown by the blue bars, during the onset of the Great Recession, food security sensitivity to income peaks slightly in 2008 for households with children under age 15. This relationship then remains fairly constant, until 2011, when we see much greater sensitivity to income (spike in the magnitude of the regression coefficient) for all three groups.
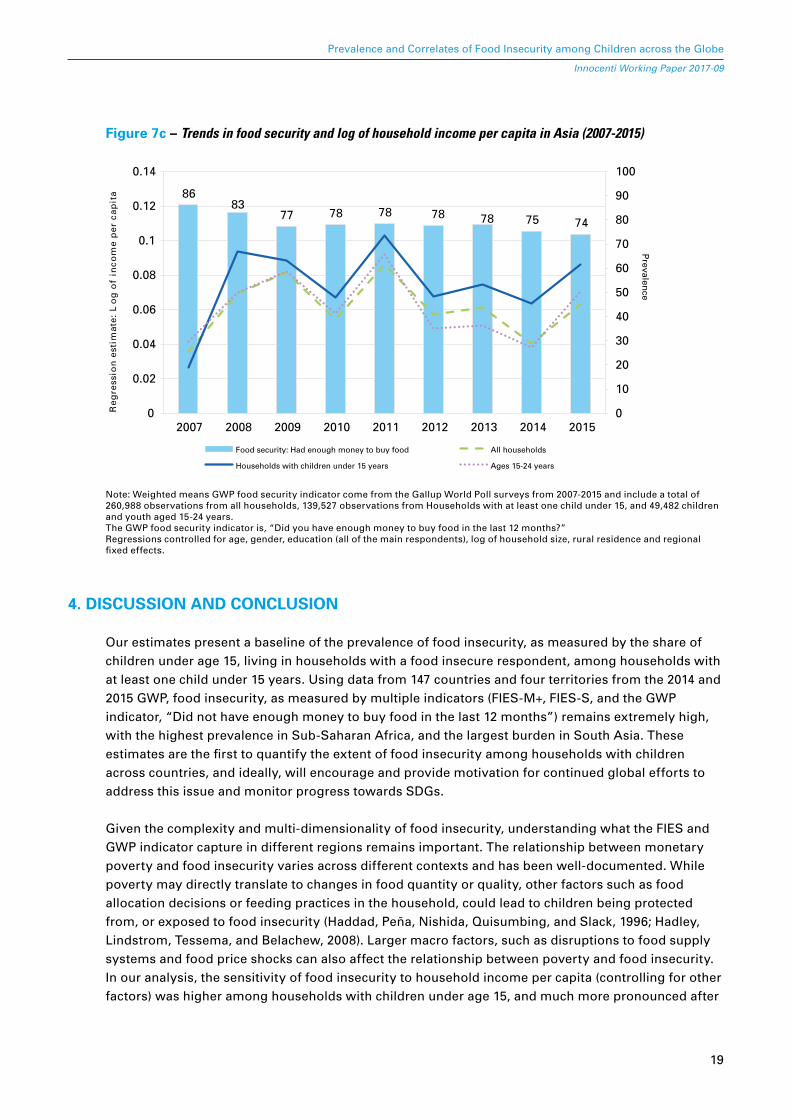
We also replicate the analysis focusing on two regions of interest, Sub-Saharan Africa (Figure 7b) and Asia (Figure 7c). In Sub-Saharan Africa, households with children are only slightly more sensitive to income, than all households or adolescents. Food security decreases in 2008, before improving in 2009, and decreasing again in 2010. Simultaneously in 2010, food security becomes much more sensitive to income – peaking before the sensitization that occurred in 2011 globally. In Asia, although food security remains fairly stable beginning in 2009, there is high volatility in food security sensitivity to income across all three groups, with peak sensitivity in 2008 for households with children under age 15, in 2009 for all households and youth aged 15 to 24 years, and in 2011 for all three groups, coinciding with global sensitization.

18
Prevalence and Correlates of Food Insecurity among Children across the Globe
Innocenti Working Paper 2017-09
Figure 7a – Trends in global food security and log of household income per capita (2006-2015)
8480
71 72 7271
7569 69 69
0
10
20
30
40
50
60
70
80
90
100
0
0.02
0.04
0.06
0.08
0.1
0.12
0.14
2006 2007 2008 2009 2010 2011 2012 2013 2014 2015
Prevalen
ce
atipac rep emocni fo go
L :etamitse noisserge
R
Food security: Had enough money to buy food All households
Households with at least one child under 15 Ages 15-24 years
Note: Weighted means GWP food security indicator come from the Gallup World Poll surveys from 2006-2015 and include a total of 1,231,960 observations from all households, 642,638 observations from Households with at least one child under 15, and 253,838 children and youth aged 15-24 years. The GWP food security indicator is, “Did you have enough money to buy food in the last 12 months?”Regressions controlled for age, gender, education, log of household size, rural residence and regional fixed effects.
Figure 7b – Trends in food security and log of household income per capita in Sub-Saharan Africa (2007-2015)
53
44
5146
50
5046 45 43
0
10
20
30
40
50
60
70
80
90
100
0
0.02
0.04
0.06
0.08
0.1
0.12
0.14
2007 2008 2009 2010 2011 2012 2013 2014 2015
Prevalen
ce
atipac re
p em
ocni f
o g
oL :eta
mitse n
oisserge
R
Food security: Had enough money to buy food All households
Households with at least one child under 15 years Ages 15-24 years
Note: Weighted means GWP food security indicator come from the Gallup World Poll surveys from 2007-2015 and include a total of 246,315 observations from all households, 178,452 observations from Households with at least one child under 15, and 74,584 children and youth aged 15-24 years. The GWP food security indicator is, “Did you have enough money to buy food in the last 12 months?”Regressions controlled for age, gender, education (all of the main respondents), log of household size, rural residence and regional fixed effects.
19
Prevalence and Correlates of Food Insecurity among Children across the Globe
Innocenti Working Paper 2017-09
Figure 7c – Trends in food security and log of household income per capita in Asia (2007-2015)
8683
77 78 78 78 78 75 74
0
10
20
30
40
50
60
70
80
90
100
0
0.02
0.04
0.06
0.08
0.1
0.12
0.14
2007 2008 2009 2010 2011 2012 2013 2014 2015
Prevalen
ce
atipac re
p em
ocni f
o g
oL :eta
mitse n
oisserge
R
Food security: Had enough money to buy food All households
Households with children under 15 years Ages 15-24 years
Note: Weighted means GWP food security indicator come from the Gallup World Poll surveys from 2007-2015 and include a total of 260,988 observations from all households, 139,527 observations from Households with at least one child under 15, and 49,482 children and youth aged 15-24 years. The GWP food security indicator is, “Did you have enough money to buy food in the last 12 months?”Regressions controlled for age, gender, education (all of the main respondents), log of household size, rural residence and regional fixed effects.
4. DISCUSSION AND CONCLUSION
Our estimates present a baseline of the prevalence of food insecurity, as measured by the share of children under age 15, living in households with a food insecure respondent, among households with at least one child under 15 years. Using data from 147 countries and four territories from the 2014 and 2015 GWP, food insecurity, as measured by multiple indicators (FIES-M+, FIES-S, and the GWP indicator, “Did not have enough money to buy food in the last 12 months”) remains extremely high, with the highest prevalence in Sub-Saharan Africa, and the largest burden in South Asia. These estimates are the first to quantify the extent of food insecurity among households with children across countries, and ideally, will encourage and provide motivation for continued global efforts to address this issue and monitor progress towards SDGs.
Given the complexity and multi-dimensionality of food insecurity, understanding what the FIES and GWP indicator capture in different regions remains important. The relationship between monetary poverty and food insecurity varies across different contexts and has been well-documented. While poverty may directly translate to changes in food quantity or quality, other factors such as food allocation decisions or feeding practices in the household, could lead to children being protected from, or exposed to food insecurity (Haddad, Peña, Nishida, Quisumbing, and Slack, 1996; Hadley, Lindstrom, Tessema, and Belachew, 2008). Larger macro factors, such as disruptions to food supply systems and food price shocks can also affect the relationship between poverty and food insecurity. In our analysis, the sensitivity of food insecurity to household income per capita (controlling for other factors) was higher among households with children under age 15, and much more pronounced after

20
Prevalence and Correlates of Food Insecurity among Children across the Globe
Innocenti Working Paper 2017-09
the Great Recession, particularly in low- and middle-income (LMIC) regions, which were already suffering from the food and energy price shocks during 2007-2008 (Verick and Islam, 2010).
Although there were strong correlations between monetary poverty and the FIES-M+ and GWP indicator, both our food insecurity indicators are more strongly correlated with the NX Index across all regions. The results suggest that these food insecurity indicators encompass more than just monetary poverty alone, with the magnitude of the relationship varying by setting. Comparisons with national-level data in Africa and Europe show that definitions of food insecurity that are limited to monetary poverty or quantity of food alone, may underestimate the true magnitude of this complex issue. Thus, efforts to decrease food insecurity, among all households and households with children, will require unpacking the context of food insecurity in each setting, and tailoring appropriate programme and policy responses.
This analysis warrants the discussion of several limitations. First, our sample consists of 147 countries and four territories, and we do not extrapolate our results to all countries.1 Therefore, our estimates likely underestimate the true prevalence and burden of food insecurity, especially if food insecurity rates are higher in the countries that are excluded. Secondly, estimates provided at the regional-levels should be interpreted with caution as intra-regional differences in food insecurity undoubtedly exist. Thirdly, marginalized groups within countries who may face higher levels of food insecurity may fall out of the survey sample or be under-represented. Fourthly, we do not control for the endogenous relationship in our regression analyses looking at the relationship between food insecurity and income over time, and therefore, results should be interpreted with caution. Finally, we emphasise that our analysis is built on the assumption that all household members face the same food insecurity risks, since the GWP surveys one randomly selected respondent per household. However, we know that this assumption rarely holds, with individual-level food security risks differing based on factors including intra-household food allocation decisions, often based on age and sex. Furthermore, prior research has shown that children’s definitions of food insecurity may substantively differ from those of adults, limiting the extension of the findings to conclusions on child food insecurity (Fram et al., 2013).
Although there is a growing evidence base on child self-reports of food insecurity, a critical next step will be to determine and define the different domains of child food insecurity across different countries and contexts (Fram et al., 2013; Fram, Bernal, and Frongillo, 2013). Equally important will be to understand how food insecurity reports differ between children’s self-reports and that of guardians and caregivers, whether or not children are insulated from household food insecurity, and how these dynamics may differ by age and sex, across different contexts. The current analysis using the FIES provides a good starting point to understand estimates of food insecurity among households with children to expedite progress towards achieving the SDG Goal of ending hunger by 2030.
1 Depending on whether or not Taiwan is counted, there are approximately 195 countries in the world. Therefore, the GWP is missing for 48 countries. However, since the GWP covers the highest population countries, in terms of population coverage, the bias in our estimates, is likely to be smaller.

21
Prevalence and Correlates of Food Insecurity among Children across the Globe
Innocenti Working Paper 2017-09
5. REFERENCES
Ballard, T. J., Kepple, A. W. and Cafiero, C. (2013). The food insecurity experience scale: development of a global standard for monitoring hunger worldwide. Rome: FAO. Retrieved from: http://www.fao.org/economic/ess/ess-fs/voices/en/
Bernal, J., Frongillo, E. and Jaffe, K. (2015). Food insecurity of children increases shame of others knowing they are without food. The FASEB Journal, 29 (1 Supplement), 585-518.
Coates, J. (2013). Build it back better: deconstructing food security for improved measurement and action. Global Food Security, 2(3), 188-194.
Cook, J. T., Frank, D. A., Berkowitz, C., Black, M. M., Casey, P. H., Cutts, D. B. and Levenson, S. (2004). Food insecurity is associated with adverse health outcomes among human infants and toddlers. The Journal of Nutrition, 134(6), 1432-1438.
De Neubourg, C., Chai, J., de Milliano, M., Plavgo, I. and Wei, Z. (2012). Step-by-step guidelines to the Multiple Overlapping Deprivation Analysis (MODA). Retrieved from https://www.unicef-irc.org/publications/pdf/iwp_2012_10.pdf
FAO. (2015a). FAOSTAT statistics database (2014 and 2015). FAO, Rome.
FAO. (2015b). Methods for estimating comparable rates of food insecurity experienced by adults throughout the world. Retrieved from: http://www.fao.org/3/c-i4830e.pdf
Fram, M., Bernal, J. and Frongillo, E. A. (2015). The measurement of food insecurity among children: Review of literature and concept note. Innocenti Working Paper No.2015-08. Florence, Italy. Retrieved from: https://www.unicef-irc.org/publications/784/
Fram, M., Frongillo, E. A., Draper, C. L. and Fishbein, E. M. (2013). Development and validation of a child report assessment of child food insecurity and comparison to parent report assessment. Journal of Hunger & Environmental Nutrition, 8(2), 128-145.
Haddad, L. J., Peña, C., Nishida, C., Quisumbing, A. R. and Slack, A. T. (1996). Food security and nutrition implications of intrahousehold bias. Retrieved from: http://ageconsearch.umn.edu/record/42682/files/dp19.pdf
Hadley, C., Lindstrom, D., Tessema, F. and Belachew, T. (2008). Gender bias in the food insecurity experience of Ethiopian adolescents. Social Science & Medicine, 66(2), 427-438.
Howard, L. L. (2011). Does food insecurity at home affect non-cognitive performance at school? A longitudinal analysis of elementary student classroom behavior. Economics of Education Review, 30(1), 157-176.
Jaffe, K., Bernal, J. and Herrera, H. A. (2014). Relation between shame, nutrition and happiness in children. Acta Científica Venezolana, 65(1):29-39.

22
Prevalence and Correlates of Food Insecurity among Children across the Globe
Innocenti Working Paper 2017-09
Jyoti, D. F., Frongillo, E. A. and Jones, S. J. (2005). Food insecurity affects school children’s academic performance, weight gain, and social skills. The Journal of Nutrition, 135(12), 2831-2839.
Rasch, G. (1993). Probabilistic models for some intelligence and attainment tests: ERIC.
Rose-Jacobs, R., Black, M. M., Casey, P. H., Cook, J. T., Cutts, D. B., Chilton, M. and Frank, D. A. (2008). Household food insecurity: associations with at-risk infant and toddler development. Pediatrics, 121(1), 65-72.
Slack, K. S. and Yoo, J. (2005). Food hardship and child behavior problems among low‐income children. Social Service Review, 79(3), 511-536.
United Nations Economic and Social Council. (2016). Report of the Inter-agency and expert group on Sustainable Development Goal indicators. (E/CN.3/2016/2/Rev.1*). United Nations Retrieved from: http://unstats.un.org/unsd/statcom/47th-session/documents/2016-2-IAEG-SDGs-Rev1-E.pdf
Verick, S. and Islam, I. (2010). The great recession of 2008-2009: causes, consequences and policy responses. Discussion paper series // Forschungsinstitut zur Zukunft der Arbeit, No. 4934. Retrieved from: http://hdl.handle.net/10419/36905
World Bank. (2015). World Development Indicators. Retrieved from: Retrieved from http://data.worldbank.org/indicator/SP.POP.0014.TO.ZS
23
Prevalence and Correlates of Food Insecurity among Children across the Globe
Innocenti Working Paper 2017-09
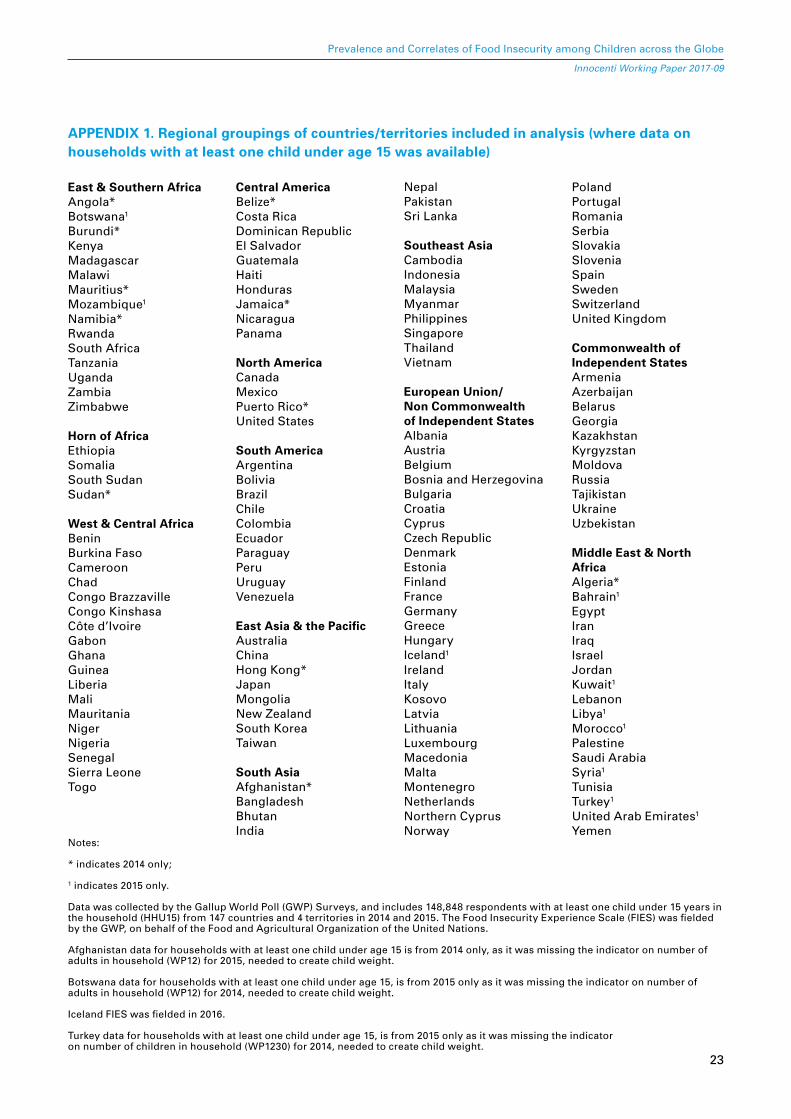
APPENDIX 1. Regional groupings of countries/territories included in analysis (where data on households with at least one child under age 15 was available)
East & Southern AfricaAngola*Botswana1 Burundi*KenyaMadagascarMalawiMauritius*Mozambique1
Namibia*RwandaSouth AfricaTanzaniaUgandaZambiaZimbabwe
Horn of AfricaEthiopiaSomaliaSouth SudanSudan*
West & Central AfricaBeninBurkina FasoCameroonChadCongo BrazzavilleCongo KinshasaCôte d’IvoireGabonGhanaGuineaLiberiaMaliMauritaniaNigerNigeriaSenegalSierra LeoneTogo
Central AmericaBelize*Costa RicaDominican RepublicEl SalvadorGuatemalaHaitiHondurasJamaica*NicaraguaPanama
North AmericaCanadaMexicoPuerto Rico*United States
South AmericaArgentinaBoliviaBrazilChileColombiaEcuadorParaguayPeruUruguayVenezuela
East Asia & the PacificAustraliaChinaHong Kong*JapanMongoliaNew ZealandSouth KoreaTaiwan
South AsiaAfghanistan*BangladeshBhutanIndia
NepalPakistanSri Lanka
Southeast AsiaCambodiaIndonesiaMalaysiaMyanmarPhilippinesSingaporeThailandVietnam
European Union/Non Commonwealth of Independent StatesAlbaniaAustriaBelgiumBosnia and HerzegovinaBulgariaCroatiaCyprusCzech RepublicDenmarkEstoniaFinlandFranceGermanyGreeceHungaryIceland1
IrelandItalyKosovoLatviaLithuaniaLuxembourgMacedoniaMaltaMontenegroNetherlandsNorthern CyprusNorway
PolandPortugalRomaniaSerbiaSlovakiaSloveniaSpainSwedenSwitzerlandUnited Kingdom
Commonwealth of Independent StatesArmeniaAzerbaijanBelarusGeorgiaKazakhstanKyrgyzstanMoldovaRussiaTajikistanUkraineUzbekistan
Middle East & North AfricaAlgeria*Bahrain1 EgyptIranIraqIsraelJordanKuwait1
LebanonLibya1
Morocco1
PalestineSaudi ArabiaSyria1
TunisiaTurkey1
United Arab Emirates1
YemenNotes:
* indicates 2014 only;
1 indicates 2015 only.
Data was collected by the Gallup World Poll (GWP) Surveys, and includes 148,848 respondents with at least one child under 15 years in the household (HHU15) from 147 countries and 4 territories in 2014 and 2015. The Food Insecurity Experience Scale (FIES) was fielded by the GWP, on behalf of the Food and Agricultural Organization of the United Nations.
Afghanistan data for households with at least one child under age 15 is from 2014 only, as it was missing the indicator on number of adults in household (WP12) for 2015, needed to create child weight.
Botswana data for households with at least one child under age 15, is from 2015 only as it was missing the indicator on number of adults in household (WP12) for 2014, needed to create child weight.
Iceland FIES was fielded in 2016.
Turkey data for households with at least one child under age 15, is from 2015 only as it was missing the indicator on number of children in household (WP1230) for 2014, needed to create child weight.

24
Prevalence and Correlates of Food Insecurity among Children across the Globe
Innocenti Working Paper 2017-09
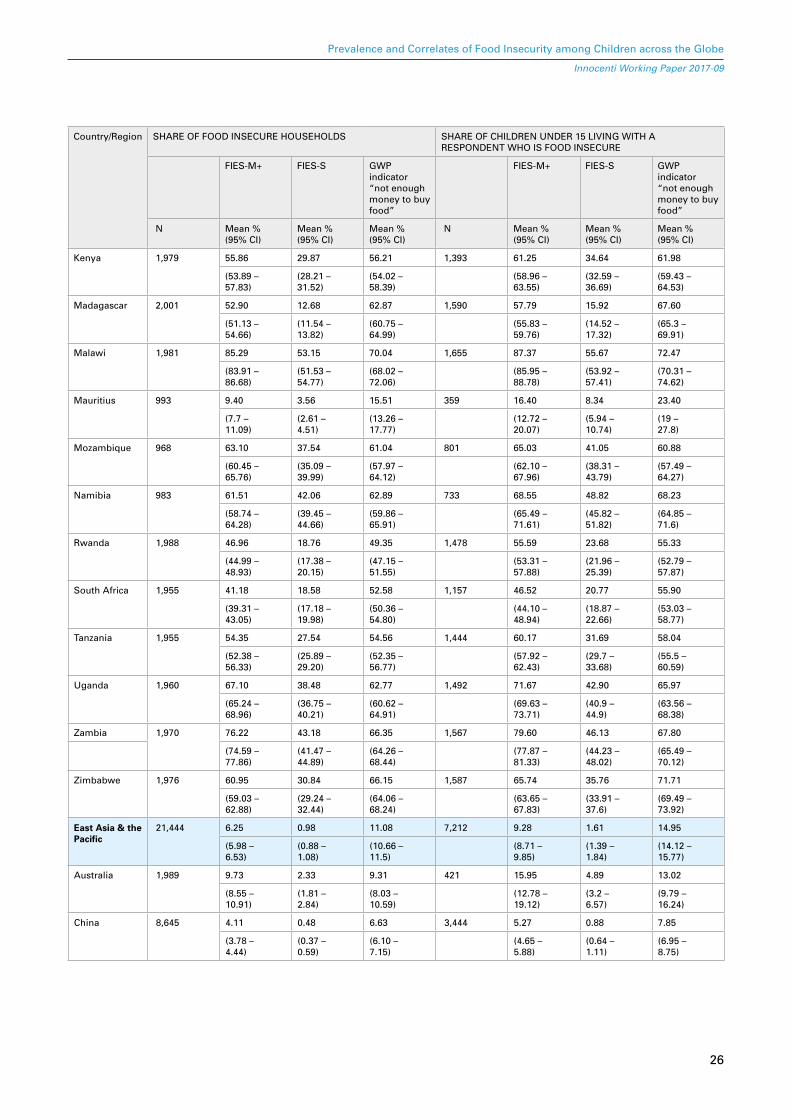
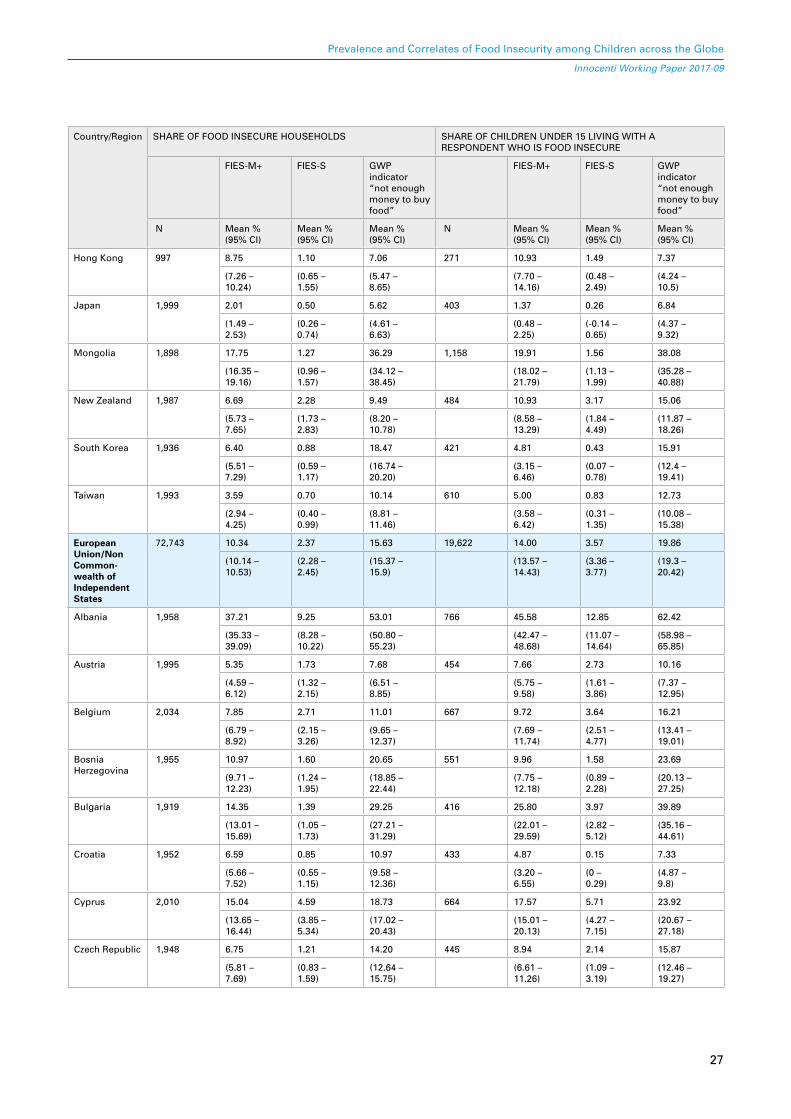
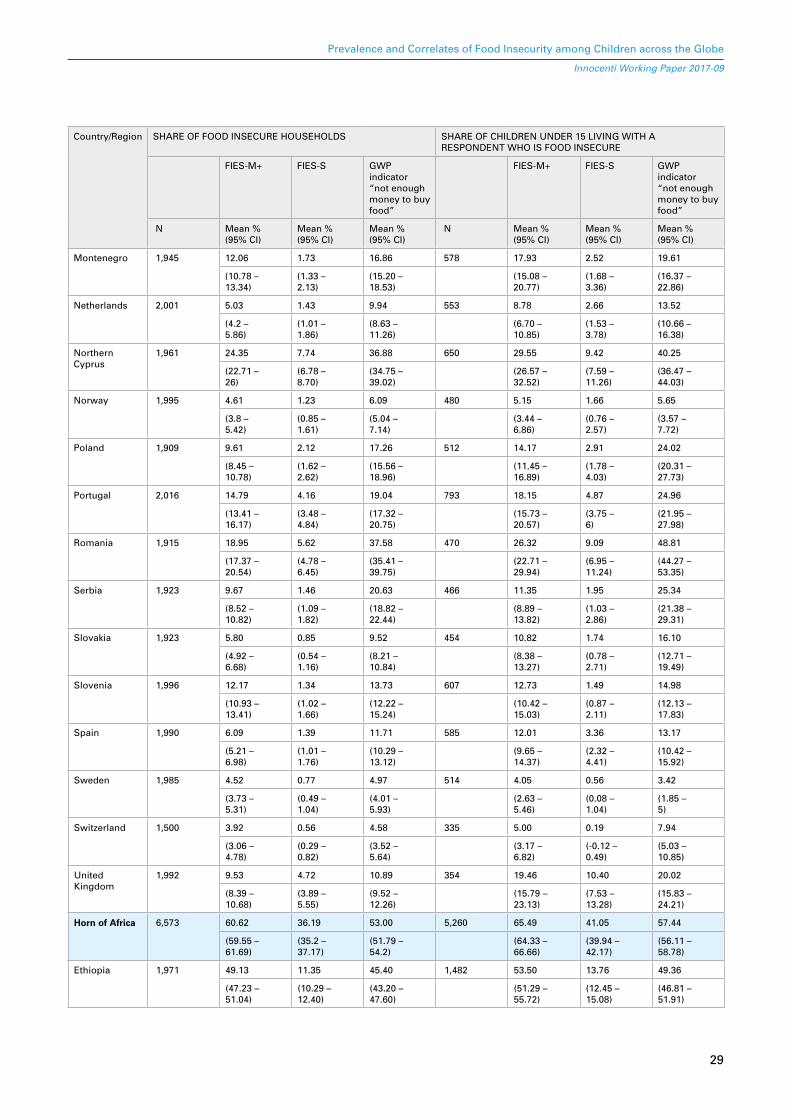
APPENDIX 2: Food insecurity prevalence by region and country in 2014-15, among all households, and households with children under 15 years
Country/Region SHARE OF FOOD INSECURE HOUSEHOLDS SHARE OF CHILDREN UNDER 15 LIVING WITH A RESPONDENT WHO IS FOOD INSECURE
FIES-M+ FIES-S GWP indicator “not enough money to buy food”
FIES-M+ FIES-S GWP indicator “not enough money to buy food”
N Mean % (95% CI)
Mean % (95% CI)
Mean % (95% CI)
N Mean % (95% CI)
Mean % (95% CI)
Mean % (95% CI)
FULL SAMPLE (147 countries and 4 territories)
289,933 26.69 10.77 32.41 148,848 41.28 19.06 45.04
(26.55 – 26.84)
(10.68 – 10.86)
(32.23 – 32.58)
(41.05 – 41.5)
(18.89 – 19.22)
(44.79 – 45.29)
Central America
15,587 42.56 17.29 49.55 9,529 49.37 20.47 54.84
(41.86 – 43.25)
(16.81 – 17.76)
(48.76 – 50.33)
(48.48 – 50.27)
(19.84 – 21.11)
(53.84 – 55.83)
Belize 482 28.14 9.12 31.89 266 37.91 12.45 35.05
(24.5 – 31.79)
(7.12 – 11.13)
(27.72 – 36.07)
(32.70 – 43.11)
(9.3 – 15.6)
(29.28 – 40.82)
Costa Rica 1,958 20.79 4.70 32.47 877 27.34 6.58 39.96
(19.19 – 22.39)
(4.02 – 5.37)
(30.40 – 34.55)
(24.71 – 29.97)
(5.42 – 7.74)
(36.71 – 43.21)
Dominican Republic
1,988 52.79 20.71 53.62 1,125 58.87 24.10 59.56
(50.81 – 54.77)
(19.33 – 22.09)
(51.42 – 55.81)
(56.29 – 61.45)
(22.21 – 26)
(56.69 – 62.43)
El Salvador 1,970 38.75 10.17 48.91 1,195 44.21 12.57 51.78
(36.84 – 40.67)
(9.24 – 11.11)
(46.70 – 51.12)
(41.69 – 46.73)
(11.26 – 13.88)
(48.94 – 54.62)
Guatemala 1,961 40.55 14.23 47.89 1,461 45.69 16.82 51.10
(38.6 – 42.49)
(13.03 – 15.42)
(45.68 – 50.11)
(43.41 – 47.97)
(15.34 – 18.29)
(48.53 – 53.66)
Haiti 895 80.99 68.42 59.74 590 79.70 65.31 57.75
(78.8 – 83.18)
(65.92 – 70.92)
(56.52 – 62.96)
(76.99 – 82.40)
(62.19 – 68.43)
(53.75 – 61.75)
Honduras 1,959 54.09 20.03 62.05 1,427 57.68 21.39 64.59
(52.16 – 56.01)
(18.73 – 21.33)
(59.90 – 64.20)
(55.46 – 59.89)
(19.83 – 22.96)
(62.11 – 67.08)
Jamaica 485 50.94 24.57 55.77 266 54.35 28.56 59.58
(46.88 – 55)
(21.50 – 27.64)
(51.33 – 60.20)
(48.79 – 59.91)
(24.26 – 32.86)
(53.65 – 65.52)
Nicaragua 1,973 44.11 16.71 57.72 1,405 49.62 19.30 62.84
(42.14 – 46.08)
(15.46 – 17.96)
(55.53 – 59.90)
(47.26 – 51.97)
(17.73 – 20.87)
(60.31 – 65.37)
Panama 1,916 30.32 11.13 42.10 917 38.12 15.48 47.02
(28.48 – 32.16)
(10.01 – 12.25)
(39.89 – 44.32)
(35.29 – 40.95)
(13.62 – 17.35)
(43.78 – 50.25)

25
Prevalence and Correlates of Food Insecurity among Children across the Globe
Innocenti Working Paper 2017-09
Country/Region SHARE OF FOOD INSECURE HOUSEHOLDS SHARE OF CHILDREN UNDER 15 LIVING WITH A RESPONDENT WHO IS FOOD INSECURE
FIES-M+ FIES-S GWP indicator “not enough money to buy food”
FIES-M+ FIES-S GWP indicator “not enough money to buy food”
N Mean % (95% CI)
Mean % (95% CI)
Mean % (95% CI)
N Mean % (95% CI)
Mean % (95% CI)
Mean % (95% CI)
Common-wealth of Independent States
22,503 13.44 1.46 26.99 10.829 15.16 2.06 28.47
(13.07 – 13.81)
(1.35 – 1.58)
(26.41 – 27.57)
(14.6 – 15.73)
(1.87 – 2.26)
(27.62 – 29.32)
Armenia 1,946 19.79 0.54 40.98 865 22.78 0.55 43.06
(18.31 – 21.27)
(0.41 – 0.66)
(38.80 – 43.17)
(20.46 – 25.10)
(0.37 – 0.74)
(39.75 – 46.36)
Azerbaijan 1,891 6.15 0.78 16.38 983 6.63 0.67 18.60
(5.36 – 6.94)
(0.47 – 1.09)
(14.71 – 18.05)
(5.53 – 7.74)
(0.28 – 1.06)
(16.16 – 21.04)
Belarus 1,853 8.46 0.51 18.38 509 7.27 0.17 15.34
(7.43 – 9.5)
(0.33 – 0.70)
(16.61 – 20.14)
(5.54 – 9.00)
(-0.04 – 0.38)
(12.2 – 18.49)
Georgia 1,947 28.41 1.02 52.67 793 30.05 1.18 54.33
(26.64 – 30.18)
(0.86 – 1.17)
(50.45 – 54.89)
(27.19 – 32.91)
(0.92 – 1.44)
(50.86 – 57.81)
Kazakhstan 1,824 7.51 0.73 21.31 935 7.52 0.59 21.45
(6.57 – 8.46)
(0.45 – 1.02)
(19.43 – 23.19)
(6.20 – 8.83)
(0.31 – 0.87)
(18.82 – 24.09)
Kyrgyzstan 1,880 21.00 4.56 30.61 1,316 23.60 5.41 33.77
(19.41 – 22.59)
(3.86 – 5.26)
(28.53 – 32.70)
(21.64 – 25.56)
(4.49 – 6.33)
(31.21 – 36.33)
Moldova 1,860 10.45 2.15 32.77 650 11.86 2.51 33.56
(9.41 – 11.49)
(1.61 – 2.70)
(30.63 – 34.91)
(9.97 – 13.75)
(1.52 – 3.51)
(29.92 – 37.2)
Russia 3,806 7.68 0.58 14.19 1,292 8.06 0.76 17.24
(7 – 8.37)
(0.41 – 0.74)
(13.08 – 15.30)
(6.83 – 9.28)
(0.42 – 1.09)
(15.18 – 19.31)
Tajikistan 1,682 12.95 2.65 24.83 1,443 13.72 2.79 25.52
(11.64 – 14.26)
(2.05 – 3.24)
(22.77 – 26.90)
(12.27 – 15.17)
(2.13 – 3.44)
(23.26 – 27.77)
Ukraine 1,839 16.70 1.60 32.55 607 15.22 1.62 29.56
(15.31 – 18.1)
(1.21 – 2.00)
(30.41 – 34.70)
(12.91 – 17.52)
(0.92 – 2.32)
(25.92 – 33.2)
Uzbekistan 1,975 13.73 2.05 23.85 1,436 14.28 2.05 24.44
(12.47 – 14.99)
(1.56 – 2.53)
(21.97 – 25.73)
(12.78 – 15.78)
(1.49 – 2.62)
(22.22 – 26.67)
East & Southern Africa
23,628 60.92 31.26 61.30 17,121 67.86 36.86 65.90
(60.37 – 61.47)
(30.78 – 31.74)
(60.68 – 61.92)
(67.25 – 68.48)
(36.28 – 37.43)
(65.19 – 66.61)
Angola 965 63.42 19.56 72.19 800 68.52 23.28 76.15
(60.9 – 65.94)
(17.57 – 21.55)
(69.36 – 75.03)
(65.89 – 71.15)
(20.97 – 25.6)
(73.19 – 79.11)
Botswana 1,959 56.48 32.54 63.31 685 67.08 37.88 70.36
(54.55 – 58.41)
(30.84 – 34.25)
(61.17 – 65.44)
(64.07 – 70.09)
(35 – 40.76)
(66.93 – 73.79)
Burundi 988 79.40 40.14 66.68 739 81.52 44.89 71.60
(77.26 – 81.55)
(37.90 – 42.38)
(63.74 – 69.62)
(79.09 – 83.95)
(42.33 – 47.46)
(68.34 – 74.86)
26
Prevalence and Correlates of Food Insecurity among Children across the Globe
Innocenti Working Paper 2017-09
Country/Region SHARE OF FOOD INSECURE HOUSEHOLDS SHARE OF CHILDREN UNDER 15 LIVING WITH A RESPONDENT WHO IS FOOD INSECURE
FIES-M+ FIES-S GWP indicator “not enough money to buy food”
FIES-M+ FIES-S GWP indicator “not enough money to buy food”
N Mean % (95% CI)
Mean % (95% CI)
Mean % (95% CI)
N Mean % (95% CI)
Mean % (95% CI)
Mean % (95% CI)
Kenya 1,979 55.86 29.87 56.21 1,393 61.25 34.64 61.98
(53.89 – 57.83)
(28.21 – 31.52)
(54.02 – 58.39)
(58.96 – 63.55)
(32.59 – 36.69)
(59.43 – 64.53)
Madagascar 2,001 52.90 12.68 62.87 1,590 57.79 15.92 67.60
(51.13 – 54.66)
(11.54 – 13.82)
(60.75 – 64.99)
(55.83 – 59.76)
(14.52 – 17.32)
(65.3 – 69.91)
Malawi 1,981 85.29 53.15 70.04 1,655 87.37 55.67 72.47
(83.91 – 86.68)
(51.53 – 54.77)
(68.02 – 72.06)
(85.95 – 88.78)
(53.92 – 57.41)
(70.31 – 74.62)
Mauritius 993 9.40 3.56 15.51 359 16.40 8.34 23.40
(7.7 – 11.09)
(2.61 – 4.51)
(13.26 – 17.77)
(12.72 – 20.07)
(5.94 – 10.74)
(19 – 27.8)
Mozambique 968 63.10 37.54 61.04 801 65.03 41.05 60.88
(60.45 – 65.76)
(35.09 – 39.99)
(57.97 – 64.12)
(62.10 – 67.96)
(38.31 – 43.79)
(57.49 – 64.27)
Namibia 983 61.51 42.06 62.89 733 68.55 48.82 68.23
(58.74 – 64.28)
(39.45 – 44.66)
(59.86 – 65.91)
(65.49 – 71.61)
(45.82 – 51.82)
(64.85 – 71.6)
Rwanda 1,988 46.96 18.76 49.35 1,478 55.59 23.68 55.33
(44.99 – 48.93)
(17.38 – 20.15)
(47.15 – 51.55)
(53.31 – 57.88)
(21.96 – 25.39)
(52.79 – 57.87)
South Africa 1,955 41.18 18.58 52.58 1,157 46.52 20.77 55.90
(39.31 – 43.05)
(17.18 – 19.98)
(50.36 – 54.80)
(44.10 – 48.94)
(18.87 – 22.66)
(53.03 – 58.77)
Tanzania 1,955 54.35 27.54 54.56 1,444 60.17 31.69 58.04
(52.38 – 56.33)
(25.89 – 29.20)
(52.35 – 56.77)
(57.92 – 62.43)
(29.7 – 33.68)
(55.5 – 60.59)
Uganda 1,960 67.10 38.48 62.77 1,492 71.67 42.90 65.97
(65.24 – 68.96)
(36.75 – 40.21)
(60.62 – 64.91)
(69.63 – 73.71)
(40.9 – 44.9)
(63.56 – 68.38)
Zambia 1,970 76.22 43.18 66.35 1,567 79.60 46.13 67.80
(74.59 – 77.86)
(41.47 – 44.89)
(64.26 – 68.44)
(77.87 – 81.33)
(44.23 – 48.02)
(65.49 – 70.12)
Zimbabwe 1,976 60.95 30.84 66.15 1,587 65.74 35.76 71.71
(59.03 – 62.88)
(29.24 – 32.44)
(64.06 – 68.24)
(63.65 – 67.83)
(33.91 – 37.6)
(69.49 – 73.92)
East Asia & the Pacific
21,444 6.25 0.98 11.08 7,212 9.28 1.61 14.95
(5.98 – 6.53)
(0.88 – 1.08)
(10.66 – 11.5)
(8.71 – 9.85)
(1.39 – 1.84)
(14.12 – 15.77)
Australia 1,989 9.73 2.33 9.31 421 15.95 4.89 13.02
(8.55 – 10.91)
(1.81 – 2.84)
(8.03 – 10.59)
(12.78 – 19.12)
(3.2 – 6.57)
(9.79 – 16.24)
China 8,645 4.11 0.48 6.63 3,444 5.27 0.88 7.85
(3.78 – 4.44)
(0.37 – 0.59)
(6.10 – 7.15)
(4.65 – 5.88)
(0.64 – 1.11)
(6.95 – 8.75)
27
Prevalence and Correlates of Food Insecurity among Children across the Globe
Innocenti Working Paper 2017-09
Country/Region SHARE OF FOOD INSECURE HOUSEHOLDS SHARE OF CHILDREN UNDER 15 LIVING WITH A RESPONDENT WHO IS FOOD INSECURE
FIES-M+ FIES-S GWP indicator “not enough money to buy food”
FIES-M+ FIES-S GWP indicator “not enough money to buy food”
N Mean % (95% CI)
Mean % (95% CI)
Mean % (95% CI)
N Mean % (95% CI)
Mean % (95% CI)
Mean % (95% CI)
Hong Kong 997 8.75 1.10 7.06 271 10.93 1.49 7.37
(7.26 – 10.24)
(0.65 – 1.55)
(5.47 – 8.65)
(7.70 – 14.16)
(0.48 – 2.49)
(4.24 – 10.5)
Japan 1,999 2.01 0.50 5.62 403 1.37 0.26 6.84
(1.49 – 2.53)
(0.26 – 0.74)
(4.61 – 6.63)
(0.48 – 2.25)
(-0.14 – 0.65)
(4.37 – 9.32)
Mongolia 1,898 17.75 1.27 36.29 1,158 19.91 1.56 38.08
(16.35 – 19.16)
(0.96 – 1.57)
(34.12 – 38.45)
(18.02 – 21.79)
(1.13 – 1.99)
(35.28 – 40.88)
New Zealand 1,987 6.69 2.28 9.49 484 10.93 3.17 15.06
(5.73 – 7.65)
(1.73 – 2.83)
(8.20 – 10.78)
(8.58 – 13.29)
(1.84 – 4.49)
(11.87 – 18.26)
South Korea 1,936 6.40 0.88 18.47 421 4.81 0.43 15.91
(5.51 – 7.29)
(0.59 – 1.17)
(16.74 – 20.20)
(3.15 – 6.46)
(0.07 – 0.78)
(12.4 – 19.41)
Taiwan 1,993 3.59 0.70 10.14 610 5.00 0.83 12.73
(2.94 – 4.25)
(0.40 – 0.99)
(8.81 – 11.46)
(3.58 – 6.42)
(0.31 – 1.35)
(10.08 – 15.38)
European Union/Non Common-wealth of Independent States
72,743 10.34 2.37 15.63 19,622 14.00 3.57 19.86
(10.14 – 10.53)
(2.28 – 2.45)
(15.37 – 15.9)
(13.57 – 14.43)
(3.36 – 3.77)
(19.3 – 20.42)
Albania 1,958 37.21 9.25 53.01 766 45.58 12.85 62.42
(35.33 – 39.09)
(8.28 – 10.22)
(50.80 – 55.23)
(42.47 – 48.68)
(11.07 – 14.64)
(58.98 – 65.85)
Austria 1,995 5.35 1.73 7.68 454 7.66 2.73 10.16
(4.59 – 6.12)
(1.32 – 2.15)
(6.51 – 8.85)
(5.75 – 9.58)
(1.61 – 3.86)
(7.37 – 12.95)
Belgium 2,034 7.85 2.71 11.01 667 9.72 3.64 16.21
(6.79 – 8.92)
(2.15 – 3.26)
(9.65 – 12.37)
(7.69 – 11.74)
(2.51 – 4.77)
(13.41 – 19.01)
Bosnia Herzegovina
1,955 10.97 1.60 20.65 551 9.96 1.58 23.69
(9.71 – 12.23)
(1.24 – 1.95)
(18.85 – 22.44)
(7.75 – 12.18)
(0.89 – 2.28)
(20.13 – 27.25)
Bulgaria 1,919 14.35 1.39 29.25 416 25.80 3.97 39.89
(13.01 – 15.69)
(1.05 – 1.73)
(27.21 – 31.29)
(22.01 – 29.59)
(2.82 – 5.12)
(35.16 – 44.61)
Croatia 1,952 6.59 0.85 10.97 433 4.87 0.15 7.33
(5.66 – 7.52)
(0.55 – 1.15)
(9.58 – 12.36)
(3.20 – 6.55)
(0 – 0.29)
(4.87 – 9.8)
Cyprus 2,010 15.04 4.59 18.73 664 17.57 5.71 23.92
(13.65 – 16.44)
(3.85 – 5.34)
(17.02 – 20.43)
(15.01 – 20.13)
(4.27 – 7.15)
(20.67 – 27.18)
Czech Republic 1,948 6.75 1.21 14.20 445 8.94 2.14 15.87
(5.81 – 7.69)
(0.83 – 1.59)
(12.64 – 15.75)
(6.61 – 11.26)
(1.09 – 3.19)
(12.46 – 19.27)

28
Prevalence and Correlates of Food Insecurity among Children across the Globe
Innocenti Working Paper 2017-09
Country/Region SHARE OF FOOD INSECURE HOUSEHOLDS SHARE OF CHILDREN UNDER 15 LIVING WITH A RESPONDENT WHO IS FOOD INSECURE
FIES-M+ FIES-S GWP indicator “not enough money to buy food”
FIES-M+ FIES-S GWP indicator “not enough money to buy food”
N Mean % (95% CI)
Mean % (95% CI)
Mean % (95% CI)
N Mean % (95% CI)
Mean % (95% CI)
Mean % (95% CI)
Denmark 1,996 4.99 0.68 5.80 551 8.51 1.19 7.64
(4.16 – 5.81)
(0.42 – 0.93)
(4.78 – 6.83)
(6.48 – 10.54)
(0.62 – 1.76)
(5.42 – 9.87)
Estonia 1,952 8.13 0.24 17.16 473 11.15 0.21 21.15
(7.12 – 9.14)
(0.13 – 0.35)
(15.49 – 18.84)
(8.73 – 13.56)
(0.03 – 0.4)
(17.46 – 24.84)
Finland 1,986 9.19 2.53 9.69 274 7.73 0.88 8.61
(8.11 – 10.26)
(1.99 – 3.08)
(8.38 – 10.99)
(5.41 – 10.05)
(0.15 – 1.61)
(5.26 – 11.95)
France 1,979 6.51 1.67 11.13 486 6.02 1.34 12.23
(5.58 – 7.44)
(1.21 – 2.12)
(9.74 – 12.51)
(4.29 – 7.74)
(0.48 – 2.2)
(9.31 – 15.15)
Germany 1,992 3.61 1.02 5.24 418 4.91 1.19 7.27
(2.91 – 4.31)
(0.66 – 1.38)
(4.26 – 6.22)
(3.16 – 6.66)
(0.38 – 2)
(4.77 – 9.76)
Greece 1,999 12.93 1.52 20.13 446 15.74 2.13 24.61
(11.64 – 14.22)
(1.16 – 1.88)
(18.37 – 21.89)
(12.70 – 18.78)
(1.28 – 2.98)
(20.59 – 28.62)
Hungary 1,925 9.22 1.15 16.19 465 11.84 1.20 16.59
(8.11 – 10.33)
(0.82 – 1.48)
(14.54 – 17.83)
(9.34 – 14.33)
(0.52 – 1.87)
(13.2 – 19.98)
Iceland 594 8.12 2.25 11.26 225 8.36 3.46 11.64
(6.12 – 10.13)
(1.32 – 3.18)
(8.71 – 13.81)
(4.94 – 11.79)
(1.5 – 5.42)
(7.41 – 15.86)
Ireland 1,991 10.10 4.18 11.18 601 17.94 7.29 20.84
(8.93 – 11.27)
(3.44 – 4.91)
(9.79 – 12.56)
(15.21 – 20.67)
(5.59 – 8.99)
(17.58 – 24.1)
Italy 1,966 7.51 0.93 13.93 450 8.79 1.13 18.09
(6.52 – 8.5)
(0.63 – 1.22)
(12.40 – 15.47)
(6.50 – 11.07)
(0.42 – 1.85)
(14.52 – 21.66)
Kosovo 1,809 13.45 3.31 18.95 967 16.03 4.26 22.73
(12.11 – 14.78)
(2.64 – 3.98)
(17.14 – 20.76)
(14.07 – 17.99)
(3.25 – 5.27)
(20.09 – 25.38)
Latvia 1,909 9.82 0.74 18.82 437 12.89 1.15 21.45
(8.69 – 10.95)
(0.51 – 0.98)
(17.07 – 20.58)
(10.12 – 15.66)
(0.52 – 1.78)
(17.59 – 25.31)
Lithuania 1,869 18.50 3.12 12.20 456 21.53 4.55 16.82
(16.95 – 20.06)
(2.50 – 3.75)
(10.71 – 13.68)
(18.12 – 24.93)
(2.98 – 6.11)
(13.37 – 20.26)
Luxembourg 1,983 5.27 2.34 5.79 513 7.25 4.51 5.99
(4.44 – 6.1)
(1.81 – 2.88)
(4.76 – 6.82)
(5.19 – 9.30)
(2.94 – 6.08)
(3.93 – 8.06)
Macedonia 1,966 13.23 3.78 20.73 573 20.97 6.80 29.37
(11.88 – 14.59)
(3.11 – 4.45)
(18.93 – 22.52)
(17.91 – 24.02)
(5.16 – 8.45)
(25.63 – 33.11)
Malta 2,005 5.35 1.60 7.56 540 10.50 3.47 13.74
(4.5 – 6.21)
(1.16 – 2.04)
(6.40 – 8.72)
(8.18 – 12.82)
(2.29 – 4.66)
(10.83 – 16.65)
29
Prevalence and Correlates of Food Insecurity among Children across the Globe
Innocenti Working Paper 2017-09
Country/Region SHARE OF FOOD INSECURE HOUSEHOLDS SHARE OF CHILDREN UNDER 15 LIVING WITH A RESPONDENT WHO IS FOOD INSECURE
FIES-M+ FIES-S GWP indicator “not enough money to buy food”
FIES-M+ FIES-S GWP indicator “not enough money to buy food”
N Mean % (95% CI)
Mean % (95% CI)
Mean % (95% CI)
N Mean % (95% CI)
Mean % (95% CI)
Mean % (95% CI)
Montenegro 1,945 12.06 1.73 16.86 578 17.93 2.52 19.61
(10.78 – 13.34)
(1.33 – 2.13)
(15.20 – 18.53)
(15.08 – 20.77)
(1.68 – 3.36)
(16.37 – 22.86)
Netherlands 2,001 5.03 1.43 9.94 553 8.78 2.66 13.52
(4.2 – 5.86)
(1.01 – 1.86)
(8.63 – 11.26)
(6.70 – 10.85)
(1.53 – 3.78)
(10.66 – 16.38)
Northern Cyprus
1,961 24.35 7.74 36.88 650 29.55 9.42 40.25
(22.71 – 26)
(6.78 – 8.70)
(34.75 – 39.02)
(26.57 – 32.52)
(7.59 – 11.26)
(36.47 – 44.03)
Norway 1,995 4.61 1.23 6.09 480 5.15 1.66 5.65
(3.8 – 5.42)
(0.85 – 1.61)
(5.04 – 7.14)
(3.44 – 6.86)
(0.76 – 2.57)
(3.57 – 7.72)
Poland 1,909 9.61 2.12 17.26 512 14.17 2.91 24.02
(8.45 – 10.78)
(1.62 – 2.62)
(15.56 – 18.96)
(11.45 – 16.89)
(1.78 – 4.03)
(20.31 – 27.73)
Portugal 2,016 14.79 4.16 19.04 793 18.15 4.87 24.96
(13.41 – 16.17)
(3.48 – 4.84)
(17.32 – 20.75)
(15.73 – 20.57)
(3.75 – 6)
(21.95 – 27.98)
Romania 1,915 18.95 5.62 37.58 470 26.32 9.09 48.81
(17.37 – 20.54)
(4.78 – 6.45)
(35.41 – 39.75)
(22.71 – 29.94)
(6.95 – 11.24)
(44.27 – 53.35)
Serbia 1,923 9.67 1.46 20.63 466 11.35 1.95 25.34
(8.52 – 10.82)
(1.09 – 1.82)
(18.82 – 22.44)
(8.89 – 13.82)
(1.03 – 2.86)
(21.38 – 29.31)
Slovakia 1,923 5.80 0.85 9.52 454 10.82 1.74 16.10
(4.92 – 6.68)
(0.54 – 1.16)
(8.21 – 10.84)
(8.38 – 13.27)
(0.78 – 2.71)
(12.71 – 19.49)
Slovenia 1,996 12.17 1.34 13.73 607 12.73 1.49 14.98
(10.93 – 13.41)
(1.02 – 1.66)
(12.22 – 15.24)
(10.42 – 15.03)
(0.87 – 2.11)
(12.13 – 17.83)
Spain 1,990 6.09 1.39 11.71 585 12.01 3.36 13.17
(5.21 – 6.98)
(1.01 – 1.76)
(10.29 – 13.12)
(9.65 – 14.37)
(2.32 – 4.41)
(10.42 – 15.92)
Sweden 1,985 4.52 0.77 4.97 514 4.05 0.56 3.42
(3.73 – 5.31)
(0.49 – 1.04)
(4.01 – 5.93)
(2.63 – 5.46)
(0.08 – 1.04)
(1.85 – 5)
Switzerland 1,500 3.92 0.56 4.58 335 5.00 0.19 7.94
(3.06 – 4.78)
(0.29 – 0.82)
(3.52 – 5.64)
(3.17 – 6.82)
(-0.12 – 0.49)
(5.03 – 10.85)
United Kingdom
1,992 9.53 4.72 10.89 354 19.46 10.40 20.02
(8.39 – 10.68)
(3.89 – 5.55)
(9.52 – 12.26)
(15.79 – 23.13)
(7.53 – 13.28)
(15.83 – 24.21)
Horn of Africa 6,573 60.62 36.19 53.00 5,260 65.49 41.05 57.44
(59.55 – 61.69)
(35.2 – 37.17)
(51.79 – 54.2)
(64.33 – 66.66)
(39.94 – 42.17)
(56.11 – 58.78)
Ethiopia 1,971 49.13 11.35 45.40 1,482 53.50 13.76 49.36
(47.23 – 51.04)
(10.29 – 12.40)
(43.20 – 47.60)
(51.29 – 55.72)
(12.45 – 15.08)
(46.81 – 51.91)
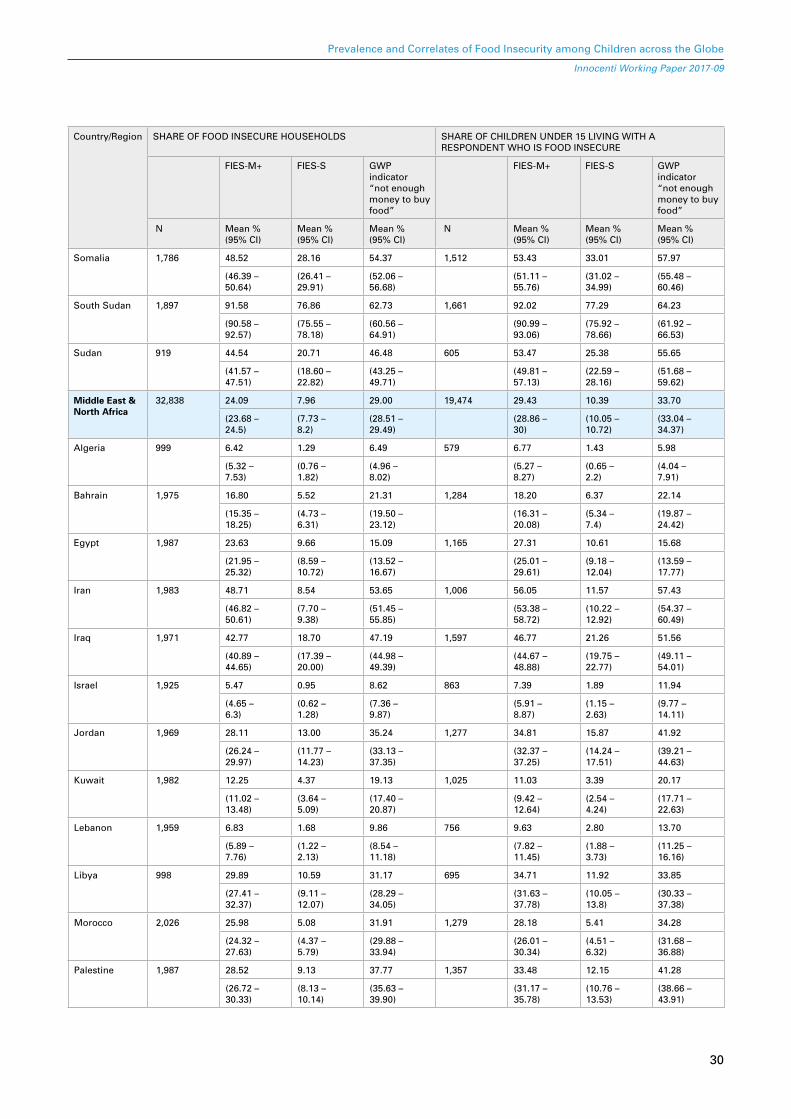
30
Prevalence and Correlates of Food Insecurity among Children across the Globe
Innocenti Working Paper 2017-09
Country/Region SHARE OF FOOD INSECURE HOUSEHOLDS SHARE OF CHILDREN UNDER 15 LIVING WITH A RESPONDENT WHO IS FOOD INSECURE
FIES-M+ FIES-S GWP indicator “not enough money to buy food”
FIES-M+ FIES-S GWP indicator “not enough money to buy food”
N Mean % (95% CI)
Mean % (95% CI)
Mean % (95% CI)
N Mean % (95% CI)
Mean % (95% CI)
Mean % (95% CI)
Somalia 1,786 48.52 28.16 54.37 1,512 53.43 33.01 57.97
(46.39 – 50.64)
(26.41 – 29.91)
(52.06 – 56.68)
(51.11 – 55.76)
(31.02 – 34.99)
(55.48 – 60.46)
South Sudan 1,897 91.58 76.86 62.73 1,661 92.02 77.29 64.23
(90.58 – 92.57)
(75.55 – 78.18)
(60.56 – 64.91)
(90.99 – 93.06)
(75.92 – 78.66)
(61.92 – 66.53)
Sudan 919 44.54 20.71 46.48 605 53.47 25.38 55.65
(41.57 – 47.51)
(18.60 – 22.82)
(43.25 – 49.71)
(49.81 – 57.13)
(22.59 – 28.16)
(51.68 – 59.62)
Middle East & North Africa
32,838 24.09 7.96 29.00 19,474 29.43 10.39 33.70
(23.68 – 24.5)
(7.73 – 8.2)
(28.51 – 29.49)
(28.86 – 30)
(10.05 – 10.72)
(33.04 – 34.37)
Algeria 999 6.42 1.29 6.49 579 6.77 1.43 5.98
(5.32 – 7.53)
(0.76 – 1.82)
(4.96 – 8.02)
(5.27 – 8.27)
(0.65 – 2.2)
(4.04 – 7.91)
Bahrain 1,975 16.80 5.52 21.31 1,284 18.20 6.37 22.14
(15.35 – 18.25)
(4.73 – 6.31)
(19.50 – 23.12)
(16.31 – 20.08)
(5.34 – 7.4)
(19.87 – 24.42)
Egypt 1,987 23.63 9.66 15.09 1,165 27.31 10.61 15.68
(21.95 – 25.32)
(8.59 – 10.72)
(13.52 – 16.67)
(25.01 – 29.61)
(9.18 – 12.04)
(13.59 – 17.77)
Iran 1,983 48.71 8.54 53.65 1,006 56.05 11.57 57.43
(46.82 – 50.61)
(7.70 – 9.38)
(51.45 – 55.85)
(53.38 – 58.72)
(10.22 – 12.92)
(54.37 – 60.49)
Iraq 1,971 42.77 18.70 47.19 1,597 46.77 21.26 51.56
(40.89 – 44.65)
(17.39 – 20.00)
(44.98 – 49.39)
(44.67 – 48.88)
(19.75 – 22.77)
(49.11 – 54.01)
Israel 1,925 5.47 0.95 8.62 863 7.39 1.89 11.94
(4.65 – 6.3)
(0.62 – 1.28)
(7.36 – 9.87)
(5.91 – 8.87)
(1.15 – 2.63)
(9.77 – 14.11)
Jordan 1,969 28.11 13.00 35.24 1,277 34.81 15.87 41.92
(26.24 – 29.97)
(11.77 – 14.23)
(33.13 – 37.35)
(32.37 – 37.25)
(14.24 – 17.51)
(39.21 – 44.63)
Kuwait 1,982 12.25 4.37 19.13 1,025 11.03 3.39 20.17
(11.02 – 13.48)
(3.64 – 5.09)
(17.40 – 20.87)
(9.42 – 12.64)
(2.54 – 4.24)
(17.71 – 22.63)
Lebanon 1,959 6.83 1.68 9.86 756 9.63 2.80 13.70
(5.89 – 7.76)
(1.22 – 2.13)
(8.54 – 11.18)
(7.82 – 11.45)
(1.88 – 3.73)
(11.25 – 16.16)
Libya 998 29.89 10.59 31.17 695 34.71 11.92 33.85
(27.41 – 32.37)
(9.11 – 12.07)
(28.29 – 34.05)
(31.63 – 37.78)
(10.05 – 13.8)
(30.33 – 37.38)
Morocco 2,026 25.98 5.08 31.91 1,279 28.18 5.41 34.28
(24.32 – 27.63)
(4.37 – 5.79)
(29.88 – 33.94)
(26.01 – 30.34)
(4.51 – 6.32)
(31.68 – 36.88)
Palestine 1,987 28.52 9.13 37.77 1,357 33.48 12.15 41.28
(26.72 – 30.33)
(8.13 – 10.14)
(35.63 – 39.90)
(31.17 – 35.78)
(10.76 – 13.53)
(38.66 – 43.91)
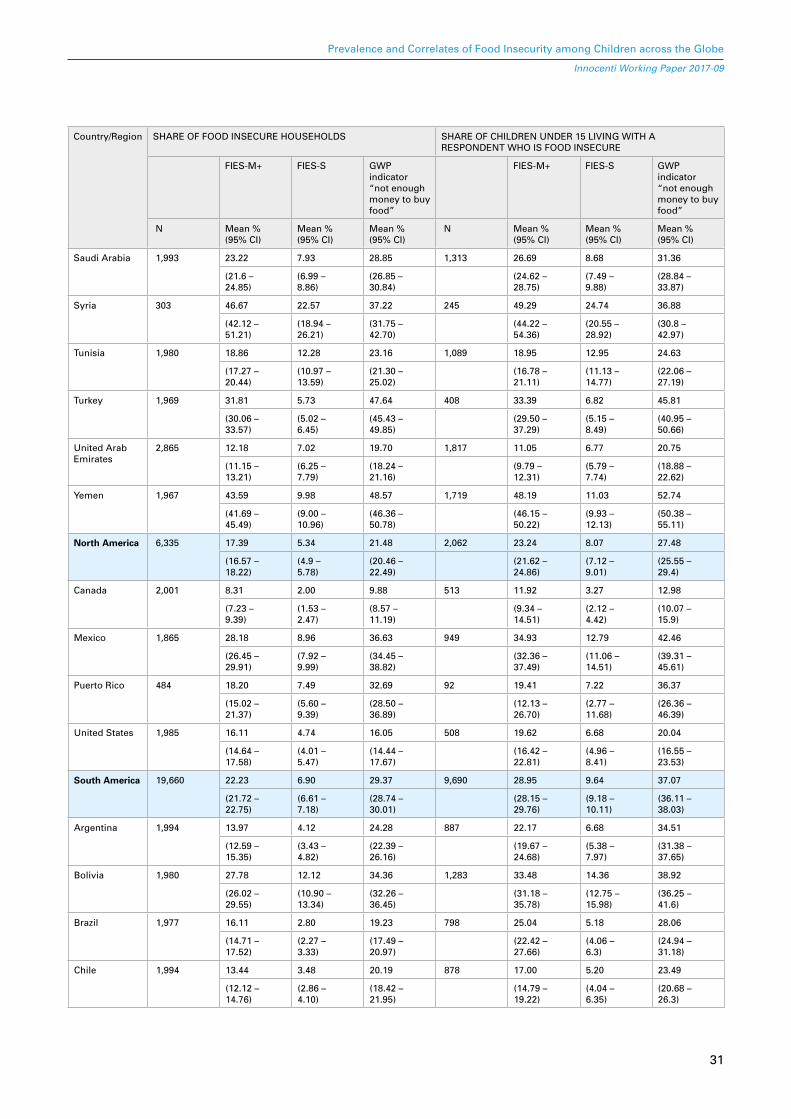
31
Prevalence and Correlates of Food Insecurity among Children across the Globe
Innocenti Working Paper 2017-09
Country/Region SHARE OF FOOD INSECURE HOUSEHOLDS SHARE OF CHILDREN UNDER 15 LIVING WITH A RESPONDENT WHO IS FOOD INSECURE
FIES-M+ FIES-S GWP indicator “not enough money to buy food”
FIES-M+ FIES-S GWP indicator “not enough money to buy food”
N Mean % (95% CI)
Mean % (95% CI)
Mean % (95% CI)
N Mean % (95% CI)
Mean % (95% CI)
Mean % (95% CI)
Saudi Arabia 1,993 23.22 7.93 28.85 1,313 26.69 8.68 31.36
(21.6 – 24.85)
(6.99 – 8.86)
(26.85 – 30.84)
(24.62 – 28.75)
(7.49 – 9.88)
(28.84 – 33.87)
Syria 303 46.67 22.57 37.22 245 49.29 24.74 36.88
(42.12 – 51.21)
(18.94 – 26.21)
(31.75 – 42.70)
(44.22 – 54.36)
(20.55 – 28.92)
(30.8 – 42.97)
Tunisia 1,980 18.86 12.28 23.16 1,089 18.95 12.95 24.63
(17.27 – 20.44)
(10.97 – 13.59)
(21.30 – 25.02)
(16.78 – 21.11)
(11.13 – 14.77)
(22.06 – 27.19)
Turkey 1,969 31.81 5.73 47.64 408 33.39 6.82 45.81
(30.06 – 33.57)
(5.02 – 6.45)
(45.43 – 49.85)
(29.50 – 37.29)
(5.15 – 8.49)
(40.95 – 50.66)
United Arab Emirates
2,865 12.18 7.02 19.70 1,817 11.05 6.77 20.75
(11.15 – 13.21)
(6.25 – 7.79)
(18.24 – 21.16)
(9.79 – 12.31)
(5.79 – 7.74)
(18.88 – 22.62)
Yemen 1,967 43.59 9.98 48.57 1,719 48.19 11.03 52.74
(41.69 – 45.49)
(9.00 – 10.96)
(46.36 – 50.78)
(46.15 – 50.22)
(9.93 – 12.13)
(50.38 – 55.11)
North America 6,335 17.39 5.34 21.48 2,062 23.24 8.07 27.48
(16.57 – 18.22)
(4.9 – 5.78)
(20.46 – 22.49)
(21.62 – 24.86)
(7.12 – 9.01)
(25.55 – 29.4)
Canada 2,001 8.31 2.00 9.88 513 11.92 3.27 12.98
(7.23 – 9.39)
(1.53 – 2.47)
(8.57 – 11.19)
(9.34 – 14.51)
(2.12 – 4.42)
(10.07 – 15.9)
Mexico 1,865 28.18 8.96 36.63 949 34.93 12.79 42.46
(26.45 – 29.91)
(7.92 – 9.99)
(34.45 – 38.82)
(32.36 – 37.49)
(11.06 – 14.51)
(39.31 – 45.61)
Puerto Rico 484 18.20 7.49 32.69 92 19.41 7.22 36.37
(15.02 – 21.37)
(5.60 – 9.39)
(28.50 – 36.89)
(12.13 – 26.70)
(2.77 – 11.68)
(26.36 – 46.39)
United States 1,985 16.11 4.74 16.05 508 19.62 6.68 20.04
(14.64 – 17.58)
(4.01 – 5.47)
(14.44 – 17.67)
(16.42 – 22.81)
(4.96 – 8.41)
(16.55 – 23.53)
South America 19,660 22.23 6.90 29.37 9,690 28.95 9.64 37.07
(21.72 – 22.75)
(6.61 – 7.18)
(28.74 – 30.01)
(28.15 – 29.76)
(9.18 – 10.11)
(36.11 – 38.03)
Argentina 1,994 13.97 4.12 24.28 887 22.17 6.68 34.51
(12.59 – 15.35)
(3.43 – 4.82)
(22.39 – 26.16)
(19.67 – 24.68)
(5.38 – 7.97)
(31.38 – 37.65)
Bolivia 1,980 27.78 12.12 34.36 1,283 33.48 14.36 38.92
(26.02 – 29.55)
(10.90 – 13.34)
(32.26 – 36.45)
(31.18 – 35.78)
(12.75 – 15.98)
(36.25 – 41.6)
Brazil 1,977 16.11 2.80 19.23 798 25.04 5.18 28.06
(14.71 – 17.52)
(2.27 – 3.33)
(17.49 – 20.97)
(22.42 – 27.66)
(4.06 – 6.3)
(24.94 – 31.18)
Chile 1,994 13.44 3.48 20.19 878 17.00 5.20 23.49
(12.12 – 14.76)
(2.86 – 4.10)
(18.42 – 21.95)
(14.79 – 19.22)
(4.04 – 6.35)
(20.68 – 26.3)
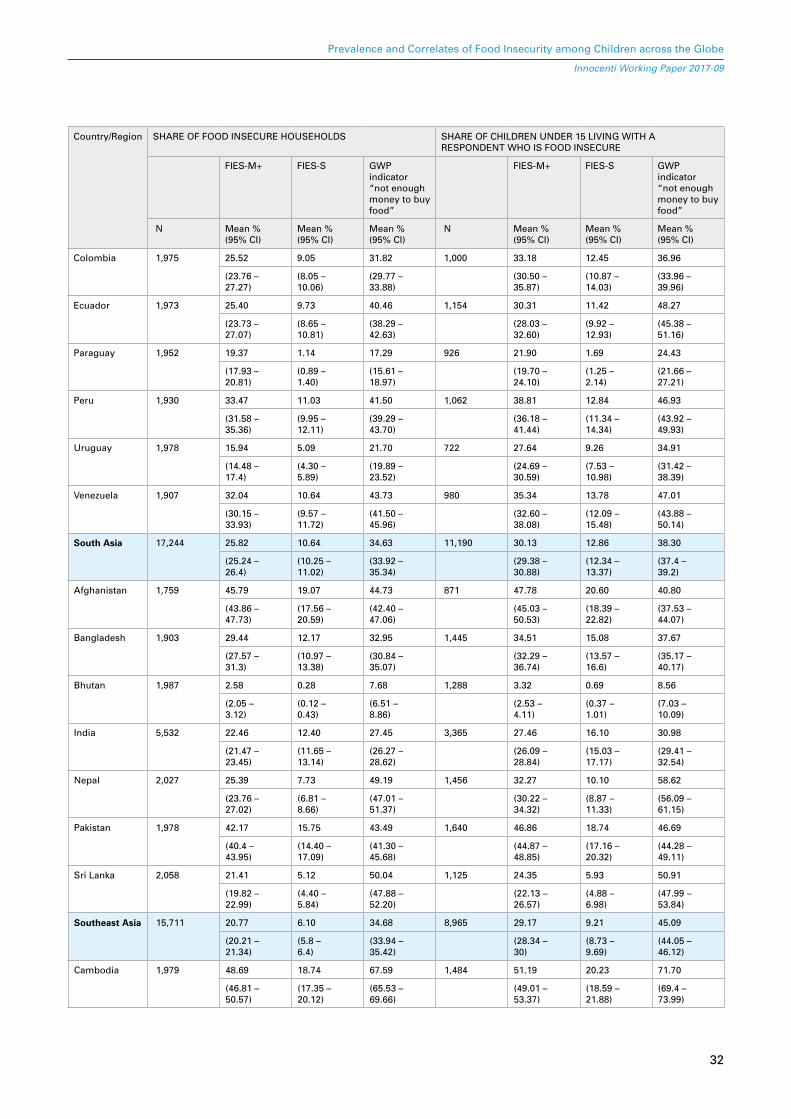
32
Prevalence and Correlates of Food Insecurity among Children across the Globe
Innocenti Working Paper 2017-09
Country/Region SHARE OF FOOD INSECURE HOUSEHOLDS SHARE OF CHILDREN UNDER 15 LIVING WITH A RESPONDENT WHO IS FOOD INSECURE
FIES-M+ FIES-S GWP indicator “not enough money to buy food”
FIES-M+ FIES-S GWP indicator “not enough money to buy food”
N Mean % (95% CI)
Mean % (95% CI)
Mean % (95% CI)
N Mean % (95% CI)
Mean % (95% CI)
Mean % (95% CI)
Colombia 1,975 25.52 9.05 31.82 1,000 33.18 12.45 36.96
(23.76 – 27.27)
(8.05 – 10.06)
(29.77 – 33.88)
(30.50 – 35.87)
(10.87 – 14.03)
(33.96 – 39.96)
Ecuador 1,973 25.40 9.73 40.46 1,154 30.31 11.42 48.27
(23.73 – 27.07)
(8.65 – 10.81)
(38.29 – 42.63)
(28.03 – 32.60)
(9.92 – 12.93)
(45.38 – 51.16)
Paraguay 1,952 19.37 1.14 17.29 926 21.90 1.69 24.43
(17.93 – 20.81)
(0.89 – 1.40)
(15.61 – 18.97)
(19.70 – 24.10)
(1.25 – 2.14)
(21.66 – 27.21)
Peru 1,930 33.47 11.03 41.50 1,062 38.81 12.84 46.93
(31.58 – 35.36)
(9.95 – 12.11)
(39.29 – 43.70)
(36.18 – 41.44)
(11.34 – 14.34)
(43.92 – 49.93)
Uruguay 1,978 15.94 5.09 21.70 722 27.64 9.26 34.91
(14.48 – 17.4)
(4.30 – 5.89)
(19.89 – 23.52)
(24.69 – 30.59)
(7.53 – 10.98)
(31.42 – 38.39)
Venezuela 1,907 32.04 10.64 43.73 980 35.34 13.78 47.01
(30.15 – 33.93)
(9.57 – 11.72)
(41.50 – 45.96)
(32.60 – 38.08)
(12.09 – 15.48)
(43.88 – 50.14)
South Asia 17,244 25.82 10.64 34.63 11,190 30.13 12.86 38.30
(25.24 – 26.4)
(10.25 – 11.02)
(33.92 – 35.34)
(29.38 – 30.88)
(12.34 – 13.37)
(37.4 – 39.2)
Afghanistan 1,759 45.79 19.07 44.73 871 47.78 20.60 40.80
(43.86 – 47.73)
(17.56 – 20.59)
(42.40 – 47.06)
(45.03 – 50.53)
(18.39 – 22.82)
(37.53 – 44.07)
Bangladesh 1,903 29.44 12.17 32.95 1,445 34.51 15.08 37.67
(27.57 – 31.3)
(10.97 – 13.38)
(30.84 – 35.07)
(32.29 – 36.74)
(13.57 – 16.6)
(35.17 – 40.17)
Bhutan 1,987 2.58 0.28 7.68 1,288 3.32 0.69 8.56
(2.05 – 3.12)
(0.12 – 0.43)
(6.51 – 8.86)
(2.53 – 4.11)
(0.37 – 1.01)
(7.03 – 10.09)
India 5,532 22.46 12.40 27.45 3,365 27.46 16.10 30.98
(21.47 – 23.45)
(11.65 – 13.14)
(26.27 – 28.62)
(26.09 – 28.84)
(15.03 – 17.17)
(29.41 – 32.54)
Nepal 2,027 25.39 7.73 49.19 1,456 32.27 10.10 58.62
(23.76 – 27.02)
(6.81 – 8.66)
(47.01 – 51.37)
(30.22 – 34.32)
(8.87 – 11.33)
(56.09 – 61.15)
Pakistan 1,978 42.17 15.75 43.49 1,640 46.86 18.74 46.69
(40.4 – 43.95)
(14.40 – 17.09)
(41.30 – 45.68)
(44.87 – 48.85)
(17.16 – 20.32)
(44.28 – 49.11)
Sri Lanka 2,058 21.41 5.12 50.04 1,125 24.35 5.93 50.91
(19.82 – 22.99)
(4.40 – 5.84)
(47.88 – 52.20)
(22.13 – 26.57)
(4.88 – 6.98)
(47.99 – 53.84)
Southeast Asia 15,711 20.77 6.10 34.68 8,965 29.17 9.21 45.09
(20.21 – 21.34)
(5.8 – 6.4)
(33.94 – 35.42)
(28.34 – 30)
(8.73 – 9.69)
(44.05 – 46.12)
Cambodia 1,979 48.69 18.74 67.59 1,484 51.19 20.23 71.70
(46.81 – 50.57)
(17.35 – 20.12)
(65.53 – 69.66)
(49.01 – 53.37)
(18.59 – 21.88)
(69.4 – 73.99)

33
Prevalence and Correlates of Food Insecurity among Children across the Globe
Innocenti Working Paper 2017-09
Country/Region SHARE OF FOOD INSECURE HOUSEHOLDS SHARE OF CHILDREN UNDER 15 LIVING WITH A RESPONDENT WHO IS FOOD INSECURE
FIES-M+ FIES-S GWP indicator “not enough money to buy food”
FIES-M+ FIES-S GWP indicator “not enough money to buy food”
N Mean % (95% CI)
Mean % (95% CI)
Mean % (95% CI)
N Mean % (95% CI)
Mean % (95% CI)
Mean % (95% CI)
Indonesia 1,959 17.02 5.19 26.94 1,352 19.52 6.00 30.63
(15.56 – 18.48)
(4.39 – 6.00)
(24.97 – 28.91)
(17.67 – 21.36)
(4.95 – 7.05)
(28.17 – 33.09)
Malaysia 1,948 16.49 8.05 18.85 936 20.75 12.20 22.07
(15.01 – 17.97)
(7.04 – 9.06)
(17.11 – 20.59)
(18.35 – 23.14)
(10.39 – 14)
(19.41 – 24.73)
Myanmar 2,035 13.14 1.55 46.02 1,278 16.96 2.15 53.26
(11.93 – 14.35)
(1.16 – 1.94)
(43.85 – 48.19)
(15.27 – 18.65)
(1.57 – 2.73)
(50.52 – 56)
Philippines 1,993 43.97 10.84 64.16 1,376 51.52 13.98 71.06
(42.09 – 45.85)
(9.85 – 11.82)
(62.05 – 66.27)
(49.26 – 53.78)
(12.66 – 15.31)
(68.66 – 73.46)
Singapore 1,940 3.13 1.09 5.76 635 3.84 1.51 5.08
(2.41 – 3.85)
(0.69 – 1.49)
(4.72 – 6.80)
(2.45 – 5.24)
(0.7 – 2.32)
(3.37 – 6.79)
Thailand 1,903 6.81 2.26 18.53 677 9.91 3.23 17.74
(5.78 – 7.84)
(1.73 – 2.79)
(16.79 – 20.28)
(7.88 – 11.95)
(2.15 – 4.32)
(14.85 – 20.62)
Vietnam 1,954 15.86 0.85 27.30 1,227 17.63 1.01 30.23
(14.47 – 17.24)
(0.58 – 1.12)
(25.32 – 29.28)
(15.82 – 19.44)
(0.64 – 1.38)
(27.66 – 32.8)
West & Central Africa
35,667 54.42 26.39 57.13 27,894 59.10 29.05 60.07
(53.97 – 54.87)
(26.02 – 26.76)
(56.62 – 57.64)
(58.6 – 59.6)
(28.62 – 29.48)
(59.5 – 60.65)
Benin 1,949 55.61 23.63 63.93 1,457 55.49 23.50 65.66
(53.7 – 57.53)
(22.18 – 25.08)
(61.79 – 66.06)
(53.29 – 57.69)
(21.83 – 25.18)
(63.21 – 68.1)
Burkina Faso 1,936 42.01 16.73 46.17 1,571 44.55 18.56 47.19
(40.14 – 43.89)
(15.39 – 18.06)
(43.95 – 48.39)
(42.45 – 46.65)
(17 – 20.11)
(44.72 – 49.66)
Cameroon 1,946 53.92 27.69 63.52 1,464 56.00 28.89 66.09
(51.99 – 55.85)
(26.12 – 29.26)
(61.38 – 65.66)
(53.80 – 58.21)
(27.07 – 30.7)
(63.66 – 68.52)
Chad 1,968 64.33 25.67 66.33 1,702 67.55 27.83 67.21
(62.53 – 66.12)
(24.16 – 27.17)
(64.24 – 68.42)
(65.67 – 69.43)
(26.18 – 29.48)
(64.98 – 69.44)
Congo Brazzaville
1,933 61.86 37.30 63.57 1,289 64.24 39.35 64.72
(60.03 – 63.69)
(35.62 – 38.98)
(61.43 – 65.72)
(62.03 – 66.45)
(37.29 – 41.41)
(62.1 – 67.33)
Congo Kinshasa
1,854 72.26 36.67 71.25 1,585 75.31 37.37 74.68
(70.57 – 73.96)
(34.92 – 38.42)
(69.19 – 73.31)
(73.60 – 77.03)
(35.48 – 39.25)
(72.54 – 76.82)
Côte d’Ivoire 1,941 52.06 19.40 60.42 1,432 56.00 21.43 64.04
(50.16 – 53.96)
(18.04 – 20.75)
(58.24 – 62.59)
(53.84 – 58.17)
(19.8 – 23.05)
(61.55 – 66.53)
Gabon 1,951 58.55 36.75 60.24 1,286 64.20 41.18 62.09
(56.63 – 60.48)
(34.98 – 38.53)
(58.07 – 62.41)
(61.91 – 66.50)
(38.97 – 43.39)
(59.43 – 64.74)
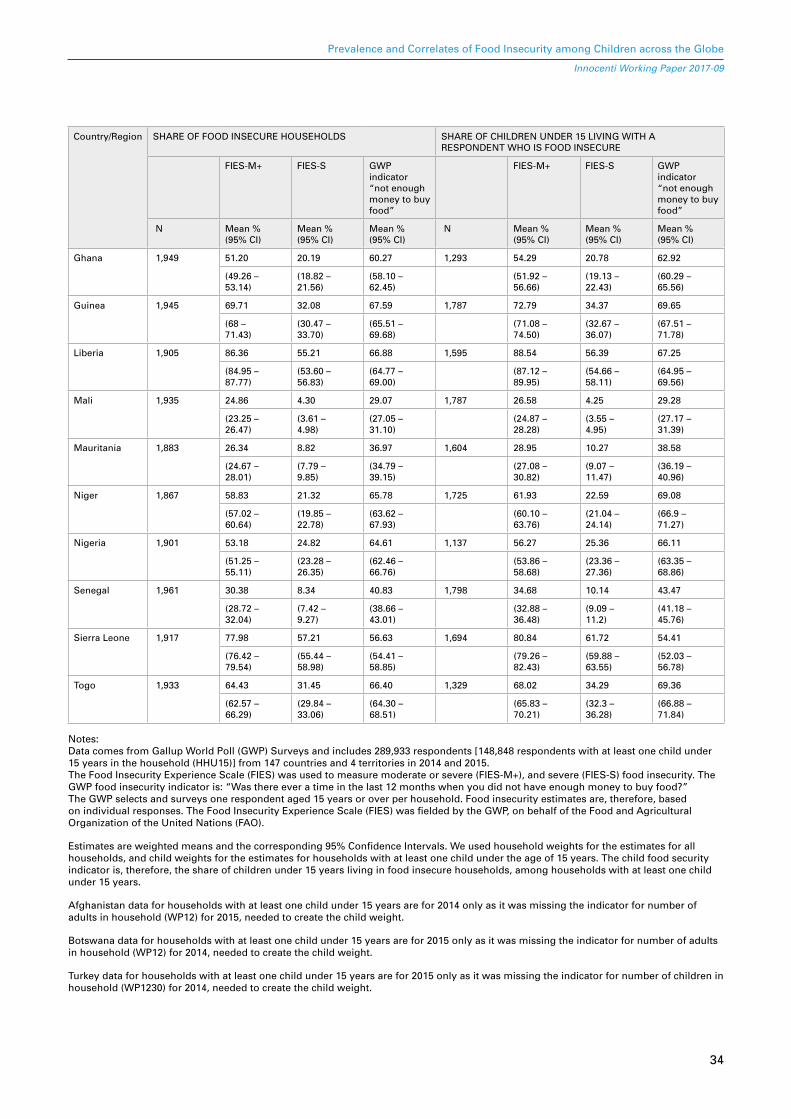
34
Prevalence and Correlates of Food Insecurity among Children across the Globe
Innocenti Working Paper 2017-09
Country/Region SHARE OF FOOD INSECURE HOUSEHOLDS SHARE OF CHILDREN UNDER 15 LIVING WITH A RESPONDENT WHO IS FOOD INSECURE
FIES-M+ FIES-S GWP indicator “not enough money to buy food”
FIES-M+ FIES-S GWP indicator “not enough money to buy food”
N Mean % (95% CI)
Mean % (95% CI)
Mean % (95% CI)
N Mean % (95% CI)
Mean % (95% CI)
Mean % (95% CI)
Ghana 1,949 51.20 20.19 60.27 1,293 54.29 20.78 62.92
(49.26 – 53.14)
(18.82 – 21.56)
(58.10 – 62.45)
(51.92 – 56.66)
(19.13 – 22.43)
(60.29 – 65.56)
Guinea 1,945 69.71 32.08 67.59 1,787 72.79 34.37 69.65
(68 – 71.43)
(30.47 – 33.70)
(65.51 – 69.68)
(71.08 – 74.50)
(32.67 – 36.07)
(67.51 – 71.78)
Liberia 1,905 86.36 55.21 66.88 1,595 88.54 56.39 67.25
(84.95 – 87.77)
(53.60 – 56.83)
(64.77 – 69.00)
(87.12 – 89.95)
(54.66 – 58.11)
(64.95 – 69.56)
Mali 1,935 24.86 4.30 29.07 1,787 26.58 4.25 29.28
(23.25 – 26.47)
(3.61 – 4.98)
(27.05 – 31.10)
(24.87 – 28.28)
(3.55 – 4.95)
(27.17 – 31.39)
Mauritania 1,883 26.34 8.82 36.97 1,604 28.95 10.27 38.58
(24.67 – 28.01)
(7.79 – 9.85)
(34.79 – 39.15)
(27.08 – 30.82)
(9.07 – 11.47)
(36.19 – 40.96)
Niger 1,867 58.83 21.32 65.78 1,725 61.93 22.59 69.08
(57.02 – 60.64)
(19.85 – 22.78)
(63.62 – 67.93)
(60.10 – 63.76)
(21.04 – 24.14)
(66.9 – 71.27)
Nigeria 1,901 53.18 24.82 64.61 1,137 56.27 25.36 66.11
(51.25 – 55.11)
(23.28 – 26.35)
(62.46 – 66.76)
(53.86 – 58.68)
(23.36 – 27.36)
(63.35 – 68.86)
Senegal 1,961 30.38 8.34 40.83 1,798 34.68 10.14 43.47
(28.72 – 32.04)
(7.42 – 9.27)
(38.66 – 43.01)
(32.88 – 36.48)
(9.09 – 11.2)
(41.18 – 45.76)
Sierra Leone 1,917 77.98 57.21 56.63 1,694 80.84 61.72 54.41
(76.42 – 79.54)
(55.44 – 58.98)
(54.41 – 58.85)
(79.26 – 82.43)
(59.88 – 63.55)
(52.03 – 56.78)
Togo 1,933 64.43 31.45 66.40 1,329 68.02 34.29 69.36
(62.57 – 66.29)
(29.84 – 33.06)
(64.30 – 68.51)
(65.83 – 70.21)
(32.3 – 36.28)
(66.88 – 71.84)
Notes: Data comes from Gallup World Poll (GWP) Surveys and includes 289,933 respondents [148,848 respondents with at least one child under 15 years in the household (HHU15)] from 147 countries and 4 territories in 2014 and 2015. The Food Insecurity Experience Scale (FIES) was used to measure moderate or severe (FIES-M+), and severe (FIES-S) food insecurity. The GWP food insecurity indicator is: “Was there ever a time in the last 12 months when you did not have enough money to buy food?” The GWP selects and surveys one respondent aged 15 years or over per household. Food insecurity estimates are, therefore, based on individual responses. The Food Insecurity Experience Scale (FIES) was fielded by the GWP, on behalf of the Food and Agricultural Organization of the United Nations (FAO).
Estimates are weighted means and the corresponding 95% Confidence Intervals. We used household weights for the estimates for all households, and child weights for the estimates for households with at least one child under the age of 15 years. The child food security indicator is, therefore, the share of children under 15 years living in food insecure households, among households with at least one child under 15 years.
Afghanistan data for households with at least one child under 15 years are for 2014 only as it was missing the indicator for number of adults in household (WP12) for 2015, needed to create the child weight.
Botswana data for households with at least one child under 15 years are for 2015 only as it was missing the indicator for number of adults in household (WP12) for 2014, needed to create the child weight.
Turkey data for households with at least one child under 15 years are for 2015 only as it was missing the indicator for number of children in household (WP1230) for 2014, needed to create the child weight.
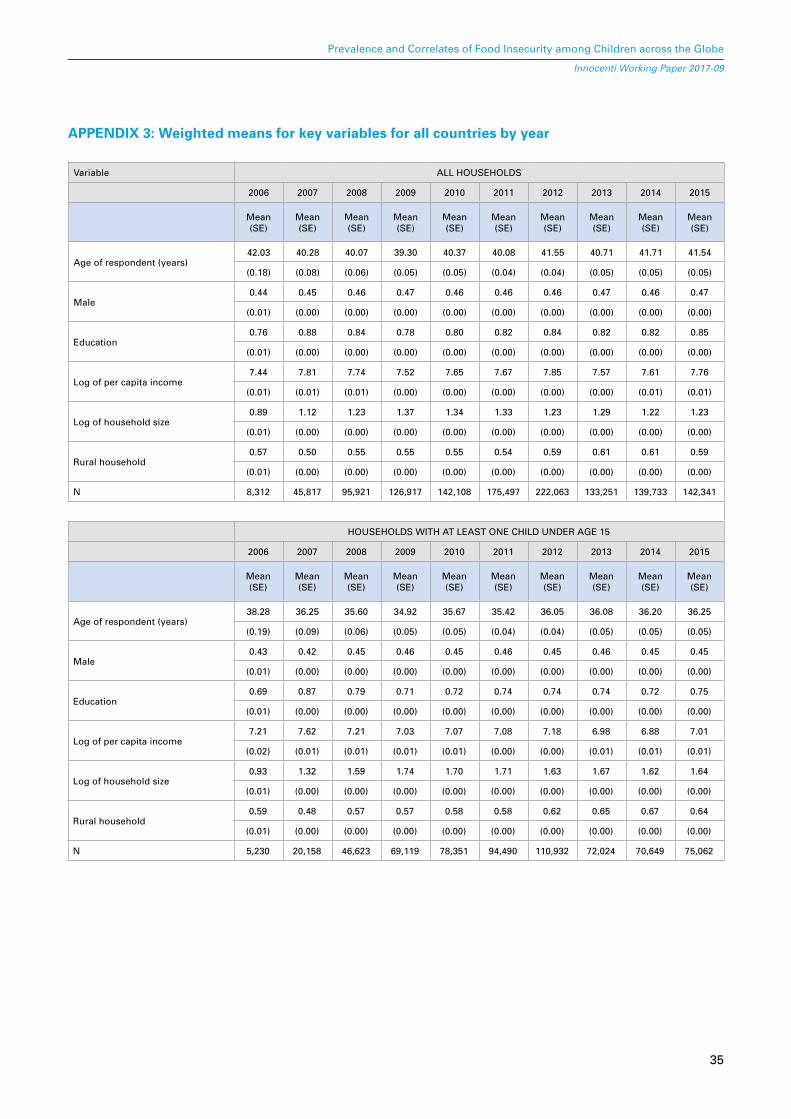
35
Prevalence and Correlates of Food Insecurity among Children across the Globe
Innocenti Working Paper 2017-09
APPENDIX 3: Weighted means for key variables for all countries by year
Variable ALL HOUSEHOLDS
2006 2007 2008 2009 2010 2011 2012 2013 2014 2015
Mean (SE)
Mean (SE)
Mean (SE)
Mean (SE)
Mean (SE)
Mean (SE)
Mean (SE)
Mean (SE)
Mean (SE)
Mean (SE)
Age of respondent (years)42.03 40.28 40.07 39.30 40.37 40.08 41.55 40.71 41.71 41.54
(0.18) (0.08) (0.06) (0.05) (0.05) (0.04) (0.04) (0.05) (0.05) (0.05)
Male0.44 0.45 0.46 0.47 0.46 0.46 0.46 0.47 0.46 0.47
(0.01) (0.00) (0.00) (0.00) (0.00) (0.00) (0.00) (0.00) (0.00) (0.00)
Education0.76 0.88 0.84 0.78 0.80 0.82 0.84 0.82 0.82 0.85
(0.01) (0.00) (0.00) (0.00) (0.00) (0.00) (0.00) (0.00) (0.00) (0.00)
Log of per capita income7.44 7.81 7.74 7.52 7.65 7.67 7.85 7.57 7.61 7.76
(0.01) (0.01) (0.01) (0.00) (0.00) (0.00) (0.00) (0.00) (0.01) (0.01)
Log of household size0.89 1.12 1.23 1.37 1.34 1.33 1.23 1.29 1.22 1.23
(0.01) (0.00) (0.00) (0.00) (0.00) (0.00) (0.00) (0.00) (0.00) (0.00)
Rural household0.57 0.50 0.55 0.55 0.55 0.54 0.59 0.61 0.61 0.59
(0.01) (0.00) (0.00) (0.00) (0.00) (0.00) (0.00) (0.00) (0.00) (0.00)
N 8,312 45,817 95,921 126,917 142,108 175,497 222,063 133,251 139,733 142,341
HOUSEHOLDS WITH AT LEAST ONE CHILD UNDER AGE 15
2006 2007 2008 2009 2010 2011 2012 2013 2014 2015
Mean (SE)
Mean (SE)
Mean (SE)
Mean (SE)
Mean (SE)
Mean (SE)
Mean (SE)
Mean (SE)
Mean (SE)
Mean (SE)
Age of respondent (years)38.28 36.25 35.60 34.92 35.67 35.42 36.05 36.08 36.20 36.25
(0.19) (0.09) (0.06) (0.05) (0.05) (0.04) (0.04) (0.05) (0.05) (0.05)
Male0.43 0.42 0.45 0.46 0.45 0.46 0.45 0.46 0.45 0.45
(0.01) (0.00) (0.00) (0.00) (0.00) (0.00) (0.00) (0.00) (0.00) (0.00)
Education0.69 0.87 0.79 0.71 0.72 0.74 0.74 0.74 0.72 0.75
(0.01) (0.00) (0.00) (0.00) (0.00) (0.00) (0.00) (0.00) (0.00) (0.00)
Log of per capita income7.21 7.62 7.21 7.03 7.07 7.08 7.18 6.98 6.88 7.01
(0.02) (0.01) (0.01) (0.01) (0.01) (0.00) (0.00) (0.01) (0.01) (0.01)
Log of household size0.93 1.32 1.59 1.74 1.70 1.71 1.63 1.67 1.62 1.64
(0.01) (0.00) (0.00) (0.00) (0.00) (0.00) (0.00) (0.00) (0.00) (0.00)
Rural household0.59 0.48 0.57 0.57 0.58 0.58 0.62 0.65 0.67 0.64
(0.01) (0.00) (0.00) (0.00) (0.00) (0.00) (0.00) (0.00) (0.00) (0.00)
N 5,230 20,158 46,623 69,119 78,351 94,490 110,932 72,024 70,649 75,062
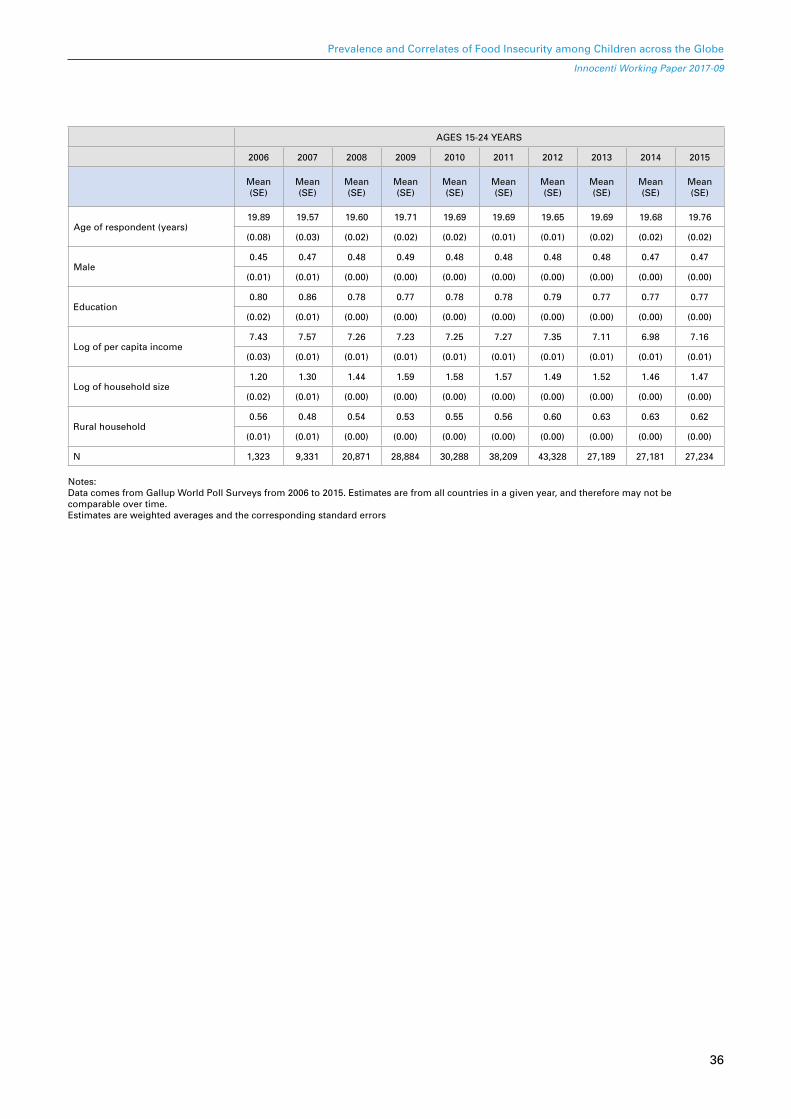
36
Prevalence and Correlates of Food Insecurity among Children across the Globe
Innocenti Working Paper 2017-09
AGES 15-24 YEARS
2006 2007 2008 2009 2010 2011 2012 2013 2014 2015
Mean (SE)
Mean (SE)
Mean (SE)
Mean (SE)
Mean (SE)
Mean (SE)
Mean (SE)
Mean (SE)
Mean (SE)
Mean (SE)
Age of respondent (years)19.89 19.57 19.60 19.71 19.69 19.69 19.65 19.69 19.68 19.76
(0.08) (0.03) (0.02) (0.02) (0.02) (0.01) (0.01) (0.02) (0.02) (0.02)
Male0.45 0.47 0.48 0.49 0.48 0.48 0.48 0.48 0.47 0.47
(0.01) (0.01) (0.00) (0.00) (0.00) (0.00) (0.00) (0.00) (0.00) (0.00)
Education0.80 0.86 0.78 0.77 0.78 0.78 0.79 0.77 0.77 0.77
(0.02) (0.01) (0.00) (0.00) (0.00) (0.00) (0.00) (0.00) (0.00) (0.00)
Log of per capita income7.43 7.57 7.26 7.23 7.25 7.27 7.35 7.11 6.98 7.16
(0.03) (0.01) (0.01) (0.01) (0.01) (0.01) (0.01) (0.01) (0.01) (0.01)
Log of household size1.20 1.30 1.44 1.59 1.58 1.57 1.49 1.52 1.46 1.47
(0.02) (0.01) (0.00) (0.00) (0.00) (0.00) (0.00) (0.00) (0.00) (0.00)
Rural household0.56 0.48 0.54 0.53 0.55 0.56 0.60 0.63 0.63 0.62
(0.01) (0.01) (0.00) (0.00) (0.00) (0.00) (0.00) (0.00) (0.00) (0.00)
N 1,323 9,331 20,871 28,884 30,288 38,209 43,328 27,189 27,181 27,234
Notes: Data comes from Gallup World Poll Surveys from 2006 to 2015. Estimates are from all countries in a given year, and therefore may not be comparable over time. Estimates are weighted averages and the corresponding standard errors

37
Prevalence and Correlates of Food Insecurity among Children across the Globe
Innocenti Working Paper 2017-09
APPENDIX 4: Notes on sources and calculations
Population estimates
All population estimates come from FAOSTAT [Accessed November 17, 2016], except for:
� Hong Kong for 2014 were provided by FAO and came from Wikipedia; 2015 estimates came from the Hong Kong census and statistics department (http://www.censtatd.gov.hk/hkstat/sub/so20.jsp)
� Kosovo for 2014 were provided by FAO and came from Wikipedia; 2015 estimates were calculated using an annual population growth rate of 0.009 (from the World Development Indicators, 2013)
� Northern Cyprus for 2014 were provided by FAO and came from Wikipedia (based on the 2011 census); we used the same estimate in 2015 because of missing data on the annual population growth rate
All estimates of proportion of children under age 15, in a given country, came from the World Development Indicators, World Bank Database [Accessed May 25, 2017], except for:
� Estimates for Northern Cyprus and Taiwan came from UN Stats, as provided by FAO; we used 2014 estimates for both 2014 and 2015
� Only the 2015 estimate were available for Kosovo from the WDI database, therefore we also used the 2015 estimate for 2014


![Research Article Prevalence and Correlates of ...downloads.hindawi.com/journals/ecam/2016/6987636.pdfthat in Sub-Saharan Africa, overall hypertension prevalence isbetweenand%[,].Asaresultofthechronicnature](https://static.fdocuments.in/doc/165x107/5f4ab019b3cfbf7b282ae746/research-article-prevalence-and-correlates-of-that-in-sub-saharan-africa-overall.jpg)


