ANALYSIS OF FACTORS THAT INFLUENCE BEHAVIOR USING …
12
Asian Journal of Management Sciences & Education Vol. 8(1) January 2019 __________________________________________________________________________________________________________________________________________________________________________________________________________________________________________________________________________________________________________________________________________________________________________________________________________________________________________________________________ Copyright © 2019 Leena and Luna International, Chikusei, Japan. 83 | Page (株) リナアンドルナインターナショナル, 筑西市,日本 ISSN: 2186-845X ISSN: 2186-8441 Print www.ajmse. leena-luna.co.jp ANALYSIS OF FACTORS THAT INFLUENCE BEHAVIOR USING MOBILE CELLULAR APPLICATION AB WITH UNIFIED THEORY OF ACCEPTANCE AND USE OF TECHNOLOGY 2 (UTAUT 2) IN MILLENNIAL CUSTOMERS OF ABC IN JABODETABEK AND JABAR Torang Hasudungan 1 , Adhi Prasetio 2 School of Economics & Business, Telkom University, INDONESIA. 1 [email protected], 2 [email protected] ABSTRACT The millennials segment has a huge market potential in using various digital developments. XYZ has a large proportion of millennial’s customers and helps in digitizing, one of which is by providing AB as a cellular application from the A cellular card. This study aims to analyze the factors that influence the intention of customer behavior in using A technology services using the Unified Theory of Acceptance and Use of Technology 2 (UTAUT2) model that are modified and consist of Performance Expectancy, Effort Expectancy, Social Influency, Facilitating Condinations, Hedonic motivation, Price Value, Habit and Content as the main variables as well as Age, Gender and Experience as moderate. This study uses descriptive and causal methods to explain customer perceptions of variables and examine causal relationships between variables based on hypotheses in the study. The study used a survey conducted by conducting questionnaires on A users with millennials age, in Jabodetabek and West Java and already or not yet using A to provide perceptions of adoption using A. The data analysis technique was carried out using Partial Least Squares (PLS) as one method of Structural Equation Modeling (SEM) which complemented the weak regression method using the Variance Based SEM approach. Keywords: Millennial; Unified Theory of Acceptance and Use of Technology; LOOPkita; LOOP; Application Technology Services. INTRODUCTION The Nielsen survey report in 2016 on the population of mobile phone users of 12-65 years old group, XYZ dominates the 12-19 years old customer group, which is the millennial segment. XYZ customers of 17-24 years old as millennial segment have a proportion of 52% of the total market share of XYZ. This shows that the majority of XYZ customers are within the category of millennial segment. Therefore, it is necessary to produce a Digital Marketing based products for the millennial segment target, one of which is inventory from the XYZ Digital Marketing, the AB application. AB is the derivative product of A card in the form of applications. A is intentionally introduced by not showing its relationship with the XYZ because the survey results on the perception of young generation on XYZ card showed that XYZ card is associated with old people or employees’ card with its relatively expensive price (Nielsen; Internal XYZ, 2016). XYZ acts as the largest cellular operator in Indonesia today and continues to develop its products by presenting a convenience, maximum service and adapting to digital changes and developments. In March 2016, XYZ launched AB apps as a mobile application on smartphone for A card cellular customers which can manage and display the data internet usage. AB plays a role to grow and target its millennial customer segment.
Transcript of ANALYSIS OF FACTORS THAT INFLUENCE BEHAVIOR USING …

Asian Journal of Management Sciences & Education Vol. 8(1) January 2019 __________________________________________________________________________________________________________________________________________________________________________________________________________________________________________________________________________________________________________________________________________________________________________________________________________________________________________________________________
Copyright © 2019 Leena and Luna International, Chikusei, Japan.
83 | P a g e (株) リナアンドルナインターナショナル, 筑西市,日本
ISSN: 2186-845X ISSN: 2186-8441 Print
www.ajmse. leena-luna.co.jp
ANALYSIS OF FACTORS THAT INFLUENCE BEHAVIOR USING
MOBILE CELLULAR APPLICATION AB WITH UNIFIED THEORY OF
ACCEPTANCE AND USE OF TECHNOLOGY 2 (UTAUT 2) IN
MILLENNIAL CUSTOMERS OF ABC IN JABODETABEK AND JABAR
Torang Hasudungan1, Adhi Prasetio
2
School of Economics & Business, Telkom University,
INDONESIA.
ABSTRACT
The millennials segment has a huge market potential in using various digital
developments. XYZ has a large proportion of millennial’s customers and helps in
digitizing, one of which is by providing AB as a cellular application from the A
cellular card. This study aims to analyze the factors that influence the intention of
customer behavior in using A technology services using the Unified Theory of
Acceptance and Use of Technology 2 (UTAUT2) model that are modified and consist
of Performance Expectancy, Effort Expectancy, Social Influency, Facilitating
Condinations, Hedonic motivation, Price Value, Habit and Content as the main
variables as well as Age, Gender and Experience as moderate. This study uses
descriptive and causal methods to explain customer perceptions of variables and
examine causal relationships between variables based on hypotheses in the study.
The study used a survey conducted by conducting questionnaires on A users with
millennials age, in Jabodetabek and West Java and already or not yet using A to
provide perceptions of adoption using A. The data analysis technique was carried out
using Partial Least Squares (PLS) as one method of Structural Equation Modeling
(SEM) which complemented the weak regression method using the Variance Based
SEM approach.
Keywords: Millennial; Unified Theory of Acceptance and Use of Technology;
LOOPkita; LOOP; Application Technology Services.
INTRODUCTION
The Nielsen survey report in 2016 on the population of mobile phone users of 12-65 years
old group, XYZ dominates the 12-19 years old customer group, which is the millennial
segment. XYZ customers of 17-24 years old as millennial segment have a proportion of
52% of the total market share of XYZ. This shows that the majority of XYZ customers are
within the category of millennial segment. Therefore, it is necessary to produce a Digital
Marketing based products for the millennial segment target, one of which is inventory
from the XYZ Digital Marketing, the AB application. AB is the derivative product of A
card in the form of applications. A is intentionally introduced by not showing its
relationship with the XYZ because the survey results on the perception of young
generation on XYZ card showed that XYZ card is associated with old people or
employees’ card with its relatively expensive price (Nielsen; Internal XYZ, 2016).
XYZ acts as the largest cellular operator in Indonesia today and continues to develop its
products by presenting a convenience, maximum service and adapting to digital changes
and developments. In March 2016, XYZ launched AB apps as a mobile application on
smartphone for A card cellular customers which can manage and display the data internet
usage. AB plays a role to grow and target its millennial customer segment.

Asian Journal of Management Sciences & Education Vol. 8(1) January 2019 __________________________________________________________________________________________________________________________________________________________________________________________________________________________________________________________________________________________________________________________________________________________________________________________________________________________________________________________________
ISSN: 2186-845X ISSN: 2186-8441 Print
www.ajmse. leena-luna.co.jp
Leena and Luna International, Chikusei, Japan. Copyright © 2019
(株) リナアンドルナインターナショナル, 筑西市,日本 P a g e | 84
The development of smartphone today is increasing, especially its use among the public
where smartphones are commonly used in all type of circles. A smartphone is capable of
showing pictures, playing videos, checking and sending e-mail, and surfing the Web. The
modern smartphone, such as iPhone and Android phones can also run third-party
applications, which provide unlimited functionalities in today’s digital world. The market
share and the penetration level of smartphone are predicted to continue to increase
throughout the Asia Pacific until 2018, and the Asia Pacific becomes the most potential
region for companies to compete in providing benefit value to telecommunication
customers (Srivastava, 2014).
AB is a mobile application that can manage and display internet data usage for smartphone
and can be downloaded on the Android Operating System (OS). AB application depends
on customers A. The analysis of customer A behavior and communication with the
millennial segment is very important to help XYZ to provide the right content to
customers so that it can be the key to increase the number of AB application users. AB can
help to serve the XYZ customers, but the current adoption is not significant enough for
AB’s performance.
The customer’s decision to accept and use technology is influenced by several factors of
customer behavior (Harsono & Suryana, 2014). UTAUT2 is one of the models to identify
customer behavior as an individual’s behavior in accepting and using technology
(Venkatesh, Thong & Xu, 2012). The contribution of acceptance and use of products of
technology and system information can be done using the UTAUT2 (Indrawati, 2017).
LITERATURE
Consumer Behavior
Consumer behavior is a study of processes that develop when individuals or groups of
people choose, use or discard a product, service, idea or experience to satisfy their needs
and desires (Solomon, 2016). The factors that influence consumer behavior are culture,
social, personal and psychology; internal factors which include age, occupation, lifestyle,
personality, motivation, perception, beliefs and attitudes; and also external factors which
include culture, family, reference groups, environmental conditions and situations (Kotler
& Keller, 2016).
Information Technology
Some definitions and descriptions of IT according to several sources in (Riqotunnihlah,
2014):
1. Haag and Keen: a set of tools that help to work with information and perform tasks
related to information processing.
2. Martin: computer technology used to process and store information and includes
communication technology to send information.
3. Keown: all forms of technology used to create, store, change and use the information
in all of its forms.
4. Willams and Sawyer: a combination of computers connected to high-speed
communication channels for sending data, both in the form of text, audio and video as
a general form that describes any technology that helps to produce, manipulate, store,
communicate and/or convey information.
5. Loudon: a tool used by managers to deal with information changes that occur when the
information has been processed and previously stored in the computer.

Asian Journal of Management Sciences & Education Vol. 8(1) January 2019 __________________________________________________________________________________________________________________________________________________________________________________________________________________________________________________________________________________________________________________________________________________________________________________________________________________________________________________________________
Copyright © 2019 Leena and Luna International, Chikusei, Japan.
85 | P a g e (株) リナアンドルナインターナショナル, 筑西市,日本
ISSN: 2186-845X ISSN: 2186-8441 Print
www.ajmse. leena-luna.co.jp
Theory of Adoption Technology
UTAUT is a proposed integrated model based on empirical studies of 8 main models related
to information technology adoption research which combines the TRA and TPB into TAM as
Acceptance, C-TAM-TPB, MM, MPCU, IDT and SCT into 4 main variables, there are
Performance Expectancy, Effort Expectancy, Social Influence and Facilitating Conditions
sebagai Behavior Intention atau Use Behavior 4 moderator variables, there are Gender, Age,
Experiecne and Voluntariness of Use as factors that can influence the interest in accepting
and using the IT (Venkatesh, Thong & Xu, 2003). UTAUT is the highest exploratory model
for the adoption of technology acceptance and use behavior compared to other theories
(Indrawati, 2017).
Modification of Unified Theory of Acceptance and Use of Technology 2
UTAUT2 for technology services consist of Perfomance Expectancy, Effort Expectancy,
Social Influency, Facilitating Condinations, Hedonic Motivation, Price Value and Habbit as
the main variable as well as Age, Gender and Experience as moderate (Venkatesh, Thong &
Xu, 2012). Content is added as a variable that affects customer interest in using the
application (Indrawati, 2017).
Venkatesh, Thong & Xu (2003):
1. Performance Expectancy: “the degree to which an individual believes that using the
system will help him or her to attain gains in job performance”.
2. Effort Expectancy: “the degree of ease associated with the use of the system”.
3. Social Influence: “the degree to which an individual perceives that important other
believe he or she should use the new system”.
4. Facilitating Conditions sebagai “the degree to which an individual believes that an
organizational and technical infrastructure exists to support use of the system”.
Brown & Venkatesh (2005) in Indrawati (2017):
5. Hedonic Motivation: “the fun or pleasure derived from using a technology, and it has
been shown to play an important role in determining technology acceptance and use”.
Venkatesh, Thong & Xu (2012):
6. Price Value: one of the important differences between the use of technology by
consumers and organizations is that consumers usually bear the financial costs of use,
while employees do not.
7. Use Behavior: adoption of mobile internet in Hong Kong, Use Behavior is measured
based on the frequency of mobile internet usage.
Limayen et. al. in Venkatesh, Thong & Xu (2012):
8. Habit: “the extent to which people tend to perform behaviors automatically because of
learning”.
Heijden, Verhagen and Creemers dalam Indrawati (2017):
9. Content:“the willingness of a party to be vulnerable to the actions of another party
based on the expectation that the other will perform a particular action important to the
trustor, irrespective of the ability to monitor or control that other party”.
Ajzen (1991) in Indrawati (2017):
10. Behavior Intention: “Intentions are assumed to capture the motivational faktors that
influence a behavior: the are indications of how hard people are willing to try, of how
much of an effort they are planning to exert, in order to perform the behavior”.

Asian Journal of Management Sciences & Education Vol. 8(1) January 2019 __________________________________________________________________________________________________________________________________________________________________________________________________________________________________________________________________________________________________________________________________________________________________________________________________________________________________________________________________
ISSN: 2186-845X ISSN: 2186-8441 Print
www.ajmse. leena-luna.co.jp
Leena and Luna International, Chikusei, Japan. Copyright © 2019
(株) リナアンドルナインターナショナル, 筑西市,日本 P a g e | 86
MODEL FRAMEWORK
Figure 1. Model Framework Application AB of Card Cellular A of XYZ
HIPOTHESIS
1.
Perfor-
mance
Expec-
tancy
(PE)
H1a0: Performance Expectancy affects Behavior Intention
H1a1: Performance Expectancy not affects Behavior Intention
H1b0: Age moderates the influence of Performance Expectancy
H1b1: Age not moderates the influence of Performance Expectancy
H1c0: Gender moderates the influence of Performance Expectancy
H1c1: Gender not moderates the influence of Performance Expectancy
H1d0: Experience moderates the influence of Performance Expectancy
H1d1: Experience not moderates the influence of Performance Expectancy
..... (countinue until last variable that is Behavioral Intention (BI))
METHODS
Descriptive is study where researchers want to describe the usage characteristics of a
product and know the user's perception of a product. (Indrawati, 2017). Causal is study
where researchers want to describe one or more factors that cause problems (Bougie &
Sekaran, 2013).
A population is all groups of individuals, events or interesting things which are being
studied with predetermined quantities and characteristics, while samples are part of the
population (Bougie & Sekaran, 2013). The sampling technique used was Nonprobability
Sampling, where the sample does not have a previous probability to be selected with
Convenience Sampling, where the sample was chosen because of the right conditions,
time and place and sample size is the number of samples used in the study (Malhotra,
2013). The sample size is at least 100 to ensure and describe the characteristics (Fraenkel
and Wallen, 2012).
A questionnaire is a measuring instrument or form which consists of a series of questions
formalized to obtain information from respondents (Malhotra, 2013). Data analysis
techniques used was PLS as one of the methods of SEM and functioned as an evaluation
Asian Journal of Management Sciences & Education Vol. 8(1) January 2019 __________________________________________________________________________________________________________________________________________________________________________________________________________________________________________________________________________________________________________________________________________________________________________________________________________________________________________________________________
Copyright © 2019 Leena and Luna International, Chikusei, Japan.
87 | P a g e (株) リナアンドルナインターナショナル, 筑西市,日本
ISSN: 2186-845X ISSN: 2186-8441 Print
www.ajmse. leena-luna.co.jp
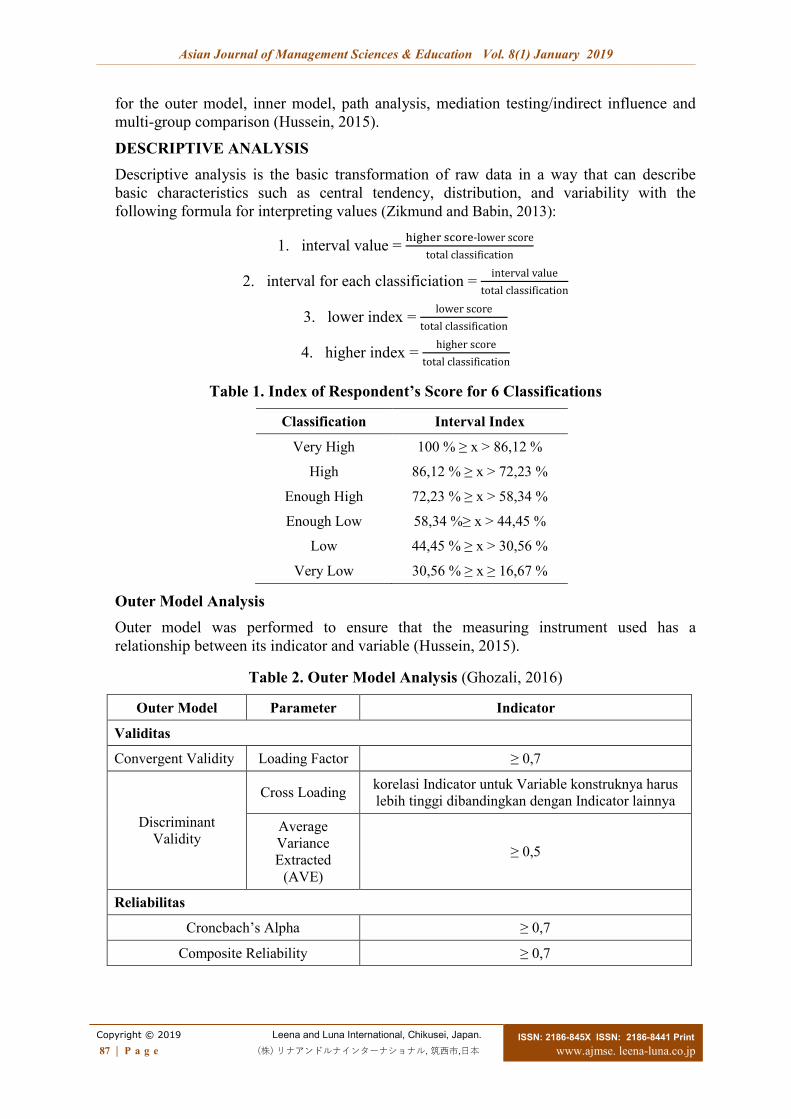
for the outer model, inner model, path analysis, mediation testing/indirect influence and
multi-group comparison (Hussein, 2015).
DESCRIPTIVE ANALYSIS
Descriptive analysis is the basic transformation of raw data in a way that can describe
basic characteristics such as central tendency, distribution, and variability with the
following formula for interpreting values (Zikmund and Babin, 2013):
1. interval value = higher score-lower score
total classification
2. interval for each classificiation = interval value
total classification
3. lower index = lower score
total classification
4. higher index = higher score
total classification
Table 1. Index of Respondent’s Score for 6 Classifications
Classification Interval Index
Very High 100 % ≥ x > 86,12 %
High 86,12 % ≥ x > 72,23 %
Enough High 72,23 % ≥ x > 58,34 %
Enough Low 58,34 %≥ x > 44,45 %
Low 44,45 % ≥ x > 30,56 %
Very Low 30,56 % ≥ x ≥ 16,67 %
Outer Model Analysis
Outer model was performed to ensure that the measuring instrument used has a
relationship between its indicator and variable (Hussein, 2015).
Table 2. Outer Model Analysis (Ghozali, 2016)
Outer Model Parameter Indicator
Validitas
Convergent Validity Loading Factor ≥ 0,7
Discriminant
Validity
Cross Loading korelasi Indicator untuk Variable konstruknya harus
lebih tinggi dibandingkan dengan Indicator lainnya
Average
Variance
Extracted
(AVE)
≥ 0,5
Reliabilitas
Croncbach’s Alpha ≥ 0,7
Composite Reliability ≥ 0,7

Asian Journal of Management Sciences & Education Vol. 8(1) January 2019 __________________________________________________________________________________________________________________________________________________________________________________________________________________________________________________________________________________________________________________________________________________________________________________________________________________________________________________________________
ISSN: 2186-845X ISSN: 2186-8441 Print
www.ajmse. leena-luna.co.jp
Leena and Luna International, Chikusei, Japan. Copyright © 2019
(株) リナアンドルナインターナショナル, 筑西市,日本 P a g e | 88
Inner Model Analysis
Inner model was performed to ensure that the structural models were robust and accurate
(Hussein, 2015).
Table 3. Inner Model Analysis (Ghozali, 2016)
Inner Model Parameter Indicator
Variance
R-Square R2
0,25 = model weak
0,50 = model moderate
0,75 = model strong
Fit Index
Goodness of Fit (GoF) =
√rata − rata Communality x rata − rata R2
*rata-rata Communality = 0,5
*rata-rata R2 untuk kondisi model:
lemah = 0,02, moderate = 0,13, kuat = 0,26
0,1 = small
0,25 = medium
0,36 = big
Significancy Based On Path Coefficient
Significant ≥ 0,1
Significancy Based On Bootstrapping
T-Value T-Statistics
H0 Accept If:
1. -T Table ≥ T
Statistics ≥ T Table
2. Probability > 0,1
H0 Reject If:
1. -T Table < T
Statistics < T Table
2. Probability < 0,1
Multi Group Analysis (MGA)
Bootstrapping Path Coefficent Original dari Bootsrapping
Comparison of path
coefficient from each
groups
MGA P-Value from MGA 1. P-Value ≤ 0,05
2. P-Value ≥ 0,95
RESULT AND ANALYSIS
This study used a sample of 200 card A customers from XYZ, both those who have used and
have not used the AB application. Data was collected and obtained based on questionnaires
distributed online and offline. Online distribution was performed with 364 private
conversations through Instagram that were incorporated in the A card community which
obtained by 60 respondents; and 1 campus email community which obtained 12 respondents,
therefore, a total of 160 respondents were obtained. Offline distribution was performed by
directly meeting the AB card customers from XYZ at the XYZ service office and 40
respondents were obtained.

Asian Journal of Management Sciences & Education Vol. 8(1) January 2019 __________________________________________________________________________________________________________________________________________________________________________________________________________________________________________________________________________________________________________________________________________________________________________________________________________________________________________________________________
Copyright © 2019 Leena and Luna International, Chikusei, Japan.
89 | P a g e (株) リナアンドルナインターナショナル, 筑西市,日本
ISSN: 2186-845X ISSN: 2186-8441 Print
www.ajmse. leena-luna.co.jp
Result of Descriptive Analysis
Table 3. Respondent’s Characteristics
Characteristics Sum Presentage
Origin
1 Jakarta 72 36,0%
2 Bogor 18 9,0%
3 Depok 14 7,0%
4 Tangerang 10 5,0%
5 Bekasi 14 7,0%
6 Jawa Barat Lainnya 72 36,0%
Age 1 Milenial (12-24 tahun) 165 82,5%
2 Bukan Milenial 35 17,5%
Gender 1 Pria 117 58,5%
2 Wanita 83 41,5%
Experience 1 Menggunakan AB 1-2 Kali/Hari 133 66,5%
2 Menggunakan AB Lebih Dari 2 Kali/Hari 67 33,5%
Table 4. Variable Index
w Variable Index (%)
1 Effort Expectancy 79,54
2 Facilitating Condition 77,38
3 Price Value 77,14
4 Social Influence 76,33
5 Hedonic Motivation 76,53
6 Perfomance Expectancy 75,10
7 Content 75,96
8 Behavior Intention 74,94
9 Use Behavior 72,67
10 Habit 71,71
The variable index from the highest to the lowest is Effort Expentacy, Facilitating
Condition, Price Value, Hedonic Motivation, Social Influence, Content, Performance
Expectancy, Behavior Intention, Use Behavior and Habit. The order of the index values
shows the most accepted adoption of AB usage by the customer in a row.
Result of Outer Model Analysis
Figure 2. Outer Model Modification of UTAUT2 for AB Application
Asian Journal of Management Sciences & Education Vol. 8(1) January 2019 __________________________________________________________________________________________________________________________________________________________________________________________________________________________________________________________________________________________________________________________________________________________________________________________________________________________________________________________________
ISSN: 2186-845X ISSN: 2186-8441 Print
www.ajmse. leena-luna.co.jp
Leena and Luna International, Chikusei, Japan. Copyright © 2019
(株) リナアンドルナインターナショナル, 筑西市,日本 P a g e | 90
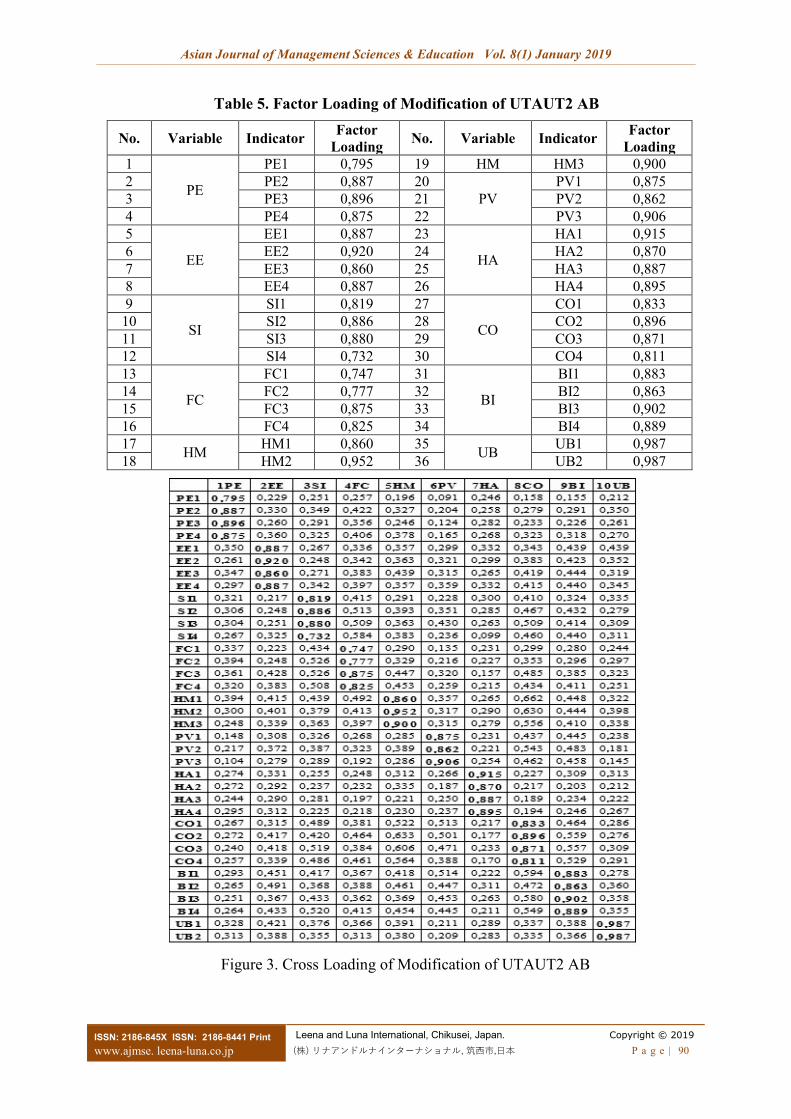
Table 5. Factor Loading of Modification of UTAUT2 AB
No. Variable Indicator Factor
Loading No. Variable Indicator
Factor
Loading
1
PE
PE1 0,795 19 HM HM3 0,900
2 PE2 0,887 20
PV
PV1 0,875
3 PE3 0,896 21 PV2 0,862
4 PE4 0,875 22 PV3 0,906
5
EE
EE1 0,887 23
HA
HA1 0,915
6 EE2 0,920 24 HA2 0,870
7 EE3 0,860 25 HA3 0,887
8 EE4 0,887 26 HA4 0,895
9
SI
SI1 0,819 27
CO
CO1 0,833
10 SI2 0,886 28 CO2 0,896
11 SI3 0,880 29 CO3 0,871
12 SI4 0,732 30 CO4 0,811
13
FC
FC1 0,747 31
BI
BI1 0,883
14 FC2 0,777 32 BI2 0,863
15 FC3 0,875 33 BI3 0,902
16 FC4 0,825 34 BI4 0,889
17 HM
HM1 0,860 35 UB
UB1 0,987
18 HM2 0,952 36 UB2 0,987
Figure 3. Cross Loading of Modification of UTAUT2 AB

Asian Journal of Management Sciences & Education Vol. 8(1) January 2019 __________________________________________________________________________________________________________________________________________________________________________________________________________________________________________________________________________________________________________________________________________________________________________________________________________________________________________________________________
Copyright © 2019 Leena and Luna International, Chikusei, Japan.
91 | P a g e (株) リナアンドルナインターナショナル, 筑西市,日本
ISSN: 2186-845X ISSN: 2186-8441 Print
www.ajmse. leena-luna.co.jp
Table 6. AVE and Croncbach’s Alpha of Modification of UTAUT2 AB
No. Variable AVE Croncbach’s Alpha No. Variable AVE Croncbach’s Alpha
1 PE 0,717 0,889 6 PV 0,811 0,856
2 EE 0,829 0,911 7 HA 0,750 0,915
3 SI 0,728 0,850 8 CO 0,779 0,875
4 FC 0,644 0,825 9 BI 0,811 0,907
5 HM 0,899 0,888 10 UB 0,968 0,973
All variables have a factor loading value of 0.7 above, AVE value of 0.5 above and bigger
cross-loading for the construct variable compared to other indicators that measure all
indicators of variables valid. All variables have Croncbach's Alpha value and composite
reliability of 0.7 and above that measure all construct variables are reliable.
Result of Outer Model Analysis
Table 7. R-Square of Modification of UTAUT2 AB
No. Variable 𝐑𝟐
𝐑𝟐
Adjusted Result
1 BI 0,577 0,487 model moderate
2 UB 0,218 0,190 model weak
Behavior Intention can be explained by the exogenous latent construct variable which
consists of 8 dependent variables, consist of PE or Performance Expectancy, EE or Effort
Expectancy, SI or Social Influence, FC or Facilitating Condition, HM or Hedonic
Motivation, PV or Price Value, HA or Habbit and CO or Content with 57.7%, while 42.3
% is explained by other variables. 8 independent variables as exogenous latent construct
variables have a moderate influence for Behavior Intention. Use Behavior can be
explained by the exogenous latent construct variable which consists of 1 dependent
variable, namely Behavior Intention with 21.8%, while 78.2% is explained by other
variables. 1 independent variable as a latent exogenous construct variable has a weak
influence for Use Behavior.
Table 8. Goodness of Fit of Modification of UTAUT2 AB
No. Variable Average
Communality 𝐑𝟐 Model
Average 𝐑𝟐
GoF Result
1 BI 0,5 0,577 weak 0,02 0,1 model small
2 UB 0,5 0,218 Weak 0,02 0,1 model small
8 independent variables as exogenous latent construct variables have a small effect with
10% on the dependent variable of Behavior Intention as an endogenous latent construct
variable. 1 independent variable as a latent exogenous construct variable has a small effect
with 10% on the dependent variable of Use Behavior as an endogenous latent construct
variable.
Table 9. Significant Path Coefficient Modification UTAUT2 AB
No. Exogenous
Variable
Endogenous
Variable Result No. Exogenous
Variable
Endogenous
Variable Result
BI UB BI UB
1 PE 0,033 - not
significant 6 PV 0,223 - significant
2 EE 0,198 - significant 7 HA -0,001 - not

Asian Journal of Management Sciences & Education Vol. 8(1) January 2019 __________________________________________________________________________________________________________________________________________________________________________________________________________________________________________________________________________________________________________________________________________________________________________________________________________________________________________________________________
ISSN: 2186-845X ISSN: 2186-8441 Print
www.ajmse. leena-luna.co.jp
Leena and Luna International, Chikusei, Japan. Copyright © 2019
(株) リナアンドルナインターナショナル, 筑西市,日本 P a g e | 92
significant
3 SI 0,191 - significant 8 CO 0,237 - significant
4 FC -
0,015 -
not
significant
5 HM 0,060 - not
significant 9 BI - 0,324 significant
Exogenous variables of CO, PV, SI and EE have a strong influence on the hypothetical
relationship on endogenous variables of BI with significant values of 0.237, 0.223, 0.198
and 0.191. Exogenous variables of PE, FC, HM and HA cannot predict the BI because the
value is < 0.1, among others 0.033, -0.015, 0.06 and -0.001. The exogenous variable BI
has a strong influence of hypothesis relationship on endogenous variables of UB with
0.324.
Table 10. T Statistics Modification UTAUT2 AB
No.
Variable T
Stat. Result No.
Variable T
Stat. Result Depen-
dent
Indepen-
dent
Depen-
dent
Indepen-
dent
1 PE
BI
0,325 not
significant 6 PV
BI
2,933 significant
2 EE 2,351 significant 7 HA 0,062 not
significant
3 SI 2,412 significant 8 CO 2,017 significant
4 FC 0,024 not
significant
5 HM 0,528 not
significant 9 BI UB 4,736 significant
Variable that have a positive influence on the behavior of individual interest in using AB
is 5, there are Effort Expentacy, Social Influence, Price Value and Content to Behavior
Intention serta Behavior Intention to Use Behavior. Variable that do not have a positive
influence on the behavior of individual interest in using AB is 4, there are Performance
Expectancy, Facilitating Condition, Hedonic Motivation and Habit to Behavior Intention.
Table 11. MGA Moderate Age of Modification of UTAUT2 AB
No. Variabel Path Coefficent Original p-
value Result
Dependent Independent 1 (milenial) 2 (bukan)
1 PE
BI
0,056 -0,081 0,130 not significant
2 EE 0,228 0,031 0,184 not significant
3 SI 0,126 0,229 0,747 not significant
4 FC 0,020 0,055 0,570 not significant
5 HM -0,033 0,442 0,968 significant
6 PV 0,172 0,514 0,957 significant
7 HA 0,054 -0,161 0,084 significant
8 CO 0,346 -0,135 0,019 not significant
9 BI UB 0,309 0,613 0,993 significant

Asian Journal of Management Sciences & Education Vol. 8(1) January 2019 __________________________________________________________________________________________________________________________________________________________________________________________________________________________________________________________________________________________________________________________________________________________________________________________________________________________________________________________________
Copyright © 2019 Leena and Luna International, Chikusei, Japan.
93 | P a g e (株) リナアンドルナインターナショナル, 筑西市,日本
ISSN: 2186-845X ISSN: 2186-8441 Print
www.ajmse. leena-luna.co.jp
Table 12. MGA Moderate Gender of Modification of UTAUT2 AB
No. Variabel Path Coefficent Original p-
value Result
Dependent Independent 1 (pria) 2 (wanita)
1 PE
BI
-0,005 0,155 0,924 significant
2 EE 0,216 0,147 0,315 not significant
3 SI 0,151 0,104 0,376 not significant
4 FC 0,002 0,039 0,588 not significant
5 HM -0,001 0,041 0,585 not significant
6 PV 0,150 0,299 0,857 not significant
7 HA 0,067 0,009 0,370 not significant
8 CO 0,365 0,196 0,200 not significant
9 BI UB 0,430 0,307 0,181 not significant
Table 13. MGA Moderat Experience Modification UTAUT2 AB
No. Variabel Path Coefficent Original p-
value Result
Dependen Independen 1 (1-2kali) 2 (3-4kali)
1 PE
BI
-0,089 -0,265 0,697 not significant
2 EE 0,305 -0,029 0,217 not significant
3 SI 0,044 -0,055 0,536 not significant
4 FC 0,031 0,302 0,918 significant
5 HM 0,026 -0,031 0,427 not significant
6 PV 0,134 0,539 0,841 not significant
7 HA 0,152 0,351 0,074 significant
8 CO 0,390 0,168 0,324 not significant
9 BI UB 0,692 0,506 0,267 not significant

Asian Journal of Management Sciences & Education Vol. 8(1) January 2019 __________________________________________________________________________________________________________________________________________________________________________________________________________________________________________________________________________________________________________________________________________________________________________________________________________________________________________________________________
ISSN: 2186-845X ISSN: 2186-8441 Print
www.ajmse. leena-luna.co.jp
Leena and Luna International, Chikusei, Japan. Copyright © 2019
(株) リナアンドルナインターナショナル, 筑西市,日本 P a g e | 94
REFERENCES
[1] Bougieand, S. (2013). Research methods for business: A skill building approach. New
York: John wiley&Sons.
[2] Fraenkel, J. R., & Wallen, N. E. (2012). How to design and evalute researche in
education. New York: Mc Graw-Hill Inc.
[3] Ghozali, I. (2016). Aplikasi analisis multivariate dengan program IBM SMARTPLS.
Semarang: Baand Penerbit Universitas Diponegoro.
[4] Hair, J. F., Ringle, C. M., & Sarstedt, M. (2011). PLS-SEM: Indeed a Silver Bullet.
Journal of Marketing Theory and Practice, 19 (2), 138-150.
[5] Harsono, L. D., & Suryana, L. A. (2014). Factors affecting the use behavior of social
media using UTAUT 2 model. Singapore: AP14Singapore Conference.
[6] Hussein, A. S. (2015). Penelitian bisnis and manajemen menggunakan partial least
quares (PLS) dengan smartPLS3.0. Semarang: Universitas Brawijaya.
[7] Indrawati. (2017). Perilaku konsumen individudalam mengadopsi layanan berbasis
teknologi informasiand komunikasi. Jakarta: RefikaAditama.
[8] Internal. (2018). Laporan internal tsel. Jakarta: PT Telekomunikasi Seluler.
[9] Kotler, P., & Keller, K. L. (2016). Marketing management. London: Pearson
Education, Inc.
[10] Malhotra, N. K. (2013). Marketing research: An applied orientation. New Jersey:
Pearson Education.
[11] Riqotunnihlah. (2014). Pengertian teknologi informasi. Retreived from
https://riqotun1289. wordpress.com/2014/10/14/teknologi-informasi/.
[12] Solomon, M. R. (2016). Consumer behavior: Buying, having, and being. New Jersey:
Pearson Prentice Hall.
[13] Srivastava, B. (2014). Smartphone APAC market forecast 2014 – 2018: 34.9%
Penetration portrays a huge opportunity for vendors and developers. Indonesia:
dazeinfo.
[14] Venkatesh, V., James, Y.L.T., & Xu, X. (2012). Consumer acceptance and use of
information technology: Extending the unified theory of acceptance and use of
technology. MIS Quarterly, 36 (1), 157-178.
[15] Venkatesh, V., Michael, G. M., Gordon, B. D., & Fred, D. D. (2003). User acceptance
of information technology: Toward a unified view. MIS Quarterly, 27 (3), 425-478.
[16] Zikmund, W. G., & Babin, B. J. (2013). Essential of marketing research. China:
South-Wester Cengage Learning.