Analysis of Carbon Nanotubes and Nanofibers on Mixed ... Ester Filters by Transmission Electron Mic...
19
DEPARTMENT OF HEALTH AND HUMAN SERVICES Centers for Disease Control and Prevention National Institute for Occupational Safety and Health NIOSH Manual of Analytical Methods (NMAM), 5th Edition Analysis of Carbon Nanotubes and Nanofibers on Mixed Cellulose Ester Filters by Transmission Electron Microscopy by M. Eileen Birch, Chen Wang, Joseph E. Fernback, H. Amy Feng, Quinn T. Birch, and Alan K. Dozier, NIOSH 1 Introduction CN- 2 2 Sample Preparation CN- 2 3 TEM Analysis and Counting Method CN- 6 4 Conclusions CN-18 5 References CN-18
Transcript of Analysis of Carbon Nanotubes and Nanofibers on Mixed ... Ester Filters by Transmission Electron Mic...

DEPARTMENT OF HEALTH AND HUMAN SERVICES Centers for Disease Control and Prevention National Institute for Occupational Safety and Health
NIOSH Manual of Analytical Methods (NMAM), 5th Edition
Analysis of Carbon Nanotubes and Nanofibers on Mixed Cellulose Ester Filters by Transmission Electron Mic
roscopy by M. Eileen Birch, Chen Wang, Joseph E. Fernback, H. Amy Feng, Quinn T. Birch, and Alan K. Dozier, NIOSH
1 Introduction CN- 2 2 Sample Preparation CN- 2 3 TEM Analysis and Counting Method CN- 6 4 Conclusions CN-18 5 References CN-18

NIOSH Manual of Analytical Methods 5th Edition Chapter CN June 2017 Page CN-2 of CN-19
Analysis of Carbon Nanotubes and Nanofibers on MCE Filters by TEM
1 Introduction A transmission electron microscopy (TEM) method for the analysis of filter samples of carbon nanotubes and nanofibers (CNT and CNF) is described in this Chapter. The approach is a modification to NIOSH NMAM 7402, asbestos by TEM [NIOSH 1994], and was applied to personal breathing zone (PBZ) and area samples collected at CNT/CNF survey sites [Birch et al. 2011; Dahm et al. 2015]. Procedures specific to asbestos fiber identification and counting were eliminated from 7402. In contrast to asbestos, CNT materials used commercially are typically in the form of complex agglomerates, with highly entangled, curved tubes. This curvature can sometimes make even individual fibers difficult to size. As such, a modified method that considers these structural differences was needed for particle classification. TEM provides visualization of airborne CNT and CNF particles, indicating their size, shape, and agglomeration state [Birch et al. 2016]. These materials have distinct features (e.g., graphene layers, cylindrical structures, and hollow cores) that distinguish them from other types of particles. Given the considerable differences between CNT/CNF particles and asbestos fibers, particle counting methods necessarily differ. In the case of CNT/CNF, all particles, agglomerates as well as single fibers, are counted as a CNT/CNF ‘structure.’ Unlike Method 7402, no minimum size cutoffs have been used to date because of a lack of knowledge on lung deposition and toxicological endpoints. Based on the number of CNT/CNF structures counted, and the collected air volume, a CNT/CNF concentration (i.e., structures/cm3) can be calculated. For samples collected at the survey sites, a significant positive correlation between structure counts and elemental carbon (EC) data was found, but there was considerable scatter in the data [Dahm et al. 2013, Dahm et al. 2015]. Given the method limitations discussed herein, the calculated values for structure counts are considered semi-quantitative indicators of air concentration.
2 Sample preparation For the field surveys on CNT/CNF, open-face, 25-mm, three-piece cassettes were used for air sampling, approximating the inhalable fraction [Dahm et al. 2013, Dahm et al. 2015]. As specified in NMAM 7402, air samples were collected on mixed cellulose ester (MCE) filters having a nominal pore size of 0.8 µm (7402 specifies 0.45 to 1.2 µm), with sampling pumps operated at 5 L/min (0.5 to 16 L/min specified in 7402). Polycarbonate (PC) membrane filters also may be acceptable, but this media was not used in the field studies, and the filter preparation method differs from that described herein.

NIOSH Manual of Analytical Methods 5th Edition Chapter CN June 2017 Page CN-3 of CN-19
Analysis of Carbon Nanotubes and Nanofibers on MCE Filters by TEM
The sampling period depends on the air concentration, and it is important to avoid filter overload. Some trial and error may be necessary. In general, if a filter deposit is clearly visible, the sample is likely overloaded. An estimate of structure counts may still be possible, but overloading results in particle deposition on previously deposited material and may preclude an accurate structure count.
Three TEM grids per field sample, and one grid each for field and media blanks (when provided), were prepared using procedures outlined in NMAM 7402, with the following modifications: A scalpel is used to remove a wedge-shaped portion from the filter. Do not use a cork
borer to remove filter sections. Only one sample wedge should be placed on each slide. Do not affix the section to the
slide with any type or adhesive, as specified in 7402. (Note: After carbon coating the wedge and removing small portions for transfer to TEM grids, the remaining portion can be secured [e.g., with tape] to the slide for long term storage, if desired.) The “hot block” technique [Baron and Pickford 1986] is used to clear (collapse) the
filter wedge. Other methods also may be suitable. A description of the procedures used for sample and grid preparation is provided in the following three sections.
a. Filter Carefully open the sampling cassette with a cassette opener, with the particle collection side facing upwards (Figure 1, step 1). Remove about one fourth of the 25-mm MCE filter with a clean scalpel. Place the wedge, particle side up, on a frosted glass microscope slide labelled with the sequence and sample numbers (Figure 1, step 2). Include a media (filter) blank with each set of slides to be coated. Use the “hot block” technique [Baron and Pickford 1986] to clear (collapse) the filter wedge (Figure 1, step 3). After clearing the filter, place the slides in a carbon coater to apply a thin carbon film (Figure 1, step 4); the filter surface should be evenly coated. After coating the filter wedges, the samples are ready for transfer to TEM grids. A Jaffe wick washer [Jaffe 1948] is used for final processing of the sample grids. Preparation of the washer and transfer of the sample sections to grids therein, for final processing, are described in the next two sections.

NIOSH Manual of Analytical Methods 5th Edition Chapter CN June 2017 Page CN-4 of CN-19
Analysis of Carbon Nanotubes and Nanofibers on MCE Filters by TEM
Figure 1. Filter preparation steps prior to loading sample portions on TEM grids: (1) remove 25-mm MCE filter from air sampling cassette; (2) remove about one fourth of the filter and place the filter wedge on a glass slide; (3) clear the MCE filter with acetone vapor in a hot block; (4) apply carbon coating; (5) cut section from coated filter and divide into three portions, one per grid. Each filter portion has particles sandwiched between the carbon film and collapsed filter. b. Jaffe Wick washer Prepare a Jaffe wick washer using a petri dish (15-mm depth recommended, but other sizes may be suitable), stainless steel screen (20 mesh), and lens tissue (Figure 2, a) or a stainless steel screen disk (40 mesh) (Figure 2, b) as a wicking substrate (one disk per sample). Bend two edges of the 20-mesh screen to form a platform (Figure 2) that fits inside the petri dish and is no higher than half the dish height. The platform supports the tissue (Figure 2, a) or stainless disk (Figure 2, b) onto which the sample grids are placed and keeps them above the solvent level during sample processing (Figure 2).

NIOSH Manual of Analytical Methods 5th Edition Chapter CN June 2017 Page CN-5 of CN-19
Analysis of Carbon Nanotubes and Nanofibers on MCE Filters by TEM
Figure 2. Sample transfer and final processing: place a piece of lens tissue (a) or a stainless steel screen disk (b) on a stainless screen platform in a Jaffe wick washer filled with dimethylformamide (DMF). Sides of the platform are bent to keep sample grids above the solvent level. Depending on size, multiple disks can be used to hold grids. Use a pencil to label the lens tissue with the sample identifiers and place the tissue on the 20-mesh screen platform (Figure 2, a). The samples placed on the tissue should be the same set that was coated (together) in the carbon coater. Place the petri dish in a fume hood and carefully add dimethylformamide (DMF) to the dish until the lens tissue is saturated or screen disks are wetted, but ensure that no puddles form on surfaces of the tissue or disk. A combination of DMF and acetone also may be used for filter dissolution. (Note!: DMF [CAS 68-12-2] is flammable and hazardous in case of skin contact, eye contact, ingestion, and inhalation. Ensure adequate ventilation, proper personal protective equipment, and engineering controls in handling and storage. Consult SDS prior to use.) In a row, place three TEM grids per sample in the designated areas of the tissue or on a disk (Figure 2). If screen disks are used, place three TEM grids per sample on each (Figure 2, b). Depending on disk size, multiple disks can be used. Use one TEM grid each for the blanks (field and media). c. Sample transfer and final processing Using a scalpel and tweezers, cut and remove three small sections of the coated filter wedge as shown in Figure 1, step 5, starting at the center area (bottom left of wedge) of the filter and moving outward, across the bottom, towards the filter edge. The area of the cut sections should be similar and enough to cover a grid. Carbon side up, carefully place the excised filter sections on the three grids. If lens tissue is used,

NIOSH Manual of Analytical Methods 5th Edition Chapter CN June 2017 Page CN-6 of CN-19
Analysis of Carbon Nanotubes and Nanofibers on MCE Filters by TEM
place the section from the center of the filter (Figure1, Step 5, A) on the leftmost grid, the middle section (Figure1, Step 5, B) on the center grid, and the outermost section (Figure1, Step 5, C) on the rightmost grid. The locations are labeled as shown in Figure 1, step 5. When all filter sections have been transferred to the grids, slowly add more solvent to raise the level as high as possible without disturbing the sample preparations. Cover the petri dish, if lens tissue is used, and elevate one side of the dish by placing a microscope slide under it (allowing drops of condensed solvent to form near the edge of the cover rather than in the center, where they can drip on the grid preparation). To dissolve the filter, the tissue method requires the grids to sit overnight, while the screen disk method requires only about 30 minutes. If screen disks are used, leave the petri dish uncovered, in a fume hood or other well ventilated area. Once the residual MCE polymer is completely dissolved in the solvent, only particles embedded in the carbon film remain on the grid, as illustrated in Figure 3. Ensure that the processed grids are solvent free prior to the TEM analysis.
Figure 3. Removal of residual MCE polymer from carbon-coated sample by dimethylformamide (DMF). After polymer removal, only particles embedded in the carbon film remain on the grid.
3a. Sample quality . TEM analysis and counting method
Align the microscope for TEM applications following the manufacturer’s instructions. Load the sample into a TEM grid holder and insert the holder into the TEM column. First, examine the grid at low magnification (500-1,000X) to determine the filter loading and preparation quality. In general, to be acceptable for analysis, the grid should have at least 75% intact grid openings and a particle loading less than about 25% (area coverage).

NIOSH Manual of Analytical Methods 5th Edition Chapter CN June 2017 Page CN-7 of CN-19
Analysis of Carbon Nanotubes and Nanofibers on MCE Filters by TEM
If these criteria are met, randomly select at least four openings (with intact carbon film) from four quadrants of the grid and estimate the number of particles per opening to determine the distribution variability. If the particle loading is uneven or heavy, the sample might not be useful. Discuss any uneven distributions or loading issues with the requestor of the analysis. b. Definition of a CNT/CNF structure Count all particles that meet the following definition of a CNT structure:
Any CNT or CNF individual fiber (Figure 4) with an aspect ratio (i.e., length to width) greater than 3:1. There are no minimum length or diameter cutoffs. If a fiber structure has the morphological characteristics of CNT/CNF and meets the 3:1 aspect ratio criterion, it is counted. In our work, isolated CNT fiber or bundle structures were relatively rare. CNT agglomerates were far more common.
Figure 4. Examples of CNT fiber structures with various lengths and widths.

NIOSH Manual of Analytical Methods 5th Edition Chapter CN June 2017 Page CN-8 of CN-19
Analysis of Carbon Nanotubes and Nanofibers on MCE Filters by TEM
Any particle agglomerate with associated CNT/CNF: There are many types of
structures that fit this criterion. Some structures, classified as matrix particles, contain relatively few CNT/CNF, being mainly amorphous carbon or other components. In contrast, structures that consist mainly of CNT/CNF are classified as cluster particles.
In this chapter, ‘agglomerate’ refers to both cluster (Figure 5) and matrix (Figure 6) particles. Although matrix particles have associated CNT, they are often observed as fiber structures protruding from the particle edge. The structure of the CNT, presumably within the matrix, cannot be determined in the TEM analysis. Another classification problem occurs when agglomerates have cluster and matrix regions (Figure 7) of similar size. Structure counts are discussed in the next section.
Figure 5. Examples of CNT/CNF clusters: (a)-(f) collected from workplaces.

NIOSH Manual of Analytical Methods 5th Edition Chapter CN June 2017 Page CN-9 of CN-19
Analysis of Carbon Nanotubes and Nanofibers on MCE Filters by TEM
Figure 6. Examples of CNT matrix particles: (a)-(d) collected from workplaces. There are specific definitions of CNT and CNF; however, field samples have contained complex mixtures of structures that often do not fit these narrow definitions. For example, products described as CNT can contain CNF and vice versa, and a variety of irregularly shaped, nanoscale carbon particles have been observed. In practice, if the analytical request specifies a ‘CNT’ or ‘CNF’ facility, these terms are used in the analytical report, along with the corresponding TEM images. In addition, images and information on other types of particles are provided.

NIOSH Manual of Analytical Methods 5th Edition Chapter CN June 2017 Page CN-10 of CN-19
Analysis of Carbon Nanotubes and Nanofibers on MCE Filters by TEM
c. Structure counts The counting method for individual fibrous structures generally follows that for asbestos, as in NMAM 7402 and EPA’s AHERA (Asbestos Hazard Emergency Response Act) method [40 CFR 763; NIOSH 1994]. That is, each fiber with an aspect ratio > 3:1 is counted and the diameter and length are recorded. At a minimum, the diameter and length ranges are recorded, and averages are determined, if appropriate. This procedure is negotiable with the requestor. As mentioned, in the field samples, isolated CNT fibers were rare relative to particle agglomerates. The classification of CNT/CNF agglomerates is accomplished by considering both particle size and structure. The size bin depends on the maximum crosswise dimension. At least one dimension, the maximum crosswise length, is recorded for each structure. Other characteristics also can be examined to meet investigator needs. Some agglomerates, especially larger ones, may contain a non-CNT/CNF component. In these instances, if the agglomerate looks to be mostly CNT/CNF, it is classified as a cluster. If non-CNT/CNF components appear more abundant, the matrix classification is used. However, as discussed, some agglomerates may have roughly equal cluster and matrix portions. For these, a matrix category is usually assigned but this classification is somewhat arbitrary. Given the difficulties of particle classification, it is important to provide representative images of all particles in the sample. If the particle loading and distribution are acceptable, an initial particle count can be performed at low magnification. Select the lowest magnification that shows the majority of the particulate of interest: 5,000-15,000X is usually sufficient. Smaller particles may not be visible at low magnification, but the purpose of this step is to assess the number of grid openings likely to be counted. If the sample composition is known (e.g., a laboratory generated CNT or CNF sample), an initial count can be made to count larger (micrometer sized) CNT (CNF) particles, which dominate the particle mass. After examination of the sample at low magnification, a switch to high magnification (e.g., 40,000X) is made to image particles/features not observable at low magnification. The magnification should be adjusted as required for counting and confirming the presence of CNT. As discussed, for the analysis, three 3-mm copper TEM grids are usually prepared from each sample. A total of 40 openings (stop counting at 100 structures) are examined at high magnification (13-15 openings for each grid). The number of grid openings counted per grid should be approximately equal for the three grid preparations, and the openings counted on each grid should be selected as randomly as possible. Only grid openings that have the carbon film intact should be counted. Any particles containing CNT/CNF are counted as CNT or CNF structures, which can range from single fibers (Figure 4) to structures of varying size and composition (Figs. 5-9). Counted CNT/CNF structures are categorized by size-bins based on the
NIOSH Manual of Analytical Methods 5th Edition Chapter CN June 2017 Page CN-11 of CN-19
Analysis of Carbon Nanotubes and Nanofibers on MCE Filters by TEM
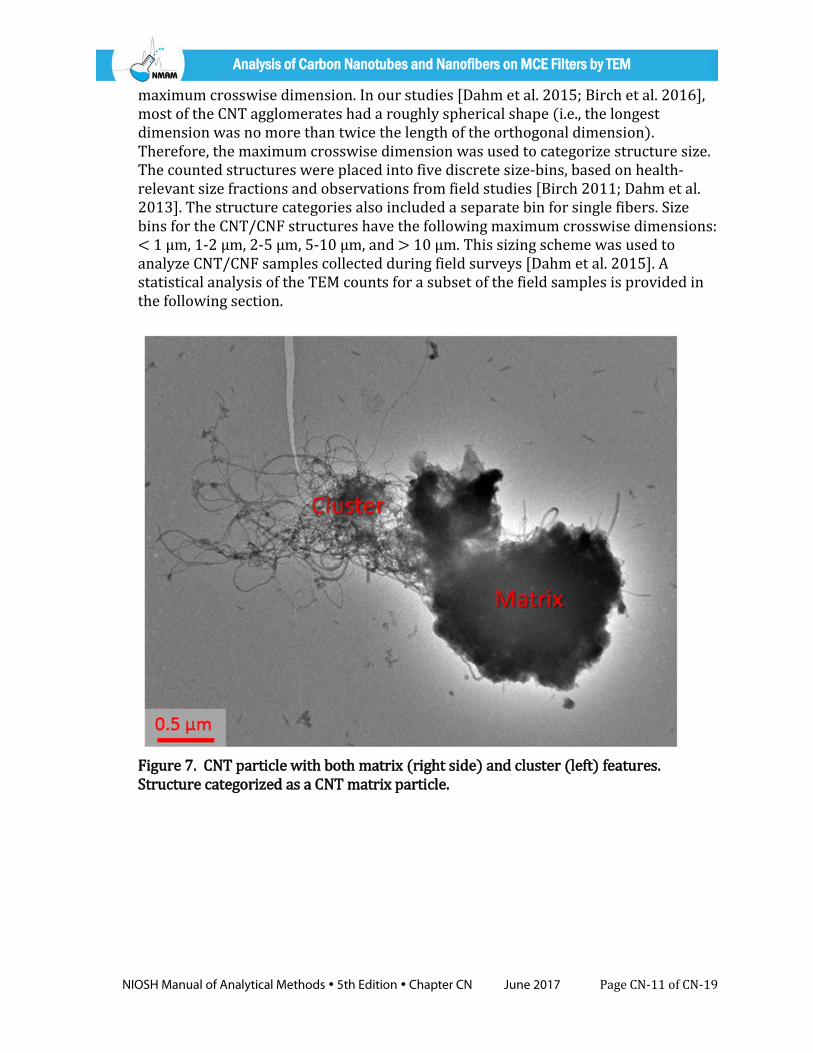
maximum crosswise dimension. In our studies [Dahm et al. 2015; Birch et al. 2016], most of the CNT agglomerates had a roughly spherical shape (i.e., the longest dimension was no more than twice the length of the orthogonal dimension). Therefore, the maximum crosswise dimension was used to categorize structure size. The counted structures were placed into five discrete size-bins, based on health-relevant size fractions and observations from field studies [Birch 2011; Dahm et al. 2013]. The structure categories also included a separate bin for single fibers. Size bins for the CNT/CNF structures have the following maximum crosswise dimensions: < 1 µm, 1-2 µm, 2-5 µm, 5-10 µm, and > 10 µm. This sizing scheme was used to analyze CNT/CNF samples collected during field surveys [Dahm et al. 2015]. A statistical analysis of the TEM counts for a subset of the field samples is provided in the following section.
Figure 7. CNT particle with both matrix (right side) and cluster (left) features. Structure categorized as a CNT matrix particle.

NIOSH Manual of Analytical Methods 5th Edition Chapter CN June 2017 Page CN-12 of CN-19
Analysis of Carbon Nanotubes and Nanofibers on MCE Filters by TEM
Figure 8. CNT particles in personal breathing zone samples collected from various sites: (a) MWCNT fiber (polymer composite site), b) SWCNT agglomerate from aerosolized, aqueous suspension (electronics site), c) MWCNT agglomerate (composites/thermoplastics site), and d) MWCNT agglomerate (primary manufacturer of CNT).

NIOSH Manual of Analytical Methods 5th Edition Chapter CN June 2017 Page CN-13 of CN-19
Analysis of Carbon Nanotubes and Nanofibers on MCE Filters by TEM
Figure 9. Examples of CNT particles embedded in polymer composite: (a)-(d). d. Statistics A total of 3000 observations (structures/opening) from 75 field samples with light loading (<5 structures per grid opening) were analyzed. The mean, standard deviation, and confidence intervals (95% confidence level) were calculated. Factors considered included grid (1-3), opening (1-14), and loading level (1-3). Grids were counted in the order of grid 1, 2, and then 3, going from the center to the edge of the filter (wedge portion). From Figure 10 and Table 1, the means and variabilities of counts from different loading levels follow the same trend. The variability of grid 1 (from center area of filter) was slightly higher than the other 2 grids. The variability becomes smaller when the loading level is increased. The box plot in Figure 11 shows the statistics of counts by openings. The means and variabilities of counts from opening 1 and 2 were slightly higher than counts from opening 12, 13 and 14. Because opening 1 was the first opening counted, and 14 the last, it is possible that

NIOSH Manual of Analytical Methods 5th Edition Chapter CN June 2017 Page CN-14 of CN-19
Analysis of Carbon Nanotubes and Nanofibers on MCE Filters by TEM
the increased variability is due to higher analyst error during the initial and final counts. The test of half data (including openings 1-7) shows similar behavior as that for all data (Figure 12). Based on the results for this sample set, counts from one or two grids, with 7 openings per grid, may be adequate if the deposit is even. Larger data sets from samples with different loadings and collected from various sites are required to develop a statistical model for further analysis.
Figure 10. Boxplot of CNT counts by categorized loading (1: mean ≤ 1, 2: 1 < mean ≤ 2, and 3: mean > 2) from three grids. The trend of mean counts from grid 1 to 3 is consistent for different loading levels. Mean count of grid 1 is slightly higher than those of grid 2 and 3.

NIOSH Manual of Analytical Methods 5th Edition Chapter CN June 2017 Page CN-15 of CN-19
Analysis of Carbon Nanotubes and Nanofibers on MCE Filters by TEM
Table 1. Statistics of sample counts obtained from different grids and loading levels (M=Mean, SD=Standard Deviation, CI=Confidence Intervals). Loadinga
Grid 1b Grid 2 b Grid 3 b
M (SD) 95% CI M (SD) 95% CI M (SD) 95% CI
Level 1 0.51 (0.84) [0.44, 0.58] 0.44 (0.64) [0.38, 0.49] 0.43 (0.66) [0.37, 0.49]
Level 2 1.45 (1.12) [1.29, 1.60] 1.33 (0.91) [1.21, 1.46] 1.35 (0.90) [1.23, 1.48]
Level 3 2.65 (1.32) [2.50, 2.80] 2.64 (1.10) [2.51, 2.77] 2.55 (1.07) [2.43, 2.68]
All 1.33 (1.41) [1.24, 1.41] 1.26 (1.28) [1.18, 1.34] 1.24 (1.25) [1.16, 1.32] a Loading levels are defined by M, where Level 1 (M ≤ 1), Level 2 (1 < M ≤ 2) and Level 3 (M > 2). b Grids collected from different locations on a filter wedge (center to edge).
Figure 11. Boxplot of CNT counts by openings (1-14). The variability in openings 1 and 2 significantly higher than that of openings 13 and 14. The means of openings 1, 2 and 3 were also higher than the means of openings 12, 13, and 14.

NIOSH Manual of Analytical Methods 5th Edition Chapter CN June 2017 Page CN-16 of CN-19
Analysis of Carbon Nanotubes and Nanofibers on MCE Filters by TEM
Figure 12. Boxplot of CNT counts by grids (1-3) from all data (counts from openings1-14) and half data (counts from openings 1-7).

NIOSH Manual of Analytical Methods 5th Edition Chapter CN June 2017 Page CN-17 of CN-19
Analysis of Carbon Nanotubes and Nanofibers on MCE Filters by TEM
e. Limit of detection (LOD)For the field samples [Dahm et al. 2015], the ‘no structures detected’ TEM samples were those with counts below the LOD, defined as 1 CNT or CNF structure per sample. The corresponding unit of structures per cm3 LOD (air concentration) was then calculated (by the requestor) based on the total air volume sampled.
f. CNT/CNF polymer compositesDusts generated from CNT/CNF polymer composites that have been mechanically worked (e.g., drilled, cut, sanded, blasted, etc.) contain particles with CNT/CNF embedded in the polymer matrix. Our analyses of polymer composite dusts have shown little evidence of individual fiber release from the composite matrix, but respirable sized matrix particles with protruding CNT/CNF have been observed (Figure 9). These findings are consistent with other reports [Bello et al. 2012; Kingston et al. 2014] on potential CNT/CNF release from polymer matrices. Particle counts for these types of samples also can be performed, though only a limited number of surveys have been conducted. Because the CNT/CNF are embedded in a polymer matrix, the toxicity of these dusts may differ substantially from dusts with free (unbound) agglomerates. Nevertheless, representative images of the particles and information on particle shape and size can be documented.
g. LimitationsThe composition of CNT powders varies substantially, especially those produced or used in workplaces. These materials contain varying amounts of amorphous carbon and residual catalyst metals, and there are many types of structures, usually in agglomerate form. As mentioned, in the case of composite dusts, CNT are embedded in a polymer matrix, which complicates their measurement. This chapter concerns the analysis of CNT powders.
In the case of ‘matrix’ particles, TEM images show mainly dark regions, with varying amounts of CNT observed at the particle’s edge. The composition of material in the dark regions is unknown. For example, it may be mainly CNT, amorphous carbon, or a combination of both. Thus, based on overall envelope size, a particle consisting mainly of amorphous carbon is counted in the same bin as an agglomerate composed mainly of CNT. Both matrix and cluster (structures with mainly CNT) type particles were common in field samples. A different counting method [Chen et al. 2012] was applied to a specific type of MWCNT (Mitsui MWCNT-7) used in an animal inhalation study but this particular product, having a more fibrous structure and more single fibers, differs from the CNT materials manufactured/used by U.S. companies. Images (Figs. 4-9) of the different particle types found in our field surveys make obvious the difficulty in developing a standardized TEM structure count method for these materials.

NIOSH Manual of Analytical Methods 5th Edition Chapter CN June 2017 Page CN-18 of CN-19
Analysis of Carbon Nanotubes and Nanofibers on MCE Filters by TEM
4. ConclusionsThe complexity and variety of structures makes CNT/CNF particle counting a challenge. Unlike elemental carbon or other less selective measures, TEM can confirm the presence of CNT. However, with respect to quantification, it is important to recognize the limitations of a counting method. Because of the heterogeneity of CNT powders, particles in the same size bin can vary greatly in their properties. Complex structures of varying mass, density, shape, and composition (e.g., amorphous carbon, residual catalyst) can fall into the same size bin. And dissimilar particles (e.g., cluster and matrix) in a given bin may have different toxicological effects. Thus, even for a given material, particle envelope size alone may not be an adequate risk indicator. Given the heterogeneity and variety of the CNT/CNF products to which workers are exposed, it is important to apply several methods to assess worker exposure, through inhalation and other routes.
Disclaimer
Mention of any company or product does not constitute endorsement by NIOSH. In addition, citations to websites external to NIOSH do not constitute NIOSH endorsement of the sponsoring organizations or their programs or products. Furthermore, NIOSH is not responsible for the content of these websites. All web addresses referenced in this document were accessible as of the publication date.
5. ReferencesBaron PA, Pickford GC[1986]. An Asbestos Sample Filter Clearing Procedure. Appl Ind Hyg 1(4):169-171.
Bello D, Wardle BL, Yamamoto N, deVilloria RG, Hallock M[2011]. Exposures to nanoscale particles and fibers during handling, processing, and machining of nanocomposites and nanoengineered composites reinforced with aligned carbon nanotubes. Proceedings of the 17th International conference on composite materials (ICCM), Edinburgh, Scotland, July 27–31, 2011.
Birch ME [2011]. Exposure and emissions monitoring during carbon nanofiber production—Part II: Polycyclic Aromatic Hydrocarbons. Ann Occup Hyg 55(9):1037-1047.
Birch ME, Ruda-Eberenz TA, Chai M, Andrews R, Hatfield RL [2013]. Properties that Influence the Specific Surface Areas of Carbon Nanotubes and Nanofibers. Ann Occup Hyg 57(9):1148-1166.
Birch ME, Wang C, Fernback JE, Feng HA, Birch QT, Dozier AK [2016]. Workplace Monitoring of Airborne Carbon Nanomaterials by HRTEM. Microsc Microanal 22(S3): 1910-1911.

NIOSH Manual of Analytical Methods 5th Edition Chapter CN June 2017 Page CN-19 of CN-19
Analysis of Carbon Nanotubes and Nanofibers on MCE Filters by TEM
Chen BT, Schwegler-Berry D, McKinney W, Stone S, Cumpston JL, Friend S, Porter DW, Castranova V, Frazer DG [2012]. Multi-walled Carbon Nanotubes: Sampling Criteria and Aerosol Characterization. Inhalation Toxicology 24(12):798–820.
CFR. Code of Federal Regulations. Washington, DC: U.S. Government Printing Office, Office of the Federal Register.
Dahm MM, Evans DE, Schubauer-Berigan MK, Birch ME, Fernback JE [2012]. Occupational Exposure Assessment in Carbon Nanotube and Nanofiber Primary and Secondary Manufacturers. Ann Occup Hyg 56(5):542-556.
Dahm MM, Evans DE, Schubauer-Berigan MK, Birch ME, Deddens JA [2013]. Occupational Exposure Assessment in Carbon Nanotube and Nanofiber Primary and Secondary Manufacturers: Mobile Direct-Reading Sampling. Ann Occup Hyg 57(3):328-344.
Dahm MM, Schubauer-Berigan MK, Evans DE, Birch ME, Fernback JE, Deddens JA [2015]. Carbon Nanotube and Nanofiber Exposure Assessments: An Analysis of 14 Site Visits. Ann Occup Hyg 59(6):705-723.
Jaffe MS [1948]. Handling and washing of fragile replicas. J. Appl. Physics 19:1189-1191.
Kingston C, Zepp R, Andradyc A, Boverhofd D, Fehire R, Hawkins D, Roberts J, Sayreg P, Shelton B, Sultani Y, Vejinsj V, Wohlleben W [2014], Release Characteristics of Selected Carbon Nanotube Polymer Composites. Carbon 68:33-57.
NIOSH [1994]. Method 7402 asbestos by TEM. In: Eller PM, Cassinelli ME, eds. NIOSH Manual of Analytical Methods. 4th ed. Cincinnati, OH: U.S. Department of Health and Human Services, Centers for Disease Control and Prevention, National Institute for Occupational Safety and Health, DHHS (NIOSH) Publication No. 94-113 [www.cdc.gov/niosh/nmam/].