ANALYSIS OF A FLASHOVER OPERATION ON TWO … of a Flashover... · ANALYSIS OF A FLASHOVER OPERATION...
17
ANALYSIS OF A FLASHOVER OPERATION ON TWO 138KV TRANSMISSION LINES Authors: Joe Perez, P.E.: SynchroGrid, College Station, Texas Hung Ming Chou, SynchroGrid, College Station, Texas Mike McMillan, Bryan Texas Utilities, Bryan, Texas Stephen Copeland, Bryan Texas Utilities, Bryan, Texas Presented before the 67th Annual Texas A&M Protective Relay Conference College Station, Texas March 31st – April 3rd, 2014
Transcript of ANALYSIS OF A FLASHOVER OPERATION ON TWO … of a Flashover... · ANALYSIS OF A FLASHOVER OPERATION...

ANALYSIS OF A FLASHOVER OPERATION
ON TWO 138KV TRANSMISSION LINES
Authors:
Joe Perez, P.E.: SynchroGrid, College Station, Texas
Hung Ming Chou, SynchroGrid, College Station, Texas
Mike McMillan, Bryan Texas Utilities, Bryan, Texas
Stephen Copeland, Bryan Texas Utilities, Bryan, Texas
Presented before the
67th Annual
Texas A&M Protective Relay Conference
College Station, Texas
March 31st – April 3rd, 2014

ANALYSIS OF A FLASHOVER OPERATION ON TWO
138KV TRANSMISSION LINES
Mike McMillan, Bryan Texas Utilities, Bryan, Texas, [email protected]
Stephen Copeland, Bryan Texas Utilities, Bryan, Texas, [email protected]
Joe Perez P.E., SynchroGrid, College Station, Texas [email protected]
Hung Ming Chou, SynchroGrid, College Station, Texas
Introduction:
Flashover operations due to a change in the physical positioning of a foreign object with an
energized conductor are a common occurrence seen throughout many transmission and
distribution systems. The inception of a fault from a flashover between two stationary
conductors, however, is not as prevalent. This is primarily due to extensive protection system
coordination and insulation design specifications that, under anticipated fault conditions, will
allow the necessary protection devices to operate, thereby clearing the fault. For Bryan Texas
Utilities during the summer of 2013, a particular flashover operation brought about a series of
atypical events, which resulted in several operations involving two 138kV transmission lines as
well as portions of the 12.5kV distribution system. As presented in the following analysis, it is
evident that, while the fault conditions experienced by the system were not within anticipated
limits, there are some steps that can be taken to mitigate future operations of this nature.
Sequence of Events:
The operations, which took place during this fault event, originated on the 12.5kV distribution
system at Substation B with the failure of a lightning arrester, as shown below in Figure 1. This
resulted in a B phase-to-ground fault, which was cleared by the faulted feeder’s breaker.
Substation BSubstation A Substation C
XFMR
134k ∆ -13.2k Y∆Y
3.7 miles 2.4 miles
Circuit Breaker Position
Closed
Open
Figure 1: Normal Configuration of Affected Equipment
During the time required to trip the affected feeder breaker, the 138kV transmission line
protection at both Substation A and Substation B recognized a fault within their zone of
protection and initiated a trip, which opened all four of the breakers protecting the faulted
transmission line, as shown in Figure 2.
Substation BSubstation A Substation C
XFMR
134k ∆ -13.2k Y∆Y
3.7 miles 2.4 miles
Circuit Breaker Position
Closed
Open
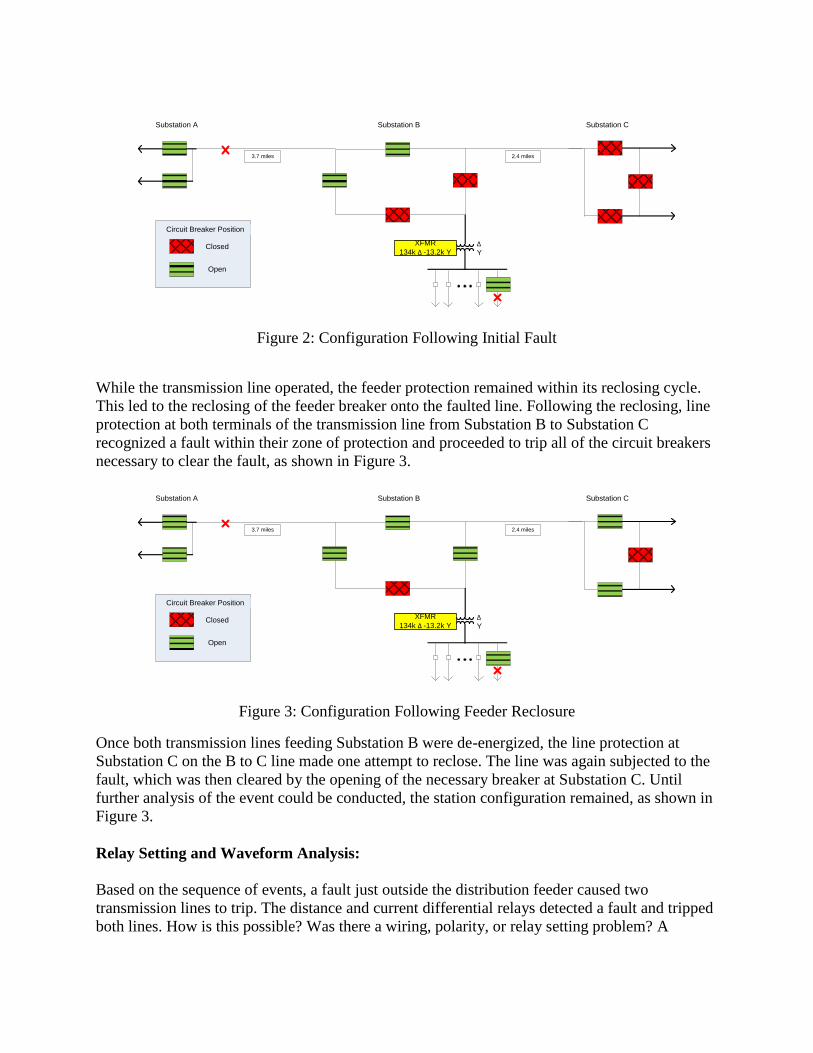
Figure 2: Configuration Following Initial Fault
While the transmission line operated, the feeder protection remained within its reclosing cycle.
This led to the reclosing of the feeder breaker onto the faulted line. Following the reclosing, line
protection at both terminals of the transmission line from Substation B to Substation C
recognized a fault within their zone of protection and proceeded to trip all of the circuit breakers
necessary to clear the fault, as shown in Figure 3.
Substation BSubstation A Substation C
XFMR
134k ∆ -13.2k Y∆Y
3.7 miles 2.4 miles
Circuit Breaker Position
Closed
Open
Figure 3: Configuration Following Feeder Reclosure
Once both transmission lines feeding Substation B were de-energized, the line protection at
Substation C on the B to C line made one attempt to reclose. The line was again subjected to the
fault, which was then cleared by the opening of the necessary breaker at Substation C. Until
further analysis of the event could be conducted, the station configuration remained, as shown in
Figure 3.
Relay Setting and Waveform Analysis:
Based on the sequence of events, a fault just outside the distribution feeder caused two
transmission lines to trip. The distance and current differential relays detected a fault and tripped
both lines. How is this possible? Was there a wiring, polarity, or relay setting problem? A

fundamental principle of waveform analysis is to verify the proper operation of relay design and
relay settings to see if they operated as intended. We will do this in the next section.
Distribution Feeder Fault:
351S Relay Settings and Waveform Analysis: The faulted feeder is protected by a 351S
overcurrent relay. This relay has instantaneous and time delay phase and ground overcurrent
protection.
According to the relay record shown in Figure 4, the failure of the lightning arrester caused a B-
G fault, but the fault then evolved into a B-C-G fault. Approximately 16 cycles after the fault
inception, the fault was isolated by the phase time overcurrent 51P1T element. Figure 4: Feeder
Fault shows when the 51P1T finally asserted and tripped the breaker. The breaker contacts
extinguished the currents about 2.88 cycles after the trip. At that point, the distribution relay
operated as intended. However, there was nothing here that provided more clues to help us
understand why the two transmission lines tripped. Let’s now see what the transmission relays
detected.
Figure 4: Feeder Fault
Substation A – Substation B 138kV Transmission Line Fault:
About 1/3 cycle after the 351 issued a trip signal, the 421 relay at Substation A saw a C-G fault
in the forward direction approximately 2.7 miles from Substation A. The relay detected a Z1G
and Z2G fault. Z2G did not time out, but Z1G issued an instantaneous trip and opened its
respective breakers instantaneously. The waveform behavior is shown in Figure 5.

Figure 5: 421 Fault Record at Substation A
At Substation B, its 421 relay also detected a line to ground fault in the forward direction
approximately 1.73 miles from Substation B towards Substation A. The relay triggered on Z1G
and Z2G. Z2G did not time out, but Z1G issued a trip and opened its respective breakers
instantaneously. This is shown in Figure 6. The relay definitely had issues detecting the distance
to fault with its fault locator algorithm. The total length of the line is about 3.7 miles, but the
fault locators gave distances that did not add up. The 421 at Substation A saw the fault at 2.7
miles, which would put the fault location from Substation B at approximately 1.0 mile. However,
the 421 at Substation B saw the fault at 1.73 miles. Therefore, the fault location distances cannot
be trusted.
Figure 6: 421 Fault Record at Substation B

In addition, the SEL-311L line differentials at Substation A and Substation B also detected a C-G
fault and issued a 87L trip signal. The fault is confirmed as internal by looking at the waveform
and vector behavior, as shown in Figure 7. Notice that local and remote A-phase currents are 180
degrees apart, as are B-phase vectors. However, the local and remote C-phase vectors seem to
be in-phase, meaning that the vectors are in the same direction and therefore indicating an
internal fault.
Figure 7: Substation A and B 311L Fault Record
All the data collected and analyzed for this line seem to indicate that the fault on the Substation
B to Substation A line was internal. The 421 saw a Z1G fault, and the 311L saw an 87LC fault.
The vector diagrams prove that the currents were in the internal direction towards the fault. The
challenge again is why the relays would trip for a fault on the distribution feeder. As mentioned
earlier, one can start putting together several different hypotheses, such as wiring polarity errors, but these are verified during pre-fault conditions confirming correct wiring.
Since both relays observed the fault as internal to the line for a distribution fault, it created an
important puzzle to this interesting case. The transmission system protection is not supposed to
trip for faults on the distribution system. Distance relays using Zones 1 and 2 cannot see faults on
the distribution system because the distribution transformer impedance is large enough to prevent
any distance relays from seeing beyond the transformer. In some cases, Zone 3 becomes a
problem since its impedance can be quite large so that, at times, the distance element can see
beyond the transformer impedance. However, the records indicate that Zone 1 operated. Before
we decipher this fault, let’s take a look at the next line fault.
Distribution Feeder Relay Reclosed onto a Fault:
After the distribution 351S issued a trip, it waited for 30 cycles and closed again. At this point,
the relay reclosed onto a fault. The phase time overcurrent elements isolated the fault 1.2 seconds
later. The phase – phase fault behavior can be observed in Figure 8.

Figure 8: 351S Recloses onto a Fault
Substation B – Substation C 138kV Transmission Line Fault:
Line Differential Waveform Analysis: After the feeder 351S relay reclosed onto a fault, the 311L
relay at South Switch detected a C-G fault. The relay issued a trip on 87LC and opened its
respective breakers. At this point, the entire substation lost both sources of power, leaving the
substation without power. Unfortunately, the relays at Substation C were not synchronized, so
we do not know exactly when they tripped. However, we know that the feeder relay had current
and voltage present, so the 311L could not have tripped before the feeder relay tripped.
Figure 9: Substations A and C 311L Fault Record

Figure 9 above shows the 311L waveform behavior on the Substation C to Substation B. We find
some interesting data. The load current before the fault, not shown in the figure, seemed to be
fairly balanced at 153A local and 153A remote at 180 degrees apart. The current polarities
appeared to be connected correctly. However, during the fault, the difference in current from
local to remote appeared enormous. The local 311L relay at Substation C saw 5500 amps, and
the remote only saw 60A. If this was an external fault, the 5500 amps at Substation C should
have also appeared at the remote end of the Substation B relay. However, the vector behavior of
local versus remote seems to indicate otherwise. The local versus remote currents were close to
180 degrees apart, indicating a possible external fault.
Keep in mind that by this time the Substation A line was already open, so there was no source at
Substation B. This explains why the relay only saw about 60 amps, but this does not explain the
direction of the currents at the remote end. The remote 311L at Substation B saw 60 amps as if
the fault were located behind the relay. An assumption at this point is that there was an internal
fault somewhere in the line. The Substation C end was feeding 5500 amps to the fault, and the
Substation B end currents behavior was probably reminiscent of preload current. This explains
the direction of the current at the Substation B end.
Phase Distance Waveform Analysis Substation C Terminal:
An interesting observation—to confuse things more—is that the 421 relay at Substation C did
not see the fault at all and did not issue a trip. It did, however, see an intermittent Z2G and Z4G
for less than half a cycle, and then both triggers disappeared. This is shown in Figure 10 below.
Figure 10: Substation C 421Record
Phase Distance Waveform Analysis at Substation B Terminal:
This relay did not see the fault and did not trigger a record. The fault on this line is even more
challenging. The lines differential detected the fault, but the distance relays failed to do so.

So why do the transmission relay trip for a fault on the distribution circuit? The oscillogrpahy on
the Substation B to Substation A line tells us that the current differential and a phase distance
element saw an internal fault. Similarly, the current differential on the Substation B to Substation
C line saw an internal fault, but the distance relays did not. What happened?
Physical Evidence:
Finding answers by looking at the waveforms and sequence of events are almost impossible
without knowing the physical layout of the system involved. Figure 11below is an aerial picture
of the location of the transmission lines and distribution circuits. We notice that the two
transmission line poles share the same structure with the distribution circuits as an underbuilt.
Figure 11: Substation B Aerial View
The hypothesis in this case is that when the distribution breaker interrupted the fault the first time, a
flashover occurred between C-Phase of the Substation B to Substation A transmission line with
one of the conductors in the distribution circuits. As a result, both relays would detect the fault,
and for this line they did.
Figure 12: Transmission Line with Distribution Underbuilt

Figure 12 shows a pole very similar to the ones used on the two transmission lines. Here, we see
that the C-Phase conductor is the closest to the distribution circuit. The current waveforms
indicate that the fault occurred on C-Phase. By looking at the pole configuration, the hypothesis
of a flashover makes sense. However, this hypothesis still needs to be proven.
The field personnel went out and inspected the line for damaged insulators on the distribution
and transmission circuits and found proof that the hypothesis might be correct. Figure 13
displays the distribution insulator, which shows signs of failure. This insulator was found 0.5
mile from the Substation B and 3.2 miles from Substation A. There is a large discrepancy
between the fault locations given by the relays, but such errors can be attributed to the flashover
fault, which is considered a high resistive fault.
The failed insulator is the piece of evidence that proves that during the feeder fault, a flashover
developed as a phase-to-ground on the distribution circuit. At the same time, the air likely
ionized, and depending on the magnitude of the flash, the fault flashed-over high enough to
interact with the transmission circuit. At this point, the transmission relays detected the fault and
tripped the line.
Figure 13: Damaged Insulator Due to Flashover
This physical evidence does prove the flashover on the Substation B to Substation A line, but
such evidence could not be verified at the Substation B to Substation C line. Due to the same
fault behavior, it is very likely that the same type of flashover happened on this line as well. The
real question here is why a flashover developed when the distribution breaker interrupted the
current. A research study was conducted to try to explain this phenomenon and prevent future
events. This study is addressed in the next section.
Flash-Over Research and Results:
A research project was begun in order to investigate the cause of the flashover event. Physical
evidence indicates the distribution insulator failed to ground. This phenomenon appears to have
happened when the distribution breaker interrupted the fault current. The hypothesis is that the
interruption of the fault caused the distribution insulator to fail and produced a flashover between
the phase and ground and subsequently to the transmission system.

A power system modeled in PSCAD was created to replicate the flashover event explained in the
previous section. The PSCAD modeling includes transmission line, distribution, insulator, and
relay data. The research results are part of a 40 page paper report that goes into the detail of the
analysis and findings. For the purposes of this paper, the summary of the report and results are
shown below.
Distribution Insulator Failure: A simulation was conducted to see the voltage response of each
phase when the breaker interrupted the fault current. From our discussion earlier, the fault started
as a C-G fault and then evolved into a C-B-G fault.
The research shows that when the breaker interrupts the currents, a current chopping effect
induces a transient over-voltage in the feeder circuit. Although the current in the vacuum
interrupter can change to zero almost instantaneously, the current in the inductance of the feeder
cannot. The inductance of the feeder includes the inductance of the line and the load. When
current chop occurs, energy stored in the effective inductance is transferred to the available load-
side capacitance to produce induced overvoltage (also called chop overvoltage), given by
√( )
where is the chop current level and √( ) is the load surge impedance; r represents circuit
losses. Long cable length and a surge capacitor can reduce the surge impedance to limit the
induced overvoltage (1).
It must be considered that every time the distribution breaker is opened, this transient
overvoltage is experienced by each insulator along the distribution circuit. However, the
insulators are protected by their Basic Impulse Level (BIL) rating to sustain transients from
faults, lightning strikes, and switching.
Upon further inspection, it was found that a previous fault several months before had similar
characteristics and consequences. Analysis of the event revealed that a distribution fault had
caused one of the transmission lines to operate. With this piece of information, we can determine
that the failed insulator properties were previously damaged where some transient events will
likely cause the insulator to fail.
In addition, based on the simulation results and event analysis, it was also discovered that during
the B-C-G fault, these phases found a current flow to ground through the fault impedance,
thereby reducing their overvoltage on the distribution system. However, since A phase is not
involved in the fault, there is not a path to ground. As a result, when the current is interrupted, a
transient overvoltage higher than B and C phases is produced and transferred to the distribution
circuit as per the previous equation. Such overvoltage is high enough to break the insulation
properties of the damaged insulator. The simulation is shown in Figure 14 below.
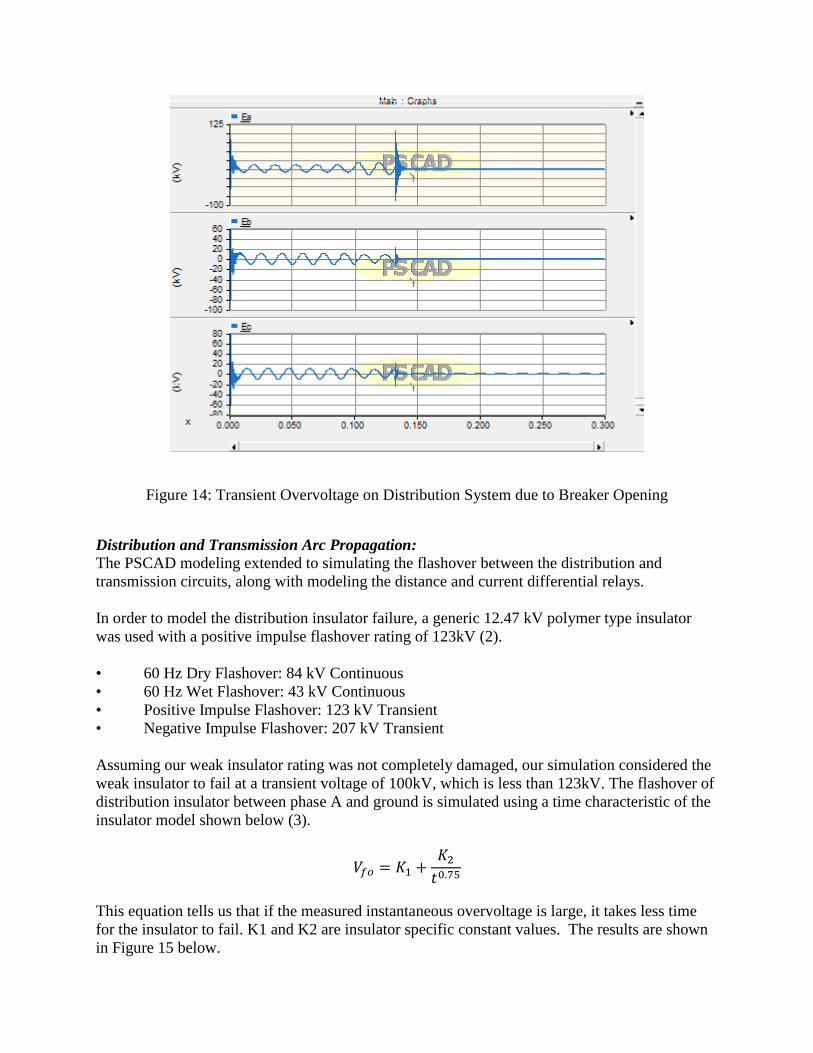
Figure 14: Transient Overvoltage on Distribution System due to Breaker Opening
Distribution and Transmission Arc Propagation:
The PSCAD modeling extended to simulating the flashover between the distribution and
transmission circuits, along with modeling the distance and current differential relays.
In order to model the distribution insulator failure, a generic 12.47 kV polymer type insulator
was used with a positive impulse flashover rating of 123kV (2).
• 60 Hz Dry Flashover: 84 kV Continuous
• 60 Hz Wet Flashover: 43 kV Continuous
• Positive Impulse Flashover: 123 kV Transient
• Negative Impulse Flashover: 207 kV Transient
Assuming our weak insulator rating was not completely damaged, our simulation considered the
weak insulator to fail at a transient voltage of 100kV, which is less than 123kV. The flashover of
distribution insulator between phase A and ground is simulated using a time characteristic of the
insulator model shown below (3).
This equation tells us that if the measured instantaneous overvoltage is large, it takes less time
for the insulator to fail. K1 and K2 are insulator specific constant values. The results are shown
in Figure 15 below.
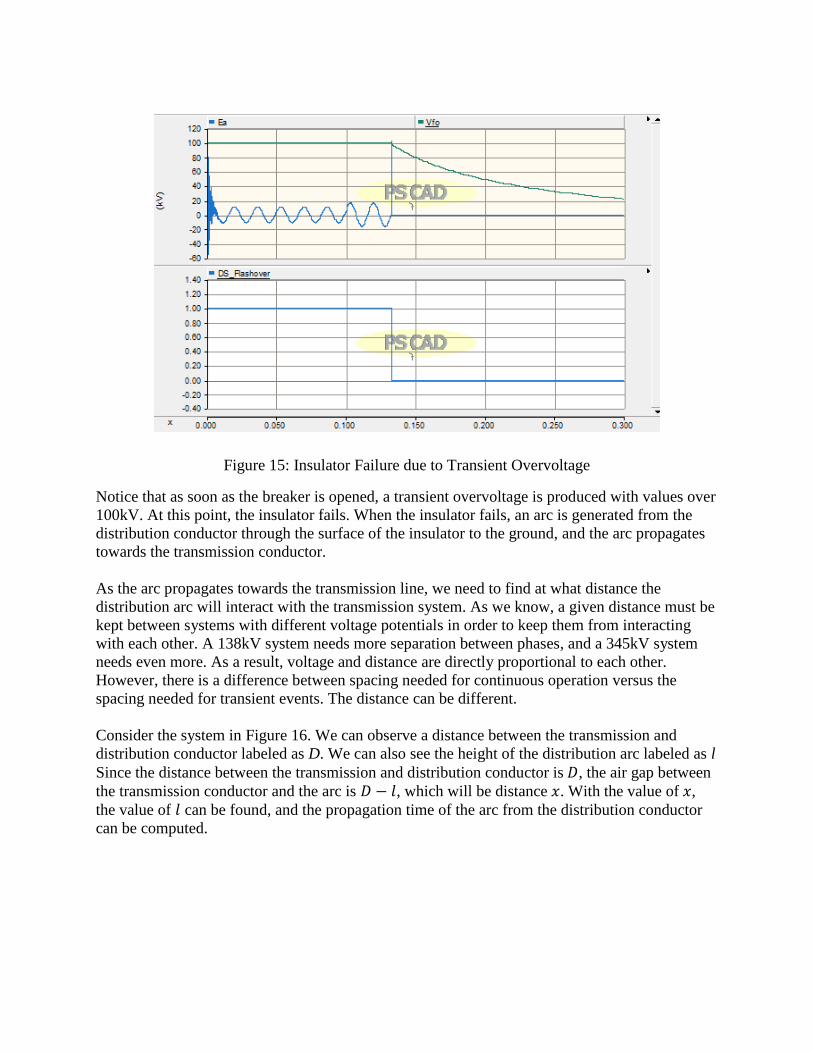
Figure 15: Insulator Failure due to Transient Overvoltage
Notice that as soon as the breaker is opened, a transient overvoltage is produced with values over
100kV. At this point, the insulator fails. When the insulator fails, an arc is generated from the
distribution conductor through the surface of the insulator to the ground, and the arc propagates
towards the transmission conductor.
As the arc propagates towards the transmission line, we need to find at what distance the
distribution arc will interact with the transmission system. As we know, a given distance must be
kept between systems with different voltage potentials in order to keep them from interacting
with each other. A 138kV system needs more separation between phases, and a 345kV system
needs even more. As a result, voltage and distance are directly proportional to each other.
However, there is a difference between spacing needed for continuous operation versus the
spacing needed for transient events. The distance can be different.
Consider the system in Figure 16. We can observe a distance between the transmission and
distribution conductor labeled as D. We can also see the height of the distribution arc labeled as l
Since the distance between the transmission and distribution conductor is , the air gap between
the transmission conductor and the arc is , which will be distance . With the value of ,
the value of can be found, and the propagation time of the arc from the distribution conductor
can be computed.

Figure 16: Transmission and Distribution Flashover Model
Flashover voltage through the air:
Lo
The equation above allows us to calculate the flashover magnitude through the air caused by
transient impulses (4). Figure 17 shows the relationship between the air gap distance and the
necessary voltage to produce a flashover. Since we do not know how high the arc of the
distribution flashover traveled, we need to make some assumptions. Assuming that the arc from
the distribution conductor travels near to the transmission conductor and the gap between the arc
and the transmission conductor is 0.38 meter, the flashover voltage of the air gap can be
calculated as 70.23 kV. This tells us that at a 0.38 meter spacing between the arc and the
transmission conductor, a 70.23kV flashover voltage potential is necessary to start conducting
through the air between the distribution arc and the transmission conductor.
These values can be further manipulated to produce different simulations and results. For our
purposes, we have verified what it takes to produce a flashover between the distribution and
transmission circuits.

Figure 17: Air Gap Distance versus Flashover Voltage
With the distribution and transmission flashover model finalized, a complete simulation using
the PSCAD distance and current differential relays was performed. The explanation of the relay
modules is beyond the scope of this paper, but it is enough to point out that the relays operated as
expected. Even though there are differences between the algorithms used by the relays versus
the ones used by PSCAD, the overall principle is the same and serves our purposes.
Recommendations:
1. Current Chopping Specifications: Vacuum breakers should be specified to have a current
chopping of close to zero amps. This will depend on the material of the circuit breaker
contact, which can be selected such that the current chopping magnitude is reduced. If the
change of current is reduced, the induced voltage can be reduced as well.
2. Use Single Pole Tripping: Based on the results of our research, we are proposing the use
of single pole tripping in distribution breakers. Since each phase has its own tripping
control, the tripping signal can be sent at exactly zero current. As a result, single pole
tripping can reduce or avoid induced overvoltages when the circuit breaker is opened. If
the circuit breaker is opened at zero current, there will be no current chopping, and no
overvoltage will be induced. Moreover, as explained previously, the induced voltage is
much larger in the unfaulted phase because there is no current flowing path in this phase.
If the circuit breaker is not opened in the unfaulted phase, then there will be no
overvoltage in this phase.
3. Transient Study: If the number of flashover occurrences continues to increase, a transient
study may reveal problematic overvoltage conditions that are experienced during
switching events. The study can determine whether or not the insulation of equipment
and coordination is well suited for a given system.
4. Insulator Maintenance: A maintenance program that inspects the insulator’s reliability on
a regular basis should always be part of the utility practice. Insulators with signs of

flashover should be replaced since such insulators can be considered weak and unfit to
provide the necessary insulation for transient events.
5. Use of Dual Line Differential Protection: Primary and backup line differential relays are
recommended in areas where fiber is available and, in this case, with distribution under-
builts. As demonstrated in this paper, the distance relays are not suitable to detect
flashover faults due to their varying resistive properties. Differential relays come with
step distance and directional overcurrent elements that can also complement the line
protection in case the fiber communication is lost.
References:
[1] T. E. Browne, Circuit interruption: theory and techniques. New York: M. Dekker, 1984.
[2] “Hendrix.” [Online]. Available: http://www.hendrix-wc.com/. [Accessed: 04-Jan-2014].
[3] P. Yadee and S. Premrudeepreechacharn, “Analysis of Tower Footin Resistance
Effected Back Flashover Across Insulator in a Transmission System.”
[4] T. Harada, Y. Aihara, and Y. Aoshima, “Influence of Switchin Impulse Wave Shape on
Flashover Volta es of Air Gaps,” IEEE Trans. Power Appar. Syst., vol. PAS-92, no. 3,
pp. 1085–1093, 1973.
Biography:
Michael McMillan graduated from Texas A&M University in 1978 with a BS in Electrical
Engineering. Employed by Bryan Texas Utilities in 1983 with responsibilities during the 30 ½
year career including distribution and transmission planning studies and modeling, line design,
SCADA and communications operations, substation maintenance operations, NERC and
ERCOT compliance, and substation design. Present position is Senior Engineer in the
Transmission and Distribution Department.
Stephen Copeland graduated from Iowa State University in 2011 with a BS in Electrical
Engineering. He has been employed by Bryan Texas Utilities for the past 2 ½ years as a
Transmission Engineer in the Transmission and Distribution Department. His responsibilities
include transmission system modeling, SCADA and communications integration, NERC and
ERCOT compliance, protection system design, and substation asset management.
Joe Perez received his B.S. degree in Electrical Engineering from Texas A&M University in
2003. After college, he worked as a field engineer installing and commissioning medium voltage
switchgears, AC and DC drives, and control houses. In 2004, Joe joined the utility world as a
transmission engineer for TMPA. He gained close experience with system protection design,
fault analysis and how to face blackouts of a transmission system. He also was in charge of
transmission system planning studies such as power flow and contingency analysis. In 2007, Joe
decided to move to the relay manufacturing side and joined ERLPhase Power Technologies,

previously known as NXTPhase. At ERL, he gained extensive experience in relay protection
algorithms for line distance, transformer and bus differential relays.
In 2012, Joe Perez established SynchroGrid LLC to provide electric utilities with simplified
power system protection design, analysis, applications, and research. Joe is the author and many
relay application notes and has presented technical papers at WPRC, Texas A&M and Georgia
Tech Relay Conferences. Joe is a registered professional engineer in the state of Texas and a
member of PSRC, IEEE, and PES. Joe resides in the Bryan/College Station area. He can be
contacted at [email protected].
Hung-Ming Chou received his B.S. degree in Electrical Engineering in 2004 in National Chiao
Tung University, Taiwan and M.S. degree in Electrical and Computer Engineering in 2009 from
Texas A&M University. He joined the Ph.D. program in Power System Automation Lab in the
same department. His research interests include Hardware-in-the-Loop real time simulation,
power electronics, power system dynamics and control, voltage stability analysis in unbalanced
distribution systems and microgrids, and big data analysis of power systems.