ANALYSING AND TROUBLESHOOTING PARALLEL … · Analyzing Data Distribution Skew ... retained...
39
Transcript of ANALYSING AND TROUBLESHOOTING PARALLEL … · Analyzing Data Distribution Skew ... retained...


Independent consultant
In-house workshops
Cost-Based Optimizer
Performance By Design
Performance Troubleshooting
Oracle ACE Director
Member of OakTable Network

Parallel Execution introduction
Major challenges
Parallel unfriendly examples
Distribution skew examples
How to measure distribution of work
How to systematically analyze distribution

Oracle Database Enterprise Edition includes the powerful Parallel Execution feature that allows spreading the processing of a single SQL statement execution across multiple worker processes
The feature is fully integrated into the Cost Based Optimizer as well as the execution runtime engine and automatically distributes the work across the so called Parallel Workers

Simple generic parallelization example
Task: Compute sum of 8 numbers
1+8=9, 9+7=16, 16+9=25,...
1+8+7+9+6+2+6+3= ???
n=8 numbers, 7 computation steps required
Serial execution: 7 time units

Simple generic parallelization example
4 workers
But 3 (7) x 4 workers assigned
3 (7) time units
1 + 8 = 9
9 + 7 = 16
6 + 2 = 8
6 + 3 = 9
9 + 16 = 25
8 + 9 = 17
25 + 17 = 42
Coordinator
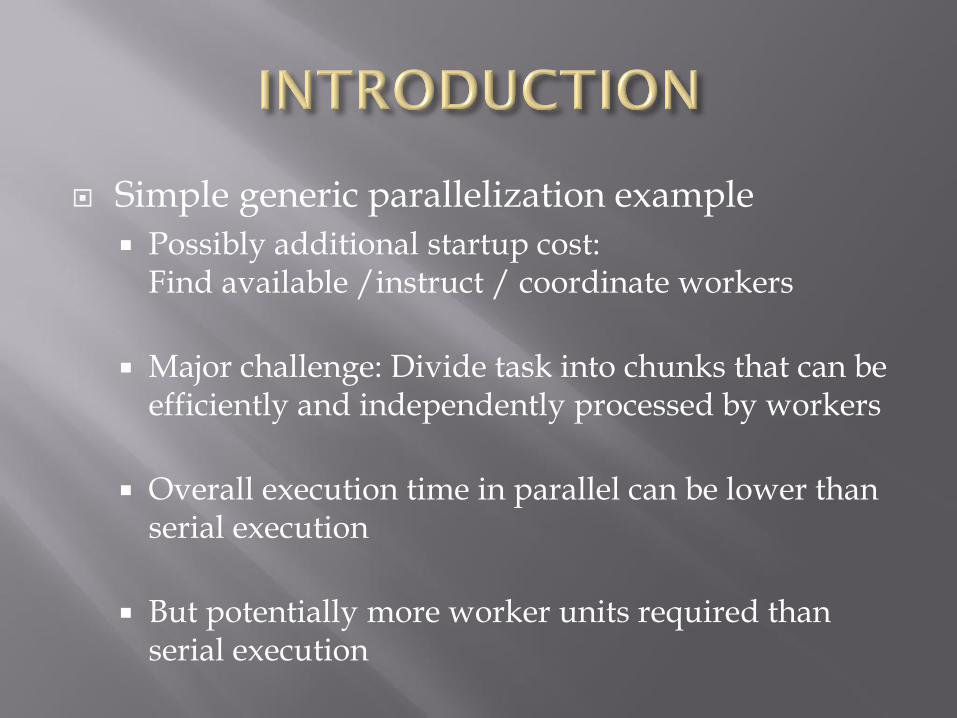
Simple generic parallelization example
Possibly additional startup cost: Find available /instruct / coordinate workers
Major challenge: Divide task into chunks that can be efficiently and independently processed by workers
Overall execution time in parallel can be lower than serial execution
But potentially more worker units required than serial execution
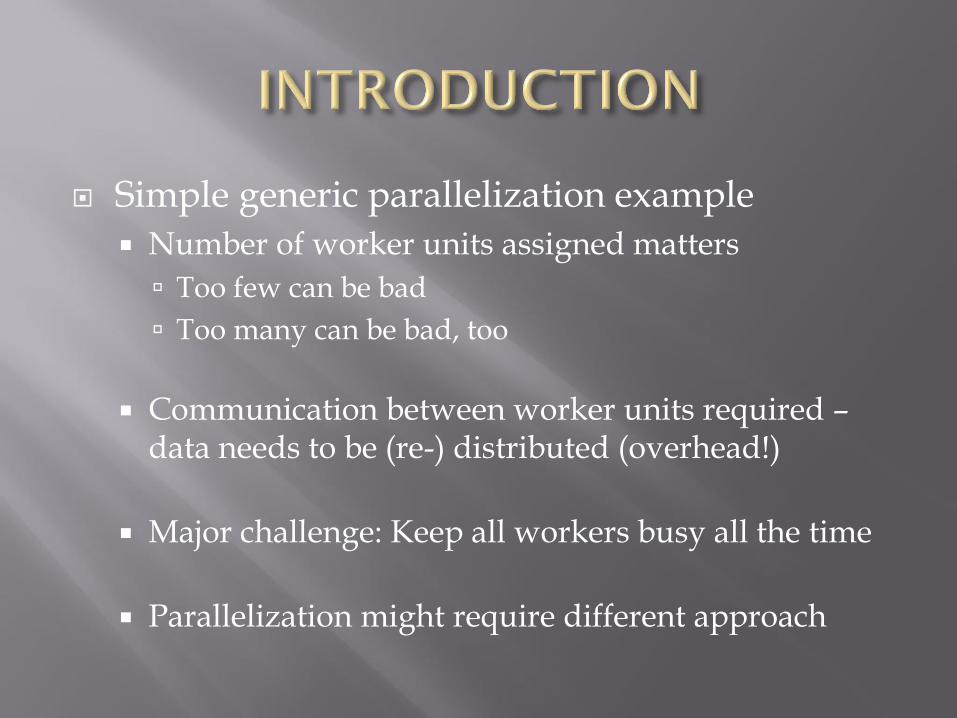
Simple generic parallelization example
Number of worker units assigned matters
Too few can be bad
Too many can be bad, too
Communication between worker units required – data needs to be (re-) distributed (overhead!)
Major challenge: Keep all workers busy all the time
Parallelization might require different approach

Parallel Execution doesn’t mean “work smarter”
You’re actually willing to accept to “work harder”
Could also be called: “Brute force” approach

So with Parallel Execution there might be the problem that it doesn’t work “hard enough”

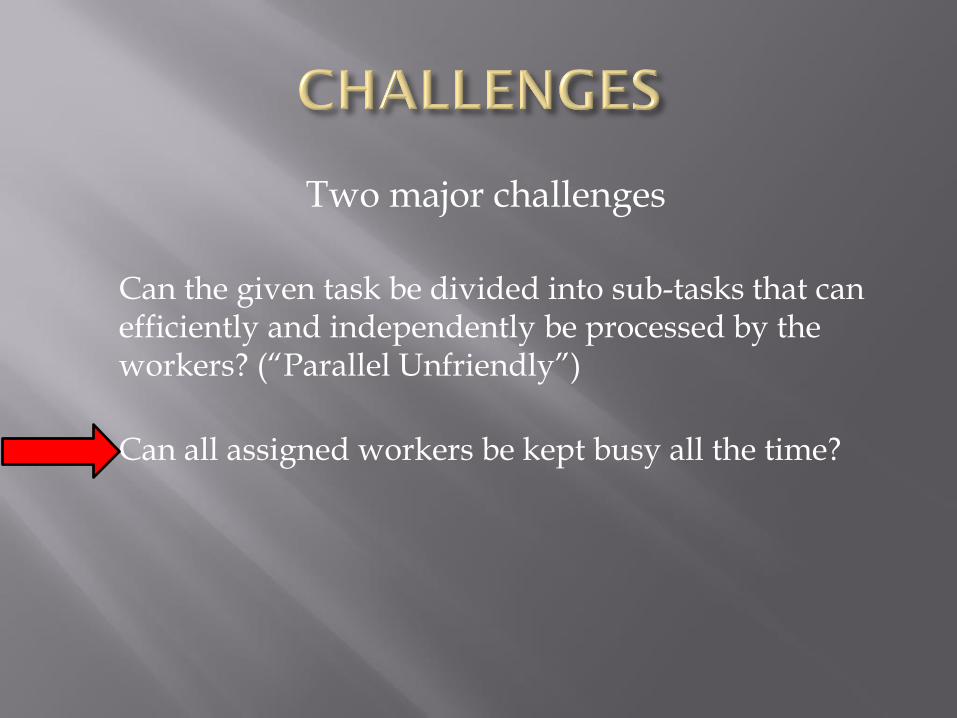
Two major challenges
Can the given task be divided into sub-tasks that can efficiently and independently be processed by the workers? (“Parallel Unfriendly”)
Can all assigned workers be kept busy all the time?

Parallel Execution can only reduce runtime as expected if all workers are kept busy
Possibly only a few or a single worker will be active and have to do all the work
In this case Parallel Execution can actually be slower than serial execution
There is a need to measure how busy the workers are kept

Note that this measure doesn’t tell you anything about the efficiency of the actual operation / execution plan
But an otherwise efficient Parallel Execution plan can only scale if the expected number of workers is kept busy ideally all the time
Note that it says “can scale” – if your system cannot scale the required resources (like I/O) you just end up with more workers waiting

Other reasons why Oracle Parallel Execution might not reduce runtime as expected:
Parallel DML/DDL gotchas
“Downgrade” at execution time (less workers assigned than expected)
Overhead of Parallel Execution implementation
Limitations of Parallel Execution implementation

Parallel DML / DDL gotchas
DML / DDL part can run parallel or serial
Query part can run parallel or serial

Parallel CTAS but serial query
-------------------------------------------------------------------------
| Id | Operation | Name | TQ |IN-OUT| PQ Distrib |
-------------------------------------------------------------------------
| 0 | CREATE TABLE STATEMENT | | | | |
| 1 | PX COORDINATOR | | | | |
| 2 | PX SEND QC (RANDOM) | :TQ10001 | Q1,01 | P->S | QC (RAND) |
| 3 | LOAD AS SELECT | T4 | Q1,01 | PCWP | |
| 4 | PX RECEIVE | | Q1,01 | PCWP | |
| 5 | PX SEND ROUND-ROBIN| :TQ10000 | | S->P | RND-ROBIN |
|* 6 | HASH JOIN | | | | |
| 7 | TABLE ACCESS FULL| T2 | | | |
| 8 | TABLE ACCESS FULL| T2 | | | |
-------------------------------------------------------------------------

Serial CTAS but parallel query
--------------------------------------------------------------------------
| Id | Operation | Name | TQ |IN-OUT| PQ Distrib |
--------------------------------------------------------------------------
| 0 | CREATE TABLE STATEMENT | | | | |
| 1 | LOAD AS SELECT | T4 | | | |
| 2 | PX COORDINATOR | | | | |
| 3 | PX SEND QC (RANDOM) | :TQ10002 | Q1,02 | P->S | QC (RAND) |
|* 4 | HASH JOIN BUFFERED | | Q1,02 | PCWP | |
| 5 | PX RECEIVE | | Q1,02 | PCWP | |
| 6 | PX SEND HASH | :TQ10000 | Q1,00 | P->P | HASH |
| 7 | PX BLOCK ITERATOR | | Q1,00 | PCWC | |
| 8 | TABLE ACCESS FULL| T2 | Q1,00 | PCWP | |
| 9 | PX RECEIVE | | Q1,02 | PCWP | |
| 10 | PX SEND HASH | :TQ10001 | Q1,01 | P->P | HASH |
| 11 | PX BLOCK ITERATOR | | Q1,01 | PCWC | |
| 12 | TABLE ACCESS FULL| T2 | Q1,01 | PCWP | |
--------------------------------------------------------------------------

Other reasons why Oracle Parallel Execution might not scale as expected:
Parallel DML/DDL gotchas
“Downgrade” at execution time (less workers assigned than expected)
Overhead of Parallel Execution implementation
Limitations of Parallel Execution implementation

“Parallel Forced Serial” Example
------------------------------------------------------------------------------
| Id | Operation | Name | TQ |IN-OUT| PQ Distrib |
------------------------------------------------------------------------------
| 0 | SELECT STATEMENT | | | | |
| 1 | PX COORDINATOR FORCED SERIAL| | | | |
| 2 | PX SEND QC (RANDOM) | :TQ10003 | Q1,03 | P->S | QC (RAND) |
| 3 | HASH UNIQUE | | Q1,03 | PCWP | |
| 4 | PX RECEIVE | | Q1,03 | PCWP | |
| 5 | PX SEND HASH | :TQ10002 | Q1,02 | P->P | HASH |
|* 6 | HASH JOIN BUFFERED | | Q1,02 | PCWP | |
| 7 | PX RECEIVE | | Q1,02 | PCWP | |
| 8 | PX SEND HASH | :TQ10000 | Q1,00 | P->P | HASH |
| 9 | PX BLOCK ITERATOR | | Q1,00 | PCWC | |
| 10 | TABLE ACCESS FULL | T2 | Q1,00 | PCWP | |
| 11 | PX RECEIVE | | Q1,02 | PCWP | |
| 12 | PX SEND HASH | :TQ10001 | Q1,01 | P->P | HASH |
| 13 | PX BLOCK ITERATOR | | Q1,01 | PCWC | |
| 14 | TABLE ACCESS FULL | T2 | Q1,01 | PCWP | |
------------------------------------------------------------------------------

Two major challenges
Can the given task be divided into sub-tasks that can efficiently and independently be processed by the workers? (“Parallel Unfriendly”)
Can all assigned workers be kept busy all the time?

select median(id) from t2;
-----------------------------------------------------------------------
| Id | Operation | Name | TQ |IN-OUT| PQ Distrib |
-----------------------------------------------------------------------
| 0 | SELECT STATEMENT | | | | |
| 1 | SORT GROUP BY | | | | |
| 2 | PX COORDINATOR | | | | |
| 3 | PX SEND QC (RANDOM)| :TQ10000 | Q1,00 | P->S | QC (RAND) |
| 4 | PX BLOCK ITERATOR | | Q1,00 | PCWC | |
| 5 | TABLE ACCESS FULL| T2 | Q1,00 | PCWP | |
-----------------------------------------------------------------------

create table t3 parallel
as
select * from t2
where rownum <= 10000000;
-----------------------------------------------------------------------------
| Id | Operation | Name | TQ |IN-OUT| PQ Distrib |
-----------------------------------------------------------------------------
| 0 | CREATE TABLE STATEMENT | | | | |
| 1 | PX COORDINATOR | | | | |
| 2 | PX SEND QC (RANDOM) | :TQ20001 | Q2,01 | P->S | QC (RAND) |
| 3 | LOAD AS SELECT | T3 | Q2,01 | PCWP | |
| 4 | PX RECEIVE | | Q2,01 | PCWP | |
| 5 | PX SEND ROUND-ROBIN | :TQ20000 | | S->P | RND-ROBIN |
|* 6 | COUNT STOPKEY | | | | |
| 7 | PX COORDINATOR | | | | |
| 8 | PX SEND QC (RANDOM) | :TQ10000 | Q1,00 | P->S | QC (RAND) |
|* 9 | COUNT STOPKEY | | Q1,00 | PCWC | |
| 10 | PX BLOCK ITERATOR | | Q1,00 | PCWC | |
| 11 | TABLE ACCESS FULL| T2 | Q1,00 | PCWP | |
-----------------------------------------------------------------------------
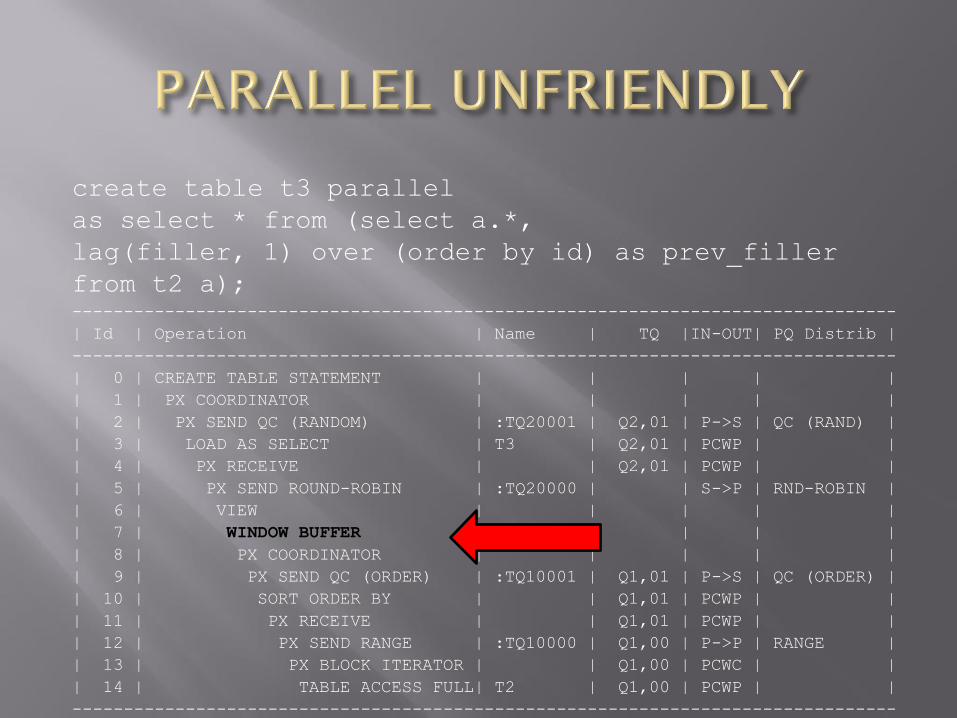
create table t3 parallel
as select * from (select a.*,
lag(filler, 1) over (order by id) as prev_filler
from t2 a); --------------------------------------------------------------------------------
| Id | Operation | Name | TQ |IN-OUT| PQ Distrib |
--------------------------------------------------------------------------------
| 0 | CREATE TABLE STATEMENT | | | | |
| 1 | PX COORDINATOR | | | | |
| 2 | PX SEND QC (RANDOM) | :TQ20001 | Q2,01 | P->S | QC (RAND) |
| 3 | LOAD AS SELECT | T3 | Q2,01 | PCWP | |
| 4 | PX RECEIVE | | Q2,01 | PCWP | |
| 5 | PX SEND ROUND-ROBIN | :TQ20000 | | S->P | RND-ROBIN |
| 6 | VIEW | | | | |
| 7 | WINDOW BUFFER | | | | |
| 8 | PX COORDINATOR | | | | |
| 9 | PX SEND QC (ORDER) | :TQ10001 | Q1,01 | P->S | QC (ORDER) |
| 10 | SORT ORDER BY | | Q1,01 | PCWP | |
| 11 | PX RECEIVE | | Q1,01 | PCWP | |
| 12 | PX SEND RANGE | :TQ10000 | Q1,00 | P->P | RANGE |
| 13 | PX BLOCK ITERATOR | | Q1,00 | PCWC | |
| 14 | TABLE ACCESS FULL| T2 | Q1,00 | PCWP | |
--------------------------------------------------------------------------------

All these examples have one thing in common:
If the Query Coordinator (non-parallel part) needs to perform a significant part of the overall
work, Parallel Execution won’t reduce the runtime as expected
Two major challenges
Can the given task be divided into sub-tasks that can efficiently and independently be processed by the workers? (“Parallel Unfriendly”)
Can all assigned workers be kept busy all the time?

Legend
P003
P002
P001
P000
time
CPU Wait

Legend
P003
P002
P001
P000
time
CPU Wait

Legend
P003
P002
P001
P000
time
CPU Wait

Parallel Execution introduction
Major challenges
Parallel unfriendly examples
Distribution skew examples
How to measure distribution of work
How to systematically analyze distribution
Measure Parallel Execution work distribution
From 11g on: Real Time SQL Monitoring
Requires Diagnostics + Tuning Pack license
Based on Active Session History to large degree

Analysis of a single SQL execution
Provides Elapsed Time and DB Time
Shows Average Active Sessions graph
Shows DB Time per Parallel Worker process

Easy to identify whether all workers are kept busy all the time or not
Easy to identify if there was a problem with work distribution
Shows actual parallel degree used (“Parallel Downgrade”)
Supports RAC

Reports are not persisted and will be flushed from memory quite quickly on busy systems
No easy identification and therefore no systematic troubleshooting which plan operations cause a work distribution problem
Lacks some precision regarding Parallel Execution details

Parallel Execution introduction
Major challenges
Parallel unfriendly examples
Distribution skew examples
How to measure distribution of work
How to systematically analyze distribution

Analyzing Data Distribution Skew
Real-Time SQL Monitoring: Not part of report, requires custom query, only data distribution skew
V$PQ_TQSTAT: requires to reproduce, fails for complex queries, only data distribution skew
Extended SQL Trace: requires to reproduce, many trace files, only data distribution skew

One very useful approach is using Active Session History (ASH)
ASH samples active sessions once a second
Activity of Parallel Workers over time can easily be analyzed
From 11g on the ASH data even contains a reference to the execution plan line, so a relation between Parallel Worker activity and execution plan line based on ASH is possible

Custom queries on ASH data required for detailed analysis
XPLAN_ASH tool runs these queries for a given SQL_ID execution
Advantage of ASH is the availability of retained historic ASH data via AWR on disk
Information can be extracted even for SQL executions as long ago as the retention configured for AWR

Fixing Data Distribution Skew
Influence Parallel Distribution: Data volume estimates, PQ_DISTRIBUTE hint
Partitioning: Partition-wise operations
Rewrite queries
Change application design

Q & A