ANÁLISIS DE LA COMPETENCIA - Grupo ACS · €498 Mn +3.0% growth vs 9M16 EBIT ... Support services...
14
November 14 th 2017 Results Presentation 3Q 2017
Transcript of ANÁLISIS DE LA COMPETENCIA - Grupo ACS · €498 Mn +3.0% growth vs 9M16 EBIT ... Support services...
November 14th 2017
Results Presentation
3Q 2017
3Q 17 – Results Presentation
1
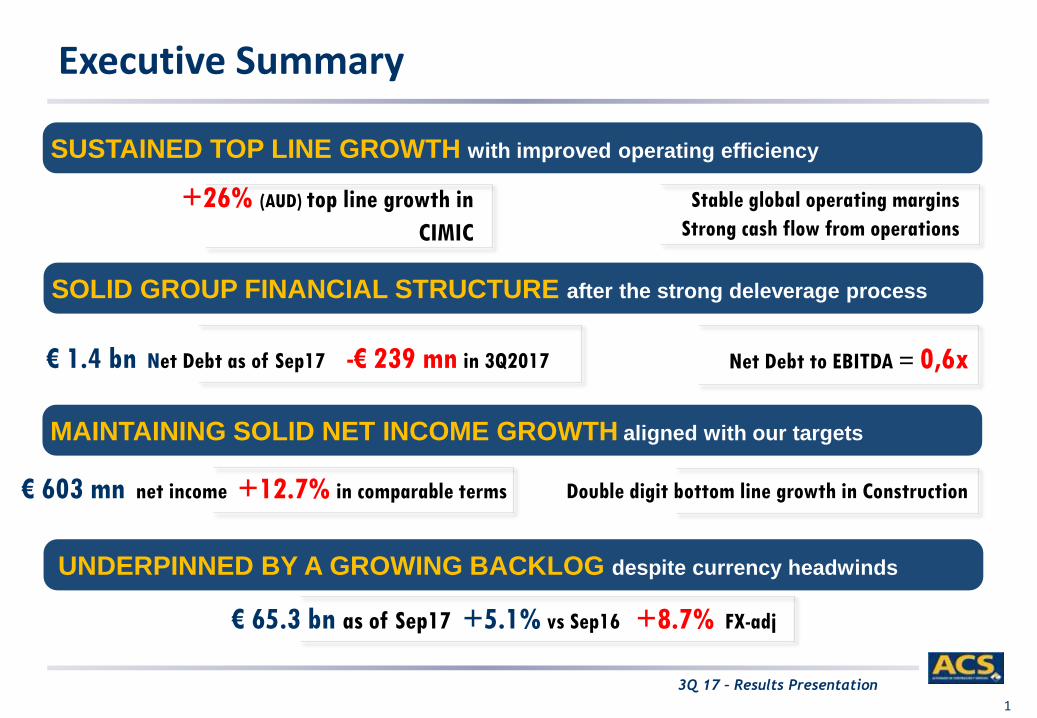
Executive Summary
SUSTAINED TOP LINE GROWTH with improved operating efficiency
+26% (AUD) top line growth in
CIMIC
Stable global operating margins
Strong cash flow from operations
SOLID GROUP FINANCIAL STRUCTURE after the strong deleverage process
Net Debt to EBITDA = 0,6x
UNDERPINNED BY A GROWING BACKLOG despite currency headwinds
€ 65.3 bn as of Sep17 +5.1% vs Sep16 +8.7% FX-adj
MAINTAINING SOLID NET INCOME GROWTH aligned with our targets
€ 603 mn net income +12.7% in comparable terms Double digit bottom line growth in Construction
€ 1.4 bn Net Debt as of Sep17 -€ 239 mn in 3Q2017
3Q 17 – Results Presentation
2
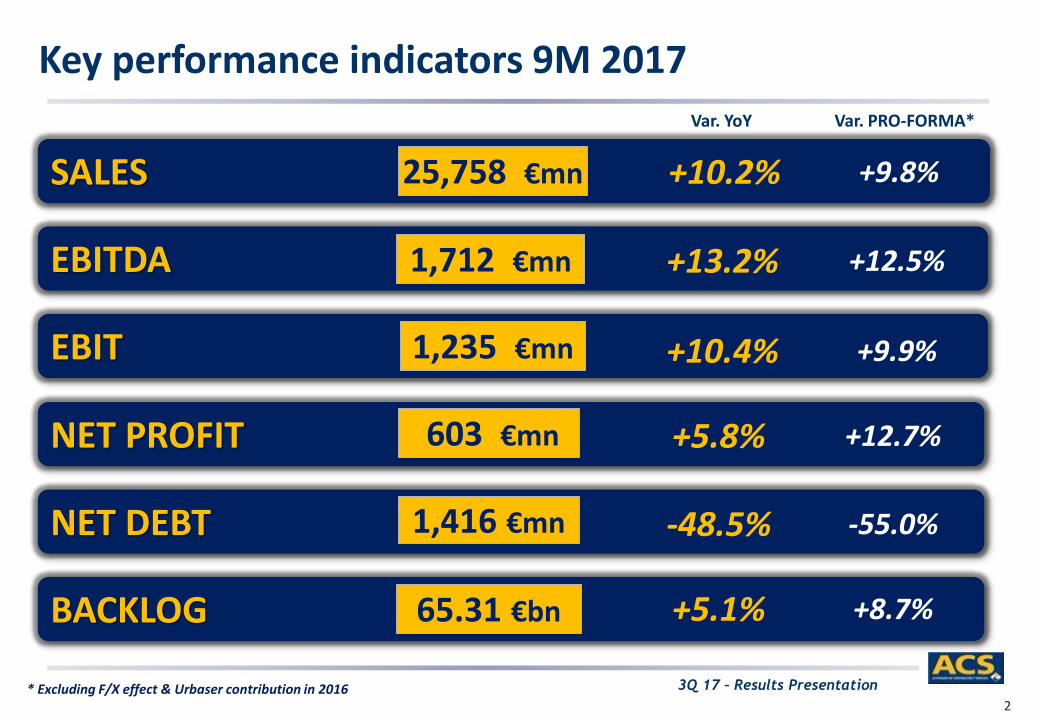
Key performance indicators 9M 2017
* Excluding F/X effect & Urbaser contribution in 2016
Var. PRO-FORMA*Var. YoY
SALES 25,758 €mn +10.2% +9.8%
BACKLOG 65.31 €bn +5.1% +8.7%
EBITDA 1,712 €mn +13.2% +12.5%
EBIT 1,235 €mn +10.4% +9.9%
NET PROFIT 603 €mn +5.8% +12.7%
NET DEBT 1,416 €mn -48.5% -55.0%

3Q 17 – Results Presentation
Spain€ 880 mn
4% Rest of Europe€ 1.532 mn
8%
North America€ 10.356 mn
52%
South America€ 348 mn
2%
Asia Pacific€ 6.659 mn
34%CIMIC
€ 6.581 mn33%
HOT America€ 8.644 mn
44%
HOT Europa€ 1.227 mn
6%
HOT HQ€ 81 mn
1%
Dragados€ 3.175 mn
16%
Iridium€ 66 mn
0%
Construction
SALES 9M17
€ 19,775 Mn
+13.3%growth vs 9M16
+12.7%ex forex
EBITDA 9M17
€ 1,197 Mn
+18.5%growth vs 9M16
5.9% +26 bpmargin vs 9M16
EBIT 9M17
€ 777 Mn
+12.2%growth vs 9M16
Net Profit 9M17
€ 282 Mn
+28.3%growth vs 9M16
SALES BREAKDOWN BY ACTIVITY SALES BREAKDOWN BY GEOGRAPHY
3,175
2,995
+6.0%
9M16 9M17
16,534
14,397
+14.8%
9M16 9M17
3.9% -4 bpmargin vs 9M16
1.4% +17 bpmargin vs 9M16
3Q 17 – Results Presentation
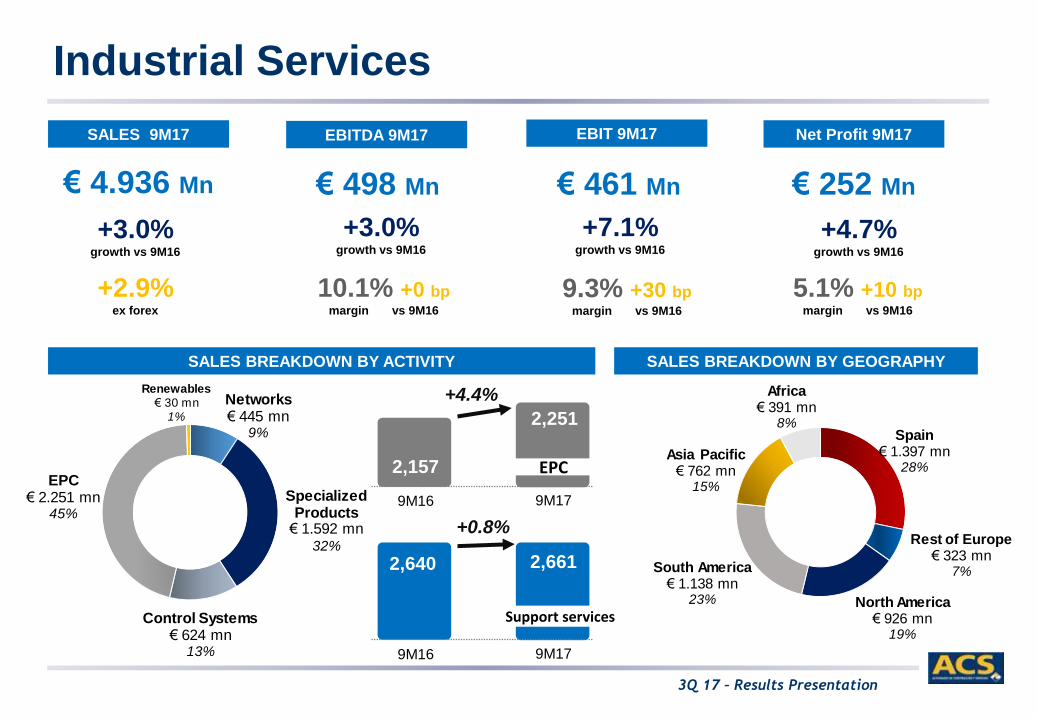
Spain€ 1.397 mn
28%
Rest of Europe€ 323 mn
7%
North America€ 926 mn
19%
South America€ 1.138 mn
23%
Asia Pacific€ 762 mn
15%
Africa€ 391 mn
8%
Industrial Services
SALES 9M17
€ 4.936 Mn
+3.0%growth vs 9M16
+2.9%ex forex
EBITDA 9M17
€ 498 Mn
+3.0%growth vs 9M16
EBIT 9M17
€ 461 Mn
+7.1%growth vs 9M16
Net Profit 9M17
€ 252 Mn
+4.7%growth vs 9M16
SALES BREAKDOWN BY ACTIVITY SALES BREAKDOWN BY GEOGRAPHY
2,251
2,157
+4.4%
9M16 9M17
2,6612,640
+0.8%
9M16 9M17
Networks€ 445 mn
9%
Specialized Products€ 1.592 mn
32%
Control Systems€ 624 mn
13%
EPC€ 2.251 mn
45%
Renewables€ 30 mn
1%
Support services
EPC
10.1% +0 bpmargin vs 9M16
9.3% +30 bpmargin vs 9M16
5.1% +10 bpmargin vs 9M16
3Q 17 – Results Presentation
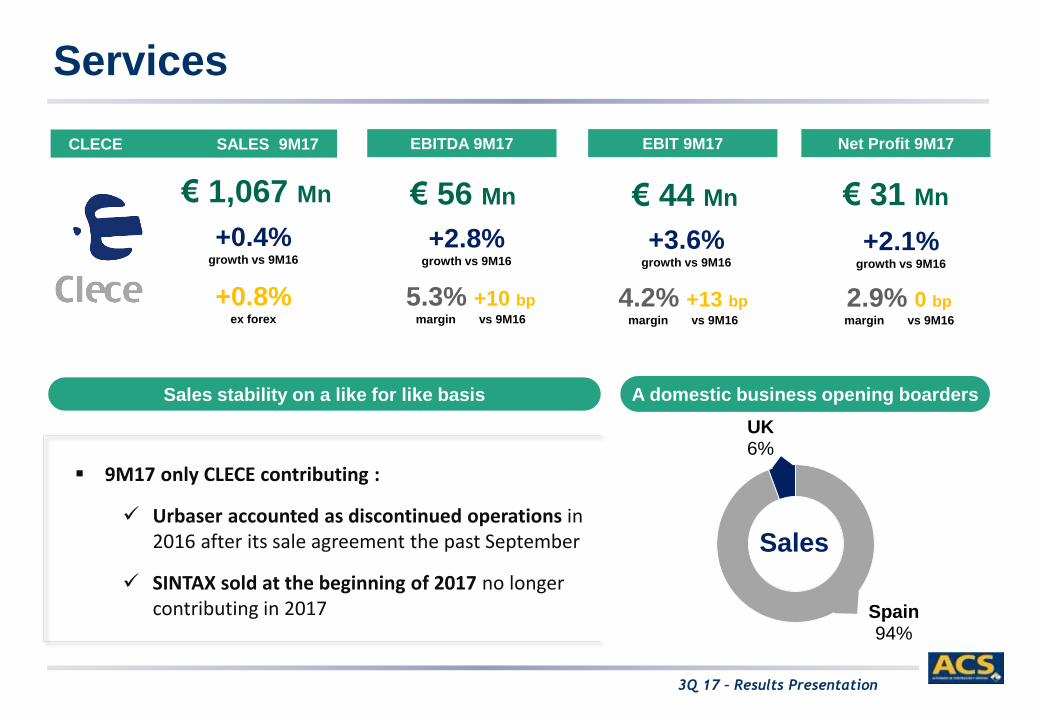
Services
CLECE SALES 9M17
€ 1,067 Mn
+0.4%growth vs 9M16
+0.8%ex forex
EBITDA 9M17
€ 56 Mn
+2.8%growth vs 9M16
EBIT 9M17
€ 44 Mn
+3.6%growth vs 9M16
Net Profit 9M17
€ 31 Mn
+2.1%growth vs 9M16
9M17 only CLECE contributing :
Urbaser accounted as discontinued operations in 2016 after its sale agreement the past September
SINTAX sold at the beginning of 2017 no longercontributing in 2017
Sales stability on a like for like basis A domestic business opening boarders
Spain94%
UK6%
Sales
5.3% +10 bpmargin vs 9M16
4.2% +13 bpmargin vs 9M16
2.9% 0 bpmargin vs 9M16
3Q 17 – Results Presentation
6
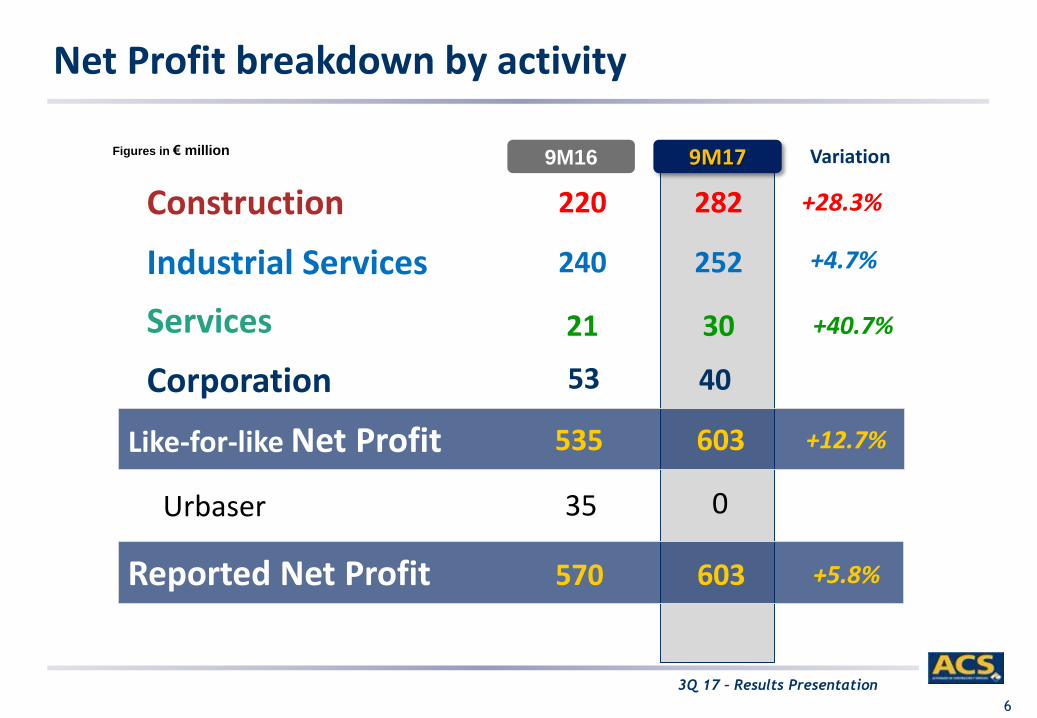
Net Profit breakdown by activity
3M17
Like-for-like Net Profit 603535 +12.7%
Construction 282220 +28.3%
Industrial Services 252240 +4.7%
Services 3021 +40.7%
Corporation 40 53
Variation
Reported Net Profit 603570 +5.8%
9M179M16
Urbaser 35
Figures in € million
0
3Q 17 – Results Presentation
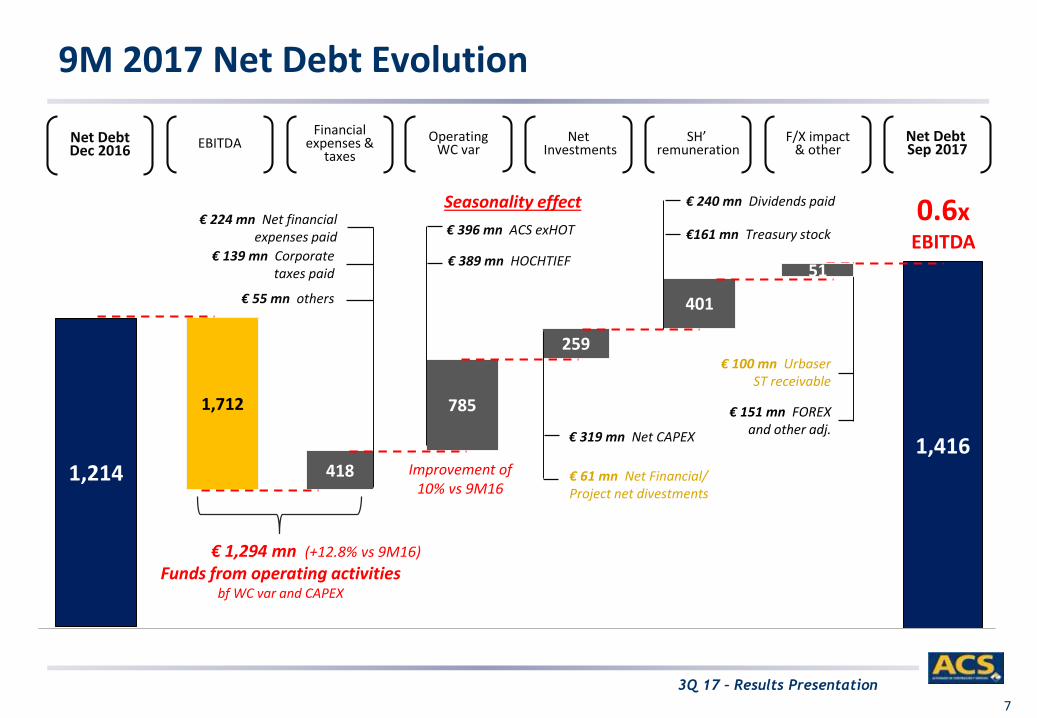
9M 2017 Net Debt Evolution
7
1,214
1,712 785
401
4181,416
Net Debt Sep 2017
Net Debt Dec 2016 EBITDA Operating
WC var
Financial expenses &
taxes
NetInvestments
SH’ remuneration
F/X impact & other
259
€ 61 mn Net Financial/ Project net divestments
€ 319 mn Net CAPEX
€ 224 mn Net financialexpenses paid
€ 55 mn others
Seasonality effect
€ 396 mn ACS exHOT
€ 389 mn HOCHTIEF
0.6x EBITDA
€ 139 mn Corporatetaxes paid
€ 151 mn FOREX and other adj.
€ 100 mn UrbaserST receivable
€ 1,294 mn (+12.8% vs 9M16)
Funds from operating activitiesbf WC var and CAPEX
51
€161 mn Treasury stock
€ 240 mn Dividends paid
Improvement of 10% vs 9M16
3Q 17 – Results Presentation
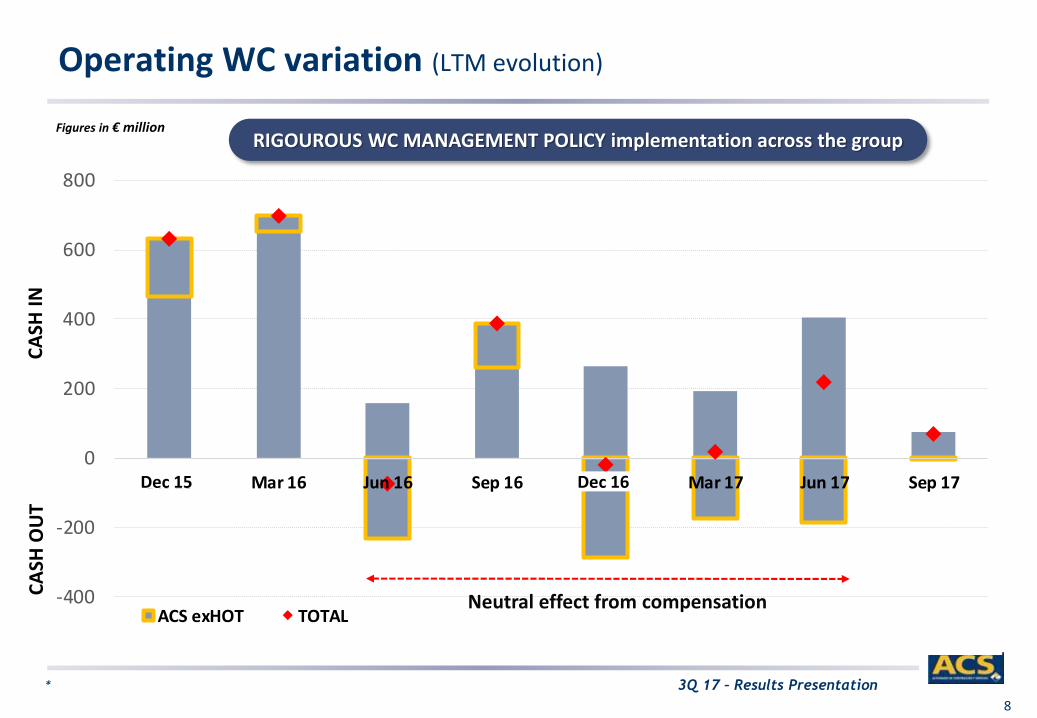
-400
-200
0
200
400
600
800
Dic 15 Mar 16 Jun 16 Sep 16 Dic 16 Mar 17 Jun 17 Sep 17
ACS exHOT TOTAL
Operating WC variation (LTM evolution)
8
*
Neutral effect from compensation
RIGOUROUS WC MANAGEMENT POLICY implementation across the groupFigures in € million
Dec 15 Dec 16
CA
SH I
NC
ASH
OU
T
3Q 17 – Results Presentation9
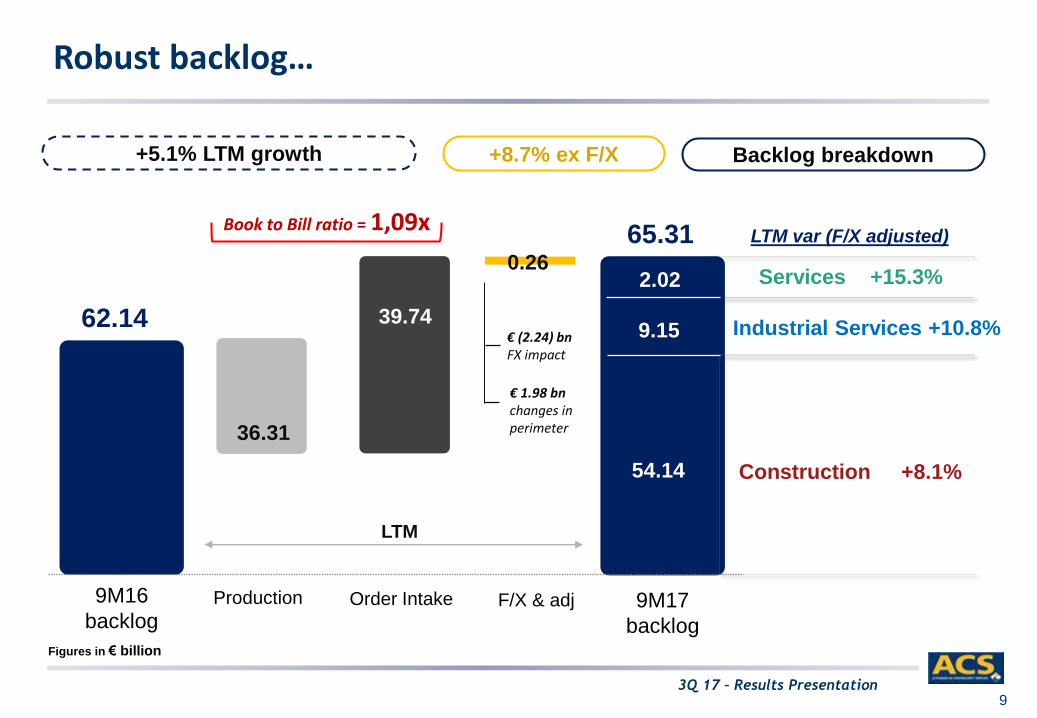
Robust backlog…
65.31
62.14
9M16
backlog9M17
backlog
Production Order Intake F/X & adj
LTM
39.74
36.31
+5.1% LTM growth +8.7% ex F/X
54.14
9.15
2.02
LTM var (F/X adjusted)
Services +15.3%
Industrial Services +10.8%
Backlog breakdown
Figures in € billion
Construction +8.1%
0.26
€ 1.98 bnchanges in perimeter
€ (2.24) bnFX impact
Book to Bill ratio = 1,09x

3Q 17 – Results Presentation
10
… highly diversified
+1%
+38%
LTM growth F/X adjusted
With a leading position in the US, Canada and Australia 65.30Bn€BACKLOG
22.35 Bn€
35%
4.98 Bn€
7 %
NORTH AMERICA
SOUTH AMERICA
-44%
0.71 Bn€
1 %
AFRICA
+16%
25.03 Bn€
38 %
ASIA PACIFIC
+6%
12.24 Bn€
19 %
EUROPE
3Q 17 – Results Presentation
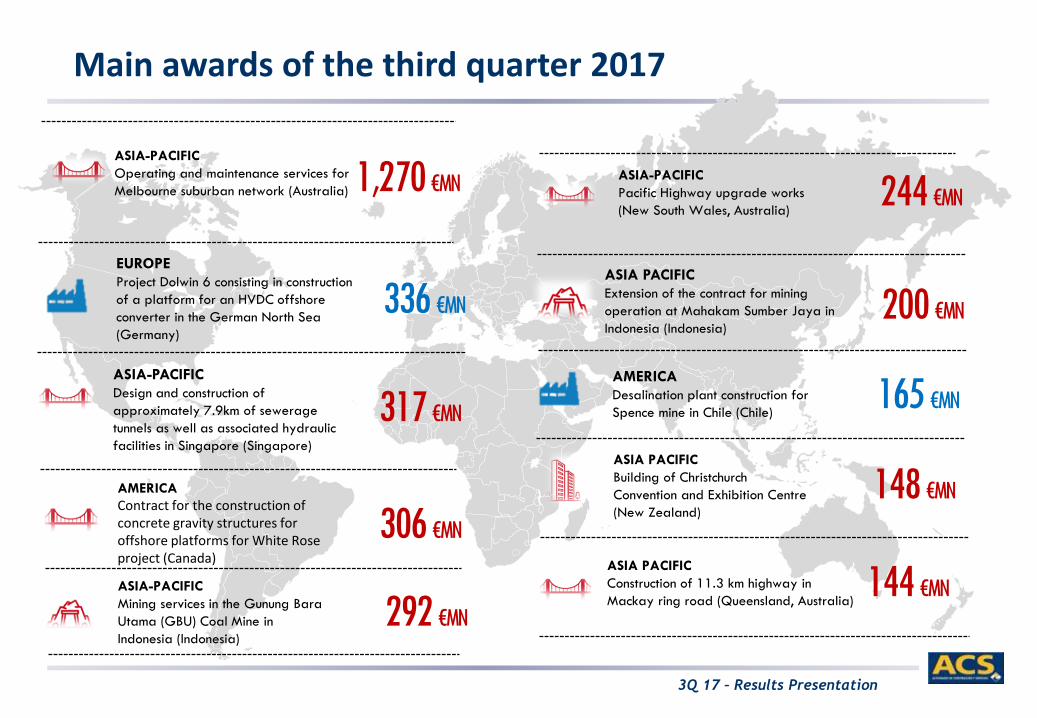
Main awards of the third quarter 2017
306 €MN
292 €MN
ASIA-PACIFIC
Mining services in the Gunung Bara
Utama (GBU) Coal Mine in
Indonesia (Indonesia)
1,270 €MN 244 €MN
148 €MN
ASIA-PACIFIC
Operating and maintenance services for
Melbourne suburban network (Australia)
ASIA-PACIFIC
Design and construction of
approximately 7.9km of sewerage
tunnels as well as associated hydraulic
facilities in Singapore (Singapore)
317 €MN
336 €MN
EUROPE
Project Dolwin 6 consisting in construction
of a platform for an HVDC offshore
converter in the German North Sea
(Germany)
AMERICA
Desalination plant construction for
Spence mine in Chile (Chile)165 €MN
AMERICA
Contract for the construction of concrete gravity structures for offshore platforms for White Rose project (Canada)
ASIA-PACIFIC
Pacific Highway upgrade works
(New South Wales, Australia)
ASIA PACIFIC
Building of Christchurch
Convention and Exhibition Centre
(New Zealand)
144 €MNASIA PACIFIC
Construction of 11.3 km highway in
Mackay ring road (Queensland, Australia)
ASIA PACIFIC
Extension of the contract for mining
operation at Mahakam Sumber Jaya in
Indonesia (Indonesia)200 €MN
3Q 17 – Results Presentation12
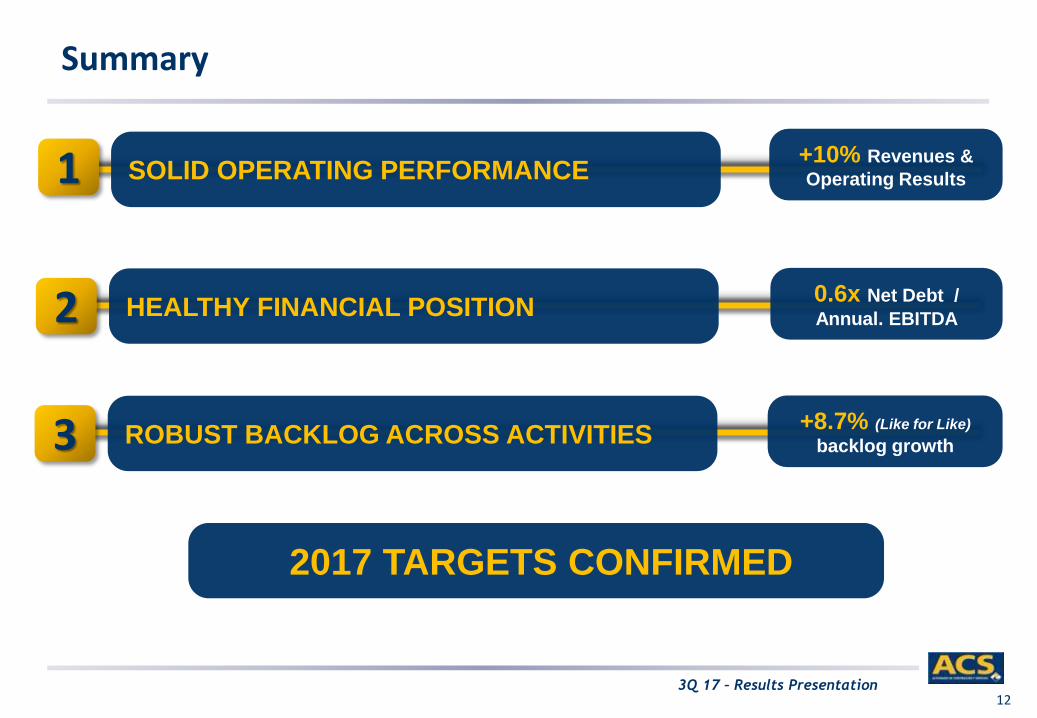
Summary
1 +10% Revenues &
Operating ResultsSOLID OPERATING PERFORMANCE
ROBUST BACKLOG ACROSS ACTIVITIES
2
3
HEALTHY FINANCIAL POSITION
2017 TARGETS CONFIRMED
0.6x Net Debt /
Annual. EBITDA
+8.7% (Like for Like)
backlog growth
This document contains forward-looking statements on the intentions. expectations or forecasts of Grupo ACS or its management at the time thedocument was drawn up and in reference to various matters including. among others. its customer base. its performance. the foreseeablegrowth of its business lines and its overall turnover. its market share. the results of Grupo ACS and other matters relating to the Group’sactivities and current position. These forward-looking statements or forecasts can in some cases be identified by terms such as “expectation”.“anticipation”. “proposal”. “belief” or similar. or their corresponding negatives. or by the very nature of predictions regarding strategies. plansor intentions.
Such forward-looking statements or forecasts in no way constitute. by their very nature. guarantees of future performance but are conditionalon the risks. uncertainties and other pertinent factors that may result in the eventual consequences differing materially from those contained insaid intentions. expectations or forecasts.
ACS. Actividades de Construcción y Servicios. S.A. does not undertake to publicly report on the outcome of any revision it makes of thesestatements to adapt them to circumstances or facts occurring subsequent to this presentation including. among others. changes in the businessof the company. in its strategy for developing this business or any other possible unforeseen occurrence. The points contained in this disclaimermust be taken fully into account by all persons or entities obliged to take decisions or to draw up or to publish opinions on securities issued byGrupo ACS and. in particular. by the analysts and investors reading this document. All the aforesaid persons are invited to consult the publicdocumentation and information that Grupo ACS reports to or files with the bodies responsible for supervising the main securities markets and. inparticular. with the National Securities Market Commission (CNMV in its Spanish initials).
This document contains financial information drawn up in accordance with International Financial Reporting Standards (IRFS). The informationhas not been audited. with the consequence that it is not definitive information and is thus subject to possible changes in the future.
Legal Disclaimer